report no. 35073-bo bolivia basic education in bolivia · report no. 35073-bo bolivia basic...
TRANSCRIPT

October 16, 2006
Document of the World BankR
eport No. 35073-B
O
Bolivia
Basic Education in B
olivia
Report No. 35073-BO
BoliviaBasic Education in BoliviaChallenges for 2006–2010
Human Development DepartmentBolivia, Ecuador, Peru and Venezuela Country Management UnitLatin America and the Caribbean Region
Pub
lic D
iscl
osur
e A
utho
rized
Pub
lic D
iscl
osur
e A
utho
rized
Pub
lic D
iscl
osur
e A
utho
rized
Pub
lic D
iscl
osur
e A
utho
rized
Pub
lic D
iscl
osur
e A
utho
rized
Pub
lic D
iscl
osur
e A
utho
rized
Pub
lic D
iscl
osur
e A
utho
rized
Pub
lic D
iscl
osur
e A
utho
rized


UNESCO UPF W D I World Development Indicators
United Nations Educational, Scientific and Cultural Organization Fiscal Programming Unit I Unidad de Programacidn Fiscal
Country Director: Marcelo Giugale Sector Director: Evangeline Javier
Sector Leader: Daniel Cotlear Sector Manager: Eduardo Velez


- 1 -
BOLIVIA
BASIC EDUCATION IN BOLIVIA: CHALLENGES FOR 2006-2010
TABLE OF CONTENTS
ACKNOWLEDGMENTS ......................................................................................................................... i11
EXECUTIVE SUMMARY ........................................................................................................................ IV
INTRODUCTION ......................................................................................................................................... 1
1 . DESCRIPTION OF THE EDUCATION SECTOR ......................................................................... 2
EDUCATION COVERAGE .............................................................................................................................. 2 ADMINISTRATIVE ORGANIZATION ............................................................................................................... 5 INSTITUTIONAL DEVELOPMENT ................................................................................................................... 6 POPULAR PARTICIPATION IN EDUCATION .................................................................................................. 10
TEACHER COMPENSATION ........................................................................................................................ 17 PUBLIC EXPENDITURE IN EDUCATION ....................................................................................................... 12
2 . ISSUES IN THE EDUCATION SECTOR ...................................................................................... 20
LOW AND INEQUITABLE ACCESS TO UPPER PRIMARY AND SECONDARY EDUCATION ............................... 20 Lack of Supply ....................................................................... Labor Market Participation ...................................................
........................................... 20 ........................................................ 24
LOW AND UNEVEN QUALITY OF EDUCATION ............................................................................................ 25 INEFFICIENT EDUCATION 29
Decentralization ......... 30 LOW ACCESS TO EARLY .............................................................. 31 Low INTERNAL EFFICIENCY IN HIGHER EDUCATION ................................................................................ 32
3 . POLICY RECOMMENDATIONS .................................................................................................. 33
IMPROVING ACCESS TO AND RETENTION IN UPPER PRIMARY AND SECONDARY SCHOOLS ....................... 33
Demand Side Interventions
National Assessments ........................................................................................................................... 36 International Assessments ................................................................................................................... 37
Improved Accountability ...................................................................................................................... 40
4 . REFERENCES ........................................................................................................................................ 41
ANNEX A.1: ACCESS AND ATTAINMENT ................................................................................................... 44 ANNEX A.2: SCHOOL ENROLLMENT BY AGE. BY INCOME. BY ETHNICITY AND BY GENDER ..................... 46 ANNEX A.3: FISCAL IMPACT OF IMPROVING TEACHER ALLOCATION ........................................................ 49
IMPROVING DECENTRALIZATION ARRANGEMENTS TO INCREASE EFFICIENCY AND EFFECTIVENESS ........ 39

. 11 .
TEXT TABLES
TABLE 1.1 : ENROLLMENT BY LEVELS IN 2002 ................................................................................................. 2 TABLE 1.2: EIB FROM 1997 TO 2002 ............................................................................................................... 8 TABLE 1.3: IMPACT OF EIB ON AGE GRADE LAG ........................................................................................... 10 TABLE 1.4: EDUCATION PROJECTS IN 2002 ................................................................................................... 11 TABLE 1.5: EDUCATION EXPENDITURES AS PERCENTAGE OF GDP 1995 -2002 ...................... TABLE 1.6: EDUCATION EXPENDITURES AS PERCENTAGE OF GDP IN 2002 ............................ TABLE 1.7: EDUCATION EXPENDITURES ON PRIMARY AND SECONDARY EDUCATION ............ TABLE 1.8: HIPC 11 FUNDS AND THE LEY DELDIALOGO (IN U S D 1, 000) ....................................... TABLE 1.9: THREE DIMENSIONS OF THE ESCALAFON DOCENTE, 2003 .................................... TABLE 1.10: TEACHERS BY CATEGORY, 2003 ............................................................................................... 18 TABLE 1.1 1 : BONOS AND INCENTIVOS .......................................................................................................... 19 TABLE 1.12: INTERNAL EFFICIENCY AND DEMOGRAPHIC PRESSURE ............................................................ 22 TABLE 1.13: EDUCATION RATES OF RETURN (PRIVATE) ......................... ................................................. 23 TABLE 1.14: SCHOOL ENROLLMENT AND LABOR MARKET P A R T ~ c ~ P A T ~ ~ N BY AGE .................................... 24 TABLE 1.15: BI-VARIATE ENROLLMENT WORK PROBIT ............................................................................... 25 TABLE 1.16: AVERAGE LANGUAGE AND MATH SCORES IN LLECE FOR GRADE 3 ....................................... 26 TABLE 1.17: ACHIEVEMENT AS MEASURED BY S I M E C A L - EIGHT GRADE (1998) ..................................... 27 TABLE 1.18: FACTORS ASSOCIATED TO HIGH QUALITY AS MEASURED BY S I M E C A L ................................. 28 TABLE 1.19: STUDENT TEACHER RATIO IN BOLIVIA ..................................................................................... 3 0 TABLE 1.20: ENROLLMENT AND GRADUATION IN PUBLIC UNIVERSITIES ..............
TEXT FIGURES
FIGURE 1.1: ENROLLMENT RATES AND GNI PER CAPITA ................................................................................. 3 FIGURE 1.2: ENROLLMENTS BY GRADE ...................................................................................... ... 3 FIGURE 1.3: ACCESS TO HIGHER EDUCATION BY QUINTILES .......................................................................... 4 FIGURE 1.4: SCHOOL ATTENDANCE BY ETHNICITY, INCOME QUINTILE, GENDER AND URBAN OR RURAL RESIDENCE ..................................................................................................................................................... 2 1 FIGURE 1.5: ENROLLMENT PYRAMIDS AND RURAL ENROLLMENT PR~JEcT~oNS .......................................... 22 FIGURE 1.6: DISTRIBUTION OF LLECE MATHEMATICS RESULTS .................................................................. 2 7 FIGURE 1.7: ENROLLMENT (SOLID LINE) AND ATTENDANCE (BROKEN LINE) BY AGE, ACCORDING TO DEMOGRAPHIC GROUP ............................................................................... .............................................. 29 FIGURE 1.8: STUDENT TEACHER RATIO VS . NUMBER OF STUDENTS AND DISTANCE FROM HOME ................ 3 1
TEXT BOXES
BOX 1.1: COMPLEMENTARY MEASURES TO SUPPORT EIB ............................................... BOX 1.2: INCREASING SCHOOL ENROLLMENT THROUGH STIPENDS IN BRAZIL: THE BOLSA ESCOLA PROGRAM
BOX 1.3: CHILE SECONDARY SCHOOL FOR ALL PRO ........................................................................... 35 BOX 1.4: THE CASE OF JORDAN .............................................................................. Box 1.5: EXAMPLES OF FINANCING FOLLOWING STUDENTS ................................... .............................. 40
.................................................................................. ......................................

ACKNOWLEDGMENTS
This report was prepared by a team consisting o f Raja Bentaouet Kattan and Sergei Soares (Task Team Leaders), Macarena Antonio, Beatriz Paredes, Douglas Ravenstein and Maria Alejandra Velasco. The team received very useful feedback from Patricia Alvarez, Daniel Cotlear, Ar ie l Fiszbein, Vicente Fretes-Cibils, Marcelo Giugale, Connie Luff, Maria Fernanda Padron, Carlos Rojas, and Eduardo Velez. The report was desktop- edited by Patricia Bernedo and Lerick Kebeck.
Peer Reviewers for this task were Luis Crouch, Carolina Sanchez-Paramo and Miguel Urquiola.
The report also benefited from feedback received from Government officials o f the Ministry o f Education and Culture (MEC) including Mauricio Alzerreca, Eric Meave, Orlando Muri l lo and Gilmar Zambrana. Furthermore, the report includes written comments submitted by Mr. Julio Roque Yujra, Viceminister of Education; Mr. Jose Antonio Suzafio, Responsable de Relaciones Internacionales del Ministerio de Educacidn y Cultura (MEC); Virginia Pierola, Coordinadora del Componente de Acceso y Permanencia de las Niiias a la Escuela Rural: Mirka Rodriguez, Profesional en Modalidad Bilingue L2; Flavia Marin, Profesional en Coordinacidn Interinstitucional e Intersectorial de Educacidn Inic ia l and Jaime Chambilla, Responsable de Formacidn Docente Continua del MEC.
The overall AAA work received thoughtful comments at the Concept Paper stage from the peer reviewers Luis Crouch, Carolina Sanchez-Paramo and Miguel Urquiola; Patricia Alvarez, Carlos Rojas and Andrea Silverman. The report was discussed during a meeting chaired by Marcelo Giugale (Country Director for Bolivia, Ecuador, Peru and Venezuela). Additional written comments were received from Robert Prouty (HDNED), Elizabeth M. King and Halsey Rogers (DECRG).


- i v -
EXECUTIVE SUMMARY
Bolivia, the poorest country in Latin America, has made great strides in expanding i t s education system over the past decade, and this i s reflected in the educational attainment o f the population. The average years o f schooling have increased from 4.4 percent in 1992 to 7.9 in 2001. However, while education coverage has increased over time, universal coverage remains a challenge, especially among disadvantaged groups, whose dropout rates and repetition rates remain high and access to secondary education i s critically low. Bol ivia faces a serious set o f challenges, including: l o w and inequitable access to upper grades o f primary and secondary education; l o w quality o f education, and thus, l o w levels o f academic achievement; and an inefficient system. The critically l o w enrollment rates at the secondary level translate into large skill gaps in the Bolivian labor force, insufficient numbers o f highly-trained individuals, and, ultimately, present significant barriers for achieving a sustained growth path in the near future.
Inequitable access to upper primary and secondary. Although access to schooling as measured by enrollment rates has become universal up to age 11 or 12, past that age, considerable gaps open up between indigenous and non-indigenous students, rural and urban, and r ich and poor students. The decline in enrollment after age 12 i s attributed to a variety o f factors. The f i rst and most obvious i s lack o f supply o f schooling. Labor market participation i s another factor keeping children out o f school.
Low and uneven quality ofeducation. Results from Bolivia’s 1998 national exams for eighth graders reveal l ow quality o f education: only ha l f o f the students achieve passing results in reading and less than one third achieve passing results in math. Analysis o f the scores reveals large differences in learning achievement between children from lower and upper income percentiles. Secondary schools are characterized by outdated curricula and pedagogical materials, inadequate infrastructure, conventional teaching techniques with very l imited pedagogic resources, and imbalanced classroom sizes (overcrowded classrooms in some schools and l o w student: teacher ratios in others). Moreover, the teaching force i s unequipped and largely untrained. In addition, the returns to schooling for upper primary and secondary education are much lower than those for lower primary or higher education. Clearly, improving the quality o f education i s critical.
InefJicient education system. Despite the fact that a high share o f GDP i s invested in education, Bol iv ia i s failing to produce the educated citizens and productive workers i t needs to compete in the global economy. In 2002, education spending constituted 6.8 percent o f GDP- exceeding what is spent by most o f Bolivia’s neighbors such as Ecuador (2.6 percent), Peru (3.3 percent), or Brazil (5.6 percent). However, resources are not allocated in an efficient manner that would improve learning outcomes. Indeed, spending on education materials i s l ow and the share o f administrative expenditures in the budget i s exceedingly high. Many schools in Bolivia have significant shortages o f basic learning supplies such as paper, pencil, and chalk since neither the directors nor the mayors accept responsibility for their provision. Moreover, infrastructure investments are not aligned

- v -
with pedagogical investments. And finally, the most serious problem facing Bolivia’s education system today i s the lack o f transparent and objective criteria for the allocation o f teachers, a process that i s complicated by the division o f decision-making among the different levels o f education administration.
In order to accelerate human capital development in Bolivia, i t wi l l be important for the government to give priori ty to education by improving the quality and coverage o f education and increasing the efficient and equitable use o f resources allocated to the sector. Moreover, measures need to be taken to ensure secondary school enrollment and completion. To get more children in school, supply-side measures must be accompanied by demand-side financing interventions that wil l address short term poverty and ensure that children enroll and complete their basic education. Improving decentralization arrangements can also help in increasing the efficiency and effectiveness o f the education system.

INTRODUCTION
The main objective o f this report is to provide an update o f the education situation in Bolivia, identify the challenges facing the Bolivian education system today, and present possible options to respond to the situation. Bol iv ia has made significant progress in expanding access to education. The primary net enrollment rate in Bolivia i s 97 percent, and about 95 percent o f children aged 7 to 14 are currently enrolled in schools, placing Bol iv ia on par with wealthier neighbors such as Brazi l or Peru. Other countries with similar GDP per capita, such as Guatemala or Honduras, have considerably lower enrollment rates o f 85 percent or less. In addition, primary dropout rates have fallen from 10 to 7 percent in rural areas and 10 to 6 percent in urban areas during the last six years. Repetition rates have equally been cut in half. Moreover, completion rates have increased from 56 percent in 1996 to 72 percent in 2001 and are estimated to reach 85 percent by 2010, placing Bol iv ia on track to achieve the Millennium Development Goal (MDG) o f Universal Primary Completion.
However, while education coverage has increased over time, Bol iv ia s t i l l faces considerable challenges for i t s education system to improve. Universal coverage remains a challenge especially among disadvantaged groups, whose dropout rates and repetition rates remain high and access to secondary education are critically low. In contrast with high enrollments for primary education, as recent as 2001, net enrollment in secondary was only 51 percent. In addition, the quality o f education has not kept pace as evidenced by Bolivia’s participation in both national (SIMECAL) and international assessments (Laboratorio Latinoamericano de Evaluacidn de la Calidad de la Educacidn). While Educational spending has been steadily climbing since 1995 from 5.3 percent to 6.8 percent o f GDP, resources are not allocated in an efficient manner that would improve learning outcomes.


- 2 -
Basic Education Init ial Primary Secondary
Higher Education Non-formal Education
1. DESCRIPTION OF THE EDUCATION SECTOR
2,634,436 86% 222,3 13 7 yo
1,877,536 62% 534,587 18% 290,423 10% 127.671 4%
EDUCATION COVERAGE
1.1 Bolivia’s National Educational System i s composed o f a formal and a non-formal sector. The non-formal system covers adult and special education. Formal education i s divided into four cycles: initial, primary, secondary, and higher education. Initial, or preschool, education begins at age 5. Primary education, covering eight years o f schooling i s compulsory for children six to thirteen years o f age. I t i s subdivided into three cycles: grades one through three, grades four to six, and grades seven and eight. Secondary education, subdivided into two cycles o f two years each (grades 9 to 10 and 11 to 12), i s offered to students fifteen to eighteen years o f age.
1.2 During the 2002 school year, the education system provided services for an estimated 3,052,530 students (Table 1.1). The vast majority (86 percent) o f students were enrolled in initial, primary and secondary education (educucidn escolurizudu), 62 percent alone in primary. Higher and adult education account for 10 and 4 percent o f enrollment, respectively. Special education enrollment i s negligible.
Table 1.1: Enrollment by Levels in 2002
ILevel I lEnrollmentl Percent o f Totall
I IAdult education I 120.7801 4%1 I h e c i a 1 educatiod 6.8911 O%I TOTAL I 3,052,5301 1 OO.O%,l Source: Ministry o f Education.
1.3 Init ial education in Bol iv ia i s both under-funded and inaccessible to the majority o f children. Preschool enrollment among 5 to 6 year-olds i s close to 30 percent and only 10 percent for 3 to 4 year-olds. Unfortunately, those who have the least access to preschool are exactly those who are most in need o f i t s benefits. The rural and poor populations are particularly underserved. Whi le 32 percent o f urban 5 and 6 year-olds are in preschool, only 24 percent o f their rural counterparts are in preschool. And 34 percent o f 5 and 6 year-olds from non-poor households go to preschool, compared to only 27 percent o f the poor.
Formal education i s far from achieving universal access.
1.4 The expansion o f education during 1990’s has helped the country reach important goals including high primary enrollment and completion rates, though much remains to be done to improve access to secondary school. Bol ivia has a 97 percent net enrollment rate, placing it above Venezuela and the Dominican Republic and close to Brazil-all countries whose GNI per capita i s much higher (Figure 1.1). In contrast, secondary

- 3 -
education in Bol iv ia i s characterized by l o w and unequal access, especially for disadvantaged groups, and poor quality.
Figure 1.1: Enrollment Rates and GNI per Capita 100
95
1 90
80
ominican Republic
O f O 0
Venezuela 0
0 2,000 4,000 6,00( GNI per Capita
, ~ ~ r c e : Edstats. UNICEF. LLECEIOREALC.
1.5 Secondary education i s comprised o f four years and offered to students 14 to 18 years who have completed primary school. As recent as 2001, net enrollment in secondary was only 5 1 percent.
1.6 As Figure 1.2 shows, the vast majority o f enrollment in non-higher education i s at the primary level, particularly in the f i rst three grades. In contrast to 300 thousand students in the first grade o f primary, there are only 89 thousand students in the final grade o f secondary school. The dashed lines show the size o f the 1994, 1987, and 1983 cohorts, which should be in first grade, end o f primary, and end o f secondary, respectively. These figures show an excess o f 63 thousand (22%) children in grade one and shortfall o f 18 and 72 thousand children (1 1 % and 81 %) at the end o f primary and secondary, respectively.
Figure 1.2: Enrollments by Grade
Secondary 4 Secondary 3
Secondary 2 Secondary 1
O, Pnrnary8 ~ n r n a r y ~ 6 PdrnaryG
O, Pnrnary5 8 ~l i rnary4 Plirnary 3 Pnrnary 2
.
Pnrnary 1 ,260
. , . lnisal2 ? I I
IniUal 1 49,152 I 1 I
0 1w.w 2w.w 3w.000 4 w . m
Enmllmenl in 2W1
Source: Ministry of Education.

- 4 -
1.7 An alternative model within the formal sector i s multi-grade education. Multi- grade schools are schools in rural areas where there are not enough students to justify a teacher for each grade. Students studying in these schools are assigned to a grade level, but study in classrooms together with students in other grade levels. About 60 percent o f Bolivia's 14,827 schools are multi-grade and 31 percent o f these are single-classroom schools. About 26 percent o f Bolivia's primary school students study in multi-grade schools. Given the percentage o f the Bolivian population living in rural areas, these figures are not surprising.'
1.8 Gross tertiary enrollment is relatively high at 33 percent, much higher than university enrollment in Brazi l and Jamaica (14 percent each) and almost as high as university enrollment in Argentina (36 percent) and Chile (37 percent). However, equitable access i s a problem: over ha l f o f tertiary enrollment i s captured by the richest 25 percent o f the population, compared to less than 10 percent for the poorest 25 percent (Figure 1.3). In addition, the system i s characterized by low quality and internal efficiency.
Figure 1.3: Access to Higher Education by Quintiles
. _.
..
100%
80%
60%
40%
20%
0%
I Brazil Mexico Colombia Chile Argentina Bolivia
..
.. .
Q S (High income)
0 44
43 04112 (Low income)
Source: Household surveys.
' Traditionally, multigrade schools have been regarded by policy makers as being unable to provide children with the same quality o f education as larger schools where children are separated into single grades. More recent work suggests that the performance o f multigrade schools may be largely due to lack o f adequate adaptation o f teaching methods to the multigrade setting. When appropriate teaching methods are developed and used, as in the case o f Escuelu Nuevu in Colombia, multigrade schools may outperform their urban counterparts. In Bolivia, the official methodology for multigrade teaching follows that o f Escuelu Nueva. However, multigrade teaching has not been given the attention that, for example, bilingual education has been given, and leaves room for improvement. Furthermore, the relations between multigrade schools and bilingual education have not been adequately explored. Further information on effectiveness o f multigrade teaching can be found in McEwan (1998) and Psacharopoulos, Rojas and Velez (1 993).

- 5 -
ADMINISTRATIVE ORGANIZATION
1.9 After the adoption o f the Popular Participation Law in 1994, the education sector in Bolivia has become gradually more decentralized. The delivery o f education in Bol iv ia i s covered by several different levels o f administration: the Ministry o f Education, nine departmental level education ministries, called SEDUCAs (Semicio Departamental de Educacidn), 327 municipalities, and 275 school districts.
1.10 Ministry of Education. The central Ministry o f Education has a technically competent and permanent technical team; but i t s sustainability i s at risk because many o f these technicians are not financed by the state. There i s a good information system at the national level. The curricular approaches and materials are adequate. The main responsibilities o f the Ministry o f Education at the central level include: budget allocation to departments, monitoring and evaluation, and planning.
1.1 1 SEDUCAs. The internal organization o f the Ministry o f Education mirrors that o f the Bolivian state. In addition to the Ministry o f Education at the central level, there are nine deconcentrated units, called SEDUCAs (Sewicio Departamental de Educacidn), which coincide with the nine departments. The SEDUCAs are hybrid organizations; they simultaneously report to the Departmental Prefect and to the Ministry o f Education. The SEDUCAs have become highly political and partisan institutions and have a low level o f administrative and technical competence. This lack o f competence i s most apparent in the poor distribution o f teachers among districts. The SEDUCAs are responsible for allocating teachers among districtsa2 At the district level, the process i s less partisan, but l o w technical capacity and local politics often make for ineffective teacher allocation also within districts. The selection o f individuals to fill each position i s also le f t to the decentralized units following national law.
1.12 Municipalities. With their varied source o f income-from own taxes, revenue- sharing and HIPC resources-municipalities are responsible for providing educational infrastructure and supplies. However, decisions relative to education are s t i l l centralized, with 89 percent o f the education budget s t i l l allocated by the central government. Municipalities spend most o f their resources (8 1 percent) on physical infrastructure and only 19 percent on pedagogical materials or training. Municipal mayors are now responsible for provision o f educational infrastructure and the consequence i s that there i s some overlap o f power between the mayor and the district director. They are also responsible for school maintenance and provision o f basic necessities such as electricity, and water.
1.13 Most o f the day-to-day administration i s done at the Educational District level, which are headed by district directors. Under the Educational District are the Education Nuclei, which consist o f groups o f six to nine schools that share resource~ .~
Districts.
’ As opposed to the central Ministry, the SEDUCAs do not have optimization models and generally do not assign teachers based on empirical data. SEDUCA heads have until recently been chosen by departmental prefects, which are highly political and partisan, non-elected, posts. While the selection process for SEDUCAs has recently been changed to merit, they are st i l l staffed by a mix of individuals chosen basically through political connections. Because o f this, teaching posts are frequently also assigned to districts by a largely political process. Urban nuclei are called redes (networks).

- 6 -
Nuclei often have a core school with a pedagogical resource center to support the other schools. Educational districts usually coincide with municipalities, but there are 327 municipalities and only 275 districts, as smaller municipalities are sometimes grouped together into one educational district. The district director i s responsible for basic functions such as distributing textbooks and pedagogical materials (provided by the center), selecting o f school directors based on competency tests, and assigning teachers among schools.
INSTITUTIONAL DEVELOPMENT
1.14 Information Systems. The M O E benefits f rom well-functioning and useful information systems. The Sistema de Informacidn Educativa (SIE) i s an accurate and timely system for providing basic statistics on enrollment, physical characteristics o f schools, characteristics o f teachers, and diverse administrative data. SIE data i s used regularly by the analysis unit to make enrollment projections, teacher surplus or deficit calculations, and various other calculations. MOE administrative systems are also adequate and teachers are paid in a timely fashion. The MOE knows, in theory, in which school each teacher i s working and what materials each school has received. O f course, these information systems can be improved. The SIE suffers from al l the inaccuracies o f an information system that is not child-based4. F low statistics are poor at the school level and the system does not provide basic information such as a child’s age and ethnicity. In addition, the different information systems are not well integrated. Although teachers and schools have unique identifiers that can be used to combine the data, this i s not easily done and usually requires hiring o f an external consultant. Anecdotal evidence points to high reliability o f enrollment data but less reliability o f data in areas such as de facto teacher allocation and school material distribution.
1.15 Learning Assessment. Bol ivia established a comprehensive evaluation system, SIMECAL, with the original idea o f making systematic use o f available information. Methodologically, S IMECAL ranks among the best international learning assessment systems. I t i s based on Item Response Theory with endogenously developed test items that reflect Bolivia’s cultural values. I t has developed tests in language and mathematics in both Spanish and indigenous languages, a feat few other Latin American assessment systems have matched. Because o f their expertise, S IMECAL staff have designed and administered tests for other national institutions such as the Armed Forces and the Police Academy. Despite i t s technical excellence, limited budget has meant that testing has been conducted sporadically (1997, 1999, and 2000), each time in different grade levels,
The difficulties o f calculating student flow rates arise from the fact that children are not individually counted in educational statistics. In the presence o f non-standard educational trajectories, such as cyclical dropout and re-entry patterns, “true” flow rates are impossible to calculate. Even when making certain strong hypotheses (in particular the hypothesis that once a child exits the educational system for more than one year, he or she never returns), the calculation o f flow rates involves complex and imperfect statistical models. A solution to this problem i s to base educational statistics on the most important unit o f the educational system: the individual student. I t has been argued that poor countries such as Bolivia cannot afford a child-based statistical system, but Peru, for example, has successfully experimented with the concept in selected rural regions. With the drop in data processing costs, statistical systems that follow children from grade to grade are increasingly feasible. Fundamentally, this type o f system involves assigning each child an individual identification number and asking schools to report the ID numbers o f enrolled students.
Educational statistics in Bolivia are classroom-based.

- 7 -
and only for small, though representative, samples. usefulness o f findings and make rigorous comparisons difficult.
These characteristics limit the
1.16 In addition, the establishment o f S IMECAL as a semi-autonomous institution has prevented i t from having the legitimacy o f a fully independent institution and from being fully integrated into MOE’s other information and planning systems. As a result, S IMECAL evaluations have not provided evaluative feedback in critical areas o f interest to the M O E such as, pedagogy, teacher training, and curriculum. Of great concern i s the fact that SIMECAL evaluations have not continued to take place. The last evaluation at the primary level took place in 2000. In August 2004, S IMECAL activities were suspended with the purpose o f carrying out an assessment o f the results and restructuring the process o f evaluations.
1.17 Pedagogic Support to Teachers. Bol iv ia does not have an adequate pedagogic support system for teachers. Many approaches have been tried but none have proven wholly successful. Perhaps the most significant effort was the system o f asesoria pedagdgica-pedagogical advisory system- which operated off icial ly from 1996 until April 2003. Later on, there was a reorganization o f the pedagogic advisors within the Public Education Service, and in January 2004 the position o f pedagogic advisor was eliminated.
1.18 Another attempt to improve classroom teaching was the Incentivo a la Actualizacidn Docente (IAD). The IAD was a bonus o f Bs. 2,400 (roughly US$350) to teachers who successfully passed a level-specific test. This teacher incentive was also abandoned due to budgetary implications5, lack o f support from the Ministry o f Education and international donors, as well as some opposition from teacher unions to attempts at diversifying teacher pay according to measures o f performance or achievement (Contreras and Talavera 2004).6
1.19 Today, district directors are expected to provide pedagogical support for teachers, but their administrative responsibilities do not allow them the time to fulfill this role. Interviews with district directors indicate that they are acutely aware o f this problem but have no means o f addressing it. All district directors interviewed stated that lack o f pedagogical support for teachers was one o f the main problems for achieving higher quality o f education.
1.20 Initial Teacher Training. In Bolivia, teachers are trained in specialized institutes called Institutos Normales Superiores (INS). There are a total o f 18 I N S in Bolivia, 10 o f which are run by universities and the remaining eight directly by the MOE. It i s important to note that ha l f o f these institutes train teachers in Intercultural Bilingual Education (EIB). There has been a consistent effort to modernize and improve I N S as education planners realize that i t i s easier to train new teachers than the ones that are already teaching. Rojas (2004) and others state that the INS are producing better trained teachers
The IAD represented 2 percent of the ministry’s wage bill, almost twice the amount spent on IPR (Incentivo a la Permanencia en el Area Rum[).
The Incentivo Colectivo de Escuelas, rewarding schools displaying good administration, cooperation and educational quality, was also abandoned after a short period of time. Finally, the IPR incentive lost much of its meaning when the IP (incentivo de permanencia) was introduced for urban teachers.

- 8 -
Year
as measured by both standardized tests and classroom observation. The intake o f the I N S system varies from 2,000 to 6,000 students, and at any given time 4,000 to 10,000 are studying to become teachers with the number o f teachers completing training at the normal schools varying from 1,000 to 4,000 per year. Since there are roughly 92,000 teachers in basic education in Bolivia, this means that the I N S graduates represent 4 percent o f the total teaching force per year. At this rate, the impact o f improvements in initial teacher training wil l take some time to reach the classroom.
Schools Students
1.2 1 Bilingual Primary Education. Intercultural Bilingual Education (EIB) was institutionalized in 1994. This initiative has resulted in an unprecedented number o f children receiving bilingual education (see Table 1.2). The bilingual approach consists o f teaching children to read and write f i rst in their native language, using this as a language o f communication and in parallel introducing them to Spanish. In Bolivia, EIB schools offer grades 1 to 3 in the indigenous language wi th Spanish as a subject matter, grades 4 to 6 in both Spanish and the indigenous language, and grade 7 onwards in Spanish in principle with the indigenous language as a subject matter.
1997 1998
1,074 24,231 1,291 38,383
1999 2000 2001 2002
1,823 57,776 2,037 87,603 2,725 1 14,868 2,899 192,238
1.22 Today, almost al l one third o f indigenous (Guarani, Quechua and Aymara speaking) rural students are enrolled in bilingual education. In total, about 30 percent o f rural schools are implementing the EIB approach. No other country in Latin America has come close to such achievements in access to bilingual education.
1.23 The M O E along with other organizations has introduced a variety o f complementary measures in support o f the EIB policy (see Box 1.1).

- 9 -
Box 1.1: Complementary Measures to Support EIB
Consejos Educativos de Pueblos Originarios (CEPOs). In addition to the pyramidal system o f educational councils, explained below, in 1998, three CEPOS -transversal Indigenous Peoples Education Councils were created for the Aymara, Quechua, and Guarani speakers and a fourth for speakers o f other various Amazonian languages. These councils were chosen by their respective ethnic groups and today p lay an important role in c i v i l society in support o f bil ingual education.
Proyecto de Institutos Normales Superiores-EIB (PINS-EIB). This was probably one o f the most important actions o f the Bol iv ian EIB policy. In some other countries where bil ingual education i s provided, bilingual teachers are usually teachers who happen to speak an indigenous language and are at best given a quick course o n how to teach in a bilingual and intercultural setting. In contrast, Bol iv ia invested heavily in init ial training o f EIB teachers. N ine o f Bolivia’s 18 Superior Normal Institutes (teacher training institutes) train EIB teachers: two in Aymara-Castellano, three in Quechua-Castellano, one i s a trilingual Quechua-Aymara- Castellano school, and one specialized in Guarani and the other l ow land languages. Bol iv ia has a growing supply o f teachers wi th three years o f training in bil ingual education. T o date, more than 6000 teachers have graduated f rom EIB institutes and the pool o f teachers i s rapidly increasing, which w i l l make it easier to scale up bil ingual education.
Proyectos Educativos Indigenas (PEIs). A specific popular participation mechanism was set up in indigenous areas to allow indigenous educational projects to transcend municipal frontiers, and fol low the distribution o f a particular ethnic group.
Programa de Formacidn en Educacidn Intercultural Bilingile para 10s paises andinos (PROEIB Ande). In addition to EIB training at the higher education level, a graduate program in bil ingual studies called PROEIB Andes was set up in Cochabamba in 1998. The program i s the result o f a jo in t effort between German Cooperation GTZ, the MOE, and the Universidad Mayor de San Sim6n (UMSS-Cochabamba). The two year masters program o f PROEIB Andes has been attended by 50 students o f 6 nationalities whose dissertations have been defended in the areas o f bilingual educational planning and bil ingual teacher training. The PROEIB Andes was fundamental in training many o f the PINS-EIB teachers.
Standardized Testing in Indigenous Languages. Bol iv ia was the first Lat in American nation to produce modem I tem Response Theory learning assessments in indigenous languages. Evidently, tests in indigenous languages had been produced before, but the effort had never been made to evaluate EIB learning w i th instruments comparable to international assessments such as PISA or LLECE.
1.24 Rigorous evaluation o f the impacts o f EIB on student attainment has shown positive results’. If two otherwise identical groups o f schools catering to identical student populations differ only in that one group applies the bilingual methodology and the other
’ More information on EIB and i ts impacts can also be found in Albb and Anaya (2003), Nucinkis (2004), and Landa and Jimenez (2004), among others.

- 1 0 -
19991 20021 2002-1 999 Highly Monolingc.al Quechua Treatment 44.65 31.26 -13.38 Comparison 45.53 38.94 -6.59
does not, then any differences in the evolution o f educational indicators wi l l be due to EIB. For example, Sanjinez et al. (2005), using propensity score matching to generate EIB treatment and control groups o f schools in rural indigenous areas and measure success using age-grade lag as their impact variable, find positive results for both Quechua and Aymara communities. However i t i s noteworthy that among these results, the data pertaining to the Quechua are the most reliable. The results (Table 1.3) show an important improvement in age-grade lag over a relatively short period (three years).
Table 1.3: Impact of EIB on Age Grade Lag
-7.68
Note: Age Grade Lag in Percent o f Children with Two or More Years o f Lag.
1.25 Notwithstanding i t s many merits, several criticisms have been leveled against EIB. One i s that implementation has been far from perfect. Pedagogic text production suffered from considerable delays. The learning modules for the second cycle (for grades four to six), crucial to the transition towards the last years o f primary school, were not produced during the three years fol lowing the modules for the f i rs t cycle o f the primary level. Due to implementation delays, the transition modules took longer and some cohorts o f children that started with the EIB approach did not have pedagogic materials to continue with the EIB approach.
1.26 Another failure o f bilingual education was that it was often applied against the wishes o f parents and students. This created unnecessary resistance among those who were anxious to see their children learn Spanish and possibly excluded many who wanted the bilingual approach. One o f the criticisms o f EIB is that i t has emphasized one aspect o f bilingualism, but has done much less to develop interculturality. In addition, the emphasis has been in teaching native language speakers in their own language and later teaching them in Spanish, but no similar effort has been made to teach native languages to urban or Spanish speaking children (two-way approach).
POPULAR PARTICIPATION IN EDUCATION
1.27 Both the Education Reform and Popular Participation Laws o f 1994 have resulted in a series o f mechanisms for popular participation in educational decision-making. An educational council was created at each level o f the educational system. The most basic o f these mechanisms was the school council that includes parents involved in decision- making regarding the school and school nucleus. Additionally, there are municipal education councils, nine departmental education councils, four CEPOs (Indigenous

- 11 -
PER 143 1,271 600,758 PEI 31 314 19,986 Total 1,006 7,736 1,23 1,916
Peoples Education Councils to facilitate the participation o f the major indigenous groups), as wel l as a national education council, the CONED (Consejo Nacional de Educacidn).
1.28 Although all these councils are legally established, many o f them have been slow to function properly. As with most other aspects o f the reform, these councils were implemented against teacher union wishes. While in some places, these councils are working well, in others, such as in the municipality o f E l Alto, the education councils have usurped functions which do not legally belong to them, such as assignment o f students to schools. At the higher levels the councils have taken a long time to materialize because while M O E authorities saw them as desirable, the political environment was never entirely favorable. The CONED was the last council to be created and met for the f i rs t time in January 2004.
1.29 Perhaps the biggest challenge that has come from the creation o f these councils i s that they have added to the complicated relationships between al l the various educational decision-making bodies and stakeholders in Bolivia. The plethora o f councils that now exists alongside the various management authorities at the national, departmental, municipal, nucleus and school levels has, at times, generated further confusion, and considerable communication difficulties. In this context, Proyectos Educativos, (Education Projects) were developed to support decentralized management at the local level and also contribute to coordination among these levels. These Education Projects begin with School Plans or PEU (Proyecto Educativo de Unidad Escolar), which are in turn aggregated into PEN (Proyecto Educativo de Nucleo - in rural areas), PER (Proyecto Educativo de Red - in urban areas) or PE I (Proyecto Educativo Indigena - in indigenous districts), depending on which o f these networks the school i s a part of. These projects are then included in the Municipal Educational Plans or PROMEs (Proyectos Municipales de Educacidn) and thereby are officially acknowledged as a part o f the municipal annual operational program. These projects and plans allow for both popular participation in educational decision making and facilitate the articulation o f the different educational actors (See Table 1.4 for number o f projects, schools, and students involved in this planning process in 2002). In total, 72 percent o f Bol ivian students were in schools that participated in this participatory planning process.
Table 1.4: Education Projects in 2002
Proj ectd School4 Student 8321 6.1511 611.172
1.30 In addition these projects leverage resources as municipal, deconcentrated, and centralized funds can be combined. Municipal mayors, for example, contribute wi th resources from HIPC, their own taxes, and co-participaciones, Although the potential has not been fully used by the Ministry o f Education, the educational projects remain a

- 1 2 -
Investment in Education Total Education Expenditures
promising instrument to improve educational planning at al l levels and increase funding for education.
1% 1% 1% 1% 1% 1% 1% 1% 5% 6% 6% 6% 6% 6% 7% 7%
PUBLIC EXPENDITURE IN EDUCATION
1.31 Despite i t s l o w per capita Gross Domestic Product (GDP) and particularly i t s limited tax revenues, Bol iv ia has a large public sector. Total government expenditure averaged 30 percent o f GDP between 1997 and 2003 and reached 34 percent in 2002. In 2002, these expenditures were undertaken with a tax base o f merely 18 percent o f GDP, leaving the remaining public sector expenditures (equivalent to 16 percent o f GDP) to be financed by foreign assistance and increasing debt. This contrasts with other countries with similar or only slightly higher GDP per capita such as Ecuador, where public sector expenditures and tax revenues both represent 27 percent o f GDP, and Guatemala, where public expenditure i s 11 percent and tax revenues are 10 percent o f GDP. The weighted average o f public expenditure in Latin America i s 23 percent o f GDP and the weighted average for tax revenues i s 22 percent o f GDPq8 I t i s within this troubling fiscal context that Bolivia’s educational expenditures have been steadily climbing, from 5.3 percent in 1995 to 6.8 percent o f GDP- exceeding what i s spent by most o f Bolivia’s neighbors such as Ecuador (2.6 percent), Peru (3.3 percent), or Brazi l (5.6 percent). This climb i s partially due to the stagnation o f GDP since 1998. However, there i s no doubt that education has also gained priority in public spending in recent years (Table 1 S) .
1.32 Since 1994, when the Popular Participation Law was passed, these resources have not al l been concentrated at the central level. Although Bol iv ia i s a unitary republic, i t i s subdivided into nine departments, whose administration i s run by centrally and politically appointed prefects, and 327 municipalities, run by elected mayors. Municipal govemments receive revenue-sharing transfers, called Co-participaciones, as wel l as Highly Indebted Poor Country (HIPC) resources. The departmental level has been somewhat neglected in the present arrangement and there is considerable pressure for decentralization o f resources and political power to this level.
* These figures underestimate both revenues and expenditures, as subnational governments in Brazil and Argentina are not included.

- 13 - 1.33 Co-participaciones are comprised o f 20 percent o f central government tax income to municipalities and 5 percent to universities. The pie from which these Co- participaciones are cut i s relatively large, amounting to about 17 percent o f GDP9- about Bs. 9 bi l l ion (US$l . l million), which means that the Co-participaciones amount to about 3.4 percent o f GDP for municipalities and 0.85 percent to universities. The HIPC pie i s smaller than that o f Co-participaciones - about 1 percent o f GDP -Bs. 582 mi l l ion (US$7.2 million). HIPC resources, however, go entirely to municipalities and 20 percent o f the funds are earmarked for education. However, HIPC resources have not been used at the rate that they are transferred to municipalities and are accumulating in their Bank accounts.
1.34 In terms o f expenditures by educational level, i t i s clear from Table 1.6 that the MOE has targeted primary education as i t s priority. With the exception o f higher education, per pupil expenditures are the highest at this level (Bs. 774). Expenditures on primary education comprise almost 70 percent o f total expenditures, and secondary education i s largely under-funded.
Table 1.6: Education Expenditures as Percentage of GDP in 2002
Source: Ministry o f EducatiodUDI.
Note: * Others include alternative education, special education, technical education, and non-university higher education.
1.35 Despite the growing evidence o f the long term benefits o f ini t ial education, particularly for the poor, i t i s clear from the table above that this level i s not a budgetary priority for the Bolivian Ministry o f Education. Per pupil expenditures at the initial education level are very l o w (Bs. 446). On the other end o f the education spectrum, higher education receives a large budget share. At 27 percent o f all educational expenditures, higher education funding is quite high by Latin American standards. Per pupil expenditures at the higher education level, however (Bs. 3,342) are l o w by Latin American standards. This combination o f high total and low per pupil expenditures i s due to Bolivia’s exceptionally high university enrollment.
The values for education financing all refer to 2002.

- 1 4 -
1.36 Higher Education Financing The budget o f the public university system has increased 62 percent between 1995 and 2002, from 1.24 percent to 1.71 percent o f GDP (3.6 percent to 4.5 percent o f public expenditures). Over the same time period there has been a large increase in higher education enrollment, indicating that the increase in expenditure was used largely to expand higher education coverage. Whi le this i s a more equitable and progressive use o f funds than if higher education enrollment had remained constant and instead per student expenditure had increased, i t does raise concerns since public universities are not held to high standards o f accountability."
1.37 Universities are al l funded centrally through co-participaciones and other treasury resources, but have almost total administrative and pedagogical autonomy. Higher education administration is a black box for the MOE since the law defines university autonomy very broadly. Information provided by universities i s composed o f basically what they wish to present. This means that, in contrast to the excellent information system for initial, primary, and secondary education (SIE), data on universities i s neither abundant nor trustworthy. Only recently has gender aggregated data on enrollment been provided and to this day, information on enrollment by ethnicity i s s t i l l only partially available.
1.38 A Vice-Ministry for Higher Education, Science, and Technology exists but has limited leverage over the public university system. Public universities are represented by the CEUB (Comiti Ejecutivo de la Universidad Boliviana) which maintains a dialogue with the Vice-Ministry. In the last few years the situation has improved somewhat through this communication mechanism. A computerized management system called COIMATA" has been offered to the universities and has been accepted by the smaller ones with much success. The larger universities are now showing interest in implementing it. In addition to helping universities in their internal management, C O I M A T A passes basic information on to the Vice-Ministry. The Vice-Ministry has also established FOMCALIDAD, a competitive fund for research projects which has improved communication and led to an incipient culture o f accountability within the university system. In spite o f these advances, higher education in Bol iv ia remains poorly managed and lacks accountability.
1.39 Municipal Finance Expenditure in Education. Municipal governments (alcaldias) have gone from being virtually absent in education funding to being responsible for 7 percent o f recurrent education expenditures and 1 percent o f total non financial public sector expenditures. W h i l e these figures are s t i l l modest, they show a trend towards decentralization o f education finance. In 2003, the total amount o f the Co- participaciones mentioned above was Bs. 1.32 bi l l ion (US$163 million), which amounts to Bs. 161 (US$20) per person per year. All municipalities in Bolivia have a bank account in which these funds are deposited on an almost daily basis. If not spent, the funds remain in the bank account, just as own tax revenues would. Municipalities may
lo Due to the autonomy law, public universities do not have to report their expenditures to anyone. Neither the MOE to whom they are subordinated in theory, nor the Ministry of Finance that pays for their expenditures, has a right to know how they spend most o f their funds. " COIMATA i s named after a waterfall in the Department of Tarija since i t was developed by the University of this same Department.

- 15 -
ofwhich; payroll
spend these resources, which are considered their o w n revenues, as they see fit and are accountable only to the controller's office (Contaduria).
3.9
1.40 The following table shows education expenditures by level o f government. Most expenditures are s t i l l made through the Ministry o f Education. Only a small share o f the Ministry's expenditures i s executed by the SEDUCAs. Municipalities are initiating an increasing share o f education investments (Table 1.7).
Capital Expenditures
Table 1.7: Education Expenditures on Primary and Secondary Education
0
Current Expenditures
I Current ExDenditures I 4.2 I
0.1 Capital Expenditures
1 SEDUCA I 0.1 I
0
Current Expenditures Capital Expenditures
I MuniciDalities I 0.8 I 0.2 0.6
Total Expenditures 5.1
1.41 With these new sources o f income, municipalities also received more responsibilities, particularly in terms o f the provision o f education infrastructure and the responsibility to administer and provide necessary education supplies. However, there has been relatively l i t t le cooperation between municipalities and the Ministry o f Education for the use o f these funds in education. For example, one o f the most common expenditures i s the construction o f walls around schools, which have no pedagogical value.
1.42 In addition, the Ley del Dialog0 o f 2000 (Dialogue Law) assigned a large but declining percentage o f HIPC funds to municipalities. Table 1.8 shows the percentage o f total HIPC I1 funds received by municipalities. The municipal totals for HIPC I1 amount to about 28 percent o f co-participaciones. Like co-participaciones, HIPC I1 funds are considered their own revenues and accumulate in municipal bank accounts if not used. Unlike co-participaciones, municipalities are not free to use these funds any way they see fit and they are accountable for their use to the Unidad de Prograrnacibn Fiscal (Unit for Fiscal Programming or UPF).

- 1 6 -
2001 (Aug-Dec) 2002 2003
2004 (Jan-June)
Table 1.8: HIPC I1 Funds and the Ley del Didlogo (in USD 1,000)
32,652 37,652 87% 80,478 107,478 75% 47,182 77,792 61% 19,464 34,683 56%
IYear I Dialog0 I Total HIPC I1 I ?LO I
1.43 The UPF directly oversees the monthly execution o f the 1 1 1 largest municipalities in Bolivia, but in theory all are accountable to the central government for HIPC I1 expenditures. This has led municipalities to become more hesitant in spending these monies. As o f June 2004, there were Bs. 34 mi l l ion unused for education and another Bs. 1 17 mi l l ion for productive infrastructure. Visits to municipalities indicated that this i s not only due to the very strict oversight by UPF but also to the weak coordination between municipalities and the MOE, which leaves mayors unsure o f the best way to spend HIPC funds.
1.44 Finally, the Politica Nacional de Compensacibn (National Compensation Policy) established funds for investment in social infrastructure at the municipal level that are negotiated with the central Government. These are channeled through the Fondo Nacional de Inversibn Productiva y Social (National Fund for Social and Productive Investment- FPS) and may be used for building educational infrastructure. The FPS provides a means o f channeling resources to smaller municipalities with less managerial capacity.
1.45 From all sources, municipalities spent Bs. 216 mi l l ion (US$27 million) in education in 2002, which amounts to Bs. 71 per student (US$9). Evidently, since funds are partially fungible and the co-participaciones, Ley del Dialogo, and the National Compensation Policy (PNC) al l pay for more or less the same things, investment from one source may only be crowding out investment from another one.
1.46 As noted above, education investments have increased 145 percent from 1995 to 2002 (from 0.56 to 1.16 percent o f GDP and from 1.6 to 3.0 percent o f public sector expenditures). Much o f this increase occurred in a difficult fiscal environment from 1998 onwards and reflects a long-term national budgetary commitment to education as wel l as strong donor support and HIPC support. External financing, whether entirely concessional funding by bilateral donors and multilateral agencies or subsidized interest loans from development funds such as IDA, was responsible for 69 percent o f M O E investment between 1995 and 2001. In addition, external financing has paid for some recurrent expenditures such that the total volume o f external financing in education i s roughly equivalent to the total volume o f M O E investments.

- 1 7 -
TEACHER COMPENSATION
1.47 Bolivia’s escalafdn docente i s a pay scale determined by three factors: location, initial training (haber bdsico) and incentives and bonuses (designed to reward positive performance and compensate for hardships). They are independent o f the haber bdsico and the categoria and they differ solely by the budget from which they are drawn. All public school teachers are paid by the central Government according to this scale. Payments are usually made in a timely and accurate fashion-as opposed to some other countries in which teacher pay i s used to regulate cash f low by the Ministry o f Finance. Table 1.9 below shows the three dimensions o f the escalafon for 2003 for the standard work week o f 18 teaching hours. There are four teacher training categories, and teachers are paid more for having received higher training. These categories are normalistas, egresados titulados por antigiiedad, and interinos. Normalistas refer to those individuals who successfully concluded their teacher training at teacher training schools; egresados are those who attended teacher training schools but have not yet received their official diplomas (usually due to pending requirements); titulados po r antigiiedad are teachers whose years on the job are recognized as almost equivalent to a teaching degree; and interinos are teachers with no formal training in education.
Table 1.9: Three Dimensions of the Escalafdn Docente, 2003
Bolivianos for 18 Teaching Hour Work Week, in 2003
Source: Ministry o f Education, 2004.
1.48 Finally, the three categories related to location correspond to the degree o f urbanization o f the area where the school i s located. The first category includes the nine

- 1 8 -
Category Capital Provincia Rural TOTAL Total (%) Normalista 50% 17% 33% 43,409 47% Egresado 23% 32% 45 % 26,959 29% Tit Antigiiedad 44% 25% 31% 4,260 5%
departmental capitals (Capital); the second encompasses other urban locations (Provincia); and the third i s al l the remaining rural areas (Rural), which generally include very isolated locations made almost inaccessible by mountains or forests. Teachers are paid more for working in less urban areas. For example, a teacher training school graduate working in a small town enters the teaching profession making Bs. 714, but as soon as he or she i s confirmed as a permanent teacher the salary wil l automatically r ise to Bs. 928. Thereafter, ascension through the pay scale wi l l not be automatic but wil l depend on tenure and performance on tests which will gradually increase the salary to Bs. 1,785. If the same teacher decides to move to a departmental capital such as Potosi when at category (3) his or her salary wi l l drop from Bs. 1,142 to Bs. 1,040.
Interino 21% 23% 56% 17,826 19% Total Teachers 36% 23% 41% 92,454 100%
1.49 Table 1.10 shows the distribution o f teachers by category. The large number o f interims-almost 20 percent o f the total number o f teachers-is alarming. Interinos have diverse educational backgrounds. Some are individuals with very l i t t le formal education while others are individuals with university degrees but no formal teacher training. An important challenge in improving education quality in Bol iv ia i s to ascertain the impact o f having untrained teachers and if the impact i s negative, to provide a solution to the 20 percent o f teachers who are currently interims.
Table 1.10: Teachers by Category, 2003
1 S O The third dimension o f the basic pay scale i s experience. Tenure i s contingent on passing an exam as wel l as budget approval by the Ministry o f Finance (MOF). The pay increments based on this dimension are quite large and if teachers progressed upwards automatically, the already large education wage bill would become impossible for the Government to pay. For this reason, the MOF can only authorize promotions once the M O E approves the budget to pay for the increases.”
1.5 1 Previously, promotions were automatically given to teachers based on their years o f experience (i.e., when the MOF authorized new positions, they were f i l led by the most experienced teachers), but are now based on a test. Teachers have the option o f taking this test every four years and failing candidates have the possibility o f taking the test the fol lowing year, as the Ministry holds the exam every year. In 2003 and 2004, the pass rates were 41.2 percent and 59.9 percent, respectively. In practice, not al l teachers who are eligible for the test take it, either due to lack o f adequate documentation or due to anxiety about failing. Until the last year, budgetary considerations influenced the threshold score at which teachers passed the exam and the bar was set a posteriori. This
’* Th is negotiation period i s always a tense period and i s accompanied by strikes and manifestations by the unions and difficult negotiations between the ministries o f Education and Finance.

- 1 9 -
Table 1.11: Bonos and Incentivos
Incentive Description
Bono frontera
Bono zona
Monthly bonus paid to teachers who work within 5Okm o f the country’s frontiers.
An additional monthly incentive to teachers in highly inaccessible regions.
Bono pro libro An annual stipend for buying books.
Bono econdmico An annual stipend that all teachers receive, unlinked to any specific behavior.
Bono cumplimiento An annual prize for teaching at least 200 days, that has no verification mechanism.
Bono jerarquico Additional pay for school directors.
Other bonos An annual stipend to al l teachers who do not receive the IPR (explained below).
Incentivo a la Permanencia Annual incentive given to teachers worlung in en el Area Rural Pobre areas where NBI ) (umet basic needs index) i s (IPW superior to 75%.
Incentivo Colectivo a las Incentive given only in 2001 to 1100 schools Escuelas (ICE) whose performance on an index calculated from
SIE data was the best in the nation.
Incentivo a la Modalidad Incentive given only in 2001 to bilingual teachers. Bilingue (IMB)
Incentivo a la Actualizacidn Docente (IAD)
Source: Ministry o f Education, 2004.
One time annual Incentive given only in 2002
created concerns over transparency particularly f rom teacher unions and, as a result, a fixed passing grade was set in advance beginning in 2004. This led to a 22 percent increase in the number o f teachers taking the exam and almost double the number o f those passing it. If not adequately monitored and planned, this may lead either to financially unsustainable commitments or to politically costly broken promises. As previously mentioned, the Education Reform o f 1994 introduced a number o f incentives to make up for the lack o f success in reforming the basic escalafdn (Table 1.1 1)
Value
20% o f haber basico (monthly)
20% o f haber basico (monthly)
Bs. 440 (annual)
Bs. 744 (annual)
Bs. 621 (annual)
Varies wi th base pay
Bs. 400 (annual)
US$lOO
US$354
US$200
US$350
1.52 The main difference between bonos and incentivos i s that bonos are provided by the Treasury and incentivos are supported by donors, which i s why their value i s expressed and calculated in U.S. dollars rather than Bolivianos (Bs). A clear negative aspect o f the incentivos i s their inconsistency. Contrary to MOE’s original intention, the IMB and ICE were paid only once, in 2001. As for the IPR, i t has been paid regularly since 2000; but may soon be devoid o f funding due to the closing o f the externally- financed projects that support them. An incentive that i s paid only occasionally and seemingly at random is a weak incentive that i s l ikely to cause more political dissent than result in positive changes in teaching practice and placement.

- 20 -
2. ISSUES IN THE EDUCATION SECTOR
2.1 As described above, Bol iv ia has made great strides in expanding its education system over the past decade. An examination o f the current status indicates that Bol ivia faces a wide set o f challenges, including: l ow and inequitable access to upper grades o f primary and secondary education, l o w levels o f academic achievement, and an inefficient education system. Two final challenges that will not be discussed in depth include: l ow access to early childhood education and low internal efficiency in higher e d ~ c a t i o n . ' ~
LOW AND INEQUITABLE ACCESS TO UPPER PRIMARY AND SECONDARY EDUCATION.
2.2 Although access to schooling as measured by enrollment rates has become universal up to age 11 or 12, considerable gaps open up between indigenous and non- indigenous students, rural and urban, and r ich and poor students beyond that age. The four panels o f Figure 1.4 clearly show that from the ages o f seven to about eleven, almost all children are in school. Even attendance rates in rural areas, in the lowest quintiles or among the Quechua-speaking population are wel l above 90 percent. However, from ages 12 onwards, enrollment drops significantly and the gap grows larger. At that age, students in urban areas, Spanish-speakers and from higher income families have a greater chance o f being enrolled in school. Enrollment rates for 14 year-olds in the top income quintile are 14 percentage points higher than those o f their cohorts in the bottom income quintile. Quechua 14-year-olds are 16 percentage points behind their Spanish-speaking counterparts, and the difference between urban and rural i s 14 percentage points. At age 15, when children should be entering secondary school, the difference grows larger and enrollment plummets. Indeed at age 16, the difference in attendance rates between urban and rural i s 27 percentage points, 26 points between the richest and poorest quintile, and 17 points between Quechua and Spanish speakers. This suggests that access to the last cycle o f primary, and particularly to secondary schooling, i s especially l o w among disadvantaged groups .
Lack of Supply
2.3 The decline in enrollment after age 12 i s attributed to a variety o f factors. The f i rst and most obvious i s lack o f supply o f schooling. While there are close to 13 thousand schools offering grades 1 to 3, only 8 thousand schools offer grades 4 to 5, less than 5 thousand schools offer the last cycle o f primary school and less than 2,500 schools offer secondary education. This suggests that schools offering higher grades become sparser, and distances between schools increase as students progress to higher grades. Geographical Information System (GIS) data show that children who do not attend school l ive on average twice as far from the nearest school as those who do. I t i s not surprising that, other things being equal, children who must walk long distances have a significantly higher chance o f dropping out.
l3 In depth analysis o f initial education and higher education are beyond the scope o f this report.

-21 -
80% -
60% -
Figure 1.4: School Attendance by Ethnicity, Income Quintile, Gender and Urban or Rural Residence
! 40%
20% I -i- Urban a
+Rural 0% --All ,
5 10 15 2(
100%
80%
- 0 0 5 60% c .-
4-
40% al a
20%
0 %
-i- Quechua -u- A y m r a - Castellano
15 2c lo Age 5
100%
80%
60%
40%
20%
0 %
+ Quintile 1 -u- Quintile 3 - Quintile 5
5 10 15 20 Age
100%
80% - 0 r v) o 60% C .- *
40% e, a
20%
0%
+Female Male -
Source: Mecovi 2002.
2.4 Children not enrolled in school live, on average, twice as far from school as those who are enrolled. W h i l e some o f this i s due to other factors that happen to be correlated with distance, econometric analysis shows that distance i s causal and each additional kilometer between the home and the closest school reduces the probability o f being enrolled in school by 1.3 percentage points. Individuals who l ive fkrther from schools are also poorer, indigenous, and have less educated parents. In conclusion, lack o f supply o f schools i s a problem for grade 4 and above. W h i l e the possibility o f reverse causality, such as families valuing education migrating closer to schools, cannot be ruled out, the evidence is strong that lack o f schools offering high grades i s a barrier to increasing access to higher grades.
- 22 -
I I I I 113,953 I 144,105
153,421 I 131,839
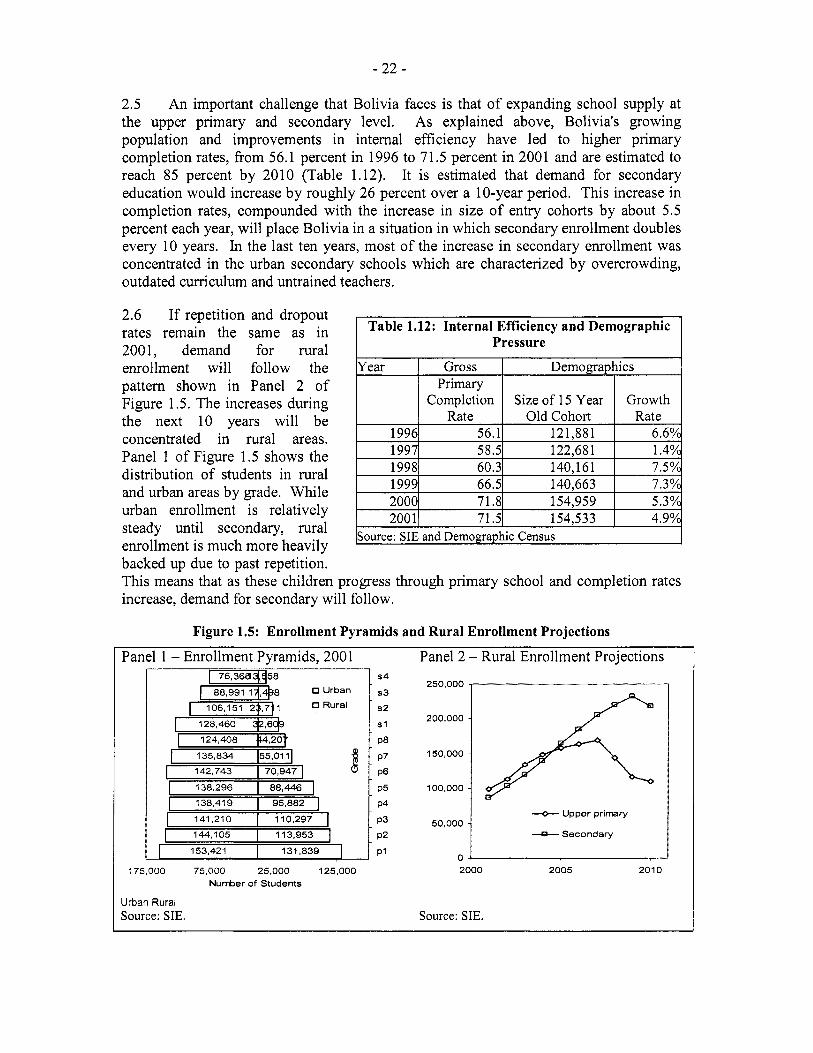
2.5 An important challenge that Bol ivia faces i s that o f expanding school supply at the upper primary and secondary level. As explained above, Bolivia's growing population and improvements in internal efficiency have led to higher primary completion rates, from 56.1 percent in 1996 to 71.5 percent in 2001 and are estimated to reach 85 percent by 2010 (Table 1.12). I t i s estimated that demand for secondary education would increase by roughly 26 percent over a 10-year period. This increase in completion rates, compounded with the increase in size o f entry cohorts by about 5.5 percent each year, will place Bolivia in a situation in which secondary enrollment doubles every 10 years. In the last ten years, most o f the increase in secondary enrollment was concentrated in the urban secondary schools which are characterized by overcrowding, outdated curriculum and untrained teachers.
P2
P I
2.6 If repetition and dropout rates remain the same as in 2001, demand for rural enrollment wil l follow the pattern shown in Panel 2 o f Figure 1.5. The increases during the next 10 years wi l l be concentrated in rural areas. Panel 1 o f Figure 1.5 shows the distribution o f students in rural and urban areas by grade. W h i l e urban enrollment i s relatively steady until secondary, rural enrollment i s much more heavily backed up due to past repetition. This means that as these children progress through primary school and completion rates increase, demand for secondary wil l follow.
Figure 1.5: Enrollment Pyramids and Rural Enrollment Projections
Panel 1 - Enrollment Pyramids, 2001 Panel 2 - Rural Enrollment Projections
1 I
138.296 88,446 138,419 95,882
141,210 110,297 I I I
250,000
200,000
150,000
100,000
50,000
0
+ Upper primary
-a- Secondary
175,000 75,000 25,000 125,000 Number of Students
Urban Rural Source: SIE.
2000 2005 2010
Source: SIE.

- 23 -
need to address quality at the upper primary and secondary education level are the l o w external benefits o f this level of education. As Average Year ly shown in Table 1.13, the rates of return to Educational Cycle Rates o f Return upper primary and secondary education are Primary Grades 1-6 12.4%
4.9% higher education. Eleven percent of Secondary 9.1% secondary graduates aged 18 to 25 are Higher 17.5% unemployed. O f those who do work, 53 S o u r c e : ~ ~ c o v ~ .
Table 1.13: Education Rates of Return (Private)
l o w when compared to those o f primary or Primary Grades 7 and 8
2.7 While the increase in completion rates i s indeed good news, this situation does create an important fiscal challenge. If pressure on secondary enrollment follows the path shown in Figure 1.5, an additional 130,000 new school places must be created over the next seven years. At today’s rural secondary student-teacher ratio o f 23:1, 5,600 new teachers wi l l be needed. With initial, primary, and secondary teacher pay constituting nearly 3 percent o f GDP, this poses a difficult fiscal challenge.
2.8 In addition, the quality o f secondary education cannot be overlooked as access to this level expands. While primary schools were the recipients o f major attention and reform in the last decade due to the Education Reform Program, secondary schools were neglected and to date continue to offer outdated curricula and pedagogical materials, inadequate infrastructure, conventional teaching techniques with very limited pedagogic resources, and imbalanced classroom sizes (overcrowded classrooms in some schools and l o w student: teacher ratios in others). Moreover, the teaching force is unequipped. I t i s estimated that approximately 45 percent o f secondary school teachers are not trained to teach this level with this number increasing to 70 percent in rural areas.

- 24 -
Labor Market Participation
2.10 Labor market participation i s another factor keeping children out o f school especially in rural areas with high poverty rates. Indeed, as Table 1.14 reveals, close to 20 percent o f children aged 10 to 14 works and this i s consistent with the age that children start to drop out (see discussion above). Results using the bivariate probit method are presented in Table 1.1514. These findings reveal that there i s a significant and negative correlation between work and s~hoo l i ng . ’~ Results show that each additional exogenous percentage point in the
Table 1.14: School Enrollment and Labor M a r k e t Participation by Age Work, no No work, N o work, Work,
Ag school no school school school 7 1% 6% 87% 7% 8 1% 3% 86% 10% 9 1% 2% 84% 13%
10 1% 3% 80% 16% 11 2% 2% 80% 16% 12 3% 3% 74% 19% 13 5% 3% 77% 14% 14 9% 7% 67% 17%
7% 61% 20% 15 12% 8% 61% 16% 16 16%
17 19% 10% 53% 17% Source: 2002 MECOVI.
probability o f working reduces the probability o f enrolling in school by 0.75 percentage points for children and youth aged 13 to 18. For children aged 9 to 12, the probability increases to 0.95 percentage points. These results, as well as the broader literature on child labor, support the assumption that chi ld labor market participation significantly impacts school enrollment and completion. There are, o f course, other factors affecting the decision to drop out o f school that are not captured and not measured in typical household surveys which will need to be addressed in future work.
l4 An econometric model was estimated in which the two explained variables are school enrollment and labor market participation and the explanatory variables are the dependency ratio o f the household, the schooling level o f the most educated adult in the household, ethnicity, household per capita income, age, and household survey geographic sampling stratum. ’’ T h i s means that the negative “true” relation between schooling and work w i l l be influenced both by the effects o f other variables and by reverse causality. In order to net out these effects, we use instrumental variables-variables that have a causal relationship with work but not with schooling, to explain the effect. We use the average value o f wages for workers aged 19-24, which i s the age category just above 13-18, in each o f the nine departments for three consecutive years as a proxy for labor demand. T h i s instrument i s imperfect as intra-family allocation o f effort and time may lead the behavior o f those aged 13- 18 to be influenced by that o f those aged 19-24 through a mechanism outside the labor market.

- 25 -
Castellano 0.3641 O'Xd I -0.3991 0% Guarani -0.0751 47?4 I -0.41d 0%
Table 1.15: Bi-variate Enrollment W o r k Probit
Urban 0.020( 72?44 I 0.08d 7% Metropolitan -0.6141 O'XJ I 0.7461 0%
Age -0.2491 0?44 I 0.1111 0% Constant 4.46d 0?4J I -2.5991 0%
klmital base I I lbase I I
k e r catita familv incornel 0.2921 O ? d I -0.3901 OYd
LOW AND UNEVEN QUALITY OF EDUCATION
2.1 1 Bolivia has participated in only one international achievement evaluation, the Laboratorio Latinoamericano de Evaluacidn de la Calidad de la Educacidn (LLECE).I6 Table 1.16 shows that Bol iv ia scored close to the median o f achievement results and given i t s per capita income, i t performs somewhat better than predicted; however, in depth analysis shows this can be misinterpreted.
l6 The LLECE evaluation was undertaken from June to November 1997 in Argentina, Bolivia, Brazil, Chile, Colombia, Cuba, Dominican Republic, Honduras, Mexico, Paraguay, and Venezuela. Third and fourth grade students were tested in math and writing. Bolivia did not participate in the more modem PISA, TIMSS, or IALS evaluations. LLECE i s based on Classical Test Theory and not Item Response Theory and relies on identical questions to compare different countries or groups. The number o f items i s relatively small and the orientation i s not on problem solving as with PISA or other more modem evaluations.

- 26 -
Y "
Argentina 263 (2) 251 (2) Bolivia 232 (7) 240 (6)
Table 1.16: Average Language and Math Scores in LLECE for Grade 3
(Position in Parenthesis) kountrv tlanmage b a t h
Source: LLECE published results.
2.12 The LLECE results in mathematics achievement are especially striking as Bol iv ia i s tied with Colombia for fifth place out o f eleven participating countries. No t only does Bol iv ia do much better than Honduras, the only other country with comparable income per capita in the sample, i t also does much better than far wealthier countries such as Venezuela and the Dominican Republic. In language however, Bol iv ia fares slightly worse in seven out o f eleven countries.
2.13 Figure 1.6 shows the distribution o f LLECE mathematics results for Cuba, Argentina, Bolivia, Venezuela, and the mean o f al l participating countries by achievement percentile. Apart from Cuba, which i s a positive outlier-and i s shown only to illustrate that even a poor country with very l imited resources can achieve educational excellence-the figure shows Argentina as an upper bound and Venezuela as a lower bound for achievement in Latin America. Bol iv ia i s about half-way between these two extremes and very close to the regional average. It i s also slightly more equitable than Latin America with Bolivia's lowest performers (those towards the left o f the distribution) doing better than their Latin American equivalents and Bolivia's highest performers (those towards the right) doing worse. Achievement results, however, can be misleading if only averages are considered. A more in depth analysis o f the international LLECE and the Bolivian SIMECAL evaluations reveal large differences in learning achievement between children from the lower and upper percentiles. The LLECE scores o f students in the ninetieth achievement percentile in Bol iv ia are less than hal f the scores o f those students in the tenth achievement percentile.

- 27 -
Achievement
Level
None
A
B
C
Figure 1.6: Distribution of LLECE Mathematics Results
-Cuba
Latin America -Bolivia -Venezuela
0 20 40 60 80 100
Language Mathematics
Description Percent Description Percent o f o f Students Students
Language understanding i s 5.1 N o capacity for problem 8.7 insufficient for taking the test.
Fragmented understating o f a 13.9 Simple problems with only one 27.1 text. operation can be solved.
solving.
Capacity to establish relations. 3 1.4 Combined operations problems. 33.7
Global text comprehension. 49.7 Complex problems are solved. 30.6
500
450
400
350
300
250
200
150
100
Source: LLbCb microdata.
2.14 Bolivia's national assessment results provide more conclusive evidence o f l ow quality. Results for eighth graders in 1998 are shown in Table 1.17. Only ha l f o f the students achieve passing results in reading and less than one third achieve passing results in math. Clearly, improving the quality o f education i s critical.
2.15 Regression analysis shows that much o f this difference i s either unexplained or related to household variables such as parental schooling; but analysis also suggests that accountability and school management improves performance. An education production function estimated by Urquiola et al. (2000)'' suggests that test scores increase when the
l7 The full specification also included individual, household, and other socioeconomic controls.

- 28 -
teacher i s a normalista, although this result i s weak and non-significant for public schools (Table 1.18). In addition, there may be some reverse causality as normalistas may choose to teach at the best schools. However, the evidence i s strong and significant for private schools. The fact that private schools do better (even when controlling for observed student characteristics), suggests that some characteristics o f private schools in Bolivia may be important determinants o f learning achievement. Selection, sorting and unobserved characteristics are l ikely to be important determinants o f private school success in the case o f paid private schools for the wealthy. However, in charter schools such as Fe y Alegria, both selection and unobserved characteristics only play a limited role. This suggests that management characteristics, such as greater pedagogical support for teachers, more supervision o f teachers, and overall accountability, may have an impact.
Table 1.18: Factors Associated to High Quality as Measured by S I M E C A L
Source: Urquiola et al. Note: Standard errors in italics.
2.16 In addition to the lack o f better teachers and effective school management, the low results may be explained by an important factor: nonattendance or absenteeism o f both students and teachers. While 95 percent o f primary school aged children are enrolled in school, household survey data reveal that on any given day, close to 40 percent o f them are not attending. Whi le this remains an insufficiently understood phenomenon, institutional reasons may be at play. Work on teacher absenteeism by Kremer et al. (2004) has shown that school directors report considerable teacher absenteeism due to institutional reasons such as training, planning, and other time-consuming activities that could be scheduled for non-instructional time. The six panels in Figure 1.7 below show enrollment (solid line) and attendance (broken line) by age for al l Bol ivian students, females, Quechua and Aymara speakers, and urban and rural residents. The panels are

- 29 -
constructed using the attendance question in the M E C O V I surveys.'' Figure 1.7 shows a large gap between enrollment and attendance especially for those students in rural areas. The difference for al l students i s 40 percentage points for ages 8, 9, and 10. In the case o f rural inhabitants, the number goes up to 50 percentage points for ages 9 and 10. Quechuas do especially poorly while Aymaras do slightly better. The attendance- enrollment gap i s less for urban inhabitants than i t is for rural inhabitants while there appears to be no gender difference.
Figure 1.7: Enrollment (solid line) and Attendance (broken line) by Age, According to
Panel 1 - Bolivia
100%
80%
60%
40%
20%
0% I
Demographic Group Panel 2 -Women
100%
40%
20%
0% I 5 15 25 5 15 25
Panel 4 - Aymara
100%
80%
60%
40%
20%
0%
Panel 5 - Rural
100%
80%
60%
40%
20%
0 Yo 5 15 25 5 15 25
Source: 2002 MECOVI.
Panel 3 - Quechuas
100%
80%
60%
40%
20%
0 Yo 5 15 25
Panel 6 - Urban
20%
0 Yo 5 15 25
INEFFICIENT EDUCATION SYSTEM
2.17 Despite the fact that a high share o f GDP i s invested in education, Bol iv ia i s failing to produce the educated citizens and productive workers i t needs to compete in the global economy. In 2002, education spending constituted 6.8 percent o f GDP-the highest level in the past ten years. However, resources are not allocated in an efficient manner that would improve learning outcomes. Indeed, spending on education materials i s low and the share o f administrative expenditures in the budget i s exceedingly high. Many schools in Bolivia have significant shortages o f basic learning supplies such as
The question is relatively new in household surveys and i t i s not totally clear how respondents are interpreting it, but the results are nevertheless quite troubling.

- 30 -
Percentile \ Year
paper, pencil, and chalk since neither the directors nor the mayors accept responsibility for their provision. Moreover, infrastructure investments are not aligned with pedagogical investments.
1991 I 1996 [ 2001
Decentralization
5%
2.18 As discussed in chapter 1, the delivery o f education i s covered by many different levels o f administration. The recent decentralization process, while positive in many aspects, has led to some misalignment o f responsibilities and resources. As in many other countries, some functions were decentralized but the control o f everything that mattered was kept in the center. Today, the education sector i s characterized by a disjointed and fragmented decision-making process. The result i s a “middle-of-the-road” between a top- down approach-in which schools are created and staffed according to demographic and student f low factors calculated by a competent central bureaucracy-and a bottom-up approach-in which decentralized bodies are responsible for hiring decisions. The present decentralization and accountability arrangement does not allow for adequate articulation between the central and municipal levels, leading to waste o f municipal resources and lack o f interest on the part o f mayors in increasing their share o f educational investment. This leads to considerable communication difficulties and inefficient use o f education resources. Particularly evident are overlaps in responsibilities among different levels o f government. These ambiguities and blurred responsibilities are particularly severe between the district directors, mayors, and departmental government^'^. These overlaps are evident in responsibilities for learning supplies, teaching positions, and infrastructure.
16.9 I 18.8 I 17.9 30% 22.0 23.7 23.0 50% 26.4 23.9 28.3 70% 30.0 30.8 39.8 95% 44.9 40.4 56.8 Mean 27.6 27.4 33.0 Bolivia 25.2 26.4 24.4
2.19 Inefficient allocation o f teachers is a major problem in Bolivia, complicated by the division o f decision-making among the different levels o f education administration. Teachers are paid by the central government, the department level education administrators
determine the allocation o f teachers to the municipalities, and the district directors assign teachers to individual schools. Once distributed, teaching positions become an acquired right o f the departments and districts and are difficult to change even if demographic shi f ts necessitate the re-allocation o f teachers.
2.20 Improving teacher allocation remains one o f the most critical elements for improving the quality o f education. Indeed, the student-teacher ratio has a weak relation with the number o f students in educational districts and almost none with the rural nature o f the districts (the distance in meters students must walk to get to the school). A simple optimization algorithm suggests that 9,000 teachers are not needed in the schools in
l 9 I t i s worth noting that one o f the problems of coordination i s related to the fact that Educational Districts usually coincide with the territorial jurisdiction of municipalities, but there are 327 municipalities and only 275 districts, as smaller municipalities are sometimes grouped together into one educational district.

- 3 1 -
200 -
150 -
100 -
50 -
0 1
which they work as evidenced by low student-teacher ratios. Figure 1.8 below shows that teacher distribution among districts i s quite poor. Even when characteristics such as the rural nature o f the country are taken into account the expected student-teacher ratio in Bolivia should be about 29:1, which i s slightly more than the observed ratio o f 24: l (Table 1.19). If the large student concentrations in the departmental capitals o f Santa Cruz and L a Paz are not considered, the student-teacher ratio falls to 16.5: 120. Therefore, the large intra-departmental variance i s not due to extreme isolation o f some municipalities. Once again, if Santa Cruz and L a Paz are excluded, 41.1 percent o f Bol ivian schools have less than 12 students per teacher. The figures indicate that while average school size i s reasonably correlated with the student-teacher ratio (0.87), distance from households to schools i s not (0.04). Distance from school to households does not have a high correlation with school size either (0.01). If the same graphs were to be made using school nuclei or individual schools, the differences would be even greater. This points to the need for improving efficiency as substantial gains can be made from better teacher allocation.
0
O . 0
0 e
0
0
0 O 0
from Home to School
0 20 40 Student Teacher Ratio
Source: SIE and GIs.
Figure 1.8: Student Teacher Ratio vs. Number of Students and Distance f rom Home Panel 1 - STR vs. Average School Size I Panel 2 - STR vs. Average Generalized Distance
0 20 40 Student Teacher Ratio
Source: SIE and GIs.
2.21 Finally many schools in Bolivia have significant shortages o f basic learning supplies such as paper, pencil, and chalk since neither the directors nor the mayors accept responsibility for their provision. In addition, there i s not an adequate budget for these types o f expenditure.
LOW ACCESS TO EARLY CHILDHOOD EDUCATION
2.22 Whi le in depth analysis o f the challenge in expanding init ial education i s beyond the scope o f this report, i t i s important to note that expanding access to initial (pre-school) education i s crucial, especially to improve educational performance o f children from disadvantaged backgrounds. International experience has shown that access to early
2o The standard deviation of their distribution i s 18.7, which corresponds to a variance of 348.3. T h i s variance i s distributed as follows: 1 percent between departments, 20 percent between districts but within departments, and 79 percent within districts.

- 32 -
Total New Graduation Year Enrollment Enrollment Graduates Rate 1990 105.879 28.241 4.785
education opportunities result in significant gains and improved learning outcomes. Initial education i s both under funded and inaccessible to most children in Bolivia. Per pupil expenditures are less than 60 percent o f per pupil expenditures at the primary level. Additionally, only 35 percent o f 5 year-olds and 67 percent o f 6 year-olds are enrolled in initial education. Unfortunately, i t is exactly those who need i t most who have the least access to pre-school education. Whi le 32 percent o f urban 5- and 6-year-olds are in pre- school, the corresponding figure for their rural counterparts i s 24 percent; while 34 percent o f 5- and 6-year-olds from non-poor households have access, only 27 percent o f the poor are in early childhood education.21
1991 1992
LOW INTERNAL EFFICIENCY IN HIGHER EDUCATION
111,455 25,316 5,349 120,976 27,969 5,272
2.23 Tertiary education in Bolivia i s characterized by poor quality and low internal efficiency. As a result, few students who enter the system actually graduate. Graduation rates are very l ow (see Table 1.20). And although they are improving over time and may be underestimated22, this signals a high level o f waste o f public resources especially given that higher education absorbs 25 percent of all expenditures in education.
1994 1995
Table 1.20: Enrollment and Graduation in Public Universities
136,791 25,104 7,040 25% 142,249 28,622 8,338 33%
1997 1998
164,393 32,754 10,550 40% 178,507 36,297 10,500 42%
11993 1 128.1991 26.4111 6.524 I
000 I 212,4411 41,2661 11,8361 40%
11996 I 151.7681 29.3981 9.890 35%1
11999 I 194.8531 39.4251 12.3111 43%1
*' In depth analysis o f init ial education and higher education are beyond the scope o f this report. 22 Higher education data i s not very reliable.

- 33 -
3. POLICY RECOMMENDATIONS
3.1 Efforts to improve the education system have resulted in an increase in overall coverage during the past decade. The challenges outlined above have prompted an emphasis on improving the performance o f the education sector especially in the area o f secondary education which has been neglected in previous reform efforts. Given the key issues outlined above some possible options to respond to the situation are presented below.
IMPROVING ACCESS TO AND RETENTION IN UPPER PRIMARY AND SECONDARY SCHOOLS
Supply Side Interventions
3.2 To sustain gains made in primary education, the first and possibly most urgent issue is the need for the expansion o f upper primary and secondary schooling. The combination o f greater access and increased completion at the primary school level, combined with the population pressure from a greater cohort size, wi l l inevitably result in a higher demand for secondary schooling, especially in rural areas. Indeed, demand for rural secondary enrollment is estimated to double by 2010.
3.3 An important determinant o f access to schooling i s the supply. For example, schools must be nearby, teachers must be present and books must be available. Improving access involves both investments in the existing conventional systems and exploring alternative methods o f service delivery to meet the specific needs o f rural students. For children who drop out or do not attend due to living far from existing schools, methods such as radio education and/or tutorial home/school combinations are particularly promising. There are many examples o f successful radio programs in Latin America. Tutorial programs, which have also been used in many countries, can be cost effective and efficient in terms o f educational impact. Tutorial programs consist o f either having a teacher visit an isolated community once or twice a week or having the children travel to a distant school once or twice per week. During the remaining days, the children follow a work program supervised by an adult from their community. If combined with radio education, as battery powered radios are available even where there i s no electricity, the model can be further enhanced.
3.4 Given the tight fiscal situation, using existing school infrastructure for alternatives such as telesecondary education in areas that have access to electricity is a promising l ow cost alternative to formal delivery o f secondary education in rural areas. This modality consists o f using existing primary infrastructure and staff for provision o f secondary schooling. A generalist teacher, with training as a high school teacher plays the role o f a facilitator while content teachers lead instruction through video or television channel. In Mexico, where this modality has been evaluated, telesecondary students, once student

- 34 -
background i s controlled for, can result in student achievement levels similar to those o f other m o d a l i t i e ~ . ~ ~
D e m a n d Side Interventions
3.5 Beside supply side strategies and given the economic downturn and increasing poverty especially in rural areas, demand-side interventions are needed to attract and retain children in school. Such interventions include conditional cash transfers, where families are provided cash subsidies in exchange for enrolling their children in school and maintaining high attendance rates. W h i l e the cost i s high, these programs have proved to be very successful in other countries in Latin America and should be studied for application in Bol iv ia (Box 1.2).
Box 1.2: Increasing School Enrollment through Stipends in Brazil: The Bolsa Escola Program
~~~~ ~~ ~~ ~ ~~ ~
In 1995 the federal district municipality o f Brasilia launched the innovative Bolsa Escola program with the goal o f increasing educational attainment and reducing the incidence o f chi ld labor. Bolsa Escola aims to break the vicious cycle o f poverty and low educational attainment in Brazil. The relevance o f th i s program for l i felong learning i s based o n i ts use o f such grants to offset the opportunity cost o f attending school.
The program also includes a savings program that creates an incentive for staying in school. The school savings program deposits money into the account o f each chi ld whose family i s a beneficiary o f the scholarship program if the chi ld i s promoted to the next grade. H a l f o f the amount deposited can be withdrawn when the ch i ld reaches the f i f th grade. Withdrawals can be made again upon successful completion o f the eighth grade and secondary school.
3.6 Mexico has had tremendous success in enrolling and retaining children in schools through i t s conditional cash transfer program, Oportunidudes. Rigorous impact evaluations o f the program indicate that i t has significantly increased the enrollment o f children, particularly girls, especially at the secondary school level. The results imply that children wil l have an average o f 0.7 years o f extra schooling because o f Oportunidudes, although this effect may increase if children are more likely to attend upper secondary school as a result o f the program. Using panel data for Mexico for 1997 to 1999 (Behrman and others 2005; Skoufias and Parker 2001; Schultz 2004) i t has been shown that Oportunidudes resulted in higher school attainment among indigenous children, and a significant reduction in the gap between indigenous and non-indigenous children (Bando and others 2005). Results show a significant reduction in the probability that indigenous children work after their participation in the program. Nonetheless, indigenous children had lower school attainment compared to children that either only speak Spanish or are bilingual.
3.7 very poor and the indigenous populations who are the most vulnerable.
I t i s important that these interventions be carefully targeted, particularly at the Household
23 See World Bank (2005).

- 35 -
surveys can be valuable tools to exploit for information on disadvantaged groups, namely the indigenous. Without the necessary political wi l l on the part o f the government, however, targeting i s unlikely to be significantly improved. Yet this option while implying a fiscal cost would also lead to a reduction in unit costs.
3.8 In addition to demand side financing schemes described above, the Secondary School for All program in Chile (Box 1.3), designed to tackle the problem o f school dropout among secondary school students, can be studied for possible application in Bolivia. Similar programs in the United States have been shown to be highly cost- effective (Greenwood and others 1998).
Box 1.3: Chile Secondary School for All Program
Chile’s “Secondary School for All” program, begun in 2000, i s designed to tackle the problem o f school dropout among secondary school students. I t i s part of a plan aimed at achieving a universal minimum o f 12 years of schooling. The educational establishments are selected through a school vulnerability risk index which estimates the school dropout probability o f the students o f each school on the basis o f the maternal level o f schooling and the repetition and attendance rates o f the students. The same index serves to determine the number o f scholarships required by each school. I t i s complemented with an appraisal card for the students, which allows the beneficiaries to be selected on the basis o f their school attendance, average marks and overage status (scholastic lag or age-for-grade).
The program i s based on an intervention strategy which combines two dimensions: the quality o f l i f e and the quality o f education. The former includes access to welfare services (mainly scholarships for the students who are most vulnerable), improvement of the conditions in schools, and the implementation o f a school health program designed to help keep young people in school. As to the quality o f the education component, each establishment must formulate and develop a plan o f action to avoid school dropout, based on a process o f reflection and analysis, and receives: (a) scholarships, worth 148,000 Chilean pesos per year (about $200 per beneficiary); (b) a teaching development plan; (c) a psycho-social development plan; and (d) the improvement o f boarding schools.
The “Secondary School for All” program has not yet been evaluated and its coverage has been relatively limited - during 2001 the program awarded around 6,000 scholarships. However, similar programs are highly cost-effective. In the United States, incentives to induce disadvantaged high-school students to graduate have proven to be a cost-effective approach.
Sources: CEPAL 2002; Greenwood and others 1998
3.9 Some other successful programs o f Network Schools in other countries in Latin America should also be studied. For example, the Matte Schools o f the Sociedad de Instruccidn Primaria o f Santiago (SIP) i s an example o f a private subsidized network o f schools that have been very successful in providing a quality education to disadvantaged children. The SIP schools are located in low-income neighborhoods, have complete autonomy, and were originally supported entirely from private contributions. They were among the first to take advantage o f the opportunity to become private, when Chile’s nationwide voucher system was established in 1980. The SIP schools have higher

- 3 6 -
performance on Chile’s national achievement tests than do both public (municipal) and private-subsidized schools, and almost as good as the more selective and more expensive paid private schools. This i s an important finding considering that SIP schools serve children from poor backgrounds (McMeekin 2003). Such programs have the benefit o f reducing fiscal costs while serving poor children.
IMPROVING LEARNING OUTCOMES
Provision of Quality Learning Materials
3.10 Access to learning materials, especially in low-income areas and in bilingual schools i s critical to improving student learning. Low educational quality can be due to family background factors as wel l as school-related factors. Among school related factors, quality learning materials along with a positive school climate have the greatest positive effect on achievement (UNESCO 2000). In Bolivia, ineffective and untrained teachers and lack o f or inadequate learning materials receive much o f the blame for poor student achievement. Achievement can be increased substantially through appropriately designed and targeted interventions, provided that they are wel l implemented. When tailored to the needs o f disadvantaged children, these interventions can reduce the difference in learning outcomes between these children and their peers. Thus, a substantial increase in learning achievement i s possible for schools in rural and disadvantaged areas if increased quality inputs are well targeted. Despite the gains o f the institutionalization o f intercultural bilingual education, part o f the education reform, implementation has been far from perfect. To date i t has yet to be fblly implemented and pedagogic text production has suffered from considerable delays and as a result many children were le f t without pedagogic materials. Perhaps the main failure o f bilingual education was that i t was often applied against the wishes o f parents and students and resulted in unnecessary resistance among parents who were anxious to see their children learn Spanish and excluded those who wanted the bilingual approach. An important recommendation i s for bilingual education to be an option, not an imposition.24
National Assessments
3.11 The use o f national assessments (SIMECAL) is necessary for establishing benchmarks for future tracking o f achievement trends and linking results to teacher training and curriculum. Bol iv ia has established a comprehensive evaluation system with the original idea o f making systematic use o f the available information. However, the results from SIMECAL have not been used to provide feedback to pol icy makers. While the original intention was to use the results to inform curriculum reform and teacher training and thus lead to changes in the classroom, this has yet to occur. L imited budget has meant that testing has been conducted sporadically (1 997, 1999, and 2000); each time in different grade levels, and only for small, though representative, samples. These characteristics limit the usefulness o f findings and make rigorous comparisons difficult. Of great concern i s the fact that SIMECAL evaluations have recently been suspended.
24 Evidently, choice in the bilingual option will involve planning difficulties for the MOE. For example, materials and particularly trained teachers cannot be provided overnight. Nevertheless, the benefits of choice far outweigh its costs.

- 37 -
Although S IMECAL has not been eliminated, the staff has been reduced and no new assessments have taken place in primary schools since 2000. This assessment system provides an excellent opportunity for Bol iv ia to establish national standards for what students should learn by the end o f the each grade, teacher qualification, curriculum evaluation and development, and provide incentives for the improvement o f education. Transforming the student assessment system from a pol icy tool into a pedagogic one, along the lines o f what exists in Chile and Uruguay today, i s the f i rst step towards establishing mechanisms for ensuring accountability and improving educational quality.
International Assessments
3.12 Furthermore, i t i s important for Bol ivia to participate in international assessments such as TIMSS and PISA and use the results to benchmark i ts performance against other countries. TIMSS and PISA results provide an excellent opportunity for a country to evaluate i t s educational system and inform pol icy responses (Box 1.4). This has been the case in Singapore and Jordan where the results are repeatedly used to reform curriculum, train teachers and conduct research on the determinants o f learning. In both cases, but especially in the case o f Singapore, the use o f the TIMSS results has provided significant returns. The cost o f participation i s relatively l ow and the benefits are many.

- 3 8 -
Box 1.4: The Case o f Jordan
Jordan has benchmarked i t s education system against other countries in the areas o f education indicators and international achievement tests. This provides Jordan wi th comparable information by which to analyze systemic progress towards better educational quality. Jordan i s also one o f the Wor ld Education Indicator Countries, which benchmark their systems to OECD countries.
In 1990, Jordan became the first Arab country to participate in the International Assessment o f Educational Progress (IAEP 11). The IAEP I1 study was launched simultaneously w i th Jordan’s effort to undertake a thorough review o f i t s education system that could be used to design a comprehensive reform program. The IAEP process not only provided crucial data o n Jordan’s educational performance (at the 8th-grade level), but also allowed national educational specialists the opportunity to learn the techniques that such an exercise involves - including sample selection, administration o f tests, and implementation monitoring. The IAEP I1 study was to be instrumental in building national capacity for independently conducting national surveys o f education achievement in the future. Jordan’s students ranked near the bottom in IAEP 11.
Then Jordan participated in TIMSS in 1999. The results o f the study came as a shock. About 75 percent o f students in mathematics and about 67 percent o f students in science scored lower than the international average. Jordan stood third from the bottom in both subjects among the 20 participating countries.
An expert committee was subsequently established to investigate the causes o f this poor performance. After an item-by-item examination o f the test and school curricula, as wel l as administration o f practice tests, Jordan re-administered the entire TIMSS examination. The results were almost identical to those obtained during the f irst round o f testing. However, the results served to inform efforts to reform educational quality. More specifically, i t served to: (a) establish benchmarks o f 13-year-olds’ achievement relative to 19 countries; (b) show the areas o f weakness and strength in each subject; (c) compare the performance o f students in schools run by different authorities, regions and areas; (d) identify cognitive processes and respond with a view to informing teacher training; (e) analyze family and home characteristics associated wi th student achievement; and ( f ) target negative and positive influences o f classroom practices, out-of school activities, and attitudes.
Jordan’s example indicates the importance o f government commitment to use the results o f international assessments for evaluating education systems, establishing benchmarks for future tracking and informing pol icy responses. Most importantly, the efforts paid off. In 2003, Jordan again participated in TIMSS. The results were impressive. Jordan improved i ts scores in both math and sciences. In science, Jordan’s performance was above average.

- 3 9 -
IMPROVING DECENTRALIZATION ARRANGEMENTS TO INCREASE EFFICIENCY AND EFFECTIVENESS
3.13 By decentralizing the educational system, the government can increase local resource mobilization and efficiency, and greater community and parental involvement in education. Educational decentralization as implemented in N e w Zealand, Victoria (Australia), Brazil, Colombia and Chile i s likely to enhance the performance o f the education system. On the other hand, a decentralized system o f finance without an effective compensatory mechanism can be detrimental to children in economically disadvantaged areas. Through appropriate policies, the benefits o f decentralization can be enjoyed without undermining equity. One o f these policies i s for the federal government to ensure that disadvantaged states get more resources than others. Decentralization presents an opportunity to rethink the way federal money i s allocated and to allow the distribution o f funds in a simple and more transparent manner, with less potential for overlap. In particular, interest in a formula-driven allocation with a corresponding accountability framework provides a good opening for more effective alternatives for dealing with equity and efficiency issues.
3.14 It i s notable that much o f Chile’s remarkable achievements in improving learning outcomes came after i t s decentralization pol icy was complemented with implementation o f well-designed public school improvement programs that increased material support for disadvantaged schools and strengthened support for professional development o f teachers. Successful decentralization efforts such as those cited above have been effective in improving education because they focused on the schools. Administrative and budgetary reforms were designed to ensure that schools and their teachers have the professional competence, authority, resources and incentives to design and carry out learning and teaching activities that are suitable to the needs o f the individual students. I t i s impractical and inefficient for the national government to bypass sub-national governments because there are educational activities that are done best at the lower levels. These are activities which the government cannot handle efficiently because i t i s too far away from the problem (for example, supervision, coordination o f location o f schools, and ensuring equity among localities within a state).
3.15 In light o f Bolivia’s present arrangements and the strong political move towards further decentralization, changing financing rules to have funds follow students may be the best solution. If the central Ministry o f Education finances departments or municipalities (or both) according to a student-based formula (adjusted for special conditions such as sparsely rural areas or transportation difficulties) this would create incentives to have as many children as possible in school without the wasteful assignment o f teaching positions in existence today. The M O E could then assume the role o f setting standards, evaluating performance, and providing technical support to the departments and municipalities that would be running schools.

- 40 -
Box 1.5: Examples of Financing Following Students
Chile. Chile allows funds to fo l low children through school choice. This means that private education providers or municipalities receive funding f rom the central government that i s strictly proportional to the number o f children enrolled in each school. Children are free to enroll in any school they choose (private or municipal). Private schools receive funding proportional to the number o f students enrolled. In the case o f municipal schools, the municipalities that run the schools receive the per capita funding, add any o w n resources they wish, and then divide the resources among their schools as they see fit.
Brazil. Brazi l has always had a decentralized education system in which schools were run either by municipalities or states, which were required by law to dedicate 25 percent o f their total revenues to education. Unfortunately, this led to high inequalities in financing due to large difference in per capita revenues among Brazil’s states. Started in 1998, a reform called FUNDEF (Fundo de Manutenqiio e de Desenvolvimento do Ensino Fundamental e de Valorizaqgo do MagistCrio) takes 15 percent o f tax collection and revenue sharing at the state and municipal levels and creates a state level fund. This fund i s then redistributed to the municipal systems and the state system in proportion to primary enrollments f rom the previous year. The federal government then tops o f f the fimd in those states in which tax collection falls beneath a certain minimum. Once again, the end result i s that financing follows children.
Colombia. Colombia has followed a decentralization path closest to that being taken by Bol iv ia now. Decentralization in education was a political decision made as part o f a national decision to decentralize in al l areas. When teachers were f irst decentralized to the departmental level their wages were paid for by a block grant called the Situado Fiscal. However, most o f the Situado was distributed according to trends driven by pre- decentralization distribution o f costs. This, o f course, did not lead to a better allocation o f teachers or equity among departments. Even worse, for a whi le departments could hire teachers and pass o n the cost to the Situado. Municipalities also receive a formula-driven grant (Purticipaciones Municipales) and hire some teachers for municipal schools. Teachers were decentralized with no attention to equity between departments or municipalities. This led to very large disparities in student-teacher ratios with n o incentive to change the resource allocation rules. As the situation became more complicated, incremental funding that follows students has been introduced and the situation i s expected to improve.
Improved Accountability
3.1 6 The fragmented decision-making process that characterizes Bolivia’s current decentralization arrangement highlights the need to assign responsibility for improving learning outcomes. In most countries that perform well in international assessments, local authorities and schools have substantial responsibility for educational content and/or the use o f resources, and many set out to teach heterogeneous groups o f learners. In order to improve learning outcomes i t i s necessary that school empowerment be accompanied by a strengthened accountability framework that enhances social and parental participation in schools. Finally, accountability can strengthen school quality by involving parents and the community more, and by setting clear goals and visions for the school system. To improve quality, Bol iv ia needs to continue i t s efforts to move decision-making to the school level.
- 4 1 -
4. REFERENCES
Albo, Xavier, and Anaya, Amalia (2003). Niiios alegres, libres, expresivos: La audacia de la
Banco Central de Bolivia. (2002). Boletin Estadistico No. 316. December.
Bando, R., L.F. Lopez-Calva and H.A. Patrinos. 2005. “Child Labor, School Attendance, and
educacidn bilingiie en Bolivia. L a Paz. CIPCA and UNICEF.
Indigenous Households: Evidence from Mexico.” World Bank Policy Research Working Paper No. 3487, Washington, D.C.
Behrman, J., P. Sengupta and S. Parker. 2005. “Progressing through PROGRESA: An Impact Assessment o f a School Subsidy Experiment in Mexico.” Economic Development and Cultural Change (forthcoming).
Contreras, Manuel and Talavera, Maria Luisa (2004). Examen Parcial: La Reforma Educativa Boliviana 1992-2002. L a Paz. Fundacion PIEB.
Cunha, F., Heckman J., Lochner, L., and Masterov, D. (2005). Interpreting the Evidence on Life Cycle Skill Formation. NBER Working Paper No. 1 133 1.
D’Emilio Lucia. Voices and Processes Towards Pluralism: Indigenous Education in Bolivia (2001). New Education Division Documents no 9. SIDA. Stockholm.
Faguet, Jean-Paul. (2003). Decentralization and Local Government in Bolivia: An Overview from the Bottom Up. LSE: Crisis States Programme. Working Paper No. 29.
Fiske, E.B. (1 996). Decentralization of Education:Politics and Consensus. Washington DC: World Bank.
Greenwood, P.W., K.E. Model, C.P. Rydell and J.R. Chiesa. 1998. Diverting Children from a Life of Crime: Measuring Costs and Benefits. Santa Monica: RAND.
Hanushek, Eric. (1986). “The Economics o f Schooling: Production and Efficiency in Public Schools” in Journal of Economic Literature. 24(3).
Heckman, James and Carneiro, Pedro. (2003). Human Capital Policy. NBER Working Paper No. 9495.
Hornberger, Nancy. (2000). “Bilingual Education Policy and Practice in the Andes: Ideological Paradox and Intercultural Possibility” in Anthropology & Education Quarterly, Vol. 3 1 NO. 2, pp. 173-201.
INE. (2003) Bolivia: Caracteristicas Educativas y Cambios Entre I992 y 2001. L a Paz. October.
Kremer, Michael, Karthik Muralidharan, Nazmul Chaudhury, Jeffrey S. Hammer, and F. Halsey Rogers, “Teacher Absence in India: A Snapshot.” Journal of the European Economic Association 3:2-3, 2004Landa, Fernando and JimCnez, Wilson. (2004). Poblacidn Indigena y Pobreza, 1989-2002: Bolivia. Mimeo.
Journal of EducationalDevelopment, 18 (6), 435-452.
Development and Cultural Change, 53, 157-1 90.
McEwan, P. J. (1 998) “The effectiveness o f multigrade schools in Colombia” in International
McEwan, P. J. (2004). “The indigenous test score gap in Bolivia and Chile” in Economic

- 42 -
McEwan, Patrick and JimCnez, Wilson (2002). Indigenous Students in Bolivian Primary Schools.
McMeekin, R. (2003).” Network o f Schools.” Education Policy Analysis Archives 1 1 (1 6).
Ministerio de Educacion. (2002). “Bolivia’s preliminary proposal for EFA - FTI”. Mimeo.
Ministerio de Educacion. (2004). La Educacidn en Bolivia: Indicadores, cfras y resultados.
Mizala, Alejandra and Romaguera, Pilar. (2003). Regulacidn, incentivos y remuneraciones de 10s
Nina, O., Molina, O., Barrientos, P. and Aguilar, P. (2004). Andlisis de la Equidad en la
Nucinkis, Nicole (2004). “Situacidn de la Educacidn Intercultural Bilingiie en Bolivia ”..
Mimeo. World Bank.
profesores en Chile. Mimeo.
Asignacidn de Recursos Educativos en Bolivia. Mimeo.
Forthcoming in L. E. Lopez (ed.) La EIB bajo examen. Plural editores- PROEIB Andes - World Bank; L a Paz.
Patrinos, H.A. (2002). “Contracting out Education.” World Bank (Processed).
Psacharopoulos, G., Rojas, C. and Velez, E. (1 993). “Achievement evaluation o f Colombia’s Escuela Nueva: I s multigrade the answer?’’ Comparative Education Review, 37 (3), 263- 276.
Rojas, Rafael L (2004). La Transformacidn del Sistema Nacional de Formacidn Docente. Mimeo.
Sanjinez, K.M.A, Padrh, F., Ravenstien, D., Velasco, A. and Soares, S. (2005). Impact Evaluation of Intercultural Bilingual Education. Mimeo. World Bank.
Schultz, T.P. (2004). “School subsidies for the poor: evaluating the Mexican Progresa poverty program.”Journal of Development Economics 74( 1): 199-250.
Skoufias, E. and S. Parker. 2001, “Conditional Cash Transfers and their Impact on Child Work and School Enrollment: Evidence from the PROGRESA Program in Mexico.” Economia 2( 1): 45-96.
Talavera, Maria Luisa. (2004). Informe Sobre la Implementacidn de la Reforma en las Escuelas .
Trivelli, Carolina. (2004). Indigenous Poverty in Peru: An Empirical Analysis. Mimeo.
UNESCO. 2000. Latin American Laboratory for Assessment o f Quality in Education: First
Mimeo.
International Comparative Study o f Language, Mathematics, and Associated Factors for Students in the Third and Fourth Years o f Primary School. Second Report. Santiago: UNESCO.
Urquiola Miguel and Vegas, Emiliana. (2003). “An analysis o f teacher pay in Bolivia.” Mimeo.
Urquiola, M., Jimenez, W., Talavera, M. L., and Hernany, W. (2000). Los Maestros en Bolivia:
Urquiola, Miguel and Calderh, Valentina (2004). Apples and oranges: Educational enrollment
Impacto, incentivos y desempen‘o.
and attainment across countries in Latin America and the Caribbean. October, 2004. Mimeo. IDB.
Urquiola, Miguel and Hsieh, Chang-Tai. (2004). When schools compete, how do they compete? An assessment of Chile ’s nationwide school voucher program. Mimeo. Columbia University. November.
Urquiola, Miguel. Bolivia: iCobertura plena en primaria en un futuro prdximo? Mimeo.

-43 -
Van der Gaag, Jaques and Tan, Jee-Peng. (1 998). The Benefits o f Early Child Development
Vera, Miguel. (1 997). Bilingiiismo y Rendimiento Escolar en Bolivia. MA thesis. Georgetown
World Bank Bolivia Country Office. (2003). Bolivia Education Sector Briefing. Mimeo.
World Bank. (1 996). Colombia: Reforming the Decentralization Law: Incentives for an Effective
World Bank. (2003). Bolivia Public Expenditure Review. Mimeo.
World Bank. (2004). Impact Evaluation of Intercultural Bilingual Education. Mimeo.
World Bank. (2005). Mexico Determinants of Learning Policy Note. Report No. 3 1842-MX
Young, Mary Eming. (2002). Early Child Development: A Stepping Stone to Success in School
Programs: An Economic Analysis. Mimeo. World Bank.
University.
Delivery of Sewices. Mimeo.
and Lifelong Learning. Mimeo. World Bank.

- 44 -
I
ANNEX A.1: ACCESS AND ATTAINMENT
90 -
Y 2
8 0 - - E" - g 15 70 -
The four panels in Figure A. 1.1 show a phase diagram constructed wi th comparable DHS Household Survey data for the four Latin American countries with available series data (Bolivia, Peru, Colombia, and Guatemala). The objective i s to include information on enrollment and attainment and to show both a time trend and comparisons with other countries.
The percentage o f the age group enrolled in school i s on the vertical axis. The first panel shows 6-10 year-olds, the second shows 11-15 year-olds, the third shows 16-20 year-olds, and the last shows 21 -24 year-olds. These correspond approximately to children who should be in initial and lower primary, upper primary, secondary, and higher education respectively. The percentage o f the age group that has attained at least some primary (panels 1 and 2), some secondary (panel 3), or some higher education (panel 4) i s on the horizontal axis. Countries with low access (such as Guatemala) w i l l be in the lower left hand comer, those with high access but inefficient f low w i l l be in the lower right hand comer, and those with both good access and good flow w i l l be in the upper right hand comer. The upper left hand comer is, in principle, impossible. The phase diagram shows progression over time.
1990 Tooo -0- Bolivia u Colombia + Peru -a-Guatemala
Figure A.l . l - Access and Attainment by Age Group
100 1
50 4 50 60 70 80 90 100
% of Group at Least Rimary
Panel 1 - Initial and Lower Primary
c
-Q- Bolivia -a- Colombia
(I)
=E 9 0 -
15 e c
8 9 5 0) z
+Peru -a- Guatemala
80 4 50 60 70 80 90 100
% of Group at Least Rimary
Panel 2 - Upper Primary
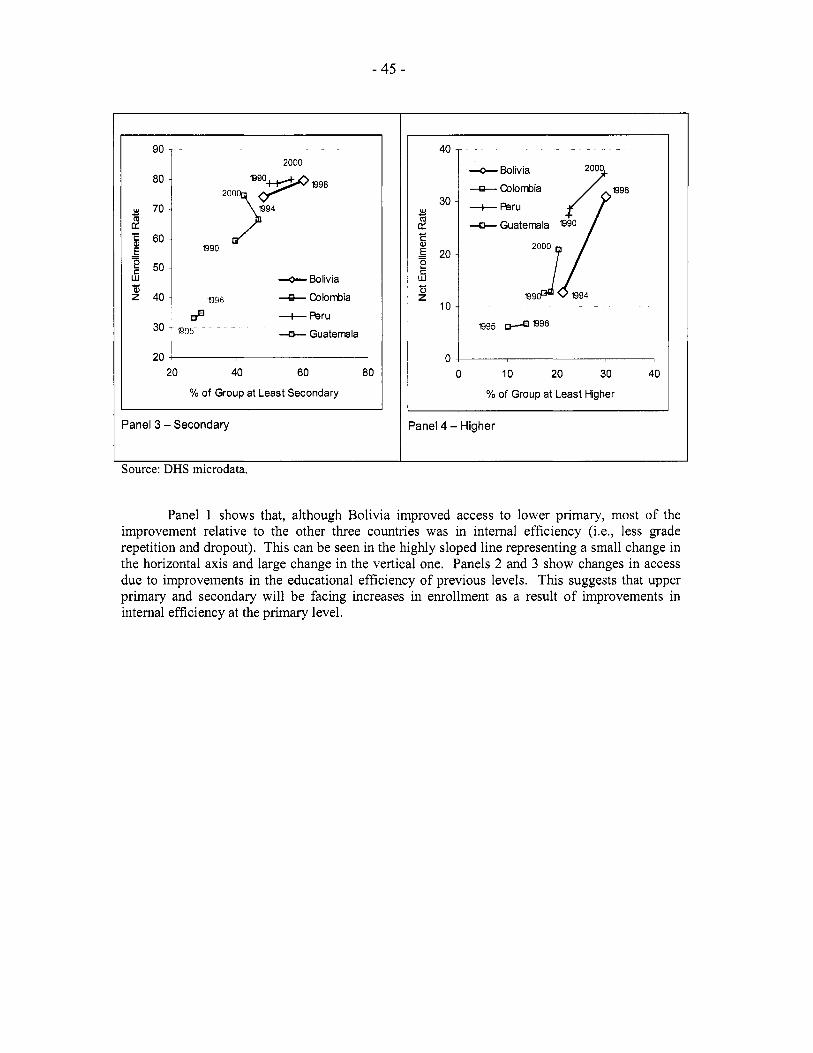
- 45 -
0 10 20 30 40
% of Group at Least Higher
I
Panel 4 - Higher
90
80
w 70 * 2 - 2 E 60
50
5 Z 40
30
20
- W
2000
2 0 j y
890
+Bolivia R08 -a- Colombia
00 +Peru D X -o- Guatemala
20 40 60 80
YO of Group at Least Secondary
Panel 3 - Secondary
40
30 3 2 E - 20
5
C Q)
P 4- a3 z
10
0
2000 3 +Bolivia
1995 # 8 9 8
Source: DHS microdata.
Panel 1 shows that, although Bol iv ia improved access to lower primary, most o f the improvement relative to the other three countries was in internal efficiency (Le., less grade repetition and dropout). This can be seen in the highly sloped l ine representing a small change in the horizontal axis and large change in the vertical one. Panels 2 and 3 show changes in access due to improvements in the educational efficiency o f previous levels. This suggests that upper primary and secondary w i l l be facing increases in enrollment as a result o f improvements in internal efficiency at the primary level.

- 46 -
ANNEX A.2: SCHOOL ENROLLMENT BY AGE, BY INCOME, BY ETHNICITY AND BY GENDER
The 1998 DHS reveals that the enrollment rate for 7-1 1 year-olds i s 95 percent. However, f rom age 12 onwards, enrollment plummets and the differences in enrollment rates among different groups grow larger.
Figure A.2.1- School Enrollment by Age
Panel 1 - Urban / Rural 100%
80%
s 3 j
5 E
60% c .- c
2 40%
20%
0 % 5
-6- Rural -All
15 Age
10 20
Panel 3 - By Ethnicity 100%
80%
- 0 0
60% 8 c c W
.- 4-
g 40% a
20%
0 Yo
+ Quechua
& Aymara - - Castellano
15 20 lo Age 5
Source: 2002 MECOVI.
Panel 2 - By Income Quintile 100%
80% ' 60% ~
5 c .- c
$ 40% a
20%
0 %
-i- Quintile 1 -D- Quintile 3 - Quintile 5
5 10 15 20 Age
Panel 4 - By Gender 100%
80%
- 0 0
60% $ c
e,
a
.- c
40%
20% -+- Female
- Male
0% 15 20 lo Age 5
At age 16, the difference in enrollment rates i s 27 percentage points between urban and rural youth, 26 percentage points between the richest and poorest quintile, and 17 between

- 47 -
Quechua and Spanish speaking youth. The gender gap i s smaller than the urbadrural, income, and indigenoushon-indigenous gaps. After age 12, boys have higher enrollment rates o f up to 6 percentage points but girls have a higher enrollment rate at age 16. It i s important to note the differences between indigenous groups. Aymara youth appear to do much better than Quechua speakers. This reveals that rural, l o w income, and Quechua are strongly associated wi th higher dropout rates, while urban, high income, Spanish, and non-rural Aymara students are associated with lower dropout rates.
The above graphs show the results according to various demographic groups, but do not show the specific effect on enrollment o f belonging to one group. For example, native Quechua speakers tend to be overwhelmingly more rural than Castellano speakers, which means that it i s impossible to tell if the factor keeping them out o f school i s their rural location or their native tongue. A multivariate analysis in Table A.2.1 shows the effects o n enrollment when changing only one student background cha rac te r i~ t i c .~~ The table also shows the change in enrollment probabilities f rom being a modal (male, Spanish speaking, urban inhabitant o f the altiplano who does not work and whose mother does not work) student to one different in only one dimension.
’’ The numbers were calculated as follows: a probit was estimated on children from 7 to 14 to estimate coefficients showing the impact o f each variable on enrollment. The estimated coefficients were then used to construct the probabilities of enrollment for the modal student (male, Spanish speaking, urban inhabitant of the altiplano who does not work and whose mother does not work).

- 48 -
1999 I 2000 I 2001 I 2002 Language
Table A.2.1- Changes in Enrolment Probabilities by Variables
Spanish Base
Native Aymara Speaker 0.4% 0.3% 0.6% 1.4% Gender Male Base
Location
Native Quechua Speaker -0.2% -1.3% -0.4% 0.4%
Female -0.4% -0.4% -0.4% -0.9%
Base Altiplano
Val le -0.7% -2.8% -1.3% -2.2% Llano -0.6% -5.4% -2.3% -5.3% Family Background
Father's Schooling (yr) Mother's Schooling (yr)
0.2% 0.7% 0.4% 0.5% 0.1% 0.3% 0.2% 0.5%
Child works Rural Interactions
IMother works I 0.2%1 1.6%1 0.4%1 1.0%1 -2.6% -15.0% -3.1% -9.4%
Urban Rural
Base -3.4%I -0.9YoI -2.5%I -2.9%
Rural Woman Interaction Rural Quechua Interaction 1Rural Aymara Interaction I -8.1%1 -3.3%1 -1.8%1 -13.0%1
Source: MECOVI surveys.
-2.7% -5.1% -4.1% -2.3% -0.5% -0.2% -0.5% 0.6%
The results show that rural location, particularly when combined with non-Spanish language, i s a strong negative determinant o f enrollment. Higher parental education level has a strong positive effect o n enrollment and chi ld labor has a strong detrimental effect, although it i s worth noting that chi ld labor may be jo in t ly determined with school enrollment making the relationship between the two more complex than what a simple probit estimation can reveal. The negative impact o f rural location and indigenous native language i s quite clear, though.

- 49 -
ANNEX A.3: FISCAL IMPACT OF IMPROVING TEACHER ALLOCATION
The objective o f this annex i s to show that better allocation o f teachers can allow for financially sustainable investments in education. The W o r l d Bank and the Ministry o f Education have advanced in the creation o f a Dynamical Mode l for teacher wages and their fiscal impacts. The software used for modeling i s called iThink and simulates a large number o f relations entered in this program. The teacher simulation model i s quite complex and what follows merely scratches the surface o f modeling possibilities.
The issue to be investigated i s the fiscal impact o f different policies for teacher hiring and remuneration. The results are a l l shown in terms o f percentage o f GDP that the primary teacher wage bill requires. Figure A.3.1 shows f ive scenarios out o f an almost countless number o f possibilities. The base scenario supposes a geometric growth rate o f the real haber bcisico o f 2 percent, which i s close to but slightly less than the historical average for the last 10 yearsz6, a conservative growth rate for real GDP o f 1 percent, which i s close to but slightly more than the average since the 2000 crisis, and also that the number o f teachers remains the same-i.e., that the Ministry merely hires new ones to fill up the openings lef t by teachers retiring or moving to new professions. This i s indicated by the caption Base Case (2, I, replace) in the graph. For this scenario to be real, o f course, either teacher allocation must improve or children wil l be left without teachers.
3'0y0 1 2.8%
2.6%
2.4%
2.2%
2.0% 2000 2005 2010 2015
Figure A.3.1 Teacher Pay / GDP
-e- Base Case (2,l ,replace)
--P Case 2 (2,l,keep)
-e- Case 3 (5 , l~ep lace)
-Case 4 (O,l,keep)
+Case 5 (5,5,replace)
Source: I Think simulations.
The base scenario shows that the pressure o f the teacher wage bill o n GDP i s not explosive and wil l even fal l f rom 2.25 percent currently to 2.03 percent by 2014. Average teaching wages wil l rise by 22.7 percent over the next decade, which i s slightly less than the 25 percent increase over the previous one. This option, o f course, presupposes that teacher allocation can be rationalized to allow the teacher student ratio to rise without losing coverage. I t i s important to state that this i s a complete simulation, which takes into consideration retirement,
26 The rest o f the escalafdn grows linearly with the haber b6sico.

- 50 -
abandonment, promotion through the escalafdn, and demographics. I t does not, however, include geographic analysis and does not take into account how teacher allocation wi l l improve.
In particular, situations in which the student-teacher ratio i s kept constant were simulated. Case 2 i s identical to the Base Case except that the student-teacher ratio i s kept constant and the graph shows that the situation i s explosive. The wage bill wi l l go to 2.85 percent o f GDP and average teaching wages wi l l increase only 16.5 percent. Only Case 3, in which the haber basico grows by a phenomenal 5 percent per year and retiring teachers are replaced, i s worse for public finances, with average teaching wages growing by 70.1 percent over 10 years and the wage bill going to 3 percent o f GDP. Case 4 shows how tough salary negotiations would have to be in order to make the wage bill fa l l while keeping the student teacher ratio constant-no increases at a l l in the haber bhsico would be possible if GDP grew at 1 percent per year.
Case 5 serves to show the potential o f high growth rates in GDP. If GDP grows at 5 percent-good but not stellar and only slightly above the average for the high growth years o f the late 1990s-then the haber bhsico could grow at 5 percent as wel l and teachers would be making 70 percent more 10 years f rom now at no additional fiscal impact o n public finances.
The most important conclusion o f the simulation exercises i s that the number o f teachers and not really their salary (wi th in reasonable parameters) i s the fundamental variable in determining the wage bill in the medium to long run. Constant wage increases are possible if carried out with a policy o f optimizing teacher allocation. Equally, some wage increases, particularly targeted wage increases, can be combined with policies for keeping children and youth-at-risk f rom dropping out, improvement o f quality, and expansion o f secondary schooling.
In addition to the base case, various other scenarios were explored.
