imf country report no. 15/36 islamic republic of ... country report no. 15/36 islamic republic of...
TRANSCRIPT
© 2015 International Monetary Fund
IMF Country Report No. 15/36
ISLAMIC REPUBLIC OF MAURITANIA SELECTED ISSUES PAPER
This Selected Issues Paper on the Islamic Republic of Mauritania was prepared by a staff team of the International Monetary Fund as background documentation for the periodic consultation with the member country. It is based on the information available at the time it was completed on January 14, 2015.
Copies of this report are available to the public from
International Monetary Fund Publication Services
PO Box 92780 Washington, D.C. 20090 Telephone: (202) 623-7430 Fax: (202) 623-7201
E-mail: [email protected] Web: http://www.imf.org Price: $18.00 per printed copy
International Monetary Fund
Washington, D.C.
February 2015
ISLAMIC REPUBLIC OF MAURITANIA
SELECTED ISSUES
Approved By Middle East and
Central Asia
Department
Prepared by Tarak Jardak, Aminata Touré, Rafik Selim (all
MCD), Oana Elena Luca (FAD), Grace B. Li (RES), and
Frantisek Ricka (SPR)
MANAGING RESOURCE WEALTH IN MAURITANIA: CONSIDERATIONS FOR A
FISCAL FRAMEWORK____________________________________________________________________ 4
A. Context ________________________________________________________________________________ 4
B. Mauritania’s Resource Wealth __________________________________________________________ 5
C. Considerations for Strengthening the Fiscal Framework _______________________________ 7
D. Illustrative Simulations for Mauritania ________________________________________________ 10
E. Strengthening Institutions _____________________________________________________________ 16
F. Conclusions ___________________________________________________________________________ 17
References _______________________________________________________________________________ 18
BOXES
1. Sustainability Analysis: Underlying Assumptions ______________________________________ 12
2. Volatility Analysis: Price Smoothing ___________________________________________________ 14
FIGURES
1. Resource Revenue Projections _________________________________________________________ 7
2. Sustainability Assessment Indicators __________________________________________________ 13
3. Managing Volatility Indicators ________________________________________________________ 15
TABLES
1. Main Mining Projects by Operational Status ___________________________________________ 5
2. Guiding Matrix for Fiscal Frameworks: Objectives and Fiscal Anchors __________________ 9
CONTENTS
January xx, 2015
January 14, 2015

ISLAMIC REPUBLIC OF MAURITANIA
2 INTERNATIONAL MONETARY FUND
GROWTH, EMPLOYMENT, AND SOCIO-DEMOGRAPHIC CHALLENGES IN
MAURITANIA ___________________________________________________________________________19
A. Introduction __________________________________________________________________________ 19
B. Growth Determinants in Mauritania: Sectoral and Factor Analysis_____________________ 20
C. Labor Market Dynamics, Socio-Demographic Issues, and Challenges Ahead __________ 24
D. Lessons from Other Countries’ Experiences and Recommendations __________________ 30
E. Conclusion ____________________________________________________________________________ 37
References _______________________________________________________________________________ 38
BOXES
1. Growth Accounting Exercise: Methodology and Data _________________________________ 23
2. Major Actions to Reduce the Gender Gap in Mauritania ______________________________ 26
STRUCTURAL REFORMS AND ECONOMIC DIVERSIFICATION FOR MORE
INCLUSIVE GROWTH IN MAURITANIA ________________________________________________40
A. Introduction __________________________________________________________________________ 40
B. Structural Reforms and Diversification for Enhancing Growth and Inclusiveness ______ 41
C. Structural Reforms to Boost Productivity ______________________________________________ 42
D. Diversification to Sustain Long-Run Growth __________________________________________ 51
E. Conclusion and Recommendations ___________________________________________________ 54
References _______________________________________________________________________________ 57
FIGURES
1. Selected Countries Relative GDP ______________________________________________________ 43
2. Mauritania TFP Growth, 1981-2011 ___________________________________________________ 43
3. Mauritania and Selected Comparators: TFP Growth, 1980-2011 _______________________ 43
4. Banking Sector Reforms. ______________________________________________________________ 44
5. Capital Market Developments _________________________________________________________ 45
6. Investors ‘Freedom ____________________________________________________________________ 45
7. Trade and FDI Liberalization___________________________________________________________ 46
8a. Trade Barriers ________________________________________________________________________ 46
8b. Regulatory Trade Barriers ____________________________________________________________ 46
9. Legal and Property Rights _____________________________________________________________ 47
10. Institutions ___________________________________________________________________________ 48
11. Business and Labor Market Regulations _____________________________________________ 48
12. Business Environment in International Perspective ___________________________________ 49
13. The Most Problematic Factors for Doing Business ___________________________________ 49
14. Stages of Development ______________________________________________________________ 50
15a. Infrastructure Quality Index _________________________________________________________ 51

ISLAMIC REPUBLIC OF MAURITANIA
INTERNATIONAL MONETARY FUND 3
15b. Public Investment Efficiency ________________________________________________________ 51
16. Mauritania and Selected Resource-Rich Comparators: Export Composition __________ 52
17. Mauritania and Selected Resource-Rich comparators: Export Quality ________________ 52
18. Mauritania and Selected Resource-Rich Comparators: Sectoral Composition of Real
GDP _____________________________________________________________________________________ 53
19. Mauritania and Selected Comparators: Value Added by Economic Activity __________ 53
ANNEX
The Model _______________________________________________________________________________ 55
PUBLIC INVESTMENT, NATURAL RESOURCE AND DEBT SUSTAINABILITY __________58
A. Introduction __________________________________________________________________________ 58
B. Model Description ____________________________________________________________________ 59
C. Investment and Revenue Scenarios ___________________________________________________ 61
D. Results ________________________________________________________________________________ 62
E. Conclusions and Policy Implications ___________________________________________________ 64
References _______________________________________________________________________________ 67
FIGURES
1. Public Investment Management Index (PIMI) _________________________________________ 59
2. Iron Ore Projections, 2014–29 _________________________________________________________ 62
3. Mauritania: Model Simulations, 2014-29 ______________________________________________ 64
ANNEX
Key Model Equations ____________________________________________________________________ 66

ISLAMIC REPUBLIC OF MAURITANIA
4 INTERNATIONAL MONETARY FUND
MANAGING RESOURCE WEALTH IN MAURITANIA:
CONSIDERATIONS FOR A FISCAL FRAMEWORK1
Mauritania, a multi-metallic commodity exporter, faces important medium-term fiscal policy
challenges arising from volatile resource revenues and prospects for a significant mining expansion.
Like other commodity exporters, Mauritania needs to avoid pro-cyclical fiscal policies and adopt rules
that guide medium-term fiscal sustainability. The analysis of fiscal framework options reveals that a
fiscal rule which targets a non-resource primary balance for long-term sustainability, designed to
allow some frontloading of public spending on productive investment, would be appropriate for
Mauritania under the assumption of a finite resource horizon. A fiscal rule targeting a structural
resource balance would be appropriate in the scenario of long-lasting resources, possible under the
assumption of favorable developments in the global commodity markets.
A. Context
1. Mauritania is a country rich in natural resources. Minerals currently make up more than
75 percent of total exports and contributed 11 percent of non-extractive GDP in 2013. Their
contribution is expected to increase if more mining projects come on stream as planned in the next
few years. At the same time, declining prices in the global commodity markets, with iron ore being
the worst performing commodity in 2014, could have important implications for export earnings and
government revenues in the short term. Whether the recent term-of-trade shock is temporary or
sustained, natural resource management will pose significant challenges and require a well-adapted
macro-fiscal framework.
2. Fiscal policy has been responsible and focused on fiscal consolidation, but important
challenges lie ahead linked to price volatility, exhaustibility of resources, and effective use of
resources. Although fiscal and external buffers were built up in the context of elevated commodity
prices during 2011-13 and could help to smooth a temporary fall in prices, the economy is still
vulnerable to terms-of-trade shocks. Moreover, prospects for significant mining expansion remain
high should a rebound in commodity prices materialize. Reinforcing the fiscal framework is now
urgent to support continued responsible fiscal policy while enhancing policy predictability, and
improve governance in managing mining wealth. This paper analyzes several fiscal framework
alternatives for Mauritania by drawing on recent analytical work on the management of resource
wealth in resource-rich developing countries (IMF 2012b).
1 Prepared by Oana Elena Luca.
ISLAMIC REPUBLIC OF MAURITANIA
INTERNATIONAL MONETARY FUND 5
B. Mauritania’s Resource Wealth
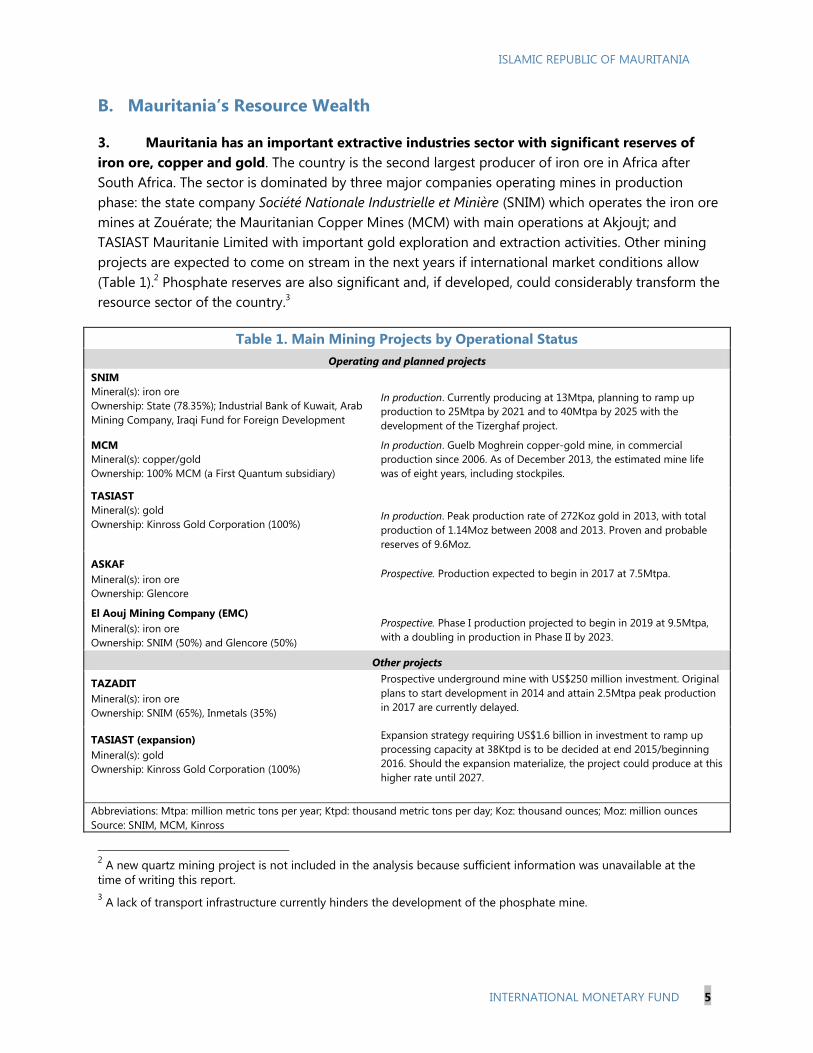
3. Mauritania has an important extractive industries sector with significant reserves of
iron ore, copper and gold. The country is the second largest producer of iron ore in Africa after
South Africa. The sector is dominated by three major companies operating mines in production
phase: the state company Société Nationale Industrielle et Minière (SNIM) which operates the iron ore
mines at Zouérate; the Mauritanian Copper Mines (MCM) with main operations at Akjoujt; and
TASIAST Mauritanie Limited with important gold exploration and extraction activities. Other mining
projects are expected to come on stream in the next years if international market conditions allow
(Table 1).2 Phosphate reserves are also significant and, if developed, could considerably transform the
resource sector of the country.3
Table 1. Main Mining Projects by Operational Status
Operating and planned projects
SNIM
Mineral(s): iron ore
Ownership: State (78.35%); Industrial Bank of Kuwait, Arab
Mining Company, Iraqi Fund for Foreign Development
In production. Currently producing at 13Mtpa, planning to ramp up
production to 25Mtpa by 2021 and to 40Mtpa by 2025 with the
development of the Tizerghaf project.
MCM
Mineral(s): copper/gold
Ownership: 100% MCM (a First Quantum subsidiary)
In production. Guelb Moghrein copper-gold mine, in commercial
production since 2006. As of December 2013, the estimated mine life
was of eight years, including stockpiles.
TASIAST
Mineral(s): gold
Ownership: Kinross Gold Corporation (100%)
In production. Peak production rate of 272Koz gold in 2013, with total
production of 1.14Moz between 2008 and 2013. Proven and probable
reserves of 9.6Moz.
ASKAF
Mineral(s): iron ore
Ownership: Glencore
Prospective. Production expected to begin in 2017 at 7.5Mtpa.
El Aouj Mining Company (EMC)
Mineral(s): iron ore
Ownership: SNIM (50%) and Glencore (50%)
Prospective. Phase I production projected to begin in 2019 at 9.5Mtpa,
with a doubling in production in Phase II by 2023.
Other projects
TAZADIT
Mineral(s): iron ore
Ownership: SNIM (65%), Inmetals (35%)
Prospective underground mine with US$250 million investment. Original
plans to start development in 2014 and attain 2.5Mtpa peak production
in 2017 are currently delayed.
TASIAST (expansion)
Mineral(s): gold
Ownership: Kinross Gold Corporation (100%)
Expansion strategy requiring US$1.6 billion in investment to ramp up
processing capacity at 38Ktpd is to be decided at end 2015/beginning
2016. Should the expansion materialize, the project could produce at this
higher rate until 2027.
Abbreviations: Mtpa: million metric tons per year; Ktpd: thousand metric tons per day; Koz: thousand ounces; Moz: million ounces
Source: SNIM, MCM, Kinross
2 A new quartz mining project is not included in the analysis because sufficient information was unavailable at the
time of writing this report.
3 A lack of transport infrastructure currently hinders the development of the phosphate mine.

ISLAMIC REPUBLIC OF MAURITANIA
6 INTERNATIONAL MONETARY FUND
4. Production of minerals is set to expand in the medium to long term. Investment in the
sector has been growing at a remarkable rate and is projected to keep the growth of extractive GDP
at 11 percent per year, on average, during 2015-20. The production of iron ore alone is expected,
relative to 2013 levels, to more than double in the next five years and increase by five times in the
next 10 years if mining expansion plans materialize. SNIM has announced plans to ramp up
production to 25 million metric tons per year (Mtpa) by 2021 and to 30Mtpa by 2025. The El Aouj
mine, a joint venture between SNIM and Glencore, is further expected to bring capacity of 9Mtpa on
stream by 2019, and could double it by 2023. Production from the Glencore-operated Askaf project,
planned to commence by early 2017, could contribute additional 7.5Mtpa of iron ore.
5. Oil and gas exploration investments could contribute to identifying additional
resource reserves. Promising commercial discoveries in 2001 at the Chinguetti oil field have been
consistently revised downwards, and Mauritania is producing nowadays less than 5,000 barrels per
day (Mbpd), well below original projections of 60Mbpd. Nevertheless, Mauritania’s largely
unexplored land and sea terrain is deemed to have considerable potential, and in recent years the
government has granted oil exploration contracts. Frontier explorers like Premier Oil, Kosmos
Energy, Chariot Oil and Gas, and Tullow Oil are actively engaged in oil exploration offshore.
Prospects for natural gas exploitation could also be significant, as indicated by the 2012 commercial
discovery made in the Chinguetti field by Tullow Oil. If the development of the Banda Gas project in
the Chinguetti field goes ahead, it could produce up to BTU60 billion per day over 20 years (World
Bank, 2014).
6. The contribution of natural resources to government revenue is significantly smaller
than their share in exports. Receipts from minerals and petroleum contribute 26 percent to
Mauritania’s budget, and are expected to decline in the medium term. This is partly the effect of a
mining fiscal regime that has been designed to create an attractive environment for investment
(Rota-Graziosi 2014). Existing mines operate under generous fiscal concessions, and new projects
coming on stream under the 2012 Mining Code will generate corporate income tax only after initial
investments are recovered and a three-year allowable tax holiday is exhausted.4
7. Mauritania’s resource horizon is uncertain and two scenarios can be used to estimate
the size of future resource revenues. Under the baseline scenario, which is consistent with the
assumptions in the staff report that all currently planned mining projects (Table 1) come to
execution, mining revenue will be large in nominal terms, even though they will decline as a share of
4 The Mining Code of 1999, under which most existing companies acquired their licenses, established a royalty
payment of 1.5 percent on the sales value of iron ore and 3 percent on gold and copper; 30 percent corporate
income tax after a three-year tax holiday; and 16 percent withholding on dividends. Revisions made in 2008,
increasing the iron ore royalty to 2 percent while reducing the income tax rate to 25 percent and the withholding on
dividends to 10 percent, were preserved in the new Mining Code of 2012. The latter introduced progressive royalty
rates linked to prices, and implemented a 10 percent unpaid state participation. In practice, however, mining
companies currently operate on the basis of negotiated terms with important variations from the applicable general
legislation.
ISLAMIC REPUBLIC OF MAURITANIA
INTERNATIONAL MONETARY FUND 7
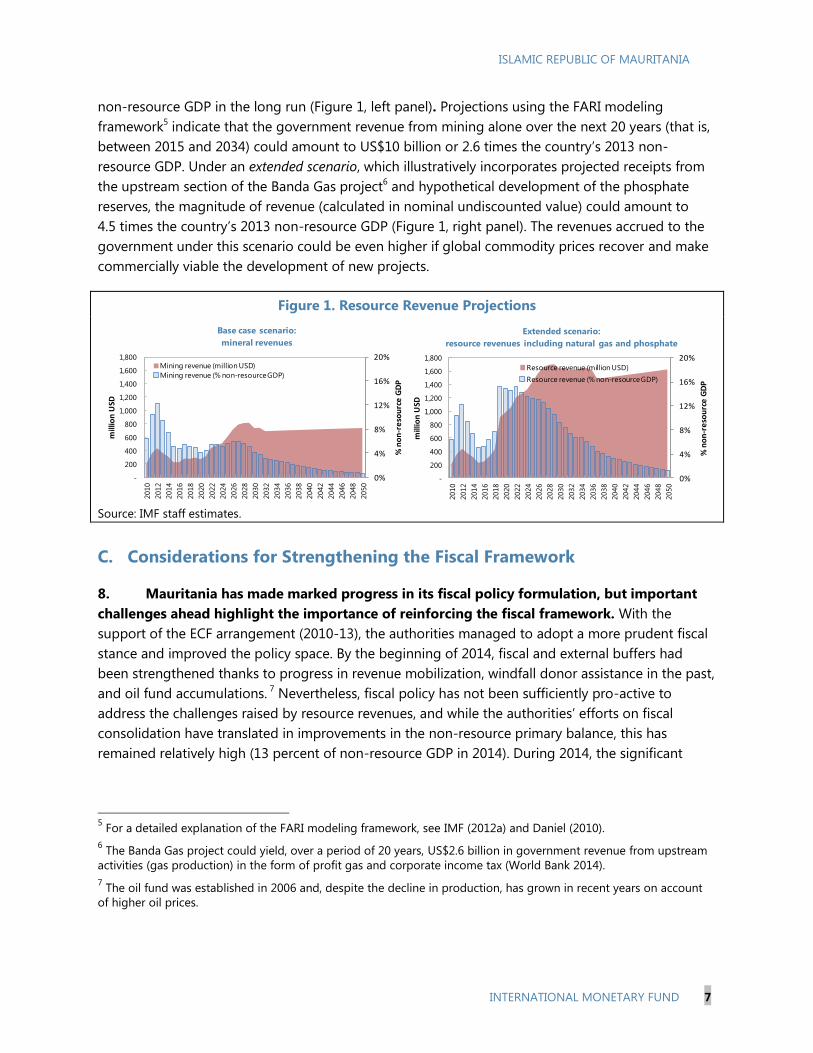
non-resource GDP in the long run (Figure 1, left panel). Projections using the FARI modeling
framework5 indicate that the government revenue from mining alone over the next 20 years (that is,
between 2015 and 2034) could amount to US$10 billion or 2.6 times the country’s 2013 non-
resource GDP. Under an extended scenario, which illustratively incorporates projected receipts from
the upstream section of the Banda Gas project6 and hypothetical development of the phosphate
reserves, the magnitude of revenue (calculated in nominal undiscounted value) could amount to
4.5 times the country’s 2013 non-resource GDP (Figure 1, right panel). The revenues accrued to the
government under this scenario could be even higher if global commodity prices recover and make
commercially viable the development of new projects.
Figure 1. Resource Revenue Projections
Source: IMF staff estimates.
C. Considerations for Strengthening the Fiscal Framework
8. Mauritania has made marked progress in its fiscal policy formulation, but important
challenges ahead highlight the importance of reinforcing the fiscal framework. With the
support of the ECF arrangement (2010-13), the authorities managed to adopt a more prudent fiscal
stance and improved the policy space. By the beginning of 2014, fiscal and external buffers had
been strengthened thanks to progress in revenue mobilization, windfall donor assistance in the past,
and oil fund accumulations. 7 Nevertheless, fiscal policy has not been sufficiently pro-active to
address the challenges raised by resource revenues, and while the authorities’ efforts on fiscal
consolidation have translated in improvements in the non-resource primary balance, this has
remained relatively high (13 percent of non-resource GDP in 2014). During 2014, the significant
5 For a detailed explanation of the FARI modeling framework, see IMF (2012a) and Daniel (2010).
6 The Banda Gas project could yield, over a period of 20 years, US$2.6 billion in government revenue from upstream
activities (gas production) in the form of profit gas and corporate income tax (World Bank 2014).
7 The oil fund was established in 2006 and, despite the decline in production, has grown in recent years on account
of higher oil prices.
0%
4%
8%
12%
16%
20%
-
200
400
600
800
1,000
1,200
1,400
1,600
1,800
2010
2012
2014
20
16
20
18
20
20
20
22
20
24
20
26
20
28
20
30
20
32
20
34
20
36
20
38
20
40
20
42
20
44
20
46
20
48
20
50
% n
on
-re
sou
rce
GD
P
mill
ion
USD
Extended scenario:
resource revenues including natural gas and phosphate
Resource revenue (million USD)
Resource revenue (% non-resource GDP)
0%
4%
8%
12%
16%
20%
-
200
400
600
800
1,000
1,200
1,400
1,600
1,800
2010
2012
2014
2016
2018
2020
2022
2024
2026
2028
2030
2032
2034
2036
2038
2040
2042
2044
2046
2048
2050
% n
on
-re
sou
rce
GD
P
mill
ion
USD
Base case scenario:
mineral revenues
Mining revenue (million USD)
Mining revenue (% non-resource GDP)

ISLAMIC REPUBLIC OF MAURITANIA
8 INTERNATIONAL MONETARY FUND
terms-of-trade shock has weakened fiscal buffers and external debt has maintained an upward trend
reaching an elevated 73½ percent of GDP.
9. Mauritania’s fiscal framework must address complex fiscal policy objectives. As in any
other country, a first objective is to ensure long-run fiscal sustainability, that is, the government must
be able to sustain spending, tax, and other fiscal policies in the long term without risking to default
on liabilities or expenditure commitments. In resource-rich countries, this requires including
resource revenues in the inter-temporal budget constraint. A second objective of the fiscal
framework for Mauritania, as for other resource-rich countries, is to manage resource revenue
uncertainty and volatility. Although the focus is usually on prices, production volumes and costs are
also uncertain and can lead to volatility. If revenue volatility is high and persistent, precautionary
financial savings should be built to smooth revenues and expenditures.8 A third objective for the
fiscal framework is debt management. Natural resource wealth may increase the capacity to borrow
as it increases the capacity to service debt. This needs to be managed wisely and integrated into a
comprehensive debt management strategy. Borrowing against future revenue, sometimes even
before production commences, reduces fiscal flexibility later and may lower the creditworthiness of
the country. Fourth, especially in countries with limited resource reserve horizons, issues of
exhaustibility and intergenerational equity considerations also need to be addressed by the fiscal
framework. As well, strengthening fiscal policy predictability and institutions is a critical objective of
the fiscal framework.
10. With these multiple objectives, the appropriate fiscal anchor depends on whether the
resource revenue is temporary or long-lasting, and whether the economy is scarce or
abundant in capital. Two elements are critical for determining the length of the resource horizon.
First, mineral assets in the ground cannot be transformed into needed financial and physical assets
above the ground if commodity prices are not high enough to make the development of the
resource commercially viable (i.e. by meeting the investors’ breakeven price). Thus, while a country
may have significant mineral reserves potential, only commercially exploitable reserves can be
included in the accounting of the resource wealth. Second, the weight of resources in total
government revenue is important. The structure of the fiscal regime for extractive industries
determines when and how much resource revenue flows into the budget. A long resource horizon
implies that the contribution of resources to the budget is significant and can be sustained over a
long period of time.9 Table 2 provides examples of this taxonomy for several resource-rich countries,
by drawing on recent analytical work at the IMF (2012b).
8 Fiscal savings would be accumulated when prices are high, and drawn on them to meet budget expenditure
(according to a pre-determined fiscal rule) when prices are low.
9 Government revenues from extractive industries vary significantly across countries (IMF 2012b). A rule of thumb for
determining whether their contribution is significant and sustained could be, in the case of mining producers, if
resource revenues represent more than 15-20 percent of total budget revenues over a period of 30 years or more.

ISLAMIC REPUBLIC OF MAURITANIA
INTERNATIONAL MONETARY FUND 9
11. When the resource horizon is short, issues of resource exhaustibility become critical
for the fiscal framework. For Mauritania, in the baseline scenario resource revenues are projected
to average 5 percent of non-resource GDP over the next decade and then gradually decline as the
process of economic diversification takes place. This relatively low and declining contribution of
resource revenue can be regarded as a scenario in which the resource horizon is short (less than
30 years), and government consumption must be smoothed over time to address issues of
sustainability and intergenerational equity. In this case, fiscal policy is recommended to be anchored
to a non-resource primary balance rule, where the non-resource primary deficit is set in line with a
long-run sustainability benchmark that takes into account the finiteness of the resource wealth.
Table 2. Guiding Matrix for Fiscal Frameworks: Objectives and Fiscal Anchors
Source: IMF (2012).
12. When resource flows are long-lasting, the focus of the fiscal framework should be on
managing price uncertainty and investment in growth-supporting projects in the short to
medium term. In the upside scenario of expanded production, resource revenues in Mauritania
could become large, averaging 11 percent of non-resource GDP over the next decade and sustained
over a long period of time , increasing the budget’s exposure to volatility from global commodity
markets. At the same time, the fiscal space could increase markedly. Addressing absorptive capacity
constraints and mitigating risks associated with diversion of resources to non-productive
expenditure should become priority objectives of the fiscal policy. In this scenario, fiscal policy is
recommended to be anchored to a primary structural balance rule, where the resource component
of budget revenue is calculated on the basis of cyclically-adjusted (“structural”) prices rather than
actual commodity prices.
13. A solid fiscal framework must be accompanied by fiscal institutions that support and
reinforce the budget’s role as the main instrument to conduct fiscal policy. This requires
Country-specificDecision Matrix
Resource Revenue
Long-lasting (>30 years) Short-term (<30 years)
Objectives Examples Objectives Examples
Capital Scarcity
(Infrastructuregaps;
development needs)
High Macroeconomic stabilityManaging volatilityDevelopment
NigeriaIraqPeruMongolia
Macroeconomic stabilitySustainability/exhaustibilityDevelopment
BoliviaGhana
Rule: Flexible structural balance perhaps with front-loaded investment
Rule: Flexible PIH-based non-resource primarybalance with front-loaded investment
Low Macroeconomic stabilityManaging volatility
Saudi ArabiaKuwaitQatarChile
Macroeconomic stabilitySustainability/exhaustibility
UKNetherlandsNorway
Rule: Structural balance perhaps with expenditure growth cap
Rule: PIH-based non-resource primary balance

ISLAMIC REPUBLIC OF MAURITANIA
10 INTERNATIONAL MONETARY FUND
strengthening public financial management systems by developing a credible medium-term
framework for budget formulation, improving the public investment process, and enhancing fiscal
transparency. The authorities’ efforts on this front in the last years go in the right direction and
could be accelerated once investment capacity is increased. The possible use of resource funds
(primarily for smoothing purposes but also taking into account intergenerational equity
considerations, and designed to mirror the fiscal rule) should reinforce the fiscal policy framework,
and not be implemented as a separate policy tool. The resource revenue flows and the resource
funds should be integrated in the budget process and the public financial management framework,
with no parallel spending program.
D. Illustrative Simulations for Mauritania
14. In this section, simulations help assess fiscal policy paths under different resource
horizons, investment plans, and external environment assumptions in Mauritania. Mauritania is
a capital-scarce country with an uncertain resource horizon. Using the IMF toolkit for designing
fiscal rules in resource-rich developing countries (IMF 2012b), it is possible to test both
intergenerational equity models (which are appropriate for short resource horizons and link fiscal
sustainability benchmarks to variants of the permanent income hypothesis approach) and price-
based rule models (which focus on long resource horizons and aim at smoothing resource revenue
volatility).
Sustainability analysis
15. A key fiscal indicator for analyzing the fiscal stance in resource-rich developing
countries with short resources horizon is the non-resource primary balance (NRPB). This
indicator, calculated as non-resource revenues less primary expenditure,10
identifies the impact of
government operations on domestic demand in isolation from resource revenues. The level of the
NRPB can be used as benchmark for a sustainable level of spending that takes into account the
future resource revenue. Three frameworks that link the sustainable level of spending to the future
resource revenue are particularly relevant: the permanent income hypothesis (PIH), the modified
PIH, and the fiscal sustainability framework (FSF).
16. The PIH framework allows for a constant NRPB deficit over time, limited to a
perpetual return on the net resource wealth. The resource wealth can be thought of as the net
present value (NPV) of the future stream of financial revenue that the state derives from the
exploitation of the resource. The revenue includes production royalties, taxes on profits, withholding
on dividends and state participation, as well as any other payments directly related to the extractive
activities, calculated annually over the life of the resource. Assuming that the initial budget position
is sustainable and that the economic conditions described in Box 1 hold, the PIH rule provides a
fiscal space of 0.65 percent of non-resource GDP (Figure 2, upper left panel). This level of spending
10
Primary expenditures are expenditures net of interest payments and income.

ISLAMIC REPUBLIC OF MAURITANIA
INTERNATIONAL MONETARY FUND 11
is considered sustainable because it finances the deficit in perpetuity, beyond the depletion of the
mineral resource in the ground. The government’s inter-temporal budget constraint is satisfied
because, at this level, the NPV of non-resource primary deficits equals the NPV of the future
resource revenue flows.
17. The modified version of the PIH framework allows for a deviation from the constant
NRPB deficit target to accommodate temporary frontloading of capital spending. The PIH
approach could be an excessively tight fiscal benchmark in developing countries with a relatively
certain extraction horizon, high investment needs, and proven capacity to absorb an acceleration of
public spending on capital assets. In a modified PIH (MPIH) framework, transformative investment in
human and infrastructure capital could be frontloaded in the medium term in anticipation of future
resource revenues to enhance potential economic growth. However, in order to satisfy the inter-
temporal budget constrain, fiscal adjustment would be required later on, particularly if the scaling
up of public investment does not result in higher growth. For Mauritania, simulations indicate that a
nominal increase in public investment of 18 percent relative to the baseline in the next five years
would require an adjustment of 0.34 percent of GDP on average between 2020 and 2030 (Figure 2,
upper right panel). This adjustment is necessary in order to rebuild financial assets to a level that can
support budgetary needs in the long run, at the same level as those under the traditional PIH
approach. With this calibration, the inter-temporal budget constraint is satisfied: the NPV of the
investment frontloading equals the NPV of the future adjustment and the overall effect on wealth
remains unchanged (under the assumption of no spillover growth effects from higher spending in
the short term).
18. The Fiscal Sustainability Framework (FSF) is a variation of the modified PIH that
incorporates ex-ante expectations that the initial public investment has important spillover
effects on economic growth. The FSF allows for an initial drawdown of government resources for
investment in growth-enhancing capital, but later stabilizes the NRPB at a level inferior to that under
the PIH or the modified PIH. Even if the long-run NRPB level is lower under the FSF, the primary
expenditure can be stabilized at a higher level because the initial investment has multiplying effects
on the economy, leading to higher growth and non-resource revenues (Figure 2, middle left panel).
The net wealth stabilization depends on the non-resource growth assumptions—a stark contrast
with the PIH and MPIH frameworks that focus on preserving the full amount of financial wealth and
do not include non-resource growth spillovers (Figure 2, bottom left panel).
ISLAMIC REPUBLIC OF MAURITANIA
12 INTERNATIONAL MONETARY FUND
Box 1. Sustainability Analysis: Underlying Assumptions
The simulations in Figure 2 compare fiscal policy under three alternative fiscal sustainability rules anchored
in the NRPB. The period of analysis spans 36 years, from 2015 through 2050. Several assumptions underpin
these simulations:
Real non-resource GDP is assumed to grow at a constant rate of 6.4 percent, and nominal non-resource
GDP at a rate of 11.8 percent (under the PIH and modified PIH rules). Inflation stays constant at 5.1
percent throughout the period. (The rates reflect long-term averages currently used in the macro
framework agreed between IMF staff and the authorities.)
Non-resource revenue (excluding grants) is assumed to stay constant, as share of non-resource GDP, at
23 percent.
The annual resource revenue flows are derived from the FARI fiscal forecasting model, which calculates
the fiscal payments for individual mines taking into account underlying project economics and then
aggregates the flows across the sector (Figure 1). Commodity prices come from the October 2014 WEO
which assumes that the iron ore price converges to US$85 per metric ton in the long-term.
The mineral wealth is calculated as the net present value of government revenues from minerals
through 2050 (as of end of 2014) under the base case scenario (of neither phosphate nor natural gas
development). Using a discount rate of 12.5 percent, equivalent to the market return of an asset on the
equity market, the mineral wealth is of MRO 1,336 billion at the beginning of 2015 (the equivalent of
1.15 the non-resource GDP of the country in 2013). From 2015 on, the net mineral wealth at the end of
each year is calculated taking into account both the net financial savings accumulated from mineral
operations during the year and the net present value of future expected mineral revenues.
The traditional PIH rule assumes that the NRPB remains constant over time and is financed with the rate
of return on the remaining net mineral wealth at the end of each year. In the baseline scenario, the
NRPB deficit corresponding to the PIH sustainability benchmark is of 0.65 percent of non-resource GDP.
The modified PIH rule allows for an increase in public investment spending of MRO 1,081 billion over
five years, between 2015 and 2019, the equivalent of 18 percent of the country’s 2013 non-resource
GDP. During this period, the NRPB reaches a maximum deficit of 2.9 percent of non-resource GDP. The
fiscal consolidation is assumed to take place over a period of 10 years starting in 2020, when the NRPB
runs at surpluses of up to 0.9 percent. By 2031, when the fiscal adjustment is concluded, fiscal policy
returns to the PIH benchmark of -0.65 percent of non-resource GDP.
The Fiscal Sustainability Framework, which incorporates the positive impact of higher public investment
on growth, generates a fiscally sustainable path that is consistent with a lower level of the NRPB deficit,
at 0.25 percent of the non-resource GDP.
Source: IMF staff calculations.
19. When the resource horizon is long, managing the volatility of resource revenue takes
precedence over issues of sustainability. A fiscal policy anchored to a structural resource balance
target helps to remove the effect of commodity price volatility by applying price-based rules.11
Under the price-based rule, budgetary revenues are projected using a smoothed (“structural”) price.
11
The fiscal anchor could be defined as the cyclically-adjusted balance—where the fiscal stance is assessed by
correcting for the impact of not only commodity price shocks, but also of the output trend, asset price cycles and
one-off factors. This analysis assumes only adjustments for commodity price cycles.

ISLAMIC REPUBLIC OF MAURITANIA
INTERNATIONAL MONETARY FUND 13
When actual commodity prices are higher than the structural price, realized revenues are higher
than budgetary revenues and the surplus is accumulated in a stabilization buffer. Conversely, when
actual prices are lower than the structural price, the deficit is covered by withdrawing funds from the
stabilization buffer.
Figure 2. Mauritania: Sustainability Assessment Indicators
Figure 1. Mauritania: Sustainability Assessment Indicators (Dec, 2014)
Source: IMF Staff calculations.
-3.5
-3
-2.5
-2
-1.5
-1
-0.5
0
0.5
1
1.5
2015
2017
2019
2021
2023
2025
2027
2029
2031
2033
2035
2037
2039
2041
2043
2045
2047
2049
PIH perpetuityModified PIH perpetuityFSF perpetuity
Non-resource primary balance
(Percent non-resource GDP)
Sources: IMF staff calculations.
Front-loading
period
MPIHadjustment
period
Long-run period
100
102
104
106
108
110
112
114
116
2014
2016
2018
2020
2022
2024
2026
2028
2030
2032
2034
2036
2038
2040
2042
2044
2046
2048
PIH perpetuity
Modified PIH perpetuity
FSF perpetuity
Financial resource wealth
(Percent non-resource GDP)
Front-loading
period
MPIHadjustment
period
Long-run period
20
22
24
26
28
30
2015
2017
2019
2021
2023
2025
2027
2029
2031
2033
2035
2037
2039
2041
2043
2045
2047
2049
Primary expenditure
Non-resource revenue
Fiscal space: PIH framework
(Percent non-resource GDP)
Sources: IMF staff calculations.
20
21
22
23
24
25
26
27
28
29
30
2015
2017
2019
2021
2023
2025
2027
2029
2031
2033
2035
2037
2039
2041
2043
2045
2047
2049
Fiscal space: Modified PIH framework
(Percent non-resource GDP)
Sources: IMF staff calculations.
Front-loading
period
Long-run periodMPIHadjustment
period
22
24
26
28
30
32
34
36
38
2015
2017
2019
2021
2023
2025
2027
2029
2031
2033
2035
2037
2039
2041
2043
2045
2047
2049
Fiscal space: Fiscal sustainability framework
(Percent non-resource GDP)
Sources: IMF staff calculations.
Front-loading
period
Long-run periodMPIH
Adjustment
period
0
20
40
60
80
100
120
2015
2017
2019
2021
2023
2025
2027
2029
2031
2033
2035
2037
2039
2041
2043
2045
2047
2049
PIH perpetuity
MPIH Perpetuity
FSF Perpetuity
Cumulative financial savings
(Percent non-resource GDP)
Sources: IMF staff calculations.

ISLAMIC REPUBLIC OF MAURITANIA
14 INTERNATIONAL MONETARY FUND
20. In choosing a price-rule formula, consideration must be given to the preference for
smoothing spending and the need to adjust to changes in price trends. Price formulas with a
short backward-looking horizon track better changes in prices, but may lead to more volatile
expenditure envelopes that can fuel procyclical fiscal policy. Price formulas with longer backward-
looking horizons allow smoother expenditure paths, but may systematically undershoot or
overshoot actual revenues if price trends change (IMF 2012b). To simulate the effect of a structural
balance anchor, three price rules were modeled for Mauritania: a five-year rolling average of
historical average (5/0/0) following Ghana’s budget oil price formula; a moving average of the past
five years, the current year, and projected prices for the next five years (5/1/5) as in Trinidad and
Tobago; and an average of the past 12 years, the current year, and three years of futures prices
(12/1/3) as introduced in Mongolia in 2013 for the copper budget price.12
These specifications were
applied simultaneously to all three commodities contributing to government revenue in Mauritania
in the base case scenario (iron ore, copper, and gold). Simulations indicate that, of the three rules,
the 5/1/5 benchmark reduces volatility relative to actual prices while responding better to changes
in prices trends (Box 2).
Box 2. Volatility Analysis: Price Smoothing
The figures above illustrate alternative benchmark iron ore and gold prices using historical and projected
WEO values. For the medium term (2015-17), the moving average of the past five years (5/0/0) is the most
optimistic benchmark. The moving average that incorporates the prior 12 years (12/1/3) offers a more
conservative approach in the medium term, yet historically it would have been a poor benchmark because it
would have undershot prices heavily over 2007-13. Given the present uncertainty as to where markets are
positioned relative to the commodity cycle, a benchmark that gives equal weight to backward- and forward-
looking prices, such as the moving average of 11 years (5/1/5), could provide a more balanced perspective.
12
These price-smoothing rules are used illustratively here and a more detailed analysis should calibrate them to the
specific situation of Mauritania.
0
20
40
60
80
100
120
140
160
2005
20
06
20
07
20
08
20
09
20
10
20
11
20
12
20
13
2014
2015
2016
2017
20
18
20
19
20
20
20
21
20
22
20
23
20
24
20
25
Alternative benchmarks: iron ore prices
(CIF, USD/metric tonne)
Iron ore price - WEO Iron ore price - MA(5/0/0)
Iron ore price - MA(5/1/5) Iron ore price - MA(12/1/3)
200
400
600
800
1,000
1,200
1,400
1,600
1,8002
00
5
20
06
20
07
2008
20
09
20
10
20
11
2012
20
13
20
14
20
15
2016
20
17
20
18
20
19
2020
20
21
20
22
20
23
2024
2025
Alternative benchmarks: gold prices
(USD/ounce)
Gold price - WEO Gold price - MA(5/0/0)
Gold price - MA(5/1/5) Gold price - MA(12/1/3)

ISLAMIC REPUBLIC OF MAURITANIA
INTERNATIONAL MONETARY FUND 15
Figure 3. Mauritania: Managing Volatility Indicators
Figure 2. Mauritania: Managing Volatility Indicators (Dec. 2014)
Source: IMF staff calculations.
-1.5
-1
-0.5
0
0.5
1
1.5
2
2015
2017
2019
2021
2023
2025
2027
2029
2031
2033
2035
2037
2039
2041
2043
2045
2047
2049
Price rule (5/0/0)
Price rule (5/1/5)
Price rule (12/1/3)
Overall primary balance
(Percent non-resource GDP)
Structural balance target: 1 percent non-resource GDP
Sources: IMF staff calculations.
-2
0
2
4
6
8
10
12
2015
2017
2019
2021
2023
2025
2027
2029
2031
2033
2035
2037
2039
2041
2043
2045
2047
2049
Price rule (5/0/0)
Price rule (5/1/5)
Price rule (12/1/3)
Real primary expenditure growth
(Percent change, year-on-year)
Structural balance target: 1 percent non-resource GDP
Sources: IMF staff calculations.
-10
0
10
20
30
40
50
2015
2017
2019
2021
2023
2025
2027
2029
2031
2033
2035
2037
2039
2041
2043
2045
2047
2049
Price rule (5/0/0)
Price rule (5/1/5)
Price rule (12/1/3)
Cumulative financial savings
(Percent non-resource GDP)
Structural balance target: 1 percent non-resource GDP
Sources: IMF staff calculations.
-50
-40
-30
-20
-10
0
10
20
30
40
50
2015
2017
2019
2021
2023
2025
2027
2029
2031
2033
2035
2037
2039
2041
2043
2045
2047
2049
Price rule (5/1/5) with 0% of NR-GDP SB target
Price rule (5/1/5) with 1% of NR-GDP SB target
Price rule (5/1/5) with -1% of NR-GDP SB target
Savings under different structural balance targets
(Percent non-resource GDP)
Sources: IMF staff calculations.
0
2
4
6
8
10
12
2015
2017
2019
2021
2023
2025
2027
2029
2031
2033
2035
2037
2039
2041
2043
2045
2047
2049
Price rule (5/1/5) with 1% of NR-
GDP SB target
Price rule (5/1/5)with 1% of NR-
GDP SB target + exp growth limit
Real primary expenditure growth with expenditure
growth limit (Percent change, year-on-year)
Sources: IMF staff calculations.
0
5
10
15
20
25
30
35
40
45
50
2015
2017
2019
2021
2023
2025
2027
2029
2031
2033
2035
2037
2039
2041
2043
2045
2047
2049
Price rule (5/1/5) with 1% of NR-
GDP SB target
Price rule (5/1/5)with 1% of NR-
GDP SB target + exp growth limit
Cumulative financial savings
(Percent non-resource GDP)
Sources: IMF staff calculations.

ISLAMIC REPUBLIC OF MAURITANIA
16 INTERNATIONAL MONETARY FUND
21. The level of the fiscal anchor must be determined in the context of the country’s debt
position. A structural surplus should be targeted because of risk factors (such as contingent
liabilities), but also as a function of Mauritania’s existing absorptive capacity constraints, at least in
the medium term. Simulations indicate that a structural balance rule targeting a surplus of 1 percent
of non-resource GDP and with the price calculated as the moving average over 11 years (5/1/5)
could smooth public expenditure growth, stabilize the overall primary balance, and allow an
accumulation of financial savings to reduce government debt (Figure 3, upper and middle row
panels).
22. As an illustration, an additional cap on real expenditure growth could further limit
procyclicality and allow a higher accumulation of financial savings. Absorption capacity
considerations may call for a cap on overall expenditure growth. Other countries (such as Mongolia)
have used expenditure caps in combination with other fiscal anchors to smooth expenditure.
Generating more predictable changes in spending could be particularly important for Mauritania if,
for example, the Banda Gas project comes on stream and phosphate resources are developed
(according to the extended scenario). Under the fiscal anchor of 1 percent structural resource
surplus and a 5/1/5 price-smoothing rule, imposing an additional cap on real expenditure growth of
7 percent brings the level of financial savings up from 37 percent to 42 percent of non-resource
GDP by 2049 (Figure 3, bottom row panels). Part of these financial savings could be set aside in
stabilization buffers, with anything in excess saved for future generations.
E. Strengthening Institutions
23. Mauritania needs to strengthen its fiscal institutions to support transparent and
efficient use of its resource wealth. A key precondition to strengthening fiscal institutions is
advancing the public financial management (PFM) reforms initiated over the past years. A new
Organic Budget Law (OBL), prepared in draft form in 2012, still needs formal adoption by Cabinet
and Parliament. The new law will include fiscal principles, setting of fiscal objectives, a medium-term
expenditure framework (MTEF), improved documentation, and a budgetary timetable with more
time for legislative scrutiny (IMF 2013). The introduction of a binding MTEF encompassing the public
investment program (PIP) is particularly important as a tool for monitoring fiscal policy and planning
capital investment spending. More sophisticated fiscal risks analysis will also be needed to support
that the government‘s fiscal strategy is robust to a range of risks, including commodity price and
production fluctuations.
24. Equally critical is to lay the foundations for a fiscal rule to specifically address natural
resource wealth considerations. Basic provisions should include fiscal objectives, the fiscal anchor,
interactions with a natural resource fund, as well as escape clauses under which fiscal policy may
deviate from the fiscal rule. Well-designed escape clauses are critical to preventing exceptional and
unforeseeable shocks from undermining the credibility of the fiscal rule. The experience of the oil
fund, whose operations have generally set an example of transparency and accountability, could
serve as starting point for the design of a more comprehensive resource fund to include mineral
revenue. Surplus revenues from the execution of the fiscal rule should flow into the resource fund,
which would first play a budget stabilization function by providing a buffer to protect planned

ISLAMIC REPUBLIC OF MAURITANIA
INTERNATIONAL MONETARY FUND 17
capital expenditure against resource revenue volatility. Any additional surplus above this buffer
would then be channeled into a savings portfolio for future generations. The resource fund should
thus be a complementary policy tool that mirrors the fiscal rule, with fund flows fully integrated into
the budget process.
25. To ensure that these reforms are implemented on a sustained basis, enhanced
transparency and communication remain critical. A good starting point is a transparent budget
formulation and execution reporting system, in which Mauritania already has a good record,
including multi-year fiscal objectives which are clearly defined and published openly, with ex-post
reporting to Parliament and the general public. Further, fiscal performance will preferably include all
financial transactions involving the state-owned enterprises, the central government, and the
general government, with identification of fiscal risks.
F. Conclusions
26. Mauritania has important natural resource wealth, and its fiscal policy is shaped by
considerations resulting from its reliance on resource revenues. Prospects for price shocks in the
short term and significant mining expansion in the long term could pose significant challenges to
fiscal policy management. Like other commodity exporting countries, Mauritania needs to avoid
procyclical fiscal policies and adopt rules that guide medium-term policy and help gain in policy
predictability. Fiscal frameworks that link the sustainable level of spending to future resource
revenues could be particularly relevant in the context of Mauritania. As a low income country scarce
in capital, consideration could also be given to frontloading public expenditure for productive
investment, within debt management constraints.
27. The choice of the fiscal anchor will be guided by the authorities’ view on the
exhaustibility of the resources. The length of the resource horizon is ultimately a function of two
factors: the market conditions that determine to what extent it is economically viable to develop the
resource potential of the country; and the fiscal regime for extractive industries which determines
the time profile and the weight of the resource revenue in the budget. Under the assumption of
finite resources, the authorities should monitor a non-resource primary balance linked to a fiscal
sustainability benchmark that takes into account estimates of the total resource wealth. Under the
assumption of a long-term resource horizon, fiscal policy should target a structural primary resource
balance to isolate the budget execution from shocks arising from commodity price fluctuations.
Future discussions and analysis will be needed to pin down the technical details of a fiscal rule.
28. Fiscal frameworks for resource wealth management require strong institutions. This
entails strong commitment to transparency, policy predictability and credibility, good governance
structures, and an enhanced quality of institutions. The adoption of the new OBL would lay the
foundations for a modern public financial management system and the implementation of a fiscal
framework geared toward the specific challenges associated with managing the resource wealth to
support fiscal sustainability.

ISLAMIC REPUBLIC OF MAURITANIA
18 INTERNATIONAL MONETARY FUND
References
Daniel, P., and others, 2010, “Evaluating Fiscal Regimes for Resource Projects: An Example from Oil
Development,” in The Taxation of Petroleum and Minerals: Principles, Problems and Practices, ed.
by Philip Daniel, Michael Keen, and Charles McPherson (London and New York: Routledge and
IMF).
International Monetary Fund, 2012 (a), “Fiscal Regimes for Extractive Industries: Design and
Implementation”, IMF Policy Paper (Washington: International Monetary Fund).
International Monetary Fund, 2012 (b), “Macroeconomic Policy Frameworks for Resource-Rich
Developing Countries—Analytical Frameworks and Applications,” IMF Policy Paper (Washington:
International Monetary Fund).
International Monetary Fund, 2014, “Peru: Fiscal Framework Alternatives for a Resource Rich Country,”
IMF Selected Issues (Washington: International Monetary Fund).
Mele, Gianluca, 2014, “Mauritania: Counting on Natural Wealth for a Sustainable Future,” World Bank
Policy Research Paper.
Rota-Graziosi, Grégoire, Alain Charlet, and Bertrand Laporte, 2014, “Mauritanie: Fiscalité minière,”
IMF Technical Assistance Report (Washington: International Monetary Fund).
Segura-Ubiergo, Alex, and others, 2014, “Mozambique: Fiscal Framework Considerations for the New
Resource-Rich Environment,” IMF Technical Assistance report (Washington: International
Monetary Fund).
World Bank. 2014. “Mauritania, Senegal, Mali—Banda Gas to Power Project” (Washington: World
Bank Group). http://documents.worldbank.org/curated/en/2014/05/19490845/mauritania-
senegal-mali-banda-gas-power-project
ISLAMIC REPUBLIC OF MAURITANIA
INTERNATIONAL MONETARY FUND 19
GROWTH, EMPLOYMENT, AND SOCIO-DEMOGRAPHIC
CHALLENGES IN MAURITANIA1
Mauritania’s growth performance in recent years has been high by regional standards and is expected
to strengthen over the medium term thanks to the expansion of mining capacity. That said, the
economy is still reliant on a narrow natural resource base. Mauritania could benefit from the positive
growth outlook and the ongoing demographic transition, with an increasing share its population at
working age, to support a structural transformation of the economy, diversifying its economy to
provide opportunities for more inclusive growth and reducing its vulnerability to terms-of-trade shocks.
Analysis of other countries’ experiences shows that as the economy diversifies, more attention should
be given to human capital development and the reduction of labor market inefficiencies.
A. Introduction
1. Mauritania is a country rich in natural resources. With more than one million km2,
Mauritania is comparable in area to Egypt but its population, at only 3.5 million, is much smaller. The
country is at the intersection of the Maghreb and the Sahel region (Morocco, Algeria, Senegal, and
Mali) which explains the multiethnic structure of the population. Historically, Mauritania has been
agro-pastoralist but as a consequence of extended, severe drought, the desert has been expanding
since the mid-1960s limiting agricultural activity to the Senegal River in the south. To the west, the
country has one of the richest fishing areas in the world. Mauritania also has extensive reserves of
iron ore, most of which is currently extracted by the state-owned Société Nationale des Industries
Minières (SNIM). Other metals include copper and gold.
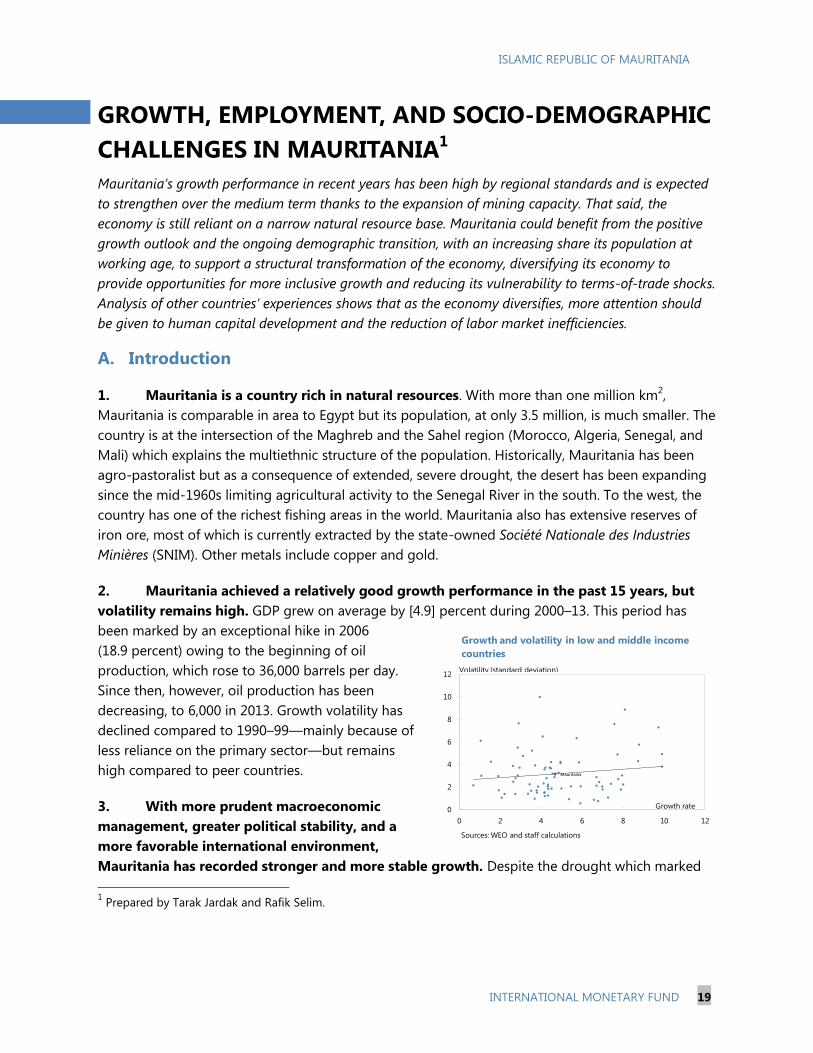
2. Mauritania achieved a relatively good growth performance in the past 15 years, but
volatility remains high. GDP grew on average by [4.9] percent during 2000–13. This period has
been marked by an exceptional hike in 2006
(18.9 percent) owing to the beginning of oil
production, which rose to 36,000 barrels per day.
Since then, however, oil production has been
decreasing, to 6,000 in 2013. Growth volatility has
declined compared to 1990–99—mainly because of
less reliance on the primary sector—but remains
high compared to peer countries.
3. With more prudent macroeconomic
management, greater political stability, and a
more favorable international environment,
Mauritania has recorded stronger and more stable growth. Despite the drought which marked
1 Prepared by Tarak Jardak and Rafik Selim.
0
2
4
6
8
10
12
0 2 4 6 8 10 12
Growth and volatility in low and middle income
countries
Sources: WEO and staff calculations
Mauritania
Volatility (standard deviation)
Growth rate

ISLAMIC REPUBLIC OF MAURITANIA
20 INTERNATIONAL MONETARY FUND
the 2011–12 agricultural seasons, GDP grew at 5.3 percent on average during 2011–13, boosted
mainly by higher mining production and buoyant activity in construction and services favored by
large public investments aimed at filling the infrastructure gap.
4. Medium-term prospects are promising thanks to an expansion in mining production.
The momentum is likely to continue in the short
to medium term as iron ore production is
expected to more than double by 2019, leading
to sustained growth of about 6.5 percent during
2015–19. However, a larger-than-forecasted
decline in iron ore prices could lead to delays or
even cancellation of some mining projects. These
risks, if they materialize, could lower growth
prospects. Even under the baseline scenario
presented in the accompanying staff report, the
authorities will continue to face the same
challenges of generating more inclusive and job-
creative growth. As shown by many resource-rich developing countries’ experiences, growth is a
necessary but insufficient condition to lower unemployment and income inequality (IMF 2013c).
5. Mauritania could benefit from improving human capital and labor market efficiency.
According to the global competitiveness index, Mauritania continues to lag behind factor-based
economies in terms of human capital—especially education—and labor market efficiency, while the
infrastructure gap has been narrowing as a result of government efforts. At the same time, the
presence of a young and better-educated segment of the population provides an additional
opportunity to benefit from the favorable environment and speed up reforms in order to absorb the
additional labor demand, reduce the unemployment rate (especially among youth) and try to bring
the informal sector into the formal economy.
6. This paper takes stock of sectoral and factor dynamics in Mauritania’s economic
growth, discusses labor market dynamics, and explores the policy options that could support
sustainable and more inclusive growth. The first section focuses on growth determinants, from a
sectoral perspective and through factor analysis. Dynamics of the labor market and socio-
demographic challenges will be addressed in sections 2 and 3, respectively. Lessons from other
countries’ experiences and policy recommendations are discussed in section 3. Section 4 concludes
B. Growth Determinants in Mauritania: Sectoral and Factor Analysis
Sectoral analysis: Some output diversification but a heavy reliance on natural resources
7. Greater trade openness and liberalization of some services have helped to diversify
output, but the productive base has remained reliant on the exploitation of natural resource
endowments.
0
2
4
6Institutions
Infrastructure
Macroeconomic
Environment
Health and primary
education
Higher education and
training
Goods market
efficiency
Labor market
efficiency
Financial market
development
Technological
readiness
Market size
Business
sophistication
Innovation
MRT
Factor-driven
Stages of Development(Score)
Source: Global competitiveness report.
0
5
10
15
20
25
30
35
40
45
1998
1999
2000
2001
2002
2003
2004
2005
2006
2007
2008
2009
2010
2011
2012
2013
Output diversification
Sources: ONS and staff calculations
Primary sector
Services and others
OilManufacturing
Mining
Construction

ISLAMIC REPUBLIC OF MAURITANIA
INTERNATIONAL MONETARY FUND 21
Since the beginning of the 1990s, Mauritania has undergone a relatively rapid trade
liberalization followed by a disengagement of the state from some services (Telecom, air
transport). This, in addition to rapid urbanization, has increased the share of the tertiary sector,
which grew by 10 percentage points during 1998–2004.
Over the same period, the share of the primary sector, dominated by pastoral activities, declined
from 38 percent in 2000 to 30 percent of GDP in (year). Difficult weather conditions, weak rural
infrastructure, and low productivity owing to the extensive and dispersed nature of farms led to
a weak contribution of agriculture and livestock to growth. In the second half of the 2000s and
in recent years, the government has attached higher importance to the sector, offering technical
and financial support to farmers and extending irrigated land, which led to yield improvement
and smoothed growth volatility.
The productive base has not changed significantly. Industrial production remains dominated by
raw extractive products, and processing is shallow (in the fishing industry, for example) because
of infrastructure bottlenecks (transport, electricity supply and ports), limited financial access, and
a weak business environment.
8. Services and construction have been the main drivers of overall growth, but are
heavily dependent on performance and revenues in the extractive sector.
Domestically oriented sectors such as services and construction were the main drivers of growth.
In services, particularly commerce and transport, average growth was 7.5 percent and
11.9 percent, respectively, on average during 1999-2012, contributing more than half of overall
growth. Construction also played an important
role, growing by [11] percent on average,
though its contribution was uneven across
years.
The direct contribution of the extractive sector
was low until 2007. In fact, except for the 2006
hike in oil production, production was limited
to iron ore and fluctuating around 11 million
tons per year. The reforms of the mining code,
in addition to higher international prices,
attracted large foreign investments and mining
production diversified to copper and gold2 and increased the contribution of the mining sector
to 0.6 percent on average during 2007–13 compared to 0 percent during 2000–06. Moreover,
because the metal prices were more than 10 times higher in 2012 than in 2000, the mining
2And, on a smaller scale, gypsum, uranium, quartz, and phosphate.
-2
-1
0
1
2
3
4
5
6
7
-3
-2
-1
0
1
2
3
4
2000-05 2006-10 2011-2013 2000-13
Primary sector Mines
Oil Manufacturing
Construction Public administration
Other GDP growth excl. oil (RHS)
Sectoral contributions
ONS and staff calculations

ISLAMIC REPUBLIC OF MAURITANIA
22 INTERNATIONAL MONETARY FUND
revenues increased substantially, reaching more than 25 percent of total revenues which allowed
large public investment that contributed to bolstering non-extractive GDP growth.
Factor analysis: The mirror of economic structure
9. GDP growth was mostly driven by the accumulation of factors of production—
especially labor—while the total factor production (TFP) contribution was negative. The
growth-accounting exercise results are
symptomatic of an economy in which agriculture
is still the biggest employer and which depends
on growth in public sector and informal services
with a minimal contribution from manufacturing.
Labor utilization was the main driver of real
GDP per capita growth, reflecting the increase
of both the labor force and the participation
rate, while the unemployment rate remained
stable. Human capital contributed positively
to growth, reflecting the gradual
improvement in education measured here by
the average years of schooling across the
population.
The 2000s recorded an acceleration of capital
accumulation, fostered by important
investments in the extractive sector and an
acceleration of public investments mostly
targeted at filling the infrastructure gap.
However, TFP contributed negatively to growth
(-1.8 percent in the 2000s compared to +1.7 percent for low-income countries (LICs)). The
-10
-5
0
5
10
15
20
25
-100
-50
0
50
100
150
200
1971 1976 1981 1986 1991 1996 2001 2006 2011
Mineral rent (growth rate)
Real GDP growth (RHS)
Growth and mineral rent
0
2
4
6
8
10
12
14
16
2008 2009 2010 2011 2012 2013 2014
Domestically financed investment
Foreign-financed investment
Extractive revenues
Capital expenditure
Mining revenues and public investment (in percent
of non extractive GDP)
-3
-2
-1
0
1
2
3
4
5
6
80-89 90-99 00-10 80-89 90-99 00-10
Mauritania LICs
Labor Capital Human capital TFP GDP growth
Growth decomposition
Sources: Penn database and IMF staff calculations
-1.0
-0.5
0.0
0.5
1.0
1.5
2.0
2.5
LIC LMIC SSA, Sahel Mauritania
1981-901991-002001-10
TFP growth in agriculture
Sources: USDA and IMF staff calculations

ISLAMIC REPUBLIC OF MAURITANIA
INTERNATIONAL MONETARY FUND 23
concentration of investments in the mining sector, the high level of informality, together with
the poor quality of education and/or the inability to retain talent, could explain why the
accumulation of factors did not translate into productivity gains.
Box 1. Growth Accounting Exercise: Methodology and Data
The growth accounting exercise explains output growth by decomposing it into the contributions of capital,
labor, and a residual. This residual is an estimate of the changes in total factor productivity (TFP) that reflect
a wide range of factors affecting input efficiency. The residual is defined as the growth in output that occurs
with unchanged levels of the factor inputs.
Following the methodology of Hall and Jones (1999), the exercise is based on a standard aggregate Cobb-
Douglas production function with a constant return to scale which includes physical capital, human capital,
and labor as production factors and labor-augmenting technological progress is assumed:
where Y, K, H, h, L, and A stand for output, physical capital, effective labor input, human capital per person ,
employment, and total factor productivity (TFP) respectively, α refers to the capital share, and (1-α) refers to
the labor share.
This can be written:
Output growth is given by TFP growth, i.e., the efficiency with which inputs of production are used, plus a
weighted sum of the growth rate of physical capital and human capital.
All the data have been taken from the Penn database. The poor quality of some data, especially the
employment ones, leaves some uncertainty in the results.
10. At the disaggregated level, the low agricultural productivity could partly explain the
aggregate productivity gap. To better understand the picture on aggregated level, we investigated
the agriculture sector. Mauritania experienced relatively low TFP growth in the agriculture sector,
unlike many low-income countries including some in the Sahel region. Recent efforts to extend
irrigated land, and other forms of financial support have improved the attractiveness of the sector
and increased its contribution to growth during 2011–13.
ISLAMIC REPUBLIC OF MAURITANIA
24 INTERNATIONAL MONETARY FUND
C. Labor Market Dynamics, Socio-Demographic Issues, and Challenges Ahead
Dynamics of the labor market
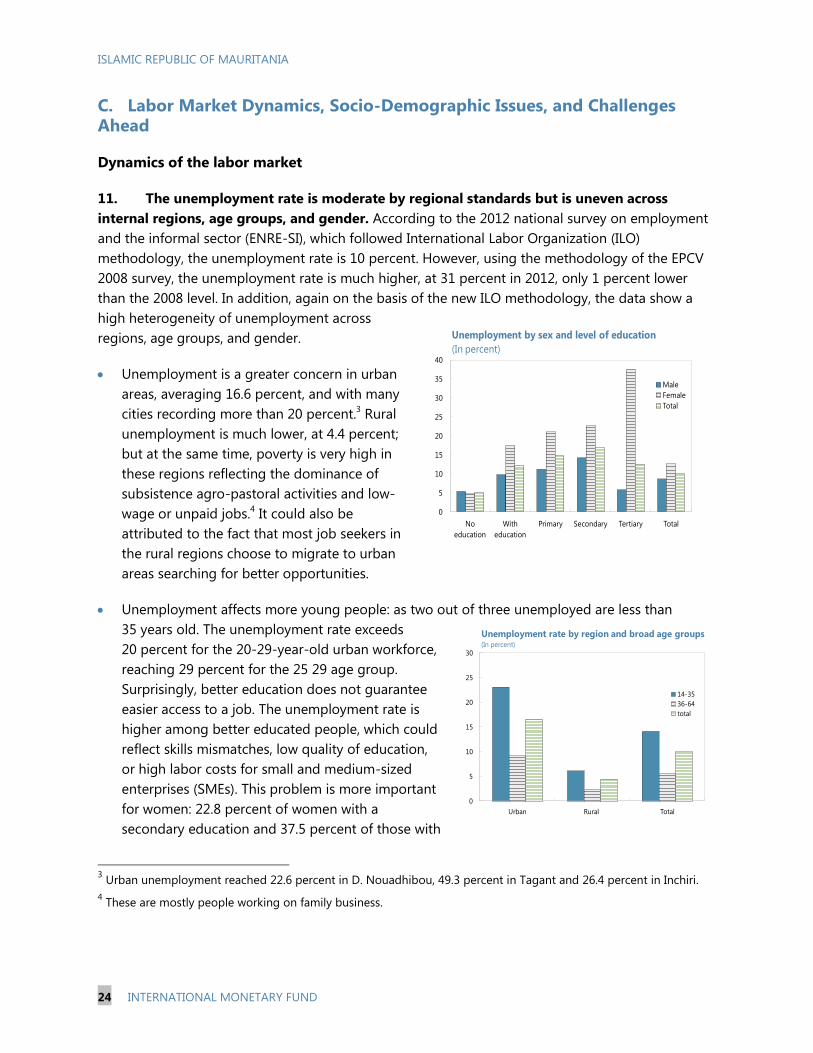
11. The unemployment rate is moderate by regional standards but is uneven across
internal regions, age groups, and gender. According to the 2012 national survey on employment
and the informal sector (ENRE-SI), which followed International Labor Organization (ILO)
methodology, the unemployment rate is 10 percent. However, using the methodology of the EPCV
2008 survey, the unemployment rate is much higher, at 31 percent in 2012, only 1 percent lower
than the 2008 level. In addition, again on the basis of the new ILO methodology, the data show a
high heterogeneity of unemployment across
regions, age groups, and gender.
Unemployment is a greater concern in urban
areas, averaging 16.6 percent, and with many
cities recording more than 20 percent.3 Rural
unemployment is much lower, at 4.4 percent;
but at the same time, poverty is very high in
these regions reflecting the dominance of
subsistence agro-pastoral activities and low-
wage or unpaid jobs.4 It could also be
attributed to the fact that most job seekers in
the rural regions choose to migrate to urban
areas searching for better opportunities.
Unemployment affects more young people: as two out of three unemployed are less than
35 years old. The unemployment rate exceeds
20 percent for the 20-29-year-old urban workforce,
reaching 29 percent for the 25 29 age group.
Surprisingly, better education does not guarantee
easier access to a job. The unemployment rate is
higher among better educated people, which could
reflect skills mismatches, low quality of education,
or high labor costs for small and medium-sized
enterprises (SMEs). This problem is more important
for women: 22.8 percent of women with a
secondary education and 37.5 percent of those with
3 Urban unemployment reached 22.6 percent in D. Nouadhibou, 49.3 percent in Tagant and 26.4 percent in Inchiri.
4 These are mostly people working on family business.
0
5
10
15
20
25
30
35
40
No
education
With
education
Primary Secondary Tertiary Total
Male
Female
Total
Unemployment by sex and level of education
(In percent)
0
5
10
15
20
25
30
Urban Rural Total
14-35
36-64
total
Unemployment rate by region and broad age groups(In percent)
ISLAMIC REPUBLIC OF MAURITANIA
INTERNATIONAL MONETARY FUND 25
tertiary education are unemployed.
12. The relatively low unemployment rate partly reflects low participation, particularly for
youth and women.
The unemployment rate would have been higher if the participation rate were not so low,
especially for youth and women. Only 4.4 out of 10 working-age people are active (looking
actively for a job). The participation rate for people aged 15–24 years is only 25 percent
(34 percent for men and 17 percent for women) which is low, given the relatively low level of
years of schooling (five years). One possible explanation is the long time it takes to find a job for
first job seekers (five years on average) which discourages them and push them to quit the
active labor force. The other one is that a large number of these young people will be involved
in family businesses and wait for their parents to be older to replace them.
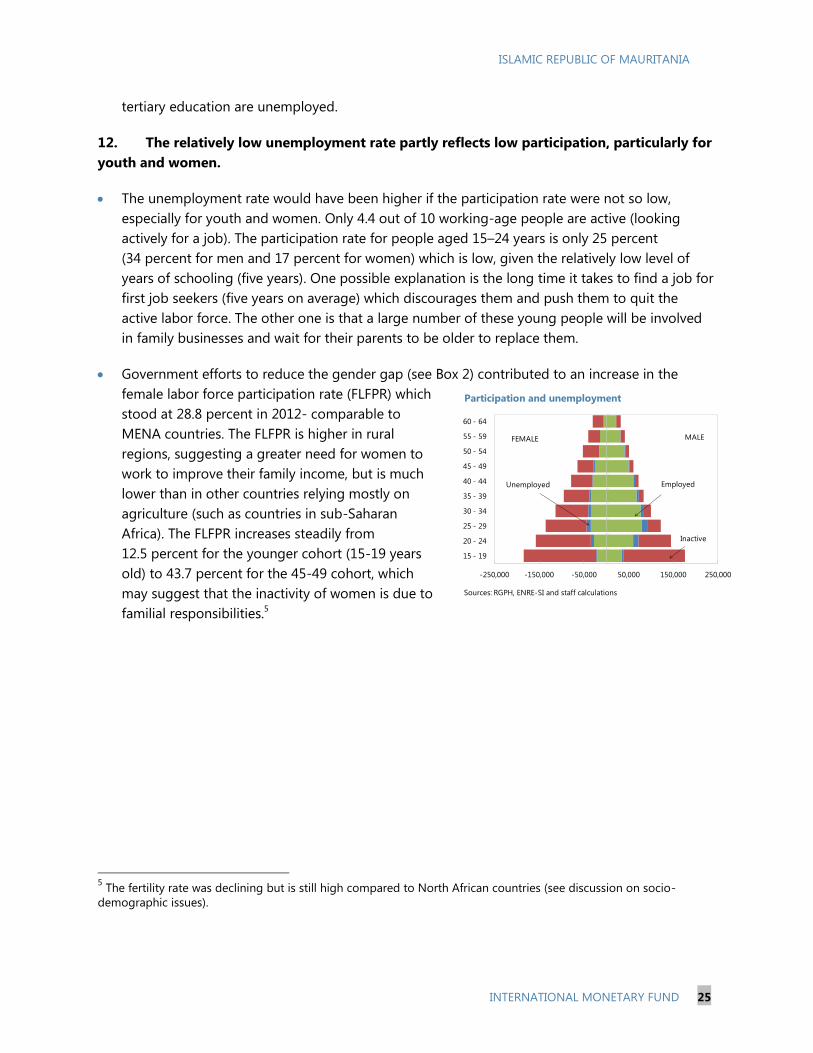
Government efforts to reduce the gender gap (see Box 2) contributed to an increase in the
female labor force participation rate (FLFPR) which
stood at 28.8 percent in 2012- comparable to
MENA countries. The FLFPR is higher in rural
regions, suggesting a greater need for women to
work to improve their family income, but is much
lower than in other countries relying mostly on
agriculture (such as countries in sub-Saharan
Africa). The FLFPR increases steadily from
12.5 percent for the younger cohort (15-19 years
old) to 43.7 percent for the 45-49 cohort, which
may suggest that the inactivity of women is due to
familial responsibilities.5
5 The fertility rate was declining but is still high compared to North African countries (see discussion on socio-
demographic issues).
-250,000 -150,000 -50,000 50,000 150,000 250,000
15 - 19
20 - 24
25 - 29
30 - 34
35 - 39
40 - 44
45 - 49
50 - 54
55 - 59
60 - 64
Participation and unemployment
Sources: RGPH, ENRE-SI and staff calculations
FEMALE MALE
Inactive
EmployedUnemployed
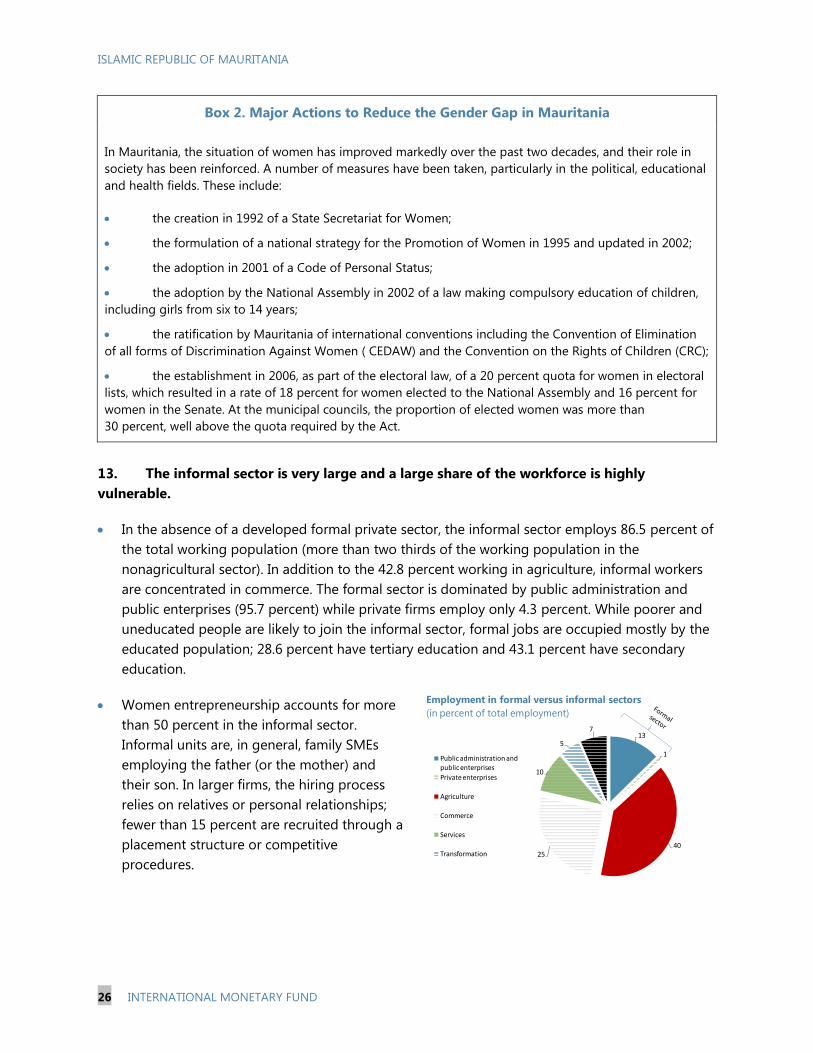
ISLAMIC REPUBLIC OF MAURITANIA
26 INTERNATIONAL MONETARY FUND
Box 2. Major Actions to Reduce the Gender Gap in Mauritania
In Mauritania, the situation of women has improved markedly over the past two decades, and their role in
society has been reinforced. A number of measures have been taken, particularly in the political, educational
and health fields. These include:
the creation in 1992 of a State Secretariat for Women;
the formulation of a national strategy for the Promotion of Women in 1995 and updated in 2002;
the adoption in 2001 of a Code of Personal Status;
the adoption by the National Assembly in 2002 of a law making compulsory education of children,
including girls from six to 14 years;
the ratification by Mauritania of international conventions including the Convention of Elimination
of all forms of Discrimination Against Women ( CEDAW) and the Convention on the Rights of Children (CRC);
the establishment in 2006, as part of the electoral law, of a 20 percent quota for women in electoral
lists, which resulted in a rate of 18 percent for women elected to the National Assembly and 16 percent for
women in the Senate. At the municipal councils, the proportion of elected women was more than
30 percent, well above the quota required by the Act.
13. The informal sector is very large and a large share of the workforce is highly
vulnerable.
In the absence of a developed formal private sector, the informal sector employs 86.5 percent of
the total working population (more than two thirds of the working population in the
nonagricultural sector). In addition to the 42.8 percent working in agriculture, informal workers
are concentrated in commerce. The formal sector is dominated by public administration and
public enterprises (95.7 percent) while private firms employ only 4.3 percent. While poorer and
uneducated people are likely to join the informal sector, formal jobs are occupied mostly by the
educated population; 28.6 percent have tertiary education and 43.1 percent have secondary
education.
Women entrepreneurship accounts for more
than 50 percent in the informal sector.
Informal units are, in general, family SMEs
employing the father (or the mother) and
their son. In larger firms, the hiring process
relies on relatives or personal relationships;
fewer than 15 percent are recruited through a
placement structure or competitive
procedures.
13
1
4025
10
5
7
Public administration and public enterprises
Private enterprises
Agriculture
Commerce
Services
Transformation
Employment in formal versus informal sectors
(in percent of total employment)

ISLAMIC REPUBLIC OF MAURITANIA
INTERNATIONAL MONETARY FUND 27
A large share of the workforce is not protected: 38 percent are unpaid, mostly working in family
businesses. Instability of jobs affects the 44 percent of workers (53 percent for women) who are
involved in seasonal or temporary jobs. Therefore, the unemployment rate could vary
substantially over the course of the year. More than 98 percent of workers in the informal sector
have no contract, and only 4 percent of workers
in the nonagricultural private sector are affiliated
to the social security system. Regarding the
motivations to create an informal unit,
57 percent of respondents said it was voluntary.
Being independent, increasing their income, or
simply familial tradition were the most common
reasons invoked.
Generally, wage setting is at the discretion of the
employer (60 percent of cases). Only 9 percent
of informal employees have fixed wages and
most of them are paid on a day to day or task basis.
Socio-demographic issues and challenges ahead
14. Mauritania is at the opening of a window of opportunity as working-age people
comprise an increasing share of its population. The fertility rate has been decreasing since the
beginning of the 1980s, although it remained high compared to North African countries. But this has
been compensated by lower infant mortality—the effect of substantial improvements in health
services—resulting in a stabilization of
population growth and age structure during
1980-2000.6 However, since the beginning of
the 2000s, the share of the working age
population has been increasing steadily,
reaching 52 percent in 2013, according to the
national population survey. This trend will be
sustained in the next decades; the working-age
population is expected to reach 60 percent in
2065 under the medium-fertility scenario,7 or
even sooner under the low-fertility scenario.
6 The stabilization of the age structure could be also explained by emigration of the labor force to neighboring and
Gulf countries.
7 For more details, see United Nations, World Population Prospects, 2012 Revision. Data for 2013 have been adjusted
to be in line with Mauritania’s 2013 population census.
76
96
44
98.3
38
0 50 100 150
Entrepreneurs and self employed
Not affiliated to social security (in % of
private non agricultural employment)
Non stable employment
No work contract
Non paid work
Measures of informal employment (in percent of total
employment in non agricuture informal sector)
20
30
40
50
60
70
80
1950
1960
1970
1980
1990
2000
2010
2020
2030
2040
2050
2060
2070
2080
2090
2100
15-64
15+
0-14
Working age population (In percent of total
population)
Sources: UN world population projections (revision 2012) et calculs du staff
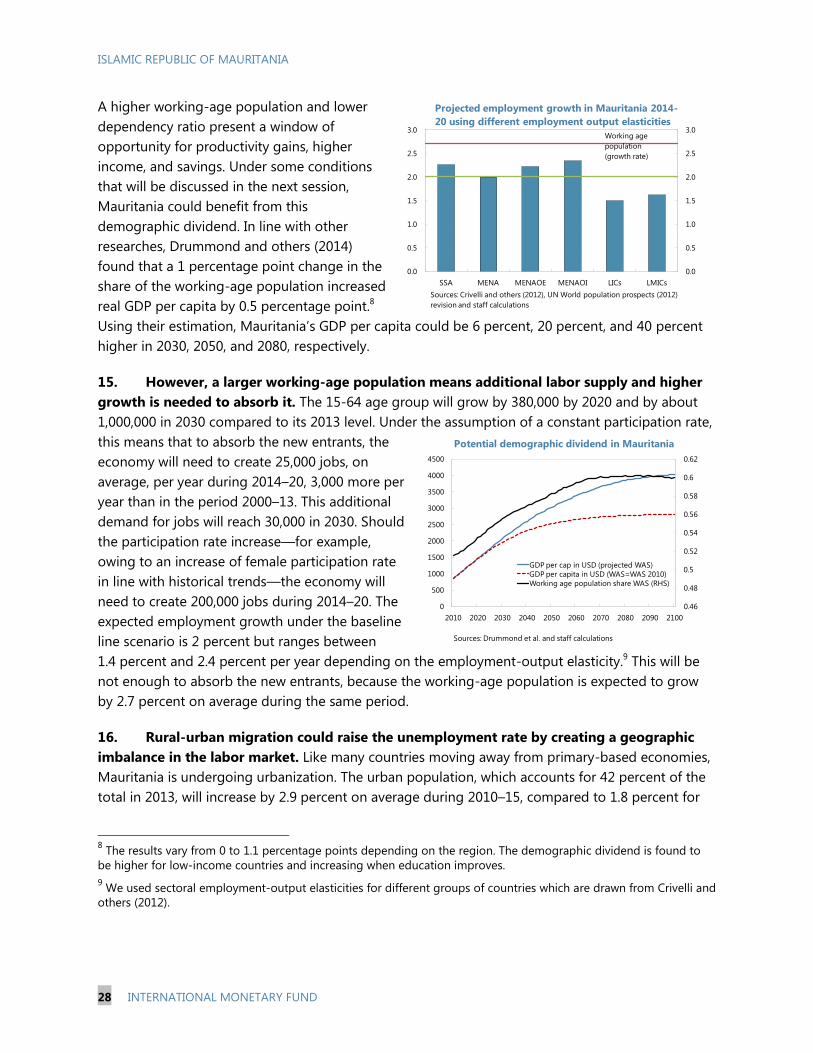
ISLAMIC REPUBLIC OF MAURITANIA
28 INTERNATIONAL MONETARY FUND
A higher working-age population and lower
dependency ratio present a window of
opportunity for productivity gains, higher
income, and savings. Under some conditions
that will be discussed in the next session,
Mauritania could benefit from this
demographic dividend. In line with other
researches, Drummond and others (2014)
found that a 1 percentage point change in the
share of the working-age population increased
real GDP per capita by 0.5 percentage point.8
Using their estimation, Mauritania’s GDP per capita could be 6 percent, 20 percent, and 40 percent
higher in 2030, 2050, and 2080, respectively.
15. However, a larger working-age population means additional labor supply and higher
growth is needed to absorb it. The 15-64 age group will grow by 380,000 by 2020 and by about
1,000,000 in 2030 compared to its 2013 level. Under the assumption of a constant participation rate,
this means that to absorb the new entrants, the
economy will need to create 25,000 jobs, on
average, per year during 2014–20, 3,000 more per
year than in the period 2000–13. This additional
demand for jobs will reach 30,000 in 2030. Should
the participation rate increase—for example,
owing to an increase of female participation rate
in line with historical trends—the economy will
need to create 200,000 jobs during 2014–20. The
expected employment growth under the baseline
line scenario is 2 percent but ranges between
1.4 percent and 2.4 percent per year depending on the employment-output elasticity.9 This will be
not enough to absorb the new entrants, because the working-age population is expected to grow
by 2.7 percent on average during the same period.
16. Rural-urban migration could raise the unemployment rate by creating a geographic
imbalance in the labor market. Like many countries moving away from primary-based economies,
Mauritania is undergoing urbanization. The urban population, which accounts for 42 percent of the
total in 2013, will increase by 2.9 percent on average during 2010–15, compared to 1.8 percent for
8 The results vary from 0 to 1.1 percentage points depending on the region. The demographic dividend is found to
be higher for low-income countries and increasing when education improves.
9 We used sectoral employment-output elasticities for different groups of countries which are drawn from Crivelli and
others (2012).
0.0
0.5
1.0
1.5
2.0
2.5
3.0
0.0
0.5
1.0
1.5
2.0
2.5
3.0
SSA MENA MENAOE MENAOI LICs LMICs
Projected employment growth in Mauritania 2014-
20 using different employment output elasticities
Sources: Crivelli and others (2012), UN World population prospects (2012)
revision and staff calculations
Working age
population
(growth rate)
0.46
0.48
0.5
0.52
0.54
0.56
0.58
0.6
0.62
0
500
1000
1500
2000
2500
3000
3500
4000
4500
2010 2020 2030 2040 2050 2060 2070 2080 2090 2100
GDP per cap in USD (projected WAS)
GDP per capita in USD (WAS=WAS 2010)
Working age population share WAS (RHS)
Potential demographic dividend in Mauritania
Sources: Drummond et al. and staff calculations

ISLAMIC REPUBLIC OF MAURITANIA
INTERNATIONAL MONETARY FUND 29
the rural population. The population of the capital city Nouakchott grew by 4.2 percent during
2000–13, almost twice the national growth rate, and it concentrates one third of the working age
population. More than 40 percent of the population of Nouadhibou—the mining and fishing city—
are natives of other regions. Very high poverty in the rural areas,10
high vulnerability owing to
frequent droughts, and lack of opportunity, are likely to accelerate the process of urbanization. In
early stages, urbanization is desirable in many countries, reducing poverty and increasing
agricultural productivity; however at some point, the absorption of workers’ flows by the urban area
will be more difficult and the geographical disequilibrium in the labor market will widen.
17. The economically active population remains relatively low-skilled, and education
policies results have been mixed.
Although 68 percent of the working-age population has had access to school, almost half did
not complete primary education and only 7 percent of males and 3.3 percent of women have
reached tertiary education.
The results of the different national development strategies of the education sector
(Programmes Nationaux de Développement du Secteur de l’Education) have been mixed.
Enrollment rates in primary and, to a lesser extent, in secondary schools improved since 2000.
However, completion rates are still low and the transition to tertiary education remains very
limited. First, this could be attributed to income constraints and the concentration of education
public services in some regions. Secondly, it could suggest low expected returns from education.
And finally, it could reflect a lower quality of education, that is, pupils have not acquired
sufficient skills to move to the next level.11
An ONS 2007 survey points out that a girl has only a
50 percent probability of becoming literate after six years of education. Respectively 17 and
18 percent of pupils succeed in the lower secondary level certificate and the baccalaureate. This
in turn reduces the efficiency of education spending.12
Gender inequalities diminished particularly for the primary level. Rural coverage has increased
reducing the substantial gap between regions that prevailed in the 1990s but remains important
for secondary and tertiary levels. Still, according to the EPCV 2008, significant disparities could
emerge when combining all these parameters i.e. gender, income level and region. In fact, a
rural girl belonging to the poorest 40 percent is three times less likely to complete primary
education than an urban boy from the richest 40 percent.
10
According to the ONS, poverty rate was 59 percent in rural areas in 2008 compared to 21 percent in urban ones.
11 Mauritania ranked 135 out 144 countries in terms of education quality in the World Economic Forum’s Global
Competitiveness Report 2014–15. The PNDSE 201120 points out that among other factors, the automatic transition
between primary and secondary level has lowered the overall qualifications of the students.
12 According to the PNDSE, the efficiency rate is 70 percent for the lower secondary school and 88 percent for the
upper one.
ISLAMIC REPUBLIC OF MAURITANIA
30 INTERNATIONAL MONETARY FUND
A private education system is growing rapidly. It accounts for 11 percent of primary school
students and more than 26 percent of secondary school students. This trend could reduce the
burden of education on the budget, but as the private sector develops, there is a risk of further
deterioration of the quality of public education because teachers could be attracted by higher
wages in the private sector.
Technical and vocational training, which is supposed to be the alternative for those who are not
able to continue or choose to quit the conventional education process, remain limited and
insufficient to meet the considerable demand. Only 6 percent of the new entrants in the labor
force have benefited from such training. Moreover, specialties seem to be inappropriate for the
labor market’s needs. Qualitative surveys show that private firms are generally dissatisfied with
the profiles they are hiring among this group.
D. Lessons from Other Countries’ Experiences and Recommendations
In the path toward a more sustainable and inclusive growth, structural reforms targeted at the demand
side, such as the diversification of the economy and the promotion of the role of the private sector (see
accompanying SIP on economic transformation), are essential. At the same time, more attention is
needed for the supply side. This includes the most efficient utilization of existing resources and the
reduction of employment vulnerability in the short term, and the development of human capital and
the gradual reduction of labor market inefficiencies in the medium to long term. Although there is no
one-size-fits-all approach, other countries’ experiences offer a large set of practical policies and
measures, some of which are active labor market policies (ALMP). We identified three interconnected
and complementary pillars that are of particular relevance for Mauritania. These are:
First pillar: Education, training, and employability
18. There is a consensus as to the impact of education on growth. The impact of education
on economic growth has been acknowledged by early literature on the role of human capital and
endogenous growth. Many channels have been identified notably the positive impact on labor
productivity, innovation, and transmission of skills, but also, in some cases, higher income and less
inequality. Hanushek and Wößmann (2007) suggest that each year of schooling boosts long-run
growth by 0.58 percentage points. Lustig and Lopez-Calva (2010) argue that education has been
key to reducing inequality in Brazil. Similarly, Hailu and Soares (2009) estimate that one-third of
the reduction in inequality is due to the effect of education.
19. Therefore, increasing access to education has been one of the highest priorities on the
development agenda in developing countries. Many, if not all, have embarked—most of the time
successfully—on a vast reform agenda aimed at increasing enrollment rates, especially in primary
school (education for all), while reducing gender and geographic inequalities. This effort has
resulted in a large increase in the number of schools and, more generally, in education spending.
With less evidence of success, conditional cash transfers were used to encourage people to send
their children to school. While the Bolsa Familia in Brazil has been relatively successful, evidence
from a similar program in Ghana (the Livelihood Empowerment Against Poverty) is more ambiguous

ISLAMIC REPUBLIC OF MAURITANIA
INTERNATIONAL MONETARY FUND 31
because there is no way of checking that the obligations have actually been met (Gbedemah and
others, 2010).
20. However, there is increasing—though still tentative—evidence that in addition to
quantity, education quality matters, especially in developing countries. Substantial differences
in education outcomes between countries have been highlighted. These differences were at first
attributed to diminishing marginal returns to schooling. Recent research, however, argues that they
could be explained by differences in the quality of education, that is, in the amount of cognitive
skills acquired after some years of schooling. Recent case studies in developing countries (Ghana,
Kenya, Morocco, Pakistan, South Africa, Tanzania) suggest that the returns on quality may be even
larger in developing countries than in developed countries.
21. Improving the quantity and quality of education does not necessarily imply additional
resources. Using a hybrid approach (parametric and nonparametric), Grigoli (2014) finds evidence of
large potential gains in enrollment rates in secondary education from improving efficiency,
especially in lower-income economies such as those in Africa. Where needed, a reallocation from
other public expenditures could be envisaged. More generally, reallocating education expenditure to
reduce student-to-teacher ratios (where these are high, for example, in rural regions) and improving
the quality of institutions could help improve the efficiency of education spending.
22. At the same time, better adapting the labor supply to the demand and supporting job
seekers in finding jobs is likely to improve education and training outcomes.
Education programs are to be tailored to better fit the employers’ needs and improve the
employability of the educated labor force. Skills mismatch could substantially reduce education
outcomes as they lead either to higher unemployment rate or underutilization of educated
people. In the first case, this may encourage students - especially poor- to leave school earlier,
reducing their ability to improve their condition. In the second, this will push the educated
workforce to informality or to low-skills jobs, ultimately reducing their productivity. This is typical
in many North African countries which experienced high unemployment rate among youth and
educated workforce while at the same time, many surveys point that enterprises complain about
the inadequacy of skills of job seekers. In such context, reforming the education programs may
be necessary (content, pedagogy) to better fit current private sector needs and future
development prospects.
Technical and vocational training could provide appropriate skills and better access to the job
market for early school leavers. Many technical vocational education and training (TVET) systems
fail because they focus on the needs of the formal economy. West African countries such as
Benin, Togo, Senegal, and Mali are restructuring TVET systems to incorporate traditional
apprenticeships, including certification mechanisms, while South Africa and Ethiopia are opening
their TVET systems to meet the informal economy’s needs. Experiments in Morocco, Benin, and
Cameroon underscore the need to associate social partners (employers and employees) in TVET
systems for the identification of jobs and for the development of appropriate training strategies
and methods.

ISLAMIC REPUBLIC OF MAURITANIA
32 INTERNATIONAL MONETARY FUND
Recommendations: Education is one of the priorities of the current government. As a matter of fact,
the President announced 2015 to be the year of education. What follows are a few suggestions that
could structure policy discussions:
Pursuing efforts to increase enrollment and attainment rates in primary school, with special
attention to the poor and girls: in this context, conditional cash transfers could be used, together
with efficient monitoring systems and adult literacy programs that are already in place could
also help increase awareness of the importance of education.
Improving the quality of education at basic levels and investing in infrastructure for the
secondary level (especially in the rural areas) could help increase enrollment rates beyond
primary school. Participating in international assessments tests (PISA, etc.) could be useful for
dynamic analysis.
Moving toward supply-driven education and
TVET programs; this consists in programs with
more empirical content13
(see PNDSE) and a focus
on promising fields with high future labor
demand. The latter objective may imply to entail
partnerships with stakeholders (mainly
employers) in designing the programs. TVET
system should focus more on the informal sector,
including agriculture-related training in rural
areas. Current workers could also benefit from
shorter time training. Finally, public spending on
TVET should be reinforced (it is currently
0.02 percent of GDP).
Reinforcing the role of Agence Nationale de Promotion de l’Emploi des Jeunes in smoothing the
transition to work by supporting job seekers over a broader geographical area, and by greater
coordination with the private sector. Currently, placement rates are satisfactory (61.5 percent)
but vary substantially by gender (only 31 percent for women compared to 64 percent for men)
and across regions (65 percent in urban regions compared to 28 percent in rural).
Regarding financing, there is room to better target public expenditures (subsidies and other
social transfers), introducing gradually conditional cash transfers where public services are
available, better targeting of education spending by setting geographical priorities, linking
education to other development strategies with external financing, and involving the private
sector in financing the reform of the TVET system.
13
For example, by promoting dual vocational education and training that combines workplace experience and
training with school-based (vocational) education, usually within a particular occupation or sector of work.
0
2
4
6
8
10
12
14
16
18
20
0
1
2
3
4
5
6
MRT LIC LMI EMDC SSA Factor
Driven
In percent of GDP In percent of government expenditure (RHS)
Public Spending on Education(2013 or latest available)
Sources: National authorities and World Bank's World Development Indicators.
ISLAMIC REPUBLIC OF MAURITANIA
INTERNATIONAL MONETARY FUND 33
Second pillar: Female participation and gender equality
23. Increasing female participation could help achieve higher and more inclusive growth.
Higher female participation would be an important component of the demographic dividend.
Higher female participation rates are estimated to have accounted for about a third of East Asia’s
high per capita growth rates in the period between 1965 and 1990 (Bloom and Williamson, 1998).
More recent studies find significant macroeconomic gains from increasing FLFPR. Aguirre and others
(2012) estimate that raising FLFPR to country-specific male level would increase GDP by 12 percent
and 34 percent in the United Arab Emirates and in Egypt, respectively. International experience also
indicates that getting women into jobs is associated with poverty reduction. It has found for
example that in countries with low levels of female employment, families often under-invest in girls’
education with important externalities on children’s nutrition and education outcomes. Lastly,
increasing FLFP may also increase competitiveness, and thus growth, by reducing labor costs. Using
a general equilibrium model for South Mediterranean countries Tsani and others (2012) suggest that
removing barriers to female participation could lead to lower real wages, higher competitiveness,
and higher growth. Their simulation results show that, in Tunisia for example, a 2.5 percentage point
increase of the FLFPR during 2015–30 will reduce real wages by 4.25—percentage points and
increase GDP growth by 1.75 percentage point.
24. Female participation is hindered by social, legal, and economic obstacles. Unequal
access to education, high fertility rates, conservative social norms, notably related to the traditional
intra-household division of labor which implies that women do most household work, restrictive
legislation and even a hostile environment in some countries, curtail women’s opportunities to
engage in formal employment in many parts of the world. Within the MENA region, the lack of
opportunities or long queuing in the public sector, the difficulty of finding private employment, and
the sizable gender wage gap in both sectors lead many women to decide not to enter the
workforce. The resulting low FLPF has serious consequences for the economy as a whole, because
potential productivity gains and economic growth are sacrificed when a large part of the labor force
is discouraged from working.
25. Even when FLFPR is high, the potential of women is often underutilized or underpaid.
In some developing countries, the female participation rate is high; however, most of the time, they
are confined to low-productivity jobs in agriculture, housework, or public services that have no
career development prospects and are regarded as a natural extension of their traditional role in
society (education, health). High poverty is often associated with high FLFP, as working is a
necessity. Lastly, women are generally paid less than men, which makes them attractive for
enterprises looking for unskilled, cheap labor.
26. Public policy could help overcome the social norms (see IMF SDN/13/10). Fiscal policy
plays an important role in encouraging women’s participation. Bangladesh prepared a gender-
responsive budget in 2005. More specifically, fiscal measures to better reconcile work and family life

ISLAMIC REPUBLIC OF MAURITANIA
34 INTERNATIONAL MONETARY FUND
include (i) making child care available and affordable e.g. by providing child care subsidies for
working mothers, (ii) publicly financed parental leave schemes which guarantee that women can
return to their jobs,14
(iii) flexible work arrangements or part-time jobs, and (iv) increasing
expenditure in rural infrastructure, for example, by making clean water more accessible and
improving transportation systems, can reduce the time women spend on domestic tasks and
facilitate their access to markets. Linking child and family benefits to female labor force participation
could be envisaged. Other policies aimed at promoting women’s entrepreneurship include
improving access to resources, especially for rural women, such as education, land, and credit.
Recommendations: As stated in previous sections, many measures have been undertaken by the
government to help fill the gender gap. To complement them, we suggest the following actions:
Ensuring equal opportunities in education at all levels and in all regions (first pillar).
Gender mainstreaming in budget and public policy formulation: the ongoing Public Investment
Management Support Project 2014–16 with the African Development Bank will give more
detailed and technical recommendations on how to include gender considerations in public
investment programs and in the planning, and monitoring and evaluation of public policies. This
applies for all development policies, sectoral strategies, etc.
Adopting active labor market policies to reduce unemployment, notably but not only among
highly educated women, including measures to promote both employment and
entrepreneurship. The gender-neutral policies described in the first pillar remain valid, but some
specific actions could be considered, such as a system of preferences—like in affirmative action
policy—for public hiring programs, and vocational training.
Helping women reconcile work and family so as to facilitate labor market participation, such as
providing affordable public child care and preschool; currently, fewer than 10 percent of children
have access to such services in Mauritania. In addition, maternity leave, flexible work
arrangements and part-time jobs should be encouraged; the labor code15
increased maternity
leave to 14 weeks, eight of these for the period after the delivery, with some flexibility within the
pregnancy and nursing period. Further extension of maternity leave could be envisaged, with
care to not create disincentives to hiring women by increasing the costs associated with their
employment. Among rural women, the fertility rate is still high, calling for redoubled efforts with
information and advocacy campaigns. Investment in health and infrastructure (water, electricity,
transport) and easier access to land and financing will help bring women into the economy.
14
This is the case in Brazil, where maternity benefits policies include 120 days of paid leave at 100 percent of their
salary, which is paid by the employer but reimbursed by Brazil’s Social Security Institute. An additional 60 days
allowance that can be provided by employers is tax-deductible. 15
Act No. N° 2004-015 to establish a Labour Code (Loi N° 2004-015 du 6 juillet 2004 portant Code du travail), dated
July 6, 2004.
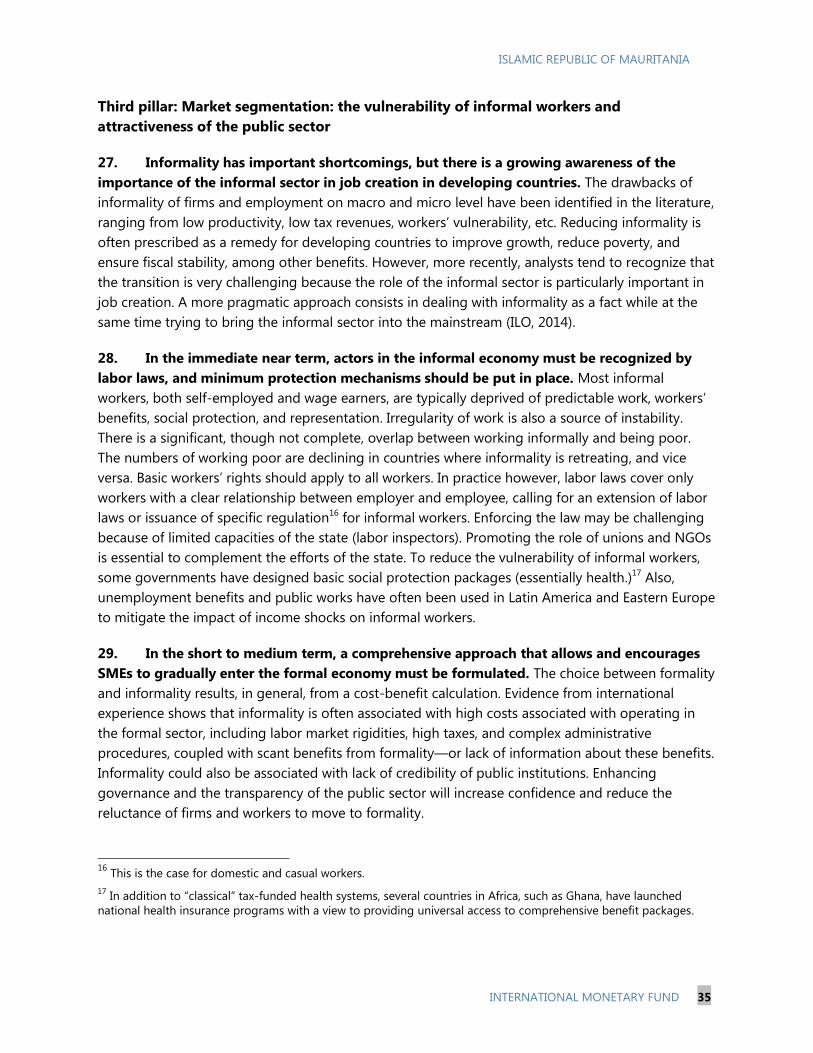
ISLAMIC REPUBLIC OF MAURITANIA
INTERNATIONAL MONETARY FUND 35
Third pillar: Market segmentation: the vulnerability of informal workers and
attractiveness of the public sector
27. Informality has important shortcomings, but there is a growing awareness of the
importance of the informal sector in job creation in developing countries. The drawbacks of
informality of firms and employment on macro and micro level have been identified in the literature,
ranging from low productivity, low tax revenues, workers’ vulnerability, etc. Reducing informality is
often prescribed as a remedy for developing countries to improve growth, reduce poverty, and
ensure fiscal stability, among other benefits. However, more recently, analysts tend to recognize that
the transition is very challenging because the role of the informal sector is particularly important in
job creation. A more pragmatic approach consists in dealing with informality as a fact while at the
same time trying to bring the informal sector into the mainstream (ILO, 2014).
28. In the immediate near term, actors in the informal economy must be recognized by
labor laws, and minimum protection mechanisms should be put in place. Most informal
workers, both self-employed and wage earners, are typically deprived of predictable work, workers’
benefits, social protection, and representation. Irregularity of work is also a source of instability.
There is a significant, though not complete, overlap between working informally and being poor.
The numbers of working poor are declining in countries where informality is retreating, and vice
versa. Basic workers’ rights should apply to all workers. In practice however, labor laws cover only
workers with a clear relationship between employer and employee, calling for an extension of labor
laws or issuance of specific regulation16
for informal workers. Enforcing the law may be challenging
because of limited capacities of the state (labor inspectors). Promoting the role of unions and NGOs
is essential to complement the efforts of the state. To reduce the vulnerability of informal workers,
some governments have designed basic social protection packages (essentially health.)17
Also,
unemployment benefits and public works have often been used in Latin America and Eastern Europe
to mitigate the impact of income shocks on informal workers.
29. In the short to medium term, a comprehensive approach that allows and encourages
SMEs to gradually enter the formal economy must be formulated. The choice between formality
and informality results, in general, from a cost-benefit calculation. Evidence from international
experience shows that informality is often associated with high costs associated with operating in
the formal sector, including labor market rigidities, high taxes, and complex administrative
procedures, coupled with scant benefits from formality—or lack of information about these benefits.
Informality could also be associated with lack of credibility of public institutions. Enhancing
governance and the transparency of the public sector will increase confidence and reduce the
reluctance of firms and workers to move to formality.
16
This is the case for domestic and casual workers.
17 In addition to “classical” tax-funded health systems, several countries in Africa, such as Ghana, have launched
national health insurance programs with a view to providing universal access to comprehensive benefit packages.
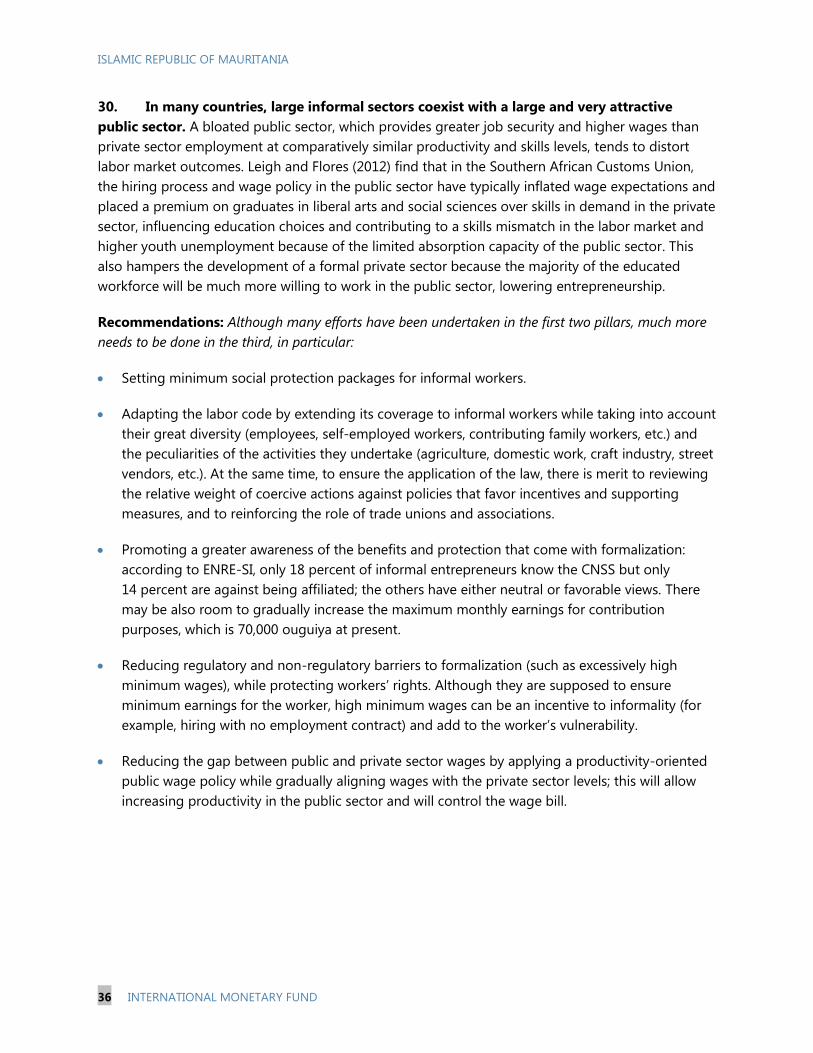
ISLAMIC REPUBLIC OF MAURITANIA
36 INTERNATIONAL MONETARY FUND
30. In many countries, large informal sectors coexist with a large and very attractive
public sector. A bloated public sector, which provides greater job security and higher wages than
private sector employment at comparatively similar productivity and skills levels, tends to distort
labor market outcomes. Leigh and Flores (2012) find that in the Southern African Customs Union,
the hiring process and wage policy in the public sector have typically inflated wage expectations and
placed a premium on graduates in liberal arts and social sciences over skills in demand in the private
sector, influencing education choices and contributing to a skills mismatch in the labor market and
higher youth unemployment because of the limited absorption capacity of the public sector. This
also hampers the development of a formal private sector because the majority of the educated
workforce will be much more willing to work in the public sector, lowering entrepreneurship.
Recommendations: Although many efforts have been undertaken in the first two pillars, much more
needs to be done in the third, in particular:
Setting minimum social protection packages for informal workers.
Adapting the labor code by extending its coverage to informal workers while taking into account
their great diversity (employees, self-employed workers, contributing family workers, etc.) and
the peculiarities of the activities they undertake (agriculture, domestic work, craft industry, street
vendors, etc.). At the same time, to ensure the application of the law, there is merit to reviewing
the relative weight of coercive actions against policies that favor incentives and supporting
measures, and to reinforcing the role of trade unions and associations.
Promoting a greater awareness of the benefits and protection that come with formalization:
according to ENRE-SI, only 18 percent of informal entrepreneurs know the CNSS but only
14 percent are against being affiliated; the others have either neutral or favorable views. There
may be also room to gradually increase the maximum monthly earnings for contribution
purposes, which is 70,000 ouguiya at present.
Reducing regulatory and non-regulatory barriers to formalization (such as excessively high
minimum wages), while protecting workers’ rights. Although they are supposed to ensure
minimum earnings for the worker, high minimum wages can be an incentive to informality (for
example, hiring with no employment contract) and add to the worker’s vulnerability.
Reducing the gap between public and private sector wages by applying a productivity-oriented
public wage policy while gradually aligning wages with the private sector levels; this will allow
increasing productivity in the public sector and will control the wage bill.
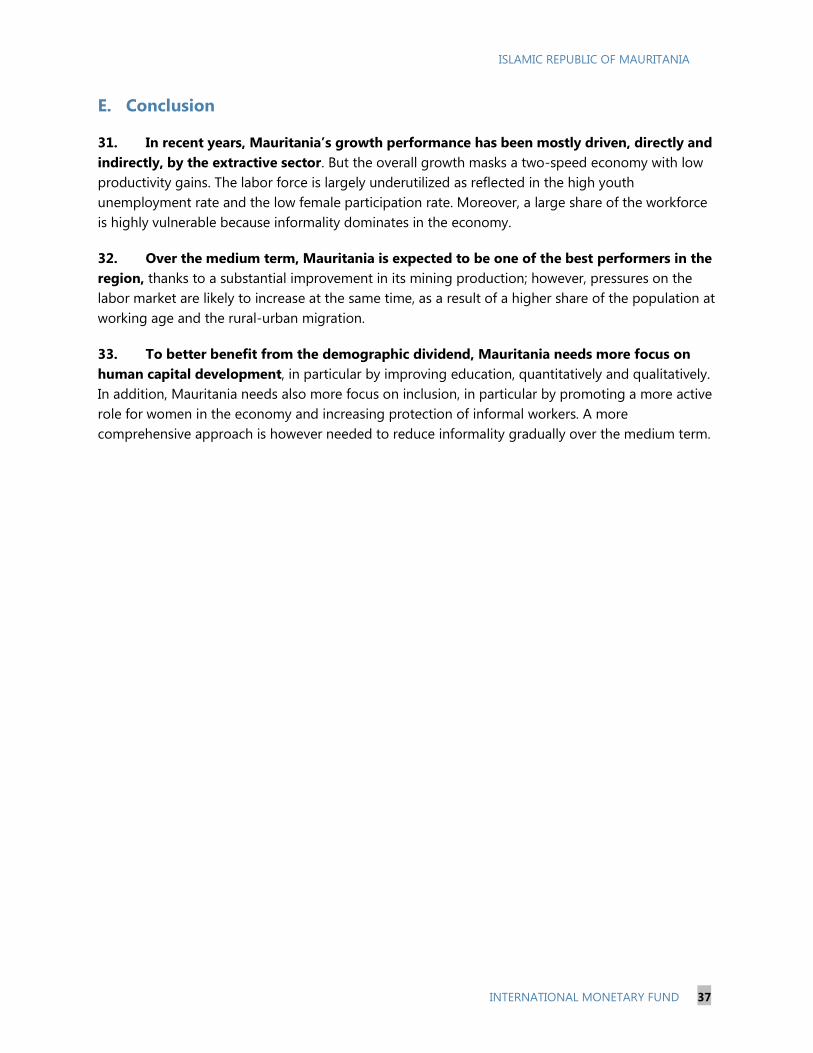
ISLAMIC REPUBLIC OF MAURITANIA
INTERNATIONAL MONETARY FUND 37
E. Conclusion
31. In recent years, Mauritania’s growth performance has been mostly driven, directly and
indirectly, by the extractive sector. But the overall growth masks a two-speed economy with low
productivity gains. The labor force is largely underutilized as reflected in the high youth
unemployment rate and the low female participation rate. Moreover, a large share of the workforce
is highly vulnerable because informality dominates in the economy.
32. Over the medium term, Mauritania is expected to be one of the best performers in the
region, thanks to a substantial improvement in its mining production; however, pressures on the
labor market are likely to increase at the same time, as a result of a higher share of the population at
working age and the rural-urban migration.
33. To better benefit from the demographic dividend, Mauritania needs more focus on
human capital development, in particular by improving education, quantitatively and qualitatively.
In addition, Mauritania needs also more focus on inclusion, in particular by promoting a more active
role for women in the economy and increasing protection of informal workers. A more
comprehensive approach is however needed to reduce informality gradually over the medium term.
ISLAMIC REPUBLIC OF MAURITANIA
38 INTERNATIONAL MONETARY FUND
References
Aguirre, DeAnne, and others, 2012, “Empowering the Third Billion. Women and the World of Work in
2012,” Booz and Company.
Bloom, D. E., and J. G. Williamson, 1998, “Demographic Transitions and Economic Miracles in
Emerging Asia,” World Bank Economic Review, vol. 12, No. 3, pp. 419-456.
Drummond, P., V. Thakoor, and S. Yu, 2014, “Africa Rising: Harnessing the Demographic Dividend,”
IMF Working Paper WP/14/143 (Washington: International Monetary Fund).
Hall, Robert E. and Charles I. Jones, 1999, “Why Do Some Countries Produce So Much More Output
per Worker than Others?” Quarterly Journal of Economics, Vol. 114, No. 1, pp. 83–116 (New York,
New York: Oxford University Press)
Hanushek, E. A. and L. Woßmann, 2007, “Education Quality and Economic Growth,” (Washington, DC:
World Bank).
Gbedemah, C., N. Jones, and P. Pereznieto, “Gendered Risks, Poverty and Vulnerability in Ghana: is
the LEAP Cash Transfer Programme Making a Difference?” Project Briefing no 52, Overseas
Development Institute, London.
Grigoli, Francesco, 2014, “A Hybrid Approach to Estimating the Efficiency of Public Spending on
Education in Emerging and Developing Countries,” IMF Working Paper 14/19 (Washington:
International Monetary Fund).
ILO, 2014, “Transitioning to Formality,” International Labor Conference 103rd
session (Geneva:
International Labor Organization).
IMF, 2013, “Women, Work, and the Economy: Macroeconomic Gains from Gender Equity”, Staff
Discussion Notes, No. 13/10, International Monetary Fund, Washington DC.
———, 2013c, “Jobs and Growth: Analytical and Operational Considerations for the Fund,” IMF
Policy Paper (Washington).
Leigh, L., and I. Flores, 2012, Closing the Jobs Gap in the Southern Africa Customs Union Region, IMF
Country Report No. 12/235 (Washington: International Monetary Fund).
Lopez-Calva, L. F., and N. Lustig (Eds.), Declining Inequality in Latin America: A Decade of Progress?
(Washington, D.C.: Brookings Institution and UNDP).
Office Nationale de Statistiques, 2012, Enquête Nationale de Référence sur l’Emploi et le Secteur
Informel, Mauritanie.
ISLAMIC REPUBLIC OF MAURITANIA
INTERNATIONAL MONETARY FUND 39
”Programme National de Développement du Secteur Educatif 2011-2020 (PNDSE II), Plan d’Action
Triennal (2012-14),” Version May 2011.
Tsani, S., L. Paroussos, C. Fragiadakis, I. Charalambidis, and P. Capros, 2012, “Female Labour Force
Participation and Economic Development in Southern Mediterranean Countries: What Scenarios
for 2030?” MEDPRO Technical Report No. 19 (Brussels: Mediterranean Prospects).

ISLAMIC REPUBLIC OF MAURITANIA
40 INTERNATIONAL MONETARY FUND
STRUCTURAL REFORMS AND ECONOMIC
DIVERSIFICATION FOR MORE INCLUSIVE GROWTH IN
MAURITANIA1
Mauritania envisages boosting economic growth and its inclusiveness through structural reforms and
economic diversification. While Mauritania has made great advances in the areas of macroeconomic
performance, advances in structural reforms have lagged behind. This paper examines, based on other
countries’ experiences, the type of structural reforms and economic diversification that could boost and
sustain growth for Mauritania. It finds that yielding higher growth rates would require increases in
total factor productivity through banking sector reforms geared at financial stability, investment in
human capital, improving the business climate, strengthening the efficiency of public investment,
improving governance and institutions, and developing a well-targeted export promotion strategy.
A. Introduction
1. Mauritania has achieved several milestones in terms of macroeconomic performance
and advances in the structural reform area. Not only the economy has benefited from high
growth performance supported by responsible macro policies and high commodity prices; but also
from structural reforms that started in the 1990s identifying the need to create a supportive
business environment for private sector development.
In the 1990s, reforms such as trade liberalization, exchange rate reforms, state owned enterprise
(SOE) reform, and privatization were identified as priorities.
In the mid-2000s, the focus of reforms priorities shifted to the financial sector, capacity building
and governance. A broad reform of the financial sector reform was envisaged to deepen
financial intermediation and improve the functioning of the banking system. Key measures
included the gradual correction of the high degree of credit concentration, improvements in
supervision, a clean-up of commercial banks’ balance sheets, and modernization of the
payments system.
In the late 2000s, reform emphasis was geared towards improving fiscal governance, monitoring
and control of budget execution and civil service reform. The latest ECF program (2010-13),
while calling for accelerated structural reforms to spur growth and foster private sector
development, focused on fiscal reforms to promote fiscal consolidation, on a multi-pronged
banking sector reform to support financial stability, on reducing cost of doing business and
improving competitiveness.
1 Prepared by Aminata Touré.

ISLAMIC REPUBLIC OF MAURITANIA
INTERNATIONAL MONETARY FUND 41
Episodes of achievements and advances were also followed by episodes of relaxation of reforms
amidst substantial political instability and external shocks; both having a negative impact on
compounding reforms. Going forward, efforts to consolidate macroeconomic stability are to be
accompanied by a comprehensive structural reform agenda to support economic diversification and
job creation, ultimately aiming at poverty reduction and improving living conditions.
2. This paper explores the structural reforms needed to accelerate and sustain
Mauritania’s economic growth and enhance its inclusiveness. Section A presents the consensus
in the literature on the roles of structural reforms implementation in boosting higher growth
economic and that of diversification in sustaining higher long run economic growth. Section B
gauges the impact of selected reforms on productivity growth, based on the results of cross-country
empirical analysis. Section C assesses the potential benefits of economic diversification for
Mauritania in the long term-run, also based on similar countries’ experiences. Section D concludes
by proposing an agenda of high-priority structural reforms for Mauritania.
B. Structural Reforms and Diversification for Enhancing Growth and Inclusiveness
3. Structural reforms help remove obstacles to a more efficient allocation of resources
and a higher growth. There is broad consensus that structural reforms—together with
improvements in institutional quality—create the conditions needed for better resource allocation,
greater productivity, and faster income convergence. Both theory and recent empirical work argue
that structural transformation—the dynamic reallocation of resources from less to more productive
sectors—is a key ingredient of economic development. In addition, as noted in IMF (2014), structural
reforms have led to diversification in exports and domestic production that, in turn, has been
conducive to faster economic growth and lower output volatility in low-income countries (LICs).
4. Sustaining growth. There is broad consensus that the following structural reforms are
important components of an overall strategy for raising incomes and sustaining economic growth:
Reducing rigidities in product and factor markets;
Liberalizing FDI;
Developing financial systems; and
Enhancing international trade.
The literature has also found evidence that sustaining growth is positively correlated with
macroeconomic stability, the degree of equality of the income distribution, democratic institutions,
and economic openness (higher propensities to export manufactures, greater openness to FDI, and
avoidance of exchange rate overvaluation).
5. Quality of institutions. In addition to structural reforms, sound economic institutions that
promote competition, entrepreneurship and innovation have been found to increase productivity
growth at the cross-country, industry, and firm levels. At the same time, political economy literature
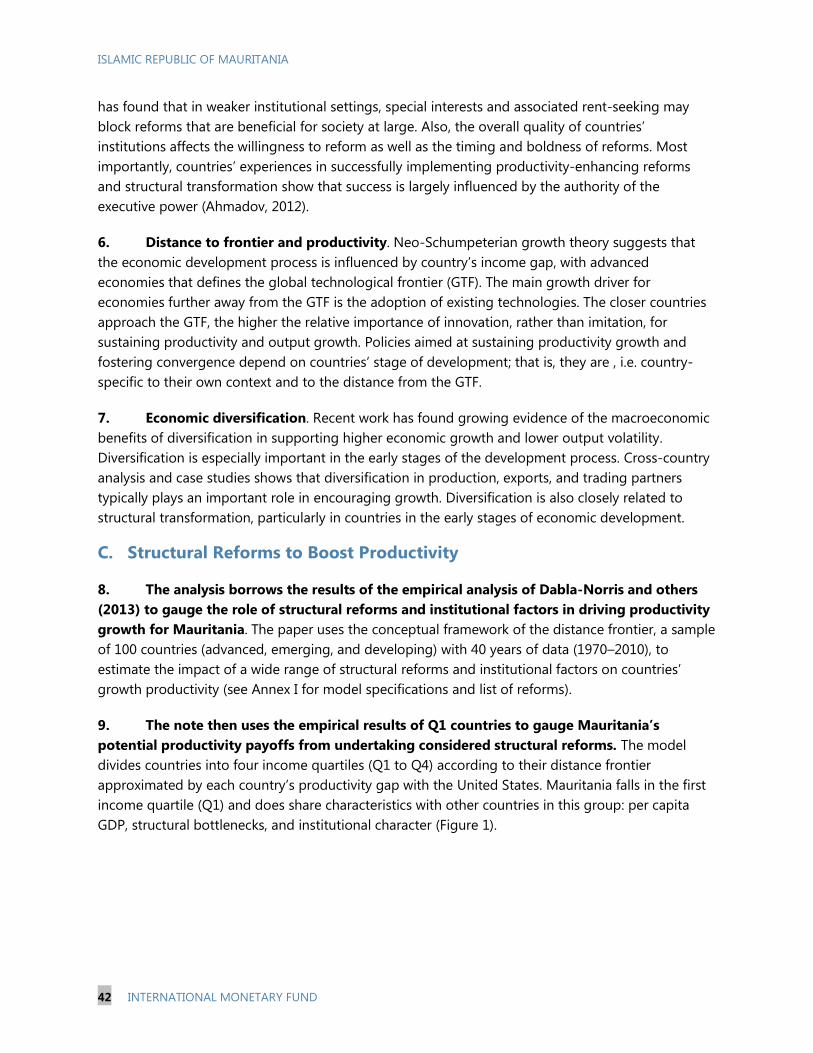
ISLAMIC REPUBLIC OF MAURITANIA
42 INTERNATIONAL MONETARY FUND
has found that in weaker institutional settings, special interests and associated rent-seeking may
block reforms that are beneficial for society at large. Also, the overall quality of countries’
institutions affects the willingness to reform as well as the timing and boldness of reforms. Most
importantly, countries’ experiences in successfully implementing productivity-enhancing reforms
and structural transformation show that success is largely influenced by the authority of the
executive power (Ahmadov, 2012).
6. Distance to frontier and productivity. Neo-Schumpeterian growth theory suggests that
the economic development process is influenced by country’s income gap, with advanced
economies that defines the global technological frontier (GTF). The main growth driver for
economies further away from the GTF is the adoption of existing technologies. The closer countries
approach the GTF, the higher the relative importance of innovation, rather than imitation, for
sustaining productivity and output growth. Policies aimed at sustaining productivity growth and
fostering convergence depend on countries’ stage of development; that is, they are , i.e. country-
specific to their own context and to the distance from the GTF.
7. Economic diversification. Recent work has found growing evidence of the macroeconomic
benefits of diversification in supporting higher economic growth and lower output volatility.
Diversification is especially important in the early stages of the development process. Cross-country
analysis and case studies shows that diversification in production, exports, and trading partners
typically plays an important role in encouraging growth. Diversification is also closely related to
structural transformation, particularly in countries in the early stages of economic development.
C. Structural Reforms to Boost Productivity
8. The analysis borrows the results of the empirical analysis of Dabla-Norris and others
(2013) to gauge the role of structural reforms and institutional factors in driving productivity
growth for Mauritania. The paper uses the conceptual framework of the distance frontier, a sample
of 100 countries (advanced, emerging, and developing) with 40 years of data (1970–2010), to
estimate the impact of a wide range of structural reforms and institutional factors on countries’
growth productivity (see Annex I for model specifications and list of reforms).
9. The note then uses the empirical results of Q1 countries to gauge Mauritania’s
potential productivity payoffs from undertaking considered structural reforms. The model
divides countries into four income quartiles (Q1 to Q4) according to their distance frontier
approximated by each country’s productivity gap with the United States. Mauritania falls in the first
income quartile (Q1) and does share characteristics with other countries in this group: per capita
GDP, structural bottlenecks, and institutional character (Figure 1).

ISLAMIC REPUBLIC OF MAURITANIA
INTERNATIONAL MONETARY FUND 43
10. Mauritania’s recent growth acceleration has not been fueled by productivity gains.
Learning from other comparator countries’ experiences, where growth dynamics have been fueled
by productivity gains, could inform on which reforms are likely to boost Mauritania’s productivity.
ZAF
BOL
DOM
ECU
SLV
GTM
HND
PRY
PER
JAM
IRQ
JOR
SYR
EGY
YEMBGD
KHM
LKA
IND
IDN
LAO
NPL
PAK
PHL
VNM
BDI
CMR
CAF
COG
COD
BENGMB
GHACIV
KENLSO
LBR
MWI
MLI
MRT
MAR
MOZ
NER
ZWE
RWA
SEN
SLE
NAM
SDN
TZATGOUGA
ZMB
ARM
ALB
KGZ
MDA
TJK
CHN
UKR
MNG
0.051
0.00
0.02
0.04
0.06
0.08
0.10
0.12
0.14
0.16
0.18
Figure 1. Selected Countries Relative GDP
(With respect to United States)
Source: Dabla-Norris and ohers, 2013.
Q2
Q1
-4.5
-4.0
-3.5
-3.0
-2.5
-2.0
-1.5
-1.0
-0.5
0.0
0.5
1.0
1981-85 1986-89 1990-95 1996-99 2000-05 2006-11
Figure 2. Mauritania TFP Growth, 1981-2011(In percent)
Source: IMF, Dabla-Norris and others, 2013.
-2.5
-2.0
-1.5
-1.0
-0.5
0.0
0.5
1.0
1.5
2.0
MRT Q1 Q2
1980-89
1990-99
2000-11
Figure 3. Mauritania and Selected Comparators:
TFP Growth, 1980-2011(In percent)
Source: IMF, Dabla-Norris and others, 2013.
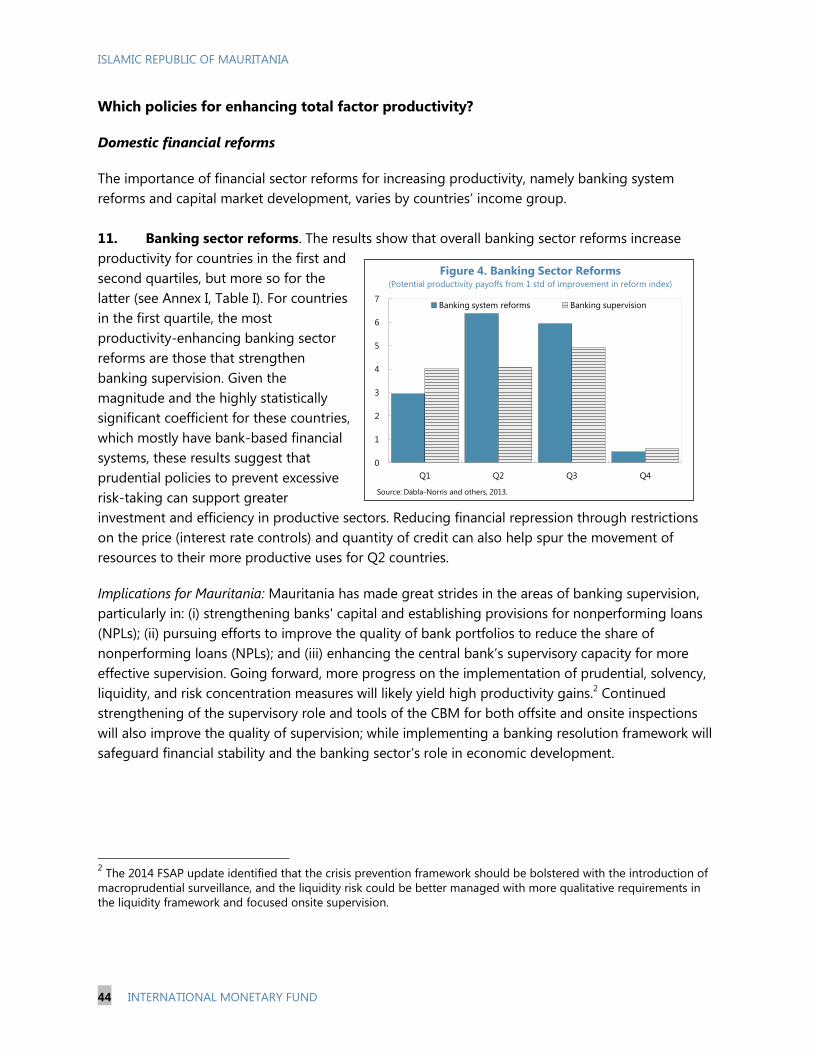
ISLAMIC REPUBLIC OF MAURITANIA
44 INTERNATIONAL MONETARY FUND
Which policies for enhancing total factor productivity?
Domestic financial reforms
The importance of financial sector reforms for increasing productivity, namely banking system
reforms and capital market development, varies by countries’ income group.
11. Banking sector reforms. The results show that overall banking sector reforms increase
productivity for countries in the first and
second quartiles, but more so for the
latter (see Annex I, Table I). For countries
in the first quartile, the most
productivity-enhancing banking sector
reforms are those that strengthen
banking supervision. Given the
magnitude and the highly statistically
significant coefficient for these countries,
which mostly have bank-based financial
systems, these results suggest that
prudential policies to prevent excessive
risk-taking can support greater
investment and efficiency in productive sectors. Reducing financial repression through restrictions
on the price (interest rate controls) and quantity of credit can also help spur the movement of
resources to their more productive uses for Q2 countries.
Implications for Mauritania: Mauritania has made great strides in the areas of banking supervision,
particularly in: (i) strengthening banks' capital and establishing provisions for nonperforming loans
(NPLs); (ii) pursuing efforts to improve the quality of bank portfolios to reduce the share of
nonperforming loans (NPLs); and (iii) enhancing the central bank’s supervisory capacity for more
effective supervision. Going forward, more progress on the implementation of prudential, solvency,
liquidity, and risk concentration measures will likely yield high productivity gains.2 Continued
strengthening of the supervisory role and tools of the CBM for both offsite and onsite inspections
will also improve the quality of supervision; while implementing a banking resolution framework will
safeguard financial stability and the banking sector’s role in economic development.
2 The 2014 FSAP update identified that the crisis prevention framework should be bolstered with the introduction of
macroprudential surveillance, and the liquidity risk could be better managed with more qualitative requirements in
the liquidity framework and focused onsite supervision.
0
1
2
3
4
5
6
7
Q1 Q2 Q3 Q4
Banking system reforms Banking supervision
Figure 4. Banking Sector Reforms(Potential productivity payoffs from 1 std of improvement in reform index)
Source: Dabla-Norris and others, 2013.
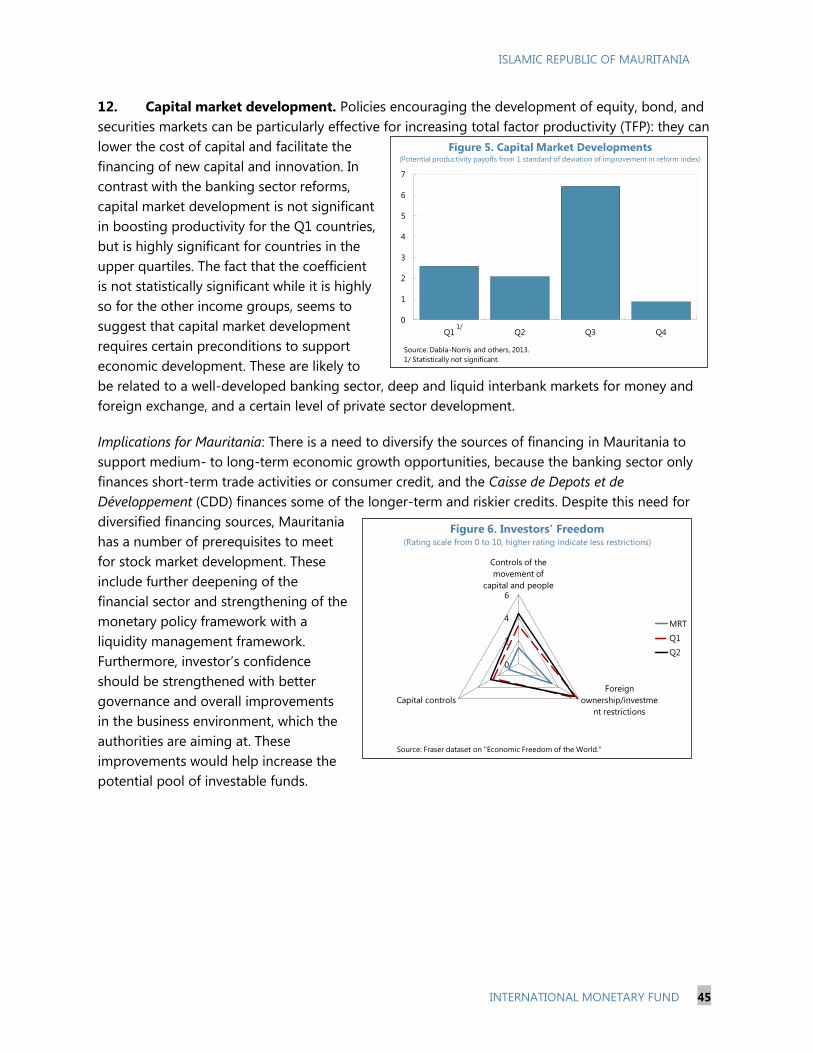
ISLAMIC REPUBLIC OF MAURITANIA
INTERNATIONAL MONETARY FUND 45
12. Capital market development. Policies encouraging the development of equity, bond, and
securities markets can be particularly effective for increasing total factor productivity (TFP): they can
lower the cost of capital and facilitate the
financing of new capital and innovation. In
contrast with the banking sector reforms,
capital market development is not significant
in boosting productivity for the Q1 countries,
but is highly significant for countries in the
upper quartiles. The fact that the coefficient
is not statistically significant while it is highly
so for the other income groups, seems to
suggest that capital market development
requires certain preconditions to support
economic development. These are likely to
be related to a well-developed banking sector, deep and liquid interbank markets for money and
foreign exchange, and a certain level of private sector development.
Implications for Mauritania: There is a need to diversify the sources of financing in Mauritania to
support medium- to long-term economic growth opportunities, because the banking sector only
finances short-term trade activities or consumer credit, and the Caisse de Depots et de
Développement (CDD) finances some of the longer-term and riskier credits. Despite this need for
diversified financing sources, Mauritania
has a number of prerequisites to meet
for stock market development. These
include further deepening of the
financial sector and strengthening of the
monetary policy framework with a
liquidity management framework.
Furthermore, investor’s confidence
should be strengthened with better
governance and overall improvements
in the business environment, which the
authorities are aiming at. These
improvements would help increase the
potential pool of investable funds.
0
1
2
3
4
5
6
7
Q1 Q2 Q3 Q4
Figure 5. Capital Market Developments(Potential productivity payoffs from 1 standard of deviation of improvement in reform index)
Source: Dabla-Norris and others, 2013.
1/ Statistically not significant.
1/
0
2
4
6
Controls of the
movement of
capital and people
Foreign
ownership/investme
nt restrictions
Capital controls
Figure 6. Investors' Freedom(Rating scale from 0 to 10, higher rating indicate less restrictions)
MRT
Q1
Q2
Source: Fraser dataset on "Economic Freedom of the World."

ISLAMIC REPUBLIC OF MAURITANIA
46 INTERNATIONAL MONETARY FUND
Real sector reforms
13. Trade and FDI liberalization. Barriers to international trade and foreign investment are
detrimental to productivity growth.
Reducing trade barriers. The economic literature has consistently found that more open
economies have experienced higher
growth (Wacziard and Welch, 2008). The
empirical results suggest that reducing
trade barriers is highly beneficial in raising
TFP for Q1 countries (Figure 7). Tariff and
nontariff barriers prevent efficient
allocation of resources and technology
transfer. The removal of nontariff barriers
that limit regional integration can prompt
agricultural productivity growth (Tombe,
2012).
Implications for Mauritania: As the
authorities take steps to increase the value-
added chain in agriculture and farming sectors to develop an exporting industry, they should be
taking steps to reduce nontariff and other regulatory trade barriers (Figures 8a–8b). When compared
to Q1 and Q2 countries, Mauritania compares favorably for tariffs barriers but not so well on
nontariff barriers and ease of imports and exports (costs and time). Reducing these barriers through
an improved business environment, could help open up new markets, facilitate export
diversification, and improve the sectoral efficiency of the exporting industries. These would benefit
from market access and deeper trade integration, cheaper imported inputs, and more robust
competition.
-2
-1
0
1
2
3
4
5
Q1 Q2 Q3 Q4
Trade (tariff rates) FDI liberalization
Figure 7. Trade and FDI Liberalization(Potential productivity payoffs from 1 std of improvement in reform index)
Source: Dabla-Norris and others, 2013.
1/ FDI liberalization not statistically significant for Q1s.
1/
0
1
2
3
4
5
6
7
8
9
MRT Q1 Q2
Tarrifs Regulatory trade barriers
Figure 8a. Trade Barriers(Rating scale from 0 to 10, higher rating indicate less restrictions)
Source: Fraser dataset on "Economic Freedom of the World."
0
1
2
3
4
5
6
7
8
9
MRT Q1 Q2
Nontariff trade barriers Ease of importing and exporting
Figure 8b. Regulatory Trade Barriers(Rating scale from 0 to 10, higher rating indicate less restrictions)
Source: Fraser dataset on "Economic Freedom of the World."
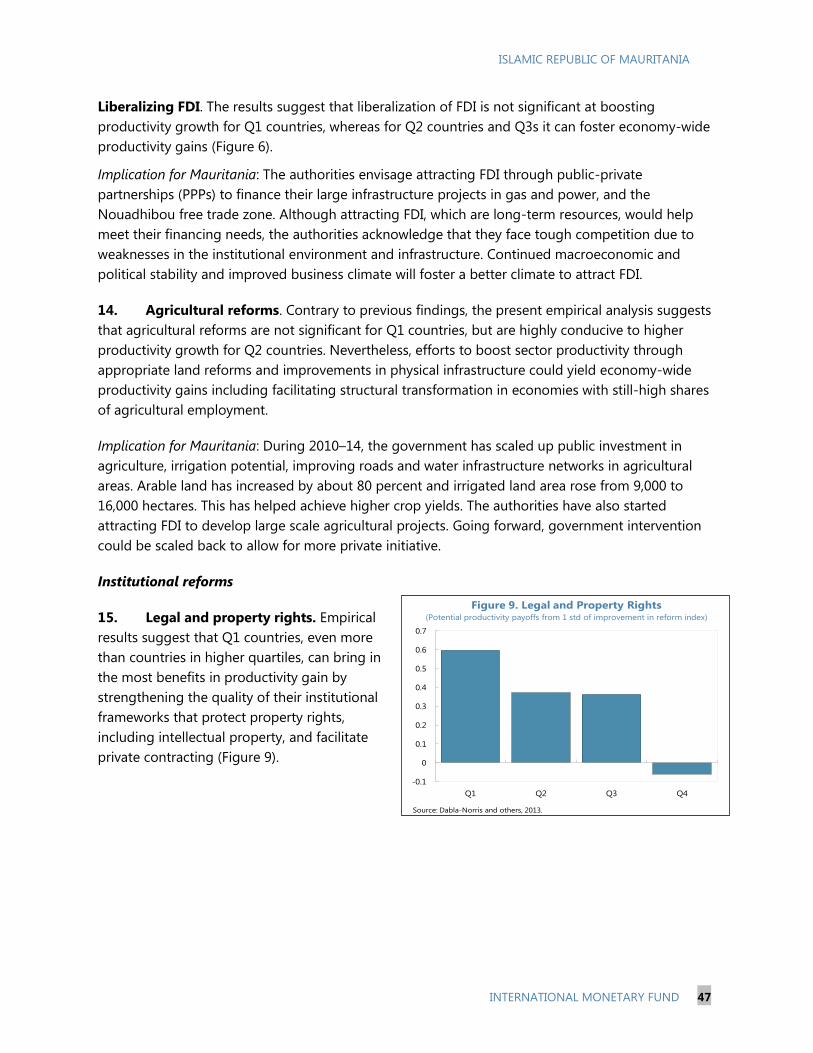
ISLAMIC REPUBLIC OF MAURITANIA
INTERNATIONAL MONETARY FUND 47
Liberalizing FDI. The results suggest that liberalization of FDI is not significant at boosting
productivity growth for Q1 countries, whereas for Q2 countries and Q3s it can foster economy-wide
productivity gains (Figure 6).
Implication for Mauritania: The authorities envisage attracting FDI through public-private
partnerships (PPPs) to finance their large infrastructure projects in gas and power, and the
Nouadhibou free trade zone. Although attracting FDI, which are long-term resources, would help
meet their financing needs, the authorities acknowledge that they face tough competition due to
weaknesses in the institutional environment and infrastructure. Continued macroeconomic and
political stability and improved business climate will foster a better climate to attract FDI.
14. Agricultural reforms. Contrary to previous findings, the present empirical analysis suggests
that agricultural reforms are not significant for Q1 countries, but are highly conducive to higher
productivity growth for Q2 countries. Nevertheless, efforts to boost sector productivity through
appropriate land reforms and improvements in physical infrastructure could yield economy-wide
productivity gains including facilitating structural transformation in economies with still-high shares
of agricultural employment.
Implication for Mauritania: During 2010–14, the government has scaled up public investment in
agriculture, irrigation potential, improving roads and water infrastructure networks in agricultural
areas. Arable land has increased by about 80 percent and irrigated land area rose from 9,000 to
16,000 hectares. This has helped achieve higher crop yields. The authorities have also started
attracting FDI to develop large scale agricultural projects. Going forward, government intervention
could be scaled back to allow for more private initiative.
Institutional reforms
15. Legal and property rights. Empirical
results suggest that Q1 countries, even more
than countries in higher quartiles, can bring in
the most benefits in productivity gain by
strengthening the quality of their institutional
frameworks that protect property rights,
including intellectual property, and facilitate
private contracting (Figure 9).
-0.1
0
0.1
0.2
0.3
0.4
0.5
0.6
0.7
Q1 Q2 Q3 Q4
Figure 9. Legal and Property Rights(Potential productivity payoffs from 1 std of improvement in reform index)
Source: Dabla-Norris and others, 2013.

ISLAMIC REPUBLIC OF MAURITANIA
48 INTERNATIONAL MONETARY FUND
Implications for Mauritania: Measures aimed at strengthening all aspects of governance could be
highly beneficial in improving productivity,
because Mauritania scores low in many
governance indicators such as property
rights, protection of minority shareholders,
strength of auditing and reporting, and
government transparency (Figure 10). In
particular, Mauritania should ensure that all
the preconditions for market-based
economic activity are in place. In particular,
property rights and the ability to enforce
contracts are two critical elements of a
country’s institutional and legal framework
that help create solid foundations for
market based economic activity. They could help promote private investment including through FDI
and entrepreneurship, and could help foster financial sector development.
16. Business and labor market regulations. Heavy regulatory burdens can discourage
international participation and severely limit
a country’s ability to benefit from
knowledge transfers, economies of scale,
and production-reallocation efficiencies. The
empirical analysis suggests that although for
Q1 countries reforms aimed at improving
business regulations do not significantly
raise the aggregate productivity growth,
they are significant for Q2 countries’
productivity gains (Figure 11). For labor
regulations, the analysis suggests that
removing excessive labor market rigidities is
not positively associated with higher aggregate productivity for Q1 countries, though it is for Q2
countries. Nonetheless, policy reforms to reduce informality can also be important avenues for
enhancing productivity.
Implications for Mauritania: Mauritania scores low in most of the World Bank’s Doing Business
indicators (Figures 12–13). To address Mauritania’s low rankings, the authorities are taking steps
such as the launch of the one-stop shop to reduce the number of procedures and the cost for
creating a business; the elimination of the minimum required capital to open a business; and
improvements in access to finance with a modernization of the centrale des risques at the CBM
(including all financial transactions above UM 3,000). Other measures such as the revamping of the
code of commerce and the revision of the procurement code are regulatory steps in the right
direction. Measures aimed at reducing administrative burdens, simplifying regulations,
-1
-0.5
0
0.5
1
1.5
Q1 Q2 Q3 Q4
Business regulation Labor market regulation
Figure 11. Business and Labor Market Regulations(Potential productivity payoffs from 1 std of improvement in reform index)
Source: Dabla-Norris et al. (2013).
1/ Business regulation not statistically significant for Q1s.
1/
0
30
60
90
120
150
Property rights
Judicial
independence
Wastefulness of
government
spending
Transparency of
government
policymaking
Strength of auditing
and reporting
standards
Protection of
minority
shareholders’
interestsMRT
LIC
LMI
Figure 10. Institutions(Rank)
Source: World Economic Forum, Global Competitiveness Index.
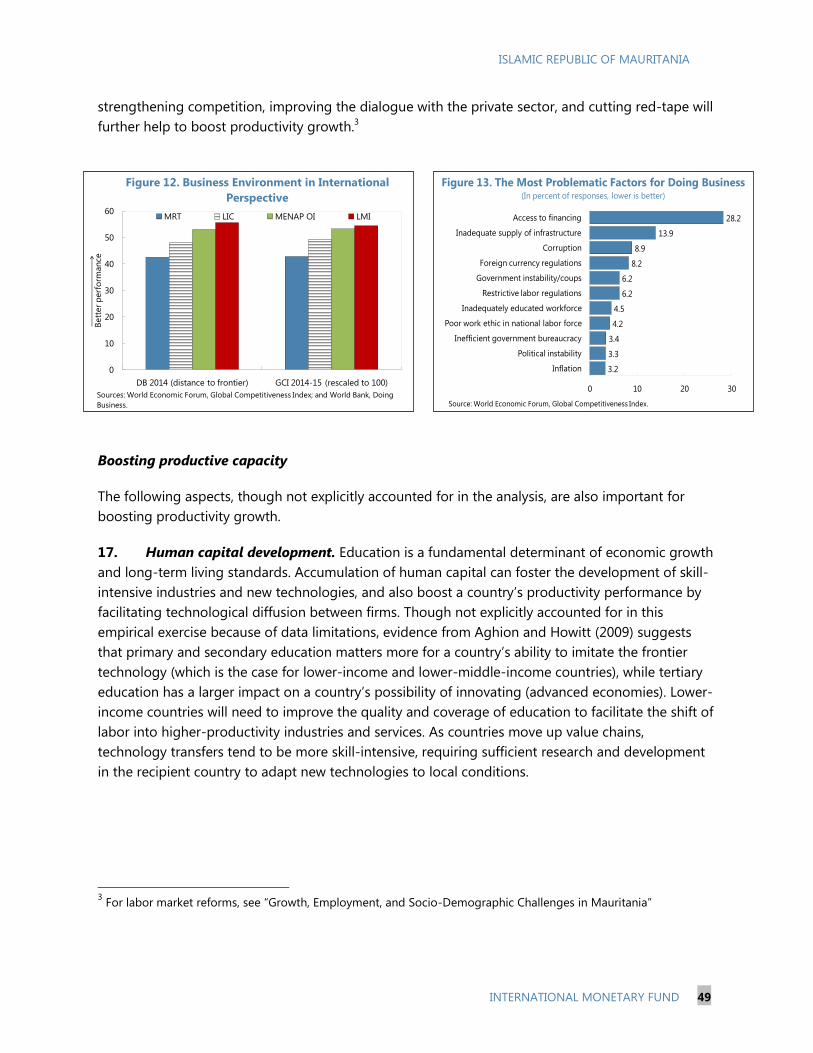
ISLAMIC REPUBLIC OF MAURITANIA
INTERNATIONAL MONETARY FUND 49
strengthening competition, improving the dialogue with the private sector, and cutting red-tape will
further help to boost productivity growth.3
Boosting productive capacity
The following aspects, though not explicitly accounted for in the analysis, are also important for
boosting productivity growth.
17. Human capital development. Education is a fundamental determinant of economic growth
and long-term living standards. Accumulation of human capital can foster the development of skill-
intensive industries and new technologies, and also boost a country’s productivity performance by
facilitating technological diffusion between firms. Though not explicitly accounted for in this
empirical exercise because of data limitations, evidence from Aghion and Howitt (2009) suggests
that primary and secondary education matters more for a country’s ability to imitate the frontier
technology (which is the case for lower-income and lower-middle-income countries), while tertiary
education has a larger impact on a country’s possibility of innovating (advanced economies). Lower-
income countries will need to improve the quality and coverage of education to facilitate the shift of
labor into higher-productivity industries and services. As countries move up value chains,
technology transfers tend to be more skill-intensive, requiring sufficient research and development
in the recipient country to adapt new technologies to local conditions.
3 For labor market reforms, see “Growth, Employment, and Socio-Demographic Challenges in Mauritania”
0
10
20
30
40
50
60
DB 2014 (distance to frontier) GCI 2014-15 (rescaled to 100)
Bett
er
perf
orm
an
ce
MRT LIC MENAP OI LMI
Figure 12. Business Environment in International
Perspective
Sources: World Economic Forum, Global Competitiveness Index; and World Bank, Doing
Business.
3.2
3.3
3.4
4.2
4.5
6.2
6.2
8.2
8.9
13.9
28.2
0 10 20 30
Inflation
Political instability
Inefficient government bureaucracy
Poor work ethic in national labor force
Inadequately educated workforce
Restrictive labor regulations
Government instability/coups
Foreign currency regulations
Corruption
Inadequate supply of infrastructure
Access to financing
Figure 13. The Most Problematic Factors for Doing Business(In percent of responses, lower is better)
Source: World Economic Forum, Global Competitiveness Index.

ISLAMIC REPUBLIC OF MAURITANIA
50 INTERNATIONAL MONETARY FUND
Implications for Mauritania. Mauritania is a factor-driven economy (Figure 14). As Mauritania
embarks on structural transformation to
diversify its economic structure and export
base, its economy will need to move its
technology frontier toward higher
efficiency. Among other things, this
transformation will require additional
educational skills, as the authorities
acknowledge. They have started tackling
the low retention rates in primary and
secondary education, and are increasing
the provision of specialized training in
mining, public works, fishing, agriculture,
and farming to enhance skills.4
18. Improving the quantity and quality of infrastructure. Investment in infrastructure has a
positive long-term impact on a country’s income level. As noted in Dabla-Norris and others (2013),
empirical evidence shows that insufficient physical infrastructure is a major drag on productivity
growth for emerging market economies (EMs) and even more so for LICs. Inadequate infrastructure
is a key determinant of low productivity growth in the agriculture and manufacturing sectors, when
compared with more advanced economies. In addition, improved quality of public investment is
equally important because inefficiencies in public investment management and weak governance
often distort the impact of public spending on capital accumulation. This is particularly pertinent for
many resource-rich developing countries, where public investment rates have increased during the
recent resource boom but investment quality suffers from relatively weak capacity in comparison
with other countries.
Implications for Mauritania: Mauritania compares favorably with peers in quality of electricity supply,
but improvements in the quality of air transportation, roads, railroads and port infrastructures will be
needed to boost productivity (Figure 15a). Similarly, on public investment efficiency, though
Mauritania scores well compared to peers in the quality of appraisal, selection, and evaluation of
projects, the index of public investment management practices suggests that the quality of
implementation and management of projects within government investment portfolios could be
improved (Figure 15b).
Mauritania has in recent years scaled up its public investment not only to enhance basic
infrastructure networks such as roads, water, port, airport, and electricity, but also to decisively
support key sectors such as agriculture. Continuous progress on this front, together with better
implementation and management, would help improve connectivity to markets, both domestic and
4 For education reforms, see “Growth, Employment, and Socio-Demographic Challenges in Mauritania”
0
2
4
6Institutions
Infrastructure
Macroeconomic
Environment
Health and primary
education
Higher education and
training
Goods market efficiency
Labor market efficiency
Financial market
development
Technological readiness
Market size
Business sophistication
Innovation
MRT Factor-driven Efficiency-driven
Figure 14. Stages of Development(Score)
Source: World Economic Forum, Global Competitiveness Index.

ISLAMIC REPUBLIC OF MAURITANIA
INTERNATIONAL MONETARY FUND 51
foreign, boost prospects for labor-intensive manufacturing and agriculture and thus generate
positive economy-wide productivity and growth effects. In addition, addressing the infrastructure
gap will also help transform the country into a more efficiency-driven economy. Given the
magnitude of the infrastructure gap and the limited public resources, however, a viable strategy to
develop infrastructure would require attracting private investment. Reforming the regulatory
environment for infrastructure and promoting PPPs would help catalyze private investment.
Fiscal policy efficiency. Although not explicitly included in the empirical analysis of Dabla-Norris
and others (2013), fiscal reforms could help ensure that provision of public services in education,
training, and infrastructure are more efficient and better targeted, thereby fostering productivity
growth. In general, the composition and quality of taxation and public spending can have significant
productivity, growth, and labor market impacts (IMF, 2013; IMF, 2012).
Implications for Mauritania: Tax collection efforts in Mauritania have improved remarkably in the
past years. Policymakers should seek the right balance, in mobilizing revenues with alternative
revenue raising measures and tax incentives (a common practice to attract FDI and promote
research and development), because tax policies (for example, corporate taxes) can affect
productivity by creating disincentives for firms to engage in innovative activities. By the same token,
cutting back spending in nonproductive areas such as distortionary and poorly targeted energy
subsidies, and improving the efficiency of public spending in priority areas, including strengthening
public financial management, could yield important productivity gains.
D. Diversification to Sustain Long-Run Growth
Export diversification
19. This section borrows the empirical results of IMF (2014) on the “Diversification and
Transformation in LICs,” which investigates the effect of diversification on growth for a sample of
84 countries, including Mauritania. The empirical analysis focuses on understanding whether the
0
1
2
3
4
5
Overall
infrastructure
Roads
Railroad
infrastructure
Port infrastructure
Air transport
infrastructure
Electricity supply
Figure 15a. Infrastructure Quality Index(Score, 1-7)
MRT
Q1
Q2
Source: Fraser dataset on "Economic Freedom of the World."
0
0.5
1
1.5
2
2.5
Mauritania Q1 Q2
Appraisal
Selection
Managing
Evaluation
Total PIMI
Figure 15b. Public Investment Efficiency (Public investment management index (PIMI)) 1/
Source: Dabla-Norris and others, 2011.
1/ Higher PIMI values indicate better investment planning and implementation; 4 is the
highest value.
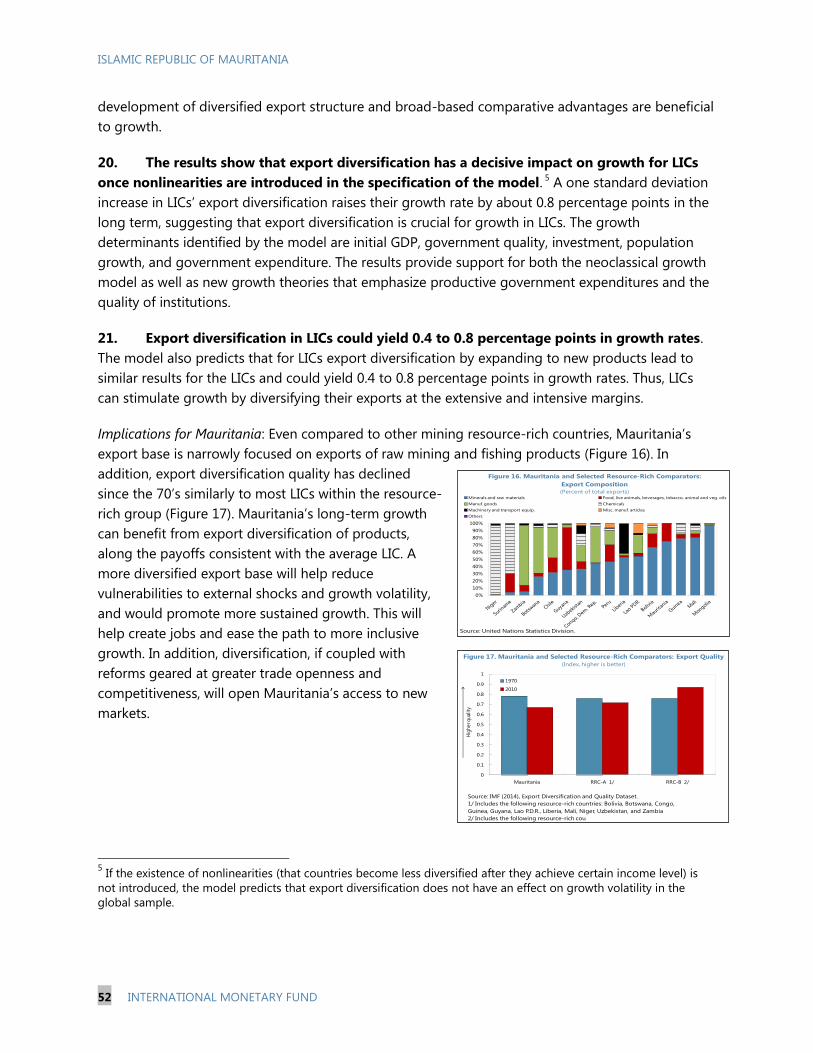
ISLAMIC REPUBLIC OF MAURITANIA
52 INTERNATIONAL MONETARY FUND
development of diversified export structure and broad-based comparative advantages are beneficial
to growth.
20. The results show that export diversification has a decisive impact on growth for LICs
once nonlinearities are introduced in the specification of the model. 5 A one standard deviation
increase in LICs’ export diversification raises their growth rate by about 0.8 percentage points in the
long term, suggesting that export diversification is crucial for growth in LICs. The growth
determinants identified by the model are initial GDP, government quality, investment, population
growth, and government expenditure. The results provide support for both the neoclassical growth
model as well as new growth theories that emphasize productive government expenditures and the
quality of institutions.
21. Export diversification in LICs could yield 0.4 to 0.8 percentage points in growth rates.
The model also predicts that for LICs export diversification by expanding to new products lead to
similar results for the LICs and could yield 0.4 to 0.8 percentage points in growth rates. Thus, LICs
can stimulate growth by diversifying their exports at the extensive and intensive margins.
Implications for Mauritania: Even compared to other mining resource-rich countries, Mauritania’s
export base is narrowly focused on exports of raw mining and fishing products (Figure 16). In
addition, export diversification quality has declined
since the 70’s similarly to most LICs within the resource-
rich group (Figure 17). Mauritania’s long-term growth
can benefit from export diversification of products,
along the payoffs consistent with the average LIC. A
more diversified export base will help reduce
vulnerabilities to external shocks and growth volatility,
and would promote more sustained growth. This will
help create jobs and ease the path to more inclusive
growth. In addition, diversification, if coupled with
reforms geared at greater trade openness and
competitiveness, will open Mauritania’s access to new
markets.
5 If the existence of nonlinearities (that countries become less diversified after they achieve certain income level) is
not introduced, the model predicts that export diversification does not have an effect on growth volatility in the
global sample.
0%
10%
20%
30%
40%
50%
60%
70%
80%
90%
100%
Source: United Nations Statistics Division.
Minerals and raw materials Food, live animals, beverages, tobacco, animal and veg. oils
Manuf. goods Chemicals
Machinery and transport equip. Misc. manuf. articles
Others
Figure 16. Mauritania and Selected Resource-Rich Comparators:
Export Composition
(Percent of total exports)
0
0.1
0.2
0.3
0.4
0.5
0.6
0.7
0.8
0.9
1
Mauritania RRC-A 1/ RRC-B 2/
Hig
her q
ual
ity
Source: IMF (2014), Export Diversification and Quality Dataset.
1/ Includes the following resource-rich countries: Bolivia, Botswana, Congo,
Guinea, Guyana, Lao P.D.R., Liberia, Mali, Niger, Uzbekistan, and Zambia
2/ Includes the following resource-rich cou
1970
2010
Figure 17. Mauritania and Selected Resource-Rich Comparators: Export Quality
(Index, higher is better)
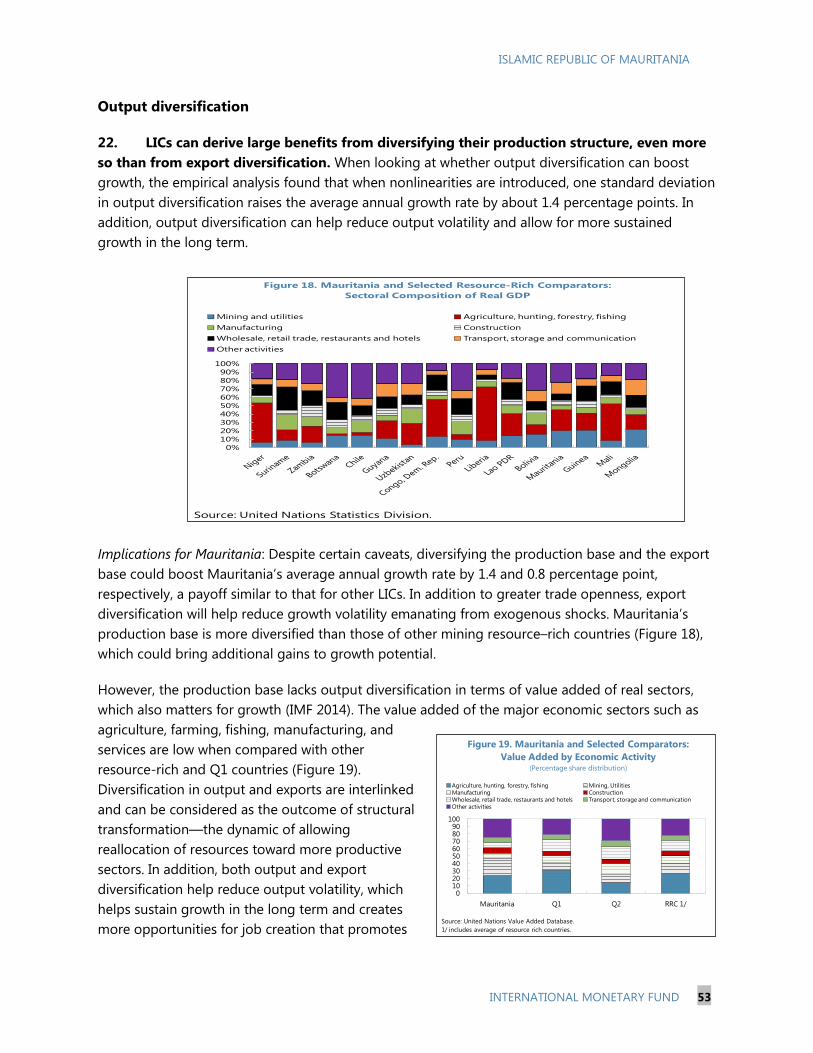
ISLAMIC REPUBLIC OF MAURITANIA
INTERNATIONAL MONETARY FUND 53
Output diversification
22. LICs can derive large benefits from diversifying their production structure, even more
so than from export diversification. When looking at whether output diversification can boost
growth, the empirical analysis found that when nonlinearities are introduced, one standard deviation
in output diversification raises the average annual growth rate by about 1.4 percentage points. In
addition, output diversification can help reduce output volatility and allow for more sustained
growth in the long term.
Implications for Mauritania: Despite certain caveats, diversifying the production base and the export
base could boost Mauritania’s average annual growth rate by 1.4 and 0.8 percentage point,
respectively, a payoff similar to that for other LICs. In addition to greater trade openness, export
diversification will help reduce growth volatility emanating from exogenous shocks. Mauritania’s
production base is more diversified than those of other mining resource–rich countries (Figure 18),
which could bring additional gains to growth potential.
However, the production base lacks output diversification in terms of value added of real sectors,
which also matters for growth (IMF 2014). The value added of the major economic sectors such as
agriculture, farming, fishing, manufacturing, and
services are low when compared with other
resource-rich and Q1 countries (Figure 19).
Diversification in output and exports are interlinked
and can be considered as the outcome of structural
transformation—the dynamic of allowing
reallocation of resources toward more productive
sectors. In addition, both output and export
diversification help reduce output volatility, which
helps sustain growth in the long term and creates
more opportunities for job creation that promotes
0102030405060708090
100
Mauritania Q1 Q2 RRC 1/
Agriculture, hunting, forestry, fishing Mining, UtilitiesManufacturing ConstructionWholesale, retail trade, restaurants and hotels Transport, storage and communicationOther activities
Figure 19. Mauritania and Selected Comparators:
Value Added by Economic Activity(Percentage share distribution)
Source: United Nations Value Added Database.
1/ includes average of resource rich countries.
0%
10%
20%
30%
40%
50%
60%
70%
80%
90%
100%
Source: United Nations Statistics Division.
Mining and utilities Agriculture, hunting, forestry, fishing
Manufacturing Construction
Wholesale, retail trade, restaurants and hotels Transport, storage and communication
Other activities
Figure 18. Mauritania and Selected Resource-Rich Comparators:
Sectoral Composition of Real GDP
ISLAMIC REPUBLIC OF MAURITANIA
54 INTERNATIONAL MONETARY FUND
growth inclusiveness. The authorities recognize that the hopes of boosting and sustaining growth
rest on their ability to transform and diversify the productive base away from sectors exposed to
exogenous shocks, and to develop both human capital and physical infrastructure so as to
accommodate planned changes in industrial structure. The authorities are therefore developing
exporting industries in red meat, poultry, dairy products and fishing together with the development
of supporting infrastructure; and setting up PPPs.
E. Conclusion and Recommendations
23. Meeting the challenge of boosting productivity, sustaining long-term growth and improving
inclusiveness will depend crucially on the ability of the authorities to successfully implement an
ambitious structural reform agenda in a manner that is mindful of their priorities and competitive
advantage, while also strengthening institutional capacity. While acknowledging the difficulty of the
tasks ahead, reforms to support economic productivity growth and diversification in Mauritania
should be pursued, with the following items given priority:
Continue strengthening the macroeconomic policy framework;
Pursuing banking sector reforms to support financial stability using the roadmap of the recently
concluded FSAP;
Invest in improving human capital development;
Continue improving the business climate to facilitate private sector development;
Strengthen the efficiency of public infrastructure investment, to ensure that quality infrastructure
is put in place;
Improving governance and strengthening institutions to support policy predictability; and
Developing a solid export promotion strategy that encompasses all aspects of international
trade (barriers to trade, competitive advantage, etc.).
24. Above all, countries’ experiences in successfully implementing productivity-enhancing
reforms and structural transformation show that success is largely influenced by the authority of the
executive power and broad ownership of reforms. Mauritanian policy makers will have to ensure
that these elements of success are given due consideration.
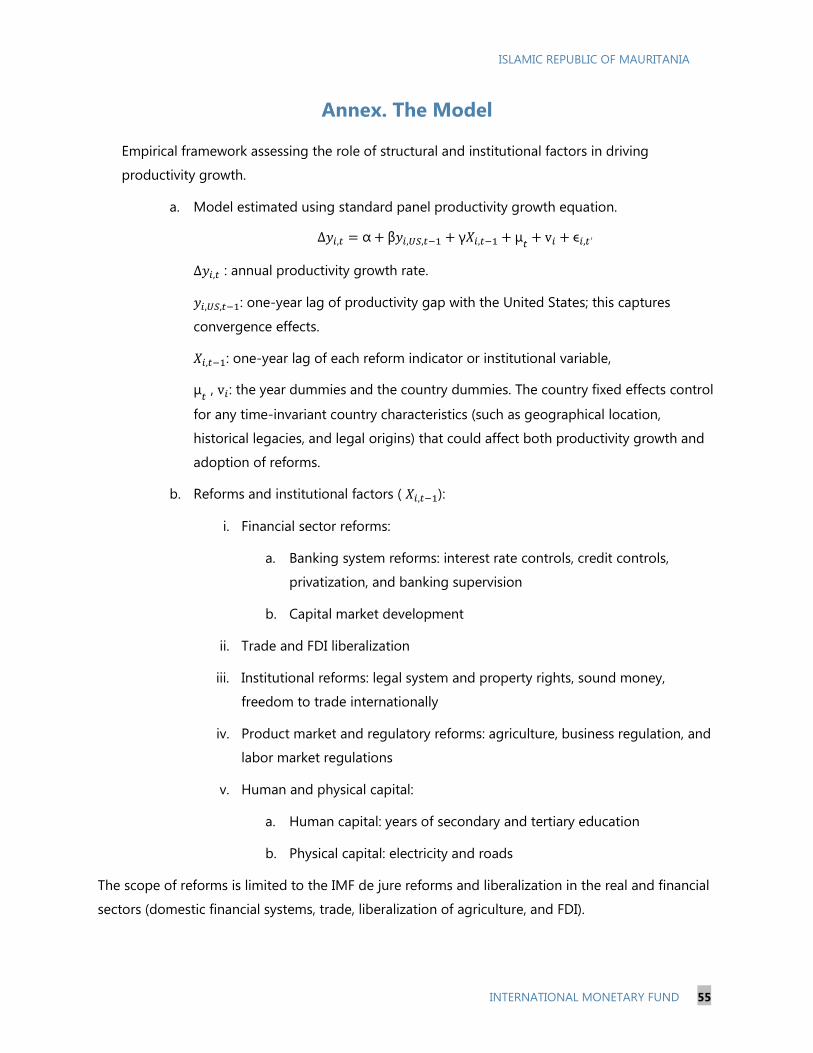
ISLAMIC REPUBLIC OF MAURITANIA
INTERNATIONAL MONETARY FUND 55
Annex. The Model
Empirical framework assessing the role of structural and institutional factors in driving
productivity growth.
a. Model estimated using standard panel productivity growth equation.
α
: annual productivity growth rate.
: one-year lag of productivity gap with the United States; this captures
convergence effects.
: one-year lag of each reform indicator or institutional variable,
, : the year dummies and the country dummies. The country fixed effects control
for any time-invariant country characteristics (such as geographical location,
historical legacies, and legal origins) that could affect both productivity growth and
adoption of reforms.
b. Reforms and institutional factors ( ):
i. Financial sector reforms:
a. Banking system reforms: interest rate controls, credit controls,
privatization, and banking supervision
b. Capital market development
ii. Trade and FDI liberalization
iii. Institutional reforms: legal system and property rights, sound money,
freedom to trade internationally
iv. Product market and regulatory reforms: agriculture, business regulation, and
labor market regulations
v. Human and physical capital:
a. Human capital: years of secondary and tertiary education
b. Physical capital: electricity and roads
The scope of reforms is limited to the IMF de jure reforms and liberalization in the real and financial
sectors (domestic financial systems, trade, liberalization of agriculture, and FDI).

ISLAMIC REPUBLIC OF MAURITANIA
56 INTERNATIONAL MONETARY FUND
TFP Regression Results
Q1 Q2 Q3 Q4 Full sample
Financial sector reforms
Banking system reforms 1/ 2.939 6.365 5.933 0.459 3.272
[1.736]* [1.545]*** [1.872]*** [0.639] [0.656]***
Interest rate controls 1.240 1.592 1.429 0.363 1.033
[0.964] [0.737]** [0.847]* [0.304] [0.307]***
Credit controls 0.850 2.906 1.004 0.488 1.182
[0.986] [0.819]*** [0.815] [0.341] [0.343]***
Privatization 1.047 2.475 3.059 -0.144 1.402
[1.011] [0.863]*** [0.879]*** [0.372] [0.363]***
Banking supervision 4.011 4.079 4.926 0.628 2.206
[1.963]** [1.251]*** [1.549]*** [0.443] [0.473]***
Capital market development 2.581 2.077 6.43 0.86 2.359
[1.843] [1.224]* [1.002]*** [0.431]** [0.447]***
Trade and FDI liberalization
Freedom to trade internationally 0.351 0.702 0.355 0.098 0.287
[0.167]** [0.158]*** [0.127]*** [0.084] [0.061]***
Trade (tariff rates) 4.196 0.190 -0.670 -1.434 0.497
[1.490]*** [1.029] [1.099] [0.774]* [0.542]
FDI liberalization 1.513 2.799 1.668 0.249 1.472
[1.302] [0.762]*** [0.762]** [0.351] [0.338]***
Institutional reforms
Legal system and property rights 0.597 0.372 0.363 -0.061 0.149
[0.220]*** [0.178]** [0.194]* [0.101] [0.082]*
Sound money 0.405 0.477 0.097 -0.010 0.185
[0.125]*** [0.112]*** [0.109] [0.066] [0.051]***
Product market and regulatory reforms
Agriculture 0.320 3.959 -0.074 1.115 1.982
[1.065] [0.880]*** [0.938] [0.834] [0.458]***
Business regulation 0.044 0.704 0.965 0.493 0.491
[0.364] [0.277]** [0.214]*** [0.128]*** [0.115]***
Labor market regulation -0.872 0.762 0.165 -0.149 -0.244
[0.482]* [0.458]* [0.250] [0.107] [0.113]**
Source: Dabla-Norris and others, 2013.1/
Includes interest controls; credit controls such as directed credit, reserves requirements; privatization; and
supervision reforms.
ISLAMIC REPUBLIC OF MAURITANIA
INTERNATIONAL MONETARY FUND 57
References
Ahmadov, Anar, 2012, Political Determinants of Economic Diversification in Natural Resource-Rich
Developing Countries, Preliminary draft.
Berg, A., J. D. Ostry, and J. Zettelmeyer, 2008, “What Makes Growth Sustained?” IMF Working Paper 08/59
(Washington: International Monetary Fund).
Dabla-Norris, Era, and others, 2008, “Anchoring Growth: The Importance of Productivity-Enhancing
Reforms in Emerging Market and Developing Economies,” IMF Staff Discussion Note 13/08
(Washington: International Monetary Fund).
Dabla-Norris, Era, and others, 2012, “Investing in Public Investment: An Index of Public Investment
Efficiency,” Journal of Economic Growth, 17 (3): 235–66.
International Monetary Fund (IMF), 2012, “Structural Transformation in Sub-Saharan Africa,” Regional
Economic Outlook: Sub-Saharan Africa, October (Washington: International Monetary Fund).
———, 2013, “German-Central European Supply Chain—Cluster Report,” IMF Country Report No. 13/263
(Washington: International Monetary Fund).
———, 2014, “Sustaining Long-Run Growth and Macroeconomic Stability in Low-Income Countries—The
Role of Structural Transformation and Diversification.” IMF Policy Paper, March 2014.
Ostry, J., Prati, A., Spilimbergo A., 2009, “Structural Reforms and Economic Performance in Advanced and
Developing Countries,” IMF Occasional Paper 268 (Washington: International Monetary Fund).
ISLAMIC REPUBLIC OF MAURITANIA
58 INTERNATIONAL MONETARY FUND
PUBLIC INVESTMENT, NATURAL RESOURCE AND DEBT
SUSTAINABILITY1
Mauritania—a low-income country endowed with significant mining resources—has embarked upon
an ambitious public investment program to address infrastructure gaps and support growth in the
non-extractive sectors of the economy, with the objective to achieve faster job creation and poverty
reduction. This study applies the Debt, Investment, Growth and Natural Resources (DIGNAR) model to
analyze the benefits of the higher public investment as well as the impact of the associated financing
requirements on the country’s debt and fiscal policy path. The model simulations suggest that the
authorities should be prudent regarding their investment plans, in particular in the event of further
declines in iron ore prices, and should be ambitious in improving their investment management
capacity. In particular, their currently planned public investment path will be costly in terms of
foregone private consumption in the medium run—including under current commodity price
projections.
A. Introduction
1. The mining industry is the main driver of Mauritanian exports. Extractive industries
comprised on average about 83 percent of the country’s total exports in 2009–13. Iron ore is the
largest component of Mauritania’s commodity export basket, alone accounting for over half of
overall exports. The iron ore mining industry has substantial expansion plans, with the public mining
company SNIM2 aiming to triple its mining output in the next 10 years, with additional expansion of
mining production expected from the private sector. The projected increase in iron exports will be a
major driver of the projected strong output growth over the next decade.
2. The authorities have taken advantage of the recent period of high iron prices and
access to concessional borrowing to ramp up investment plans. Mauritania needs to address
urgent investment needs to become a middle-income country. Both job creation through economic
diversification and improvement of the living standards of the population require better
infrastructure, including transport and electricity generation and distribution. Further irrigation in the
south of the country can increase agricultural output and increase employment. The authorities have
recently increased public investments to address these needs more rapidly, taking advantage of
higher fiscal revenues from extractive industries due to higher commodity prices during 2012–14
and available, mostly concessional, borrowing.
1 Prepared by Grace B. Li and Frantisek Ricka.
2 SNIM is a majority state-owned iron mining company (with foreign minority shareholders). Its dividend payments to
the state represent a major budget income category. SNIM is currently the only major iron producer in Mauritania,
while private companies have plans to start production in the coming years.

ISLAMIC REPUBLIC OF MAURITANIA
INTERNATIONAL MONETARY FUND 59
3. Investment in Mauritania, however, is subject to the usual capacity constraints
prevalent in lower-income countries. An IMF study (Dabla-Norris et al. (2011)) calculated a Public
Investment Management Index (PIMI) for a number of emerging markets and lower-income
countries. PIMI is a composite index of the efficiency of the public investment management process
that draws upon country diagnostics on public investment management systems conducted by the
World Bank, existing budget survey databases and assessments carried out by donors, and expert
surveys (Figure 1). The index evaluates four stages of public investment: appraisal, selection,
managing and evaluation. Mauritania is positioned roughly in the middle of the PIMI sample of
countries (and behind, for instance, Tunisia but ahead of Egypt). While the country can achieve
positive results through public investments, capacity to invest efficiently is an issue to consider when
making investment decisions, and its improvement can lead to significant benefits.
Figure 1. Public Investment Management Index (PIMI)
B. Model Description
4. The DIGNAR model provides a framework in which to analyze the benefits of higher
investments versus their costs in terms of the impact on a country’s debt level.3 The model is
designed to analyze the nexus between natural resources revenues management, public investment,
and public debt in the context of investment capacity constraints. The analytical framework is based
on Araujo et al. (2013), Buffie et al. (2012), Berg et al. (2013) and Melina et al. (2014) and includes a
natural resource sector, limited investment efficiency and absorptive capacity as well as a detailed
fiscal specification reflecting the choices by the authorities in financing investments through external
debt, taxes and drawings from the sovereign wealth fund (currently Mauritania’s oil fund, which was
set up at the start of the short-lived oil boom in 2006 and amounted to almost US$100 million,
equivalent to 2 percent of GDP in 2014). Taking resource revenues and public investment policy as
3 The description of the DIGNAR model is based on the DIGNAR Selected Issues Paper in the Republic of Congo 2014
Article IV staff report.
0
0.5
1
1.5
2
2.5
3
3.5
4
So
uth
Afr
ica
Bra
zil
Co
lom
bia
Tu
nis
iaT
hailan
dP
eru
Bo
livia
Arm
en
iaK
aza
kh
stan
Bo
tsw
an
aM
old
ova
Rw
an
da
Jord
an
Mali
Afg
han
ista
nB
urk
ina F
aso
Bela
rus
Ban
gla
desh
Serb
iaM
ad
ag
asc
ar
Ukra
ine
FY
R M
ace
do
nia
Leso
tho
Tu
rkey
Co
te d
'Ivo
ire
Zam
bia
Gh
an
aP
hilip
pin
es
Mala
wi
Nam
ibia
El S
alv
ad
or
Ko
sovo
Jam
aic
aM
on
go
lia
Mau
rita
nia
Eth
iop
iaA
lban
iaM
on
ten
eg
roM
oza
mb
iqu
eP
akis
tan
Cam
bo
dia
Ben
inA
zerb
aijan
Ken
ya
Ind
on
esi
aU
gan
da
Eg
yp
tK
yrg
yz
Rep
ub
lic
Tan
zan
iaD
jib
ou
tiB
arb
ad
os
Nig
eri
aG
uin
ea
Tri
nid
ad
an
d T
ob
ag
oS
wazi
lan
dH
ait
iS
ud
an
Sie
rra L
eo
ne
Ch
ad
Gab
on
Sen
eg
al
To
go
Bu
run
di
Gam
bia
Lao
PD
RS
ao
To
me a
nd
Pri
nci
pe
West
Ban
k a
nd
Gaza
Yem
en
So
lom
on
Isla
nd
sR
ep
ub
lic
of C
on
go
Belize
Source: IMF

ISLAMIC REPUBLIC OF MAURITANIA
60 INTERNATIONAL MONETARY FUND
given, the framework can simulate the macroeconomic outcomes of investing resource revenue,
accounting for the investment-growth linkage and the feedback effect on non-resource revenue. In
allowing the evaluation of the level of future private consumption after public investment has borne
its fruit, against the cost of foregone current private consumption resulting from financing that
investment through taxes, the model can also provide insights regarding the intergenerational
impact of the public investment program.
5. The DIGNAR model provides a stylized representation of a small open economy with
iron production and public investment needs like the Mauritanian economy. The particular
features of the model are:
The government finances its consumption and investment expenditure with taxes, debt and savings
accumulated in the sovereign wealth fund (SWF). The path of external concessional debt is given
by the projection of repayment of the existing stock of concessional debt and new concessional
debt disbursements consistent with those in the debt sustainability analysis (DSA) based on the
needs of the public investment program. The government thus only decides the level of non-
concessional (commercial) external debt. Commercial foreign debt is subject to a risk premium
that depends on the stock of external debt. Fiscal revenues are collected from the extractive and
non-extractive sectors. The government chooses the consumption tax (VAT) rate, starting from
the initial level of 14 percent in place at the end of 2014. In every period, the government can
choose to close the fiscal gap with an increase in taxes and/or debt, as well as by drawing down
savings in the SWF. While Mauritania’s SWF is currently the country’s oil fund, the model
application assumes that, should the government collect substantial revenues from the
extractive sector of the economy, it would wish to save some of the receipts and could do so in
a more general extractive SWF.
The physical capital formation process4 is subject to absorptive capacity and government efficiency
constraints.5 In particular, effective government investment is a fraction of government
expenditure on investment. In the Mauritanian model calibration, investment efficiency (the ratio
of effective investment to investment expenditure) is currently assumed at 0.5 in the non-natural
resource sector, a value suggested for other lower-income countries, and rising over the next
decade to 0.6, a level applied in the cases of some transition economies (e.g. Kazakhstan).6 This
increase assumes that Mauritania will implement substantial improvements to its public
investment management process over the coming ten years across the four areas used to
calculate the PIMI index and, especially, in project management and appraisal, where it is
4 The model only considers one single type of productive public capital formation. It does not allow exploring
sectoral composition of investment (and possibly different investment efficiency in various sectors) or issues related
to human capital accumulation.
5 Human capital investment could be another source of investment relevant for economic diversification. See
accompanying paper on structural reform and economic diversification by A. Toure.
6 This implies that efficient investment accounts for 50 percent of total investment expenditure.
ISLAMIC REPUBLIC OF MAURITANIA
INTERNATIONAL MONETARY FUND 61
lagging behind its peers. Furthermore, to capture the idea of rising investment costs due to
absorptive capacity constraints, investment efficiency is assumed to fall when the expenditure
level exceeds a certain threshold.7
Two types of households. Rule-of-thumb consumers are liquidity constrained and consume all of
their disposable income in each period. Optimizing households are subject to borrowing
constraints and have only limited access to financial markets to acquire international bonds with
portfolio adjustment costs, which restrict the degree of capital account openness. The private
sector pays a premium on foreign debt over the interest rate that the government pays on its
own external debt.
Three production sectors. In the non-extractive economy traded and non-traded goods are
produced according to a Cobb-Douglas production function with three inputs: labor, private
capital and public capital. The difference between these two sectors resides in the modeling of
technological progress—assumed to be exogenous in the non-traded sector whereas in the
traded sector it is subject to learning-by-doing externalities and depends positively on previous-
period output. The intuition is that once traded-sector production starts falling, knowledge and
skills can be lost. Growth in both sectors of the non-extractive economy is endogenously
determined as a function of behavior of firms and households, which in turn respond to
government policies and outcomes in the third sector. The latter, the extractive sector, produces
iron ore and output is assumed to be exogenous, with both price and quantities taken as given.
Given iron ore’s dominant role in Mauritania’s extractive sector and the projected rise in iron ore
production, iron ore mining is taken to represent Mauritania’s entire extractive sector.
C. Investment and Revenue Scenarios
6. The DIGNAR analysis of Mauritanian public investments is based on a 2x2 matrix of
scenarios, considering a baseline and an aggressive investment path under baseline and downside
iron ore price projections.
Baseline investment path is consistent with the projections in the staff report, which assumes a
high level of public investments over the next three years. Public investment as a percent of GDP
remains anchored at the 2018 level (around 10 percent of GDP) afterward. This path is driven by
the authorities’ investment plans in conjunction with a projection for the extractive sector output
and extractive fiscal revenues as well as new external debt disbursements embedded in the DSA.
7 Absorptive capacity constraints start binding when public investment rises above 75 percent from its initial value.
The calibration of the model implies that the average investment efficiency approximately halves when public
investment spikes to around 200 percent from its initial value.

ISLAMIC REPUBLIC OF MAURITANIA
62 INTERNATIONAL MONETARY FUND
Aggressive investment path assumes that the authorities continue investing at the baseline peak
level currently projected for 2015, at almost 15 percent of GDP, through 2018 before starting the
decline projected in the baseline to reach a level of about 10 percent of GDP by 2021.
Baseline iron ore price projection is based on an iron ore price of USD72 per ton, which is close to
the prevailing price in the world commodity markets in late 2014. This projection also assumes
that all currently planned mining projects come to execution and start production within one
year of the scheduled date. This will more than triple the iron ore production of Mauritania over
the next decade and production will be anchored at over 65 million tons per year by 2030.
Downside iron ore price projection assumes a further 10 percent decline in prices to about USD
65 per ton. This is close to futures market prices in 2015-16 as of end-2014. It is assumed that
the lower price would lead to canceling of at least one substantial mining project and delays in
the implementing others. The overall iron ore mining capacity will still increase substantially over
the coming years to 44 million tons by 2026.
Figure 2. Mauritania: Iron Ore Projections, 2014–29
Source: IMF staff estimates.
D. Results
7. The simulations show that the ambitious public investment plans would increase
output but also lead to a decrease in private consumption under current commodity prices.
The results for the baseline investment path under the baseline iron ore price projections suggest
that the authorities’ current investment plans are sustainable but hurt private consumption. Given
the high poverty levels in Mauritania, foregone consumption will be costly. The model would
finance the beginning of the investment plan with a combination of additional debt, and
drawings on the resources currently in the oil fund, later replacing the latter source with an
0
10000
20000
30000
40000
50000
60000
70000
2014
2015
2016
2017
2018
2019
2020
2021
2022
2023
2024
2025
2026
2027
2028
2029
Iron ore output (thousands of tons)
Baseline
Downside
Average 2006-2013
0
20
40
60
80
100
120
2014
2015
2016
2017
2018
2019
2020
2021
2022
2023
2024
2025
2026
2027
2028
2029
Iron ore price (USD per ton)
Baseline
Downside
ISLAMIC REPUBLIC OF MAURITANIA
INTERNATIONAL MONETARY FUND 63
increase in consumption taxes once the oil fund runs out of resources. This policy change will
decrease private consumption by about one percent below its steady state value in the medium
run. The lower consumption will in turn reduce non-extractive output to its steady-state value
after an initial rise. Only once the investments have begun fully bearing fruit in 2019 will
consumption start increasing, returning to the steady state value by 2028, with non-extractive
output rising almost one percent above its steady state. In the meantime, total public external
debt rises substantially in the coming two years, peaking at slightly over 70 percent of GDP, but
then stabilizes and begins steadily declining by 2019.
If iron prices fall further and mining expansion projects are delayed, the current investment plan
will become very costly in terms of foregone private consumption and will reduce nonextractive
output. As extractive revenues of the government fall—due to the lower price and output in iron
mining relative to the baseline scenario—the authorities will have to increase taxes and public
external debt further. This will result in a sharp fall in private consumption and a substantial
decrease in non-extractive output in the medium run. At the same time, public external debt will
increase further and then decrease more slowly than in the baseline price scenario. Overall, these
results suggest that the authorities’ baseline investment plans would be very costly to maintain
in terms of foregone private consumption should commodity prices decrease further8
A more aggressive investment path would result in higher output at a substantially higher
foregone consumption cost in the medium run. A longer period of scaled-up investments would
succeed in increasing non-extractive output more than 2.5 percent above the steady state,
almost three times the difference achieved in the baseline investment scenario. Yet, this would
come at the cost of substantially higher consumption taxes required to finance the investment
path, which would, in turn, depress private consumption by up to 3 percent below its steady
state value. Consumption would eventually recover, but the overall consumption loss in the
medium and long run would be very large and likely exceed the benefits of the successful efforts
to increase non-extractive output.
A further iron ore price decline would be particularly damaging to private consumption levels if the
authorities pursue a more aggressive investment path. The negative impact on consumption
would effectively combine the declines seen in the previous two scenarios, resulting in a steep
drop in the next five years followed by further stagnation and even decrease in the long run.
Non-extractive output would still initially increase above its steady-state level as a result of the
higher investments but then fall back as a result of the fall in private consumption. The level of
external public debt would rise above 80 percent of GDP by 2020 and only slowly decrease after
that. Overall, the costs in terms of consumption as well as the debt dynamics of maintaining an
aggressive public investment plan in the face of lower iron prices would be very large.
8 These series exclude the debt owed by Mauritania to the Kuwaiti Investment Authority (KIA) from which the country
is seeking debt relief.

ISLAMIC REPUBLIC OF MAURITANIA
64 INTERNATIONAL MONETARY FUND
Figure 3. Mauritania: Model Simulations, 2014-29
Source: IMF Staff estimates
E. Conclusions and Policy Implications
8. The DIGNAR application points to the potential costs in terms of foregone private
consumption of a scaled-up public investment plan in Mauritania, calling for flexibility in
implementation should extractive revenues fall short of expectations. While higher levels of
public investments will benefit the country in terms of non-extractive output and eventually private
consumption, in the medium run their cost will be substantial. In particular, their financing will
require higher debt and tax levels, the latter of which will depress private consumption even under
the baseline investment plans and price projections. The model suggests that a higher-than-
currently-envisaged investment path would have even larger costs. Even in the baseline investment
path, the authorities will need to remain flexible in implementation in the face of volatile global
commodity prices. Should prices decrease further and mining expansion projects be delayed or
scaled back, too much of the planned investments would have to be financed through higher debt
or taxes, potentially hurting private consumption even in the long run.
-2
-1.5
-1
-0.5
0
0.5
1
1.5
2
2.5
3
2014
2015
2016
2017
2018
2019
2020
2021
2022
2023
2024
2025
2026
2027
2028
2029
Non-extractive output (% deviation from SS)
-4.5
-4
-3.5
-3
-2.5
-2
-1.5
-1
-0.5
0
0.5
2014
2015
2016
2017
2018
2019
2020
2021
2022
2023
2024
2025
2026
2027
2028
2029
Private consumption (% deviation from SS)
0
5
10
15
20
25
2014
2015
2016
2017
2018
2019
2020
2021
2022
2023
2024
2025
2026
2027
2028
2029
Consumption tax (%)
0
10
20
30
40
50
60
70
80
90
2014
2015
2016
2017
2018
2019
2020
2021
2022
2023
2024
2025
2026
2027
2028
2029
Public external debt5 (% of GDP)
-2
-1.5
-1
-0.5
0
0.5
1
1.5
2
2.5
3
2014
2015
2016
2017
2018
2019
2020
2021
2022
2023
2024
2025
2026
2027
2028
2029
Baseline investment / baseline prices Baseline investment / low prices
Aggressive investment / baseline prices Aggressive investment / low prices
ISLAMIC REPUBLIC OF MAURITANIA
INTERNATIONAL MONETARY FUND 65
9. Further improvements in investment capacity would increase the benefits of public
investments in Mauritania and ultimately reduce their costs. The model application already
assumes an improvement over the next decade in the country’s public investment efficiency. A faster
or more substantial improvement would increase the positive impact of the planned investment
path on the economy, or alternatively achieve the same results as in the model baseline at lower
foregone consumption costs. The components of the PIMI index with particularly low values relative
to peers—those capturing project management and appraisal—suggest starting points for efforts to
further improve public investment efficiency in Mauritania.
ISLAMIC REPUBLIC OF MAURITANIA
66 INTERNATIONAL MONETARY FUND
Annex. Key Model Equations
The economy features three sectors: natural resource production, nontraded goods production and
traded goods production. Since the natural resource sector employs a small and stable fraction of
labor force and a large part of investment is financed by foreign investment, we assume that natural
resource production follows an exogenous process described by
where is an auto-regressive coefficient and
is the natural resource
production shock. Due to the small open economy assumption the international natural resource
price is taken as given and evolves according to
where is an auto-regressive coefficient and
is the resource price shock.
The government collects natural resource revenues from its production
where is royalty tax rate that can be made time-varying, if necessary. is the relative price of
traded goods to the consumption basket. Assuming that the law of one price holds for traded
goods implies that also corresponds to the real exchange rate.
Firms in both nontraded and traded sectors produce according to a Cobb-Douglas production
function using labor, private capital and public capital
,
where is a total factor productivity scale parameter, is the sectoral-specific private capital, is
the sectoral-specific labor, is the public capital, is the labor share of sectoral income and is
the output elasticity with respect to public capital, represents nontraded or traded sector.
We explicitly model inefficiency in the public sector. Effective investment is given by
where is government public investment expenditure, and governs the efficiency of
public investment. The law of motion of public capital is given by
captures the time-varying depreciation rate due to lack of maintenance on existing public
capital.

ISLAMIC REPUBLIC OF MAURITANIA
INTERNATIONAL MONETARY FUND 67
References
Araujo, J., and others, 2013, “Current Account Norms in Natural Resource Rich and Capital Scare
Economies” IMF Working Paper No. 13/80 (Washington: International Monetary Fund).
Buffie, E.F., and others, 2012, “Public Investment, Growth and Debt Sustainability: Putting Together
the Pieces” IMF Working Paper No. 12/177 (Washington: International Monetary Fund).
Berg, A., Portillo, R. Yang, S.-C. S., Zanna, L.-F., 2013, “Public Investment in Resource Abundant
Developing Countries” IMF Economic Review 61 (1), 92-129.
Dabla-Norris, E., and others, 2011, “Investing in Public Investment: An Index of Public Investment
Efficiency” IMF Working Paper No. 11/37 (Washington: International Monetary Fund).
International Monetary Fund, “Republic of Congo Staff Report for the 2014 Article IV Consultation,”
(Washington: International Monetary Fund).
Melina, G., S. C Yang, L. F. Zanna, 2014, “Debt Sustainability, Public Investment and Natural
Resources in Developing Countries: the DIGNAR Model” IMF Working Paper No. 14/50
(Washington: International Monetary Fund).