imf country report no. 15/190 lebanon country report no. 15/190 lebanon ... foreign-exchange and...
TRANSCRIPT
© 2015 International Monetary Fund
IMF Country Report No. 15/190
LEBANON 2015 ARTICLE IV CONSULTATION—PRESS RELEASE; STAFF REPORT; AND STATEMENT BY THE EXECUTIVE DIRECTOR FOR LEBANON
Under Article IV of the IMF’s Articles of Agreement, the IMF holds bilateral discussions with members, usually every year. In the context of the 2015 Article IV consultation with Lebanon, the following documents have been released and are included in this package: A Press Release summarizing the views of the Executive Board as expressed during its
June 26, 2015 consideration of the staff report that concluded the Article IV consultation with Lebanon.
The Staff Report prepared by a staff team of the IMF for the Executive Board’s consideration on June 26, 2015, following discussions that ended on May 12, 2015, with the officials of Lebanon on economic developments and policies. Based on information available at the time of these discussions, the staff report was completed on June 11, 2015.
An Informational Annex prepared by the IMF staff.
A Statement by the Executive Director for Lebanon.
The IMF’s transparency policy allows for the deletion of market-sensitive information and premature disclosure of the authorities’ policy intentions in published staff reports and other documents.
Copies of this report are available to the public from
International Monetary Fund Publication Services PO Box 92780 Washington, D.C. 20090
Telephone: (202) 623-7430 Fax: (202) 623-7201 E-mail: [email protected] Web: http://www.imf.org
Price: $18.00 per printed copy
International Monetary Fund Washington, D.C.
July 2015
Press Release No. 15/309 FOR IMMEDIATE RELEASE June 30, 2015
IMF Executive Board Concludes 2015 Article IV Consultation with Lebanon
On June 26, 2015, the Executive Board of the International Monetary Fund (IMF) concluded the Article IV consultation1 with Lebanon.
The conflict in Syria, now in its fifth year, dominates Lebanon’s outlook, with refugees now comprising over one-quarter of the population. The refugee crisis is straining local communities, adding to poverty and unemployment, and placing further pressure on the economy’s already-weak public finances and infrastructure. Moreover, Lebanon faces a difficult domestic political situation. The presidency has been vacant since May 2014 and a lack of consensus between the major parties is hindering passage of key legislation.
In the face of this uncertainty, growth remains subdued. Following a sharp drop in 2011, growth has crawled upward to about 2–3 percent but remains well short of potential. IMF staff estimate that GDP increased by only 2 percent in 2014 and project a similarly modest growth rate in 2015. Lebanon’s traditional growth drivers—tourism, real estate, and construction—have received a significant blow and a strong rebound is unlikely soon. Lebanon’s return to potential growth (4 percent) before 2019 is now doubtful. Inflation also declined sharply in 2014 on the back of lower oil prices and other one-off factors, but should return to about 3 percent by end-2015.
On the fiscal side, exceptional factors allowed for a primary surplus in 2014, but without decisive action fiscal deterioration will continue in 2015. The 2014 primary surplus of about 2.5 percent of GDP largely resulted from exceptional telecom transfers and, to some extent, from withheld and delayed payments. But the primary balance is expected to return to a deficit of almost 1.25 percent of GDP in 2015, with public debt remaining high at 132 percent of GDP. Foreign-exchange and financial markets continue to be resilient, despite Lebanon’s sizable external financial requirements. Inflows remain large, particularly from non-resident deposits; and in the context of Lebanon’s currency peg to the U.S. dollar, the Banque du Liban (BdL) has maintained an adequate level of gross foreign exchange reserves.
1 Under Article IV of the IMF's Articles of Agreement, the IMF holds bilateral discussions with members, usually every year. A staff team visits the country, collects economic and financial information, and discusses with officials the country's economic developments and policies. On return to headquarters, the staff prepares a report, which forms the basis for discussion by the Executive Board.
International Monetary Fund 700 19th Street, NW Washington, D. C. 20431 USA
2
Executive Board Assessment2
Executive Directors commended the authorities for preserving macroeconomic stability and market confidence despite the unprecedented humanitarian and economic spillovers from the conflict in Syria, including a daunting inflow of refugees which has taken a toll on public finances, infrastructures, and the social fabric. Against this background, they called on the international community to provide greater humanitarian and development assistance to Lebanon. While acknowledging that a very difficult economic and political context limits feasible policy choices, Directors encouraged the authorities to further strengthen confidence and secure more inclusive growth by implementing priority fiscal and structural reforms promptly.
Directors stressed that a sustained fiscal adjustment is essential. They welcomed the primary surplus in 2014, but noted that it mostly reflected one-off factors. They cautioned that, without further adjustment, the public debt ratio will continue to rise and add to existing vulnerabilities, crowding out essential public investment and social spending. As a first step, Directors encouraged the authorities to pass an appropriately ambitious budget for 2015. They also stressed the urgent need to reform the electricity sector to remove a large drain on the public finances.
More broadly, Directors underscored the need to place public indebtedness on a sustainable downward path. In this context, they advised caution in implementing a salary-scale adjustment for public-sector employees. They pointed to significant scope to increase revenue equitably, including by improving compliance and broadening the tax base, starting with fuel taxation. Further, Directors observed that changing the spending mix toward capital and social spending would help mitigate the procyclical impact of fiscal adjustment. They also considered that strengthening the safety nets and reforming the pension system could improve equity and fiscal sustainability.
Directors commended the central bank for supporting macroeconomic stability and maintaining adequate international reserves. They agreed that monetary policy should remain geared to supporting the U.S. dollar peg, which has served Lebanon well. Looking ahead, they underscored that fiscal adjustment would help reduce the financial and institutional burden on the central bank related to quasi-fiscal activities.
Directors noted the critical role played by Lebanon’s banking system in securing sustained, broad-based economic growth. They commended the authorities’ close oversight of the financial system, and stressed the need for continued vigilance and efforts to strengthen the regulatory framework. They highlighted the importance of increasing capital buffers, improving loan classification and restructuring rules, and further enhancing the framework to counter money
2 At the conclusion of the discussion, the Managing Director, as Chairman of the Board, summarizes the views of Executive Directors, and this summary is transmitted to the country's authorities. An explanation of any qualifiers used in summings up can be found here: http://www.imf.org/external/np/sec/misc/qualifiers.htm.
3
laundering and terrorism financing. Directors welcomed the authorities’ recent request for an update assessment under the Financial Sector Assessment Program.
Directors underscored the need to advance structural reforms to promote job creation and improve competitiveness. In addition to electricity reform, which is a critical priority, Directors highlighted the need for labor reforms, improvements in public service provision, and legislation to reinvigorate private investment, including in the oil and gas sector. Directors also encouraged the authorities to improve Lebanon’s statistical system, building on ongoing progress.


LEBANON STAFF REPORT FOR THE 2015 ARTICLE IV CONSULTATION
KEY ISSUES
Context. The Syrian crisis and the associated inflow of refugees continue to dominate Lebanon’s short-term outlook, compounding long-standing policy weaknesses and vulnerabilities. Political paralysis has set in, with virtually no progress on the structural front. Growth has remained modest and insufficient to make a dent in rising poverty and unemployment. A welcome improvement in the primary fiscal position in 2014 was largely due to temporary factors, and will not be sustained absent adjustment efforts—implying that, without additional effort, Lebanon’s already-sizable public debt burden will only worsen. Financial conditions have nonetheless remained stable, as deposit inflows continue to fund the economy and sizeable buffers support the credibility of the exchange rate peg.
Policy priorities. Policies should aim at restoring fiscal sustainability and securing inclusive growth, to help engineer a soft-landing to a stronger economy. While Lebanon’s macrofinancial structure has, historically, held up well in the face of past turmoil, certain features remain a source of considerable vulnerabilities. Continued oversight of the financial system will be instrumental in containing them.
Key recommendations. While difficult political conditions make major reforms difficult, action could be taken now in two important areas: (i) passing a budget for 2015—the first in a decade, as a signal that the fiscal situation is under control; and (ii) starting well-known reforms in the electricity sector, which remains a major impediment to improved productivity, competitiveness, growth, and equity.
Over the short term, the authorities should look beyond the temporary impact of lower oil prices and deliver a credible policy mix with sustained adjustment and a falling public debt ratio. Revenue measures should be broad-based, starting from increases in fuel taxation; while spending composition should move away from transfers to the electricity company toward capital projects and social programs. Fiscal adjustment would also reduce the financial and institutional burden on the Banque du Liban and ultimately promote interest rate flexibility.
Over the medium term, social stability requires job-rich and sustainable growth. Continued efforts to ensure a sound financial system will support this objective, along with structural reforms to improve competitiveness and equity, starting from Lebanon’s pension schemes.
June 11, 2015
LEBANON
2 INTERNATIONAL MONETARY FUND
Approved By Adnan Mazarei (MCD) and Ranil Salgado (SPR)
Discussions took place in Beirut during April 28–May 12, 2015. The staff team comprised Mses. Fedelino (head) and Nakhle (local economist), Messrs. Alshahrani and Tiffin (advance team’s head, all MCD), Mr. Jarmuzek (FAD), Mr. Lambert (MCM), and Mr. Takizawa (SPR). Mr. Mazarei (MCD) and Ms. Choueiri (OED) joined some of the policy discussions. The team met Prime Minister Salam, Parliament Speaker Berri, Minister of Finance Khalil, Governor of the Banque du Liban Salamé, members of parliament, and representatives of the private sector, civil society, and the international community. The team shared with the authorities its work on a range of analytical and policy issues. Ms. Panaligan and Ms. Pineda contributed to the preparation of this report.
CONTENTS
CONTEXT: POLICY INERTIA _______________________________________________________________________ 4
AMID MOUNTING RISKS ________________________________________________________________________ 10
POLICY DISCUSSIONS ___________________________________________________________________________ 14
A. A More Balanced Policy Mix ___________________________________________________________________ 14
B. Aiming Higher: Stronger and More Inclusive Growth __________________________________________ 20
STAFF APPRAISAL _______________________________________________________________________________ 28 BOXES 1. The Prolonged Impact of the Syrian Refugee Crisis ______________________________________________ 6 2. Can Nominal GDP Increase with Falling Prices and Stagnant Growth? ___________________________ 8 3. Policies Since the 2014 Article IV Consultation __________________________________________________ 9 4. Why Increasing Fuel Taxation Makes Sense ____________________________________________________ 16 5. A Financial Conditions Index for Lebanon _____________________________________________________ 21 6. Data Issues in Lebanon—Capacity Constraints ________________________________________________ 27 TABLES 1. Selected Economic Indicators, 2012–20 ________________________________________________________ 30 2. Central Government Overall Deficit and Financing, 2012–20 (In billions of Lebanese pounds) ___ 31 3. Central Government Overall Deficit and Financing, 2012–20 (In percent of GDP) _______________ 32 4. Lebanon Government Debt, 2012–20 __________________________________________________________ 33 5. Monetary Survey, 2012–20 _____________________________________________________________________ 34 6. Balance of Payments, 2012–20 _________________________________________________________________ 35 7. Financial Soundness Indicators for the Banking Sector, 2010–14 ______________________________ 36
LEBANON
INTERNATIONAL MONETARY FUND 3
ANNEXES I. Public Debt Sustainability Analysis ________________________________________________________________37 II. External Sector Assessment _______________________________________________________________________45 III. External Debt Sustainability Analysis ______________________________________________________________48

LEBANON
4 INTERNATIONAL MONETARY FUND
CONTEXT: POLICY INERTIA… 1. Lebanon has a reputation of living close to the edge. In the past, it has weathered significant shocks, sustained macroeconomic imbalances even wider than those currently experienced, with political dynamics often preventing a more strategic approach to addressing underlying vulnerabilities.
2. But this time may be different. The Syria crisis—now in its fifth year—represents one of the worst humanitarian crises since the Second World War, and is the key determinant of Lebanon’s short-term outlook and longer-term prospects (Box 1). The number of refugees has steadied, partly as a result of tighter border restrictions. But they nonetheless comprise over one-quarter of the population, straining local communities, adding to poverty and unemployment, and placing further pressure on Lebanon’s already-weak public finances and infrastructure. The authorities have stepped forward and should be commended for hosting the refugees, but they cannot shoulder this overwhelming burden alone. International support has helped, but remains insufficient given the sheer scale of Lebanon’s humanitarian and development needs.
3. The country is in the grip of a protracted political crisis. The presidency has been vacant since May 2014, and parliament lacks sufficient consensus to convene to discuss key legislation. Without a president, cabinet can still enact legislation, but only if agreed unanimously by all 24 ministers—which is very difficult given the current political fissures. Parliament’s term was recently extended (for a second time) to June 2017, adding to concerns as to its legitimacy. In this environment, a few targeted policy actions would send a strong signal about the country’s will and determination to move forward despite the many challenges ahead.
4. Growth has decelerated significantly. Following a crash from 8 percent in 2010 to less than 1 percent in 2011, growth has inched upward to around 2–3 percent, but remains well short of its potential. Inflation also declined sharply in 2014, owing to lower oil prices and a number of additional one-off developments, but is expected to return to a trend rate of about 3 percent in 2015. In this regard, lower CPI inflation has essentially offset the recent appreciation of the Lebanese pound (pegged to the U.S. dollar), leaving Lebanon’s real effective exchange rate broadly unchanged.
5. Rising uncertainty is taking a toll on the economy, but incomes and consumption are receiving a temporary boost from lower oil prices. Lebanon’s traditional growth sectors—tourism, real estate, and construction—have all taken a significant blow, and a strong rebound is unlikely in the immediate future. Indeed, early indications for 2015 point to a marked softening of the construction sector, particularly for high-end residential projects. However, the pass-through
0
5
10
15
0
5
10
15
2009 2012
GDP Indicators(Percent growth, annual)
BdL Indicator (12m ma)
IMF Staff Indicator
Official GDP
IMF Estimate
Sources: National authorities, and IMF staff calculations.
LEBANON
INTERNATIONAL MONETARY FUND 5
5
15
10
0
-5
-10
-15
Dec 2011 Dec 2012 Dec 2013 Dec 2014
M3
Trade Flows
Passenger Arrivals
Cement Deliveries
Cleared Checks
Electricity Production
Petroleum Deliveries
Sources: National authorities; and IMF staff calculations.
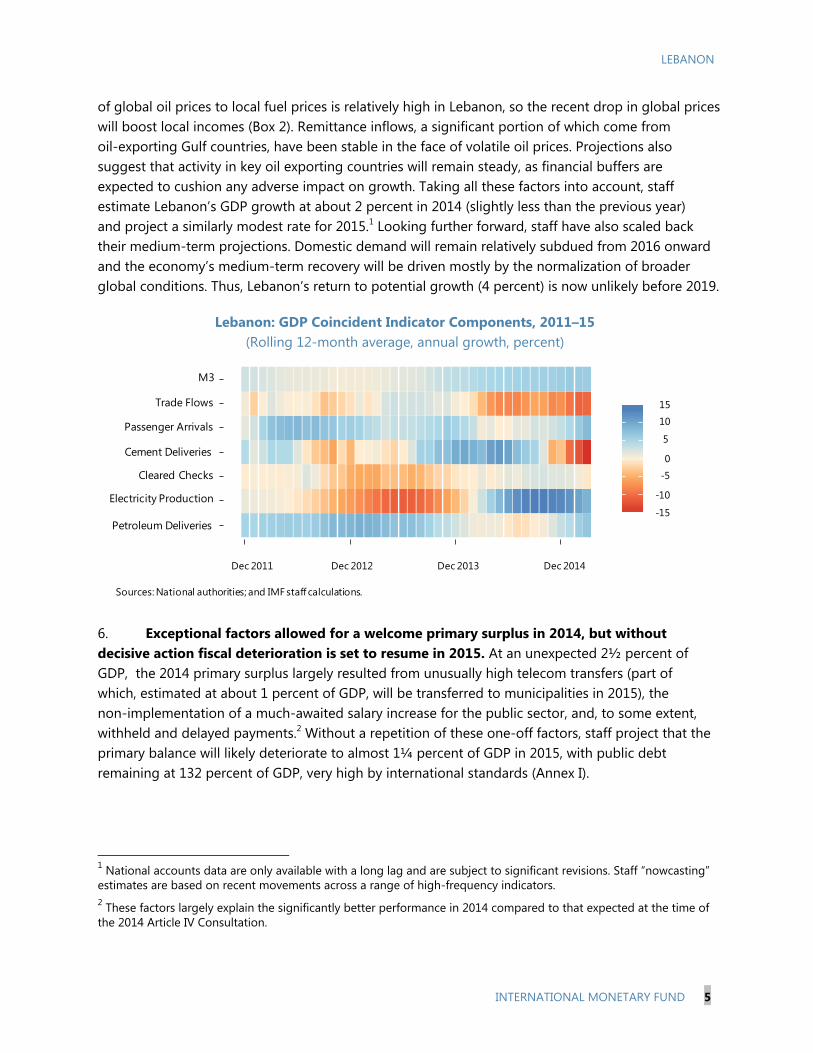
of global oil prices to local fuel prices is relatively high in Lebanon, so the recent drop in global prices will boost local incomes (Box 2). Remittance inflows, a significant portion of which come from oil-exporting Gulf countries, have been stable in the face of volatile oil prices. Projections also suggest that activity in key oil exporting countries will remain steady, as financial buffers are expected to cushion any adverse impact on growth. Taking all these factors into account, staff estimate Lebanon’s GDP growth at about 2 percent in 2014 (slightly less than the previous year) and project a similarly modest rate for 2015.1 Looking further forward, staff have also scaled back their medium-term projections. Domestic demand will remain relatively subdued from 2016 onward and the economy’s medium-term recovery will be driven mostly by the normalization of broader global conditions. Thus, Lebanon’s return to potential growth (4 percent) is now unlikely before 2019.
Lebanon: GDP Coincident Indicator Components, 2011–15 (Rolling 12-month average, annual growth, percent)
6. Exceptional factors allowed for a welcome primary surplus in 2014, but without decisive action fiscal deterioration is set to resume in 2015. At an unexpected 2½ percent of GDP, the 2014 primary surplus largely resulted from unusually high telecom transfers (part of which, estimated at about 1 percent of GDP, will be transferred to municipalities in 2015), the non-implementation of a much-awaited salary increase for the public sector, and, to some extent, withheld and delayed payments.2 Without a repetition of these one-off factors, staff project that the primary balance will likely deteriorate to almost 1¼ percent of GDP in 2015, with public debt remaining at 132 percent of GDP, very high by international standards (Annex I).
1 National accounts data are only available with a long lag and are subject to significant revisions. Staff “nowcasting” estimates are based on recent movements across a range of high-frequency indicators. 2 These factors largely explain the significantly better performance in 2014 compared to that expected at the time of the 2014 Article IV Consultation.
LEBANON
6 INTERNATIONAL MONETARY FUND
Box 1. The Prolonged Impact of the Syrian Refugee Crisis
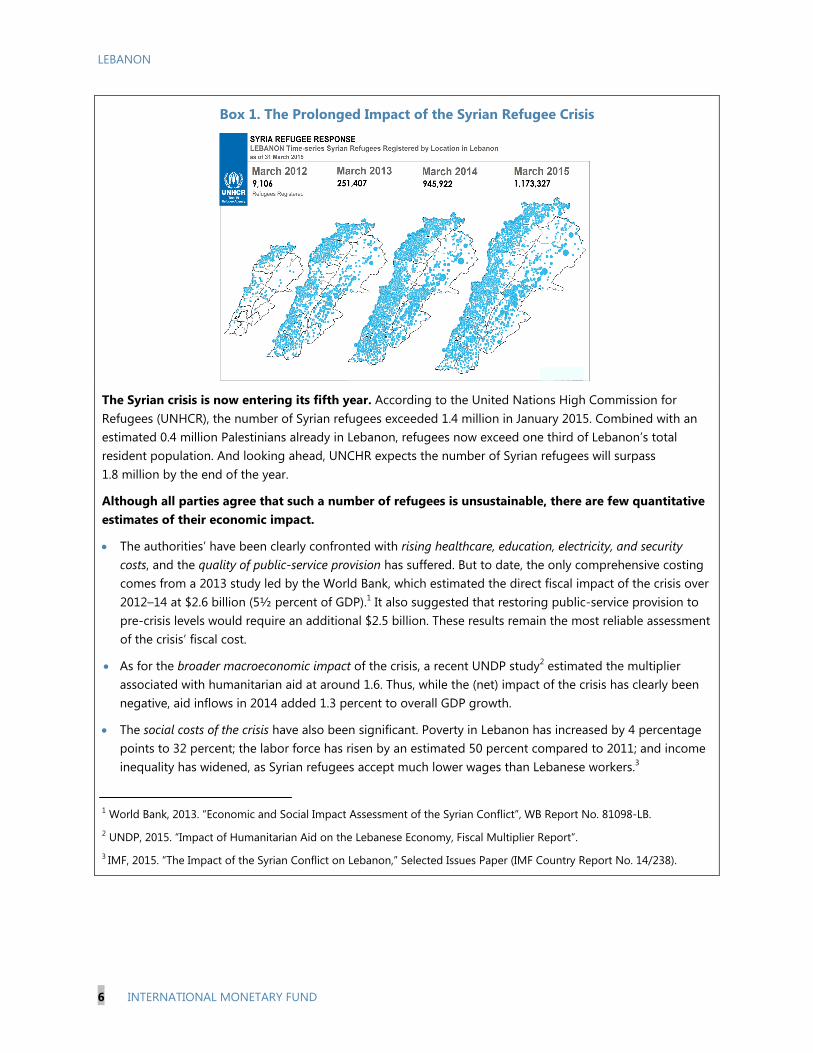
The Syrian crisis is now entering its fifth year. According to the United Nations High Commission for Refugees (UNHCR), the number of Syrian refugees exceeded 1.4 million in January 2015. Combined with an estimated 0.4 million Palestinians already in Lebanon, refugees now exceed one third of Lebanon’s total resident population. And looking ahead, UNCHR expects the number of Syrian refugees will surpass 1.8 million by the end of the year.
Although all parties agree that such a number of refugees is unsustainable, there are few quantitative estimates of their economic impact.
The authorities’ have been clearly confronted with rising healthcare, education, electricity, and security costs, and the quality of public-service provision has suffered. But to date, the only comprehensive costing comes from a 2013 study led by the World Bank, which estimated the direct fiscal impact of the crisis over 2012–14 at $2.6 billion (5½ percent of GDP).1 It also suggested that restoring public-service provision to pre-crisis levels would require an additional $2.5 billion. These results remain the most reliable assessment of the crisis’ fiscal cost.
As for the broader macroeconomic impact of the crisis, a recent UNDP study2 estimated the multiplier associated with humanitarian aid at around 1.6. Thus, while the (net) impact of the crisis has clearly been negative, aid inflows in 2014 added 1.3 percent to overall GDP growth.
The social costs of the crisis have also been significant. Poverty in Lebanon has increased by 4 percentage points to 32 percent; the labor force has risen by an estimated 50 percent compared to 2011; and income inequality has widened, as Syrian refugees accept much lower wages than Lebanese workers.3
1 World Bank, 2013. “Economic and Social Impact Assessment of the Syrian Conflict”, WB Report No. 81098-LB. 2 UNDP, 2015. “Impact of Humanitarian Aid on the Lebanese Economy, Fiscal Multiplier Report”. 3 IMF, 2015. “The Impact of the Syrian Conflict on Lebanon,” Selected Issues Paper (IMF Country Report No. 14/238).
LEBANON
INTERNATIONAL MONETARY FUND 7
Box 1. The Prolonged Impact of the Syrian Refugee Crisis (concluded)
A comprehensive strategy is yet to be put in place. As a matter of policy, Lebanon has long maintained that it is not a country of asylum, a final destination for refugees, or a country of resettlement. But there is no consensus on the best way to curb the inflows or deal with existing refugees—memories about Palestinian refugee camps have prevented the consideration of organized settlements or any measure that might allude to a permanent presence. After a long delay, the authorities adopted a policy paper in October 2014 focusing on three broad principles: (i) reducing the number of individuals registered in Lebanon as displaced; (ii) addressing local security concerns; and (iii) sharing the burden of the crisis by expanding the humanitarian response to include local communities and infrastructure. It also encouraged relocation to safe areas in Syria, or for third countries to offer more resettlement opportunities. As part of this policy, the authorities have tightened border-control requirements; and registrations of new refugees are now down to around 10,000 per month, compared to around 30,000 per month prior to October 2014.
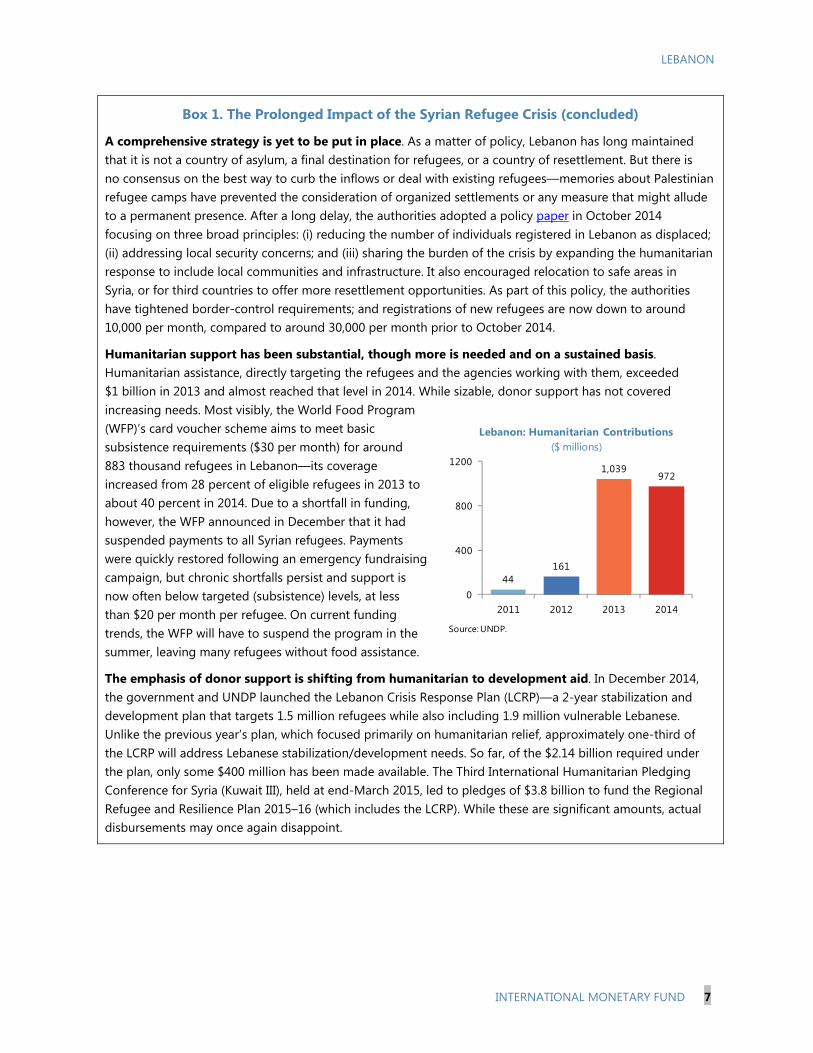
Humanitarian support has been substantial, though more is needed and on a sustained basis. Humanitarian assistance, directly targeting the refugees and the agencies working with them, exceeded $1 billion in 2013 and almost reached that level in 2014. While sizable, donor support has not covered increasing needs. Most visibly, the World Food Program (WFP)’s card voucher scheme aims to meet basic subsistence requirements ($30 per month) for around 883 thousand refugees in Lebanon—its coverage increased from 28 percent of eligible refugees in 2013 to about 40 percent in 2014. Due to a shortfall in funding, however, the WFP announced in December that it had suspended payments to all Syrian refugees. Payments were quickly restored following an emergency fundraising campaign, but chronic shortfalls persist and support is now often below targeted (subsistence) levels, at less than $20 per month per refugee. On current funding trends, the WFP will have to suspend the program in the summer, leaving many refugees without food assistance.
The emphasis of donor support is shifting from humanitarian to development aid. In December 2014, the government and UNDP launched the Lebanon Crisis Response Plan (LCRP)—a 2-year stabilization and development plan that targets 1.5 million refugees while also including 1.9 million vulnerable Lebanese. Unlike the previous year’s plan, which focused primarily on humanitarian relief, approximately one-third of the LCRP will address Lebanese stabilization/development needs. So far, of the $2.14 billion required under the plan, only some $400 million has been made available. The Third International Humanitarian Pledging Conference for Syria (Kuwait III), held at end-March 2015, led to pledges of $3.8 billion to fund the Regional Refugee and Resilience Plan 2015–16 (which includes the LCRP). While these are significant amounts, actual disbursements may once again disappoint.
44161
1,039972
0
400
800
1200
2011 2012 2013 2014
Lebanon: Humanitarian Contributions($ millions)
Source: UNDP.
LEBANON
8 INTERNATIONAL MONETARY FUND
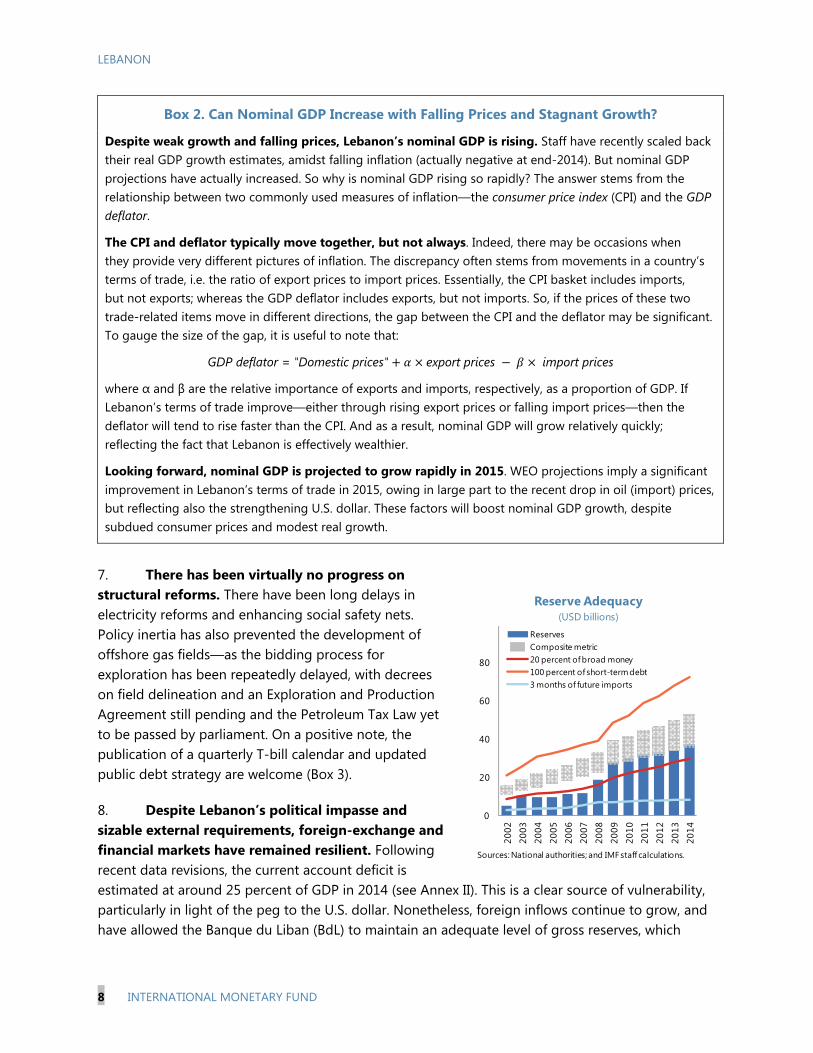
Box 2. Can Nominal GDP Increase with Falling Prices and Stagnant Growth?
Despite weak growth and falling prices, Lebanon’s nominal GDP is rising. Staff have recently scaled back their real GDP growth estimates, amidst falling inflation (actually negative at end-2014). But nominal GDP projections have actually increased. So why is nominal GDP rising so rapidly? The answer stems from the relationship between two commonly used measures of inflation—the consumer price index (CPI) and the GDP deflator.
The CPI and deflator typically move together, but not always. Indeed, there may be occasions when they provide very different pictures of inflation. The discrepancy often stems from movements in a country’s terms of trade, i.e. the ratio of export prices to import prices. Essentially, the CPI basket includes imports, but not exports; whereas the GDP deflator includes exports, but not imports. So, if the prices of these two trade-related items move in different directions, the gap between the CPI and the deflator may be significant. To gauge the size of the gap, it is useful to note that:
GDP deflator = "Domestic prices" export prices import prices
where α and β are the relative importance of exports and imports, respectively, as a proportion of GDP. If Lebanon’s terms of trade improve—either through rising export prices or falling import prices—then the deflator will tend to rise faster than the CPI. And as a result, nominal GDP will grow relatively quickly; reflecting the fact that Lebanon is effectively wealthier.
Looking forward, nominal GDP is projected to grow rapidly in 2015. WEO projections imply a significant improvement in Lebanon’s terms of trade in 2015, owing in large part to the recent drop in oil (import) prices, but reflecting also the strengthening U.S. dollar. These factors will boost nominal GDP growth, despite subdued consumer prices and modest real growth.
7. There has been virtually no progress on structural reforms. There have been long delays in electricity reforms and enhancing social safety nets. Policy inertia has also prevented the development of offshore gas fields—as the bidding process for exploration has been repeatedly delayed, with decrees on field delineation and an Exploration and Production Agreement still pending and the Petroleum Tax Law yet to be passed by parliament. On a positive note, the publication of a quarterly T-bill calendar and updated public debt strategy are welcome (Box 3).
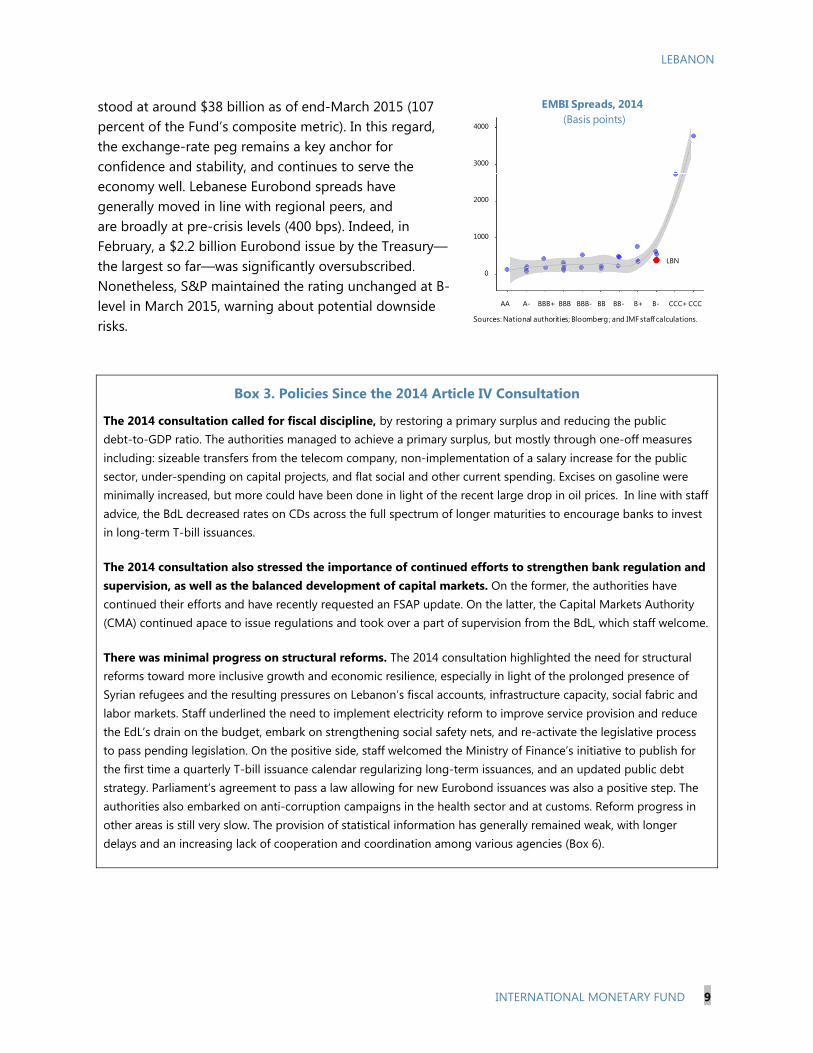
8. Despite Lebanon’s political impasse and sizable external requirements, foreign-exchange and financial markets have remained resilient. Following recent data revisions, the current account deficit is estimated at around 25 percent of GDP in 2014 (see Annex II). This is a clear source of vulnerability, particularly in light of the peg to the U.S. dollar. Nonetheless, foreign inflows continue to grow, and have allowed the Banque du Liban (BdL) to maintain an adequate level of gross reserves, which
0
20
40
60
80
2002
2003
2004
2005
2006
2007
2008
2009
2010
2011
2012
2013
2014
Reserve Adequacy (USD billions)
ReservesComposite metric20 percent of broad money100 percent of short-term debt3 months of future imports
Sources: National authorities; and IMF staff calculations.
LEBANON
INTERNATIONAL MONETARY FUND 9
AA A- BBB+ BBB BBB- BB BB- B+ B- CCC+ CCC
4000
3000
2000
1000
0
LBN
EMBI Spreads, 2014 (Basis points)
Sources: National authorities; Bloomberg ; and IMF staff calculations.
stood at around $38 billion as of end-March 2015 (107 percent of the Fund’s composite metric). In this regard, the exchange-rate peg remains a key anchor for confidence and stability, and continues to serve the economy well. Lebanese Eurobond spreads have generally moved in line with regional peers, and are broadly at pre-crisis levels (400 bps). Indeed, in February, a $2.2 billion Eurobond issue by the Treasury—the largest so far—was significantly oversubscribed. Nonetheless, S&P maintained the rating unchanged at B- level in March 2015, warning about potential downside risks.
Box 3. Policies Since the 2014 Article IV Consultation
The 2014 consultation called for fiscal discipline, by restoring a primary surplus and reducing the public debt-to-GDP ratio. The authorities managed to achieve a primary surplus, but mostly through one-off measures including: sizeable transfers from the telecom company, non-implementation of a salary increase for the public sector, under-spending on capital projects, and flat social and other current spending. Excises on gasoline were minimally increased, but more could have been done in light of the recent large drop in oil prices. In line with staff advice, the BdL decreased rates on CDs across the full spectrum of longer maturities to encourage banks to invest in long-term T-bill issuances.
The 2014 consultation also stressed the importance of continued efforts to strengthen bank regulation and supervision, as well as the balanced development of capital markets. On the former, the authorities have continued their efforts and have recently requested an FSAP update. On the latter, the Capital Markets Authority (CMA) continued apace to issue regulations and took over a part of supervision from the BdL, which staff welcome.
There was minimal progress on structural reforms. The 2014 consultation highlighted the need for structural reforms toward more inclusive growth and economic resilience, especially in light of the prolonged presence of Syrian refugees and the resulting pressures on Lebanon’s fiscal accounts, infrastructure capacity, social fabric and labor markets. Staff underlined the need to implement electricity reform to improve service provision and reduce the EdL’s drain on the budget, embark on strengthening social safety nets, and re-activate the legislative process to pass pending legislation. On the positive side, staff welcomed the Ministry of Finance’s initiative to publish for the first time a quarterly T-bill issuance calendar regularizing long-term issuances, and an updated public debt strategy. Parliament’s agreement to pass a law allowing for new Eurobond issuances was also a positive step. The authorities also embarked on anti-corruption campaigns in the health sector and at customs. Reform progress in other areas is still very slow. The provision of statistical information has generally remained weak, with longer delays and an increasing lack of cooperation and coordination among various agencies (Box 6).

LEBANON
10 INTERNATIONAL MONETARY FUND
…AMID MOUNTING RISKS 9. Lebanon’s unique macro-financial structure is a source of resilience, but also of key risks. With aggregate assets exceeding 350 percent of GDP, the Lebanese banking sector is one of the largest in the world and the largest in the MENA region as a share of GDP. Banks attract substantial deposits from both residents and nonresidents, including from Lebanon’s large overseas diaspora. And they play a crucial role in channeling these funds to both the private and public sectors, helping fund large budget and current account deficits. In itself, the banking system has a relatively conservative business model, is well-supervised, and enjoys a relatively stable funding base with significant buffers. While the nexus between the banks and the sovereign has been at the core of Lebanon’s resilience, it also means that broader macroeconomic stability depends in large part on the banks’ continued ability to attract foreign deposits.
10. Based on traditional financial-soundness indicators, there is little evidence of a build-up of risks to financial stability.
Credit to the nonfinancial private sector has grown by about 9 percent per year over 2013–14, faster than nominal output. As a result, the private sector credit-to-GDP ratio increased from 86 to 91 percent over the same period, in part driven by three BdL stimulus packages totaling $3.4 billion. While this might otherwise be a cause for concern, standard metrics such as the “credit gap” (the deviation of credit-to-GDP from its long-run trend) suggest that, based on Lebanon’s past experience, risks to financial stability are not currently out of line.
At the same time, the BdL has introduced new macroprudential measures to contain the build-up of risk, tightening provisioning rules for retail loans and imposing new restrictions on lending to households, in the form of lower loan-to-value ratios and debt-service-to-income ratios.
60
70
80
90
100
0
5
10
15
20
25
30
2007 2008 2009 2010 2011 2012 2013 2014
Credit to the Private Sector(y/y growth, percent)
Credit/GDP (RHS)
Credit Growth
Sources: Banque du Liban ; and IMF staff calculations.
Lebanon's Macro-Financial System
Note: The width of the arrows is proportional to the size of the exposures.
BANQUE DU LIBAN
RE
ST O
F T
HE
WO
RLD
BANKS
GOVERNMENT OF LEBANON
RESIDENT PRIVATE SECTOR

LEBANON
INTERNATIONAL MONETARY FUND 11
0
10
20
30
40
2008 2009 2010 2011 2012 2013 2014
Non-Resident Deposits 1/ (y/y growth)
1/ Includes deposits of non-resident banks.Sources: National authorities; IMF staff calculations.
Private sector leverage appears contained. Leverage is not a pressing worry for Lebanese banks, as the system’s leverage ratio (at 6.5 percent) is well above Basel III’s minimum requirement of 3 percent. Similarly, household indebtedness is reasonable, at around 44 percent of household income. However, there is little available data on non-financial corporate leverage.
Risks could arise following a sharper downturn of the real estate market. A sizable fraction of bank loans to the private sector have been directed at the real estate sector, where activity is softening. But, in the absence of a price index, the number and value of property sales can serve as a proxy for the housing cycle. Both indicators grew by close to 3 percent in 2014. This is slightly more than the 2009–14 average for the number of transactions, but well below the past average for the value of sold properties (around 11 percent).
11. Nonetheless, the structure of Lebanon’s financial system, and the tight nexus between banks and the sovereign, make the economy dependent on the confidence of non-resident depositors. As noted above, deposit inflows are the key source of funding for the economy. These inflows have been resilient, including in the face of financial- and commodity-market volatility. Deposit growth has decelerated over recent years—but at 7–8 percent, it has remained sufficient to cover Lebanon’s (public and external) financing needs and to maintain the current international reserve buffer. However, risks from a further escalation of regional conflict (or other external events) are exceptionally high, and could lead to a negative and potentially protracted investor response.
12. Spillovers from the Syria crisis pose the most serious threat to the economy. Under the baseline, staff assume that the conflict in Syria will begin to ease toward the end of 2016; at which point confidence will come back and growth will gradually return to potential—a modest 4 percent. Thus, in contrast to the recent past, when high GDP growth helped contain Lebanon’s imbalances, subdued growth over the
Housing Other
Hotels & Rest.
Other Real Estate
Construction
Trade and Services
Individuals IndustryFin.
Interm.
Other Agric.
Bank Loans by Sector, June 2014
Sources: Banque du Liban; and IMF staff calculations.
0
2
4
6
8
10
12
14
16
18
2015 2016 2017 2018 2019 2020
Public Debt Repayment Profile(USD billion)
Foreign principal
Foreign interest
Domestic principal
Domestic interest
Sources: National authorities; and IMF staff calculations.

LEBANON
12 INTERNATIONAL MONETARY FUND
foreseeable future will likely remain too low to stabilize debt, create jobs, or address the country’s deepening social tensions. On the (so far unlikely) upside, however, if the crisis in Syria were to be resolved, Lebanon would be in a unique position to assist in its reconstruction, with significant and positive implications for local incomes and growth.
13. Downside risks associated with the Syrian crisis are exceptionally high. In addition, two key risks also loom large (see Risk Assessment Matrix):
Continued fiscal deterioration due to political stalemate and entrenched social tensions. In the face of social pressures and refugee needs, the authorities may postpone fiscal adjustment as politically too difficult. Any such course would further increase public debt, possibly leading to financing pressures and lower investor confidence. This could, in turn, quickly spread into the macro-financial sphere—triggering lower deposits, higher financing costs, deteriorating bank finances, mounting exchange-rate pressures, and falling reserves.
Stalled structural reforms. Continued erosion of already weak infrastructure, and further disappointments, especially on the electricity front—compounded by the pressures from the refugee presence—could further weaken growth and competitiveness. This would have a direct impact on Lebanon’s already-adverse debt dynamics and social stability (with a longer-term feedback loop on domestic security).
Authorities’ views
14. The authorities broadly agreed with staff’s assessment of risks. They viewed developments in the region, most notably the crisis in Syria, as the main risk to security and relatedly, macroeconomic stability. They continued to believe that, although the international community had helped, it had done too little to allow Lebanon to deal adequately with the tragedy of the refugees, and that much more was needed to stem a crisis that transcended national and regional borders.
15. They were less concerned about spillovers from global financial market volatility and increased interest rates. They noted that, in the past, the pass-through from dollar to domestic interest rates had been gradual and incomplete, and that Lebanon would manage as long as a sufficiently large differential vis-à-vis dollar rates was maintained.
16. They shared staff’s assessment on the key role of continued deposit inflows. However, they underscored that, as the stock of deposits grows larger, less emphasis should be put on the growth rate per se rather than on the absolute size of the inflows, which continued to be sufficient to fund the economy. A slowdown in itself was not a pressing concern and was to be expected, given the domestic and regional outlook.
LEBANON
INTERNATIONAL MONETARY FUND 13
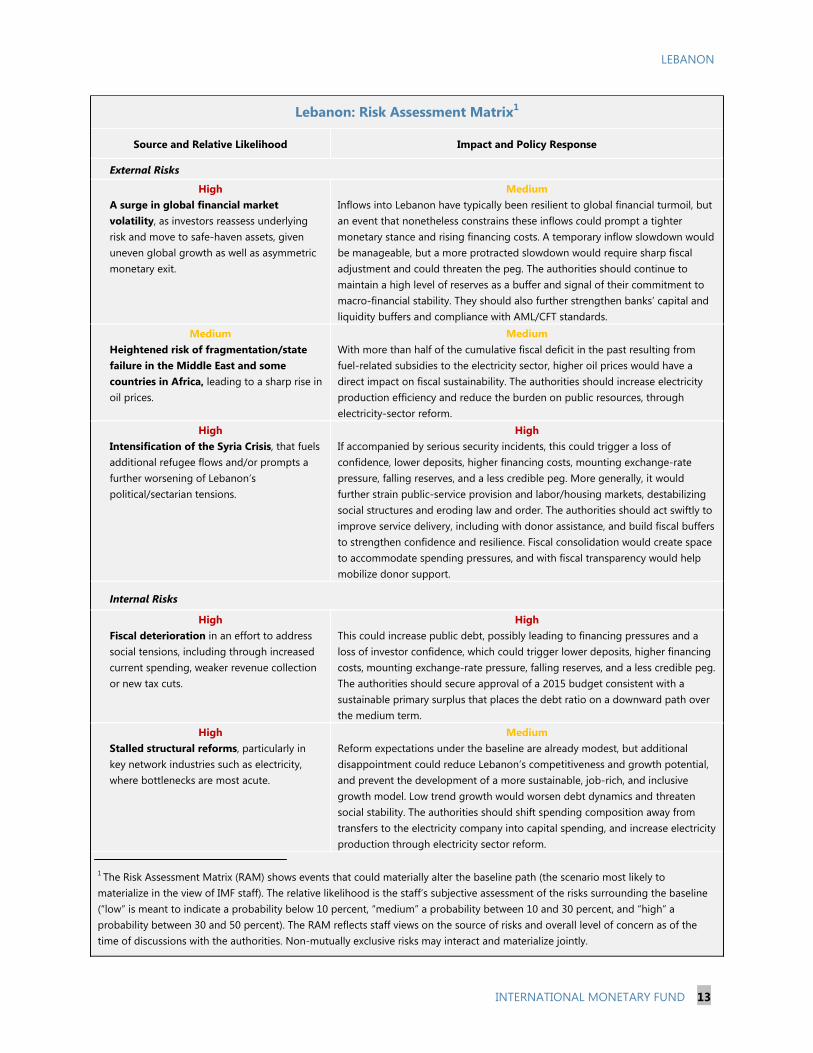
Lebanon: Risk Assessment Matrix1
Source and Relative Likelihood Impact and Policy Response
External Risks
High A surge in global financial market volatility, as investors reassess underlying risk and move to safe-haven assets, given uneven global growth as well as asymmetric monetary exit.
Medium Inflows into Lebanon have typically been resilient to global financial turmoil, but an event that nonetheless constrains these inflows could prompt a tighter monetary stance and rising financing costs. A temporary inflow slowdown would be manageable, but a more protracted slowdown would require sharp fiscal adjustment and could threaten the peg. The authorities should continue to maintain a high level of reserves as a buffer and signal of their commitment to macro-financial stability. They should also further strengthen banks’ capital and liquidity buffers and compliance with AML/CFT standards.
Medium Heightened risk of fragmentation/state failure in the Middle East and some countries in Africa, leading to a sharp rise in oil prices.
Medium With more than half of the cumulative fiscal deficit in the past resulting from fuel-related subsidies to the electricity sector, higher oil prices would have a direct impact on fiscal sustainability. The authorities should increase electricity production efficiency and reduce the burden on public resources, through electricity-sector reform.
High Intensification of the Syria Crisis, that fuels additional refugee flows and/or prompts a further worsening of Lebanon’s political/sectarian tensions.
High If accompanied by serious security incidents, this could trigger a loss of confidence, lower deposits, higher financing costs, mounting exchange-rate pressure, falling reserves, and a less credible peg. More generally, it would further strain public-service provision and labor/housing markets, destabilizing social structures and eroding law and order. The authorities should act swiftly to improve service delivery, including with donor assistance, and build fiscal buffers to strengthen confidence and resilience. Fiscal consolidation would create space to accommodate spending pressures, and with fiscal transparency would help mobilize donor support.
Internal Risks
High Fiscal deterioration in an effort to address social tensions, including through increased current spending, weaker revenue collection or new tax cuts.
High This could increase public debt, possibly leading to financing pressures and a loss of investor confidence, which could trigger lower deposits, higher financing costs, mounting exchange-rate pressure, falling reserves, and a less credible peg. The authorities should secure approval of a 2015 budget consistent with a sustainable primary surplus that places the debt ratio on a downward path over the medium term.
High Stalled structural reforms, particularly in key network industries such as electricity, where bottlenecks are most acute.
Medium Reform expectations under the baseline are already modest, but additional disappointment could reduce Lebanon’s competitiveness and growth potential, and prevent the development of a more sustainable, job-rich, and inclusive growth model. Low trend growth would worsen debt dynamics and threaten social stability. The authorities should shift spending composition away from transfers to the electricity company into capital spending, and increase electricity production through electricity sector reform.
1 The Risk Assessment Matrix (RAM) shows events that could materially alter the baseline path (the scenario most likely to materialize in the view of IMF staff). The relative likelihood is the staff’s subjective assessment of the risks surrounding the baseline (“low” is meant to indicate a probability below 10 percent, “medium” a probability between 10 and 30 percent, and “high” a probability between 30 and 50 percent). The RAM reflects staff views on the source of risks and overall level of concern as of the time of discussions with the authorities. Non-mutually exclusive risks may interact and materialize jointly.

LEBANON
14 INTERNATIONAL MONETARY FUND
POLICY DISCUSSIONS 17. Lebanon needs to take action. Over the short term, the key challenge will be to articulate a coherent policy mix, starting immediately with credible adjustment to restore fiscal sustainability. Over the longer term, social stability requires job-rich, sustainable growth that benefits all, which cannot happen without a more inclusive macroeconomic environment and structural reform. These two themes—ushering in a more balanced policy mix and laying the ground for higher and more inclusive growth—featured prominently in the 2015 Consultation.
A. A More Balanced Policy Mix
18. The need for fiscal adjustment is inescapable. Without it, and in the context of Lebanon’s slowing growth and rising global interest rates, public debt will increase. Similarly, without adjustment, government financing needs will continue to rise; the underlying codependence between banks and the sovereign will intensify; and Lebanon’s reliance on deposit inflows will grow larger, exposing the economy even more to sudden swings in depositors’ confidence. On all these counts, delayed adjustment will simply exacerbate Lebanon’s underlying vulnerabilities.
19. The case for fiscal adjustment is also grounded in fairness. Without it and with ever more debt, interest payments will soar to some 12 percent of GDP, or about 40 percent of total spending, crowding out essential social programs and infrastructure projects and largely benefitting public debt holders at the expense of the less-privileged. Thus lack of fiscal adjustment is also costly and inequitable.
20. Yet, on current policies fiscal sustainability will remain elusive. Under the baseline scenario, staff assume that the salary scale adjustment for the public sector will be implemented as part of a package including the following revenue measures:3 an increase in the corporate income tax rate (from 15 to 17 percent); the introduction of a capital gains tax on real estate; an increase in the tax rate on interest income (from 5 to 7 percent); and new stamp duties and fees. However, while the proposed package generates moderate primary surpluses, it would not be sufficient to tackle Lebanon’s deteriorating debt dynamics. As a result, debt is projected to reach 143 percent of GDP by 2020, with its trajectory subject to significant downside risks (Annex I).
3 While the salary increase is subject to uncertainty, in the ongoing political debate it is clearly linked to the adoption of (partially) compensating revenue measures. Staff projections assume that the salary increase will be implemented as of January 1, 2015, while the revenue measures will become effective as of January 1, 2016.
Lebanon: Government Spending, 2014
Wages InterestEDL
TransfersCurrent
SpendingPublic
Investment
2 squares = 1 percent of GDPSources: National authorities; and IMF staff calculations.
LEBANON
INTERNATIONAL MONETARY FUND 15
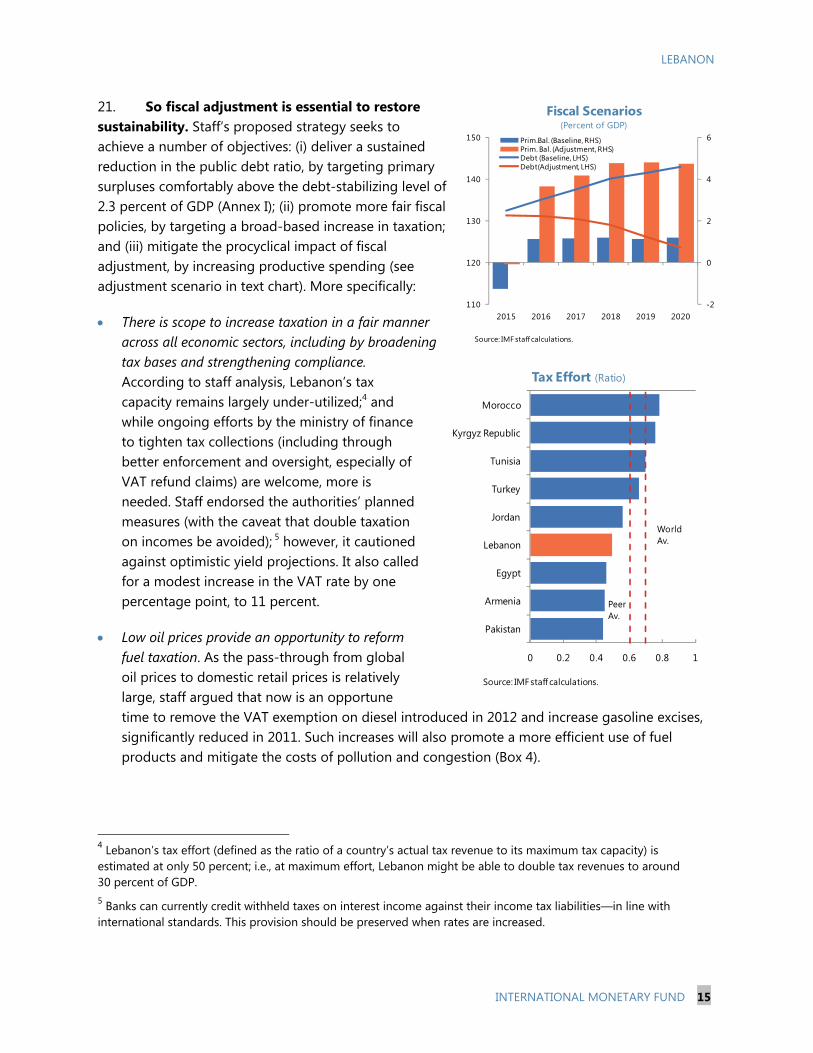
21. So fiscal adjustment is essential to restore sustainability. Staff’s proposed strategy seeks to achieve a number of objectives: (i) deliver a sustained reduction in the public debt ratio, by targeting primary surpluses comfortably above the debt-stabilizing level of 2.3 percent of GDP (Annex I); (ii) promote more fair fiscal policies, by targeting a broad-based increase in taxation; and (iii) mitigate the procyclical impact of fiscal adjustment, by increasing productive spending (see adjustment scenario in text chart). More specifically:
There is scope to increase taxation in a fair manner across all economic sectors, including by broadening tax bases and strengthening compliance. According to staff analysis, Lebanon’s tax capacity remains largely under-utilized;4 and while ongoing efforts by the ministry of finance to tighten tax collections (including through better enforcement and oversight, especially of VAT refund claims) are welcome, more is needed. Staff endorsed the authorities’ planned measures (with the caveat that double taxation on incomes be avoided); 5 however, it cautioned against optimistic yield projections. It also called for a modest increase in the VAT rate by one percentage point, to 11 percent.
Low oil prices provide an opportunity to reform fuel taxation. As the pass-through from global oil prices to domestic retail prices is relatively large, staff argued that now is an opportune time to remove the VAT exemption on diesel introduced in 2012 and increase gasoline excises, significantly reduced in 2011. Such increases will also promote a more efficient use of fuel products and mitigate the costs of pollution and congestion (Box 4).
4 Lebanon’s tax effort (defined as the ratio of a country’s actual tax revenue to its maximum tax capacity) is estimated at only 50 percent; i.e., at maximum effort, Lebanon might be able to double tax revenues to around 30 percent of GDP. 5 Banks can currently credit withheld taxes on interest income against their income tax liabilities—in line with international standards. This provision should be preserved when rates are increased.
-2
0
2
4
6
110
120
130
140
150
2015 2016 2017 2018 2019 2020
Fiscal Scenarios (Percent of GDP)
Prim.Bal. (Baseline, RHS)Prim. Bal. (Adjustment, RHS)Debt (Baseline, LHS)Debt(Adjustment, LHS)
Source: IMF staff calculations.
0 0.2 0.4 0.6 0.8 1
Pakistan
Armenia
Egypt
Lebanon
Jordan
Turkey
Tunisia
Kyrgyz Republic
Morocco
Tax Effort (Ratio)
WorldAv.
PeerAv.
Source: IMF staff calculations.
LEBANON
16 INTERNATIONAL MONETARY FUND
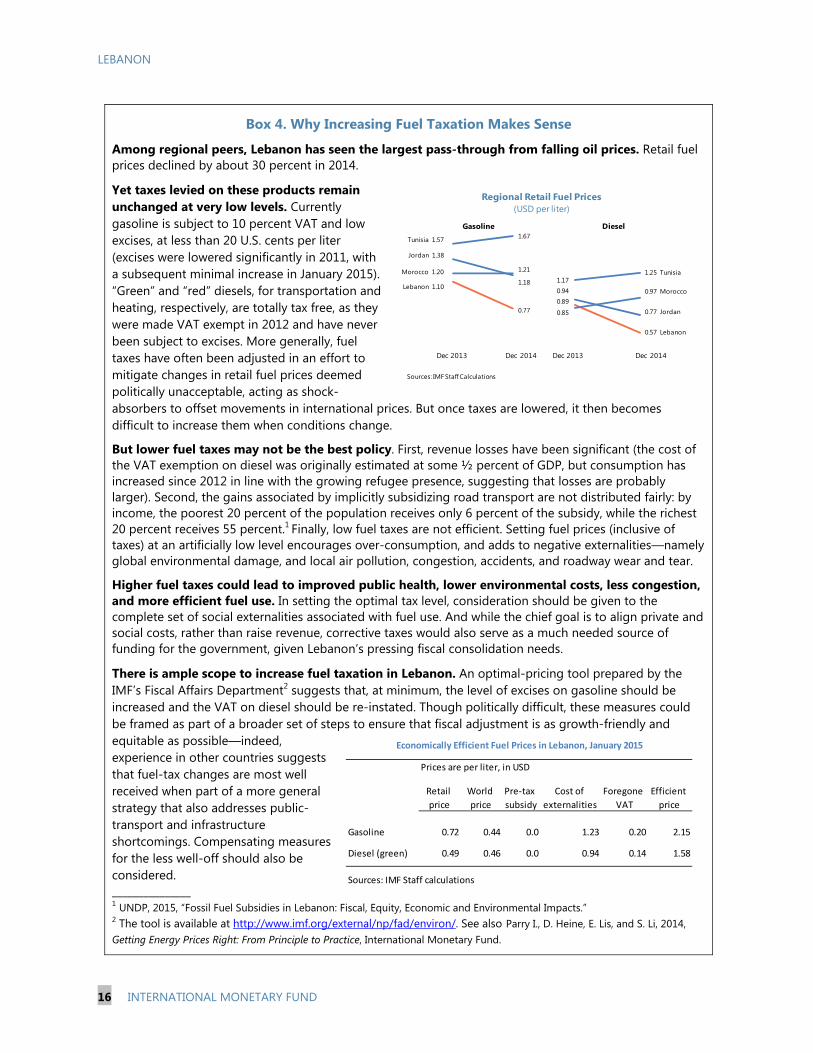
Box 4. Why Increasing Fuel Taxation Makes Sense
Among regional peers, Lebanon has seen the largest pass-through from falling oil prices. Retail fuel prices declined by about 30 percent in 2014.
Yet taxes levied on these products remain unchanged at very low levels. Currently gasoline is subject to 10 percent VAT and low excises, at less than 20 U.S. cents per liter (excises were lowered significantly in 2011, with a subsequent minimal increase in January 2015). “Green” and “red” diesels, for transportation and heating, respectively, are totally tax free, as they were made VAT exempt in 2012 and have never been subject to excises. More generally, fuel taxes have often been adjusted in an effort to mitigate changes in retail fuel prices deemed politically unacceptable, acting as shock-absorbers to offset movements in international prices. But once taxes are lowered, it then becomes difficult to increase them when conditions change.
But lower fuel taxes may not be the best policy. First, revenue losses have been significant (the cost of the VAT exemption on diesel was originally estimated at some ½ percent of GDP, but consumption has increased since 2012 in line with the growing refugee presence, suggesting that losses are probably larger). Second, the gains associated by implicitly subsidizing road transport are not distributed fairly: by income, the poorest 20 percent of the population receives only 6 percent of the subsidy, while the richest 20 percent receives 55 percent.1 Finally, low fuel taxes are not efficient. Setting fuel prices (inclusive of taxes) at an artificially low level encourages over-consumption, and adds to negative externalities—namely global environmental damage, and local air pollution, congestion, accidents, and roadway wear and tear.
Higher fuel taxes could lead to improved public health, lower environmental costs, less congestion, and more efficient fuel use. In setting the optimal tax level, consideration should be given to the complete set of social externalities associated with fuel use. And while the chief goal is to align private and social costs, rather than raise revenue, corrective taxes would also serve as a much needed source of funding for the government, given Lebanon’s pressing fiscal consolidation needs.
There is ample scope to increase fuel taxation in Lebanon. An optimal-pricing tool prepared by the IMF’s Fiscal Affairs Department2 suggests that, at minimum, the level of excises on gasoline should be increased and the VAT on diesel should be re-instated. Though politically difficult, these measures could be framed as part of a broader set of steps to ensure that fiscal adjustment is as growth-friendly and equitable as possible—indeed, experience in other countries suggests that fuel-tax changes are most well received when part of a more general strategy that also addresses public-transport and infrastructure shortcomings. Compensating measures for the less well-off should also be considered. _______________ 1 UNDP, 2015, “Fossil Fuel Subsidies in Lebanon: Fiscal, Equity, Economic and Environmental Impacts.” 2 The tool is available at http://www.imf.org/external/np/fad/environ/. See also Parry I., D. Heine, E. Lis, and S. Li, 2014, Getting Energy Prices Right: From Principle to Practice, International Monetary Fund.
Gasoline
0.57 Lebanon
0.97 Morocco
0.77 Jordan
1.25 Tunisia
Diesel
0.85
0.940.89
1.17Lebanon 1.10
Morocco 1.20
Jordan 1.38
Tunisia 1.57
Dec 2013 Dec 2014 Dec 2013 Dec 2014
Sources: IMF Staff Calculations
0.77
1.18
1.21
1.67
Regional Retail Fuel Prices(USD per liter)
Prices are per liter, in USD
Retail
price
World
price
Pre-tax
subsidy
Cost of
externalities
Foregone
VAT
Efficient
price
Gasoline 0.72 0.44 0.0 1.23 0.20 2.15
Diesel (green) 0.49 0.46 0.0 0.94 0.14 1.58
Sources: IMF Staff calculations
Economically Efficient Fuel Prices in Lebanon, January 2015

LEBANON
INTERNATIONAL MONETARY FUND 17
Lebanon: Fiscal Scenarios, 2016–18 (Percent of GDP)
Telecom transfers should be managed transparently. Staff noted that their ad-hoc nature
hampered proper cash management and called for a system of regular transfers.
The state-owned Electricité du Liban (EdL) should urgently be placed on a sound financial footing to reduce the need for government transfers. Staff noted that low oil prices have created some fiscal space, but that they cannot be relied upon to contain future transfers. Ideally, transfers should be eliminated. Staff therefore renewed calls for a comprehensive reform of the electricity sector (see next section). Ultimately, as service provision is improved, tariffs (unchanged since 1993) should be increased toward cost recovery levels while protecting lower-income consumers.
The salary scale adjustment should be implemented only if funded by credible revenue measures, phased in gradually and without retroactive payments. Staff underscored that it should be accompanied by steps toward comprehensive public-sector reform, such as lengthening working hours from 32 to 35 a week and capping overtime and benefits, to ensure that public servants are adequately remunerated based on their productivity.6 However, staff also noted that the salary debate had drawn attention away from the more pressing need for fiscal adjustment, and that fully funding the salary increases—the primary focus of ongoing political discussions—would do nothing to reduce the budget deficit, but would instead add pressures to already unsustainable public pension schemes (see below).
6 These measures were part of the original salary-scale proposal but later abandoned.
CIT
Capital Gains on Real Estate
Interest Income
Excises
Stamps and Fees
VAT
EDL Transfers
Personnel Costs
Interest payments
Capital Spending
5 percent of GDP
2016 2017 2018
BaselineAdjustment
RevenueBaselineAdjustmentSpending
Source: IMF staff estimates.
2016 2017 2018
LEBANON
18 INTERNATIONAL MONETARY FUND
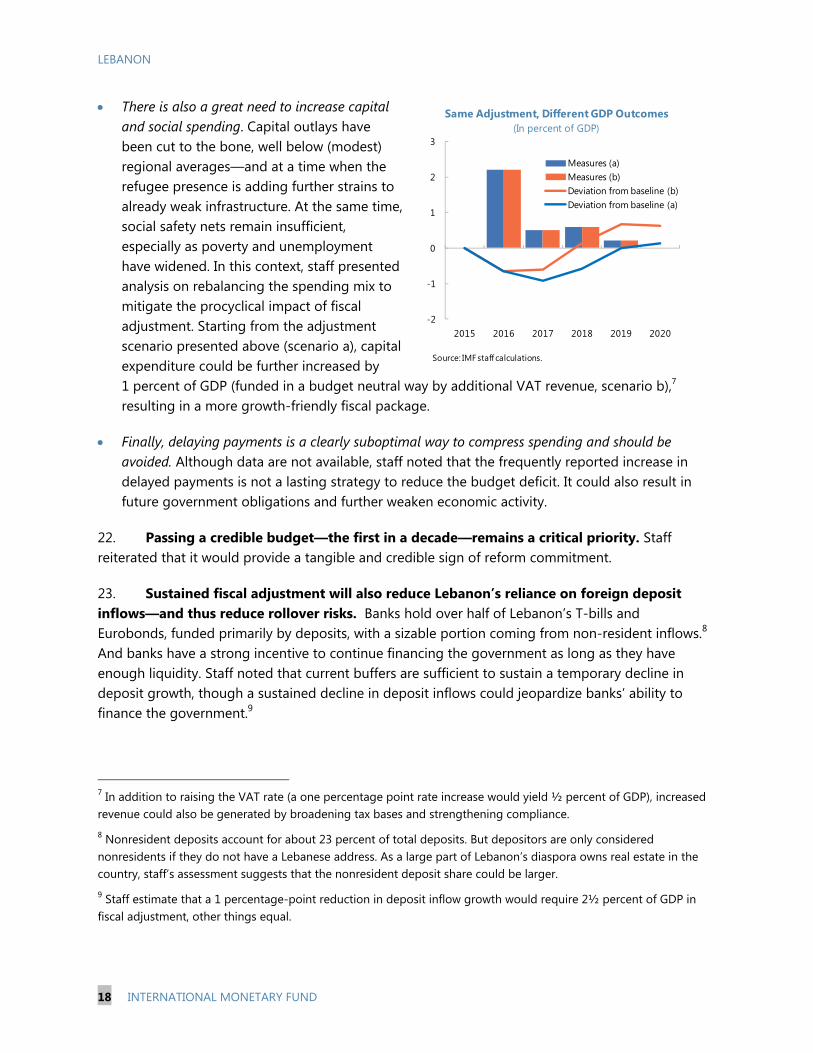
There is also a great need to increase capital and social spending. Capital outlays have been cut to the bone, well below (modest) regional averages—and at a time when the refugee presence is adding further strains to already weak infrastructure. At the same time, social safety nets remain insufficient, especially as poverty and unemployment have widened. In this context, staff presented analysis on rebalancing the spending mix to mitigate the procyclical impact of fiscal adjustment. Starting from the adjustment scenario presented above (scenario a), capital expenditure could be further increased by 1 percent of GDP (funded in a budget neutral way by additional VAT revenue, scenario b),7 resulting in a more growth-friendly fiscal package.
Finally, delaying payments is a clearly suboptimal way to compress spending and should be avoided. Although data are not available, staff noted that the frequently reported increase in delayed payments is not a lasting strategy to reduce the budget deficit. It could also result in future government obligations and further weaken economic activity.
22. Passing a credible budget—the first in a decade—remains a critical priority. Staff reiterated that it would provide a tangible and credible sign of reform commitment.
23. Sustained fiscal adjustment will also reduce Lebanon’s reliance on foreign deposit inflows—and thus reduce rollover risks. Banks hold over half of Lebanon’s T-bills and Eurobonds, funded primarily by deposits, with a sizable portion coming from non-resident inflows.8 And banks have a strong incentive to continue financing the government as long as they have enough liquidity. Staff noted that current buffers are sufficient to sustain a temporary decline in deposit growth, though a sustained decline in deposit inflows could jeopardize banks’ ability to finance the government.9
7 In addition to raising the VAT rate (a one percentage point rate increase would yield ½ percent of GDP), increased revenue could also be generated by broadening tax bases and strengthening compliance. 8 Nonresident deposits account for about 23 percent of total deposits. But depositors are only considered nonresidents if they do not have a Lebanese address. As a large part of Lebanon’s diaspora owns real estate in the country, staff’s assessment suggests that the nonresident deposit share could be larger. 9 Staff estimate that a 1 percentage-point reduction in deposit inflow growth would require 2½ percent of GDP in fiscal adjustment, other things equal.
-2
-1
0
1
2
3
2015 2016 2017 2018 2019 2020
Measures (a)Measures (b)Deviation from baseline (b)Deviation from baseline (a)
Same Adjustment, Different GDP Outcomes(In percent of GDP)
Source: IMF staff calculations.

LEBANON
INTERNATIONAL MONETARY FUND 19
24. Fiscal adjustment would reduce the financial—and institutional—burden on the BdL. The key priority of the BdL has, appropriately, been to build up Lebanon’s foreign exchange (FX) reserve buffers, given the central role of the peg as a nominal anchor. To this effect, the BdL has been channeling FX resources from the banking system into international reserves. Over the past couple of years, however, some of these funds have also been used to meet the FX needs of the government. At the same time, the BdL has also played a growing role in the allocation of credit to the private sector, by introducing subsidized schemes—accounting for about 20 percent of total outstanding loans and close to 75 percent of housing loans in 2014. Staff called for a gradual withdrawal from such quasi-fiscal schemes, allowing old subsidized credit schemes to expire. All these operations have taken a toll on the BdL’s income position. Looking forward, there is a need to gradually strengthen the BdL’s balance sheet.10
25. Finally, fiscal adjustment would allow for more market-determined interest rates. Staff noted that the BdL, at times, has helped finance the government by offering well-remunerated term deposits to banks in local currency, and channeling the proceeds to cover shortfalls in the T-bill market. As a result, the BdL has been effectively managing short- and medium-term T-Bill yields (unchanged since 2012) by using rates on its own CDs as a key signal. While financial conditions do not appear excessively loose or tight (Box 5), staff underscored that unchanging interest rates tend to dampen market signals, potentially distorting resource allocation and hindering market development. It therefore recommended that, as fiscal adjustment takes hold, the BdL should scale back its role as intermediary between banks and the sovereign, paving the way for more market-based benchmark T-bill yields.
Authorities’ views
26. The authorities agreed that reducing the debt ratio is the main priority. They noted however that the political environment is extremely difficult, as shown by the protracted debate on the 2015 budget. While there was general consensus around the need to tackle well-known issues—such as reforms of electricity and civil service—concrete steps were unlikely. At the same time, they acknowledged that even small steps could have high impact as a signal of political action. Views remained split on the salary adjustment package, with some underscoring the need to bring hiring under control and adopting differentiated salary scale increases for different categories of public sector. At the same time, some noted that higher salaries were needed to secure a more decent living for public servants, and to mitigate corruption; while others were of the view that such increases cannot be afforded now.
27. The authorities also welcomed the emphasis on growth and fairness. They appreciated that, in contrast with past advice, staff was no longer recommending a VAT rate increase up to 15 percent, which they had viewed as regressive and politically unacceptable. They welcomed the
10 Lebanon is not a Special Data Dissemination Standards subscriber, and does not report data according to the International Reserves and Foreign Currency Liquidity Template. Details of the country’s net reserve position are therefore not published.

LEBANON
20 INTERNATIONAL MONETARY FUND
Fund’s ongoing technical assistance on boosting tax capacity through broadening tax bases and strengthening compliance, which would help spread the burden of adjustment.
28. There was broad agreement on the need to rebalance the policy mix to lighten the burden placed on the BdL. The authorities generally recognized that the BdL has been doing much to preserve the credibility of the peg while providing support to the government and the economy. They noted that recent steps to lower CD rates to align them fully with T-bill rates had been well-received, and could pave the way over time to a less active role in the management of government debt. But they disagreed with the claim that the BdL was actively intermediating the flow of funds between the banks and the government. Instead, they stressed that the issue of longer-term CDs was, in part, motivated by the BdL’s capital-market development goals—long-term BdL CDs were viewed as a key first step in extending the yield curve, and would ultimately help promote the issuance of longer-term T-bills by the Treasury. In this connection, they also explained that T-bills are more desirable than CDs to banks because they are more liquid—in fact when the government followed the central bank with the issuance of longer maturity bonds, banks showed appetite for these instruments. More broadly, they remained confident that the balance sheet of the BdL would be strengthened over time, though conditions were not yet favorable for pursuing alternative policy actions in the short term.
B. Aiming Higher: Stronger and More Inclusive Growth
29. Higher growth, better growth. Current low growth rates are insufficient to address social inequities and create jobs; and even in the past, higher growth has often only benefitted a few. In discussing Lebanon’s longer-term prospects, staff stressed three key areas: strengthening the financial system; structural reform, especially in electricity; and more and better data.
Financial stability
30. Sustained, broad-based growth requires a sound financial system. The banking system is one of the economy’s most critical pillars, and has contributed to growth and prosperity. Access of households and firms to banking services is high compared to the region or with other countries of similar income level.

LEBANON
INTERNATIONAL MONETARY FUND 21
Box 5. A Financial Conditions Index for Lebanon
A Financial Condition Index (FCI) combines several financial variables that influence GDP growth. It provides a summary measure of domestic financial conditions and can be used to assess macro-financial linkages. In particular, it points to the financial factors that are supporting or slowing real activity at any point in time.
Financial conditions appear to have tightened over the past year in Lebanon. Staff computed an FCI, showing that key drivers have been lower deposit growth and an appreciating real exchange rate, offset in part by low global interest rates.
The computation involves three steps.1
First, a vector-autoregressive model including financial variables and real GDP growth was estimated using quarterly data. The financial variables in the model include the 6-month LIBOR rate, deposit growth, the spread between lending and deposit rates (both in USD and local currency), and the real effective exchange rate (REER). The sample period covers 1995–2014.
Second, impulse responses are computed to assess the cumulative impact of a one-unit shock to the financial variables on GDP growth after 6 quarters. Structural shocks are identified through a Cholesky decomposition.2
Third, the estimated responses are used as weights for each variable in the FCI. All financial variables are expressed as deviations from their sample means.
LIBOR, deposit growth, and the REER are key drivers, with a more limited role for bank interest rate spreads.
Financial conditions eased significantly after 2008, supporting growth. The loosening reflected higher deposit inflows, lower global interest rates, a real depreciation and falling bank spreads.
But since 2014, financial conditions have tightened, in step with slowing economic activity. Deposit growth in particular has decelerated, and is below its 20-year average. Looking forward, rising global interest rates are expected to further tighten local conditions.
_____________________________________________________
1 See IMF’s Asia and Pacific Department Spring 2009 Regional Economic Outlook (Box 1.4), and Swiston (2008),“A U.S. Financial Conditions Index: Putting Credit Where Credit is Due,” IMF Working Paper 08/161. 2 The ordering assumes that domestic financial variables do not have a contemporaneous effect on GDP growth and that GDP growth and domestic financial variables do not contemporaneously affect the LIBOR rate.
-2
0
2
4
6
8
10
12
-30
-20
-10
0
10
20
30
1995 1997 1998 2000 2001 2003 2004 2006 2007 2009 2010 2012 2013
Financial Conditions Index
6-month LIBOR Deposit growthUSD loan-deposit spread LBP loan-deposit spreadReal effective exchange rate Financial Conditions IndexReal GDP growth (q-o-q, in percent, right scale)
Loos
erTi
ghte
r
Source: IMF staff estimates.

LEBANON
22 INTERNATIONAL MONETARY FUND
Indicators of Financial Inclusion
31. But the current environment is particularly challenging. Banks’ capital buffers are modest, considering their significant exposure to zero-weighted local-currency sovereign debt. And despite the implicit subsidy associated with the BdL’s credit support schemes, net interest margins have been contracting (though from large levels) and profit growth is down. Although as noted above there is little evidence that credit growth in Lebanon is excessive, the unfavorable outlook, combined with limited private-sector lending opportunities and already-large exposures to the government, would affect banks’ medium-term profitability.
32. Continued efforts to strengthen banking regulation and supervision are crucial. Nonperforming loans (NPLs) have increased slightly, from a low base, while provisioning has decreased and the use of overdraft facilities is widespread. Staff noted that the low level of NPLs, in particular, is potentially at odds with Lebanon’s slowing economy, and will likely increase in the short-to-medium term. In this regard, loan-classification rules do not provide an explicit test of whether the renegotiation or rescheduling of a loan could be concealing debt service problems. And there is no written rule regarding the classification of high-balance overdrafts that are permanently rolled over. Staff reiterated that the risk weights applicable to foreign currency claims on the BdL and holdings of Eurobonds should be set in accordance with the Basel capital adequacy framework. It welcomed the Banking Control Commission’s efforts to strengthen its supervision of banking groups with cross-border operations, and encouraged pursuing the establishment of supervisory colleges for Lebanese banking groups with significant operations abroad.
33. Macroprudential policies can be helpful to limit systemic risk. Staff welcomed the creation of a Financial Stability Unit within the BdL to monitor financial risks. New macroprudential measures were introduced in 2014—though it is too early to assess their effectiveness.
LebanonMiddle East and
North AfricaUpper Middle Income
Countries
Percentage of adults with a banking account (2011) 37 18 57
Percentage of adult women with a banking account (2011) 26 13 53
Percentage of adults having borrowed from a financial institution (2014) 15.6 n.a. 10.4
Percentage of firms with a line of credit (2013) 57.3 27.3 37.8
Percentage of small firms with a line of credit (2013) 49.1 21.8 32.6
Sources: National authorities; and World Bank FinStats Database.
02468
10
Capital adequacy
Profitability
Asset quality
FX exposure
Exposure to the sovereign
Liquidity
Bank Risk Indicators2013Q4
2014Q4
Note: Away from center signifies higher risks.Sources: BCC; and IMF staff calculations.

LEBANON
INTERNATIONAL MONETARY FUND 23
34. Risks related to Anti-Money Laundering and Combating the Financing of Terrorism (AML/CFT) issues remain. The existing legislation is not in line with revised international standards, as a new AML/CFT Law has been pending in parliament since 2010. Staff therefore called for its adoption and for the allocation of sufficient resources for its effective implementation. The BdL has also recently strengthened monitoring requirements at the level of each banking branch. Efforts should also focus on the regulation of cross-border cash transactions and the risk-based supervision of banks, and money remitters in particular, along with developing a better understanding of the origin of non-resident deposits and their beneficial owners.
35. The authorities’ request for an FSAP update is most welcome. The update is scheduled for 2016, and should also tackle the development of capital markets to help promote a more diversified flow of resources to the economy.
36. Reform of capital markets should continue. Building on ongoing progress (Box 3), staff recommended a rapid move to transforming the Beirut Stock Exchange into a joint-stock company—already foreseen in the law that established the Capital Markets Authority—to pave the way for its privatization.
Authorities’ views
37. The authorities agreed that a sound banking system is critical to Lebanon’s future growth and prosperity. In this regard, both the banks and their supervisors were keenly aware of the economic and reputational risks associated with Lebanon’s challenging environment, and all agreed on the need for a continued culture of prudence and caution. They underscored the BdL’s efforts to address Basel requirements ahead of the implementation deadlines and to require additional capital buffers on top of the Basel III minimum and conservation buffers. They noted that the decline in the ratio of specific provisions to NPLs over the past year was due to a composition effect—NPLs include "substandard" loans, which had increased in importance, but do not require specific provisions. The Banking Control Commission is progressively moving toward the adoption of International Financial Reporting Standards (IFRS) 9 norms that would require provisioning based on expected losses. But in the interim, it was stressed that total provisioning, including both specific and general provisions, had increased as a share of total NPLs. The authorities agreed that NPLs would likely grow in the immediate future, but considered that banks had sufficient buffers to comfortably absorb any increase.
38. The authorities expressed confidence in the effectiveness of Lebanon’s AML/CFT regime. They noted that, although the current framework is not formally compliant with international standards, there are three draft laws pending parliamentary approval. In the interim, the BdL requires that Lebanese banks abide by the regulations in place in the countries of their correspondent banks whenever these are stricter. They mentioned the reluctance and even refusal of Lebanese banks to deal with small money remitters as evidence of bank awareness of AML/CFT issues and stricter controls. Hence there is no concern about derisking by international correspondent banks vis-à-vis their Lebanese counterparts.

LEBANON
24 INTERNATIONAL MONETARY FUND
80
90
100
110
1202011 2012 2013 2014
Lebanon: Competitiveness Rank, 2011–14(Rank out of 144)
Source: World Economic Forum.
39. The authorities also underscored the importance of continuing the reform of capital markets. They highlighted the significance of market consultations on the capital markets regulations, with assistance from the World Bank, to marshal support and ownership of the reforms. As to the transformation of the Beirut Stock Exchange into a joint-stock company, they regretted that progress had been slow.
Structural reform
40. There cannot be enduring and inclusive growth without structural reform. The traditional drivers of growth in Lebanon are also those most vulnerable to region-wide uncertainty and security concerns. These sectors, in addition, have failed to provide the high-quality, job-rich growth needed to secure social stability. Indeed, Lebanon’s employment-growth elasticity (0.2) is one of the lowest in the region, and job creation has not kept up with the economy’s rapidly expanding labor force—now increased by the refugee influx.11 The reform agenda is well known, but little has been done. 41. Lebanon’s current account deficit suggests an underlying competitiveness problem, even factoring in the Syria crisis. The sharp increase in the deficit is attributable, in part, to the disruption of traditional trade relationships and elevated regional uncertainty—though the deficit is expected to improve (slowly) over the medium term. Nonetheless, even abstracting from the impact of Syria, the external balance is weaker than suggested by fundamentals, pointing to an underlying problem with productivity and competitiveness (see Annex II). If Lebanon is to transition to a stronger, more sustainable growth model, action is needed to boost
productivity, fight corruption, and address the cost of doing business.
42. Electricity reform is an urgent priority. Lebanon’s inefficient electricity supply is a major impediment to growth: losses from EdL weigh heavily on public finances, and poor service delivery has prompted the extensive use of costly private generators. Implementation of longstanding plans to strengthen generation capacity, switch to less-expensive natural gas, and improve transmission and distribution would go a long way
11 Officially, unemployment is estimated at 11 percent (though more than 20 percent including the refugees).
0 5 10 15 20
Jordan
Morocco
Mauritania
Algeria
Lebanon
Pakistan
Yemen, Rep.
Percent of Annual Sales
Losses Due to Electricity Outages
Source: World Bank Enterprise Survey, 2013.
LEBANON
INTERNATIONAL MONETARY FUND 25
toward reducing business and consumption costs. It would also ensure more equitable access to essential services. In parallel, the authorities should start to bring electricity tariffs more in line with cost recovery to reduce the burden on public finances—though in a way that protects more vulnerable consumers.
43. Similarly, the passage of pending legislation would be a welcome signal for potential investors. The framework law for Public Private Partnerships (PPPs)—awaiting parliamentary approval for three years—could help mobilize private-sector resources for infrastructure investment, though with due attention to possible fiscal risks. Similarly, long-delayed decrees on gas resources would not only signal to investors that the government is capable of moving beyond its current paralysis, it might also trigger the start of renewed FDI inflows. 44. Reforms are also needed to arrest the chronic de-skilling of Lebanon’s labor force, and promote high-productivity growth. While the immediate need is to create formal-sector employment opportunities for lower-skilled workers (for example, through special programs and targeted public work schemes), over time Lebanon needs to move toward higher-quality sectors to absorb its flow of new, highly-skilled job seekers. Indeed, preliminary results from a recent ILO survey suggest that prospects for university graduates in Lebanon—in terms of an education premium for entry-level salaries or the ease of transition to a regular job—is worse than the MENA average.12 45. Finally, better public services will not only improve competitiveness but also increase equity. In addition to Lebanon’s large current account deficit, other indicators suggest that the economy is losing external competitiveness. Part of the explanation is the fact that public-service delivery and social safety nets are far from satisfactory: hindering the economy’s ability to respond to new opportunities and to provide an environment in which dynamic and innovative firms can thrive. Indeed, Lebanon has an enviable supply of high-quality human capital, but halting the economy’s ongoing brain drain will require better core services and a social protection system that is both reliable and fair. 46. A case in point is the pension system, which is not only fiscally unsustainable but also suffers from striking equity shortcomings. Short-term improvements should include the implementation of selected parametric changes and only limited indexation to salaries—especially in view of the planned salary scale adjustment. Over the longer term, a unified pension scheme for public and private sector employees would go a long way to address the system’s sustainability and equity concerns.
12 ILO (2015) “School to Work Transition Survey Data” (unpublished).
LEBANON
26 INTERNATIONAL MONETARY FUND
Authorities’ views
47. The authorities agreed broadly with staff’s diagnosis and suggested priorities, but noted that the lack of reform was a symptom of Lebanon’s underlying political deadlock. The reform agenda is well known. Indeed, many specific measures—such as a proposed adjustment to electricity tariffs, the expansion of electricity generation capacity, the introduction of LNG facilities, the oil and gas laws, or an agreed PPP framework—had been prepared and agreed at a technical level, but were awaiting agreement by the council of ministers. Regrettably, further progress was unlikely without a resolution of the current political crisis. Nonetheless, the authorities noted that the ongoing dialogue between the various factions, and the recent concerted efforts to pass a budget underscored a general commitment by all parties to find a solution, and insisted that once found, action on the reform agenda could follow very quickly. 48. The authorities welcomed the renewed emphasis on pension reform. They underscored the need to address the generosity of the pension scheme, highlighted the system’s inadequacy and expressed concern that the planned salary scale adjustment will result in additional pressures on pension liabilities.
Data Issues
49. Timely and reliable data are crucial for greater accountability. Although data collection and dissemination have improved in some areas, national and external accounts, fiscal, social, and labor-market statistics remain weak, undermining economic decision making, transparency, and policy effectiveness. Staff expressed concern about accumulating delays in the provision of data to the public, and noted increasing lack of cooperation and coordination among various agencies (Box 6). Steps to restore and strengthen collaboration—along with adequate funding and high-level support for the Central Administration of Statistics—would help improve statistics.
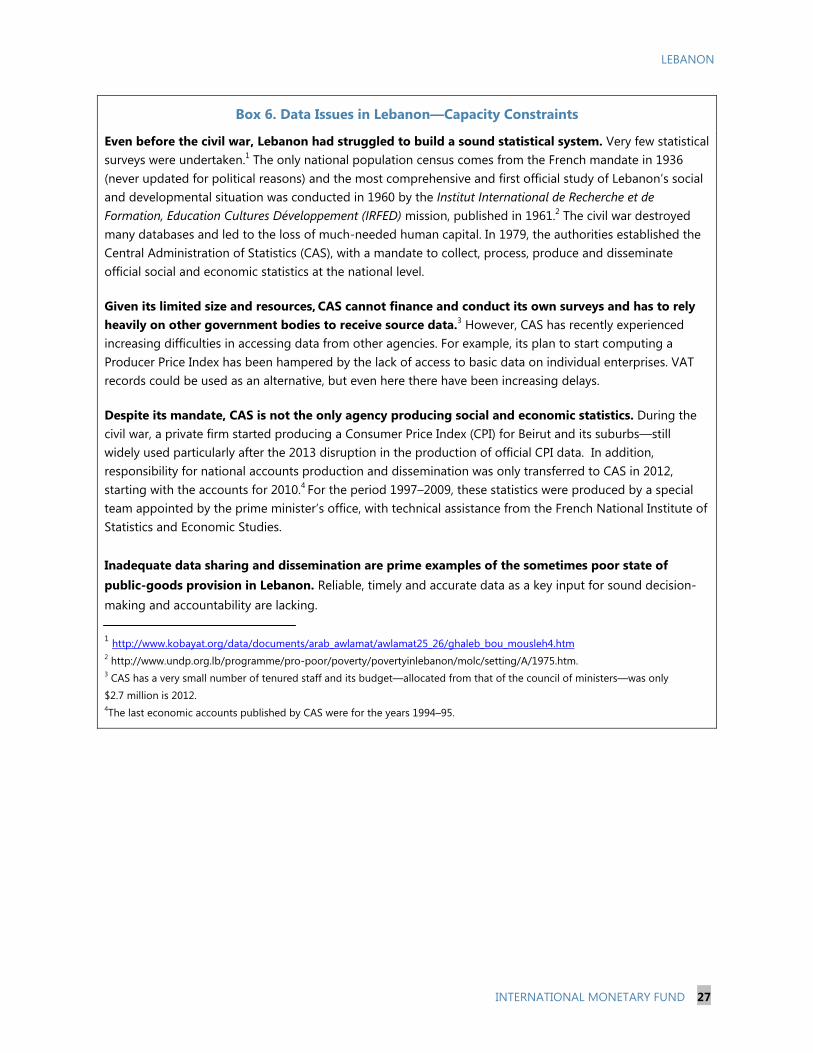
LEBANON
INTERNATIONAL MONETARY FUND 27
Box 6. Data Issues in Lebanon—Capacity Constraints
Even before the civil war, Lebanon had struggled to build a sound statistical system. Very few statistical surveys were undertaken.1 The only national population census comes from the French mandate in 1936 (never updated for political reasons) and the most comprehensive and first official study of Lebanon’s social and developmental situation was conducted in 1960 by the Institut International de Recherche et de Formation, Education Cultures Développement (IRFED) mission, published in 1961.2 The civil war destroyed many databases and led to the loss of much-needed human capital. In 1979, the authorities established the Central Administration of Statistics (CAS), with a mandate to collect, process, produce and disseminate official social and economic statistics at the national level.
Given its limited size and resources, CAS cannot finance and conduct its own surveys and has to rely heavily on other government bodies to receive source data.3 However, CAS has recently experienced increasing difficulties in accessing data from other agencies. For example, its plan to start computing a Producer Price Index has been hampered by the lack of access to basic data on individual enterprises. VAT records could be used as an alternative, but even here there have been increasing delays.
Despite its mandate, CAS is not the only agency producing social and economic statistics. During the civil war, a private firm started producing a Consumer Price Index (CPI) for Beirut and its suburbs—still widely used particularly after the 2013 disruption in the production of official CPI data. In addition, responsibility for national accounts production and dissemination was only transferred to CAS in 2012, starting with the accounts for 2010.4 For the period 1997–2009, these statistics were produced by a special team appointed by the prime minister’s office, with technical assistance from the French National Institute of Statistics and Economic Studies. Inadequate data sharing and dissemination are prime examples of the sometimes poor state of public-goods provision in Lebanon. Reliable, timely and accurate data as a key input for sound decision-making and accountability are lacking. 1 http://www.kobayat.org/data/documents/arab_awlamat/awlamat25_26/ghaleb_bou_mousleh4.htm 2 http://www.undp.org.lb/programme/pro-poor/poverty/povertyinlebanon/molc/setting/A/1975.htm. 3 CAS has a very small number of tenured staff and its budget—allocated from that of the council of ministers—was only
$2.7 million is 2012. 4The last economic accounts published by CAS were for the years 1994–95.
LEBANON
28 INTERNATIONAL MONETARY FUND
STAFF APPRAISAL العين بصيرة واليد قصيرة
The eye sees, but the arm is short (cannot reach), Arabic proverb
50. As the proverb goes, Lebanon can see but its arms are incapable of reaching. The problems and challenges it faces are well-known, though little is being done to address them. And since resilience in the face of adversity has always won the day, the main challenge now is a growing sense of complacency in the political system. In fact, political inertia is moving the country steadily backward—the legitimacy of Lebanese institutions is eroding, and the ability of the political class to work toward common solutions is waning. Perhaps more worryingly, even at the technical level political divisions are triumphing over traditional norms that have, in the past, tended to encourage cooperation. Data provision is a case in point, with increasing delays and difficulties in getting information across institutions, or even between departments in the same agency. 51. Lebanon’s traditional lifelines should not be taken for granted. Established growth sectors have been hit hard, while poverty and unemployment are increasing, and fiscal sustainability is in jeopardy. And although the bank-sovereign nexus has been a source of resilience, the economy relies on continued deposit inflows and so remains vulnerable to adverse shifts in confidence. The country has faced difficulties before, but this time they have come together in a particularly detrimental combination, with a potentially lasting impact. The oil price decline has provided breathing space, but only temporarily.
52. Lebanon’s economic problems are compounded by formidable security challenges. The country hosts over 1 million refugees from Syria, and faces growing security risks from an increasingly tense regional environment. International support has helped, but more is needed urgently, especially for the hosting communities. Still, despite all odds, Lebanon has managed so far—especially in the area of security, a key precondition for stability. Increasingly though, macroeconomic stability and shared prosperity will be critical in anchoring longer-term security, and in defusing looming social tensions. 53. Faced with exceptional circumstances, policies should aim at restoring fiscal sustainability and securing inclusive growth. While these goals will require a concerted medium-term strategy—a remote prospect at present, given the political impasse—efforts should be focused in the interim on a few concrete steps. These would not only serve as symbols of a nation that is now able to move forward, but would also in themselves help engineer a soft-landing to a better future. Two priority areas stand out. 54. The first priority is passing a budget for 2015—the first in a decade—to signal that the fiscal situation is under control. Attention has been focused on a controversial salary scale adjustment for the public sector, which has been promised but which the country can ill-afford right now. If passed, it should be conditional on measures to mitigate its impact (a strong revenue package; no retroactive payments and with installments; and measures to increase public sector
LEBANON
INTERNATIONAL MONETARY FUND 29
productivity). However, there is an urgent need to pass revenue measures regardless, including increased fuel taxation, broader tax bases and strengthened compliance. This will help secure a sustainable primary balance, and create fiscal space for more capital projects and social spending. Finally, credible fiscal adjustment will allow monetary policy to refocus squarely on supporting the peg—which remains the key nominal anchor—and less on propping up the economy and ensuring an adequate flow of funding for the government. 55. The second priority is the electricity sector. Households and businesses have long suffered from inadequate electricity provision, having (almost universally) to resort to very expensive private generation, while the government has been bleeding funds to support EdL. Cabinet should urgently implement electricity improvements—a game-changer—for productivity, competitiveness, growth, and equity. 56. The authorities’ close oversight of the financial system is welcome but should be reinforced. Strengthened supervision will support bank stability. But, given Lebanon’s challenging environment, there is also a need to increase capital buffers, improve loan classification and restructuring rules, and further enhance the AML/CFT framework. The forthcoming FSAP will add recommendations in this area. In addition, privatization of the Beirut Stock Exchange will help deepen financial markets, by encouraging start-ups to launch IPOs and opening the door for trading commodities. 57. Structural reforms remain essential to enhance Lebanon’s growth potential. There is an urgent need to jump-start the legislative agenda—including on the new Petroleum Tax Law, the Exploration and Production Agreement for the oil and gas sector, and the Public Private Partnership framework law to attract private investment. Labor reforms that help create formal-sector employment opportunities for lower-skilled workers are also needed, especially given the added pressure from Syrian refugees. And more broadly, better public service provision and stronger safety nets, starting with the pension system, would improve competitiveness and increase equity. 58. Finally, strengthened cooperation towards, and proper funding for, data compilation and dissemination are crucial for greater accountability. Although data collection and dissemination have improved in some areas, national and external accounts, fiscal, social, and labor-market statistics remain weak. Statistics cannot improve without better inter-agency cooperation and high-level support for the Central Administration of Statistics.
59. Staff propose that the next Article IV consultation take place on the standard 12-month cycle.
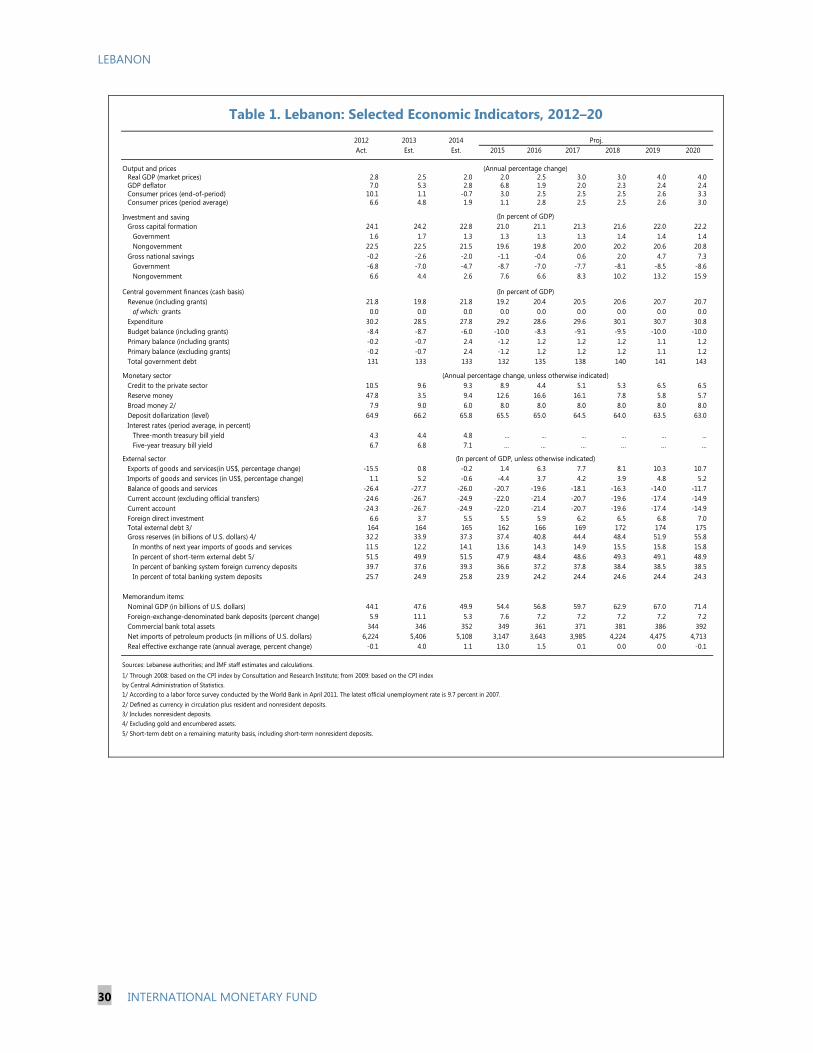
LEBANON
30 INTERNATIONAL MONETARY FUND
Table 1. Lebanon: Selected Economic Indicators, 2012–20
2012 2013 2014Act. Est. Est. 2015 2016 2017 2018 2019 2020
Output and pricesReal GDP (market prices) 2.8 2.5 2.0 2.0 2.5 3.0 3.0 4.0 4.0GDP deflator 7.0 5.3 2.8 6.8 1.9 2.0 2.3 2.4 2.4Consumer prices (end-of-period) 10.1 1.1 -0.7 3.0 2.5 2.5 2.5 2.6 3.3Consumer prices (period average) 6.6 4.8 1.9 1.1 2.8 2.5 2.5 2.6 3.0
Investment and savingGross capital formation 24.1 24.2 22.8 21.0 21.1 21.3 21.6 22.0 22.2
Government 1.6 1.7 1.3 1.3 1.3 1.3 1.4 1.4 1.4Nongovernment 22.5 22.5 21.5 19.6 19.8 20.0 20.2 20.6 20.8
Gross national savings -0.2 -2.6 -2.0 -1.1 -0.4 0.6 2.0 4.7 7.3Government -6.8 -7.0 -4.7 -8.7 -7.0 -7.7 -8.1 -8.5 -8.6Nongovernment 6.6 4.4 2.6 7.6 6.6 8.3 10.2 13.2 15.9
Central government finances (cash basis)Revenue (including grants) 21.8 19.8 21.8 19.2 20.4 20.5 20.6 20.7 20.7
of which: grants 0.0 0.0 0.0 0.0 0.0 0.0 0.0 0.0 0.0Expenditure 30.2 28.5 27.8 29.2 28.6 29.6 30.1 30.7 30.8Budget balance (including grants) -8.4 -8.7 -6.0 -10.0 -8.3 -9.1 -9.5 -10.0 -10.0Primary balance (including grants) -0.2 -0.7 2.4 -1.2 1.2 1.2 1.2 1.1 1.2Primary balance (excluding grants) -0.2 -0.7 2.4 -1.2 1.2 1.2 1.2 1.1 1.2Total government debt 131 133 133 132 135 138 140 141 143
Monetary sectorCredit to the private sector 10.5 9.6 9.3 8.9 4.4 5.1 5.3 6.5 6.5Reserve money 47.8 3.5 9.4 12.6 16.6 16.1 7.8 5.8 5.7Broad money 2/ 7.9 9.0 6.0 8.0 8.0 8.0 8.0 8.0 8.0Deposit dollarization (level) 64.9 66.2 65.8 65.5 65.0 64.5 64.0 63.5 63.0Interest rates (period average, in percent)
Three-month treasury bill yield 4.3 4.4 4.8 ... ... ... ... ... ...Five-year treasury bill yield 6.7 6.8 7.1 … … … … … …
External sector Exports of goods and services(in US$, percentage change) -15.5 0.8 -0.2 1.4 6.3 7.7 8.1 10.3 10.7Imports of goods and services (in US$, percentage change) 1.1 5.2 -0.6 -4.4 3.7 4.2 3.9 4.8 5.2Balance of goods and services -26.4 -27.7 -26.0 -20.7 -19.6 -18.1 -16.3 -14.0 -11.7Current account (excluding official transfers) -24.6 -26.7 -24.9 -22.0 -21.4 -20.7 -19.6 -17.4 -14.9Current account -24.3 -26.7 -24.9 -22.0 -21.4 -20.7 -19.6 -17.4 -14.9Foreign direct investment 6.6 3.7 5.5 5.5 5.9 6.2 6.5 6.8 7.0Total external debt 3/ 164 164 165 162 166 169 172 174 175Gross reserves (in billions of U.S. dollars) 4/ 32.2 33.9 37.3 37.4 40.8 44.4 48.4 51.9 55.8
In months of next year imports of goods and services 11.5 12.2 14.1 13.6 14.3 14.9 15.5 15.8 15.8In percent of short-term external debt 5/ 51.5 49.9 51.5 47.9 48.4 48.6 49.3 49.1 48.9In percent of banking system foreign currency deposits 39.7 37.6 39.3 36.6 37.2 37.8 38.4 38.5 38.5In percent of total banking system deposits 25.7 24.9 25.8 23.9 24.2 24.4 24.6 24.4 24.3
Memorandum items:Nominal GDP (in billions of U.S. dollars) 44.1 47.6 49.9 54.4 56.8 59.7 62.9 67.0 71.4Foreign-exchange-denominated bank deposits (percent change) 5.9 11.1 5.3 7.6 7.2 7.2 7.2 7.2 7.2Commercial bank total assets 344 346 352 349 361 371 381 386 392Net imports of petroleum products (in millions of U.S. dollars) 6,224 5,406 5,108 3,147 3,643 3,985 4,224 4,475 4,713Real effective exchange rate (annual average, percent change) -0.1 4.0 1.1 13.0 1.5 0.1 0.0 0.0 -0.1
Sources: Lebanese authorities; and IMF staff estimates and calculations.
1/ Through 2008: based on the CPI index by Consultation and Research Institute; from 2009: based on the CPI indexby Central Administration of Statistics.1/ According to a labor force survey conducted by the World Bank in April 2011. The latest official unemployment rate is 9.7 percent in 2007.2/ Defined as currency in circulation plus resident and nonresident deposits.3/ Includes nonresident deposits.4/ Excluding gold and encumbered assets.5/ Short-term debt on a remaining maturity basis, including short-term nonresident deposits.
(In percent of GDP)
(Annual percentage change, unless otherwise indicated)
(In percent of GDP, unless otherwise indicated)
Proj.
(Annual percentage change)
(In percent of GDP)
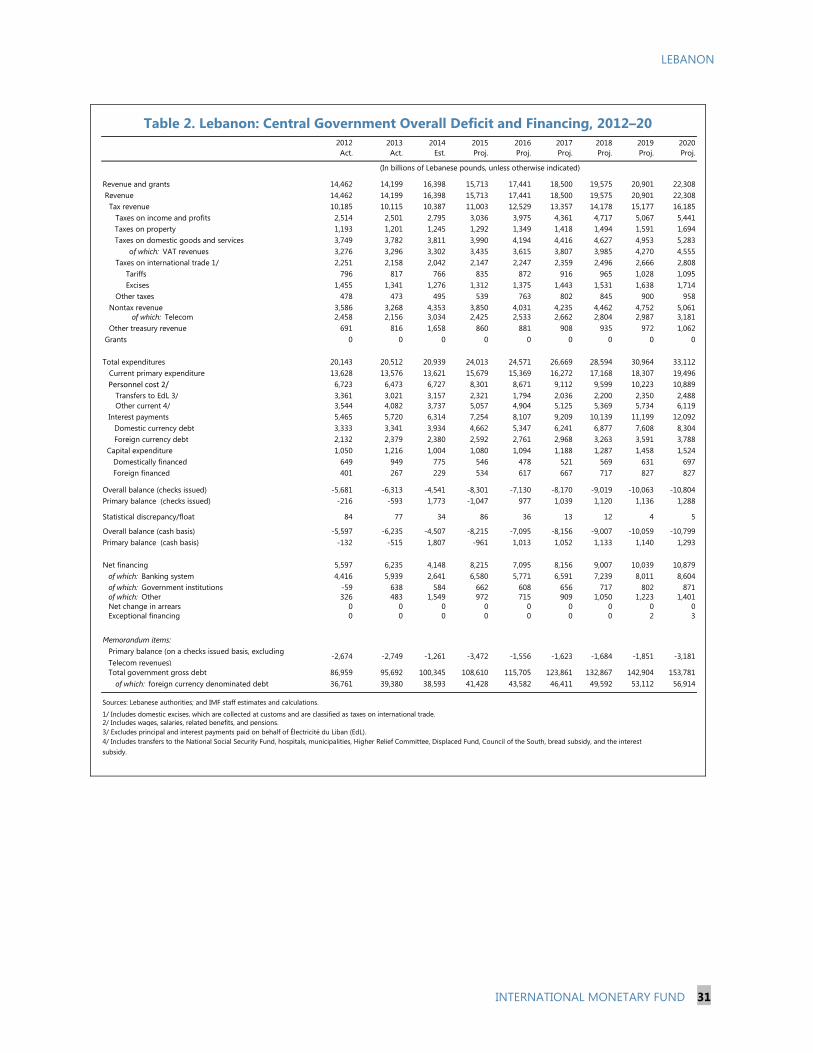
LEBANON
INTERNATIONAL MONETARY FUND 31
Table 2. Lebanon: Central Government Overall Deficit and Financing, 2012–20
2013 2014 2015 2016 2017 2018 2019 2020Act. Act. Est. Proj. Proj. Proj. Proj. Proj. Proj.
Revenue and grants 14,462 14,199 16,398 15,713 17,441 18,500 19,575 20,901 22,308 Revenue 14,462 14,199 16,398 15,713 17,441 18,500 19,575 20,901 22,308 Tax revenue 10,185 10,115 10,387 11,003 12,529 13,357 14,178 15,177 16,185 Taxes on income and profits 2,514 2,501 2,795 3,036 3,975 4,361 4,717 5,067 5,441
Taxes on property 1,193 1,201 1,245 1,292 1,349 1,418 1,494 1,591 1,694 Taxes on domestic goods and services 3,749 3,782 3,811 3,990 4,194 4,416 4,627 4,953 5,283 of which: VAT revenues 3,276 3,296 3,302 3,435 3,615 3,807 3,985 4,270 4,555
Taxes on international trade 1/ 2,251 2,158 2,042 2,147 2,247 2,359 2,496 2,666 2,808Tariffs 796 817 766 835 872 916 965 1,028 1,095Excises 1,455 1,341 1,276 1,312 1,375 1,443 1,531 1,638 1,714
Other taxes 478 473 495 539 763 802 845 900 958 Nontax revenue 3,586 3,268 4,353 3,850 4,031 4,235 4,462 4,752 5,061
of which: Telecom 2,458 2,156 3,034 2,425 2,533 2,662 2,804 2,987 3,181 Other treasury revenue 691 816 1,658 860 881 908 935 972 1,062 Grants 0 0 0 0 0 0 0 0 0
Total expenditures 20,143 20,512 20,939 24,013 24,571 26,669 28,594 30,964 33,112 Current primary expenditure 13,628 13,576 13,621 15,679 15,369 16,272 17,168 18,307 19,496 Personnel cost 2/ 6,723 6,473 6,727 8,301 8,671 9,112 9,599 10,223 10,889 Transfers to EdL 3/ 3,361 3,021 3,157 2,321 1,794 2,036 2,200 2,350 2,488 Other current 4/ 3,544 4,082 3,737 5,057 4,904 5,125 5,369 5,734 6,119
Interest payments 5,465 5,720 6,314 7,254 8,107 9,209 10,139 11,199 12,092Domestic currency debt 3,333 3,341 3,934 4,662 5,347 6,241 6,877 7,608 8,304Foreign currency debt 2,132 2,379 2,380 2,592 2,761 2,968 3,263 3,591 3,788
Capital expenditure 1,050 1,216 1,004 1,080 1,094 1,188 1,287 1,458 1,524 Domestically financed 649 949 775 546 478 521 569 631 697 Foreign financed 401 267 229 534 617 667 717 827 827
Overall balance (checks issued) -5,681 -6,313 -4,541 -8,301 -7,130 -8,170 -9,019 -10,063 -10,804Primary balance (checks issued) -216 -593 1,773 -1,047 977 1,039 1,120 1,136 1,288
Statistical discrepancy/float 84 77 34 86 36 13 12 4 5
Overall balance (cash basis) -5,597 -6,235 -4,507 -8,215 -7,095 -8,156 -9,007 -10,059 -10,799Primary balance (cash basis) -132 -515 1,807 -961 1,013 1,052 1,133 1,140 1,293
Net financing 5,597 6,235 4,148 8,215 7,095 8,156 9,007 10,039 10,879of which: Banking system 4,416 5,939 2,641 6,580 5,771 6,591 7,239 8,011 8,604of which: Government institutions -59 638 584 662 608 656 717 802 871of which: Other 326 483 1,549 972 715 909 1,050 1,223 1,401Net change in arrears 0 0 0 0 0 0 0 0 0Exceptional financing 0 0 0 0 0 0 0 2 3
Memorandum items:Primary balance (on a checks issued basis, excluding Telecom revenues)
-2,674 -2,749 -1,261 -3,472 -1,556 -1,623 -1,684 -1,851 -3,181
Total government gross debt 86,959 95,692 100,345 108,610 115,705 123,861 132,867 142,904 153,781 of which: foreign currency denominated debt 36,761 39,380 38,593 41,428 43,582 46,411 49,592 53,112 56,914
(In billions of Lebanese pounds, unless otherwise indicated)
Sources: Lebanese authorities; and IMF staff estimates and calculations.
1/ Includes domestic excises, which are collected at customs and are classified as taxes on international trade.2/ Includes wages, salaries, related benefits, and pensions. 3/ Excludes principal and interest payments paid on behalf of Électricité du Liban (EdL).4/ Includes transfers to the National Social Security Fund, hospitals, municipalities, Higher Relief Committee, Displaced Fund, Council of the South, bread subsidy, and the interest subsidy.
2012
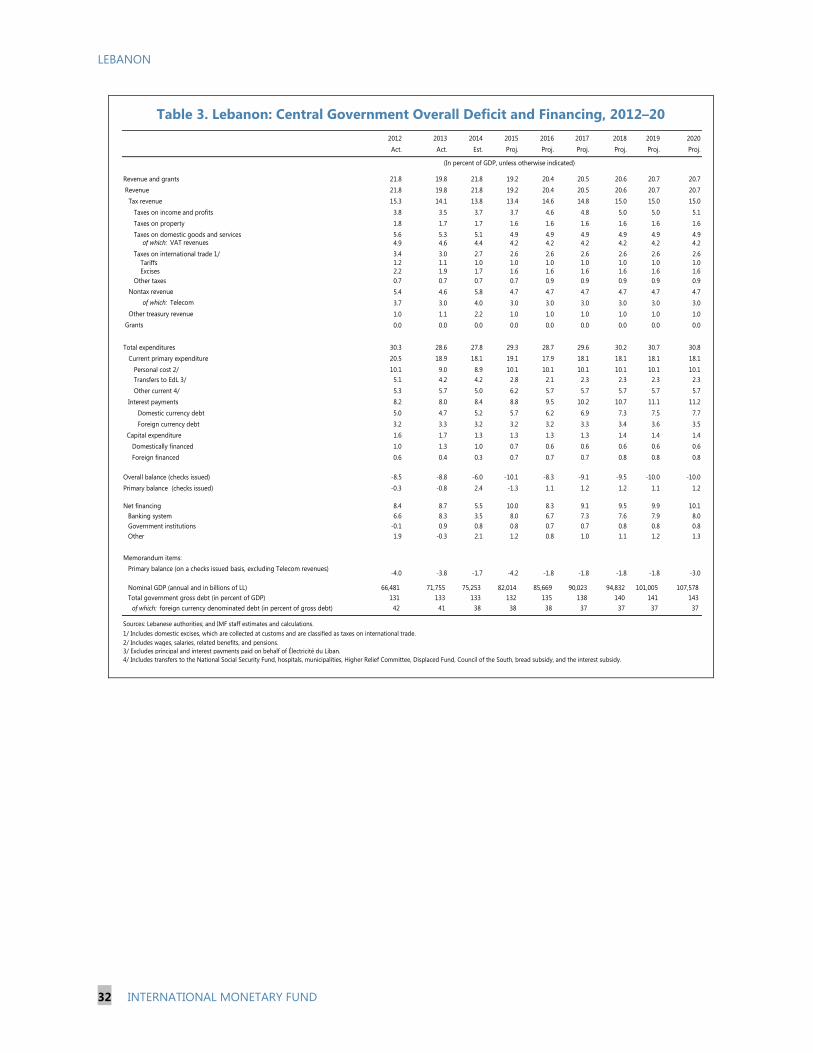
LEBANON
32 INTERNATIONAL MONETARY FUND
Table 3. Lebanon: Central Government Overall Deficit and Financing, 2012–20
2013 2014 2015 2016 2017 2018 2019 2020Act. Act. Est. Proj. Proj. Proj. Proj. Proj. Proj.
Revenue and grants 21.8 19.8 21.8 19.2 20.4 20.5 20.6 20.7 20.7 Revenue 21.8 19.8 21.8 19.2 20.4 20.5 20.6 20.7 20.7 Tax revenue 15.3 14.1 13.8 13.4 14.6 14.8 15.0 15.0 15.0 Taxes on income and profits 3.8 3.5 3.7 3.7 4.6 4.8 5.0 5.0 5.1 Taxes on property 1.8 1.7 1.7 1.6 1.6 1.6 1.6 1.6 1.6 Taxes on domestic goods and services 5.6 5.3 5.1 4.9 4.9 4.9 4.9 4.9 4.9
of which: VAT revenues 4.9 4.6 4.4 4.2 4.2 4.2 4.2 4.2 4.2 Taxes on international trade 1/ 3.4 3.0 2.7 2.6 2.6 2.6 2.6 2.6 2.6
Tariffs 1.2 1.1 1.0 1.0 1.0 1.0 1.0 1.0 1.0 Excises 2.2 1.9 1.7 1.6 1.6 1.6 1.6 1.6 1.6
Other taxes 0.7 0.7 0.7 0.7 0.9 0.9 0.9 0.9 0.9 Nontax revenue 5.4 4.6 5.8 4.7 4.7 4.7 4.7 4.7 4.7
of which: Telecom 3.7 3.0 4.0 3.0 3.0 3.0 3.0 3.0 3.0 Other treasury revenue 1.0 1.1 2.2 1.0 1.0 1.0 1.0 1.0 1.0 Grants 0.0 0.0 0.0 0.0 0.0 0.0 0.0 0.0 0.0
Total expenditures 30.3 28.6 27.8 29.3 28.7 29.6 30.2 30.7 30.8 Current primary expenditure 20.5 18.9 18.1 19.1 17.9 18.1 18.1 18.1 18.1 Personal cost 2/ 10.1 9.0 8.9 10.1 10.1 10.1 10.1 10.1 10.1 Transfers to EdL 3/ 5.1 4.2 4.2 2.8 2.1 2.3 2.3 2.3 2.3 Other current 4/ 5.3 5.7 5.0 6.2 5.7 5.7 5.7 5.7 5.7
Interest payments 8.2 8.0 8.4 8.8 9.5 10.2 10.7 11.1 11.2Domestic currency debt 5.0 4.7 5.2 5.7 6.2 6.9 7.3 7.5 7.7Foreign currency debt 3.2 3.3 3.2 3.2 3.2 3.3 3.4 3.6 3.5
Capital expenditure 1.6 1.7 1.3 1.3 1.3 1.3 1.4 1.4 1.4 Domestically financed 1.0 1.3 1.0 0.7 0.6 0.6 0.6 0.6 0.6 Foreign financed 0.6 0.4 0.3 0.7 0.7 0.7 0.8 0.8 0.8
Overall balance (checks issued) -8.5 -8.8 -6.0 -10.1 -8.3 -9.1 -9.5 -10.0 -10.0Primary balance (checks issued) -0.3 -0.8 2.4 -1.3 1.1 1.2 1.2 1.1 1.2
Net financing 8.4 8.7 5.5 10.0 8.3 9.1 9.5 9.9 10.1Banking system 6.6 8.3 3.5 8.0 6.7 7.3 7.6 7.9 8.0Government institutions -0.1 0.9 0.8 0.8 0.7 0.7 0.8 0.8 0.8Other 1.9 -0.3 2.1 1.2 0.8 1.0 1.1 1.2 1.3
Memorandum items: -0.3 -0.4 1.2 0.2 0.1Primary balance (on a checks issued basis, excluding Telecom revenues) -4.0 -3.8 -1.7 -4.2 -1.8 -1.8 -1.8 -1.8 -3.0
Nominal GDP (annual and in billions of LL) 66,481 71,755 75,253 82,014 85,669 90,023 94,832 101,005 107,578 Total government gross debt (in percent of GDP) 131 133 133 132 135 138 140 141 143
of which: foreign currency denominated debt (in percent of gross debt) 42 41 38 38 38 37 37 37 37
3/ Excludes principal and interest payments paid on behalf of Électricité du Liban.4/ Includes transfers to the National Social Security Fund, hospitals, municipalities, Higher Relief Committee, Displaced Fund, Council of the South, bread subsidy, and the interest subsidy.
2/ Includes wages, salaries, related benefits, and pensions.
2012
(In percent of GDP, unless otherwise indicated)
Sources: Lebanese authorities; and IMF staff estimates and calculations.1/ Includes domestic excises, which are collected at customs and are classified as taxes on international trade.

LEBANON
INTERNATIONAL MONETARY FUND 33
Table 4. Lebanon Government Debt, 2012–20 1/
2013 2014 2015 2016 2017 2018 2019 2020Act. Act. Est. Proj. Proj. Proj. Proj. Proj. Proj.
Net debt 2/ 54,457 59,112 62,533 68,016 72,723 78,133 84,108 90,766 97,980
Gross debt by holder 57,684 63,477 66,564 72,046 76,753 82,163 88,138 94,796 102,010Banking system 43,637 48,153 50,969 55,367 59,195 63,567 68,370 73,684 79,392
Treasury bills 27,213 30,384 33,522 36,450 39,138 42,038 45,208 48,755 52,604Other domestic loans 105 85 103 137 137 137 137 137 137Eurobonds 16,318 17,684 17,344 18,781 19,920 21,393 23,025 24,793 26,650
Nonbanks 14,048 15,325 15,595 16,679 17,557 18,596 19,768 21,112 22,619Treasury bills 5,980 6,886 7,338 7,979 8,567 9,202 9,896 10,672 11,515
Government institutions 3/ 4,298 4,721 5,031 5,471 5,874 6,309 6,785 7,318 7,895Other 1,682 2,165 2,307 2,508 2,693 2,893 3,111 3,355 3,620
Eurobonds 5,433 5,887 5,774 6,253 6,632 7,122 7,666 8,254 8,873Concessional loans 2,561 2,462 2,403 2,427 2,341 2,274 2,225 2,205 2,250Foreign currency T-bonds 74 90 80 21 17 -3 -19 -20 -19
Government deposits 3,227 4,366 4,031 4,030 4,030 4,030 4,030 4,030 4,030
Net debt 2/ 123 124 125 125 128 131 134 135 137
Gross debt by holder 131 133 133 132 135 138 140 141 143Banking system 99 101 102 102 104 106 109 110 111
Treasury bills 62 64 67 67 69 70 72 73 74Other domestic loans 0 0 0 0 0 0 0 0 0Eurobonds 37 37 35 35 35 36 37 37 37
Nonbanks 32 32 31 31 31 31 31 32 32Treasury bills 14 14 15 15 15 15 16 16 16
Government institutions 3/ 10 10 10 10 10 11 11 11 11Other 4 5 5 5 5 5 5 5 5
Eurobonds 12 12 12 11 12 12 12 12 12Concessional loans 6 5 5 4 4 4 4 3 3Foreign currency T-bonds 0 0 0 0 0 0 0 0 0
Government deposits 7 9 8 7 7 7 6 6 6
Memorandum items:Nominal GDP (in billions of Lebanese pounds) 66,481 71,755 75,253 82,014 85,669 90,023 94,832 101,005 107,578
Foreign currency debt (in percent of gross debt) 42 41 38 38 38 37 37 37 37
Sources: Lebanese authorities; and IMF staff estimates and calculations.1/ Includes all debt contracted by the treasury on behalf of the central government and public agencies other than the Banque du Liban, accrued interest; and Banque du Libanlending to Électricité du Liban. Excludes possible government arrears to the private sector.2/ Defined as gross debt less government deposits.3/ Denominated in domestic currency; mainly to the National Social Security Fund, and the National Deposit Insurance Fund.
2012
(In millions of U.S. dollars)
(In percent of GDP)

LEBANON
34 INTERNATIONAL MONETARY FUND
Table 5. Lebanon: Monetary Survey, 2012–20
2012 2013 2014 2015 2016 2017 2018 2019 2020
Act. Act. Act. Proj. Proj. Proj. Proj. Proj. Proj.
Net foreign assets 99.8 98.5 98.6 100.1 107.7 116.0 125.0 133.7 143.5Banque du Liban 69.3 65.9 70.9 70.2 75.4 81.1 87.3 93.0 99.5Commercial banks 30.5 32.6 27.7 29.9 32.3 34.9 37.7 40.7 44.0
Net domestic assets 93.3 112.1 124.5 140.9 152.6 165.1 178.6 194.2 210.6Net claims on public sector 55.9 62.0 64.5 71.1 76.9 83.5 90.7 98.7 107.3
of which: Net claims on government 61.7 68.0 70.6 77.2 83.0 89.6 96.8 104.8 113.4Banque du Liban 14.7 11.2 14.3 12.6 10.9 9.2 7.3 5.1 2.8Commercial banks 46.9 56.8 56.3 64.7 72.0 80.4 89.5 99.7 110.6
Claims on private sector 57.4 63.0 68.8 75.0 78.3 82.3 86.6 92.2 98.2Other items (net) -20.0 -12.8 -8.8 -5.2 -2.6 -0.6 1.2 3.2 5.0
Broad money (M5) 1/ 193.2 210.6 223.2 241.0 260.3 281.1 303.6 327.9 354.1In Lebanese pounds 70.1 73.8 79.2 86.1 94.3 103.2 112.9 123.5 135.1
Currency in circulation 3.2 3.4 3.6 3.9 4.3 4.6 5.0 5.4 5.8Deposits in Lebanese pounds 66.9 70.4 75.6 82.2 90.0 98.6 107.9 118.1 129.3
Deposits in foreign currency 123.1 136.8 143.9 154.9 166.0 178.0 190.7 204.4 219.1
Net foreign assets 3.8 -1.4 0.2 1.5 7.5 7.7 7.8 6.9 7.3Net domestic assets 12.8 20.1 11.1 13.1 8.3 8.2 8.1 8.7 8.5
Net claims on public sector 8.1 10.9 4.2 10.2 8.1 8.6 8.7 8.8 8.7Claims on private sector 10.5 9.6 9.3 8.9 4.4 5.1 5.3 6.5 6.5
Broad money (M5) 1/ 7.9 9.0 6.0 8.0 8.0 8.0 8.0 8.0 8.0In Lebanese pounds 11.8 5.3 7.3 8.7 9.4 9.4 9.4 9.4 9.4Deposits in foreign currency 5.9 11.1 5.2 7.6 7.2 7.2 7.2 7.2 7.2
Memorandum items:
Banque du Liban:Foreign assets 72.0 68.2 73.0 71.9 76.9 82.6 88.9 94.5 101.1
of which: foreign exchange 45.2 47.8 48.8 49.0 54.1 59.6 65.6 70.9 76.7of which: gold 23.1 16.7 16.5 15.4 15.3 15.5 15.7 16.0 16.7
Claims on public sector (net) 13.0 9.6 13.1 11.3 9.7 7.9 6.0 3.9 1.6Claims on commercial banks -20.5 -19.6 -19.9 -31.6 -31.4 -31.0 -33.1 -35.2 -38.1Reserve money 19.8 20.5 22.4 25.2 29.4 34.1 36.7 38.9 41.1Gross international reserves (including gold), in billions of U.S. dollars 2/ 47.5 45.0 48.3 47.6 50.9 54.7 58.8 62.6 66.9Gross international reserves (excluding gold), in billions of U.S. dollars 3/ 32.2 33.9 37.3 37.4 40.8 44.4 48.4 51.9 55.8
In percent of banking system foreign currency deposits 39.7 37.6 39.3 36.6 37.2 37.8 38.4 38.5 38.5In percent of total banking system deposits 25.7 24.9 25.8 23.9 24.2 24.4 24.6 24.4 24.3
Share of foreign currency deposits in total private sector deposits (in percent) 64.9 66.2 65.8 65.5 65.0 64.5 64.0 63.5 63.0
Sources: Banque du Liban; and IMF staff estimates and projections.
1/ Broad money (M5) is defined as M3 (currency + resident deposits) + nonresident deposits.2/ Defined as all official foreign currency assets, less encumbered foreign assets.3/ Defined as all official foreign currency assets, less encumbered foreign assets and gold.
(In trillions of Lebanese pounds, unless otherwise indicated)
(Year-on-year percent change)
(In trillions of Lebanese pounds)
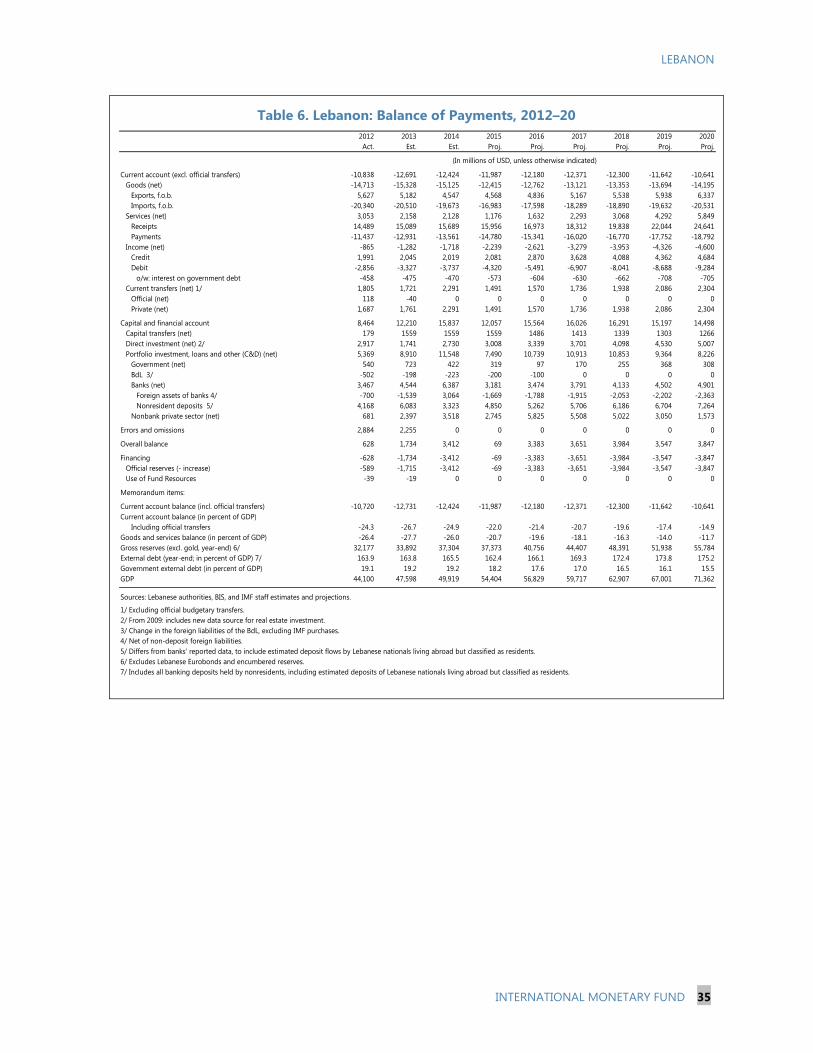
LEBANON
INTERNATIONAL MONETARY FUND 35
Table 6. Lebanon: Balance of Payments, 2012–20
2012 2013 2014 2015 2016 2017 2018 2019 2020Act. Est. Est. Proj. Proj. Proj. Proj. Proj. Proj.
Current account (excl. official transfers) -10,838 -12,691 -12,424 -11,987 -12,180 -12,371 -12,300 -11,642 -10,641Goods (net) -14,713 -15,328 -15,125 -12,415 -12,762 -13,121 -13,353 -13,694 -14,195
Exports, f.o.b. 5,627 5,182 4,547 4,568 4,836 5,167 5,538 5,938 6,337Imports, f.o.b. -20,340 -20,510 -19,673 -16,983 -17,598 -18,289 -18,890 -19,632 -20,531
Services (net) 3,053 2,158 2,128 1,176 1,632 2,293 3,068 4,292 5,849Receipts 14,489 15,089 15,689 15,956 16,973 18,312 19,838 22,044 24,641Payments -11,437 -12,931 -13,561 -14,780 -15,341 -16,020 -16,770 -17,752 -18,792
Income (net) -865 -1,282 -1,718 -2,239 -2,621 -3,279 -3,953 -4,326 -4,600Credit 1,991 2,045 2,019 2,081 2,870 3,628 4,088 4,362 4,684Debit -2,856 -3,327 -3,737 -4,320 -5,491 -6,907 -8,041 -8,688 -9,284
o/w: interest on government debt -458 -475 -470 -573 -604 -630 -662 -708 -705Current transfers (net) 1/ 1,805 1,721 2,291 1,491 1,570 1,736 1,938 2,086 2,304
Official (net) 118 -40 0 0 0 0 0 0 0Private (net) 1,687 1,761 2,291 1,491 1,570 1,736 1,938 2,086 2,304
Capital and financial account 8,464 12,210 15,837 12,057 15,564 16,026 16,291 15,197 14,498Capital transfers (net) 179 1559 1559 1559 1486 1413 1339 1303 1266Direct investment (net) 2/ 2,917 1,741 2,730 3,008 3,339 3,701 4,098 4,530 5,007Portfolio investment, loans and other (C&D) (net) 5,369 8,910 11,548 7,490 10,739 10,913 10,853 9,364 8,226
Government (net) 540 723 422 319 97 170 255 368 308BdL 3/ -502 -198 -223 -200 -100 0 0 0 0Banks (net) 3,467 4,544 6,387 3,181 3,474 3,791 4,133 4,502 4,901
Foreign assets of banks 4/ -700 -1,539 3,064 -1,669 -1,788 -1,915 -2,053 -2,202 -2,363Nonresident deposits 5/ 4,168 6,083 3,323 4,850 5,262 5,706 6,186 6,704 7,264
Nonbank private sector (net) 681 2,397 3,518 2,745 5,825 5,508 5,022 3,050 1,573
Errors and omissions 2,884 2,255 0 0 0 0 0 0 0
Overall balance 628 1,734 3,412 69 3,383 3,651 3,984 3,547 3,847
Financing -628 -1,734 -3,412 -69 -3,383 -3,651 -3,984 -3,547 -3,847Official reserves (- increase) -589 -1,715 -3,412 -69 -3,383 -3,651 -3,984 -3,547 -3,847Use of Fund Resources -39 -19 0 0 0 0 0 0 0
Memorandum items:
Current account balance (incl. official transfers) -10,720 -12,731 -12,424 -11,987 -12,180 -12,371 -12,300 -11,642 -10,641Current account balance (in percent of GDP)
Including official transfers -24.3 -26.7 -24.9 -22.0 -21.4 -20.7 -19.6 -17.4 -14.9Goods and services balance (in percent of GDP) -26.4 -27.7 -26.0 -20.7 -19.6 -18.1 -16.3 -14.0 -11.7Gross reserves (excl. gold, year-end) 6/ 32,177 33,892 37,304 37,373 40,756 44,407 48,391 51,938 55,784External debt (year-end; in percent of GDP) 7/ 163.9 163.8 165.5 162.4 166.1 169.3 172.4 173.8 175.2Government external debt (in percent of GDP) 19.1 19.2 19.2 18.2 17.6 17.0 16.5 16.1 15.5GDP 44,100 47,598 49,919 54,404 56,829 59,717 62,907 67,001 71,362
Sources: Lebanese authorities, BIS, and IMF staff estimates and projections.
1/ Excluding official budgetary transfers.2/ From 2009: includes new data source for real estate investment. 3/ Change in the foreign liabilities of the BdL, excluding IMF purchases.4/ Net of non-deposit foreign liabilities.5/ Differs from banks' reported data, to include estimated deposit flows by Lebanese nationals living abroad but classified as residents.6/ Excludes Lebanese Eurobonds and encumbered reserves.7/ Includes all banking deposits held by nonresidents, including estimated deposits of Lebanese nationals living abroad but classified as residents.
(In millions of USD, unless otherwise indicated)

LEBANON
36 INTERNATIONAL MONETARY FUND
Table 7. Lebanon: Financial Soundness Indicators for the Banking Sector, 2010–14 (In percent, end of period)
2010 2011 2012 2013 2014Capital
Regulatory capital to risk-weighted assets 13.4 11.6 13.0 14.5 14.0Regulatory Tier 1 capital to risk-weighted assets 11.4 11.0 12.1 13.5 12.8
Asset qualityNon performing loans net of provisions to capital 5.7 5.2 5.2 6.1 6.3Non performing loans to gross loans 4.3 3.8 3.8 4.0 4.0
Asset concentrationClaims on the public sector (BdL excluded) to total assets 22.7 20.8 20.5 22.9 21.3Placements with the BdL to total assets 31.3 33.6 34.6 33.0 36.1Foreign assets to total assets 20.0 18.1 17.2 16.2 13.8
ProfitabilityReturn on assets (after tax) 1.2 1.1 1.0 1.0 1.0Return on equity (after tax) 17.1 14.5 12.8 11.7 11.2
LiquidityDeposits to total liabilities 87.7 87.9 87.9 87.5 87.4Liquid assets to total assets - 22.7 23.2 22.7 20.0Liquid assets to short term liabilities - 32.5 33.9 33.8 30.0
FX exposureForeign-currency-denominated loans to total loans - 78.4 77.4 76.5 75.8Foreign-currency-denominated liabilities to total liabilities - 66.2 65.1 65.5 64.8Net open FX position to regulatory capital - 16.9 13.9 11.8 13.9
Sources: Lebanese authorities and Financial Soundness Indicators (FSI).

LEBANON
INTERNATIONAL MONETARY FUND 37
Annex I. Public Debt Sustainability Analysis1
With public debt already exceeding 130 percent of GDP and gross financing needs around 25 percent of GDP in 2015, Lebanon faces significant risks to public debt sustainability. Under the baseline scenario, debt and financing needs will continue to rise as a share of GDP, reaching 143 percent and 40 percent, respectively. In addition, debt dynamics and financing needs are subject to significant macroeconomic shocks, especially to growth and the interest rate, and contingent liability shocks. Large liquidity buffers and a captive investor base continue to represent important mitigating factors. Decisive policy actions are nevertheless required to restore fiscal sustainability.
1. The baseline scenario assumes that the conflict in Syria will start to ease only in 2016. This is also underpinned by the following assumptions:
Real GDP growth is projected not to exceed 2.5 percent until 2016, mainly as a result of the impact of the Syria crisis on Lebanon. It is projected to increase to 3 percent in 2017, and return to its potential estimated at 4 percent from 2019 onward.
Inflation (measured by the GDP deflator) is estimated to decelerate from 5.3 percent in 2013 to 2.8 percent in 2014, but is projected to increase to around 7 percent in 2015 as a result of temporary windfall from lower oil prices, before settling around 2 percent on average in 2016–20.
The primary balance is projected to switch to small surpluses starting in 2016. These projections are based on: (i) an estimate of the salary scale adjustment; (ii) a gradual reduction in subsidies to the state-owned electricity company, Electricité du Liban (EdL), reflecting global oil prices; and (iii) tax measures on income and profits, capital gains, and some stamp fees and charges (see main text).
2. The baseline assumptions are broadly plausible. Staff forecast track record is not systematically biased, as reflected in projection errors generally not being consistently on one side. The median forecast errors for inflation and primary balance during 2006–14 are broadly in line with those observed in other countries, while the forecast track record for real GDP growth for 2011–14 shows some bias, not differently from other surveillance benchmark countries. The projected fiscal adjustment is consistent with experiences of surveillance countries.
3. The deteriorating debt outlook reflects the projected path of fiscal adjustment and positive interest rate-growth differential. The public debt-to-GDP ratio is forecast to increase from 133 percent in 2014 to 143 percent in 2020. The authorities’ fiscal consolidation, measured by changes in the primary balance, is relatively modest and assumed to take effect gradually. While economic growth will increasingly contribute to lowering debt over time, its impact will not be large enough to offset adverse dynamics from real interest rates. The gross financing needs are forecast 1 Prepared by Mariusz Jarmuzek (FAD).
LEBANON
38 INTERNATIONAL MONETARY FUND
to fluctuate around 30 percent of GDP over the projection period, peaking to around 40 percent of GDP in 2018. The upward financing needs trajectory is primarily driven by large fiscal deficits and the debt maturity profile—an average of around 3 and 5 years, for domestic and foreign debt, respectively.
4. The debt and financing needs projections are particularly sensitive to growth and contingent liability shocks:
Growth shock. Slower growth remains the principal risk to debt sustainability. Assuming a decline in growth by one standard deviation for 2016 and 2017, the debt-to-GDP ratio is forecast to reach almost 160 percent in 2020. Financing needs are projected to reach almost 45 percent of GDP in 2020 and remain at high levels until the end of the projection horizon.
Interest rate shock. Higher interest rates also pose a significant risk to debt sustainability. A shock to the interest rate results in the debt-to-GDP ratio reaching almost 150 percent at the end of the projection horizon, with financing needs projected to exceed 40 percent of GDP.
Macro-fiscal shock. If shocks to growth, interest rate, and primary balance occurred simultaneously, the debt-to-GDP ratio would exceed 170 percent at the end of the projection horizon. Financing needs would reach almost 50 percent of GDP in 2020.
Contingent liability shock. In the absence of concrete estimates of contingent liabilities, a standardized shock of 10 percent of financial sector assets is used to represent a hypothetical realization of such contingent liabilities. In such a scenario, the debt-to-GDP ratio would exceed 175 percent at the end of the projection horizon. Financing needs would exceed 45 percent of GDP in 2020. The large effect reflects the significant size of Lebanon’s banking sector relative to the size of its economy.
5. The fan charts show significant uncertainty around the baseline. The width of the symmetric fan chart, estimated at around 50 percent of GDP, illustrates the degree of uncertainty for equal-probability upside and downside shocks. But in light of the downside risks associated with the Syria crisis, an upside shock to growth is constrained to zero in the asymmetric fan chart, resulting in a more upward-sloping debt path. This reflects a balance of risks skewed to the downside.
6. Lebanon’s debt profile reveals weaknesses. External financing needs are well above the upper risk-assessment benchmark and public debt in foreign currency is above the lower risk-assessment benchmark. These factors point to risks in case of pressures on the exchange rate and foreign exchange reserves. While bond spreads are above the lower risk assessment benchmark, they have been relatively stable even in times of stress. Public debt held by nonresidents is estimated to be only slightly above the lower risk assessment benchmark, while the level of, and the change in, short-term debt are below the lower risk assessment benchmarks.
LEBANON
INTERNATIONAL MONETARY FUND 39
7. Risks to debt sustainability should be weighed against a number of mitigating factors.
Investor base. Debt is held largely by domestic financial institutions that are tightly regulated in terms of their net open positions and investment strategies. This factor, coupled with relatively low demand for private sector credit and limited regional investment opportunities, has resulted in a captive investor base. In turn, domestic financial institutions fund their positions from deposits largely held by nonresidents, which have shown resilience in times of stress.2 In addition, a significant share of domestic debt is held by the BdL. Given that the debt is held predominantly by domestic investors, an alternative metric that might better capture risks to debt sustainability is the public debt-to-broad money ratio. This ratio decreased from 66 percent in 2003 to 45 percent in 2014 and is forecasted to stay below 50 percent over the projection horizon.
Debt financing profile. The large external financing needs amounting to around 160 percent of GDP reflect payments related to debt but also, to a significant extent, large nonresident short-term deposits. The exclusion of nonresident deposits—given their past stability—reduces external financing needs to around 40 percent of GDP over the projection horizon—still well above benchmark values but possibly capturing immediate risks more accurately. Although debt denominated in foreign currency accounts for more than 40 percent of total public debt, it is held mostly by domestic financial institutions and is underpinned by sizable external buffers in the form of international reserves. The level of, and the change in, short-term debt are very low, substantially reducing refinancing risk.
Buffers. The high level of gross international reserves remains an anchor for investors’ confidence. In addition, banks’ NFA also represent a substantial buffer. Finally, there are also significant cash cushions in the form of deposits accumulated by the government. The average figure for government deposits points to around 20 percent of GDP,3 which implies a significantly lower public debt-to-GDP ratio on a net basis and coverage of financing needs for around half a year.
8. The authorities broadly concurred with staff’s analysis. They noted challenges to formulating a credible medium-term fiscal strategy, while underscoring mitigating factors to debt sustainability risks. In particular, they singled out the issue of the large external financing needs as an example of an indicator that does not capture well Lebanon’s specific circumstances.
2 These sizable deposits (around 120 percent of GDP) have consistently behaved as long-term deposits, despite their short maturity profile, reflecting the loyalty of the Lebanese diaspora and other regional investors. But given that nonresident deposits are contractually of short maturity, this factor can also be considered as a potential source of vulnerability. 3 The government’s foreign exchange account has, however, been in overdraft over the past few years, which reduces the size of the buffer.

LEBANON
40 INTERNATIONAL MONETARY FUND
Lebanon Public DSA Risk Assessment
Lebanon
Source: IMF staff.
1/ The cell is highlighted in green if debt burden benchmark of 70% is not exceeded under the specific shock or baseline, yellow if exceeded under specific shock but not baseline, red if benchmark is exceeded under baseline, white if stress test is not relevant.
Real Interest Rate Shock
External Financing
Requirements
Real GDP Growth Shock
Heat Map
Upper early warning
Evolution of Predictive Densities of Gross Nominal Public Debt(in percent of GDP)
Debt profile 3/
Lower early warning(Indicators vis-à-vis risk assessment benchmarks, in 2014)
Debt Profile Vulnerabilities
Gross financing needs 2/
Debt level 1/ Real GDP Growth Shock
Primary Balance Shock
3/ The cell is highlighted in green if country value is less than the lower risk-assessment benchmark, red if country value exceeds the upper risk-assessment benchmark, yellow if country value is between the lower and upper risk-assessment benchmarks. If data are unavailable or indicator is not relevant, cell is white. Lower and upper risk-assessment benchmarks are:
Change in the Share of Short-
Term Debt
Foreign Currency
Debt
Public Debt Held by Non-
Residents
Primary Balance Shock
Real Interest Rate Shock
Exchange Rate Shock
Contingent Liability Shock
Exchange Rate Shock
Contingent Liability shock
5/ External financing requirement is defined as the sum of current account deficit, amortization of medium and long-term total external debt, and short-term total external debt at the end of previous period.
4/ EMBIG, an average over the last 3 months, 08-Nov-14 through 06-Feb-15.
2/ The cell is highlighted in green if gross financing needs benchmark of 15% is not exceeded under the specific shock or baseline, yellow if exceeded under specific shock but not baseline, red if benchmark is exceeded under baseline, white if stress test is not relevant.
200 and 600 basis points for bond spreads; 5 and 15 percent of GDP for external financing requirement; 0.5 and 1 percent for change in the share of short-term debt; 15 and 45 percent for the public debt held by non-residents; and 20 and 60 percent for the share of foreign-currency denominated debt.
Market Perception
2060
38%
1 2
200600
379 bp
1 2
515
162%
1 2
0.51
-0.3%
1 2
EMBIG External Financing Requirement
Annual Change in Short-Term Public
Debt
Public Debt in Foreign Currency
(in basis points) 4/ (in percent of GDP) 5/ (in percent of total) (in percent of total)
100
110
120
130
140
150
160
170
180
2013 2014 2015 2016 2017 2018 2019 2020
10th-25th 25th-75th 75th-90thPercentiles:Baseline
Symmetric Distribution
100
110
120
130
140
150
160
170
180
2013 2014 2015 2016 2017 2018 2019 2020
Restricted (Asymmetric) Distribution
0 is the max positive growth rate shock (percent)no restriction on the interest rate shock0 is the max positive pb shock (percent GDP)no restriction on the exchange rate shock
Restrictions on upside shocks:
1545 17%
1 2
Public Debt Held by Non-Residents
(in percent of total)
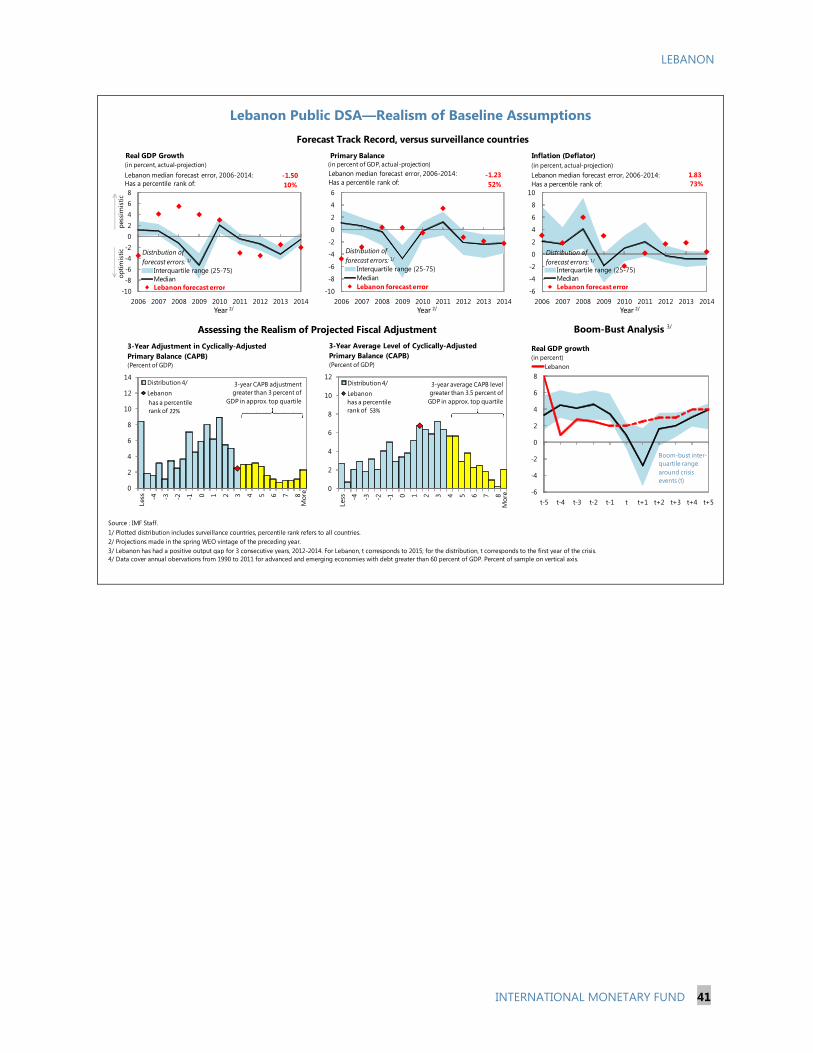
LEBANON
INTERNATIONAL MONETARY FUND 41
Lebanon Public DSA—Realism of Baseline Assumptions
Source : IMF Staff.1/ Plotted distribution includes surveillance countries, percentile rank refers to all countries.2/ Projections made in the spring WEO vintage of the preceding year.3/ Lebanon has had a positive output gap for 3 consecutive years, 2012-2014. For Lebanon, t corresponds to 2015; for the distribution, t corresponds to the first year of the crisis.
4/ Data cover annual obervations from 1990 to 2011 for advanced and emerging economies with debt greater than 60 percent of GDP. Percent of sample on vertical axis.
Forecast Track Record, versus surveillance countries
Boom-Bust Analysis 3/Assessing the Realism of Projected Fiscal Adjustment
-10-8-6-4-202468
2006 2007 2008 2009 2010 2011 2012 2013 2014Year 2/
Real GDP Growth
Interquartile range (25-75)MedianLebanon forecast error
-1.5010%Has a percentile rank of:
Lebanon median forecast error, 2006-2014:
Distribution of forecast errors: 1/
(in percent, actual-projection)
-10
-8
-6
-4
-2
0
2
4
6
2006 2007 2008 2009 2010 2011 2012 2013 2014Year 2/
Primary Balance
Interquartile range (25-75)MedianLebanon forecast error
-1.2352%Has a percentile rank of:
Lebanon median forecast error, 2006-2014:
Distribution of forecast errors: 1/
(in percent of GDP, actual-projection)
-6
-4
-2
0
2
4
6
8
10
2006 2007 2008 2009 2010 2011 2012 2013 2014Year 2/
Inflation (Deflator)
Interquartile range (25-75)MedianLebanon forecast error
1.8373%Has a percentile rank of:
Lebanon median forecast error, 2006-2014:
Distribution of forecast errors: 1/
(in percent, actual-projection)
pess
imis
ticop
timis
tic
-6
-4
-2
0
2
4
6
8
t-5 t-4 t-3 t-2 t-1 t t+1 t+2 t+3 t+4 t+5
Real GDP growth
Lebanon
Boom-bust inter-quartile range around crisis events (t)
(in percent)
0
2
4
6
8
10
12
14
Less -4 -3 -2 -1 0 1 2 3 4 5 6 7 8
Distribution 4/
Lebanon
3-Year Adjustment in Cyclically-Adjusted Primary Balance (CAPB)(Percent of GDP)
Mor
e
3-year CAPB adjustment greater than 3 percent of
GDP in approx. top quartilehas a percentile rank of 22%
0
2
4
6
8
10
12
Less -4 -3 -2 -1 0 1 2 3 4 5 6 7 8
Distribution 4/Lebanon
3-Year Average Level of Cyclically-Adjusted Primary Balance (CAPB)(Percent of GDP)
Mor
e
3-year average CAPB level greater than 3.5 percent of GDP in approx. top quartilehas a percentile
rank of 53%

LEBANON
42 INTERNATIONAL MONETARY FUND
Lebanon Public Sector Debt Sustainability Analysis (DSA)—Baseline Scenario (In percent of GDP, unless otherwise indicated)
As of February 06, 20152/ 2013 2014 2015 2016 2017 2018 2019 2020 Sovereign Spreads
Nominal gross public debt 158 133 133 132 135 138 140 141 143 EMBIG (bp) 3/ 400
Public gross financing needs 52.0 27.8 24.2 28.0 27.4 29.4 38.9 33.9 38.9 5Y CDS (bp) 380
Real GDP growth (in percent) 5.5 2.5 2.0 2.0 2.5 3.0 3.0 4.0 4.0 Ratings Foreign LocalInflation (GDP deflator, in percent) 3.7 5.3 2.8 6.8 1.9 2.0 2.3 2.4 2.4 Moody's B2 B2Nominal GDP growth (in percent) 9.5 7.9 4.9 9.0 4.5 5.1 5.3 6.5 6.5 S&Ps B- B-Effective interest rate (in percent) 4/ 7.4 6.6 6.6 7.1 7.3 7.6 7.8 8.1 8.3 Fitch B B
2013 2014 2015 2016 2017 2018 2019 2020 cumulativeChange in gross public sector debt -4.2 2.6 0.0 -1.0 2.7 2.5 2.2 1.1 1.7 9.2
Identified debt-creating flows -4.7 -0.9 -0.2 -1.1 2.4 2.1 2.0 0.9 1.1 7.4Primary deficit -2.1 0.7 -2.4 1.2 -1.2 -1.2 -1.2 -1.1 -1.2 -4.7
Primary (noninterest) revenue and gra23.6 19.8 21.8 19.2 20.4 20.5 20.6 20.7 20.7 122.1Primary (noninterest) expenditure 21.5 20.5 19.4 20.3 19.2 19.4 19.4 19.6 19.5 117.4
Automatic debt dynamics 5/ -2.6 -1.6 2.2 -2.3 3.6 3.2 3.2 2.1 2.3 12.1Interest rate/growth differential 6/ -2.6 -1.6 2.2 -2.3 3.6 3.2 3.2 2.1 2.3 12.1
Of which: real interest rate 5.6 1.4 4.7 0.1 6.7 7.1 7.1 7.3 7.6 36.0Of which: real GDP growth -8.1 -3.0 -2.5 -2.4 -3.2 -3.9 -3.9 -5.2 -5.3 -23.9
Exchange rate depreciation 7/ 0.0 0.0 0.0 … … … … … … …Other identified debt-creating flows 0.0 0.0 0.0 0.0 0.0 0.0 0.0 0.0 0.0 0.0
Please specify (1) (e.g., drawdown of 0.0 0.0 0.0 0.0 0.0 0.0 0.0 0.0 0.0 0.0Contingent liabilities 0.0 0.0 0.0 0.0 0.0 0.0 0.0 0.0 0.0 0.0Please specify (2) (e.g., ESM and Euro0.0 0.0 0.0 0.0 0.0 0.0 0.0 0.0 0.0 0.0
Residual, including asset changes 8/ 0.4 3.5 0.2 0.1 0.3 0.4 0.2 0.2 0.6 1.9
Source: IMF staff.
1/ Public sector is defined as general government.
2/ Based on available data.3/ EMBIG.
4/ Defined as interest payments divided by debt stock (excluding guarantees) at the end of previous year.
5/ Derived as [(r - π(1+g) - g + ae(1+r)]/(1+g+π+gπ)) times previous period debt ratio, with r = interest rate; π = growth rate of GDP deflator; g = real GDP growth rate;
a = share of foreign-currency denominated debt; and e = nominal exchange rate depreciation (measured by increase in local currency value of U.S. dollar).6/ The real interest rate contribution is derived from the numerator in footnote 5 as r - π (1+g) and the real growth contribution as -g.
7/ The exchange rate contribution is derived from the numerator in footnote 5 as ae(1+r).
8/ Includes asset changes and interest revenues (if any). For projections, includes exchange rate changes during the projection period.
9/ Assumes that key variables (real GDP growth, real interest rate, and other identified debt-creating flows) remain at the level of the last projection year.
2.3balance 9/
primary
Debt, Economic and Market Indicators 1/
2004-2012Actual
Projections
Contribution to Changes in Public DebtProjections
2004-2012Actual
debt-stabilizing
-25
-20
-15
-10
-5
0
5
10
15
20
2004 2005 2006 2007 2008 2009 2010 2011 2012 2013 2014 2015 2016 2017 2018 2019 2020
Debt-Creating Flows
Primary deficit Real GDP growth Real interest rate Exchange rate depreciation Other debt-creating flows ResidualChange in gross public sector debt
projection
(in percent of GDP)
-40
-30
-20
-10
0
10
20
30
40
50
cumulative
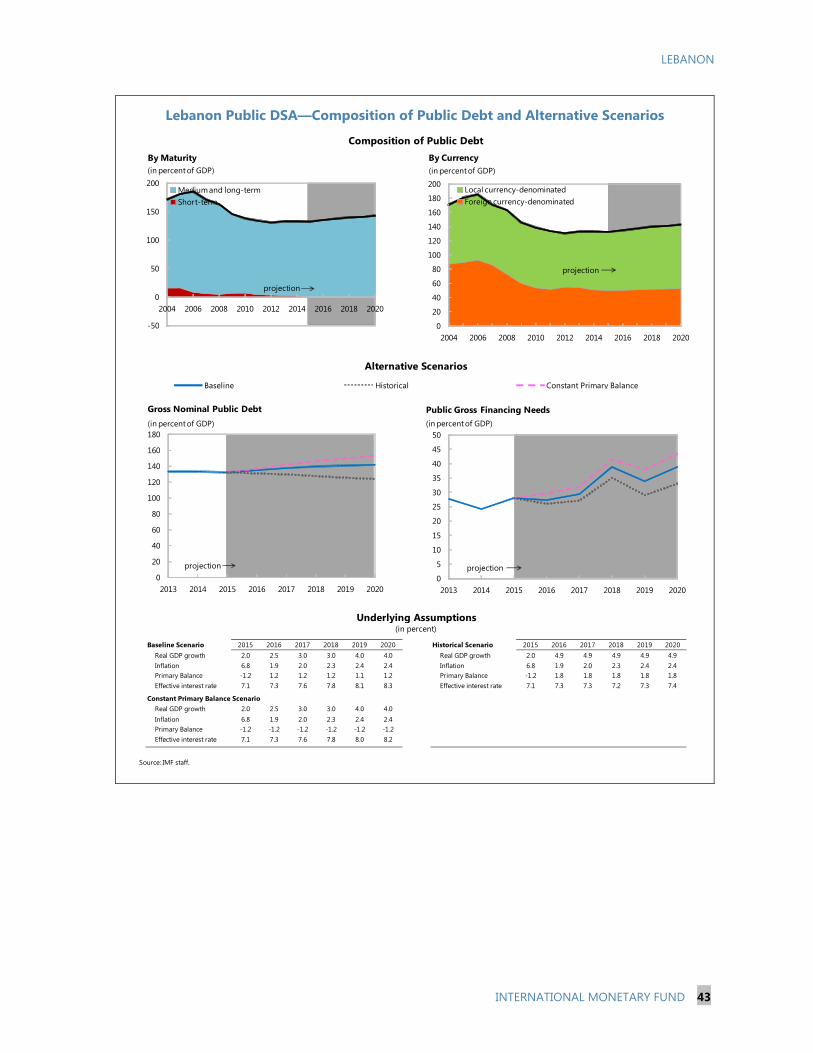
LEBANON
INTERNATIONAL MONETARY FUND 43
Lebanon Public DSA—Composition of Public Debt and Alternative Scenarios
Baseline Scenario 2015 2016 2017 2018 2019 2020 Historical Scenario 2015 2016 2017 2018 2019 2020Real GDP growth 2.0 2.5 3.0 3.0 4.0 4.0 Real GDP growth 2.0 4.9 4.9 4.9 4.9 4.9Inflation 6.8 1.9 2.0 2.3 2.4 2.4 Inflation 6.8 1.9 2.0 2.3 2.4 2.4Primary Balance -1.2 1.2 1.2 1.2 1.1 1.2 Primary Balance -1.2 1.8 1.8 1.8 1.8 1.8Effective interest rate 7.1 7.3 7.6 7.8 8.1 8.3 Effective interest rate 7.1 7.3 7.3 7.2 7.3 7.4
Constant Primary Balance ScenarioReal GDP growth 2.0 2.5 3.0 3.0 4.0 4.0Inflation 6.8 1.9 2.0 2.3 2.4 2.4Primary Balance -1.2 -1.2 -1.2 -1.2 -1.2 -1.2Effective interest rate 7.1 7.3 7.6 7.8 8.0 8.2
Source: IMF staff.
Underlying Assumptions(in percent)
Alternative Scenarios
Composition of Public Debt
Baseline Historical Constant Primary Balance
0
20
40
60
80
100
120
140
160
180
2013 2014 2015 2016 2017 2018 2019 2020
Gross Nominal Public Debt(in percent of GDP)
projection0
5
10
15
20
25
30
35
40
45
50
2013 2014 2015 2016 2017 2018 2019 2020
Public Gross Financing Needs(in percent of GDP)
projection
-50
0
50
100
150
200
2004 2006 2008 2010 2012 2014 2016 2018 2020
By Maturity
Medium and long-termShort-term
projection
(in percent of GDP)
0
20
40
60
80
100
120
140
160
180
200
2004 2006 2008 2010 2012 2014 2016 2018 2020
By Currency
Local currency-denominatedForeign currency-denominated
projection
(in percent of GDP)
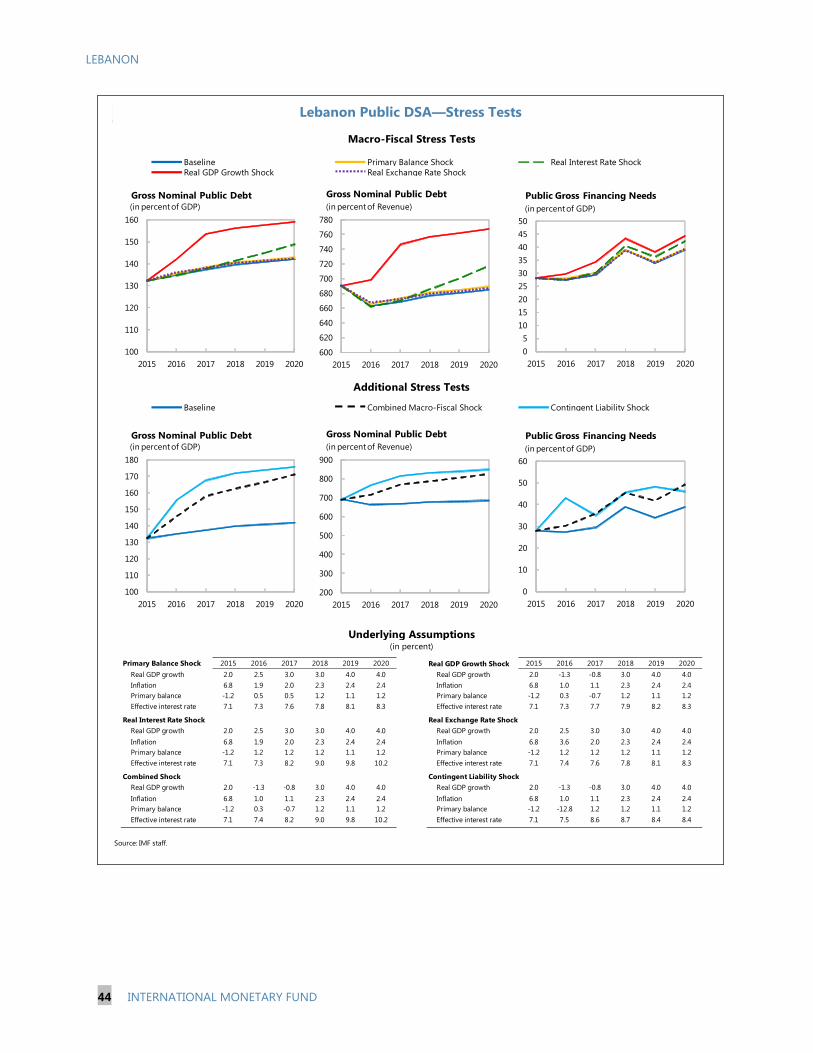
LEBANON
44 INTERNATIONAL MONETARY FUND
Lebanon Public DSA—Stress Tests
Primary Balance Shock 2015 2016 2017 2018 2019 2020 Real GDP Growth Shock 2015 2016 2017 2018 2019 2020Real GDP growth 2.0 2.5 3.0 3.0 4.0 4.0 Real GDP growth 2.0 -1.3 -0.8 3.0 4.0 4.0Inflation 6.8 1.9 2.0 2.3 2.4 2.4 Inflation 6.8 1.0 1.1 2.3 2.4 2.4Primary balance -1.2 0.5 0.5 1.2 1.1 1.2 Primary balance -1.2 0.3 -0.7 1.2 1.1 1.2Effective interest rate 7.1 7.3 7.6 7.8 8.1 8.3 Effective interest rate 7.1 7.3 7.7 7.9 8.2 8.3
Real Interest Rate Shock Real Exchange Rate ShockReal GDP growth 2.0 2.5 3.0 3.0 4.0 4.0 Real GDP growth 2.0 2.5 3.0 3.0 4.0 4.0Inflation 6.8 1.9 2.0 2.3 2.4 2.4 Inflation 6.8 3.6 2.0 2.3 2.4 2.4Primary balance -1.2 1.2 1.2 1.2 1.1 1.2 Primary balance -1.2 1.2 1.2 1.2 1.1 1.2Effective interest rate 7.1 7.3 8.2 9.0 9.8 10.2 Effective interest rate 7.1 7.4 7.6 7.8 8.1 8.3
Combined Shock Contingent Liability ShockReal GDP growth 2.0 -1.3 -0.8 3.0 4.0 4.0 Real GDP growth 2.0 -1.3 -0.8 3.0 4.0 4.0Inflation 6.8 1.0 1.1 2.3 2.4 2.4 Inflation 6.8 1.0 1.1 2.3 2.4 2.4Primary balance -1.2 0.3 -0.7 1.2 1.1 1.2 Primary balance -1.2 -12.8 1.2 1.2 1.1 1.2Effective interest rate 7.1 7.4 8.2 9.0 9.8 10.2 Effective interest rate 7.1 7.5 8.6 8.7 8.4 8.4
Source: IMF staff.
Macro-Fiscal Stress Tests
Baseline Primary Balance ShockReal GDP Growth Shock
Real Interest Rate Shock
(in percent)
Real Exchange Rate Shock
Combined Macro-Fiscal Shock
Additional Stress Tests
Baseline
Underlying Assumptions
Contingent Liability Shock
100
110
120
130
140
150
160
2015 2016 2017 2018 2019 2020
Gross Nominal Public Debt(in percent of GDP)
600
620
640
660
680
700
720
740
760
780
2015 2016 2017 2018 2019 2020
Gross Nominal Public Debt(in percent of Revenue)
05
101520253035404550
2015 2016 2017 2018 2019 2020
Public Gross Financing Needs(in percent of GDP)
100
110
120
130
140
150
160
170
180
2015 2016 2017 2018 2019 2020
Gross Nominal Public Debt(in percent of GDP)
200
300
400
500
600
700
800
900
2015 2016 2017 2018 2019 2020
Gross Nominal Public Debt(in percent of Revenue)
0
10
20
30
40
50
60
2015 2016 2017 2018 2019 2020
Public Gross Financing Needs(in percent of GDP)
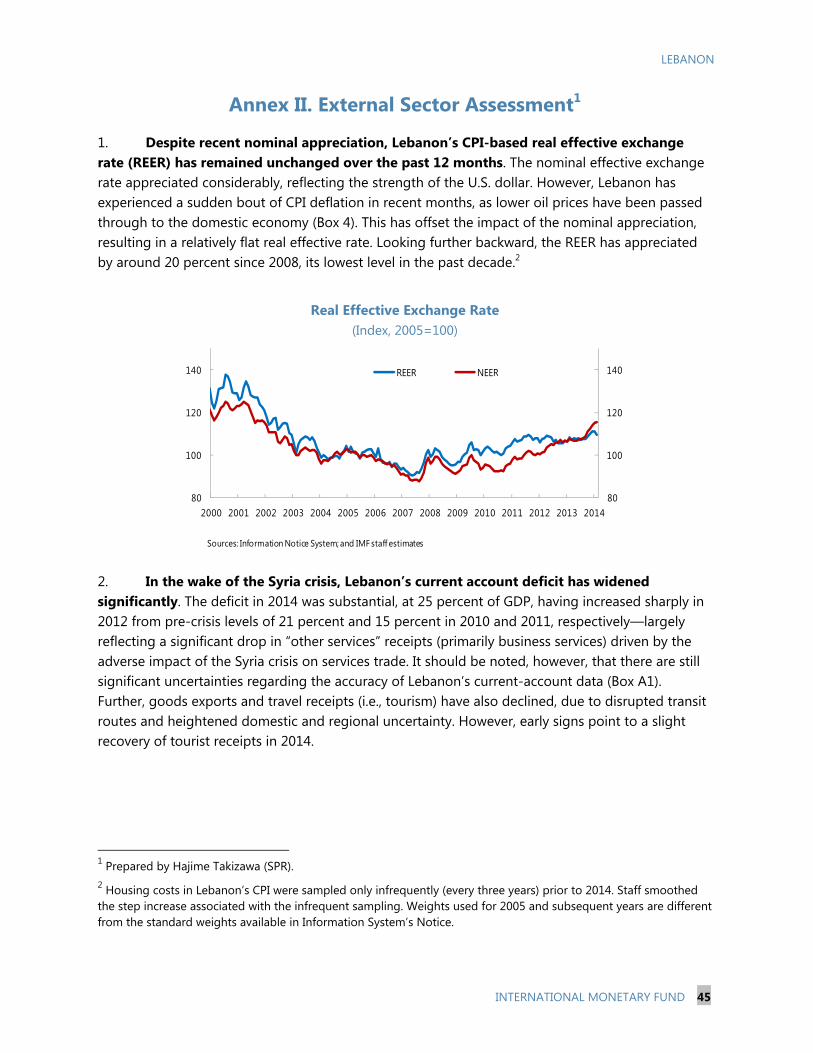
LEBANON
INTERNATIONAL MONETARY FUND 45
Annex II. External Sector Assessment1
1. Despite recent nominal appreciation, Lebanon’s CPI-based real effective exchange rate (REER) has remained unchanged over the past 12 months. The nominal effective exchange rate appreciated considerably, reflecting the strength of the U.S. dollar. However, Lebanon has experienced a sudden bout of CPI deflation in recent months, as lower oil prices have been passed through to the domestic economy (Box 4). This has offset the impact of the nominal appreciation, resulting in a relatively flat real effective rate. Looking further backward, the REER has appreciated by around 20 percent since 2008, its lowest level in the past decade.2
Real Effective Exchange Rate (Index, 2005=100)
2. In the wake of the Syria crisis, Lebanon’s current account deficit has widened significantly. The deficit in 2014 was substantial, at 25 percent of GDP, having increased sharply in 2012 from pre-crisis levels of 21 percent and 15 percent in 2010 and 2011, respectively—largely reflecting a significant drop in “other services” receipts (primarily business services) driven by the adverse impact of the Syria crisis on services trade. It should be noted, however, that there are still significant uncertainties regarding the accuracy of Lebanon’s current-account data (Box A1). Further, goods exports and travel receipts (i.e., tourism) have also declined, due to disrupted transit routes and heightened domestic and regional uncertainty. However, early signs point to a slight recovery of tourist receipts in 2014.
1 Prepared by Hajime Takizawa (SPR). 2 Housing costs in Lebanon’s CPI were sampled only infrequently (every three years) prior to 2014. Staff smoothed the step increase associated with the infrequent sampling. Weights used for 2005 and subsequent years are different from the standard weights available in Information System’s Notice.
80
100
120
140
80
100
120
140
2000 2001 2002 2003 2004 2005 2006 2007 2008 2009 2010 2011 2012 2013 2014
REER NEER
Sources: Information Notice System; and IMF staff estimates
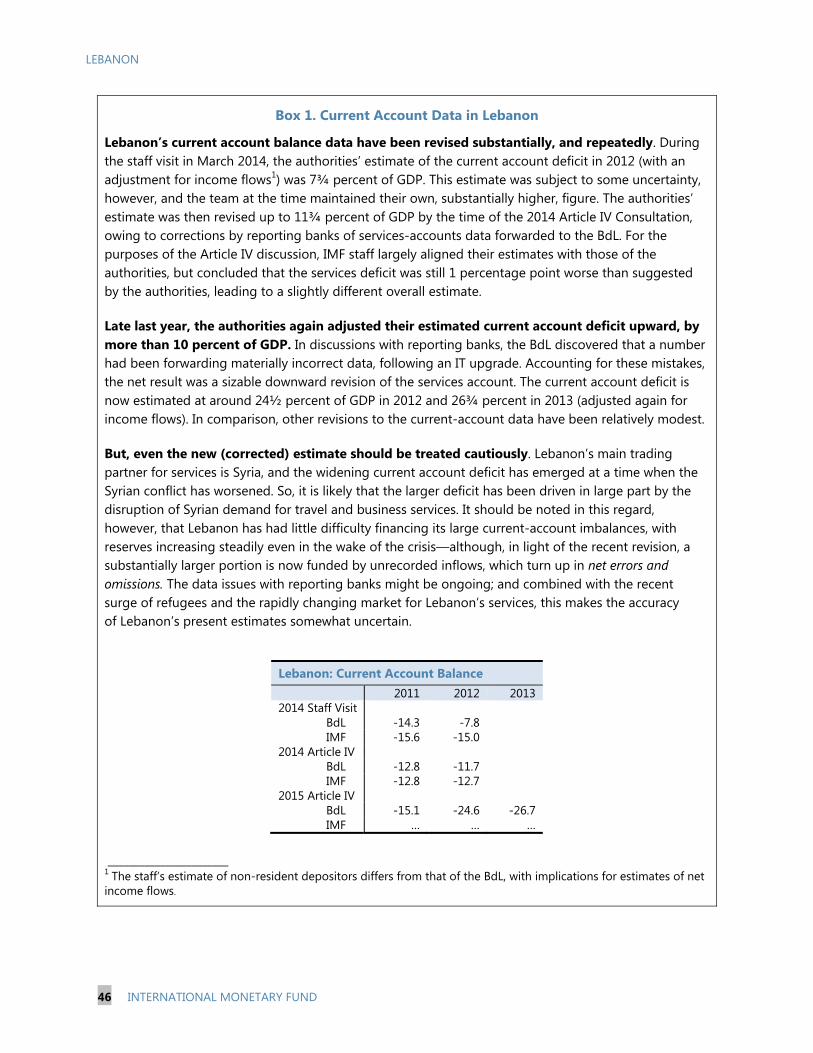
LEBANON
46 INTERNATIONAL MONETARY FUND
Box 1. Current Account Data in Lebanon
Lebanon’s current account balance data have been revised substantially, and repeatedly. During the staff visit in March 2014, the authorities’ estimate of the current account deficit in 2012 (with an adjustment for income flows1) was 7¾ percent of GDP. This estimate was subject to some uncertainty, however, and the team at the time maintained their own, substantially higher, figure. The authorities’ estimate was then revised up to 11¾ percent of GDP by the time of the 2014 Article IV Consultation, owing to corrections by reporting banks of services-accounts data forwarded to the BdL. For the purposes of the Article IV discussion, IMF staff largely aligned their estimates with those of the authorities, but concluded that the services deficit was still 1 percentage point worse than suggested by the authorities, leading to a slightly different overall estimate.
Late last year, the authorities again adjusted their estimated current account deficit upward, by more than 10 percent of GDP. In discussions with reporting banks, the BdL discovered that a number had been forwarding materially incorrect data, following an IT upgrade. Accounting for these mistakes, the net result was a sizable downward revision of the services account. The current account deficit is now estimated at around 24½ percent of GDP in 2012 and 26¾ percent in 2013 (adjusted again for income flows). In comparison, other revisions to the current-account data have been relatively modest.
But, even the new (corrected) estimate should be treated cautiously. Lebanon’s main trading partner for services is Syria, and the widening current account deficit has emerged at a time when the Syrian conflict has worsened. So, it is likely that the larger deficit has been driven in large part by the disruption of Syrian demand for travel and business services. It should be noted in this regard, however, that Lebanon has had little difficulty financing its large current-account imbalances, with reserves increasing steadily even in the wake of the crisis—although, in light of the recent revision, a substantially larger portion is now funded by unrecorded inflows, which turn up in net errors and omissions. The data issues with reporting banks might be ongoing; and combined with the recent surge of refugees and the rapidly changing market for Lebanon’s services, this makes the accuracy of Lebanon’s present estimates somewhat uncertain.
Lebanon: Current Account Balance 2011 2012 20132014 Staff Visit
BdL -14.3 -7.8IMF -15.6 -15.0
2014 Article IVBdL -12.8 -11.7IMF -12.8 -12.7
2015 Article IVBdL -15.1 -24.6 -26.7IMF … … …
_______________________ 1 The staff’s estimate of non-resident depositors differs from that of the BdL, with implications for estimates of net income flows.

LEBANON
INTERNATIONAL MONETARY FUND 47
3. The current account deficit is projected to narrow over the medium term but will remain sizable—15 percent of GDP by 2020. In particular, exports of goods and services will recover as domestic and regional uncertainties start to dissipate. While the projected 10 percentage-point adjustment of the external balance is considerable, the baseline nonetheless assumes that the crisis will still be influencing the current account balance even over the projection horizon, with a majority (two thirds) of Syrian refugees still in Lebanon by 2020.
4. Consultative Group on Exchange Rate (CGER)-type methodologies, applied to the baseline framework, suggest that Lebanon’s exchange rate is overvalued.3,4 This finding contrasts with the results from the 2014 Article IV consultation, reflecting the authorities’ recent revision to the current account balance, and a new (less optimistic) assumption regarding the persistence of the Syrian crisis’ impact on Lebanon’s balance of payments.
5. The extent of actual misalignment is likely to be lower than indicated by the CGER-type calculation. As discussed above, the medium-term external current account deficit projection reflects the highly persistent, but still temporary, impact of the Syria crisis. Abstracting from these effects, the REER would appear to be less overvalued.
3 The analytical tools were developed to facilitate external assessments for countries that are not included in the Consultative Group on Exchange Rate Issues (CGER) sample; it applies the same analytical approaches as those proposed by the CGER, but to a larger panel spanning emerging and developing countries, including Lebanon. Additional methodological information can be found at http://www.imf.org/external/pubs/ft/dp/2014/dp1401.pdf. Panel regression results are based on data from 2014 October WEO. The underlying external current account balance is taken from the latest WEO submission. 4 A third approach commonly used—the Equilibrium Real Exchange Rate (ERER)—could not be applied as it relies on labor productivity data, not available for Lebanon as employment data are missing.

LEBANON
48 INTERNATIONAL MONETARY FUND
Annex III. External Debt Sustainability Analysis1
1. Lebanon’s external debt will remain elevated. The external debt was 165 percent of GDP at end-2014, up from its most recent trough of 163 percent at end-2010. The increase reflects Lebanon’s sizable current account deficits, financed in large part by nonresident deposits into the banking sector (short-term deposits account for 77 percent of the economy’s external debt). Under the baseline scenario, external debt is projected to increase slightly to 175 percent of GDP by 2020. These projections assume a gradual recovery in GDP growth, an easing of the non-interest current account deficit, a rise of nonresident deposit inflows, and a general increase in nominal interest rates.
2. Two main factors mitigate the underlying vulnerabilities associated with high external debt.
Almost all nonresident deposits are short-term, though they largely originate from the Lebanese diaspora. They have been relatively stable over past stress episodes and account for some 80 percent of gross external financing needs over the projection period.
Owing to a lack of information on maturity, all external non-deposit liabilities of banks and all the external debt of nonbanks (about 10 percent of gross external financing) are treated as short-term debt. This implies that gross annual financing needs and short-term external debt are likely overestimated.
3. Standard bound tests suggest that debt dynamics are sensitive to macroeconomic shocks, particularly to the exchange rate. A one-time real depreciation of 30 percent in 2016 would increase the debt level to 244 percent of GDP (Figure 1, panel 6) on impact. This underscores the importance of the exchange rate peg as a linchpin of macroeconomic and financial stability in Lebanon. In addition, a permanent shock to the usual macroeconomic variables (½ standard deviation based on historical data) would have the following impact:
For the interest rate, the debt ratio would increase to 180 percent of GDP by 2020 (Figure 1, panel 2);
For the growth rate, it would increase to 190 percent of GDP by 2020 (Figure 1, panel 3); and
For the noninterest current account balance, it would increase to 199 percent of GDP by 2020 (Figure 1, panel 4).
A combined permanent shock of a ¼ standard deviation, applied simultaneously to the interest rate, growth rate, and noninterest current account balance would raise the debt ratio to 197 percent of GDP by 2020 (Figure 1, panel 5).
1 Prepared by Hajime Takizawa (SPR).
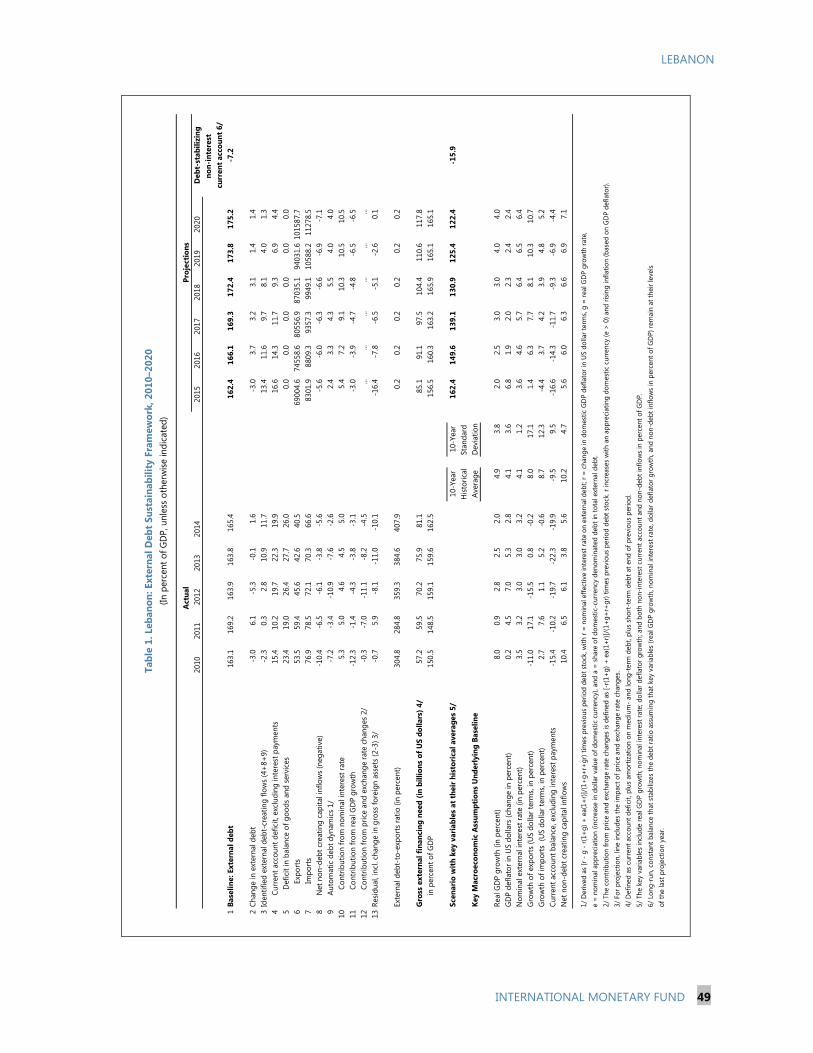
LEBANON
INTERNATIONAL MONETARY FUND 49
Proj
ectio
ns20
1020
1120
1220
1320
1420
1520
1620
1720
1820
1920
20D
ebt-
stab
ilizi
ngno
n-in
tere
st
curr
ent a
ccou
nt 6
/1
Base
line:
Ext
erna
l deb
t16
3.1
169.
216
3.9
163.
816
5.4
162.
416
6.1
169.
317
2.4
173.
817
5.2
-7.2
2Ch
ange
in e
xter
nal d
ebt
-3.0
6.1
-5.3
-0.1
1.6
-3.0
3.7
3.2
3.1
1.4
1.4
3Id
entif
ied
exte
rnal
deb
t-cr
eatin
g flo
ws
(4+
8+9)
-2.3
0.3
2.8
10.9
11.7
13.4
11.6
9.7
8.1
4.0
1.3
4Cu
rren
t acc
ount
def
icit,
exc
ludi
ng in
tere
st p
aym
ents
15.4
10.2
19.7
22.3
19.9
16.6
14.3
11.7
9.3
6.9
4.4
5D
efic
it in
bal
ance
of g
oods
and
ser
vice
s23
.419
.026
.427
.726
.00.
00.
00.
00.
00.
00.
06
Expo
rts
53.5
59.4
45.6
42.6
40.5
6900
4.6
7455
8.6
8055
6.9
8703
5.1
9403
1.6
1015
87.7
7Im
port
s 76
.978
.572
.170
.366
.683
01.9
8809
.393
57.3
9949
.110
588.
211
278.
58
Net
non
-deb
t cre
atin
g ca
pita
l inf
low
s (n
egat
ive)
-10.
4-6
.5-6
.1-3
.8-5
.6-5
.6-6
.0-6
.3-6
.6-6
.9-7
.19
Auto
mat
ic d
ebt d
ynam
ics
1/-7
.2-3
.4-1
0.9
-7.6
-2.6
2.4
3.3
4.3
5.5
4.0
4.0
10Co
ntrib
utio
n fro
m n
omin
al in
tere
st ra
te5.
35.
04.
64.
55.
05.
47.
29.
110
.310
.510
.511
Cont
ribut
ion
from
real
GD
P gr
owth
-1
2.3
-1.4
-4.3
-3.8
-3.1
-3.0
-3.9
-4.7
-4.8
-6.5
-6.5
12Co
ntrib
utio
n fro
m p
rice
and
exch
ange
rate
cha
nges
2/
-0.3
-7.0
-11.
1-8
.2-4
.5...
......
......
...13
Resid
ual,
incl
. cha
nge
in g
ross
fore
ign
asse
ts (2
-3) 3
/-0
.75.
9-8
.1-1
1.0
-10.
1-1
6.4
-7.8
-6.5
-5.1
-2.6
0.1
Exte
rnal
deb
t-to
-exp
orts
ratio
(in
perc
ent)
304.
828
4.8
359.
338
4.6
407.
90.
20.
20.
20.
20.
20.
2
Gro
ss e
xter
nal f
inan
cing
nee
d (in
bill
ions
of U
S do
llars
) 4/
57.2
59.5
70.2
75.9
81.1
85.1
91.1
97.5
104.
411
0.6
117.
8in
per
cent
of G
DP
150.
514
8.5
159.
115
9.6
162.
515
6.5
160.
316
3.2
165.
916
5.1
165.
1
Scen
ario
with
key
var
iabl
es a
t the
ir h
isto
rica
l ave
rage
s 5/
10-Y
ear
10-Y
ear
162.
414
9.6
139.
113
0.9
125.
412
2.4
-15.
9H
istor
ical
Stan
dard
Ke
y M
acro
econ
omic
Ass
umpt
ions
Und
erly
ing
Base
line
Aver
age
Dev
iatio
n
Real
GD
P gr
owth
(in
perc
ent)
8.0
0.9
2.8
2.5
2.0
4.9
3.8
2.0
2.5
3.0
3.0
4.0
4.0
GD
P de
flato
r in
US
dolla
rs (c
hang
e in
per
cent
)0.
24.
57.
05.
32.
84.
13.
66.
81.
92.
02.
32.
42.
4N
omin
al e
xter
nal i
nter
est r
ate
(in p
erce
nt)
3.5
3.2
3.0
3.0
3.2
4.1
1.2
3.6
4.6
5.7
6.4
6.5
6.4
Gro
wth
of e
xpor
ts (U
S do
llar t
erm
s, in
per
cent
)-1
1.0
17.1
-15.
50.
8-0
.28.
017
.11.
46.
37.
78.
110
.310
.7G
row
th o
f im
port
s (U
S do
llar t
erm
s, in
per
cent
)2.
77.
61.
15.
2-0
.68.
712
.3-4
.43.
74.
23.
94.
85.
2Cu
rren
t acc
ount
bal
ance
, exc
ludi
ng in
tere
st p
aym
ents
-1
5.4
-10.
2-1
9.7
-22.
3-1
9.9
-9.5
9.5
-16.
6-1
4.3
-11.
7-9
.3-6
.9-4
.4N
et n
on-d
ebt c
reat
ing
capi
tal i
nflo
ws
10.4
6.5
6.1
3.8
5.6
10.2
4.7
5.6
6.0
6.3
6.6
6.9
7.1
1/ D
eriv
ed a
s [r
- g
- r(1
+g)
+ e
a(1+
r)]/(
1+g+
r+gr
) tim
es p
revi
ous
perio
d de
bt s
tock
, with
r =
nom
inal
effe
ctiv
e in
tere
st ra
te o
n ex
tern
al d
ebt;
r = c
hang
e in
dom
estic
GD
P de
flato
r in
US
dolla
r ter
ms,
g =
real
GD
P gr
owth
rate
, e
= n
omin
al a
ppre
ciat
ion
(incr
ease
in d
olla
r val
ue o
f dom
estic
cur
renc
y), a
nd a
= s
hare
of d
omes
tic-c
urre
ncy
deno
min
ated
deb
t in
tota
l ext
erna
l deb
t.2/
The
con
trib
utio
n fro
m p
rice
and
exch
ange
rate
cha
nges
is d
efin
ed a
s [-
r(1+
g) +
ea(
1+r)]
/(1+
g+r+
gr) t
imes
pre
viou
s pe
riod
debt
sto
ck. r
incr
ease
s w
ith a
n ap
prec
iatin
g do
mes
tic c
urre
ncy
(e >
0) a
nd ri
sing
infla
tion
(bas
ed o
n G
DP
defla
tor).
3/
For
pro
ject
ion,
line
incl
udes
the
impa
ct o
f pric
e an
d ex
chan
ge ra
te c
hang
es.
4/ D
efin
ed a
s cu
rren
t acc
ount
def
icit,
plu
s am
ortiz
atio
n on
med
ium
- an
d lo
ng-t
erm
deb
t, pl
us s
hort
-ter
m d
ebt a
t end
of p
revi
ous
perio
d.
5/ T
he k
ey v
aria
bles
incl
ude
real
GD
P gr
owth
; nom
inal
inte
rest
rate
; dol
lar d
efla
tor g
row
th; a
nd b
oth
non-
inte
rest
cur
rent
acc
ount
and
non
-deb
t inf
low
s in
per
cent
of G
DP.
6/ L
ong-
run,
con
stan
t bal
ance
that
sta
biliz
es th
e de
bt ra
tio a
ssum
ing
that
key
var
iabl
es (r
eal G
DP
grow
th, n
omin
al in
tere
st ra
te, d
olla
r def
lato
r gro
wth
, and
non
-deb
t inf
low
s in
per
cent
of G
DP)
rem
ain
at th
eir l
evel
s of
the
last
pro
ject
ion
year
.
Act
ual
Tabl
e 1.
Leb
anon
: Ext
erna
l Deb
t Sus
tain
abili
ty F
ram
ewor
k, 2
010–
2020
(In p
erce
nt o
f GD
P, u
nles
s ot
herw
ise in
dica
ted)

LEBANON
50 INTERNATIONAL MONETARY FUND
Figure 1. Lebanon: External Debt Sustainability: Bound Tests 1/ 2/ (External debt in percent of GDP)

LEBANON
INTERNATIONAL MONETARY FUND 51
Appendix I. Draft Press Release
Press Release No. 15/x
FOR IMMEDIATE RELEASE
[Month, dd, yyyy]
IMF Executive Board Concludes Article IV Consultation with Lebanon
On June [26], 2015, the Executive Board of the International Monetary Fund (IMF) concluded
the Article IV consultation1 with Lebanon.
The conflict in Syria, now in its fifth year, dominates Lebanon’s outlook, with refugees now
comprising over one-quarter of the population. The refugee crisis is straining local
communities, adding to poverty and unemployment, and placing further pressure on the
economy’s already-weak public finances and infrastructure. Moreover, Lebanon faces a
difficult domestic political situation. The presidency has been vacant since May 2014 and a lack
of consensus between the major parties is hindering passage of key legislation.
In the face of this uncertainty, growth remains disappointing. Following a sharp drop in 2011,
growth has crawled upward to about 2–3 percent but remains well short of potential. IMF staff
estimate that GDP increased by only 2 percent in 2014 and project a similarly modest growth
rate in 2015. Lebanon’s traditional growth drivers—tourism, real estate, and construction—have
received a significant blow and a strong rebound is unlikely soon. Lebanon’s return to potential
1 Under Article IV of the IMF's Articles of Agreement, the IMF holds bilateral discussions with members, usually
every year. A staff team visits the country, collects economic and financial information, and discusses with
officials the country's economic developments and policies. On return to headquarters, the staff prepares a report,
which forms the basis for discussion by the Executive Board.
International Monetary Fund
700 19th Street, NW
Washington, D. C. 20431 USA

LEBANON
52 INTERNATIONAL MONETARY FUND
growth (4 percent) before 2019 is now doubtful. Inflation also declined sharply in 2014 on the
back of lower oil prices and other one-off factors, but should return to about 3 percent by
end-2015.
On the fiscal side, exceptional factors allowed for a primary surplus in 2014, but without
decisive action fiscal deterioration will continue in 2015. The 2014 primary surplus of about
2.5 percent of GDP largely resulted from exceptional telecom transfers and, to some extent,
from withheld and delayed payments. But the primary balance is expected to return to a deficit
of almost 1.25 percent of GDP in 2015, with public debt remaining high at 132 percent of GDP.
Foreign-exchange and financial markets continue to be resilient, despite Lebanon’s sizable
external financial requirements. Inflows remain large, particularly from non-resident deposits;
and in the context of Lebanon’s currency peg to the U.S. dollar, the Banque du Liban (BdL) has
maintained an adequate level of gross foreign exchange reserves.
Executive Board Assessment2
< >
2 At the conclusion of the discussion, the Managing Director, as Chairman of the Board, summarizes the views of
Executive Directors, and this summary is transmitted to the country's authorities. An explanation of any qualifiers
used in summings up can be found here: http://www.imf.org/external/np/sec/misc/qualifiers.htm.
LEBANON STAFF REPORT FOR THE 2015 ARTICLE IV CONSULTATION—INFORMATIONAL ANNEX Prepared By
The Middle East and Central Asia Department (In consultation with other departments)
FUND RELATIONS ________________________________________________________________________ 2
WORLD BANK-IMF COLLABORATION ___________________________________________________ 5
STATISTICAL ISSUES ____________________________________________________________________ 11
CONTENTS
June 11, 2015

LEBANON
2 INTERNATIONAL MONETARY FUND
FUND RELATIONS (As of May 30, 2015) Membership Status:
Joined: April 14, 1947; Article VIII
General Resources Account
SDR Million Percent Quota
Quota 266.40 100.00
Fund holdings of currency 231.72 86.98
Reserve position in Fund 34.68 13.02
SDR Department
SDR Million Percent Allocation
Net cumulative allocation 193.29 100.00
Holdings 192.30 99.49
Use of Fund Resources
Lebanon has no outstanding credit from/obligations to the IMF.
Latest Financial Arrangements
None.
Implementation of HIPC Initiative and Multilateral Debt Relief Initiative (MDRI)
Not applicable.
Safeguards Assessment:
Pursuant to Fund policy, the Banque du Liban (BdL) was subject to a full safeguards assessment in conjunction with the first Emergency Post-Conflict Assistance (EPCA) in April 2007. The 2008 safeguards assessment report proposed several specific measures for enhancing the BdL
LEBANON
INTERNATIONAL MONETARY FUND 3
financial reporting, audit and control procedures, and recommended an update of the central bank law. An update safeguards assessment was completed in August 2009 in the context of the second EPCA. The update noted progress achieved in enhancing procedures for reserve management and external audit, but recommended further actions to strengthen internal audit, financial reporting transparency, oversight, and central bank legislation.
Nonfinancial Relations
Exchange Arrangement
Lebanon has accepted the obligations of Article VIII, Sections 2, 3, and 4 in 1993, and maintains an exchange system free of restrictions on the making of payments and transfers for current international transactions. The exchange arrangement, which maintains a de-facto peg to the U.S. dollar, is classified as stabilized. Since October 1999, the BdL has been intervening to keep the pound around a mid-point parity of LL 1,507.5 per $1, with a bid-ask spread of LL+/-6.5.
Last Article IV Consultation
The 2014 Article IV Consultation was concluded by the Executive Board on June 26, 2014. At the time, Directors noted that the conflict in Syria and domestic political uncertainty were adding stress to Lebanon’s already difficult economic environment. This led to a subdued growth, an increase in fiscal imbalances and a rise in public debt. They commended the authorities’ efforts for receiving an unprecedented inflow of Syrian refugees but recognized that this was straining the economic and social structures and fueling already high unemployment and poverty. They agreed that Lebanon needed additional support from the international community. They emphasized the importance of a credible and balanced fiscal adjustment strategy to prevent further fiscal deterioration. Directors agreed that monetary policy should remain geared towards maintaining adequate FX reserves in support of the dollar peg. They underscored the need to reform the electricity sector, including by improving generation capacity and raising average tariffs toward costs recovery, while protecting lower-income users. Directors emphasized the importance of undertaking structural reforms to unlock Lebanon’s growth potential and improve social conditions.
Financial Sector Assessment Program
Lebanon participated in the Financial Sector Assessment Program in 1999, and the related report was presented to the Executive Board at the time of the 1999 Article IV Consultation (FO/DIS/99/113). A Financial System Stability Assessment update was conducted in 2001, and the related report presented to the Executive Board at the time of the 2001 Article IV Consultation (SM/01/281). In February 2015, the authorities requested an FSAP update. The scoping mission is expected to take place in the fall of 2015 and the FSAP in early 2016.
LEBANON
4 INTERNATIONAL MONETARY FUND
Resident Representative Office
The IMF Resident Representative Office in Lebanon was opened in January 2008 and closed in August 2011. The Fund maintains a local office.
Technical Assistance (TA)
Fiscal area—In recent years, the Fiscal Affairs Department (FAD) has provided assistance on the tax regime and revenue administration of oil and gas resources, PFM reform, the budget system law, public accounting; while METAC continued to provide TA on tax and customs administration and PFM reform. In 2015, FAD is providing further advice and capacity building on fiscal regimes and revenue administration for the oil and gas sector and conducting a tax gap analysis for the Value Added Tax (VAT). It also carried out a TA mission to strengthen the performance of the Large Taxpayers’ Office (LTO) and VAT Directorate through developing audit programs based on sector-specific compliance risks.
Financial area—The Monetary and Capital Markets Department (MCM) has provided TA mainly on establishing supervisory colleges for international banking groups, banking supervision, early warning system, non-bank financial institutions supervision, and the coordinated direct investment survey.
Statistical area—The Statistics Department has provided TA in national accounts, price and balance of payments statistics. Several missions on the consumer price index (CPI) were undertaken, a workshop on price compilation issues and a national accounts statistics mission were conducted in 2015. METAC has been providing assistance on balance of payments and international investment position statistics.
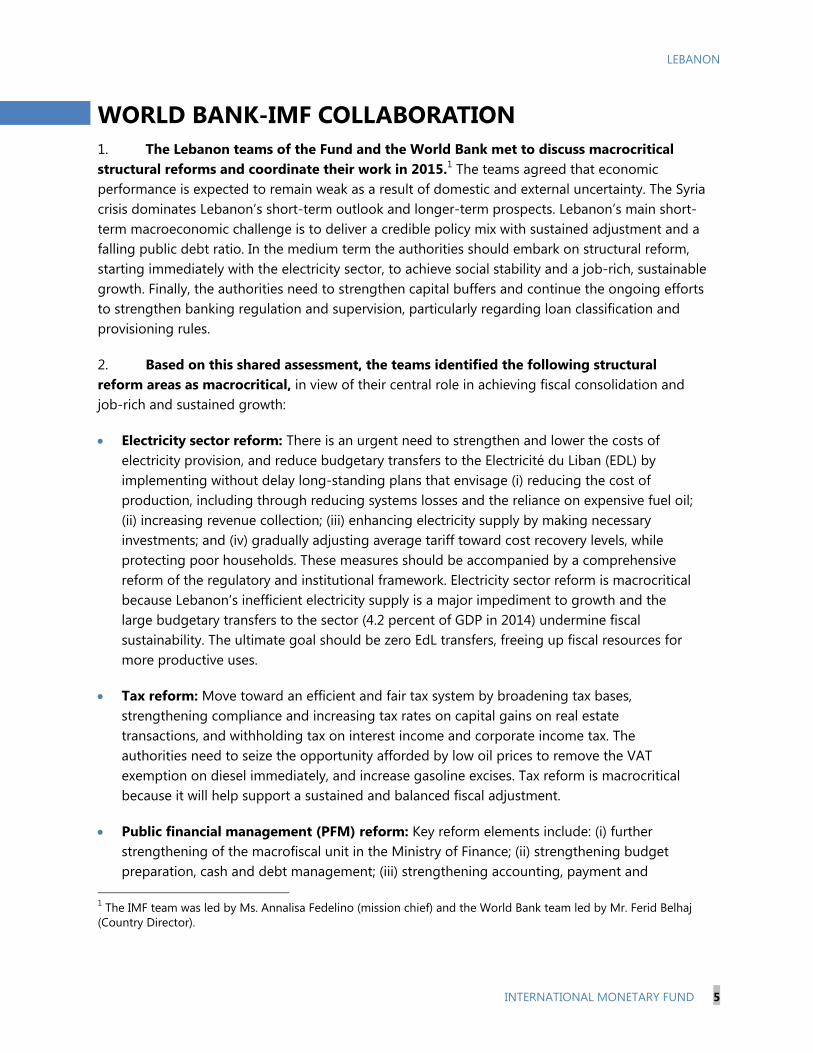
LEBANON
INTERNATIONAL MONETARY FUND 5
WORLD BANK-IMF COLLABORATION 1. The Lebanon teams of the Fund and the World Bank met to discuss macrocritical structural reforms and coordinate their work in 2015.1 The teams agreed that economic performance is expected to remain weak as a result of domestic and external uncertainty. The Syria crisis dominates Lebanon’s short-term outlook and longer-term prospects. Lebanon’s main short-term macroeconomic challenge is to deliver a credible policy mix with sustained adjustment and a falling public debt ratio. In the medium term the authorities should embark on structural reform, starting immediately with the electricity sector, to achieve social stability and a job-rich, sustainable growth. Finally, the authorities need to strengthen capital buffers and continue the ongoing efforts to strengthen banking regulation and supervision, particularly regarding loan classification and provisioning rules.
2. Based on this shared assessment, the teams identified the following structural reform areas as macrocritical, in view of their central role in achieving fiscal consolidation and job-rich and sustained growth:
Electricity sector reform: There is an urgent need to strengthen and lower the costs of electricity provision, and reduce budgetary transfers to the Electricité du Liban (EDL) by implementing without delay long-standing plans that envisage (i) reducing the cost of production, including through reducing systems losses and the reliance on expensive fuel oil; (ii) increasing revenue collection; (iii) enhancing electricity supply by making necessary investments; and (iv) gradually adjusting average tariff toward cost recovery levels, while protecting poor households. These measures should be accompanied by a comprehensive reform of the regulatory and institutional framework. Electricity sector reform is macrocritical because Lebanon’s inefficient electricity supply is a major impediment to growth and the large budgetary transfers to the sector (4.2 percent of GDP in 2014) undermine fiscal sustainability. The ultimate goal should be zero EdL transfers, freeing up fiscal resources for more productive uses.
Tax reform: Move toward an efficient and fair tax system by broadening tax bases, strengthening compliance and increasing tax rates on capital gains on real estate transactions, and withholding tax on interest income and corporate income tax. The authorities need to seize the opportunity afforded by low oil prices to remove the VAT exemption on diesel immediately, and increase gasoline excises. Tax reform is macrocritical because it will help support a sustained and balanced fiscal adjustment.
Public financial management (PFM) reform: Key reform elements include: (i) further strengthening of the macrofiscal unit in the Ministry of Finance; (ii) strengthening budget preparation, cash and debt management; (iii) strengthening accounting, payment and
1 The IMF team was led by Ms. Annalisa Fedelino (mission chief) and the World Bank team led by Mr. Ferid Belhaj (Country Director).

LEBANON
6 INTERNATIONAL MONETARY FUND
auditing functions, including by introducing a Government Financial Management Information System; (iv) completing the coverage of the Treasury Single Account; (v) developing a system to account for arrears and increasing transparency and regularity in treasury inflows and outflows and (vi) setting up a framework to assess the fiscal impact of the Syrian refugees on certain budget lines. These reforms are macrocritical because they will improve the management of public finances and reduce ad-hoc and discretionary adjustments.
Social services and safety net reform: Social services and the social safety net are far from satisfactory. The following reforms would help: (i) health: rationalizing health spending and expanding health insurance coverage; (ii) pension systems: strengthening financial sustainability and administration of the National Social Security Fund, reforming the end-of-service indemnity, and ultimately introducing a unified and fairer pension system for public and private sector employees to restore fiscal sustainability and ensure equity; (iii) education: improving the quality of public education, including strengthening higher education and vocational training and enhancing resources and capacity building at schools to accommodate Syrian students; and (iv) social safety nets: improving targeting to the most needy through among other initiatives expanding the coverage and enhancing the social assistance package of the National Poverty Targeting Program (NPTP) to Lebanese affected by the Syrian crisis and all Lebanese households under the extreme poverty line. These reforms are macrocritical because they will increase the efficiency of public spending; enhance the productivity of the workforce and strengthen growth prospects; reduce inequalities as well as alleviate social tensions, and generate political support for the needed fiscal consolidation.
Investment climate reform: Lebanon’s corporate sector is held back by the high costs of doing business, arising from weaknesses in governance, regulatory systems, and contract enforcement as well as high cost and inefficient provision of basic utilities like electricity, water and transportation. Reforms in this area are macrocritical because they will improve competitiveness, decrease business costs and help increase the growth potential.
Financial sector stability assessment: Given the very large financial sector and the high dollarization, financial stability is key for macroeconomic stability. Assessing financial system stability—which would be undertaken in the upcoming FSAP scheduled for early 2016 —is macrocritical because it will help identify potential risks and provide suggestions for addressing them.
Reform of the statistical system: Lebanon’s statistical system suffers from fragmentation and limited capacity to provide timely and reliable data. More recently, accumulated delays in the provision of data to the public and increasing lack of cooperation and coordination among various agencies have been noted. Strengthening statistical systems is macrocritical because timely and reliable data are needed to monitor economic and social developments and support decision making and greater accountability.
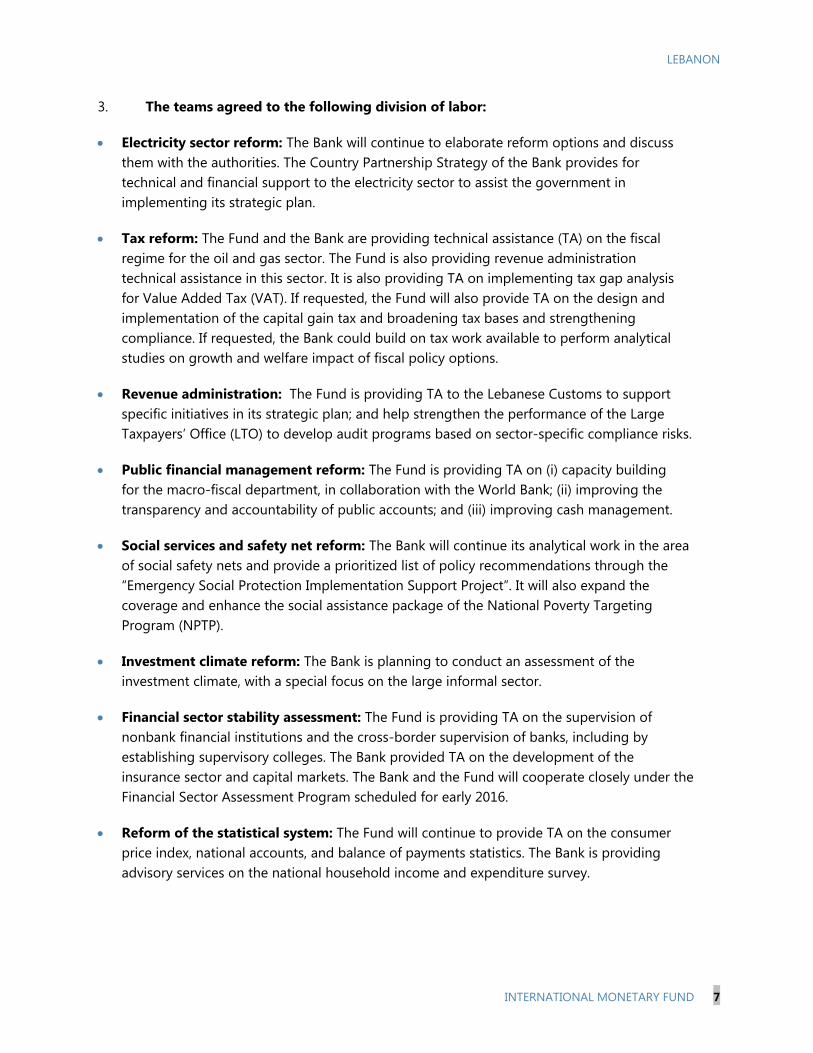
LEBANON
INTERNATIONAL MONETARY FUND 7
3. The teams agreed to the following division of labor:
Electricity sector reform: The Bank will continue to elaborate reform options and discuss them with the authorities. The Country Partnership Strategy of the Bank provides for technical and financial support to the electricity sector to assist the government in implementing its strategic plan.
Tax reform: The Fund and the Bank are providing technical assistance (TA) on the fiscal regime for the oil and gas sector. The Fund is also providing revenue administration technical assistance in this sector. It is also providing TA on implementing tax gap analysis for Value Added Tax (VAT). If requested, the Fund will also provide TA on the design and implementation of the capital gain tax and broadening tax bases and strengthening compliance. If requested, the Bank could build on tax work available to perform analytical studies on growth and welfare impact of fiscal policy options.
Revenue administration: The Fund is providing TA to the Lebanese Customs to support specific initiatives in its strategic plan; and help strengthen the performance of the Large Taxpayers’ Office (LTO) to develop audit programs based on sector-specific compliance risks.
Public financial management reform: The Fund is providing TA on (i) capacity building for the macro-fiscal department, in collaboration with the World Bank; (ii) improving the transparency and accountability of public accounts; and (iii) improving cash management.
Social services and safety net reform: The Bank will continue its analytical work in the area of social safety nets and provide a prioritized list of policy recommendations through the “Emergency Social Protection Implementation Support Project”. It will also expand the coverage and enhance the social assistance package of the National Poverty Targeting Program (NPTP).
Investment climate reform: The Bank is planning to conduct an assessment of the investment climate, with a special focus on the large informal sector.
Financial sector stability assessment: The Fund is providing TA on the supervision of nonbank financial institutions and the cross-border supervision of banks, including by establishing supervisory colleges. The Bank provided TA on the development of the insurance sector and capital markets. The Bank and the Fund will cooperate closely under the Financial Sector Assessment Program scheduled for early 2016.
Reform of the statistical system: The Fund will continue to provide TA on the consumer price index, national accounts, and balance of payments statistics. The Bank is providing advisory services on the national household income and expenditure survey.

LEBANON
8 INTERNATIONAL MONETARY FUND
4. The teams have the following requests for information from their counterparts:
The Fund team requests to be kept informed of progress in the Bank’s work in the above macrocritical structural reform areas. Timing: when milestones are reached (and at least semi-annually).
The Bank team requests to be kept informed of the Fund’s assessments of macroeconomic policies and prospects, as well as of Fund’s TA in the above reform areas. Timing: in the context of Article IV Consultation and other missions (and at least semi-annually).
The two teams will continue to exchange views on the macroframework and the Country Partnership Strategy.
The table below lists the teams’ separate and joint work programs in 2014–15.
Lebanon—Bank and Fund Planned Activities in Macrocritical Structural Reform Areas
Title Products Provisional Timing of Missions
Expected Delivery
Date
1. Bank Work
Program IBRD Lending Program Grants/Trust Funds
Urban Transport Development Project ($134.7 m)
Ongoing
12/31/2015
Education Development Project II ($40 m)
Greater Beirut Water Supply ($200 m)
Water Supply Augmentation Project ($474 m)
Environmental Pollution Abatement ($15 m)
Fiscal Management Reform 2 ($5.2 m)
Social Promotion & Protection ($30 m)
Cultural Heritage & Urban Development ($58.5 m)
Mobile Internet Ecosystem ($6.4 m)
Supporting Innovation in SMEs ($30 m)
Ongoing
Ongoing
Pending
Pending
Pending
Pending
Ongoing
Pending
Ongoing
12/31/2016
6/30/2016
6/30/2024
3/31/2021
3/31/2017
12/31/2018
12/31/2015
12/31/2017
6/30/2018
Improve Capacity for Environmental Compliance ($0.3 m – IDF)
Emergency Education System Stabilization ($32 m) / LSCTF
Emergency Primary Healthcare Restoration ($15 m)/ LSCTF
Ongoing
Pending
Pending
10/7/2016
6/30/2020
12/30/2018
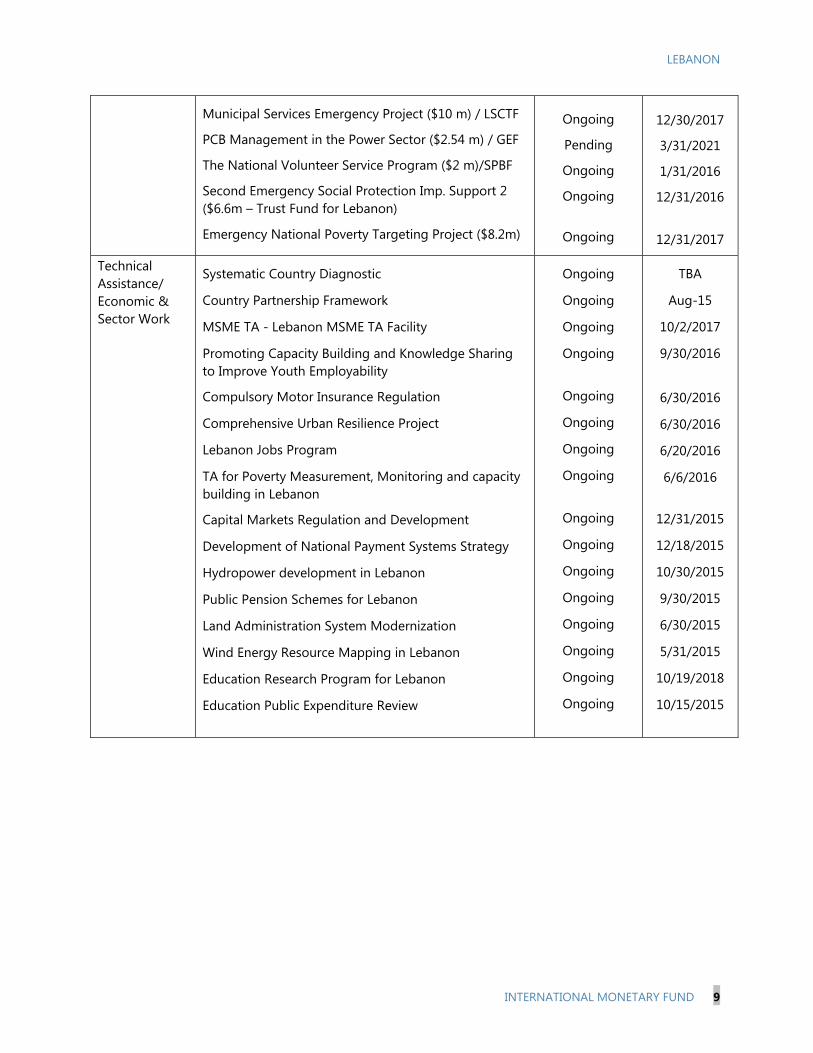
LEBANON
INTERNATIONAL MONETARY FUND 9
Municipal Services Emergency Project ($10 m) / LSCTF
PCB Management in the Power Sector ($2.54 m) / GEF
The National Volunteer Service Program ($2 m)/SPBF
Second Emergency Social Protection Imp. Support 2 ($6.6m – Trust Fund for Lebanon)
Emergency National Poverty Targeting Project ($8.2m)
Ongoing
Pending
Ongoing
Ongoing
Ongoing
12/30/2017
3/31/2021
1/31/2016
12/31/2016
12/31/2017
Technical Assistance/ Economic & Sector Work
Systematic Country Diagnostic
Country Partnership Framework
MSME TA - Lebanon MSME TA Facility
Promoting Capacity Building and Knowledge Sharing to Improve Youth Employability
Compulsory Motor Insurance Regulation
Comprehensive Urban Resilience Project
Lebanon Jobs Program
TA for Poverty Measurement, Monitoring and capacity building in Lebanon
Capital Markets Regulation and Development
Development of National Payment Systems Strategy
Hydropower development in Lebanon
Public Pension Schemes for Lebanon
Land Administration System Modernization
Wind Energy Resource Mapping in Lebanon
Education Research Program for Lebanon
Education Public Expenditure Review
Ongoing
Ongoing
Ongoing
Ongoing
Ongoing
Ongoing
Ongoing
Ongoing
Ongoing
Ongoing
Ongoing
Ongoing
Ongoing
Ongoing
Ongoing
Ongoing
TBA
Aug-15
10/2/2017
9/30/2016
6/30/2016
6/30/2016
6/20/2016
6/6/2016
12/31/2015
12/18/2015
10/30/2015
9/30/2015
6/30/2015
5/31/2015
10/19/2018
10/15/2015
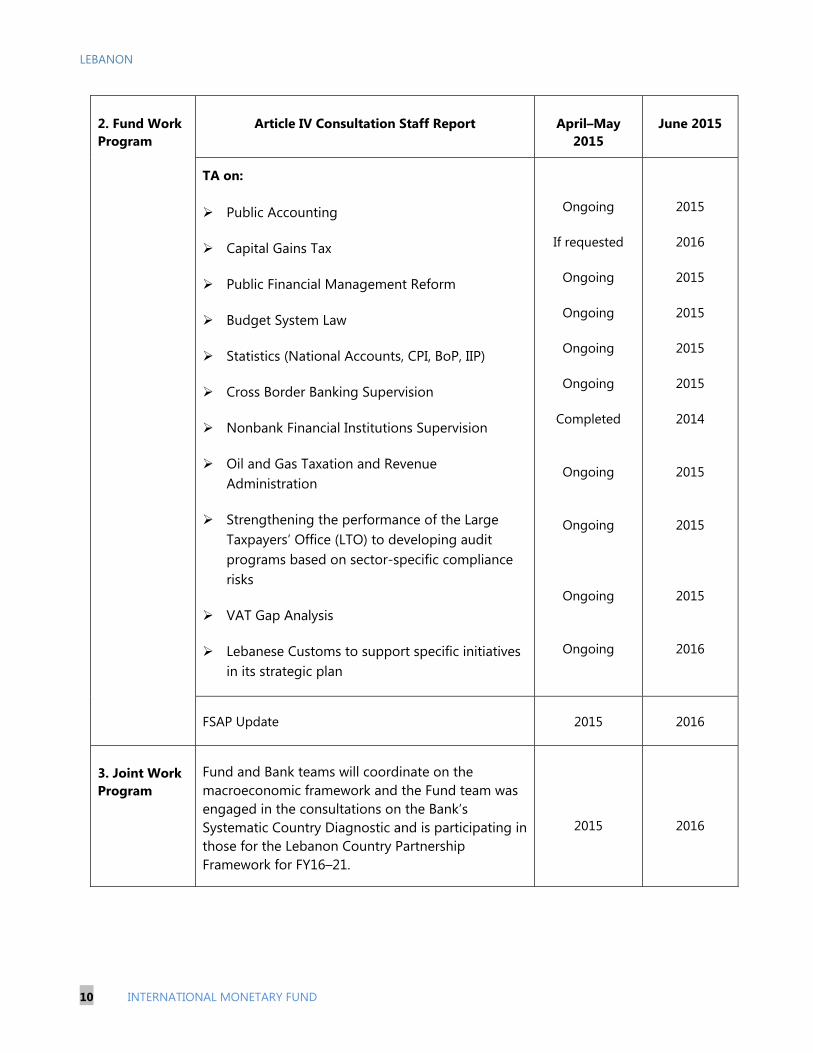
LEBANON
10 INTERNATIONAL MONETARY FUND
2. Fund Work Program
Article IV Consultation Staff Report
April–May
2015
June 2015
TA on: Public Accounting
Capital Gains Tax
Public Financial Management Reform
Budget System Law
Statistics (National Accounts, CPI, BoP, IIP)
Cross Border Banking Supervision
Nonbank Financial Institutions Supervision
Oil and Gas Taxation and Revenue Administration
Strengthening the performance of the Large Taxpayers’ Office (LTO) to developing audit programs based on sector-specific compliance risks
VAT Gap Analysis
Lebanese Customs to support specific initiatives in its strategic plan
Ongoing
If requested
Ongoing
Ongoing
Ongoing
Ongoing
Completed
Ongoing
Ongoing
Ongoing
Ongoing
2015
2016
2015
2015
2015
2015
2014
2015
2015
2015
2016
FSAP Update 2015 2016
3. Joint Work Program
Fund and Bank teams will coordinate on the macroeconomic framework and the Fund team was engaged in the consultations on the Bank’s Systematic Country Diagnostic and is participating in those for the Lebanon Country Partnership Framework for FY16–21.
2015
2016
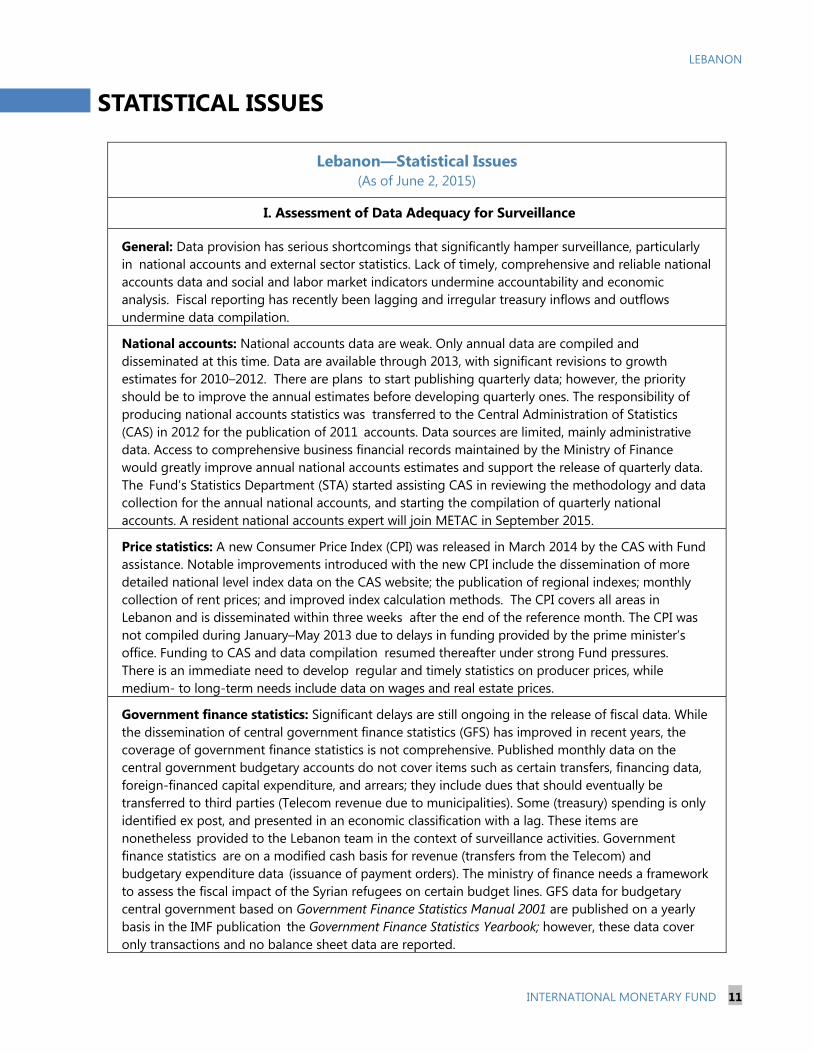
LEBANON
INTERNATIONAL MONETARY FUND 11
STATISTICAL ISSUES
Lebanon—Statistical Issues (As of June 2, 2015)
I. Assessment of Data Adequacy for Surveillance
General: Data provision has serious shortcomings that significantly hamper surveillance, particularly in national accounts and external sector statistics. Lack of timely, comprehensive and reliable national accounts data and social and labor market indicators undermine accountability and economic analysis. Fiscal reporting has recently been lagging and irregular treasury inflows and outflows undermine data compilation.
National accounts: National accounts data are weak. Only annual data are compiled and disseminated at this time. Data are available through 2013, with significant revisions to growth estimates for 2010–2012. There are plans to start publishing quarterly data; however, the priority should be to improve the annual estimates before developing quarterly ones. The responsibility of producing national accounts statistics was transferred to the Central Administration of Statistics (CAS) in 2012 for the publication of 2011 accounts. Data sources are limited, mainly administrative data. Access to comprehensive business financial records maintained by the Ministry of Finance would greatly improve annual national accounts estimates and support the release of quarterly data. The Fund’s Statistics Department (STA) started assisting CAS in reviewing the methodology and data collection for the annual national accounts, and starting the compilation of quarterly national accounts. A resident national accounts expert will join METAC in September 2015.
Price statistics: A new Consumer Price Index (CPI) was released in March 2014 by the CAS with Fund assistance. Notable improvements introduced with the new CPI include the dissemination of more detailed national level index data on the CAS website; the publication of regional indexes; monthly collection of rent prices; and improved index calculation methods. The CPI covers all areas in Lebanon and is disseminated within three weeks after the end of the reference month. The CPI was not compiled during January–May 2013 due to delays in funding provided by the prime minister’s office. Funding to CAS and data compilation resumed thereafter under strong Fund pressures. There is an immediate need to develop regular and timely statistics on producer prices, while medium- to long-term needs include data on wages and real estate prices.
Government finance statistics: Significant delays are still ongoing in the release of fiscal data. While the dissemination of central government finance statistics (GFS) has improved in recent years, the coverage of government finance statistics is not comprehensive. Published monthly data on the central government budgetary accounts do not cover items such as certain transfers, financing data, foreign-financed capital expenditure, and arrears; they include dues that should eventually be transferred to third parties (Telecom revenue due to municipalities). Some (treasury) spending is only identified ex post, and presented in an economic classification with a lag. These items are nonetheless provided to the Lebanon team in the context of surveillance activities. Government finance statistics are on a modified cash basis for revenue (transfers from the Telecom) and budgetary expenditure data (issuance of payment orders). The ministry of finance needs a framework to assess the fiscal impact of the Syrian refugees on certain budget lines. GFS data for budgetary central government based on Government Finance Statistics Manual 2001 are published on a yearly basis in the IMF publication the Government Finance Statistics Yearbook; however, these data cover only transactions and no balance sheet data are reported.
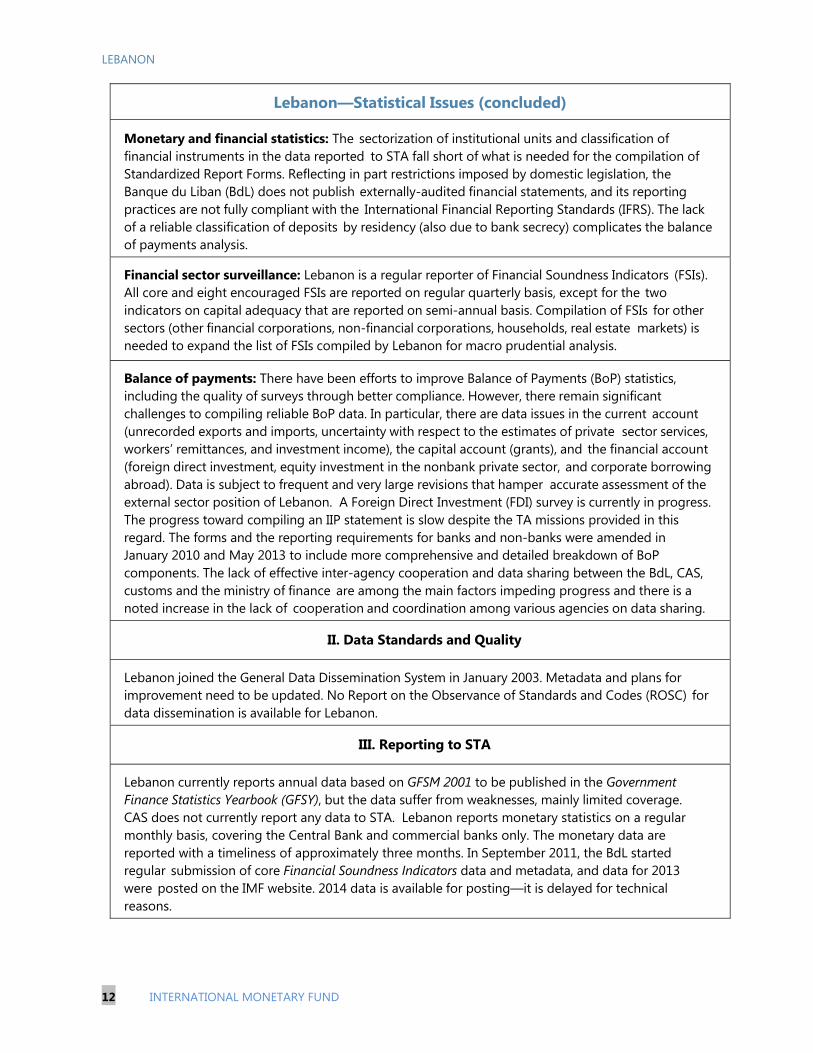
LEBANON
12 INTERNATIONAL MONETARY FUND
Lebanon—Statistical Issues (concluded)
Monetary and financial statistics: The sectorization of institutional units and classification of financial instruments in the data reported to STA fall short of what is needed for the compilation of Standardized Report Forms. Reflecting in part restrictions imposed by domestic legislation, the Banque du Liban (BdL) does not publish externally-audited financial statements, and its reporting practices are not fully compliant with the International Financial Reporting Standards (IFRS). The lack of a reliable classification of deposits by residency (also due to bank secrecy) complicates the balance of payments analysis.
Financial sector surveillance: Lebanon is a regular reporter of Financial Soundness Indicators (FSIs). All core and eight encouraged FSIs are reported on regular quarterly basis, except for the two indicators on capital adequacy that are reported on semi-annual basis. Compilation of FSIs for other sectors (other financial corporations, non-financial corporations, households, real estate markets) is needed to expand the list of FSIs compiled by Lebanon for macro prudential analysis.
Balance of payments: There have been efforts to improve Balance of Payments (BoP) statistics, including the quality of surveys through better compliance. However, there remain significant challenges to compiling reliable BoP data. In particular, there are data issues in the current account (unrecorded exports and imports, uncertainty with respect to the estimates of private sector services, workers’ remittances, and investment income), the capital account (grants), and the financial account (foreign direct investment, equity investment in the nonbank private sector, and corporate borrowing abroad). Data is subject to frequent and very large revisions that hamper accurate assessment of the external sector position of Lebanon. A Foreign Direct Investment (FDI) survey is currently in progress. The progress toward compiling an IIP statement is slow despite the TA missions provided in this regard. The forms and the reporting requirements for banks and non-banks were amended in January 2010 and May 2013 to include more comprehensive and detailed breakdown of BoP components. The lack of effective inter-agency cooperation and data sharing between the BdL, CAS, customs and the ministry of finance are among the main factors impeding progress and there is a noted increase in the lack of cooperation and coordination among various agencies on data sharing.
II. Data Standards and Quality
Lebanon joined the General Data Dissemination System in January 2003. Metadata and plans for improvement need to be updated. No Report on the Observance of Standards and Codes (ROSC) for data dissemination is available for Lebanon.
III. Reporting to STA
Lebanon currently reports annual data based on GFSM 2001 to be published in the Government Finance Statistics Yearbook (GFSY), but the data suffer from weaknesses, mainly limited coverage. CAS does not currently report any data to STA. Lebanon reports monetary statistics on a regular monthly basis, covering the Central Bank and commercial banks only. The monetary data are reported with a timeliness of approximately three months. In September 2011, the BdL started regular submission of core Financial Soundness Indicators data and metadata, and data for 2013 were posted on the IMF website. 2014 data is available for posting—it is delayed for technical reasons.
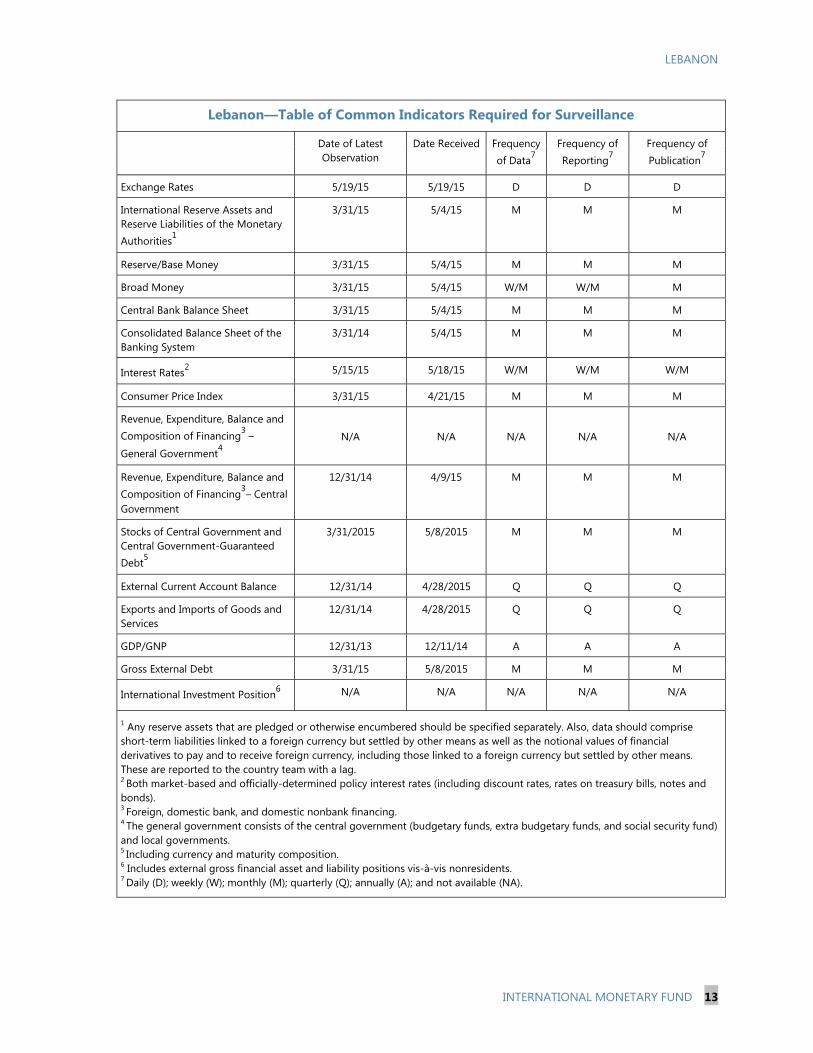
LEBANON
INTERNATIONAL MONETARY FUND 13
Lebanon—Table of Common Indicators Required for Surveillance
Date of Latest Observation
Date Received Frequency of Data7
Frequency of Reporting7
Frequency of Publication7
Exchange Rates 5/19/15 5/19/15 D D D
International Reserve Assets and Reserve Liabilities of the Monetary Authorities1
3/31/15 5/4/15 M M M
Reserve/Base Money 3/31/15 5/4/15 M M M
Broad Money 3/31/15 5/4/15 W/M W/M M
Central Bank Balance Sheet 3/31/15 5/4/15 M M M
Consolidated Balance Sheet of the Banking System
3/31/14 5/4/15 M M M
Interest Rates2 5/15/15 5/18/15 W/M W/M W/M
Consumer Price Index 3/31/15 4/21/15 M M M
Revenue, Expenditure, Balance and Composition of Financing3 –
General Government4
N/A N/A N/A N/A N/A
Revenue, Expenditure, Balance and Composition of Financing3– Central Government
12/31/14 4/9/15 M M M
Stocks of Central Government and Central Government-Guaranteed Debt5
3/31/2015 5/8/2015 M M M
External Current Account Balance 12/31/14 4/28/2015 Q Q Q
Exports and Imports of Goods and Services
12/31/14 4/28/2015 Q Q Q
GDP/GNP 12/31/13 12/11/14 A A A
Gross External Debt 3/31/15 5/8/2015 M M M
International Investment Position6 N/A N/A N/A N/A N/A
1 Any reserve assets that are pledged or otherwise encumbered should be specified separately. Also, data should comprise short-term liabilities linked to a foreign currency but settled by other means as well as the notional values of financial derivatives to pay and to receive foreign currency, including those linked to a foreign currency but settled by other means. These are reported to the country team with a lag. 2 Both market-based and officially-determined policy interest rates (including discount rates, rates on treasury bills, notes and bonds). 3 Foreign, domestic bank, and domestic nonbank financing. 4 The general government consists of the central government (budgetary funds, extra budgetary funds, and social security fund) and local governments. 5 Including currency and maturity composition. 6 Includes external gross financial asset and liability positions vis-à-vis nonresidents. 7 Daily (D); weekly (W); monthly (M); quarterly (Q); annually (A); and not available (NA).
Statement by Hazem Beblawi, Executive Director for Lebanon and Maya Choueiri, Senior Advisor to Executive Director
June 26, 2015
1. Lebanon is facing exceptional, force majeure, circumstances that are beyond its control. The main challenge facing the country is the political and security impact of the Syrian crisis, now entering its fifth year, and their ensuing economic and social consequences. Since the onset of the crisis in early 2011, over one million registered Syrians, about a quarter of the Lebanese population, have taken refuge in Lebanon. With this inflow, Lebanon has become the country with the highest per capita concentration of refugees worldwide.1 This has put serious pressures on virtually all aspects of the economy, straining public finances, service delivery and the environment in particular. The crisis has also resulted in increased poverty among the Lebanese, as well as higher unemployment. Notwithstanding this difficult environment, the economy continued to be resilient and growth is expected to hold up in 2015. Moreover, deposit inflows remain strong, foreign exchange reserves at a comfortable level, and the banking system robust. This attests to the authorities’ capacity to maintain confidence, particularly the confidence of non-resident depositors, which is the core strength of Lebanon’s financial system, despite the difficult environment. Going forward, the authorities will continue to be faced with the challenge of coping with the adverse implications of the Syrian crisis while preserving macroeconomic and financial stability.
2. International humanitarian support was extremely helpful in mitigating the impact of the refugee crisis. However, it remains insufficient given the size of the problem, particularly for local communities and the economy at large, as clearly outlined in Box 1 of the staff report. Lebanon does not have the fiscal space to address the impact of the Syrian refugee crisis alone; dealing with it requires strong international support.
Risks to the Outlook
3. Assessing Lebanon’s economic developments and policies cannot abstract from developments in the region, particularly the crisis in Syria, as these have major implications for security in the country, and thereby for macroeconomic stability. The authorities feel that this aspect could have been better recognized in the report. They also consider that the challenges associated with the Syrian crisis, while documented in the report, could have been better embedded in the economic analysis and the policy recommendations. This includes in particular the fiscal cost associated with the refugee crisis and the challenges associated with launching structural reforms. The domestic political crisis is largely a reflection of the
1 “The number of Syrian refugees in Lebanon passes the 1 million mark”, UNHCR, The UN Refugee Agency, April 3, 2014, http://www.unhcr.org/533c1d5b9.html.
2
regional difficulties and cautious decision-making, particularly on divisive social issues, is needed to preserve the country's stability and domestic cohesion at this juncture.
Fiscal Policy and Reforms 4. Despite the fiscal burden of the refugees, a primary surplus of 2.5 percent of GDP was achieved in 2014, which included larger than usual telecommunications transfers. The authorities are committed to fiscal discipline and agree with staff that passing a budget for 2015 would be an important signal of this commitment. They put forward a draft 2015 budget in April which aims at balancing essential spending needs with stability goals. They adopted measures aimed at supporting revenue earlier this year. These included an increase in gasoline excises in January 2015 and efforts by the Ministry of Finance to tighten tax collections, particularly through better enforcement and oversight of VAT refund claims.
5. The draft budget is still debated, reflecting diverging views on the public sector salary scale adjustment. The authorities are confident that the revenue measures they envisaged would be sufficient to offset the cost of the salary scale adjustment. These measures, in line with staff recommendations, include (i) an increase in the tax rate on interest income from 5 to 7 percent; (ii) an increase in the corporate income tax rate from 15 to 17 percent; (iii) a capital gains tax on real estate transactions; and (iv) new stamp duties and fees. The authorities welcomed the focus in the staff’s adjustment scenario on growth and fairness aspects.
6. The fiscal impact of the Syrian crisis is extensive. The negative impact on investor and consumer confidence and the disruption in the trade routes for exports and imports of goods, tourism, and financial services are placing downward pressure on government revenues. Combined with rising demand for public services due to the large refugee influx, this is further damaging Lebanon’s public finances. The staff report mentions rising healthcare, education, electricity, and security costs, as well as the deterioration in the quality of public services. An Economic and Social Impact Assessment led by the World Bank2 estimated the direct fiscal impact of the crisis over 2012–14 at US$2.6 billion (5½ percent of GDP). It also suggested that restoring public-service provision to pre-crisis levels would require an additional US$2.5 billion.
7. The authorities concur with staff that there is scope to increase taxation in a fair manner. They appreciated that in the context of a proposed adjustment scenario, staff was no longer recommending a VAT rate increase up to 15 percent, which they had viewed as regressive and difficult to implement. They had suggested at the time of last year’s Article IV consultation enhancing tax capacity by broadening tax bases, addressing tax loopholes, and
2 World Bank, Poverty Reduction and Economic Management Department, Middle East and North Africa Region, “Lebanon, Economic and Social Impact Assessment”, September 2013.
3
strengthening compliance, as these measures would help spread the burden of adjustment. They appreciate the Fund’s ongoing technical assistance in these areas.
Monetary and Exchange Rate Policies
8. Monetary policy helped maintain confidence in the Lebanese financial system, with the exchange rate peg providing a firm anchor for financial stability. The authorities continue to maintain a high level of reserves, given the central role of the peg.
9. The challenging environment has limited credit opportunities to the private sector. In order to help address the problem, the Banque du Liban (BdL) has played a role by introducing targeted subsidized schemes to support lending in key sectors. These schemes have supported growth without resulting in a build-up of risks or a credit boom. Moreover, the authorities have recently tightened macroprudential rules, namely the debt service to income and loan-to-value-ratios, to avoid any potential leverage in the private sector. They remained confident that the balance sheet of the BdL would be strengthened over time, though conditions were not yet favorable for pursuing alternative policy actions in the short term.
Banking Sector
10. The banking sector remains resilient despite the challenging environment which has limited credit opportunities to the private sector and the banks’ expansion in neighboring countries. The BdL has strived to implement the Basel requirements ahead of the implementation deadlines and to require additional capital buffers on top of the Basel III minimum and conservation buffers. The authorities also emphasized that total provisioning, including both specific and general provisions, had increased as a share of total nonperforming loans, as outlined in paragraph 37 of the staff report. The authorities expressed confidence in the effectiveness of Lebanon’s AML/CFT regime, which is in practice fully compliant with international standards. Three draft laws await parliamentary approval and in the interim, the BdL requires that Lebanese banks abide by the regulations in place in the countries of their correspondent banks whenever these are stricter. Lebanon’s financial intelligence unit, the Special Investigation Commission, actively cooperates with its foreign counterparts.
Structural Reforms
11. Despite the difficulty to undertake structural reforms given the political deadlock, electricity sector reform continued to rank high on the authorities’ agenda in view of the large budgetary transfers to the sector. In the past two years, progress was made under the authorities’ 2011 comprehensive strategy, with the construction of a new power plant and the rehabilitation of existing ones. Moreover, three private distribution service providers started operations, and two power barges were rented to supplement power production while power plants are being built. However, demand from refugees is estimated to absorb the electricity
4
supplied by the barges, setting back expected supply improvements. Moreover, the Ministry of Finance has started the publication of a quarterly T-bill issuance calendar regularizing long-term issuances, as well as of an updated public debt strategy. The authorities also embarked on anti-corruption campaigns in the health sector and at customs.