older population and health system: a profile of lebanon · 1 older population and health system: a...
TRANSCRIPT

1
Older Population and Health System: A profile of Lebanon
I. Introduction to Lebanon Lebanon is a middle income country with a population estimated at 4 million over 80% of whom live in urban areas (Central Administration of Census, 1997). Before the civil war, the Lebanese economy was robust, enterprise flourished, and it was the banking center of the Middle East. The civil war, which began in 1975, led to the relocation of many service sectors out of the country, much of the industrial and agricultural infrastructure was destroyed, the economy went into decline (E.I.U. Country Profile, 1992-93). Increased spending on security forces and the reduction in government revenues from taxes and other duties led to a steep increase in public debt. The purpose of this paper is to describe the health care system of Lebanon, analyze its components, highlighting issues that may require attention and that may need to be addressed. This paper has drawn from many studies that have been published or produced in the past few years. Annotation and recognition of the authors have been indicated all through II. Demographic Trends
1. Mortality and Fertility rates
The last population census was carried out in 1932. Recently two major surveys were conducted-- the PAPCHILD survey of 1996 covering 6,000 households and the UNFPA Population and Housing survey of 75,000 households. The latest estimates place the population at four million (Central Administration of Statistics, 1997). Of these, 93% are Lebanese citizens. Twenty-eight percent of the population is under the age of 15 and 10% over age 60. Population has been growing at 1.6 percent per year and Total Fertility Rate is 2.7. Tables below shows that with regard to key health and demographic indicators, Lebanon fares better than most other Middle Eastern countries.
Outcome indicators in selected Middle Eastern countries (1997-98)
Category Egypt Syria Jordan Lebanon 1998 Birth Rate, crude (per 1,000 people)
25 29 31 23.5
Death Rate, crude (per 1,000 people)
7 5 4 6.5
Life expectancy at birth, total (years)
66 69 71 70
Mortality rate, infant (per 1,000 live births)
51 31 29 28
Mortality rate, under-5 (per 1,000 live births)
66 38 35 32
However, there are still significant variations across the geographical regions of the country. A study conducted by UNICEF showed that even though infant and under-five mortality was low for the country as a whole, differences existed among regions. The Bekaa and Northern regions account for most of the under-five mortality. Similarly, in undeserved regions vaccination coverage tends to be lower. The Ministry of Health has initiated targeted campaigns to reduce these disparities. Table below provides some selected demographic and health indicators. It shows steady increases in life expectancy and a steady decline in morality rates. The demographic transition has been accompanied by an

2
2
epidemiological transition. While important health problems are still related to infectious diseases, chronic and degenerative diseases are becoming more prevalent. The causes for this are the aging of the population, changing dietary habits, and changes in lifestyle concomitant with urbanization. Prevalence rates for hypertension and diabetes are on the rise in Lebanon. In addition there are 4,000 – 5,000 new cases of cancer each year. Concerning AIDS, there were 3.1 cases per 100,000 people in 1997.
Selected Outcome Indicators for Lebanon
Series 1980 1990 1993 1994 1995 1996 1997 1999 Life expectancy at birth, female (years)
67 70 - - - - 72 73.9
Life expectancy at birth, male (years)
63 66 - - - - 68 71.7
Life expectancy at birth, total (years)
35 68 - - - - 70 73
Mortality rate, adult, female (per 1,000 female adults)
181 150 - - - - 134
Mortality rate, adult, male (per 1,000 male adults)
241 210 - - - - 177
Mortality rate, infant (per 1,000 live births)
48 36 - - - - 28 26
Mortality rate, under-5(per 1,000 live births)
- 40 - - - - 32
Mortality ratio, maternal(per 100,000 live births)
- 300 - - - - 104
2. Population Structure
a) The Population Pyramid
Source: Household survey 2000
Beirut Beirut suburbs
Rest of Mt Lebanon
North South Nabatieh Beqaa Lebanon
0-4 5.2 7.4 6.4 9.8 8.7 9.8 9 8 5-9 8.6 9.3 7.6 11.7 11.3 11.9 10.2 10 10-14 8.5 9.1 8.1 11.2 11.4 11.4 11.3 10 0-14 22.3 25.8 22.1 32.7 31.4 33.1 30.5 28 15-19 9.1 10.5 8.6 11.4 11.6 10.2 12.1 10.6 20-24 9.8 9.3 9.1 10 9 8.3 10.7 9.5 25-29 8.3 10 9.4 8.1 8.5 7.8 8.7 8.9 30-34 6.8 8.9 8.2 6.7 7.4 7.3 7 7.6 35-39 6.8 7.5 8.9 6.2 7.5 7.4 6.1 7.2
40-44 6.4 6.1 6.4 5 5.7 5.1 5.2 5.7 15-44 47.2 52.3 50.6 47.4 49.7 46.1 49.8 49.5 45-49 5.3 4.7 5.1 4 3.6 3.8 4.3 4.4 50-54 5.2 4.2 4.6 3.5 3.9 3.1 3.7 4 55-59 5 3.3 3.9 3 3.2 2.8 2.8 3.4 60-64 5.1 3.1 3.7 2.7 2.6 3.6 3.1 3.3 45-64 20.6 15.3 17.3 13.2 13.3 13.3 13.9 15.1 65-69 3.4 2.7 3.3 2.5 2.1 2.9 2.2 2.7 > 70 6.2 3.8 6.4 4.2 3.4 4.5 3.7 4.5 > 65 9.6 6.5 9.7 6.7 5.5 7.4 5.9 7.2 Unknown 0.1 0.1 0.2 0.1 0.1 Totals 99.7 99.9 99.7 100 99.9 99.9 100.1 99.8 Number individuals
3494 6350 4581 6420 3844 3592 4367 32648
3
3
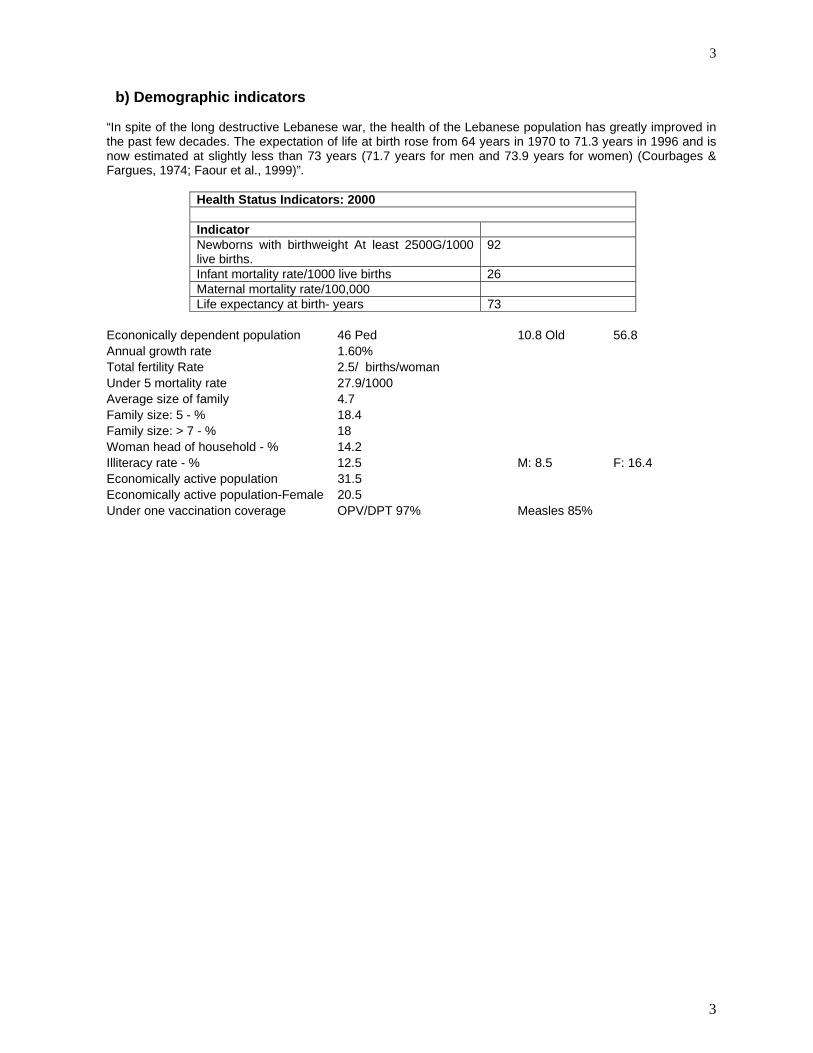
b) Demographic indicators “In spite of the long destructive Lebanese war, the health of the Lebanese population has greatly improved in the past few decades. The expectation of life at birth rose from 64 years in 1970 to 71.3 years in 1996 and is now estimated at slightly less than 73 years (71.7 years for men and 73.9 years for women) (Courbages & Fargues, 1974; Faour et al., 1999)”.
Health Status Indicators: 2000 Indicator Newborns with birthweight At least 2500G/1000 live births.
92
Infant mortality rate/1000 live births 26 Maternal mortality rate/100,000 Life expectancy at birth- years 73
Econonically dependent population 46 Ped 10.8 Old 56.8 Annual growth rate 1.60% Total fertility Rate 2.5/ births/woman Under 5 mortality rate 27.9/1000 Average size of family 4.7 Family size: 5 - % 18.4 Family size: > 7 - % 18 Woman head of household - % 14.2 Illiteracy rate - % 12.5 M: 8.5 F: 16.4 Economically active population 31.5 Economically active population-Female 20.5 Under one vaccination coverage OPV/DPT 97% Measles 85%

4
4
III. 50+ Population: General Assessments A major study, commissioned by the Ministry of Social Affairs, and undertaken by Dr Abla Sibai in September 1998, reviewed the published and unpublished reports concerning the older population. Further analysis was also undertaken of the Population and Housing Survey conducted by the Ministry in 1996. The sample survey of this study was a national probability sample covering the entire regions of Lebanon and consisted of some 70,000 households (10% of the estimated population). The current study abstracted the records of all individuals above the age of 60 years at the time of the survey. The following tables summarize the main findings, about this important section of the Lebanese population. It is worth noting that the very old (80 years and above) account for 10.6% of the old population among males and 12.1% among women. This is in accord with the literature whereby women are expected to live longer than men. The subgroup 60-64 years old Men in that age group were in their majority married (91.3%). More than two thirds were still working (68.3%): only 11.6% had retired. Almost half had completed only primary education, while 6% had finished university studies. Almost half were employees. More than 4/5th live in an apartment., that 70% of them actually own. Unlike men, less than 2/3rd of the women were still married in that age group: 28% had become widows. Almost 60% were illiterate and a little more than 1% had completed university. 90% of women were housewives at home. When employed, three quarters of women tended to be employees. Like men, most women lived in apartments that most of them actually owned. The subgroup 65-74 years old Men were still in their majority married. However only 43% were still working, while 20% had retired. When working, two thirds were self employed. Again most of men lived in apartments that thye entirely owned. Less than half of women were still married by the age of 75 years. 60% had become widows. The older age groups Even above 80 years, two thirds of men were still married, as compared to only 17% of women. Only 20% were still working, mainly in their own business.
5
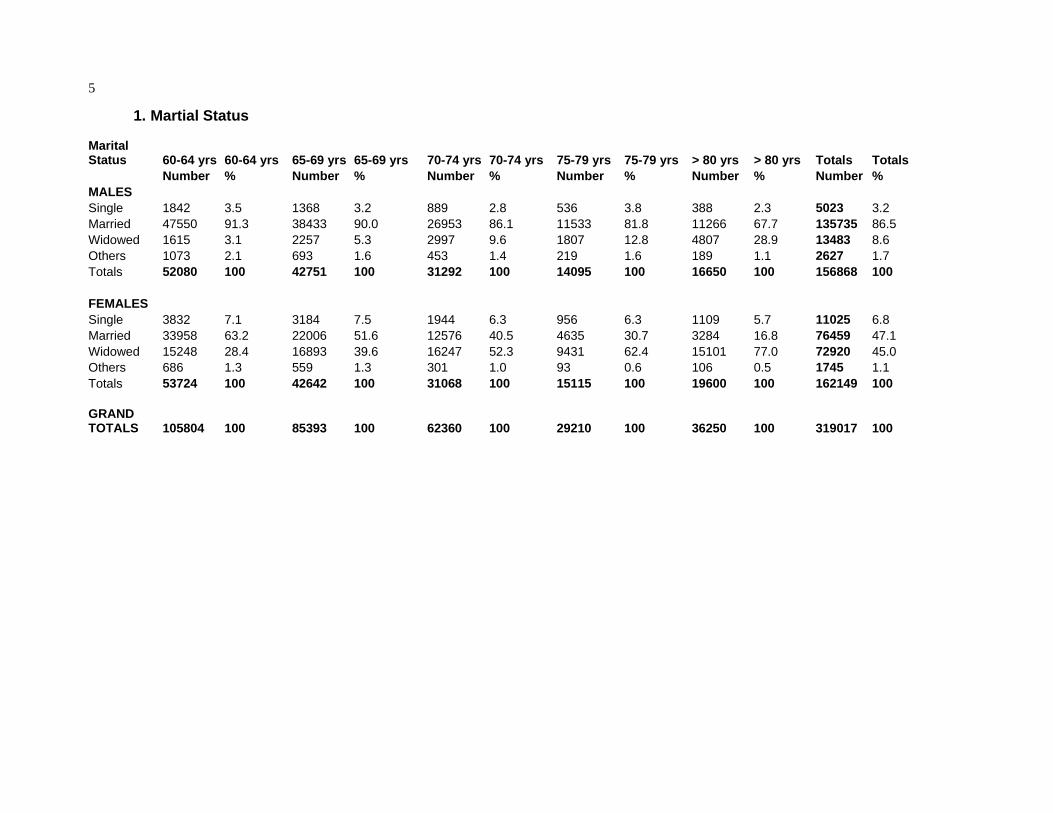
1. Martial Status
Marital Status 60-64 yrs 60-64 yrs 65-69 yrs 65-69 yrs 70-74 yrs 70-74 yrs 75-79 yrs 75-79 yrs > 80 yrs > 80 yrs Totals Totals Number % Number % Number % Number % Number % Number % MALES Single 1842 3.5 1368 3.2 889 2.8 536 3.8 388 2.3 5023 3.2 Married 47550 91.3 38433 90.0 26953 86.1 11533 81.8 11266 67.7 135735 86.5 Widowed 1615 3.1 2257 5.3 2997 9.6 1807 12.8 4807 28.9 13483 8.6 Others 1073 2.1 693 1.6 453 1.4 219 1.6 189 1.1 2627 1.7 Totals 52080 100 42751 100 31292 100 14095 100 16650 100 156868 100 FEMALES Single 3832 7.1 3184 7.5 1944 6.3 956 6.3 1109 5.7 11025 6.8 Married 33958 63.2 22006 51.6 12576 40.5 4635 30.7 3284 16.8 76459 47.1 Widowed 15248 28.4 16893 39.6 16247 52.3 9431 62.4 15101 77.0 72920 45.0 Others 686 1.3 559 1.3 301 1.0 93 0.6 106 0.5 1745 1.1 Totals 53724 100 42642 100 31068 100 15115 100 19600 100 162149 100 GRAND TOTALS 105804 100 85393 100 62360 100 29210 100 36250 100 319017 100

6
6
2. Working Status
Working status 60-64 60-64 65-74 65-74 > 75 yrs > 75 yrs Totals Totals Number % Number % Number % Number % MALES Working status 35567 68.3 32154 43.4 5952 19.4 73673 46.9 Home Based worker 293 0.6 346 0.5 160 0.5 799 0.5 Self-sufficient 3921 7.5 10500 14.2 7023 22.8 21444 13.7 Unemployed 1652 3.2 2791 3.8 906 2.9 5349 3.4 Retired 6037 11.6 15424 20.8 6603 21.5 28064 17.9 Others 4632 8.9 12848 17.3 10110 32.9 27590 17.6 Totals 52102 100 74063 100 30754 100 156919 100 FEMALES Working status 3603 6.7 2036 2.8 327 0.9 5966 3.7 Home Based worker 512 1.0 558 0.8 77 0.2 1147 0.7 Self-sufficient 566 1.1 1526 2.1 942 2.7 3034 1.9 Unemployed 85 0.2 85 0.1 58 0.2 228 0.1 Retired 298 0.6 591 0.8 311 0.9 1200 0.7 Housewife 48373 90.0 68087 92.3 31452 90.5 147912 91.2 Others 319 0.6 847 1.1 1570 4.5 2736 1.7 Totals 53756 100 73730 100 34737 100 162223 100 GRAND TOTALS 105858 100 147793 100 65491 100 319142 100
Employment status 60-64 60-64 65-74 65-74 > 75 yrs > 75 yrs Totals Totals Number % Number % Number % Number % MALES Self-employed 19174 52.1 22551 64.0 5153 73.6 46878 59.3 Employee 17613 47.9 12668 36.0 1845 26.4 32126 40.7 Totals 36787 100 35219 100 6998 100 79004 100 FEMALES Self-employed 1106 26.4 952 35.6 218 47.1 2276 31.1 Employee 3082 73.6 1725 64.4 245 52.9 5052 68.9 Totals 4188 100 2677 100 463 100 7328 100 GRAND TOTALS 40975 100 37896 100 7461 100 86332 100

7
7
After the pediatric age group (above 15 years), between 3-4.5 % of the older population was unemployed even at their advancing age. The overall unemployment was 9.4% for the population between 15-64 years. In the older brackets, only men were employed in the labor market.
Unemployment by age and sex - Per cent Source: Household survey 2000 Males Females Totals 15-19 31.5 41.7 33.5 20-24 19.4 19.3 19.3 25-29 8 13 9.6 30-34 5.4 9 6.4 35-39 3.3 9.5 5 40-44 3.4 5.4 3.9 45-49 3.4 2.1 3.1 50-54 4.5 1.7 4.1 55-59 5.1 1.3 4.5 60-64 4.5 4 65-69 3.9 3.5 > 70 3.3 3 15-64 years 8.6 11.6 9.4 Number individuals 7789 2717 10506

8
8
3. Educational levels by age group
Educational level 60-74 years 60-74 years Above 75 yrsAbove 75 yrs Total Total
Number % Number % Number % MALES Illiterate 36879 29.2 12471 40.5 49350 31.4 Informal/Primary 63015 49.9 13619 44.3 76634 48.8 Intermediate/Secondary 18681 14.8 3273 10.6 21954 14.0 University/Higher Studies 7591 6.0 1392 4.5 8983 5.7 Totals 126166 100 30755 100 156921 100 FEMALES Illiterate 72080 56.5 24657 71.0 96737 59.6 Informal/Primary 39276 30.8 7733 22.3 47009 29.0 Intermediate/Secondary 14531 11.4 2134 6.1 16665 10.3 University/Higher Studies 1598 1.3 213 0.6 1811 1.1 Totals 127485 100 34737 100 162222 100 GRAND TOTALS 253651 100 65492 100 319143 100

9
9
4. Housing and living arrangements
Type of residence 60-74 60-74 > 75 yrs > 75 yrs Totals Totals Number % Number % Number % MALES Independent residence 27185 21.5 8594 27.9 35779 22.8 Apartment in a building 98763 78.3 22130 72.0 120893 77.0 Shack 124 0.1 20 0.1 144 0.09 Others 93 0.1 10 0.03 103 0.07 Totals 126165 100 30754 100 156919 100 FEMALES Independent residence 27024 21.2 9617 27.7 36641 22.6 Apartment in a building 100193 78.5 25059 72.1 125252 77.2 Shack 144 0.1 61 0.2 205 0.1 Others 215 0.2 0 0 215 0.1 Totals 127576 100 34737 100 162313 100 GRAND TOTALS 253741 100 65491 100 319232 100
Ownership of residence 60-74 60-74 > 75 yrs > 75 yrs Totals Totals Number % Number % Number % MALES Entirely owned 87897 69.7 22481 73.1 110378 70.3 Partially owned 2205 1.7 668 2.2 2873 1.8 Rented 28779 22.8 5942 19.3 34721 22.1 Others 7285 5.8 1664 5.4 8949 5.7 Totals 126166 100 30755 100 156921 100 FEMALES Entirely owned 84427 66.2 23780 68.5 108207 66.7 Partially owned 3272 2.6 1220 3.5 4492 2.8 Rented 31692 24.9 7017 20.2 38709 23.9 Others 8095 6.3 2720 7.8 10815 6.7 Totals 127486 100 34737 100 162223 100 GRAND TOTALS 253652 100 65492 100 319144 100

10
IV. 50+ Population Health Indicators 1. Health Wellness and illness In the National household health survey, the percent of the older population in the representative sample of the entire Lebanese population was 10.5% for the population above 60 years of age. This survey was conducted in 1998 and released in December 2000. The proportion of the tranche above 65 years was 7.2%. Almost one third of the above 60 years old perceived their health status to be poor, as compared to 6.7% for the entire population. It should be cautioned however that the unknown responses in that age group was higher than 40.8%! Perception of health wellness Source: Household survey 2000 Poor Average Good Very Good Excellent Unknown Sample < 5 years 1.8 5.6 30.8 32.9 28.7 0.3 2635 5-14 1.8 6.2 30.5 33.4 27.8 0.3 6535 15-59 4.5 16.7 36.1 25.4 14.6 2.6 19959 > 60 32.5 38.7 21.6 4.2 1.6 1.5 3501 Not determined 11 22.8 25.4 40.8 18 Overall 6.7 16 33 25.4 17 1.9 32648 When asked whether they have suffered from an illness or injury, in the past month, close to two thirds of the older population responded that they were fine and healthy (as compared to 73% of the general public). This rate did not increase appreciably between the age of 60 and 70 years.
Suffered illness or injury in past month Source: Household survey 2000 Males Females Totals Sample Has had Has had Has had Anterior Unknown illness accident both illness 0-4 41.6 38.1 39.9 2635 39 0.8 0 0 0.2 5-9 29.5 31.1 30.3 3268 10-14 22.1 23.5 22.8 3267 25.2 1.1 0.1 0.2 0.2 15-19 19.5 23.9 21.7 3413 20-24 20.9 25.6 23.2 3108 25-29 22.3 28 25.2 2872 30-34 24.1 31.4 28.1 2466 35-39 27.3 31.7 29.7 2352 40-44 27.8 36 32.3 1861 45-49 27.9 38.3 33.5 1445 50-54 29.5 44.4 37.3 1320 55-59 31.5 44.3 37.9 1122 26.4 1.1 0.2 0.3 2.6 60-64 35.1 46.9 41.2 1104 65-69 36.2 48.9 42.7 897 70 above 41.1 47.9 44.4 1500 41.2 1.1 0.2 0.5 1.4 Unknown 16.6 11 18 Total 27.4 32.9 30.2 32648 28.7 1.1 0.1 0.2 1.8
11
11
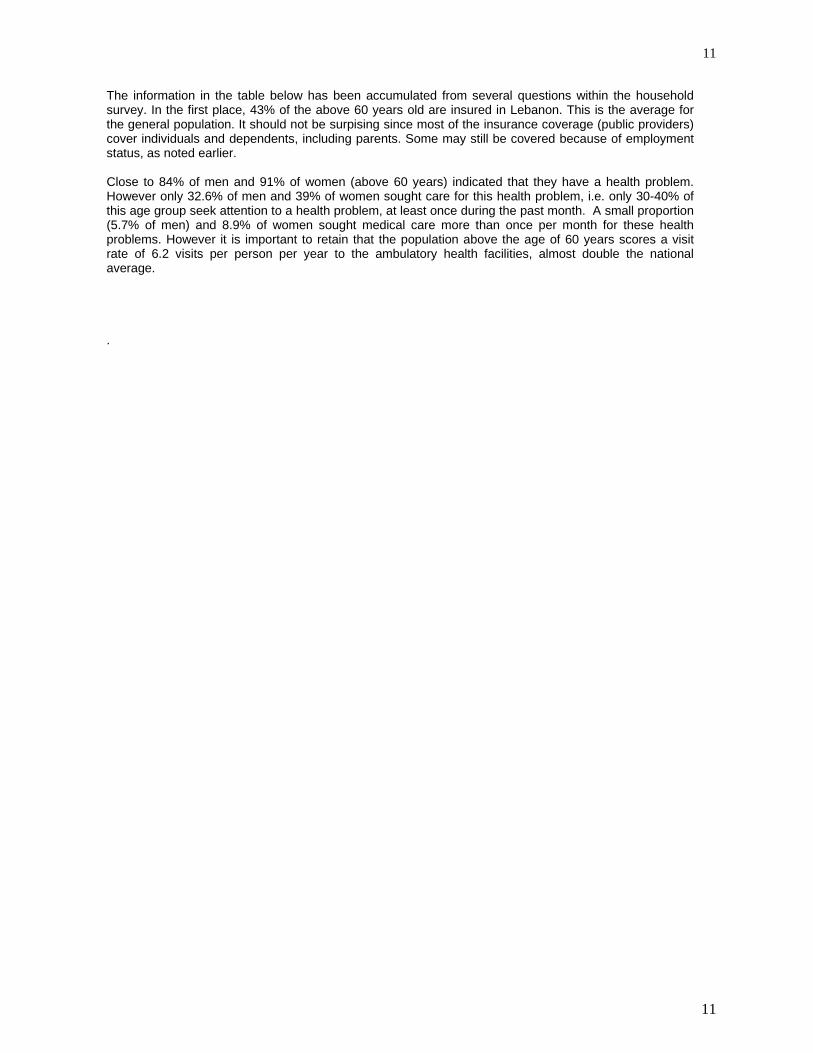
The information in the table below has been accumulated from several questions within the household survey. In the first place, 43% of the above 60 years old are insured in Lebanon. This is the average for the general population. It should not be surpising since most of the insurance coverage (public providers) cover individuals and dependents, including parents. Some may still be covered because of employment status, as noted earlier. Close to 84% of men and 91% of women (above 60 years) indicated that they have a health problem. However only 32.6% of men and 39% of women sought care for this health problem, i.e. only 30-40% of this age group seek attention to a health problem, at least once during the past month. A small proportion (5.7% of men) and 8.9% of women sought medical care more than once per month for these health problems. However it is important to retain that the population above the age of 60 years scores a visit rate of 6.2 visits per person per year to the ambulatory health facilities, almost double the national average. .
12
Ambulatory visits Per month
Insured Has health Received Received
Has health Received Received
Has health Received ReceivedAverage Males Females
Both sexes
Both sexes problem care x 1 care > 1 problem care > 1 care > 1 problem care x 1 care > 1 No of
Males Males Males Females Females FemalesBoth sexes
Both sexes
Both sexes
visits/year
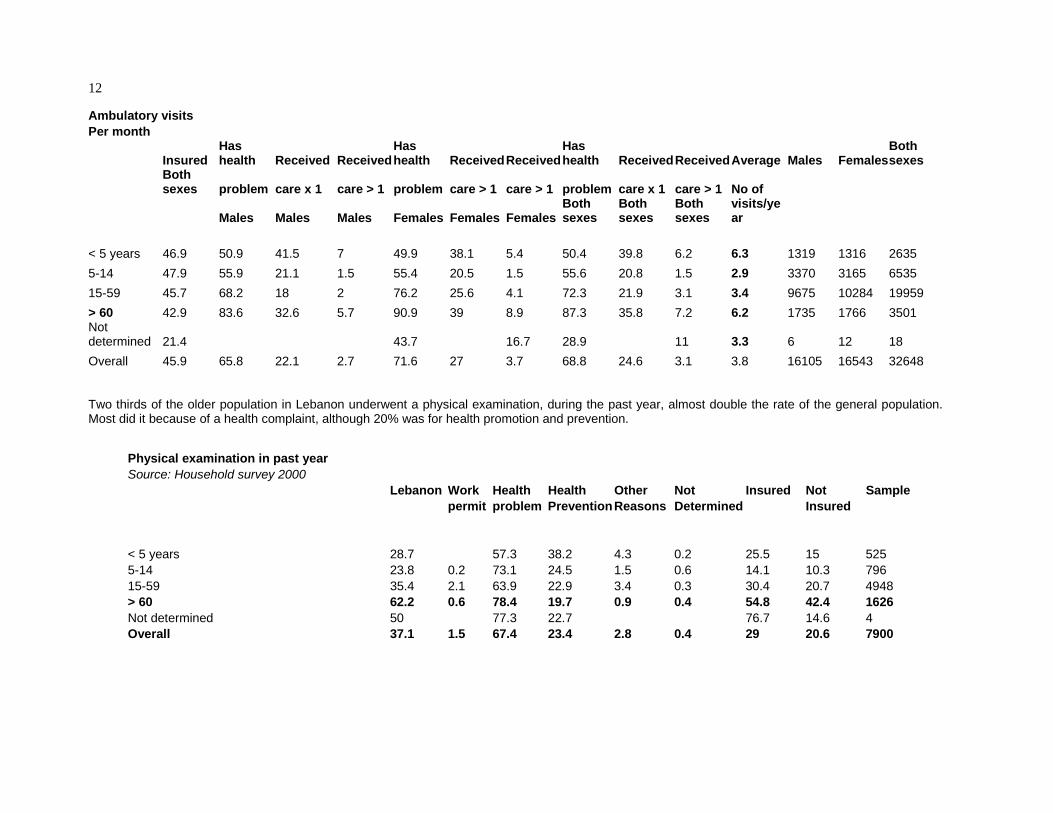
< 5 years 46.9 50.9 41.5 7 49.9 38.1 5.4 50.4 39.8 6.2 6.3 1319 1316 2635 5-14 47.9 55.9 21.1 1.5 55.4 20.5 1.5 55.6 20.8 1.5 2.9 3370 3165 6535 15-59 45.7 68.2 18 2 76.2 25.6 4.1 72.3 21.9 3.1 3.4 9675 10284 19959 > 60 42.9 83.6 32.6 5.7 90.9 39 8.9 87.3 35.8 7.2 6.2 1735 1766 3501 Not determined 21.4 43.7 16.7 28.9 11 3.3 6 12 18 Overall 45.9 65.8 22.1 2.7 71.6 27 3.7 68.8 24.6 3.1 3.8 16105 16543 32648 Two thirds of the older population in Lebanon underwent a physical examination, during the past year, almost double the rate of the general population. Most did it because of a health complaint, although 20% was for health promotion and prevention.
Physical examination in past year Source: Household survey 2000 Lebanon Work Health Health Other Not Insured Not Sample permit problem Prevention Reasons Determined Insured < 5 years 28.7 57.3 38.2 4.3 0.2 25.5 15 525 5-14 23.8 0.2 73.1 24.5 1.5 0.6 14.1 10.3 796 15-59 35.4 2.1 63.9 22.9 3.4 0.3 30.4 20.7 4948 > 60 62.2 0.6 78.4 19.7 0.9 0.4 54.8 42.4 1626 Not determined 50 77.3 22.7 76.7 14.6 4 Overall 37.1 1.5 67.4 23.4 2.8 0.4 29 20.6 7900

13
2. Chronic illnesses This poor perception of wellness was confirmed when close to 75% of men of this age bracket (above 60 years) declared at least one chronic illness (men) and 84.2% of women. Chronic illnesses Source: Household survey 2000
Declared at Declared at Declared atSample size
Sample size Sample size
least 1 dis least 1 dis least 1 dis Males Females Both sexes Males Females Both sexes < 5 years 10.4 8 9.2 1319 1316 2635 5-14 14.8 12.8 13.8 3370 3165 6535 15-59 29.1 38.3 33.8 9675 10284 19959 > 60 73.4 84.2 78.9 1735 1766 3501 Not determined 16.6 11 6 12 18 Overall 29.3 35.8 32.6 16105 16543 32648 3. Risk factors for non-communicabe diseases The National health household survey attempted to seek information on lifestyles. Smoking was used as one indicator. It was found that 26% of the Lebanese population above the age of 15 years did smoke. The population above the age of 60 years tended to be on the higher side of smokers: 30% between the ages of 60-70 years and 16% at a more advanced age.
Smoking Source: Household survey 2000 Smoker Smoker Smoker Sample
Males Females Both sexes
15-19 6.3 1.8 4.1 3413 20-24 20.1 6.3 13.4 3108 25-29 32.9 11.7 22.2 2871 30-34 43.5 22.8 32.2 2466 35-39 48.2 29.6 38.2 2352 40-44 51 32.4 41 1861 45-49 57 34.3 44.8 1445 50-54 46.8 31.9 39 1320 55-59 50.3 25.6 37.9 1122 60-64 42.4 19.2 30.4 1104 65-69 38.3 18.8 28.4 897 70 above 21.7 10.2 16 1500 Unknown 18 Total 33.7 18.3 25.8 Sample 11415 12062 23477 23477
14
14
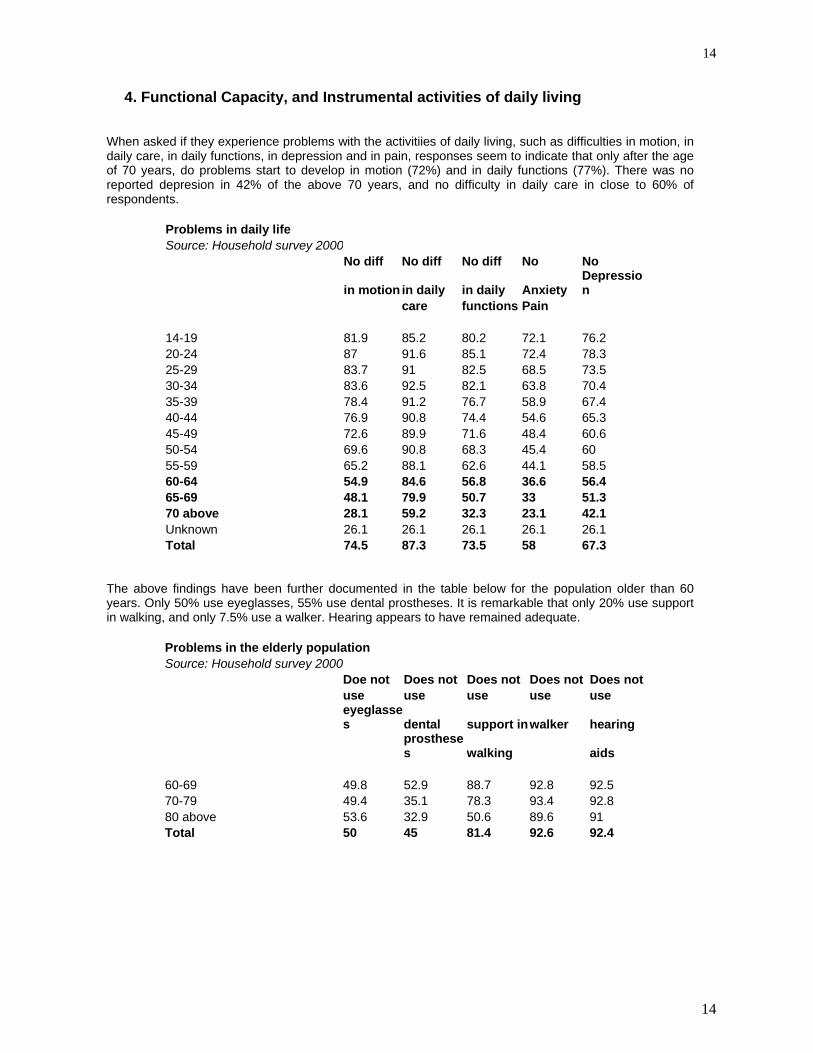
4. Functional Capacity, and Instrumental activities of daily living When asked if they experience problems with the activitiies of daily living, such as difficulties in motion, in daily care, in daily functions, in depression and in pain, responses seem to indicate that only after the age of 70 years, do problems start to develop in motion (72%) and in daily functions (77%). There was no reported depresion in 42% of the above 70 years, and no difficulty in daily care in close to 60% of respondents.
Problems in daily life Source: Household survey 2000 No diff No diff No diff No No
in motion in daily in daily Anxiety Depression
care functions Pain 14-19 81.9 85.2 80.2 72.1 76.2 20-24 87 91.6 85.1 72.4 78.3 25-29 83.7 91 82.5 68.5 73.5 30-34 83.6 92.5 82.1 63.8 70.4 35-39 78.4 91.2 76.7 58.9 67.4 40-44 76.9 90.8 74.4 54.6 65.3 45-49 72.6 89.9 71.6 48.4 60.6 50-54 69.6 90.8 68.3 45.4 60 55-59 65.2 88.1 62.6 44.1 58.5 60-64 54.9 84.6 56.8 36.6 56.4 65-69 48.1 79.9 50.7 33 51.3 70 above 28.1 59.2 32.3 23.1 42.1 Unknown 26.1 26.1 26.1 26.1 26.1 Total 74.5 87.3 73.5 58 67.3
The above findings have been further documented in the table below for the population older than 60 years. Only 50% use eyeglasses, 55% use dental prostheses. It is remarkable that only 20% use support in walking, and only 7.5% use a walker. Hearing appears to have remained adequate.
Problems in the elderly population Source: Household survey 2000 Doe not Does not Does not Does not Does not use use use use use
eyeglasses dental support inwalker hearing
prostheses walking aids
60-69 49.8 52.9 88.7 92.8 92.5 70-79 49.4 35.1 78.3 93.4 92.8 80 above 53.6 32.9 50.6 89.6 91 Total 50 45 81.4 92.6 92.4
15
15
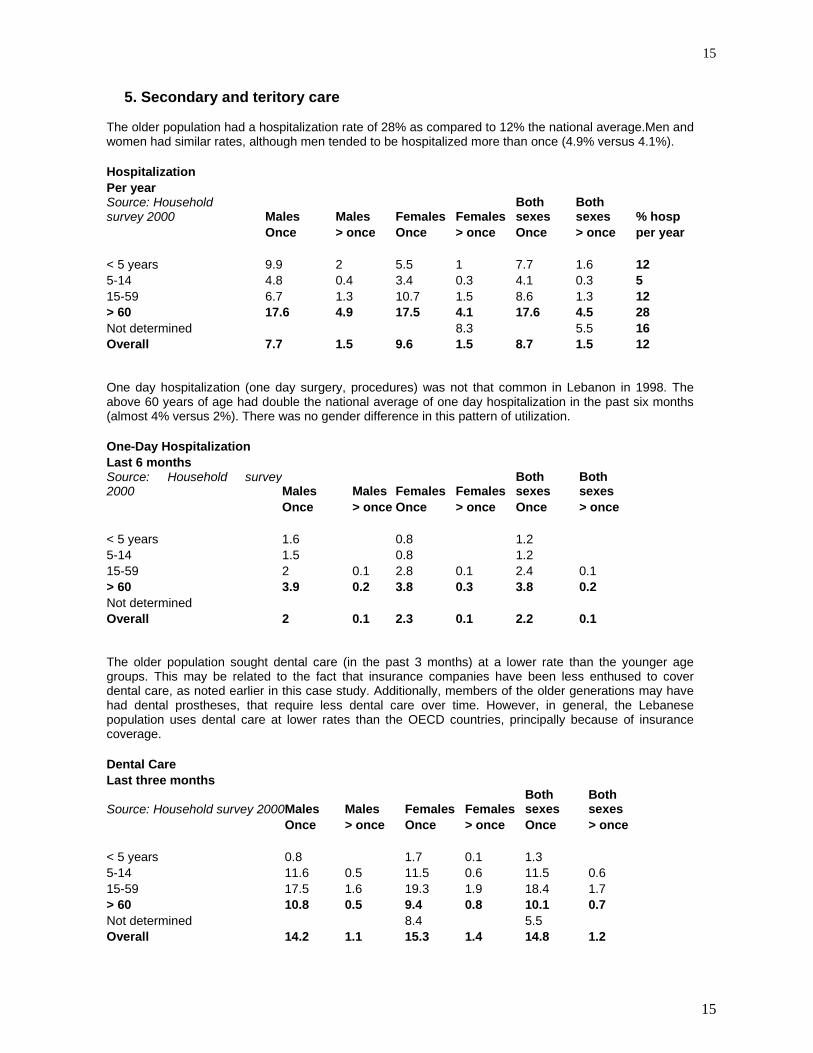
5. Secondary and teritory care The older population had a hospitalization rate of 28% as compared to 12% the national average.Men and women had similar rates, although men tended to be hospitalized more than once (4.9% versus 4.1%). Hospitalization Per year Source: Household survey 2000 Males Males Females Females
Both sexes
Both sexes % hosp
Once > once Once > once Once > once per year < 5 years 9.9 2 5.5 1 7.7 1.6 12 5-14 4.8 0.4 3.4 0.3 4.1 0.3 5 15-59 6.7 1.3 10.7 1.5 8.6 1.3 12 > 60 17.6 4.9 17.5 4.1 17.6 4.5 28 Not determined 8.3 5.5 16 Overall 7.7 1.5 9.6 1.5 8.7 1.5 12 One day hospitalization (one day surgery, procedures) was not that common in Lebanon in 1998. The above 60 years of age had double the national average of one day hospitalization in the past six months (almost 4% versus 2%). There was no gender difference in this pattern of utilization. One-Day Hospitalization Last 6 months Source: Household survey2000 Males Males Females Females
Both sexes
Both sexes
Once > once Once > once Once > once < 5 years 1.6 0.8 1.2 5-14 1.5 0.8 1.2 15-59 2 0.1 2.8 0.1 2.4 0.1 > 60 3.9 0.2 3.8 0.3 3.8 0.2 Not determined Overall 2 0.1 2.3 0.1 2.2 0.1 The older population sought dental care (in the past 3 months) at a lower rate than the younger age groups. This may be related to the fact that insurance companies have been less enthused to cover dental care, as noted earlier in this case study. Additionally, members of the older generations may have had dental prostheses, that require less dental care over time. However, in general, the Lebanese population uses dental care at lower rates than the OECD countries, principally because of insurance coverage. Dental Care Last three months
Source: Household survey 2000 Males Males Females Females Both sexes
Both sexes
Once > once Once > once Once > once < 5 years 0.8 1.7 0.1 1.3 5-14 11.6 0.5 11.5 0.6 11.5 0.6 15-59 17.5 1.6 19.3 1.9 18.4 1.7 > 60 10.8 0.5 9.4 0.8 10.1 0.7 Not determined 8.4 5.5 Overall 14.2 1.1 15.3 1.4 14.8 1.2

16
16
The utilization of ambulatory services (visits last month), dental visits (last 3 months), hospitalizations (last year), one day hospitalization (last six months) were compared to identify differences in utilization due to insurance status. Most of the parameters did not change appreciably except perhaps for hospitalization (19.4 versus 16.6% and 5.8% versus 3.6%). As we had noted earlier, the older population is insured to the same tune as the rest of the population (about 50%), while the other half accesses the medical faciliites of the Ministry of Health, the insurance of last resort for the uninsured.
Utilization of medical care and Insurance Status Ambulatory Ambulatory Ambulatory Ambulatory Dental care Dental care Dental care Dental care Visits x 1 Visits > 1 Visits x 1 Visits > 1 Once More than 1 Once More than 1 Insured Insured Not insured Not insured Insured Insured Not insuredNot insured < 5 years 40.1 7.7 39.7 4.9 1.5 1 0.1 5-14 years 22 1.5 19.8 1.4 12.7 0.9 10.5 0.3 15-59 years 23 3.6 22.1 2.8 19.9 1.8 18 1.8 > 60 years 37.3 7.7 35.6 7.3 10.2 0.7 10.2 0.7 Not determined 25.6 14.6 14.6 Overall 25.6 3.9 24.6 3.3 15.9 1.3 14.3 1.2 Hospital Hospital Hospital Hospital Hospital Hospital Hospital Hospital admit x 1 admit > 1 admit x 1 admit > 1 Day x 1 Day > 1 Day x 1 Day > 1 Insured Insured Not insured Not insured Insured Insured Not insuredNot insured < 5 years 9.8 2.1 5.8 1.1 0.9 1.4 5-14 years 4.3 0.5 4 0.3 1.2 1.1 15-59 years 10.1 1.8 8 1.1 2.7 0.1 2.3 0.1 > 60 years 19.4 5.8 16.6 3.6 4 0.3 3.8 0.2 Not determined 25.6 Overall 9.7 1.9 8 1.2 2.3 0.1 2.1 0.1
As indicated earlier in this case study for Lebanon, the overall health care bill amounted in 1998 to 2,994,000 billions LL or close to 2 billions $. Of this amount, 1,785 billions were spent out-of-pocket, 311 billions was expended by the Ministry of Health, 297 billions by the National Social Security Fund, all the other public funds spent 189 billions, while private insurance spent 412 billions. Each of these parties allocated these sums to hospital care, outpatient care, pharmaceuticals, other expenses and administration, as shown in the table below, that has been adapted from the National Health Accounts study for Lebanon 1998, released in December 2000.
Total Hospitals Non-Institutional Pharmaceuticals Other Admin
OOP 1,785 246 978 525 35 0 MOH 311 227 28 21 22 13 NSSF 297 108 42 48 60 40 Other Public 189 105 42 18 3 21 Private Ins. 412 50 160 103 7 92 Total 2,994 735 1,250 715 128 166
The population over the age of 65 years had a health care bill of 426 billions LL (284 millions $), of which 251 (167 millions $) were out-of-pocket expenditures.

17
17
Age 65 and Over Subset
Total Hospitals Non-InstitutionalPharmaceuticals Other Admin OOP 251 49 127 71 5 0 MOH 56 44 4 3 3 2 NSSF 41 19 5 5 7 5 Other Public 28 18 5 2 0 3 Private Ins. 50 9 18 12 1 11 Total 426 138 158 93 16 22
Insured 65+
Total Hospitals Non-Institutional Pharmaceuticals Other Admin
OOP 65 8 44 12 1 0 MOH 15 14 0 0 0 1 NSSF 41 19 5 5 7 5 Other Public 28 18 5 2 0 3 Private Ins. 50 9 18 12 1 11 Total 199 67 71 31 9 20 Uninsured 65+
Total Hospitals Non-Institutional Pharmaceuticals Other Admin
OOP 186 40 83 59 4 0 MOH 42 30 4 3 3 2 NSSF 0 0 0 0 0 0 Other Public 0 0 0 0 0 0 Private Ins. 0 0 0 0 0 0 Total 228 71 87 62 7 2
This sum (426 billions LL), was spent as follows: 199 billions LL by the insured above the age of 65 years, and 228 by the uninsured in that same age group, as detailed in the two tables above.
Future Law Profile Matrix for Total NSSF coverage of Population
Total Hospitals Non-Institutional Pharmaceuticals Other Admin
OOP 1,491 169 855 430 37 0 MOH 218 160 19 16 14 9 NSSF 297 108 42 48 60 40 Other Public 189 105 42 18 3 21 Private Ins. 247 30 96 62 4 55 New Plan 875 155 323 266 13 118 Total 3,317 726 1,377 840 131 242
If the National Social Security were to become universal and cover all the Lebanese population, actuarial studies indicated that the overall health care bill would increase to 3,317 billions LL or 2.211 billions $, an increase of 10.6%. The population over the age of 65 years, that would now become insured in its totality, was expected to consume 632 billions LL or 421 millions $, i.e. about 1,460 $ per person above the age of 65 years per year, for all medical expenditures..

18
18
V. Health Care System of Lebanon 1. Historical review of Health Care system The issues and difficulties facing the health care system (HCS) are not new, and they precede the civil disturbances of the last two decades. They emanate from an attitude of “laissez-faire” that had characterized most sectors since the country achieved its independence in 1943. Lebanon’s health sector until 1958 had followed the international trends that had prevailed in the first half of the twentieth century. Initially, at the turn of that century, the State had focused primarily on promulgating legislation to protect Society against health ills, that were then predominantly infectious diseases. Thus, the quarantine system was established, laws governing water supply and sewage disposal were promulgated, and dispensaries for the poor and facilities to house the contagious patients and the mental patients were built and managed by the State. Medical care, that was not as sophisticated then, was entrusted to the charitable, religious and community groups, often with support from the Government. Private practice and facilities started in the twenties, patterned on the French model since Lebanon was then under the mandate of France. Physicians who had trained and specialized primarily in Europe returned and opened small facilities to treat their inpatients, within their specialty. Medical education, and indeed the preparation of health manpower, was confined to the two prestigious foreign universities: the American University of Beirut (since 1866) and the Saint Joseph University (since 1877). Both were and continue to be centers for excellence in health profession education. One should note nevertheless that the two universities were educating then for the entire region (including Palestine) since few educational facilities existed in the Region (except for Egypt, Syria and Iraq). Thus the output of its Lebanese graduates was small, elitist and selective. In the first fifteen years of independence (1943-1958), the State built a network of regional, district and rural hospitals, all within a referral system, to provide care, for essentially the under-privileged. Patients were then required to attest to their financial need to be admitted for care. This regulation (that had continued from the earlier days, impacted negatively on the Government facilities, since it stigmatized the users within their community, as being in need. Although this regulation was discontinued in 1970, the perception remained and languished. The ethos of care by the Government was “paternalistic”, a favor to the less privileged. After a relatively benign civil disturbance in 1958 (if compared to the latter one in 1975), the Government attempted major reforms in all sectors. In a sense, Lebanon adapted the trends that prevailed in the world after the end of the second world war. In the health sector, these reforms were quite advanced even when compared with more developed countries. Social development with community participation, primary health care principles, were actively encouraged and institutionalized. The National Social Security Fund was established in 1964, to insure social programs in Maternity, Medical Care (1971), Occupational accidents, end-of-service indemnities, family allowances, for its enrollees and their dependents. The Cooperative of the Civil Servants was also established four months later, as a temporary institution, to cover the civil servants (until the NSSF had time to extend its programs). The Government was moving into the vision of health care as a human right, provided in a spirit of solidarity amongst the different strata of the population. The civil disturbances that had started in 1975 had a major negative impact on the public health care system. The state facilities were often at dangerous sites of the country, and were in their majority destroyed, looted or deserted. The staff found difficulty in reaching their work station. The centralization of the Ministry of Health had prevented the smooth flow of supplies, pharmaceuticals, systems, manpower and regulations. To provide care for the traumatized population, the Government relied on the private sector. Before the war, in 1970, only 10% of the Ministry budget used to be expended on the care of its patients in private facilities, principally for advanced care that was not available in the public hospitals. This budget line provided the ready opportunity for the treatment of patients during the war. Of all sectors in the economy, none flourished as much as the private health sector during the past two decades. However, no one denies the extent that the private hospital sector assisted in the provision of care, under duress, during that long period of strife. It is to be noted that these incentives expanded the private sector to areas of the country that were until then under-served. Just before the civil strife and all through that crisis, the preparation of physicians was accelerated in Lebanon as well as in the Region. This is attributed to the social and economic preeminence of physicians in Society (and also as a sure way to climb the social and political ladder). The Lebanese University had been established in 1954 ; in addition, scores of Lebanese left for medical education abroad, on grants and fellowships provided by friendly governments, often from the former Soviet Union and Arab countries. The numbers, quality, preparation, background, homogeneity of the medical corps began to change drastically.

19
19
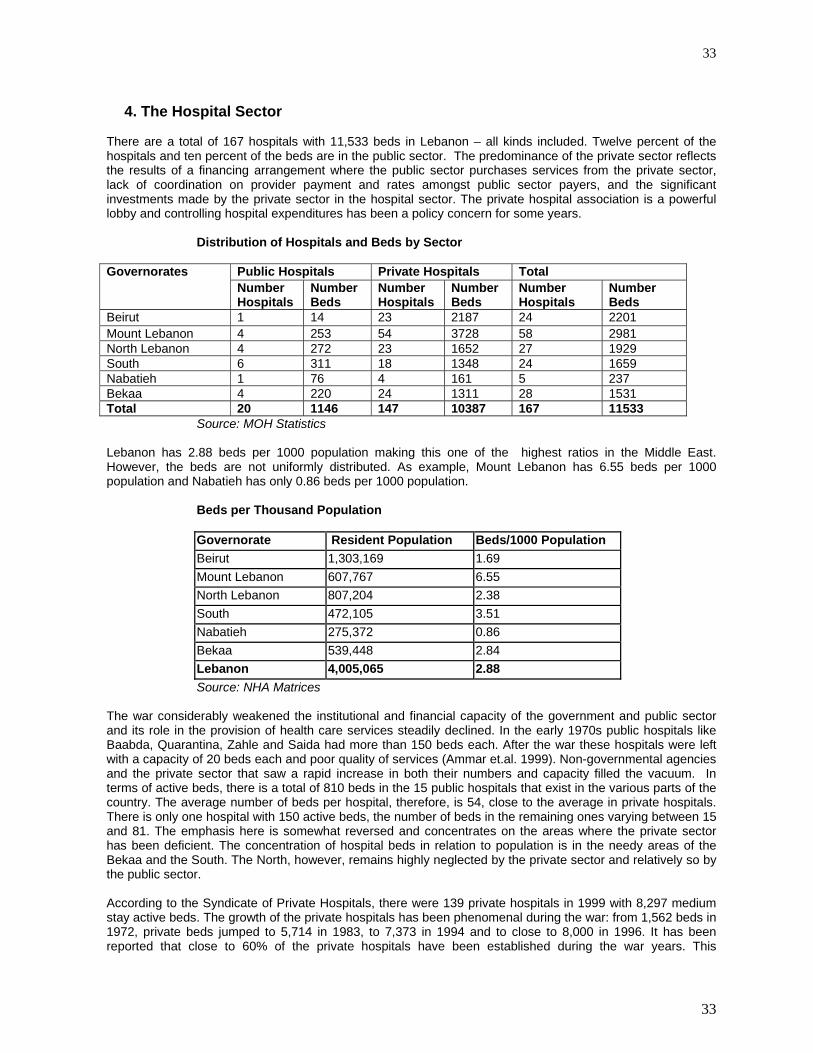
After the war ended in 1990, the Government started to refurbish its hospitals and to build new ones. In 1992, the Ministry decided to cover the treatment of patients undergoing complex surgeries and medical care such as cardiac surgery, cancer treatment, renal dialysis. These developments however have failed to delineate the role of the Ministry of Health, in a clear and sustainable manner. As is stands today, the Ministry is essentially yet another financing public agency, since close to 80% of its budget (as will be detailed further down) is spent on the hospitalization of patients on its account in private hospitals. The Ministry of Health has not been prepared for this role, in its legislation. The existing legislation, promulgated in 1961, stills defines the role of the Ministry, as a “public health” entity, i.e. the provision of non-personal health services, to the communities and the country in addition to is regulatory responsibilities (licensure, inspection and control). Moreover, from its original role to provide care for the poor, the Ministry has evolved to be the safety net, to cover, in principle, the medical care of all the non-insured, and to promote access and equity. Initially, the Ministry of Health provided hospital care to the medically indigent, in a paternalistic manner. Hospital care was seen as a “financial duress” for the medically indigent, and progressively for other segments of the population. In 1992, coverage was extended to the complex procedures and treatments, basically the “catastrophic illnesses” that would tax any household financially. This has oriented care towards the hospitals, to insure coverage and facilitate access, to the satisfaction of all users and providers, and to the detriment of Primary Health Care and its role as gatekeeper of care. In summary, Lebanon has a highly fragmented health care system. The war considerably weakened the institutional and financial capacity of the government and public sector and its role in the provision of health care services steadily declined. Non-governmental agencies and the private sector that saw a rapid increase in both their numbers and capacity filled the vacuum. Health care services have become increasingly oriented towards curative care with a rapid growth in the number of hospitals and centers for high technology services. Today ninety percent of hospital beds are in the private sector. The Primary Health Care system has remained weak.
2. Financing health care According to the National Household Health Expenditures and Utilization Survey ( NHHEUS), 46.8% of the population reported having some form of insurance (either social or private). If one excludes the non-Lebanese population that is estimated at 7.6% the government is responsible for the remaining 45.6% of the population. There also is a fair amount of geographic variation in the profile of the insured by Mohafazat or governorate. The highest proportion of the population covered is in Beirut and Mount of Lebanon with the lowest coverage in Bekaa and Nabatyeh. Information was obtained on the proportion of the population covered by various financing agencies from these agencies. Expenditures on hospital care by public financing agents are very high. Overall, 66.4 percent of the recurrent public health expenditures is spent on hospital based care, 14% on ambulatory care, 7.8% on pharmaceuticals, other goods accounts for 5%, 6.8% on administration. In the case of the Ministry of Health 71% of its budget is used to pay for hospital based care. Expenditures on primary health care services are a sub-set of that on non-institutional health care providers and accounts for less than 5% of public expenditures. The Ministry of Health has not been able to disburse all amounts allotted to primary health care and in some cases these resources have been diverted to curative care services. There are three sources of governmental health insurance providers in Lebanon, in addition to the payments made by the Ministry of Public Health to private hospitals for the hospitalization of the uninsured applicants. a) The National Social Security Fund (NSSF) The NSSF was established in 1964, within the programs of reforms that had been legislated after the 1958 civil disturbances. The Public Law mandated the creation of independent funds to cover Workmen’s compensation, end-of-service indemnities and Maternity and Sickness. The latter was implemented in 1971. The NSSF is quite similar to the French model of Social Security. It is financed by the employer, the employee and the Government. The high social costs of the NSSF has led employers to underestimate the salaries of their employees, and/or employ non-Lebanese in preference to the nationals.
20
20
The NSSF is managed by an independent 26-member Board of Directors: 10 representing the employers, 10 representing the employees and six the Government. A Director-General executes the decisions of the Board. Having been essentially a gain to the workers, the NSSF falls under the tutelage of the Ministry of Labor and Social Affairs. The Ministry of Health has little input, if at all, into its operations or decisions. The NSSF is the most important source of public health insurance in Lebanon. It covers, in principle, Lebanese citizens who are workers and employees in the private non-agricultural sector; permanent employees in agriculture, employees of public institutions and independent offices who are not subject to civil service; teachers in public schools; taxi drivers; newspaper sellers; and university students. Health coverage includes sickness and maternity allowances amounting to 90 per cent of hospitalization costs and 80 per cent of medical consultations and medication excluding dental care. Thus to a large extent, the Fund is financed from private sources: yet it is a public institution. On April 12, 2000, a project Law was approved by the Cabinet instituting the provision of health care to the entire population above the age of 64 years, under the auspices of the NSSF. The project Law has not been implemented as yet and may be revised. Beneficiaries include the spouse, male children under the age of 16 years (up to 25 years if in formal education), female children up to the age of 25 years. There is no age limit for coverage if the child suffers from a handicap. Parents are also covered if they are over the age of 60 years, living in the same household and cannot support themselves (There is evidence that this restriction is not strictly applied). Hospital admission is secured through one’s physician and reviewed by the NSSF medical inspector at the hospital. Patients enter Class II, but may enter into a higher class if they pay the class difference out-of-pocket. Payment to providers is through an agreed upon tariff that is negotiated on a periodic basis (usually yearly). Taxi drivers, university students, newspaper men do not pay any co-payment; all others pay 10% of the hospital costs and 20% of outpatient care (based on the tariff!). Hospitals submit the patients’ bills to the NSSF. There is usually a delay and often bills are discounted after review. Outpatient care is paid by the patient and later reimbursed by the NSSF to the patient. Dental care is not covered as yet. There is evidence that the reimbursement procedures are tedious, time-consuming and bureaucratic. This leads many to forego their claims for ambulatory care reimbursement. Hence, although the financial barrier is removed, the bureaucratic/administrative barrier limits the reimbursement of claims. An agreement was reached between the NSSF and the Ministry of Health in the early 1970s, whereby one of the Ministry’s hospitals (Batroun) was leased to the NSSF for Management and Operations. This agreement is still ongoing. This was seen as an attempt of the NSSF to provide care within its own network of facilities. NSSF reimburses $ 70 per enrollee to any institution that wishes to make its own medical care arrangements. NSSF states that its cost for the coverage per capita is 200,000 LL ($ 133) per year in 1999, for the present range of medical services. Coverage by the NSSF is indexed on the number of enrollees registered in the Sickness Fund. The total number of beneficiaries is obtained by multiplying that number with a constant that represents the average dependents per enrollee. This has been 3, 3.5 or 4 persons per enrollee, depending on the year. The entire list of beneficiaries is not released, nor is the data computerized. This has led to widely different numbers as far as the percent of the population covered by the NSSF as well as the costs incurred to provide for that population. There is evidence to suggest that the population covered is in fact substantially smaller than indicated by the NSSF, due to double-counting of beneficiaries, as well as the accurateness of the constant used to determine the total number of beneficiaries. The household survey of 1997 revealed that only 15.2 % of the sample interviewed were covered by the NSSF. In the most recent survey (March 2000), 17.8% responded that they carry the NSSF coverage. The NHHEUS reports a coverage of 26.1%. The NSSF maintains that it provides coverage for 33% of the Lebanese population, i.e. double the numbers suggested by the surveys. This information impacts as well on the costs of operation and coverage since the number of beneficiaries claimed may be double the numbers who receive the service (hence the cost would be halved!)

21
21
NSSF COVERAGE Source: Director-General 1999 Employees in Public and Private sectorsand teachers in private schools 328843 University students 21077 Taxi drivers 34635 Newspapers men 100 Totals 384655
b) The Cooperative of the Civil Servants (Coop) The third most important source of public health insurance is the Cooperative of the Civil Servants. The Law instituting the Coop was issued in 1964, four months after the Law of the NSSF by the same Cabinet. An article in the Law stipulates that the Coop is to be merged with the NSSF once the latter has been developed. The Coop insures all employees of the public sector who are subject to the laws of the Civil Service. Health insurance here covers 90 per cent of hospitalization costs and 75 per cent of consultations, medication and dental treatment for the employee (up to a ceiling, beyond which the Coop covers all). In addition, it covers 75 per cent of hospitalization costs for the family members of the employee and 50 per cent of their medical consultations and pharmaceuticals The Coop is operated by the Office of the Prime Minister. It covers the permanent civil servants. The staff on contracts are covered by the NSSF (as above). The Coop also covers educational and other family benefits. After a service of 20 years, the civil servant (and his dependents) is covered also after retirement. The Coop uses the multiplier of 6 to estimate the dependents (and hence the beneficiaries)! Coverage includes hospital care, ambulatory services, dental care and optometric services as well. Coverage is in First, Second or Third class depending on the employment grade of the enrollee. Dental care is covered, as well as 90% of treatment abroad up to $ 10,000. The Coop is financed from a 1% deduction of the payroll: the balance is covered by the Government. The Coop enters into a tariff agreement with the providers, independently of the other public funds. The tariff of the Coop is usually more advantageous than the other funds; its hospitalization rate was only 7% in 1995. C)The Security Forces The coverage of the security forces is achieved through several funds: The Military are covered by the Ministry of Defense, through the Military Medical Services. The Internal Security forces (ISF) have their own plan, under the Ministry of Interior. The staff of the Public Security, the Customs employees and those of the State Security are covered through two different funds, under the Office of the Prime Minister. All uniformed staff members are covered with their dependents and their parents. The dependency ratio is 3.5 persons per enrollee. The following benefited from the security forces’ schemes, as per the Official Gazette:
1998
Army- Enrollees 85,000 Army- Beneficiaries 325,000 ISF – Enrollees 23,100 ISF- Beneficiaries 78,100 General Security- Enrollees 3,800 General Security- Beneficiaries 13,000 State Security- Enrollees 1,463 State Security- Beneficiaries 3,877 Totals 533,340
22
22
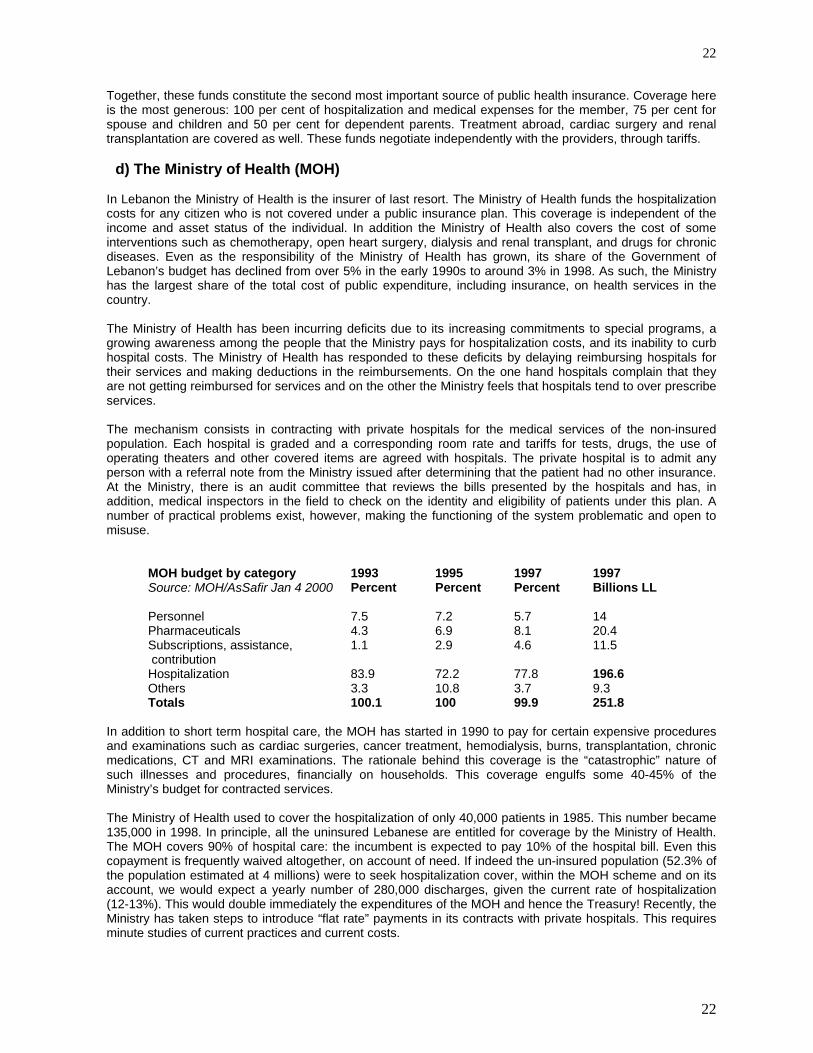
Together, these funds constitute the second most important source of public health insurance. Coverage here is the most generous: 100 per cent of hospitalization and medical expenses for the member, 75 per cent for spouse and children and 50 per cent for dependent parents. Treatment abroad, cardiac surgery and renal transplantation are covered as well. These funds negotiate independently with the providers, through tariffs. d) The Ministry of Health (MOH) In Lebanon the Ministry of Health is the insurer of last resort. The Ministry of Health funds the hospitalization costs for any citizen who is not covered under a public insurance plan. This coverage is independent of the income and asset status of the individual. In addition the Ministry of Health also covers the cost of some interventions such as chemotherapy, open heart surgery, dialysis and renal transplant, and drugs for chronic diseases. Even as the responsibility of the Ministry of Health has grown, its share of the Government of Lebanon’s budget has declined from over 5% in the early 1990s to around 3% in 1998. As such, the Ministry has the largest share of the total cost of public expenditure, including insurance, on health services in the country. The Ministry of Health has been incurring deficits due to its increasing commitments to special programs, a growing awareness among the people that the Ministry pays for hospitalization costs, and its inability to curb hospital costs. The Ministry of Health has responded to these deficits by delaying reimbursing hospitals for their services and making deductions in the reimbursements. On the one hand hospitals complain that they are not getting reimbursed for services and on the other the Ministry feels that hospitals tend to over prescribe services. The mechanism consists in contracting with private hospitals for the medical services of the non-insured population. Each hospital is graded and a corresponding room rate and tariffs for tests, drugs, the use of operating theaters and other covered items are agreed with hospitals. The private hospital is to admit any person with a referral note from the Ministry issued after determining that the patient had no other insurance. At the Ministry, there is an audit committee that reviews the bills presented by the hospitals and has, in addition, medical inspectors in the field to check on the identity and eligibility of patients under this plan. A number of practical problems exist, however, making the functioning of the system problematic and open to misuse.
MOH budget by category 1993 1995 1997 1997 Source: MOH/AsSafir Jan 4 2000 Percent Percent Percent Billions LL Personnel 7.5 7.2 5.7 14 Pharmaceuticals 4.3 6.9 8.1 20.4 Subscriptions, assistance, contribution
1.1 2.9 4.6 11.5
Hospitalization 83.9 72.2 77.8 196.6 Others 3.3 10.8 3.7 9.3 Totals 100.1 100 99.9 251.8
In addition to short term hospital care, the MOH has started in 1990 to pay for certain expensive procedures and examinations such as cardiac surgeries, cancer treatment, hemodialysis, burns, transplantation, chronic medications, CT and MRI examinations. The rationale behind this coverage is the “catastrophic” nature of such illnesses and procedures, financially on households. This coverage engulfs some 40-45% of the Ministry’s budget for contracted services. The Ministry of Health used to cover the hospitalization of only 40,000 patients in 1985. This number became 135,000 in 1998. In principle, all the uninsured Lebanese are entitled for coverage by the Ministry of Health. The MOH covers 90% of hospital care: the incumbent is expected to pay 10% of the hospital bill. Even this copayment is frequently waived altogether, on account of need. If indeed the un-insured population (52.3% of the population estimated at 4 millions) were to seek hospitalization cover, within the MOH scheme and on its account, we would expect a yearly number of 280,000 discharges, given the current rate of hospitalization (12-13%). This would double immediately the expenditures of the MOH and hence the Treasury! Recently, the Ministry has taken steps to introduce “flat rate” payments in its contracts with private hospitals. This requires minute studies of current practices and current costs.

23
23
e) The Private insurance companies The private insurance market is growing rapidly in Lebanon. According to the Ministry of Economy sources approximately 70 private insurance companies provide health insurance. They provide both complementary and comprehensive health insurance policies. The former is to complement and fill gaps in the benefits provided by NSSF, CSC, and health insurance arrangements for the Army and Police. The latter refer to stand alone health insurance policies that can cover a range of benefits including inpatient and outpatient care, and coverage for pharmaceutical expenses. It is estimated that 8% of the population has comprehensive coverage and 4.6% gap insurance. According to the ACAL (Association of Lebanese Insurance Companies), health insurance continues to dominate the sector, representing some 48% of total premiums written. The top 20 firms control about 70% of the market. In May of 1999, Parliament passed an insurance reform law that is expected to pave the way for the consolidation of the sector.
Insurance Premiums 1997-1998
Type of Coverage Total Premium 1998 ($ million)
Total Premium 1997 ($ million) Increase %
Hospitalization 215 198 8.58 Life 75 80 6.26 Motor 25 64 11.15 General Accidents 41 27 51.24 Fire 34 19 85.86 Workmen’s Compensation
16 18 13.88
Marine 12 15 17.14 TOTAL 450 421 7.05
Source: NHA Matrices Compared to other countries in the region, Lebanon has a fairly well developed private insurance sector. Private insurance is licensed by the Ministry of Economy. Insurance companies are required by law to set aside 40% of premiums as reserves. Ten of the companies are foreign owned and preliminary reports indicate that another ten are non-operational. The two global reinsurance companies with offices in Lebanon are MunichRe and SwissRe. Nearly 85% of the policies are purchased by employers as an employee benefit or to fill gaps in NSSF coverage. Insurance policies in Lebanon typically cover in-patient care. Outpatient services are covered for an additional premiums with co-payments of around 20%. Estimates of the breakdown of expenditures by private insurance companies by type of service shows that physician fees account for 30% of expenses, pharmaceuticals for 31%, hospitalization costs for 15%, and administrative expenses for 24%. Many insurance companies still consider health to be a loss leader. The private insurance market is inadequately regulated. Consequently, insurers indulge in “cream skimming”, selecting only good risks and either denying coverage or setting very high premiums for individuals with pre-existing conditions. The administrative costs of private insurance are high: up to 50% of the premium. A large proportion of that is disbursed to middlemen. Insurance companies pay 11% of the premium as a tax to the Ministry of Economy. The private insurance company must also lodge 40% of its premium as guarantee.
Distribution of Private Insurance Expenditures Item Percentage Physician Fees 30% Pharmaceuticals 31% Hospitalization Costs 15% Administrative Expenses 24% Total 100% Source: NHA matrices

24
24
The number of Lebanese enrolled in private insurance had risen between 1992 and 1995, only to stabilize or even decrease lately. In 1998, the Central Statistics Agency estimated that 464,000 (116,000 of which is co-insurance) persons had taken up a private insurance; Mednet’s estimates are 473,000 (173,000 of which are for co-insurance). The hospitalization rate for this population varied between 11-15% over the period 1995-1999. Insurance policies in Lebanon typically cover in-patient care. Outpatient services are covered for an additional premiums with co-payments of around 20%. f) The Mutual Funds There is also a growing number of mutual funds being established, covering health expenses in the context of syndicates, associations and other groups. The mutual funds started in 1991. This movement is under the tutelage of the Ministry of Housing and Cooperatives. The Law governing the mutual funds permit any group of 50 persons (or above) to form a mutual fund. The linkage could be professional, religious or community-based. Tax laws that provide tax-breaks to non-profit groups have lead to a proliferation of mutual funds that offer health insurance coverage to their enrollees. Recent estimates would indicate that about 65,000 individuals were covered for health benefits by mutuelles. However, the number of enrollees ranges from as low as sixty-six to twelve thousand. Private insurance companies feel the differential tax treatment distorts the playing field and the growth of mutual funds hampers the competitiveness of the insurance market. Mutual funds do not pay taxes on the premium, unlike the private insurance companies.
Insurance Status of the Lebanese Population Source: Household Survey 2000
Beirut Beirut Rest of North South Nabatieh Beqaa Lebanon suburbs Mt
Lebanon
NSSF - Alone 18 17 19.6 11.5 12.1 9.3 11.2 14.5 NSSF - With other insurance 5.8 6.3 4.1 1.5 1.2 0.9 0.9 3.2 Total NSSF 23.8 23.3 23.7 13 13.3 10.2 12.1 17.7 Coop - Alone 3 3 3.5 4.5 5.6 7.1 5.1 4.2 Coop - with other insurance 0.2 0.4 0.1 0.2 0 1.4 0.1 0.3 Total Coop 3.2 3.4 3.6 4.7 5.6 8.5 5.2 4.5 Uniformed - alone 3.8 6.4 7 12 4.4 7.5 12.5 8 Uniformed - with other insurance
0 0.1 0 0.2 0 0.1 0.2 0.1
Total Uniformed 3.8 6.5 7 12.2 4.4 7.6 12.7 8.1 Private insurance - alone 15.3 10.4 13.6 3.6 4 1.3 2.9 7.6 Private insurance - with other insurance
1.7 0.8 0.8 0.9 1.1 0.2 0.2 0.8
Total - Private insurance 17 11.2 14.4 4.5 5.1 1.5 3.1 8.4 Complementary insurance 4 5.2 3.3 0.7 1.2 0.5 0.7 2.5 Municipality coverage 1.2 0.3 0 0.6 0.3 0 0.1 0.4 Insurance/in school or at work-alone
0.1 1 0.5 1.7 0.2 0.2 0.6 0.8
Insurance/in school or at work-others
0.1 0.3 0.1 1 0.1 0 0.2 0.3
Insurance/in school or at work 0.2 1.3 0.6 2.7 0.3 0.2 0.8 1.1 Insurance - Syndicates - alone
2.5 1.9 2.6 0.7 1.7 1.9 1.4 1.7
Insurance - Syndicates - with other
0.5 0.1 0.2 0 0.3 0.1 0 0.1
Insurance - Syndicates - Total 3 2 2.8 0.7 2 2 1.4 1.8 Other type of insurance - alone
3 2.4 0.5 3.7 20.4 7.8 1.4 4.8
Other type of insurance - with other
0 0.1 0 0.5 1.4 1.1 0 0.4
Other type of insurance - 3 2.5 0.5 4.2 21.8 8.9 1.4 5.2

25
25
Total Non-insured 45.3 48.8 46.5 57.2 46 61.2 63 52.3 Unknown 1.5 2.2 1.9 1.9 2.6 1.5 0.6 1.8 All insured 59.2 55.7 55.9 43.3 54 39.4 37.5 49.7 All groups 106 106.7 104.3 102.4 102.6 102.1 101.1 103.8 Other type of insurance includes UNRWA. Hizbollah, etc.
g) The Non-Governmental Organizations (NGOs) There is a relatively small proportion of the total health bill that represents coverage of beneficiaries of health assistance from local and foreign not-for-profit and non-governmental organizations (NFP/NGOs) operating generally at the local level in poorer urban districts and underprivileged rural areas. The importance of this coverage is rather in the fact that it relates to needy individuals who would have great difficulty obtaining health services from other sources. Medical care, offered through NGOs witnessed major extension during the war years. It became evident that health care is a magnet to attract the sympathies and allegiance of the population then under duress. This has waned somewhat since 1990. However, it should be noted that the involvement of the Community in the provision of medical care, did offer some innovative models for the financing, governance and management of health services. Some of this experience has assisted in the push for the autonomy of public hospitals. h) Donor Assistance In 1998, donor assistance amounted to 1.96% of total health care financing. The sharpest decline in donor assistance has been to immunization and control of diseases and there has been a significant increase in support for family planning activities. Outlays for capital investment account for the majority of donor assistance. The Ministry of Health and other government agencies are the primary beneficiary of donor assistance.
Summary of External Assistance Disbursements to Health Sector (000s LL)
Area 1995 1996 1997 1998 Sector Policy and Planning 1,116,000 1,636,500 1,828,500 828,000 Primary Health Care 11,775,000 11,112,000 6,688,500 4,701,000 Immunization and control of diseases 820,500 5,191,500 589,500 111,000 Family Planning 985,500 1,057,500 619,500 1,137,000 Hospitals and Health Centers 19,632,000 53,755,500 41,491,500 46,867,500 Total 34,330,995 72,754,996 51,219,497 53,646,498 Percentage Change in External Assistance
Area 1995 1996 1997 1998 Sector Policy and Planning 46.6% 11.7% -54.7% Primary Health Care -5.6% -39.8% -29.7% Immunization and control of diseases 532.7% -88.6% -81.2% Family Planning 7.3% -41.4% 83.5% Hospitals and Clinics 173.8% -22.8% 13.0% Total 111.9% -29.6% 4.7%
Source: UNDP Annual Report and Information from CDR The World Bank has been supporting health sector reform as well as capital investment activities in Lebanon. The World Bank’s loan portfolio was USD 38 million. Of this disbursements in 1998 amounted to USD 2.34 million and cumulative disbursements until the end of March 31, 1999 was USD 3.91 million.
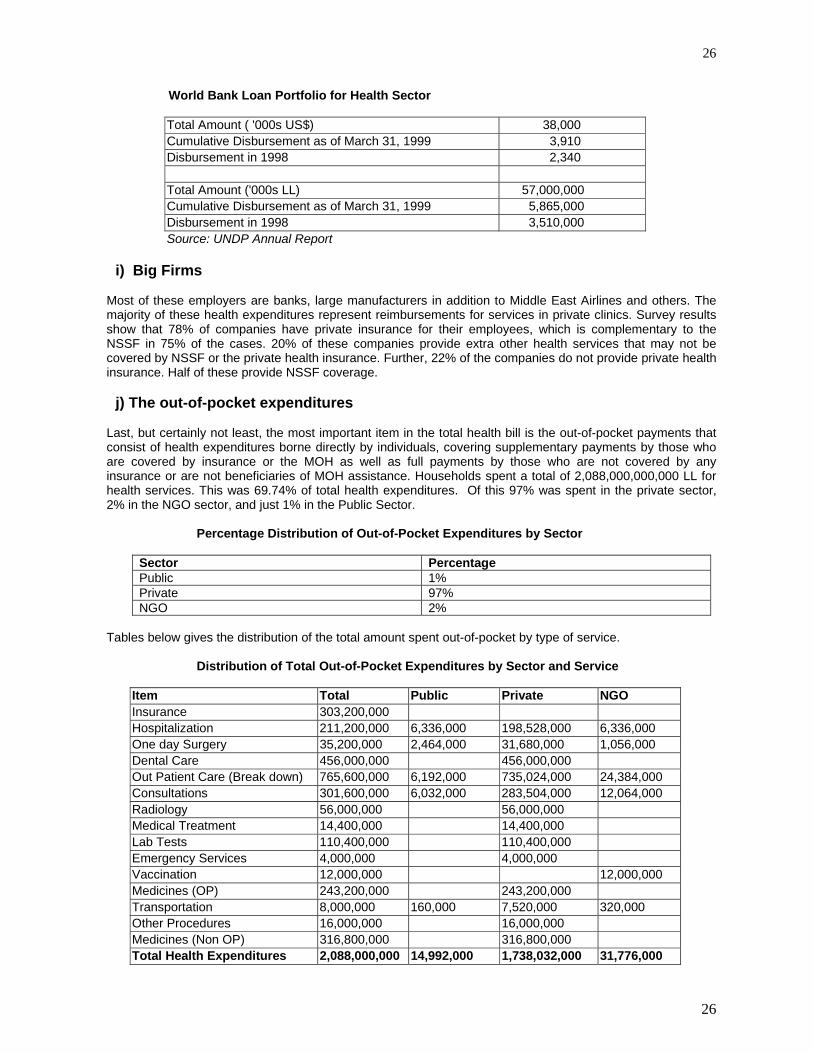
26
26
World Bank Loan Portfolio for Health Sector
Total Amount ( '000s US$) 38,000 Cumulative Disbursement as of March 31, 1999 3,910 Disbursement in 1998 2,340 Total Amount ('000s LL) 57,000,000 Cumulative Disbursement as of March 31, 1999 5,865,000 Disbursement in 1998 3,510,000 Source: UNDP Annual Report
i) Big Firms Most of these employers are banks, large manufacturers in addition to Middle East Airlines and others. The majority of these health expenditures represent reimbursements for services in private clinics. Survey results show that 78% of companies have private insurance for their employees, which is complementary to the NSSF in 75% of the cases. 20% of these companies provide extra other health services that may not be covered by NSSF or the private health insurance. Further, 22% of the companies do not provide private health insurance. Half of these provide NSSF coverage. j) The out-of-pocket expenditures Last, but certainly not least, the most important item in the total health bill is the out-of-pocket payments that consist of health expenditures borne directly by individuals, covering supplementary payments by those who are covered by insurance or the MOH as well as full payments by those who are not covered by any insurance or are not beneficiaries of MOH assistance. Households spent a total of 2,088,000,000,000 LL for health services. This was 69.74% of total health expenditures. Of this 97% was spent in the private sector, 2% in the NGO sector, and just 1% in the Public Sector.
Percentage Distribution of Out-of-Pocket Expenditures by Sector
Sector Percentage Public 1% Private 97% NGO 2%
Tables below gives the distribution of the total amount spent out-of-pocket by type of service.
Distribution of Total Out-of-Pocket Expenditures by Sector and Service
Item Total Public Private NGO Insurance 303,200,000 Hospitalization 211,200,000 6,336,000 198,528,000 6,336,000 One day Surgery 35,200,000 2,464,000 31,680,000 1,056,000 Dental Care 456,000,000 456,000,000 Out Patient Care (Break down) 765,600,000 6,192,000 735,024,000 24,384,000 Consultations 301,600,000 6,032,000 283,504,000 12,064,000 Radiology 56,000,000 56,000,000 Medical Treatment 14,400,000 14,400,000 Lab Tests 110,400,000 110,400,000 Emergency Services 4,000,000 4,000,000 Vaccination 12,000,000 12,000,000 Medicines (OP) 243,200,000 243,200,000 Transportation 8,000,000 160,000 7,520,000 320,000 Other Procedures 16,000,000 16,000,000 Medicines (Non OP) 316,800,000 316,800,000 Total Health Expenditures 2,088,000,000 14,992,000 1,738,032,000 31,776,000

27
27
The household survey only reinforces the fact that the private sector dominates the market in Lebanon. Seventy-eight percent of outpatient visits took place in the private sector, followed by the NGO sector at 12%, with the Public sector accounting for only 9% of all visits. With regard to hospitalizations the private sector once again accounts for nearly 86% of all admissions with the Public sector accounting for 9%. The Public Sector fares a little better when it comes to one day surgery probably because it both pays for this as well provides these services at its facilities. Dental care is almost exclusively the domain of the private sector. This predominance of the private sector in Lebanon makes it clear that any attempt at containing costs and improving efficiency will require the participation and buy-in of the private sector. At the same time unless this sector is better managed, meaningful changes to the health system cannot be achieved.
Choice of Provider Type of Care Public Private NGOs Outpatient Visits 9.4% 78.4% 12.2% Hospitalizations 8.7% 85.7% 5.6% One day Surgery 19.8% 74.3% 5.9% Dental Care 0.6% 86.2% 13.2% Note: The distribution of dental care might underestimate use of Public facilities
Table below shows the percentage of household expenditures that went to pay for health services. On average, households spent a little over 14% of their household expenditures on health services. However, the burden of out-of-pocket expenditures, measured as a proportion of household expenditures, is not equitably distributed. It is seen that nearly a fifth of expenditures in households in the lowest income category went to heatlh. The proportion spent on health goes down with income and households in the highest income group spend only 8% on health care. Even though there might not be inequities in access as measured by per capita use rates the burden of out-of-pocket expenditures is inequitably distributed. While the Ministry of Health pays for hospitalization costs of the uninsured (including the poor) there is probably a need to develop a targeted financing scheme that assures financial access to health services for low income families.
Proportion of Household Expenditures Spent on Health Income Category (‘000 LL) Percent Less than 300 19.86% 300-500 17.96% 500-800 16.07% 800-1200 14.78% 1200-1600 14.02% 1600-2400 14.14% 2400-3200 11.36% 3200-5000 10.68% 5000 and over 8.05% All households 14.06%
Unlike use rate where one did not observe inequities in access the examination of expenditures does raise some equity concerns. On average Lebanese households spend 2,609,000 LL per year on health care. However, households in the Mount of Lebanon spend nearly twice as much on health as households in the North of Lebanon. Similary, one observes a clear correlation between household income and health expenditures. Households with lower incomes spend far less on health care than those with higher incomes. This inspite of the fact that they tend to use more health services on a per capita basis than higher income households. Per capita expenditures amounted to 522,000 LL per year. Of these 15% was spent on insurance, 10% on hospitalization, 2% on one day surgery, 22% for dental care, 36% for outpatient care (exlcuding drugs), and 15% on drugs. Once again the expenditures on pharmaceuticals only reinforces the need to better manage and control this sector. Similarly, the high share of dental expenditures coupled with the access issues observed earlier point probably point to the need to find ways of increasing insurance coverage for dental care.

28
28
Annual Per Capita Expenditures by Type of Service (‘000 LL)
Item Per Capita Per Cent Insurance 75.80 15 Hospitalization 52.80 10 One day Surgery 8.80 2 Dental Care 114.00 22 Out Patient Care (Break down) 191.40 36 Consultations 75.40 Radiology 14.00 Medical Treatment 3.60 Lab Tests 27.60 Emergency Services 1.00 Vaccination 3.00 Medicines (OP) 60.80 Transportation 2.00 Other Procedures 4.00 Medicines (Non OP) 79.20 15 Total Health Expenditures 522.00 100.00
k) Overall expenditures The table below list all the above sources and their respective financial contributions to the total national health bill.
Total LL Hospitals
Non-Institutional Health Care Providers Pharmaceuticals
Retail Sales, capital investment, profit
General Health Administration & Ins.
MOH 310,919,302 226,577,948 27,794,622 21,151,000 22,154,979 13,240,753 Army 86,620,910 50,769,000 3,874,410 13,200,000 2,082,500 16,695,000 ISF 39,708,970 24,371,000 7,853,471 5,236,499 350,000 1,898,000 GS 6,000,000 3,500,000 2,500,000 0 SS 2,400,000 1,450,000 950,000 0 MOSA 1,213,500 0 1,213,500 0 M DISP 230,000 115,000 115,000 0 CSC 45,128,944 24,337,128 18,762,550 0 94,953 1,934,313 NSSF 296,126,000 107,708,000 42,159,000 47,541,000 98,718,000 MUTUAL 33,850,231 0 25,387,673 8,462,558 EMPLOYERS 44,202,642 40,074,140 4,128,502 NGO's 6,774,000 0 6,774,000 0 0 0 Private Insurance Schemes 333,878,035 50,081,705 100,163,411 103,502,191 80,130,728 Household 1,784,800,000 246,400,000 978,400,000 560,000,000 Donors 966,000 0 0 0 966,000 0 Custom duties 1,300,000 Total 2,994,118,534 735,309,781 1,256,021,777 759,093,248 25,648,432 218,045,296
MOH= Ministry of Health; ISF= Internal Security Forces; GS: General Security forces; SS: State Security Forces; MOSA: Ministry of Social Affairs; M Disp: Ministry of the Displaced; CSC: Cooperative of civil servants; NSSF: National Social Security Fund; Mutual: Mutual Funds;
29
29
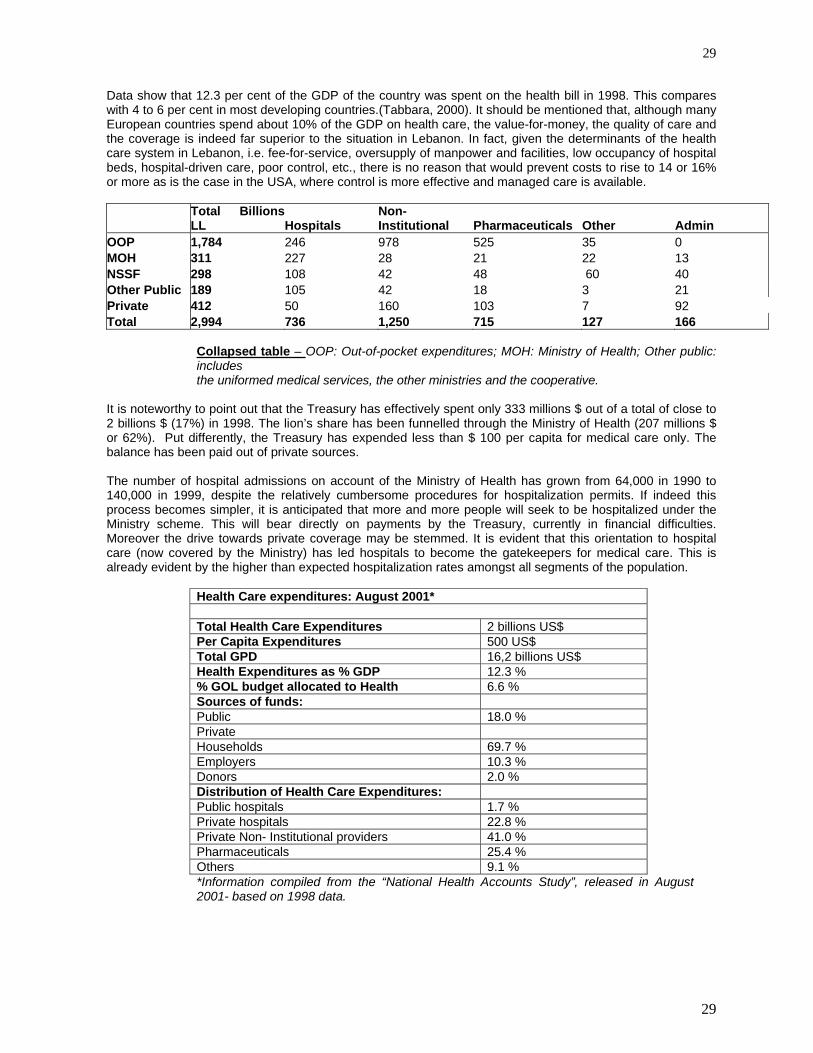
Data show that 12.3 per cent of the GDP of the country was spent on the health bill in 1998. This compares with 4 to 6 per cent in most developing countries.(Tabbara, 2000). It should be mentioned that, although many European countries spend about 10% of the GDP on health care, the value-for-money, the quality of care and the coverage is indeed far superior to the situation in Lebanon. In fact, given the determinants of the health care system in Lebanon, i.e. fee-for-service, oversupply of manpower and facilities, low occupancy of hospital beds, hospital-driven care, poor control, etc., there is no reason that would prevent costs to rise to 14 or 16% or more as is the case in the USA, where control is more effective and managed care is available.
Total BillionsLL Hospitals
Non-Institutional Pharmaceuticals Other Admin
OOP 1,784 246 978 525 35 0 MOH 311 227 28 21 22 13 NSSF 298 108 42 48 60 40 Other Public 189 105 42 18 3 21 Private 412 50 160 103 7 92 Total 2,994 736 1,250 715 127 166
Collapsed table – OOP: Out-of-pocket expenditures; MOH: Ministry of Health; Other public: includes the uniformed medical services, the other ministries and the cooperative.
It is noteworthy to point out that the Treasury has effectively spent only 333 millions $ out of a total of close to 2 billions $ (17%) in 1998. The lion’s share has been funnelled through the Ministry of Health (207 millions $ or 62%). Put differently, the Treasury has expended less than $ 100 per capita for medical care only. The balance has been paid out of private sources. The number of hospital admissions on account of the Ministry of Health has grown from 64,000 in 1990 to 140,000 in 1999, despite the relatively cumbersome procedures for hospitalization permits. If indeed this process becomes simpler, it is anticipated that more and more people will seek to be hospitalized under the Ministry scheme. This will bear directly on payments by the Treasury, currently in financial difficulties. Moreover the drive towards private coverage may be stemmed. It is evident that this orientation to hospital care (now covered by the Ministry) has led hospitals to become the gatekeepers for medical care. This is already evident by the higher than expected hospitalization rates amongst all segments of the population.
Health Care expenditures: August 2001* Total Health Care Expenditures 2 billions US$ Per Capita Expenditures 500 US$ Total GPD 16,2 billions US$ Health Expenditures as % GDP 12.3 % % GOL budget allocated to Health 6.6 % Sources of funds: Public 18.0 % Private Households 69.7 % Employers 10.3 % Donors 2.0 % Distribution of Health Care Expenditures: Public hospitals 1.7 % Private hospitals 22.8 % Private Non- Institutional providers 41.0 % Pharmaceuticals 25.4 % Others 9.1 % *Information compiled from the “National Health Accounts Study”, released in August 2001- based on 1998 data.

30
30
In summary, Lebanon has several different government, not-for-profit, and private for-profit financing schemes. These include:
Two employment based social insurance schemes Four different schemes to cover the security forces The Ministry of Health financing that covers any citizen who is not covered under any other scheme. MOH payments are not dependent on the income of the beneficiary A private insurance market that is largely employment based Mutual funds Out-of-pocket expenditures
l) Insurance Profile of the Population
Governorate Insured Non-Insured Missing Beirut 53% 45% 2% Beirut Suburbs 49% 49% 2% Mount of Lebanon 52% 47% 2% North of Lebanon 41% 57% 2% South of Lebanon 51% 46% 3% Nabatyeh 37% 61% 2% Bekaa 36% 63% 1% Total 46% 52% 2% Source: NHHEUS
Table One below shows the proportion of population covered by various financing agents as reported by these agencies and earlier estimates. Table II (next) provides the information as reported by the household survey. The most striking difference is observed in the coverage rates under NSSF. According to their estimates roughly 26.1% of the population is covered under the NSSF scheme. However, the household survey numbers show a lower coverage rate at 17.8%. The household survey results for other categories (Army and Private Insurance) closely match known figures.
Percentage of Population Covered by Various Financing Agencies- NHA Financing Agency Percent of Population
Covered NSSF 26.1%
CSC 4.4 Army 8.8 IS 1.9 GS+SS 0.4 Private Insurance 8.00 (complete coverage)
4.60 (gap insurance) Mutual Funds 1.6 MOH 42.70 Source: NSSF, CSC, Army, IS, GS, and SS figures obtained from agency or DOS. Private Insurance figures obtained from article by Ammar et.al.
Percent of Population Covered by Various Financing Agencies (Based on Household Survey) Type of Insurance Alone With
another insurance
Total
NSSF 14.6% 3.2% 17.8% Army 8.1% 0.0% 8.1% Private Insurance 7.6% 0.7% 8.3% CSC 4.3% 0.3% 4.6%

31
31
Complementary Insurance 2.5% 2.5% Group Insurance 1.8% 0.1% 1.9% Provided by Municipalities 0.4% 0.4% Insurance at Work 0.8% 0.8% Other Types of Insurance 4.8% 0.3% 5.1% Total 44.9% 4.6% 49.5% Source: NHHEUS Note: This will add up to more than 46% because people have multiple coverage
2. Benefits under Various Public Financing Schemes
Type of Services MOH NSSF CSC Armed Forces Hospitalization 85% 90% 90% 100% Physician No Up to 20000 LL 75% up to 12000LL Up to 20000LL Specialist No Up to 30000 LL 75% up to 12000LL Up to 30000LL Ambulatory No Yes 90% 100% Drugs No Yes Yes Yes Emergency Clinics No as physician and
specialist as physician and specialist as physician and
specialist Emergency Hospitals Hospital as Hospitalization as Hospitalization as
Hospitalization Dental Coverage No No 75% of tariff 100% Ophthalmology No No 75% up to 35000LL 100/80/6000 Immunization Yes at HC No No No Treatment Abroad No No 90% pre admission $10000 pre
admission Open Heart 8,000,000LL 90% As MOH 100% Kidney Transplant 19,000,000LL 90% As MOH 100% Dialysis 135000LL/session 100% 100% 100%
Source: NHA The health care system of Lebanon is experiencing a strong tilt towards curative care, fueled by an oversupply of physicians, hospital beds, abundance of high-tech expensive equipment, poor regulation and third party payment, as well as through the incentives inherent in third party coverage and provider payments. The rise in health expenditures can also be attributed to the high expectations of the population. These expectations are closer to those in developed economies Therefore unless the health care delivery system undergoes re-structuring, under any one of the reform options, the overall cost of medical care cannot but go on rising. 3. Health Care Utilization A National Household Health Expenditure and Utilization Survey (NHHEUS) has recently been completed. This represents the first time a health specific survey has been conducted in Lebanon. A nationally representative sample of roughly 6,500 households was used. The survey addressed the following main questions:
Health Care Use and its determinants Choice of Provider by type of service and its determinants Out-of-pocket expenditures by type of provider and service Insurance Status of population including multiple coverage Gender Equity in health care use The health status and health care use of the elderly
On average Lebanese used 3.6 outpatient visits per year, with males using 3.1 visits per capita per year and females 4.1 visists per year. While regional disparities exist in use rates, these do not appear to be significant.

32
32
This probably reflects the presence of a well-developed market for health services (in the private, NGO, and public sectors). An interesting finding is that unlike many other counties lower income individuals have higher use rates than those in higher income groups. Jordan is the other country in the region where similar results have been observed. This indicates that there does not appear to be inequities in access to health services if these are measured by use rates. Looking at use rates by age group it is seen that those over the age of sixty and those less than the age of five have the highest use rates. Other than those below the age of five use rates for females tends to be higher than males. Those who have insurance have higher use rates than the uninsured. Hospitalization rates hovered around 7 % amongst the population in 1984 (Beirut 1984-AUB). It is currently in the range of 12-13% as the table below indicates:
Ministry of Health discharges in Private hospitals 135,000 NSSF discharges 110,400 Cooperative discharges 18,300 Army Military discharges 44,300 Police discharges 23,000 Security forces discharges 2,800 Private insurance discharges 64,400 Self-Payers 96,000 Total discharges (1998) 494,200 ALOS 4 days Occupancy rate 55% Population 4 millions Private hospital beds 8,300 Public sector beds 810 Total hospital beds- acute 9,110 Hospitalization rate 12.5%
The household survey completed in March 2000 documented that the overall hospitalization rate is 12% per year (1.5% of the population had more than one hospitalization per year). As expected, in the age group (above 60 years), it was 28%, with 4.5% having more than one episode per year! Hospitalization episodes did not vary significantly amongst the regions. Hospitalization (once per year and more than once per year) was more frequent amongst lower income groups: 10.5% and 3.1% for households earning less than 300,000 LL per month, versus 7.8% and 2.2% for households earning more than 5 millions LL per month. Evidently hospitalization rates varied between the insured and the non-insured 10% versus 8 % for one admission per year; 1.6 % versus 1.2% for those admitted more than once per year. Hospitalization for one day (Day surgery, etc.) had similar frequencies across regions, income groups, age and insurance status. When examining hospitalization rates, one does not see inequities in use rates though those with insurance do tend to have a higher use of hospital services than those that are unisured. The age differences persist as in the case of outpatient care. The fact that lower income households have higher use rates than those with higher incomes quite likely reflects the fact that the government as the insurer of the last resort pays for hospital care for all uninsured in Lebanon. Thus those needing hospital care can either use insurance (social or private) or approach the Ministry of Health for finances. With regard to the use of Day Surgery, while the elderly have higher use rates than other age groups one does not observe the differences by insurance status as was seen in the case of outpatient care and hospitalization. This is likely because most insurance policies do not cover day surgery. With dental treatment an interesting observation is that the highest use rates are to be found in the Mount of Lebanon. As dental care is not covered under most insurance policies this probably reflects the fact that the largest number of dentists are to be found in the Mount of Lebanon area. Contrary to the trend with regard to other services, the elderly use far less dental care than those in the age group fifteen to fifty-nine. Similary, those in the lower income groups use less dental care than those in the higher income groups. While some of this might be a function of greater awareness the findings for income and age likely indicate a lack of access (due to the inability to pay).
33
33
4. The Hospital Sector There are a total of 167 hospitals with 11,533 beds in Lebanon – all kinds included. Twelve percent of the hospitals and ten percent of the beds are in the public sector. The predominance of the private sector reflects the results of a financing arrangement where the public sector purchases services from the private sector, lack of coordination on provider payment and rates amongst public sector payers, and the significant investments made by the private sector in the hospital sector. The private hospital association is a powerful lobby and controlling hospital expenditures has been a policy concern for some years.
Distribution of Hospitals and Beds by Sector
Public Hospitals Private Hospitals Total Governorates Number Hospitals
Number Beds
Number Hospitals
Number Beds
Number Hospitals
Number Beds
Beirut 1 14 23 2187 24 2201 Mount Lebanon 4 253 54 3728 58 2981 North Lebanon 4 272 23 1652 27 1929 South 6 311 18 1348 24 1659 Nabatieh 1 76 4 161 5 237 Bekaa 4 220 24 1311 28 1531 Total 20 1146 147 10387 167 11533
Source: MOH Statistics Lebanon has 2.88 beds per 1000 population making this one of the highest ratios in the Middle East. However, the beds are not uniformly distributed. As example, Mount Lebanon has 6.55 beds per 1000 population and Nabatieh has only 0.86 beds per 1000 population.
Beds per Thousand Population Governorate Resident Population Beds/1000 Population Beirut 1,303,169 1.69 Mount Lebanon 607,767 6.55 North Lebanon 807,204 2.38 South 472,105 3.51 Nabatieh 275,372 0.86 Bekaa 539,448 2.84 Lebanon 4,005,065 2.88 Source: NHA Matrices
The war considerably weakened the institutional and financial capacity of the government and public sector and its role in the provision of health care services steadily declined. In the early 1970s public hospitals like Baabda, Quarantina, Zahle and Saida had more than 150 beds each. After the war these hospitals were left with a capacity of 20 beds each and poor quality of services (Ammar et.al. 1999). Non-governmental agencies and the private sector that saw a rapid increase in both their numbers and capacity filled the vacuum. In terms of active beds, there is a total of 810 beds in the 15 public hospitals that exist in the various parts of the country. The average number of beds per hospital, therefore, is 54, close to the average in private hospitals. There is only one hospital with 150 active beds, the number of beds in the remaining ones varying between 15 and 81. The emphasis here is somewhat reversed and concentrates on the areas where the private sector has been deficient. The concentration of hospital beds in relation to population is in the needy areas of the Bekaa and the South. The North, however, remains highly neglected by the private sector and relatively so by the public sector. According to the Syndicate of Private Hospitals, there were 139 private hospitals in 1999 with 8,297 medium stay active beds. The growth of the private hospitals has been phenomenal during the war: from 1,562 beds in 1972, private beds jumped to 5,714 in 1983, to 7,373 in 1994 and to close to 8,000 in 1996. It has been reported that close to 60% of the private hospitals have been established during the war years. This
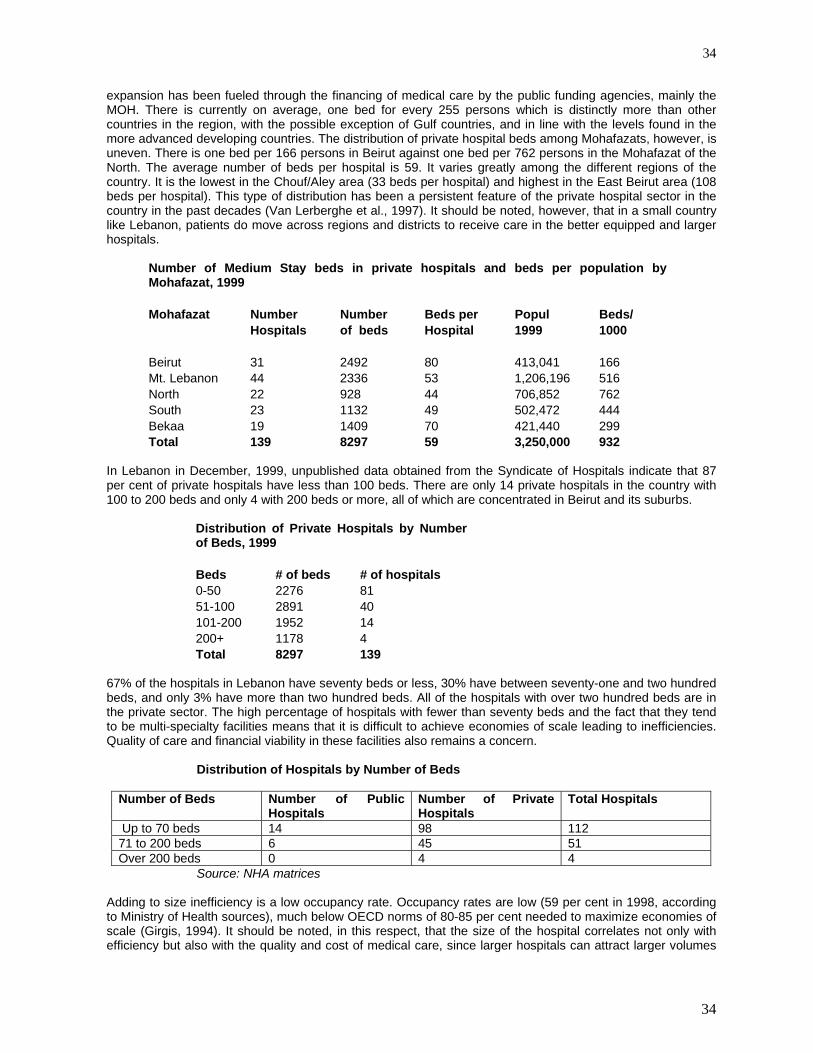
34
34
expansion has been fueled through the financing of medical care by the public funding agencies, mainly the MOH. There is currently on average, one bed for every 255 persons which is distinctly more than other countries in the region, with the possible exception of Gulf countries, and in line with the levels found in the more advanced developing countries. The distribution of private hospital beds among Mohafazats, however, is uneven. There is one bed per 166 persons in Beirut against one bed per 762 persons in the Mohafazat of the North. The average number of beds per hospital is 59. It varies greatly among the different regions of the country. It is the lowest in the Chouf/Aley area (33 beds per hospital) and highest in the East Beirut area (108 beds per hospital). This type of distribution has been a persistent feature of the private hospital sector in the country in the past decades (Van Lerberghe et al., 1997). It should be noted, however, that in a small country like Lebanon, patients do move across regions and districts to receive care in the better equipped and larger hospitals.
Number of Medium Stay beds in private hospitals and beds per population byMohafazat, 1999 Mohafazat Number Number Beds per Popul Beds/ Hospitals of beds Hospital 1999 1000 Beirut 31 2492 80 413,041 166 Mt. Lebanon 44 2336 53 1,206,196 516 North 22 928 44 706,852 762 South 23 1132 49 502,472 444 Bekaa 19 1409 70 421,440 299 Total 139 8297 59 3,250,000 932
In Lebanon in December, 1999, unpublished data obtained from the Syndicate of Hospitals indicate that 87 per cent of private hospitals have less than 100 beds. There are only 14 private hospitals in the country with 100 to 200 beds and only 4 with 200 beds or more, all of which are concentrated in Beirut and its suburbs.
Distribution of Private Hospitals by Numberof Beds, 1999 Beds # of beds # of hospitals 0-50 2276 81 51-100 2891 40 101-200 1952 14 200+ 1178 4 Total 8297 139
67% of the hospitals in Lebanon have seventy beds or less, 30% have between seventy-one and two hundred beds, and only 3% have more than two hundred beds. All of the hospitals with over two hundred beds are in the private sector. The high percentage of hospitals with fewer than seventy beds and the fact that they tend to be multi-specialty facilities means that it is difficult to achieve economies of scale leading to inefficiencies. Quality of care and financial viability in these facilities also remains a concern.
Distribution of Hospitals by Number of Beds
Number of Beds Number of Public Hospitals
Number of Private Hospitals
Total Hospitals
Up to 70 beds 14 98 112 71 to 200 beds 6 45 51 Over 200 beds 0 4 4
Source: NHA matrices Adding to size inefficiency is a low occupancy rate. Occupancy rates are low (59 per cent in 1998, according to Ministry of Health sources), much below OECD norms of 80-85 per cent needed to maximize economies of scale (Girgis, 1994). It should be noted, in this respect, that the size of the hospital correlates not only with efficiency but also with the quality and cost of medical care, since larger hospitals can attract larger volumes

35
35
of patients, hence improving the capabilities of the medical team, and reducing the cost. More than 70 per cent of the hospitals of the private sector are owned by private individuals or groups of doctors. Some have reportedly been financed by banks and investor groups, along with physicians. The rest, such as the Makassed Hospital in Beirut, the St Georges’ Hospital in Beirut, the Benevolent Islamic Hospital in Tripoli and others are owned and operated by non-governmental organizations, usually religious, charitable or community groups. The cost of service in the latter hospitals is generally lower than in the other private hospitals. For the first time, as part of the National Health Accounts activity, a sample of hospital bills paid by government agencies was analyzed to better understand their breakdown. Table below shows that 73% of the amount Ministry of Health’s reimbursements for hospital care was on surgical care. The CSC spent 59% of its hospital reimbursements for surgical care, the ISF 53%, the Army 51%, and the NSSF 60%.
Distribution of Hospital Expenditures (Percent) Agency Non- Surgical
Costs Surgical Costs
Ministry of Health 27% 73% ISF 47% 53% Army 49% 51% NSSF 40% 60% CSC 41% 59% Source: NHA Spreadsheets
Table below shows the distribution of costs associated with hospitalization by category of service. An interesting finding is that diagnostic tests accounted for 19.4% of the costs and drugs and medical supplies for 25.1% of costs. Surgery costs were 15.0% of total costs, Operation Theater accounted for 11.0% of costs, and room and board was 15.9% of costs. Doctor fees were only 8.0% of the costs. These findings would appear to support the perception that hospitals tend to perform large number of investigations and prescribe a number of drugs for each episode of hospitalization as a means of optimizing their revenues. Distribution of hospital reimbursement by typeof service
Ministry of Health ISF Army NSSF CSC
Weighted Average
Surgery 16.7 10.2 11.7 13.1 16.1 15 Doctors fees 8.6 14.4 9.4 11.1 11.4 8 Anesthesia 4.8 2.5 3.1 4.8 4.9 4.2 Room and Board 15.6 13.6 18.4 17 12.8 15.9 Operating Room 12.6 9.6 8.4 18.2 10.3 11 Laboratory tests 12.2 12.3 13.2 10.5 9.2 11 Radiology exams 7.1 4.7 7.3 6.9 4.6 6 MRI 0.5 0.8 0.8 0.9 0.2 0.6 CT scan 2.4 1.8 1.9 0 1 1.8 Medicines 15.7 19.1 14.6 12 19.3 19.1 Miscellaneous 2.8 9 6.2 4.7 3.7 6 Others 1.1 2.1 5.1 0.7 6.4 2.1 Totals 100.1 100.1 100.1 99.9 99.9 100.7
Source: NHA Spreadsheets
In 1984, the Ministry of Health developed a classification for acute general hospitals, that has been used as the basis for contract awards, tariffs and payments. The classification system is based on two aspects: size as well as “hotel” services. Within the reform process that has been started in 1995, a system for hospital accreditation has just been completed. It is expected that the accreditation system will promote and perhaps lead to the legislation of minimal criteria for hospitals and hospital services. This should assist the Ministry in differentiating between
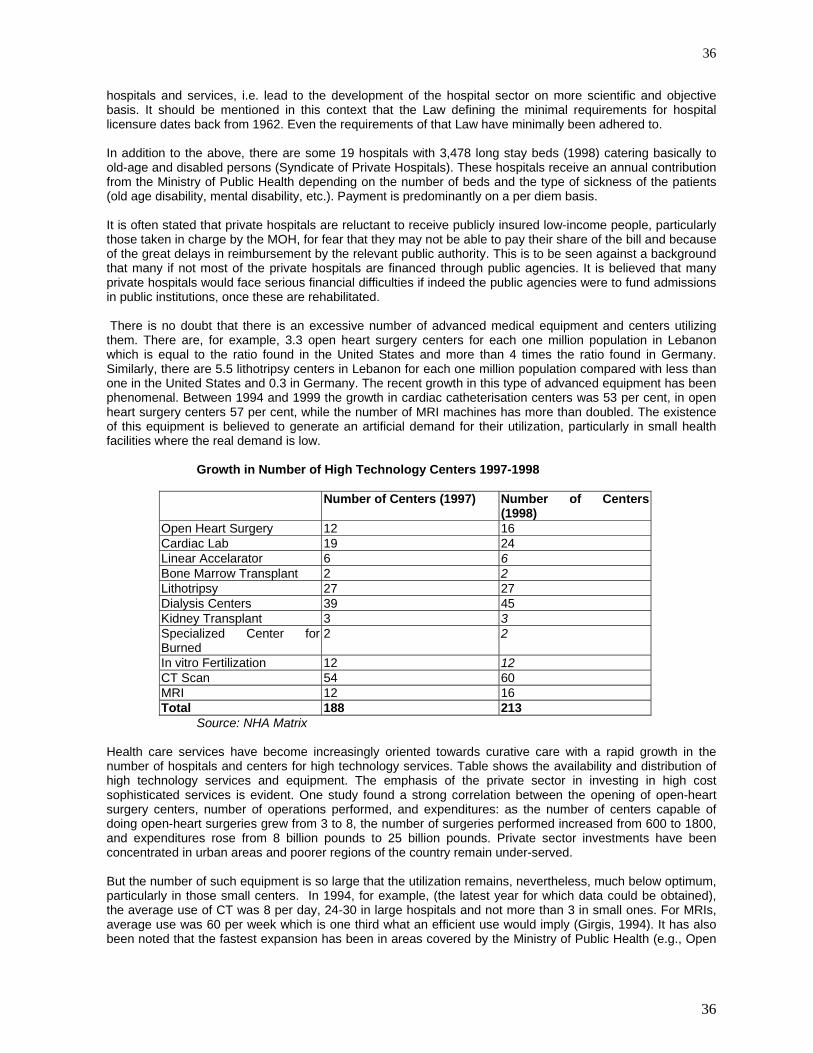
36
36
hospitals and services, i.e. lead to the development of the hospital sector on more scientific and objective basis. It should be mentioned in this context that the Law defining the minimal requirements for hospital licensure dates back from 1962. Even the requirements of that Law have minimally been adhered to. In addition to the above, there are some 19 hospitals with 3,478 long stay beds (1998) catering basically to old-age and disabled persons (Syndicate of Private Hospitals). These hospitals receive an annual contribution from the Ministry of Public Health depending on the number of beds and the type of sickness of the patients (old age disability, mental disability, etc.). Payment is predominantly on a per diem basis. It is often stated that private hospitals are reluctant to receive publicly insured low-income people, particularly those taken in charge by the MOH, for fear that they may not be able to pay their share of the bill and because of the great delays in reimbursement by the relevant public authority. This is to be seen against a background that many if not most of the private hospitals are financed through public agencies. It is believed that many private hospitals would face serious financial difficulties if indeed the public agencies were to fund admissions in public institutions, once these are rehabilitated. There is no doubt that there is an excessive number of advanced medical equipment and centers utilizing them. There are, for example, 3.3 open heart surgery centers for each one million population in Lebanon which is equal to the ratio found in the United States and more than 4 times the ratio found in Germany. Similarly, there are 5.5 lithotripsy centers in Lebanon for each one million population compared with less than one in the United States and 0.3 in Germany. The recent growth in this type of advanced equipment has been phenomenal. Between 1994 and 1999 the growth in cardiac catheterisation centers was 53 per cent, in open heart surgery centers 57 per cent, while the number of MRI machines has more than doubled. The existence of this equipment is believed to generate an artificial demand for their utilization, particularly in small health facilities where the real demand is low.
Growth in Number of High Technology Centers 1997-1998
Number of Centers (1997) Number of Centers (1998)
Open Heart Surgery 12 16 Cardiac Lab 19 24 Linear Accelarator 6 6 Bone Marrow Transplant 2 2 Lithotripsy 27 27 Dialysis Centers 39 45 Kidney Transplant 3 3 Specialized Center for Burned
2 2
In vitro Fertilization 12 12 CT Scan 54 60 MRI 12 16 Total 188 213
Source: NHA Matrix Health care services have become increasingly oriented towards curative care with a rapid growth in the number of hospitals and centers for high technology services. Table shows the availability and distribution of high technology services and equipment. The emphasis of the private sector in investing in high cost sophisticated services is evident. One study found a strong correlation between the opening of open-heart surgery centers, number of operations performed, and expenditures: as the number of centers capable of doing open-heart surgeries grew from 3 to 8, the number of surgeries performed increased from 600 to 1800, and expenditures rose from 8 billion pounds to 25 billion pounds. Private sector investments have been concentrated in urban areas and poorer regions of the country remain under-served. But the number of such equipment is so large that the utilization remains, nevertheless, much below optimum, particularly in those small centers. In 1994, for example, (the latest year for which data could be obtained), the average use of CT was 8 per day, 24-30 in large hospitals and not more than 3 in small ones. For MRIs, average use was 60 per week which is one third what an efficient use would imply (Girgis, 1994). It has also been noted that the fastest expansion has been in areas covered by the Ministry of Public Health (e.g., Open

37
37
heart, MRI, etc.) while there has been virtually no expansion in the areas not covered by the Ministry (e.g., Radiotherapy). This explains, partly at least, the excessive use of the covered equipment and the resulting inflation in the bills presented to the Ministry (Girgis 1994, Van Lerberghe et al., 1997). There is, for apparently the same reason, excessive use of hospitalization (12.5%). It is widely believed by experts that a number of ambulatory cases end up as cases of hospitalization because the first type of service is less covered than the second. Public hospitals have a different kind of oversupply of equipment. Personal contacts with physicians and administrators there revealed the existence of large amounts of equipment, mostly modern and intact, that lay unused because of lack of space, medical personnel, or supporting services. In some cases, the lack of an electrical outlet or appropriate connections or supporting machinery, were reported to be causes for not using a set of modern hospital equipment. The Government proceeded after the end of the civil disturbances to rehabilitate the existing public hospitals and build new ones. From 15 public hospitals with 810 beds, the number will increase to 28 hospitals with close to 2,900 beds. It should be noted that an additional 2,100 beds will be added very soon to the public hospital system; another 1,000 beds are currently being commissioned on the private side. A total of some 3,000 new hospital beds will beef up the Lebanese hospital system. Currently the existing hospitals are occupied at merely 55%! An attempt was made in 1978 to make public hospitals autonomous. The laws were revised in July 1996 (Law 544/96; Law 602/97) and are currently being applied in some of the newly built public hospitals Nabatieh, Dahr El Bachek, Tannourine). The driving force behind autonomy lies in promoting the efficiency of the public hospital. It is anticipated that the Ministry of Health will contract with the public hospitals in much the same manner as it does with private hospitals. In this manner, public hospitals could retrieve their operating costs through contracts with the MOH, the public agencies and private insurance, much as the private hospitals do at this time (the copayment by the patient will be reduced to 5% instead of 15%). It appears that public hospitals are also favoring inpatient care that is reimbursed by the Ministry of health, thus behaving much like the private hospital. Patients, physicians, hospitals seem to opt for hospitalization since it is covered by the MOH. 5. The Health Centers and Ambulatory services
Coverage with Primary Health Care Indicators Population with access to local health services
%
Total 98 Urban 99 Rural 97 Infants fully Immunized DPT 93 OPV 88 Measles Vaccine 84 Hepatitis B vaccine 86
The Primary Health Care system has remained weak. The private sector, especially NGOs, dominates this sector with public involvement being minimal. Private providers include private practitioners, dentists, pharmacists, and medical labs. NGOs own over 80% of the 110 Primary Health Care Centers and 734 dispensaries spread across the country. NGOs have contributed successfully to joint preventive programs carried out by the MOH and UN Agencies. For example, over 200 centers owned and operated by NGOs are affiliated to the reproductive health program and undertake family planning activities, provide antenatal care. NGOS also support the health system by conducting surveys and training programs and provide logistical support by purchasing and distributing essential drugs through a vast network of PHC centers (UNDP, 1997). Ambulatory services tend to respond to consumer demand. Follow-up and continuum of care remain weak, quality of care varies significantly across providers, and community involvement is limited.

38
38
The Ministry of Public Health gives some health services in public hospitals and in a number of public health centers. The Ministry of Social Affairs (MOSA) also gives health assistance at public social centers. These consist of curative and preventive health care services, vaccinations, primary health care, reproductive health services for mothers and children, advice on reproductive health and a set of services aimed at the disabled population. MOSA also assists a number of centers belonging to not-for-profit and non-governmental organizations (NFP/ NGO) that include, among their activities, health services. Some of these centers function properly and some poorly (Van Lerberghe et al., 1997). They operate in the various parts of the country. No thorough survey of these centers has been made so little is known about their effectiveness. Nevertheless, the decline in international donations has forced many of these centers to operate in a way not very dissimilar from the operation of private clinics, that is, charging the patients for the services of the doctor and those of the center itself (Van Lerberghe et al., 1997).” (Tabbara, 2000)
Mohafazat MOH MOSA Red Munici NGO Closed Total Cross palities open Beirut 2 1 10 1 12 Mount Lebanon 5 4 1 5 17 2 30 South Lebanon 4 0 0 20 0 24 North Lebanon 4 0 0 11 1 14 Bekaa 7 2 1 10 2 18 Total 22* 7 2 1 68 6 98 *According to MoPH, in 1999 these total 28including 4 that are expected to open during 2000. Source: The World Bank(1999b)
All in all there are some 700 health centers and clinics in the country (Khoury G., 1999) but the number of persons covered by their services remains limited in relation to the national health system. However, the concentration of the centers in disadvantaged areas makes their importance in the health system greater than their number or their coverage. The carte sanitaire project of 1997 had the following classification:
Active Closed MOH MOSA Municipality
NGO
Health Centers
104 6 25 8 1 76
Dispensaries 754 88 48 122 21 563 It should be mentioned, in this context, that health care, primarily outpatient services, had witnessed a major boost during the difficult years of the war. Political, religious and community groups established clinics, dispensaries and health centers to cater to the needs of their respective population. Health care became an effective tool to promote the image of these various groups. Before the war, in the period of 1958-75, the Office of Social Development (later to become the Ministry of Social Affairs) had also encouraged the development of comprehensive health centers, based on community organization, participation and partial funding. The concept and programs of Primary Health Care were promoted well in advance of the Alma Ata declaration and the world-wide movement for PHC and Health for All. The Ministry of Health has embarked after the war to refurbish its network of health centers and build additional ones (much alike the hospital facilities program). The Health sector rehabilitation program (World Bank-MOH) has also several task forces and programs to promote ambulatory care, empower the communities, train PHC professionals and qada physicians, introduce technology and rehabilitate health centers in both the public and voluntary sectors (NGOs).

39
39
The utilization of health centers has been low. Private clinics have been the main outlet for ambulatory care for 85% of patients in Beirut (Beirut 1984) and for 79% in Lebanon. Hospital outpatient departments were the venue for 8%, NGO clinics for 10%, other facilities for 3%. Only 20% of households had a family physician to take care of their health concerns on a continuous basis. The reimbursement of the cost of ambulatory services is in effect with the various public agencies, except for the Ministry of Health (The MOH offers care at no or minimal cost within its own network). However, since the patient has to pay first, to be reimbursed later, there is evidence that many prefer not go through the process of reimbursement that is considered tedious and time-consuming. As noted earlier, data from the household survey (that has been completed in March 2000) indicated that the utilization of ambulatory services averaged 3.8 visits per person per year. As expected, there were about 6.3 visits per person per year in the age group “less than 5 years” and “those about 60 years of age”. A quarter of the overall population has an outpatient encounter once every month; 3% has more than one episode of care per month. These rates appear to be uniform across the various regions of the country. Utilization was not different between the insured and the non-insured. Of interest however is the reported higher utilization of ambulatory services amongst the lower income groups (6.3 visits per year for households earning less than 300,000 LL per month). One should note that 70% of the survey respondents indicated that they have a health problem (only 27% indicated that they are in good health). About 30% of the respondents acknowledged that they have incurred illness or injury in the previous 30 days, yet less than 25% sought medical care. About 16% of the overall population used dental care services within three months. Women availed themselves of dental services more than men, particularly in the age group 15-60 years. Income had a definite influence on the use of dental services: the higher the income, the greater the utilization. Insurance status did not affect utilization, since dental care is covered by insurance far less frequently than medical care.
6. HUMAN RESOURCES
Manpower and Physical Resources Indicators: 2000 Indicator Per 10,000 pop. Physician 29.2 Dentist 10.4 Pharmacist 6.5 Nursing & midwifery personnel 11.9 Hospital beds 30.7 PHC units & centers 6.9
a) Physicians The plethora of physicians in Lebanon has been an important issue for the medical profession for the past two decades, only to be exacerbated in the past few years. As the table below indicates, Lebanon had 14 new registered physicians in the ten-year period of 1931-40. There was a total of 800 physicians in 1946. Along with the rest of the world, the number of physicians kept on increasing at a very fast rate. Yet even in the decade of 1961-70, there was an average yearly increase of physicians of about 100. In the last three decades, the yearly number of new physicians entering the market has been in the range of 500-700! The increase in the number of registered physicians in the past eight years alone (4,918) has been close to the total pool of registered physicians in 1980 (5,141)! Up until the late 1970s,most of the physicians practicing in Lebanon were graduates of the two medical schools that existed then in Lebanon, namely the American University of Beirut and the Saint Joseph University. A relatively small percentage of physicians had completed their medical education in Western Europe, mainly France. In 1999, as shown herewith, the graduates of Lebanese universities made up only 39% of the total pool and of the new yearly inflow. The graduates from countries in the former USSR (Eastern Europe) constituted in 1999, some 28% of the total pool and 36% of the new inflow. These graduates had received fellowships and grants in the past three decades to study abroad. Lebanese physicians who had
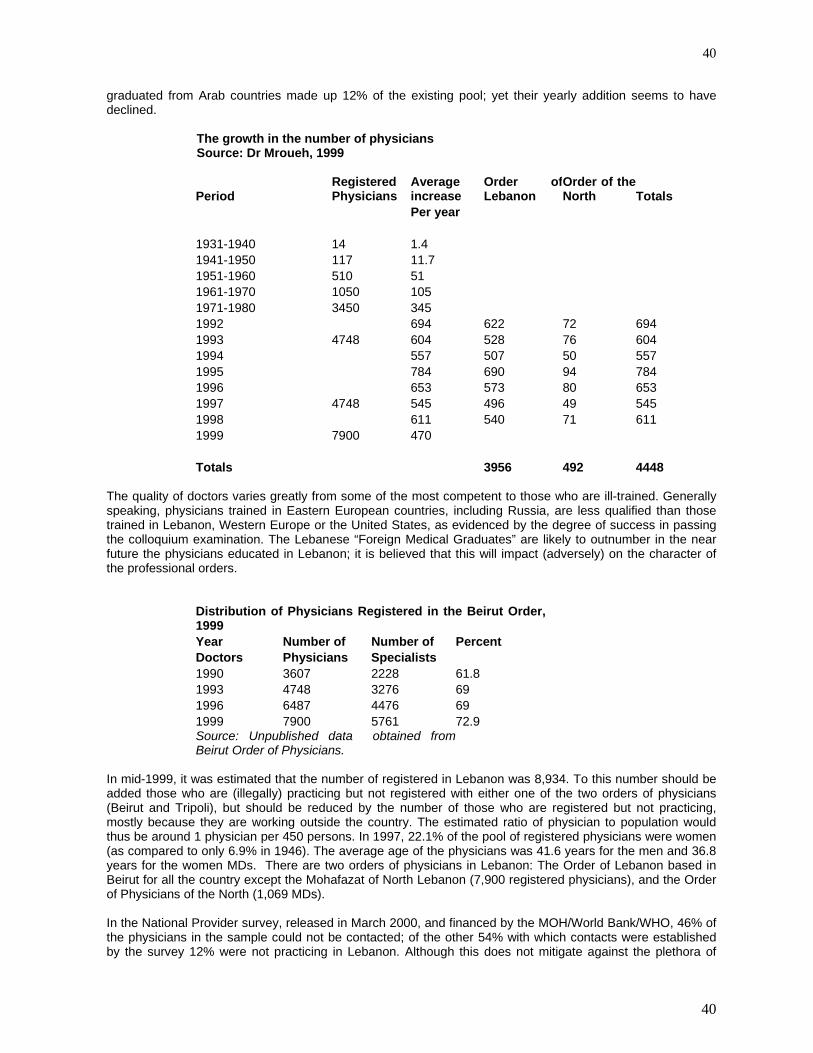
40
40
graduated from Arab countries made up 12% of the existing pool; yet their yearly addition seems to have declined.
The growth in the number of physicians Source: Dr Mroueh, 1999
Period Registered Physicians
Average increase
Order of Lebanon
Order of the North Totals
Per year 1931-1940 14 1.4 1941-1950 117 11.7 1951-1960 510 51 1961-1970 1050 105 1971-1980 3450 345 1992 694 622 72 694 1993 4748 604 528 76 604 1994 557 507 50 557 1995 784 690 94 784 1996 653 573 80 653 1997 4748 545 496 49 545 1998 611 540 71 611 1999 7900 470 Totals 3956 492 4448
The quality of doctors varies greatly from some of the most competent to those who are ill-trained. Generally speaking, physicians trained in Eastern European countries, including Russia, are less qualified than those trained in Lebanon, Western Europe or the United States, as evidenced by the degree of success in passing the colloquium examination. The Lebanese “Foreign Medical Graduates” are likely to outnumber in the near future the physicians educated in Lebanon; it is believed that this will impact (adversely) on the character of the professional orders.
Distribution of Physicians Registered in the Beirut Order,1999 Year Number of Number of Percent Doctors Physicians Specialists 1990 3607 2228 61.8 1993 4748 3276 69 1996 6487 4476 69 1999 7900 5761 72.9 Source: Unpublished data obtained fromBeirut Order of Physicians.
In mid-1999, it was estimated that the number of registered in Lebanon was 8,934. To this number should be added those who are (illegally) practicing but not registered with either one of the two orders of physicians (Beirut and Tripoli), but should be reduced by the number of those who are registered but not practicing, mostly because they are working outside the country. The estimated ratio of physician to population would thus be around 1 physician per 450 persons. In 1997, 22.1% of the pool of registered physicians were women (as compared to only 6.9% in 1946). The average age of the physicians was 41.6 years for the men and 36.8 years for the women MDs. There are two orders of physicians in Lebanon: The Order of Lebanon based in Beirut for all the country except the Mohafazat of North Lebanon (7,900 registered physicians), and the Order of Physicians of the North (1,069 MDs). In the National Provider survey, released in March 2000, and financed by the MOH/World Bank/WHO, 46% of the physicians in the sample could not be contacted; of the other 54% with which contacts were established by the survey 12% were not practicing in Lebanon. Although this does not mitigate against the plethora of

41
41
physicians in Lebanon, this information indicates that the number of physicians in Lebanon may not be that high and highlights the importance of an updated database, for decision-making. It is an established fact that large numbers of physicians register with the Ministry of Health (to obtain their license), with the Order of physicians (to complete the practice requirements), but then elect to emigrate. In two studies by Kronfol in 1979 only 34% of the medical graduates of the American University of Beirut between 1935-1974 (40 years), were practicing in Lebanon. In a follow up of that study, in 1987, only 16% of the 1960-69 medical graduates were practicing in Lebanon. There is no established mechanism to update the records of physicians.
Physicians Registered in the Beirut Order of Physicians Country/Region Number Percent 1999 % Lebanon 3100 39.2 170 38.3 Eastern Europe 2234 28.3 180 36.2 Western Europe 1377 17.4 52 11.1 Arab Region 957 12.1 38 8.1 North America 40 0.51 14 3 Other 192 2.43 16 3.4 Total 7900 100 470 100 Source: Unpublished data obtained from Beirut Orderof Physicians.
There is a discrepancy in the distribution of physicians across regions, with a concentration in the Greater Beirut area. In November 1999, there was 1 registered doctor per 125 persons in Beirut as against 1 per 417 persons in Mount Lebanon and 1 per 665 persons in the Bekaa.. This is to be expected since the major hospitals are also situated in the Greater Beirut area. Since the ratio of hospital beds to population is more or less normal, the ratio of hospital beds per physician is unusually low compared with other countries. While this ratio is between 2 and 3 hospital beds per physician in most countries, it is less than one hospital bed per physician in Lebanon. With the rapid increase in the number of doctors mentioned earlier, this situation is likely to worsen in the near future.
Distribution of physicians by Mohafazat andspecialization 1999 Source: Order of Physicians Mohafazat Surgical Medical Pediatrics General Totals Percent Beirut 835 878 257 847 2817 32.4 Mount Lebanon 998 886 294 1033 3211 36.9 South Lebanon 385 278 114 263 1040 12.0 Beka'a 229 126 58 204 617 7.1 North Lebanon 328 248 98 341 1015 11.7 Totals 2775 2416 821 2688 8700 100
Around 70 per cent of physicians registered in the Beirut Order of Physicians (which includes 88 per cent of total registered physicians) are specialized and only 30 per cent are in the field of general or family medicine. The ratio of specialists to generalists has been increasing. In 1990, for example, the proportion of specialists was 61 per cent of total. Medical consultations for even the most routine kind which should be dealt with by the family doctor or even para-medical personnel are obtained from specialists. This generally adds to the cost of health care, whether covered by insurance or out-of-pocket, or increases unmet needs for persons unable or unwilling to pay the specialists’ fees. It is a documented fact that physicians control 75% of all health expenditures. Hence an oversupply of MDs could well drive upwards the cost of medical care, through “over-doctoring”. A legislation enacted in the seventies required medical graduates to opt for practice for two years in the rural areas or opt for specialty training. Although the law intended to encourage practice outside the cities, the effect has been to encourage specialty training. Rural areas are currently served primarily by physicians educated outside Lebanon. There is a significant number of unemployed or underemployed physicians in the country. Furthermore, according to the Order of Physicians, the income of physicians has declined and public and private hospitals and health institutions are now claiming a percentage of that income for hospital privileges extended to doctors (Khoury G, 1999).

42
42
Physicians, as per specialty Source: Dr Mroueh, 1999 Number Percent Generalists 2310 31.2 Specialists 5102 68.8 Surgical specialties 2475 45.8 Medical specialties 2209 40.8 Pediatric specialties 724 13.4 Totals 7412 100 5408 100
Policies should be devised to control both the quantity and quality of physicians. The level of the Colloquium should be maintained at high standards. There have been calls, particularly from the Order of Physicians, to stop the licensing of new schools of medicine and impose quotas on entrants into the existing schools. But direct government intervention in determining the supply of doctors is said to run into conflict with private education and the prerogatives of the private educational sector. In May 2000, licenses were granted to two additional medical schools in the country: The Lebanese-American University and the Balamand University. This brings the total number of medical schools licensed in the country to six. Recommendations are being made by the Order of Physicians to introduce the “numerus clausus” to limit the number of admissions to medical schools in and outside Lebanon. Other suggestions included a “lottery” to choose the selected applicants. A minimal grade at a special entrance examination or at the official secondary school leaving certificate (the Baccalaureate II) has also been suggested as a potential measure to stem the flow of medical graduates. There has also been recommendations to encourage medical schools in Lebanon to cut down on the number of students admitted to the medical schools, by offering these schools financial incentives to counter balance the loss of tuition income. The great dependence of the health system on specialized physicians and the relative shortage of doctors in the area of general and family medicine should be redressed. It must be noted that the fees set by the NSSF for consultations by general practitioners is two-thirds those for specialists. Dialogue between the government authorities and universities towards redressing the balance between generalists and specialists should be pursued. The majority of physicians practice independently (solo practice) and are compensated on a fee-for-service modality. The overabundance of physicians may be a factor that may assist the acceptance of prepayment, capitation or employment (salaried). Similarly the grouping of physicians into Group practice schemes such as Preferred Physician Providers Group (PPPG) is likely to become more acceptable. As concerns medical education, one should note that medical schools in Lebanon have, each on its own, developed standards for admission based on entrance examinations (national and in some cases international), as well as maximal number of accepted students. It is generally agreed that the graduates of the “Lebanese” medical schools have excellent standards, by any comparison. Thus, to request and or invite these medical schools to cut down on the number of admissions is unlikely to be accepted. Tuition paid by medical students make up more than half the budget of the medical schools and its associated medical center. In addition, graduates are their source for housestaff, residents and future faculty members. It may be worthwhile to invite medical schools in Lebanon to diversify into graduate medical education, or postdoctoral education. Lebanon and the Region are in need of academic education to prepare physicians to become specialists in the many different specialties of medicine. This suggestion may reduce the number of physicians seeking training abroad, particularly if such programs are joint programs with academic medical centers in the USA or Europe. Postgraduate education will also assist in the development of fellowship programs, research and faculty members. Financial incentives may be introduced to encourage the development of postgraduate education in needed specialties for Lebanon and the region such as Gerontology, Emergency Medicine, Forensic Medicine, Administration, Quality Care, etc. Degrees may be considered for the successful achievement of these programs, such as the Post-MD Masters program. Postgraduate medical education could also serve to improve the quality of Lebanese foreign medical graduates, particularly those who fail the colloquiom licensing examination. An experiment in the 1980s was not deemed successful in “rehabilitating” a cohort of FMG, on the basis that their basic medical and science foundation was not as strong and solid as anticipated. This attempt can be repeated. This would also discourage weaker students from receiving education abroad, if they were to know that they will have to face

43
43
rigid requirements for licensure, including additional years of academic preparation, rather than simply sitting for an examination. The licensure examination could also be strengthened considerably and standardized, as one aspect of quality control. There have also been proposals to invite the medical schools in Lebanon to develop formal association with the larger public hospitals, and be involved with their management and educational programs. This would support the image as well as the quality of care in the public hospitals, as well as provide additional training slots for medical graduates. There had been such a partnership prior to the civil war between the American University of Beirut and the Saida Government Hospital, that was deemed satisfactory by all parties then. A National Council for Medical Education had been proposed in the 1983 reform. Draft legislation had been prepared but could not be passed then, as the political situation deteriorated. It is advised that this idea be examined again, to provide an established mechanism for steering medical education in the country. b) Dentists Dentists face almost the same situation as the physicians in Lebanon. It is reported that there are currently 3,471 dentists registered in the Order of dentists of Lebanon and another 400 registered in the Order of dentists of North Lebanon (The Order of dentists had been established in 1949 but had then split in 1966 (Al Mustaqbal, Jan 2000) Distribution of dentists by Mohafazat %
1985 1994 Number 1994 Percent 1994 Beirut 35 28.7 828 28.7 Mount Lebanon 24 46.2 1331 46.2 North Lebanon 12 9.4 270 9.4 South Lebanon 5 8.1 233 8.1 Bekaa 4 1.5 43 1.5 Unspecified 20 6.1 178 6.2 Total 100 100 2883 100 A study by Dr Doughan reveals a concentration of dentists in Beirut and Mount Lebanon. This is believed to be due to the effective economic demand for dental care in the more affluent regions of the country. One must remember that dental care does not have as extensive a coverage by funding agencies as medical care. Dental graduates from universities in Lebanon made up 41% of the pool of dentists in 1994. The Saint Joseph University and the Lebanese University graduates each some 40 new dentists yearly, while “foreign dental graduates” return to Lebanon at the rate of some 150 every year. These FDG have been educated primarily in Eastern Europe, France and in Arab countries.
Distribution by country of Graduation 1994
Number Percent Lebanon 1181 41.0 Roumania 426 14.8 USSR 382 13.3 France 194 6.7 Syria 167 5.8 Egypt 150 5.2 Bulgaria 103 3.6 Other 280 9.7 Totals 2883 100
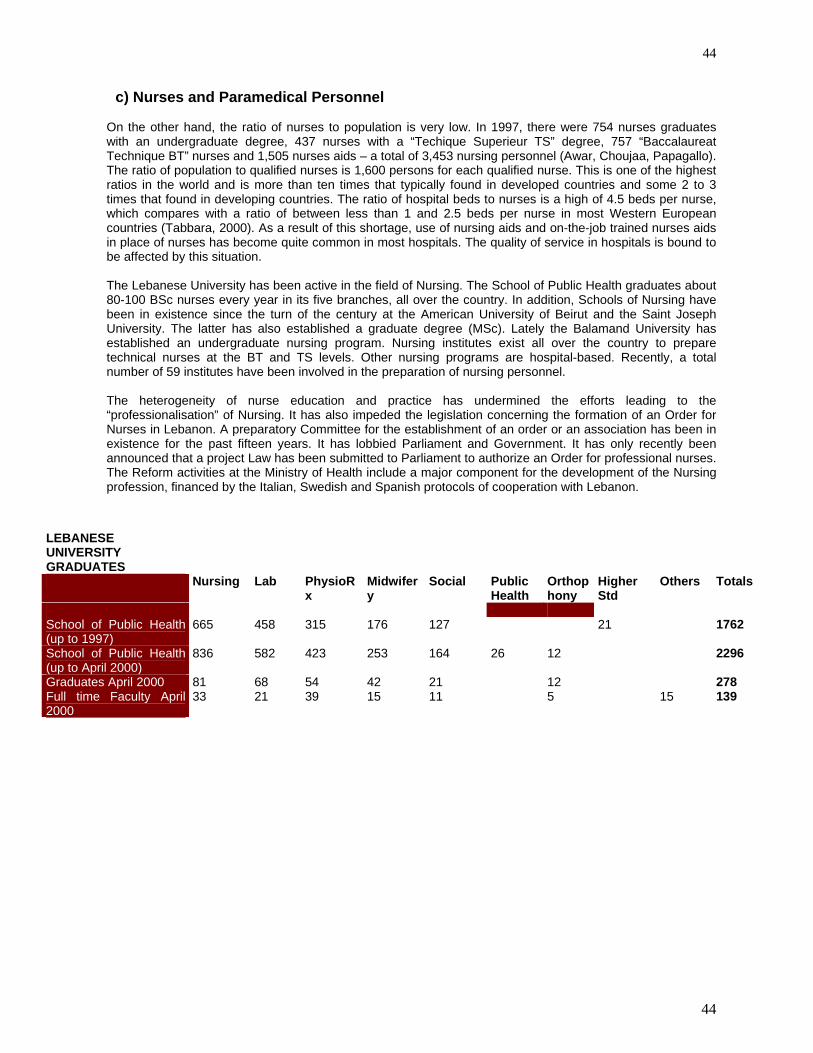
44
44
c) Nurses and Paramedical Personnel On the other hand, the ratio of nurses to population is very low. In 1997, there were 754 nurses graduates with an undergraduate degree, 437 nurses with a “Techique Superieur TS” degree, 757 “Baccalaureat Technique BT” nurses and 1,505 nurses aids – a total of 3,453 nursing personnel (Awar, Choujaa, Papagallo). The ratio of population to qualified nurses is 1,600 persons for each qualified nurse. This is one of the highest ratios in the world and is more than ten times that typically found in developed countries and some 2 to 3 times that found in developing countries. The ratio of hospital beds to nurses is a high of 4.5 beds per nurse, which compares with a ratio of between less than 1 and 2.5 beds per nurse in most Western European countries (Tabbara, 2000). As a result of this shortage, use of nursing aids and on-the-job trained nurses aids in place of nurses has become quite common in most hospitals. The quality of service in hospitals is bound to be affected by this situation. The Lebanese University has been active in the field of Nursing. The School of Public Health graduates about 80-100 BSc nurses every year in its five branches, all over the country. In addition, Schools of Nursing have been in existence since the turn of the century at the American University of Beirut and the Saint Joseph University. The latter has also established a graduate degree (MSc). Lately the Balamand University has established an undergraduate nursing program. Nursing institutes exist all over the country to prepare technical nurses at the BT and TS levels. Other nursing programs are hospital-based. Recently, a total number of 59 institutes have been involved in the preparation of nursing personnel. The heterogeneity of nurse education and practice has undermined the efforts leading to the “professionalisation” of Nursing. It has also impeded the legislation concerning the formation of an Order for Nurses in Lebanon. A preparatory Committee for the establishment of an order or an association has been in existence for the past fifteen years. It has lobbied Parliament and Government. It has only recently been announced that a project Law has been submitted to Parliament to authorize an Order for professional nurses. The Reform activities at the Ministry of Health include a major component for the development of the Nursing profession, financed by the Italian, Swedish and Spanish protocols of cooperation with Lebanon.
LEBANESE UNIVERSITY GRADUATES
Nursing Lab PhysioRx
Midwifery
Social Public Health
Orthophony
Higher Std
Others Totals
School of Public Health (up to 1997)
665 458 315 176 127 21 1762
School of Public Health (up to April 2000)
836 582 423 253 164 26 12 2296
Graduates April 2000 81 68 54 42 21 12 278 Full time Faculty April 2000
33 21 39 15 11 5 15 139
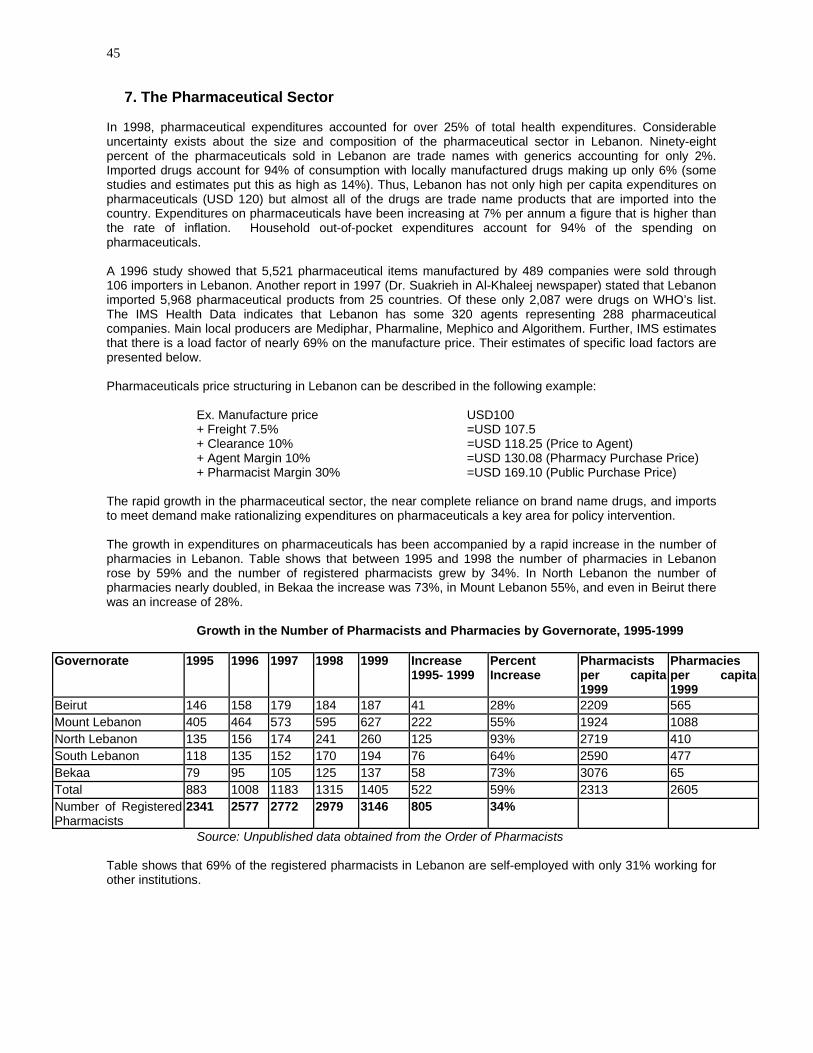
45
7. The Pharmaceutical Sector In 1998, pharmaceutical expenditures accounted for over 25% of total health expenditures. Considerable uncertainty exists about the size and composition of the pharmaceutical sector in Lebanon. Ninety-eight percent of the pharmaceuticals sold in Lebanon are trade names with generics accounting for only 2%. Imported drugs account for 94% of consumption with locally manufactured drugs making up only 6% (some studies and estimates put this as high as 14%). Thus, Lebanon has not only high per capita expenditures on pharmaceuticals (USD 120) but almost all of the drugs are trade name products that are imported into the country. Expenditures on pharmaceuticals have been increasing at 7% per annum a figure that is higher than the rate of inflation. Household out-of-pocket expenditures account for 94% of the spending on pharmaceuticals. A 1996 study showed that 5,521 pharmaceutical items manufactured by 489 companies were sold through 106 importers in Lebanon. Another report in 1997 (Dr. Suakrieh in Al-Khaleej newspaper) stated that Lebanon imported 5,968 pharmaceutical products from 25 countries. Of these only 2,087 were drugs on WHO’s list. The IMS Health Data indicates that Lebanon has some 320 agents representing 288 pharmaceutical companies. Main local producers are Mediphar, Pharmaline, Mephico and Algorithem. Further, IMS estimates that there is a load factor of nearly 69% on the manufacture price. Their estimates of specific load factors are presented below. Pharmaceuticals price structuring in Lebanon can be described in the following example:
Ex. Manufacture price USD100 + Freight 7.5% =USD 107.5 + Clearance 10% =USD 118.25 (Price to Agent) + Agent Margin 10% =USD 130.08 (Pharmacy Purchase Price) + Pharmacist Margin 30% =USD 169.10 (Public Purchase Price)
The rapid growth in the pharmaceutical sector, the near complete reliance on brand name drugs, and imports to meet demand make rationalizing expenditures on pharmaceuticals a key area for policy intervention. The growth in expenditures on pharmaceuticals has been accompanied by a rapid increase in the number of pharmacies in Lebanon. Table shows that between 1995 and 1998 the number of pharmacies in Lebanon rose by 59% and the number of registered pharmacists grew by 34%. In North Lebanon the number of pharmacies nearly doubled, in Bekaa the increase was 73%, in Mount Lebanon 55%, and even in Beirut there was an increase of 28%.
Growth in the Number of Pharmacists and Pharmacies by Governorate, 1995-1999
Governorate 1995 1996 1997 1998 1999 Increase 1995- 1999
Percent Increase
Pharmacists per capita 1999
Pharmacies per capita 1999
Beirut 146 158 179 184 187 41 28% 2209 565 Mount Lebanon 405 464 573 595 627 222 55% 1924 1088 North Lebanon 135 156 174 241 260 125 93% 2719 410 South Lebanon 118 135 152 170 194 76 64% 2590 477 Bekaa 79 95 105 125 137 58 73% 3076 65 Total 883 1008 1183 1315 1405 522 59% 2313 2605 Number of Registered Pharmacists
2341 2577 2772 2979 3146 805 34%
Source: Unpublished data obtained from the Order of Pharmacists Table shows that 69% of the registered pharmacists in Lebanon are self-employed with only 31% working for other institutions.
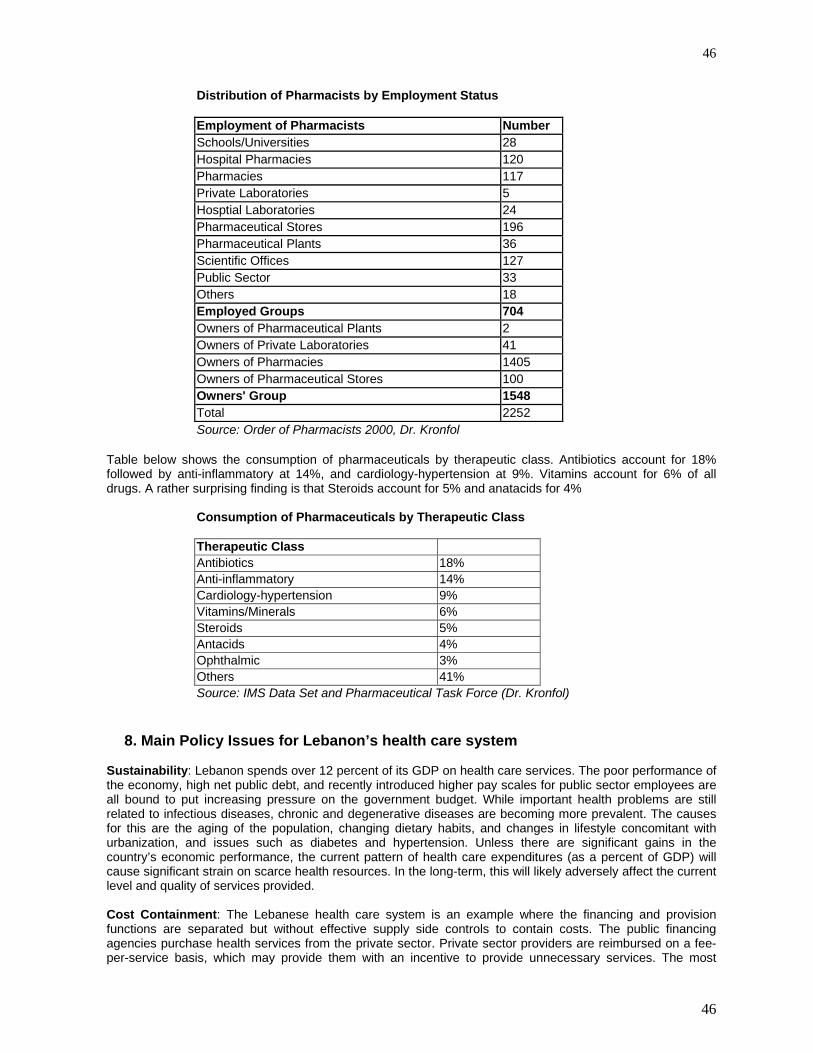
46
46
Distribution of Pharmacists by Employment Status Employment of Pharmacists Number Schools/Universities 28 Hospital Pharmacies 120 Pharmacies 117 Private Laboratories 5 Hosptial Laboratories 24 Pharmaceutical Stores 196 Pharmaceutical Plants 36 Scientific Offices 127 Public Sector 33 Others 18 Employed Groups 704 Owners of Pharmaceutical Plants 2 Owners of Private Laboratories 41 Owners of Pharmacies 1405 Owners of Pharmaceutical Stores 100 Owners' Group 1548 Total 2252 Source: Order of Pharmacists 2000, Dr. Kronfol
Table below shows the consumption of pharmaceuticals by therapeutic class. Antibiotics account for 18% followed by anti-inflammatory at 14%, and cardiology-hypertension at 9%. Vitamins account for 6% of all drugs. A rather surprising finding is that Steroids account for 5% and anatacids for 4%
Consumption of Pharmaceuticals by Therapeutic Class Therapeutic Class Antibiotics 18% Anti-inflammatory 14% Cardiology-hypertension 9% Vitamins/Minerals 6% Steroids 5% Antacids 4% Ophthalmic 3% Others 41% Source: IMS Data Set and Pharmaceutical Task Force (Dr. Kronfol)
8. Main Policy Issues for Lebanon’s health care system Sustainability: Lebanon spends over 12 percent of its GDP on health care services. The poor performance of the economy, high net public debt, and recently introduced higher pay scales for public sector employees are all bound to put increasing pressure on the government budget. While important health problems are still related to infectious diseases, chronic and degenerative diseases are becoming more prevalent. The causes for this are the aging of the population, changing dietary habits, and changes in lifestyle concomitant with urbanization, and issues such as diabetes and hypertension. Unless there are significant gains in the country’s economic performance, the current pattern of health care expenditures (as a percent of GDP) will cause significant strain on scarce health resources. In the long-term, this will likely adversely affect the current level and quality of services provided. Cost Containment: The Lebanese health care system is an example where the financing and provision functions are separated but without effective supply side controls to contain costs. The public financing agencies purchase health services from the private sector. Private sector providers are reimbursed on a fee-per-service basis, which may provide them with an incentive to provide unnecessary services. The most

47
47
expensive health services (cancer, dialysis, kidney transplant, open heart surgery, chronic diseases, and burns) are provided either free or at minimal copayment by government agencies. The Ministry also pays for hospitalization costs for all uninsured and given data gaps it is possible that private insurance shifts the burden of high cost services to it. All of these factors contribute to cost escalation. Provider Payment reforms are key to cost containment. In this regard the Ministry of Health started implementing a flat rate system for same day surgical procedures in May 1998. An analysis conducted on the potential impact of extending this to other surgical procedures indicated that this might lead to lower costs. The Table below shows that each of the principal financing intermediaries has a separate supervising Ministry. This makes inter-agency coordination difficult. At a minimum consideration should be given to setting up an institution that can coordinate payments, monitor utilization, and oversee providers across the different public financing agencies.
Financing Agents and their Supervisory Ministry
Financing Agency Supervising Ministry NSSF Ministry of Labor CSC Presidency of the Council of Ministers Army Ministry of National Defense ISF Ministry of Interior GS+SS Ministry of Interior Private Insurance Ministry of Economy and Commerce Mutual Funds Ministry of Housing and Cooperatives MOH Ministry of Health
Source: Ammar et.al., 1999
Centralized budgeting and managerial controls extend little authority and discretion to managers of public facilities. Hence, managers are provided with few incentives to engage in cost containment efforts. The Ministry of Health has initiated efforts to make its hospitals autonomous. This effort needs to be strengthened and expanded. Rationalizing Capacity in the Hospital Sector: The Lebanon NHA findings draw attention to the fact that 62% of public expenditures are spent on hospital care. Indiscriminate capital investment in the private hospital sector and little regulation has resulted in a surge in the number of private hospitals. With 2.88 beds per 1000 population Lebanon has the highest ratio of bed to population among MENA countries participating in the regional NHA initiative. However, 67% of these beds are in hospitals with less than 70 beds. This coupled with the multi-specialty nature of these facilities leads to inefficiencies. Quality of care and financial viability of many of these facilities remains a concern. Reallocating expenditures from Curative to Primary Health Care: Under the present breakdown of expenditures, less than 10 percent of resources are allocated to primary health care. Not only are few resources spent on primary and preventive health care services, it appears the NGO and public systems do not have the capacity to fully utilize these resources. Investments in preventive measures (including changes in lifestyle) are likely to result in substantially limiting curative expenditures in the future. In the wake of the rapid expansion of the curative sector, the primary health care sector has languished. There is a need to both strengthen the capacity of the system to deliver primary health care services as well as increase funding for these services. Controlling Capital Investment in Medical Technology: The Lebanon NHA study reiterates previous findings that government reimbursements for high cost services has resulted in a rapid growth of high technology centers. This in turn has contributed to cost escalation. As example, as the number of centers capable of doing open-heart surgeries grew from 3 to 8, the number of surgeries performed increased from 600 to 1800, and expenditures rose from 8 billion pounds to 25 billion. The Ministry of Health spends about 75% of its budget on paying for curative care in the private sector. For efforts at cost containment to be effective policies need to be developed that will control investments in medical technology. Rationalizing Expenditures on Pharmaceuticals: Pharmaceuticals accounted for over 25% of total health expenditures. Ninety-eight percent of the pharmaceuticals sold in Lebanon are trade names with generics accounting for only 2%. Imported drugs account for 94% of consumption with locally manufactured drugs making up only 6%. Thus, Lebanon has not only high per capita expenditures on pharmaceuticals (USD 120)
48
48
but almost all of the drugs are trade name products that are imported into the country. Expenditures on pharmaceuticals have been increasing at 7% per annum a figure that is higher than the rate of inflation. Between 1995 and 1998 the number of pharmacies grew by 59% and the number of registered pharmacists grew by 34%. The high level of expenditures also is likely due to the lack of a significant policy for using generic drugs, as substitutes for other equivalently higher prices prescription drugs. Hence, to effectively contain overall health care expenditures, the Government of Lebanon should initiate policies for improving the efficiency by which pharmaceuticals are imported, distributed and sold in the country and improve its management and oversight of this sector. Expanding health insurance coverage to the uninsured and limiting multiple coverage: In Lebanon health insurance is tied with employment and those in low income households are less likely to be employed in the formal sector. Further the presence of multiple insurance coverage also allows for inefficiencies, double dipping, over consumption of health services, and cost escalation. It is very difficult to obtain information from private insurance companies on premiums, claims, loss ratios, and profits. The government needs to improve its management of the private insurance market and reduce multiple insurance coverage if it wants to control health care costs. Equity: Household out-of-pocket expenditures account for 69% health expenditures in Lebanon. The household survey shows that there does not appear to be inequities in access to health care. Lower income households tend to use more health care per capita than higher income households. It is only with regard to dental care that we observe inequities in access. However, when one analyzes the burden of out-of-pocket expenditures it appears that the burden is inequitably distributed with lower incomes households spending a much greater proportion of their incomes on health than higher income households. Even though the Ministry of Health as the insurer of last resort pays for hospitalization costs for all insured (including those with low incomes) there is no formal financing mechanism for primary and preventive health services. As part of the health financing reform the government might want to consider designing a targeted program to provide quality basic health services for those with low incomes.

49
49
VI. Long Term Care Facilities for the long term care of patients, in Lebanon, fall into two main categories:
1. The long term or chronic hospitals: These are medical facilities that specialize in the treatment of patients in need of LT care such as the patients with special needs (Handicapped) of all kinds, whether physical, mental or geriatric. These are located all over the country, number 22 and offer close to 5,000 beds for care
2. The geriatric homes for the older population: these are facilities that provide care for the older
population, some of whom may still be able to carry on with the activities of daily living; others may need assistance in that respect as well. These number also about 22 all over the country.
Both of these facilities have been traditionally established, managed, operated and financed by philanthropic, charitable, usually religious, organizations. Both of these facilities are supported by the Government. However, whereas the first group is supported by the Ministry of Health, the second group is supported by the Ministry of Social Affairs. Both receive donations, gifts, financial assistance from individuals and communities. Fund raising is usually carried by the respective Board of Trustees (or Directors, whatever the appelation). These faciliites tend to be actively supported by philanthropists, within our culture. The medical facilities, i.e. the long term chronic hospitals are usually large facilities. Some have evolved from being facilities to treat tuberculosis (sanatoria) or mental illnesses in the past. They resemble monasteries and religious buildings in their design (dormitories, refractories, etc.) although newer wings have been added and the older ones have been refurbished and upgraded. These facilities are usually located outside the capital, Beirut, in its immediate suburbs. The Ministry of Health subsidies these facilities by paying a daily rate for each of its patients. Hence the income related to the patient-days in the facility. 1. Long Term Hospitals LONG TERM HOSPITALS Beds Location Kind of pts Al Amal for Mental Handicapped 20 Broumana Mental Handicapped Al Azounieh 100 Azounieh Respiratory problems Al Fanar Mental Hospital 200 Zahrani Mental problems Al Ma'had Al Lubnani Lil Muaqeen 64 Beit Chabab Physiotherapy
Al Roum 110 Beirut Physiotherapy; Eye Cares for 400 older people in their homes
Al Saideh 606 Antelias Al Salib 957 Biqnaya Bhannis 150 Bhannes Dar Al Ajaza Ain Wa Zein 64 Ain Wa Zein Dar Al Ajaza Al islamia 800 Beirut All kinds of therapy Dar Al Diayafa Sami Qudsi 10 Atchaneh Geriatrics Dar Al Massih Al Malaq 88 Nahr El Kalb Sisters of the Cross 332 Deir Al Qamar Dar Al Rahma 548 Ain Saadeh Dar As Salam 140 Saida Geriatrics Dar El Sahel 36 Aramoun Hamlin 70 Chbanieh Respiratory Jamiyat Al Khadamat Al Ijtimaiah 128 Tripoli Markaz Al Ta'heel Al Toubi 83 Ouzai Phys Hand Rahibat Al Salib Deir Al Qamar 332 Feir Al Qamar TOTALS 4838

50
50
2. Geriatric Homes
The Geriatric homes are new additions to the social structure. The religious socio-cultural environment used to favor the care of the older population in their homes, within their families. Support used to be provided by the more junior members of the extended families. To a large extent, this remains the case. These geriatric homes are needed for the older people who may not have progeny or direct relatives to care for, particularly if they live in the major cities. The geriatric homes are also established, managed and operated by charitable, voluntary, usually religious organizations. They receive assisatnce from the Ministry of Social Affairs to continue their operations. The community at large also supports financially these institutions.
GERIATRIC HOMES
Beds Established
Inayat Bil Tofl wal Oum 35 1985 Al Umr Al Madid- Dar Al Aytam 60 1992 Dar Al Ajaza Al Islamia 800 1954 Saint Georges Sami Al Kudsi Residence- Bikfaya Dar Al Inaya- Jbeil Dar Al Rahma - Ain Saadeh 700 1949 Ain Wa Zein - Al Chouf 74 1989 Al Umr Al Tawil - Bhirsaf 120 1989 Ma'wa Al Ajaza Al Marouni - Furn el Chebak 80 1950 Beit Al Ajaza Saidat Al Alam - Jounieh Hamlin - Hamana 100 1971 Ma'wa Al Ajaza Al Faransi 70 1904 Al Sahel Hospital - Aramoun 32 1990 Beit Al Inayat Al Ilahia - Zghorta 28 Ma'wa Mar Yousef - Batroun 50 1973 Jamiyat Al Khadamat Al Ijtimaia - Tripoli150 1954 Jamiyat Hamilat Al Saleeb - Tripoli 18 1936 Jamiyat Al Bir Al Massihi Al Orthodoxi 45 1984 Ma'wa Al Ajaza - Tel Chiha 40 1957 Dar Al Salam Lil Riaya Al Ijtimaiya -Saida 69 1989 Totals 2471 Source: Al Mustachfa Wal Siha - Dec 1999
ACUTE CARE CHRONIC CARE
REGION HOSPITALS BEDS HOSPITALS BEDS BEIRUT 33 2350 4 861 METN 22 1269 10 1860 CHOUF/ALEY 14 533 3 430 KESROUAN/JBEIL 8 618 2 105 BEKAA 20 838 0 0 NORTH 21 1003 2 150 SOUTH 22 1249 1 200 TOTALS 140 7860 22 3606 SOURCE: MAKASSED
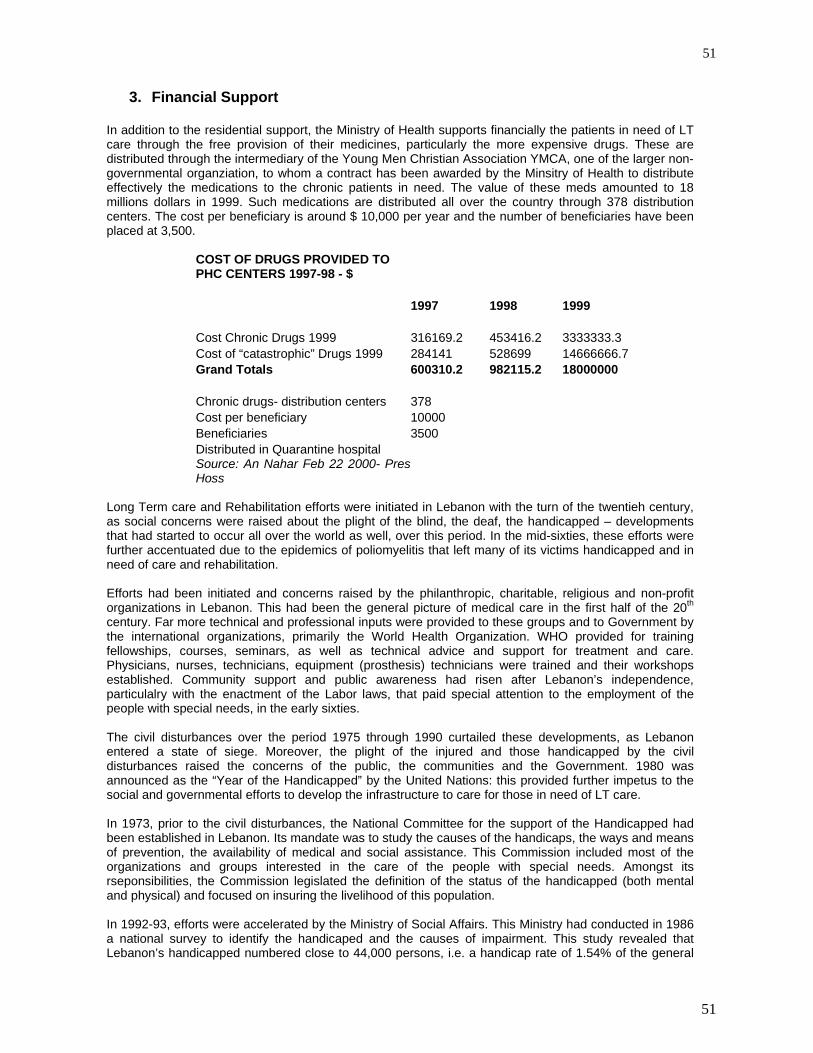
51
51
3. Financial Support
In addition to the residential support, the Ministry of Health supports financially the patients in need of LT care through the free provision of their medicines, particularly the more expensive drugs. These are distributed through the intermediary of the Young Men Christian Association YMCA, one of the larger non-governmental organziation, to whom a contract has been awarded by the Minsitry of Health to distribute effectively the medications to the chronic patients in need. The value of these meds amounted to 18 millions dollars in 1999. Such medications are distributed all over the country through 378 distribution centers. The cost per beneficiary is around $ 10,000 per year and the number of beneficiaries have been placed at 3,500.
COST OF DRUGS PROVIDED TO PHC CENTERS 1997-98 - $ 1997 1998 1999 Cost Chronic Drugs 1999 316169.2 453416.2 3333333.3 Cost of “catastrophic” Drugs 1999 284141 528699 14666666.7 Grand Totals 600310.2 982115.2 18000000 Chronic drugs- distribution centers 378 Cost per beneficiary 10000 Beneficiaries 3500 Distributed in Quarantine hospital Source: An Nahar Feb 22 2000- PresHoss
Long Term care and Rehabilitation efforts were initiated in Lebanon with the turn of the twentieh century, as social concerns were raised about the plight of the blind, the deaf, the handicapped – developments that had started to occur all over the world as well, over this period. In the mid-sixties, these efforts were further accentuated due to the epidemics of poliomyelitis that left many of its victims handicapped and in need of care and rehabilitation. Efforts had been initiated and concerns raised by the philanthropic, charitable, religious and non-profit organizations in Lebanon. This had been the general picture of medical care in the first half of the 20th century. Far more technical and professional inputs were provided to these groups and to Government by the international organizations, primarily the World Health Organization. WHO provided for training fellowships, courses, seminars, as well as technical advice and support for treatment and care. Physicians, nurses, technicians, equipment (prosthesis) technicians were trained and their workshops established. Community support and public awareness had risen after Lebanon’s independence, particulalry with the enactment of the Labor laws, that paid special attention to the employment of the people with special needs, in the early sixties. The civil disturbances over the period 1975 through 1990 curtailed these developments, as Lebanon entered a state of siege. Moreover, the plight of the injured and those handicapped by the civil disturbances raised the concerns of the public, the communities and the Government. 1980 was announced as the “Year of the Handicapped” by the United Nations: this provided further impetus to the social and governmental efforts to develop the infrastructure to care for those in need of LT care. In 1973, prior to the civil disturbances, the National Committee for the support of the Handicapped had been established in Lebanon. Its mandate was to study the causes of the handicaps, the ways and means of prevention, the availability of medical and social assistance. This Commission included most of the organizations and groups interested in the care of the people with special needs. Amongst its rseponsibilities, the Commission legislated the definition of the status of the handicapped (both mental and physical) and focused on insuring the livelihood of this population. In 1992-93, efforts were accelerated by the Ministry of Social Affairs. This Ministry had conducted in 1986 a national survey to identify the handicaped and the causes of impairment. This study revealed that Lebanon’s handicapped numbered close to 44,000 persons, i.e. a handicap rate of 1.54% of the general

52
52
population. In the same year, Caritas conducted its own survey that identified 106,355 handicapped persons in the country: 39% had a physical handicap, 15% were deaf and dumb, 14% were blind, 8% had amputation and 24% had mental conditions. These surveys and studies encouraged the establishment of the institutions to care for handicaps. It is believed that up to 60 such institutions and organizations exist in Lebanon, although they are of variable level of sophistication. Most are charitable, voluntary, not-for-profit, community based and religious organziations supported and supervised by one or more of the Government funding agencies. In addition to the facilities, there are some 20 medical specialists in Lebanon for physical medicine and rehabilitation, in addition to the larger group of orthopedic surgeons, neurologists and rheumatologists. The specialty is also recognized in Lebanon and a national association has been formed lately to promote the interests of the physician specialists in this field. Technicians are also educated at the technical and university levels. In 1978, legislation was passed that defined the educational program requirements, duration and contents. A licensing examination is also required. Technicians in prosthetics and orthotics are also active in the country, as are occupational therapists (ergotherapists). Efforts to support and further develop the care to the handicapped were expanded by the World Rehabilitation Fund (WRF) in Lebanon, immediately after the end of the civil disturbances in 1990. Such efforts consisted in training, equipment donation and fellowships for trainers. Community-based rehabilitation services CBRS have been successfully implemented in Lebanon in the 1990s, after a timid beginning in the early eighties. These concepts have been supported by the WRF and by the WHO. A national registry for the handicapped is currently being developed by the Ministry of Social Affairs, and is in an advanced state. 4. The Survey of the Handicapped – 1996 A major survey was conducted by the Ministry of Social Affairs over the period December 1995 and May 1996, in collaboration with the UNDP. This was a population based survey of the entire population, covering close to 65,000 households all over the country. The sample was a three-tiered stratified sample, representing 10% of the population. The response rate was close to 95%. The survey provided important information on all kinds of characteristics of the handicapped population in the country. We will review its principal findings, herewith. All tables compare the handicapped population with the findings from the general population.
Handicapped General Significance Population Population
Men 61.8 49 Significant Women 38.2 51 10-14 years 1 13 Not significant 15-19 years 3.3 12.4 20-24 years 9.4 11.9 25-29 years 16.5 10.6 30-34 years 21.2 10 35-39 years 14.8 8 40-44 years 8.9 6.5 45-49 years 6.8 5.3 50-54 years 6 4.9 55-59 years 3.9 4.5 60-64 years 4 4.2 > 65 years 5.3 8.5

53
53
Both sexes Both sexes Men Men Women Women
Single 59.4 42 56.3 52.4 64.4 45.3 Married 30.9 39.3 39.6 45.9 16.9 45.3 Separated 0.3 17.5 0.3 0.3 0.2 0.1 Divorced 1.2 0.4 0.9 0.1 1.7 0.8 Widowed 8.2 0.9 2.9 1.3 16.8 8.5 Single Men 58.6 52.7 Not significant Single women 41.5 47.3 Married Men 79.1 49.4 Significant Married women 20.9 50.7
The handicapped population lives primarily in apartments, more so than the general population of the country. There is a significant difference (if we use the X2) for some of the variables as noted herewith.
Handicapped General Significance Population Population Type of dwelling Significant Live in apartment 72.9 56 Independent houses 26.7 43.8 Others 0.5 0.1 Rooms in dwelling Not significant Two pieces 22.9 15.9 Three pieces 27.8 25.1 Four pieces 22.7 26.6 Five pieces 12.9 18.2 Six pieces 6.7 10.6 Others 0.5 0.3
Type of families 68.7 78.7 Not significant Nuclear 8.6 6 Nuclear + some relatives 16.8 13.5 Extended families 5.9 2.3 Others Number of persons in dwelling
Educational attainment Both sexes Both sexes Men Men Women Women
Age less than 6 years 1.9 7 1.6 7.4 2.5 6.7 Has been or is in school 47.5 80.5 54.1 83.4 37 77.6 Has not been to school 50.6 12.5 44.3 9.2 60.6 15.7 Illiterate 48.9 13.5 Read and write 14.6 9.8 Primary education 21.1 35 Intermediate education 9.8 19.5 Secondary education 3.9 14.5 University education 1.6 6.7 Supplementary education 0.1 0.9
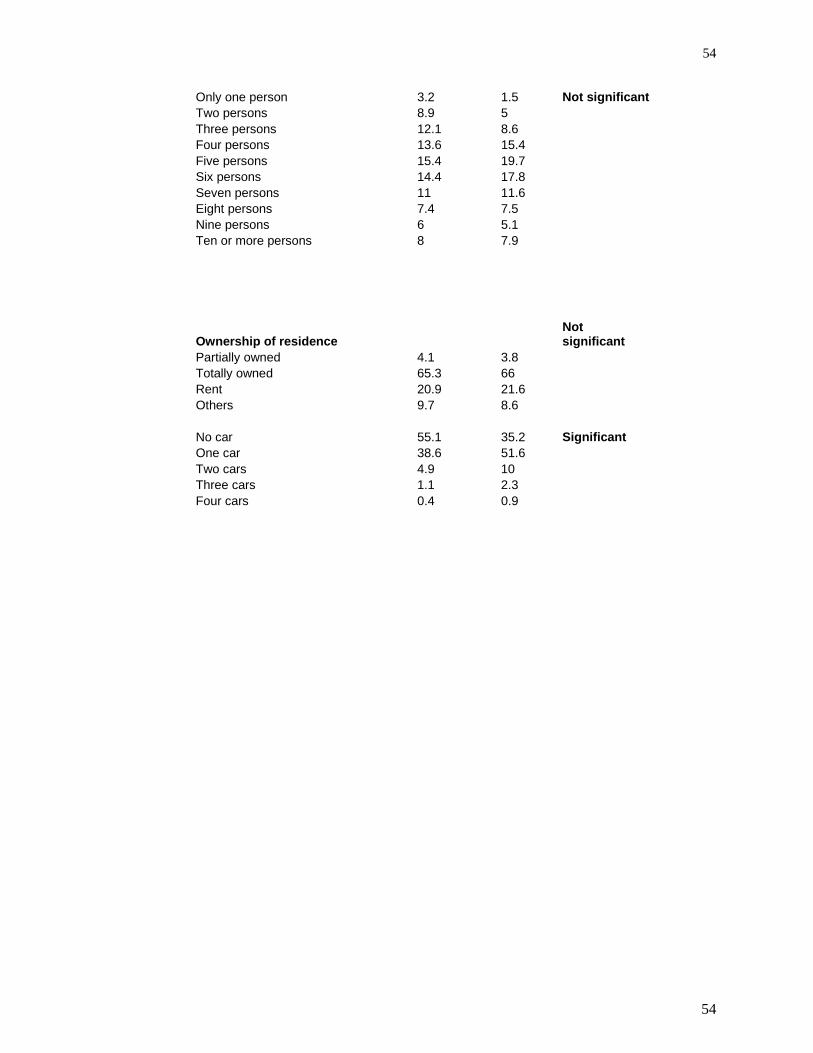
54
54
Only one person 3.2 1.5 Not significant Two persons 8.9 5 Three persons 12.1 8.6 Four persons 13.6 15.4 Five persons 15.4 19.7 Six persons 14.4 17.8 Seven persons 11 11.6 Eight persons 7.4 7.5 Nine persons 6 5.1 Ten or more persons 8 7.9
Ownership of residence Not significant
Partially owned 4.1 3.8 Totally owned 65.3 66 Rent 20.9 21.6 Others 9.7 8.6 No car 55.1 35.2 Significant One car 38.6 51.6 Two cars 4.9 10 Three cars 1.1 2.3 Four cars 0.4 0.9