imagining the future of niagara street - one region...
TRANSCRIPT

STUDY
AREA
SUNY BUFFALO STATE
DELAWARE PARK
DOWNTOWN BUFFALO
NIAGARARIVER
BLACK ROCK
33
198
190
SCENARIO PLANNING PILOT PROJECTS
Scenario planning to create a vision and to understand the impacts for the future of a stretch of Niagara Street in the city’s “Upper Rock” neighborhood.
Imagining the Future of Niagara Street

The work that provided the basis for this publication was supported by a U.S. Department of Housing and Urban Development (HUD) Sustainable Communities Regional Planning
Grant. The author and publisher are solely responsible for the accuracy of the statements and
the views of the Federal Government.
Brian ConleyGIS Analyst, University at Buffalo Regional Institute
Matthew WattlesAssociate Planner, University at Buffalo Regional Institute
This document was produced as part of One Region Forward, a regional initiative to promote more sustainable forms of development in Erie and Niagara counties. Research, analysis, and planning for this report were conducted by the University at Buffalo Regional Institute, of the State University at Buffalo, School of Architecture and Planning. Funding was provided by the US Department of Housing and Urban Development through its Partnership for Sustainable Communities, an interagency collaboration also involving the US Department of Transportation and the Environmental Protection Agency.
Project Leadership:
Kelly DixonGreater Buffalo Niagara Regional Transportation Council
Amy WeymouthGreater Buffalo Niagara Regional Transportation Council
Stakeholders Working Group:
Vision NiagaraStakeholders, (residents, businesses, investors & human service organizations) working together to encourage and implement revitalization of Niagara Street from Busti Avenue to Scajaquada Creek in Buffalo, NY.
Barbara Rowe, Peter Rowe, Giles Kavanagh, James Morris, Howard Rich, William Breeser, Kerry Traynor, Renata Kraft, Michael DeLuca, Hiroki Hata

PROCESS OVERVIEW...................................................................... 6
SCENARIO MODELING.................................................................. 5
3. Imagining the future
IMAGINED PROJECTS IN THE FUTURE SCENARIO........... .......... 9
DEVELOPMENT IMPACTS.............................................................. 11
CONCLUSION........................................................................... ...... 15
P ..............................................................................40


ONE REGION FORWARD | Niagara Street Scenario Planning 5
SCENARIO PLANNING
How can neighborhoods use scenario planning?
What is scenario planning?
What does this report do?
This report is an exercise in imagination.
stakeholders, for a more ideal neighborhood could be worked toward. This report is meant
vision.

ONE REGION FORWARD: Niagara Street Scenario Planning6
1. Engage stakeholders and learn values
VALUES
N
S
W E
Tasks:
Build partnerships between stakeholders
Conduct values research
Identify community issues and share local knowledge
Ask big picture questions
2. Learn from the data
InformingStakeholders
Tasks:
area that encompasses
knowledge
Present data on existing conditions
Use data to inform the scenario model
Data as a way to decide on important indicators
A thriving, vibrant
waterfront community
“Front Door” for Canadian
visitors
Capitalizing
architecture and historical
food and beverage
Walkable, pedestrian-
safe and bike- friendly
PROCESS OVERVIEWPROCESS OVERVIEW

ONE REGION FORWARD | Niagara Street Scenario Planning 7
Scenario Indicators for Niagara StreetA wide range of possible indicators can be scaled and catered to each individual scenario modeling project. Indicators are the outputs
as community goals, such as: improving access to transit, offering more affordable housing, or improving water quality. Indicators
alternatives and investments choices. The list below shows indicators Vision Niagara chose for their analysis:
Land Use Impacts
• Land Use mix• Housing mix • Impervious Surfaces• Rehab Projects using Historic Tax Credits
Fiscal Impacts
• • Total Tax Revenue • Return-On-Investment
Environmental Impacts• New area of open space• CO2 Emissions per household• Green Infrastructure
Transportation Impacts
• Length of new bike lanes •
VisioningTasks:
Ask Big picture questions
Record data necessary for creating future scenario.
Identify known changes within the study area.
Visioning
ScenarioCreation
Tasks:
Evaluate and compile group data and input
Research for model accuracy
vision
Identity workshop themes with data story-telling
3. Imagining the future
5. Revealing the Vision
4. Creating the Scenario

ONE REGION FORWARD: Niagara Street Scenario Planning
STUDY
AREA
SUNY BUFFALO STATE
DELAWARE PARK
DOWNTOWN BUFFALO
NIAGARARIVER
BLACK ROCK
33
198
190
Map 1: Niagara Street Context

ONE REGION FORWARD | Niagara Street Scenario Planning 9
1
2
3
4
58
67
1011
1213
1415
16
17
18
20
19
21
9
AlbaAlblbAlbAlbaAlbAlbaAlbabaAlbaAlbalbaAlbaAlbbaAAAlbabaA ny Sny Sny Sny Sy Sny Sny Sny Sny Sny Sny Sny Sny Sny ny yyyyyyy ttttttttttt
WestW tW tWestWestWes FerFerFerFerFFFerFeFerFeeerry Sry Sry SSSry Sry r tttttt
BrecBrecBrecBrecBrecBrecececBBrecBrecBreccBrecceckenrkenrkenrkenkkenrenrkenrkenkenrkenkenrkenkenrkennkenridgeidgeidgeidgeidgeidgedgedgeiidgedgegegedgedgeidgedgdgegged StStStStStStSStStStSStSSSStStS
bbA bAubuAububAububAubuuAuAubuu rn Arn AAn Arn AAArn AArn Arn An eveveeveveveAubuAubuAubuAubuAubuAub rn Arn Arn Arn AAvevevevevee
LafaLafaLafafaLafaLafaafaffLafafayettyettyettttyettyettyettyettye e AvAe Ave Ave AvAAAAe Ave Ave veeeee
n n SS
n S
n SS
n SS
nnntttttttt
Gan
sG
ans
Gan
sG
ans
Gan
sG
ans
Gan
sG
ans
Gan
sG
ans
Ga
Gan
sG
ans
Gaaa
Gononononnononnnnooooo
Infill Projects
Rehabilitation Projects
Reconstructed PublicOpen Spaces
Site Conversion
Map 2: New Project Types
IMAGINED PROJECTS IN THE FUTURE SCENARIOIMAGINED PROJECTS IN THE

ONE REGION FORWARD: Niagara Street Scenario Planning10
Rehabilitation Projects
Reconstructed Public Open Spaces
Site Conversion

ONE REGION FORWARD | Niagara Street Scenario Planning 11
Employment Impacts
Figure 2: Jobs by Sector
Figure 1: Housing by Type
Population and Housing Impacts
DEVELOPMENT IMPACTS

ONE REGION FORWARD: Niagara Street Scenario Planning12
Land Use Impacts
Figure 3: Land Use Mix
AlbanbanAlbAAlbanAlbaAlbanAlbAlbaAlbAlbanAlbanAAlbanAlbanAlbanAAAlbanbany Sty Sty Sty Sty Sty Sty Sy Styy Syy Sty Sty Styyyyyy
West West WestWest WestWest Wes FerryFerryFerryFFerFerryFeFerryFerrerFeer StStStStStSt
AuburbburAuburAububAuburA bubAuburuuAuburA n Aven AveAAven Aven Aven AveAAAn AveAnAuburAuburAuburAuburAuburAuburn Aven Aven en Aven Avn Ave
LafayLafayLafayLafayLafayLafayfafayffaff y ttttetteette ette ttette etteettette t e AveAveAveAvAAAAveAAveAv
n n St
n StStStStStt
nS
n G
anso
Gan
soG
anso
ans
Gan
soG
anso
Gan
sooG
anso
Gan
soG
anso
Gan
soG
anso
Gan
soan
Gaaa
Gnnnnnnnn
Existing Land Use
Abandoned
Commercial
Industrial
Parking
Public
Residential
Vacant
Office
WestW tW tWest WeWest Wes FerryFerFerrFerryFerryFeFerryryeFeerre StSStStSt
BreckBreckBreckBreckBrececBreckBreckBreckBreckBrecBrecckckckenenenridenrenrenridenrididdenridridnridnridenrnrnenridrr ge Stge Stge Sge Stge Stge gee Stge Stge Stge Stge Stge Stgge SStge Stg Sge S
AuburbburAuburAuburA bA bbbbuAuubbAuAubuu A eAn Aven Aven Aven AveAAA en Avn vAubuAuburAuburAuburAuburAuburn Aven Avn Aven Avn Ave
LafayafayLafayLafaLafaLafaafaLafayafayLafayfafay tttette ette ette ette ettetette AveAvAveAveAAveAAAAA
nn S
n St
n St
n StStttttSt
n S
sosG
anso
Gan
soG
anso
Gan
soG
ansosoo
Gan
soG
anso
Gan
sooG
anso
Gan
sG
anaaGG
nnnnnnn
Future Land UseAbandoned
Commercial
Industrial
Mixed Use
Open Space
Parking
Public
Residential
Vacant
Office
Map 3: Existing Land Use Map 4: Future Land Use

ONE REGION FORWARD | Niagara Street Scenario Planning 13
Rehabilitation
Fiscal Impacts
7 Rehab Projects utilizing tax credits(Historic Preservation and Main Street grants)
$6,308,192
Figure 4: Public Expenditures and Revenues

ONE REGION FORWARD: Niagara Street Scenario Planning14
1
Environmental Impacts
3
2
Transportation Impacts
4. About 140 5
1
2
3
4
5
2
Figure 5: Rents and Development Feasibility
Aver
age
Rent
s (pe
r squ
are
foot
)
ONE REGION FORWARD | Niagara Street Scenario Planning 15
CONCLUSION
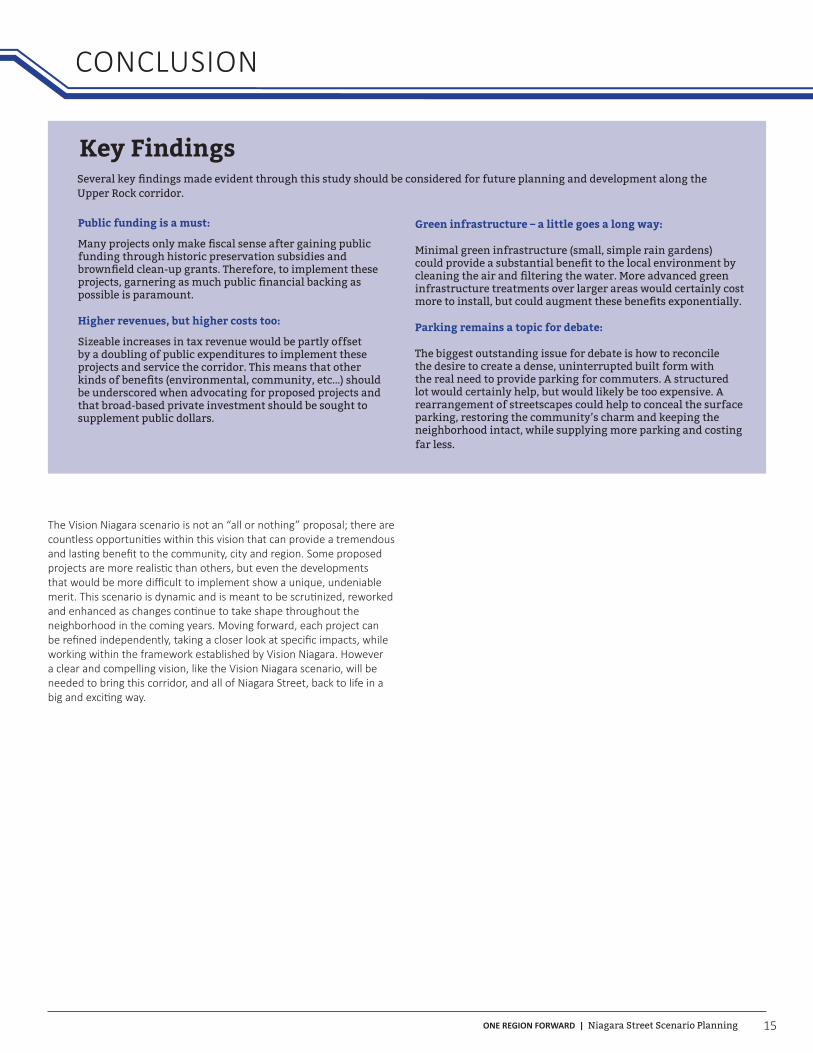
Upper Rock corridor.
CONCLUSION
Public funding is a must:
funding through historic preservation subsidies and
possible is paramount.
Higher revenues, but higher costs too:
Sizeable increases in tax revenue would be partly offset by a doubling of public expenditures to implement these projects and service the corridor. This means that other
be underscored when advocating for proposed projects and that broad-based private investment should be sought to supplement public dollars.
Green infrastructure – a little goes a long way:
Minimal green infrastructure (small, simple rain gardens)
infrastructure treatments over larger areas would certainly cost
Parking remains a topic for debate:
The biggest outstanding issue for debate is how to reconcile the desire to create a dense, uninterrupted built form with the real need to provide parking for commuters. A structured lot would certainly help, but would likely be too expensive. A rearrangement of streetscapes could help to conceal the surface parking, restoring the community’s charm and keeping the neighborhood intact, while supplying more parking and costing far less.
Key Findings

ONE REGION FORWARD: Niagara Street Scenario Planning16
Existing Conditions - Southern Aerial View: 3D Rendering
Future Conditions - Southern Aerial View: 3D Rendering

ONE REGION FORWARD | Niagara Street Scenario Planning 17
Existing Conditions - Southern Aerial View: 3D Rendering
Future Conditions - Southern Aerial View: 3D Rendering

ONE REGION FORWARD: Niagara Street Scenario Planning
1
2
3
4
5
8
6
7
10
1112
1314 15
16
17
18
20
19
21
9
AlbAlbAlbAlbAlbAlbAlbAAlblbAAlbbbAAAAlbAlblbA anyanyanyanynnynyanyanyanyanyanynyyyyyyyy StStStStSStSSStStStStStSS
WesWWesWest Ft Ft FFt FFFeeerrerrrrerreerrerrree y Sy Sy Sy Sy Sy Sttttt
BreBreBreBrBBrereBBrBrBrB ckeckckckeckeckekeckekkckeckeckeckeckekckckk nrinrinririinnririnrnrnrnnnrrr dgedgedgedgedgedgedgedgegedgeddgedgedggegedggedgeg StSStStStStStStStSSSStStStStSSt
AubAubbbAubbbbAubAubbuAuAu urnurnurnurnnn AAvAvAAvAAvAAAAveeeeeAubAubAubAubAubAubu urnurnurnurnu n AvAvAvAvAveeeee
LafLafLafLaffLafffLafayeayeayeayeayeayeayeayetttettettettetete AvAvAvAvAvAAvAAAAveeeee
nnnnnSStStStStStSttt
Gan
Ga
Ga
Gan
Gan
Gan
Gan
Gan
Gan
Gan
Gan
Ganaananaa
Gso
nso
nso
nso
nnso
nso
nnnnso
nonsonn
sosoosososo

ONE REGION FORWARD | Niagara Street Scenario Planning 19
North End Park1340,1336,1330,1318 Niagara StreetBuffalo, NY, USA
BUILDING FORMLot area 75,250 sfLot area 1.73 acresBuilding Footprint 3,763 sfParking Footprint (Adjacent) - sfHeight 2 storiesFloor-area ratio 0.10 FARGross Building SqFt 7,149 SqftNet Building SqFt 6,076 Sqft
UNITS AND EMPLOYEESHousing Units - N/A /acreAverage unit size N/A sfEmployees 5 3 /acre
CONSTRUCTION COSTS FINANCIAL PERFORMANCE
TOTAL COSTS 2,587,956$ Rental
Land Costs 129,300$ $2 /sf Cash-on-Cash (After Year 3) 699.4%
Hard Costs 1,286,775$ IRR on Project Cost (Unleveraged Return) 0.0%IRR on Investor Equity (Leveraged Return Before T 698.6%
Public 1,286,775$ $180 Debt Service Coverage Ratio (Year 3) -2.2%
Owner
2,971,881$ Project Rate of Return 0.0%
Other Costs -$ Return to Equity 0.0%Demolition Costs -$ Subsidy
Site Development Costs -$ Subsidy Amount $ 1,800,000 Additional Infrastructure -$ % of Project Costs 41%
42,215$
This project turns four brownfield parcels into a Park connecting Niagara St to the new Toll Plaza Park. The existing building on site is renovated for auxiliary park use. Brownfield Subsidies are leveraged to finance redevelopment.
Soft Costs (BF Cleanup, Park
Construction)
Possible Minimum Green
Infrastructure Costs
Map ID 1

ONE REGION FORWARD: Niagara Street Scenario Planning20
Toll Plaza ParkRiverside of Interstate 190Buffalo, NY, USA
BUILDING FORMLot area 113,356 sfLot area 2.60 acresBuilding Footprint 0 sfParking Footprint (Adjacent) - sfHeight 0 storiesFloor-area ratio 0.00 FARGross Building SqFt 0 SqftNet Building SqFt 0 Sqft
UNITS AND EMPLOYEESHousing Units - N/A /acreAverage unit size N/A sfEmployees - - /acre
CONSTRUCTION COSTS FINANCIAL PERFORMANCE
TOTAL COSTS 22,964,237$ Rental
Land Costs 226,712$ $2 /sf Cash-on-Cash (After Year 3) 0.0%
Hard Costs -$ IRR on Project Cost (Unleveraged Return) 0.0%IRR on Investor Equity (Leveraged Return Before 0.0%Debt Service Coverage Ratio (Year 3) 0.0%Owner
Soft Costs 3,126,937$ Project Rate of Return 0.0%Other Costs 19,610,588$ Return to Equity 0.0%
Demolition Costs -$ Subsidy
Site Development Costs -$ Subsidy Amount $ - Park Construction 19,610,588$ % of Project Costs 0%
-$
Project involves turning the former Interstate-190 Toll Plaza into a park along the Niagara River. A bridge will connect the park to an adjoining park built along Niagara Street.
Minimum Green Infrastructure
Costs
Map ID 2

ONE REGION FORWARD | Niagara Street Scenario Planning 21
Industrial Building Rehab1280 Niagara StreetBuffalo, NY, USA
BUILDING FORMLot area 11,500 sfLot area 0.26 acresBuilding Footprint 11,155 sfParking Footprint (Adjacent) - sfHeight 3 storiesFloor-area ratio 2.76 FARGross Building SqFt 31,792 SqftNet Building SqFt 27,023 Sqft
UNITS AND EMPLOYEESHousing Units - N/A /acreAverage unit size N/A sfEmployees 53 201 /acre
CONSTRUCTION COSTS FINANCIAL PERFORMANCETOTAL COSTS 1,082,504$ Rental
Land Costs 81,000$ $7 /sf Cash-on-Cash (After Year 3) 405.0%
Hard Costs 1,446,525$ IRR on Project Cost (Unleveraged Return) 28.4%IRR on Investor Equity (Leveraged Return Before Tax) 375.6%
Industrial 1,446,525$ $46 Debt Service Coverage Ratio (Year 3) 320.4%Owner
Project Rate of Return 0.0%Soft Costs 222,649$ Return to Equity 0.0%Other Costs -$ Subsidy
Demolition Costs -$ Subsidy Amount $ 667,669 Site Development Costs -$ % of Project Costs 38%Additional Infrastructure -$
23,157$ Rent (sqft/year) Total (per year)
Industrial 10 /sqft 270,230$ Net Operating Income
Industrial 237,262$
Project models a fully occupied industrial building.
Minimum Green Infrastructure
Costs
Map ID 3

ONE REGION FORWARD: Niagara Street Scenario Planning22
Mixed Use Infill1295, 1299, 1303 Niagara StreetBuffalo, NY, USA
BUILDING FORMLot area 18,101 sfLot area 0.42 acresBuilding Footprint 16,291 sfParking Footprint (Adjacent) - sfHeight 3 storiesFloor-area ratio 2.57 FARGross Building SqFt 46,429 SqftNet Building SqFt 42,529 Sqft
UNITS AND EMPLOYEESHousing Units 32 78 /acreAverage unit size - sfEmployees 23 54 /acre
CONSTRUCTION COSTS FINANCIAL PERFORMANCETOTAL COSTS 14,923,708$ Rental
Land Costs 94,300$ $5 /sf Cash-on-Cash (After Year 3) -4.7%
Hard Costs 12,333,881$ IRR on Project Cost (Unleveraged Return) -5.1%Residential 8,426,875$ $275 /sf IRR on Investor Equity (Leveraged Return Before Tax) 0.0%Retail 2,170,559$ $275 /sf Debt Service Coverage Ratio (Year 3) 52.6%Office 1,736,447$ $220 /sf Owner
Project Rate of Return 0.0%Soft Costs 2,485,709$ Return to Equity 0.0%Other Costs 9,817$ Subsidy
Demolition Costs 9,817$ Subsidy Amount $ - Site Development Costs -$ % of Project Costs 0%Additional Infrastructure -$ Rent (sqft) Total (per year)
Residential 1.00$ 349,332$ Retail 23.00$ 156,144$ Office 23.00$ 156,144$
Rent needed for 20% IRR
Residential 1.63 569,412$
Project involves creating a 3 story mixed use development on three adjoining parcels. The northern most parcel, currently a mechanic's garage, is demolished and incorporated into the project as mostly green space.
Minimum Green Infrastructure
Costs43,665$
Map ID 4

ONE REGION FORWARD | Niagara Street Scenario Planning 23
Mixes Use Infill1279 Niagara StreetBuffalo, NY, USA
BUILDING FORMLot area 8,687 sfLot area 0.20 acresBuilding Footprint 7,818 sfParking Footprint (Adjacent) - sfHeight 3 storiesFloor-area ratio 2.57 FARGross Building SqFt 22,282 SqftNet Building SqFt 20,410 Sqft
UNITS AND EMPLOYEESHousing Units 16 78 /acreAverage unit size - sfEmployees 11 54 /acre
CONSTRUCTION COSTS FINANCIAL PERFORMANCETOTAL COSTS 7,194,386$ Rental
Land Costs 75,000$ $9 /sf Cash-on-Cash (After Year 3) -0.7%
Hard Costs 5,919,254$ IRR on Project Cost (Unleveraged Return) 1.5%Residential 4,044,211$ $275 /sf IRR on Investor Equity (Leveraged Return Before Tax) -5.8%Retail 1,041,691$ $275 /sf Debt Service Coverage Ratio (Year 3) 93.4%Office 833,353$ $220 /sf Owner
Project Rate of Return 0.0%Return to Equity 0.0%
Soft Costs 1,193,983$ Subsidy
Other Costs 6,149$ Subsidy Amount $ - Demolition Costs 6,149$ % of Project Costs 0%Site Development Costs -$ Rent (sqft) Total (per year)
Additional Infrastructure -$ Residential 1.00$ 167,651$ Retail 23.00$ 74,936$ Office 16.00$ 60,607$
Rent needed for 20% IRR
Residential 4.60$ 771,194$ Retail 70.25$ 226,909$ Office 52 50$ 198 868$
Mixed Use infill project replaces current mechanic's garage at the corner of Auburn Avenue and Niagara Street
Minimum Green Infrastructure
Costs9,381$
Map ID 5

ONE REGION FORWARD: Niagara Street Scenario Planning24
Breckenridge Church and Infill44 BreckenridgeStreet, 1242 Niagara StreetBuffalo, NY, USA
BUILDING FORMLot area 34,495 sfLot area 0.79 acresBuilding Footprint 19,910 sfParking Footprint (Adjacent) 12,861 sfHeight N/AFloor-area ratio 1.13 FARGross Building SqFt 39,023 SqftNet Building SqFt 34,067 Sqft
UNITS AND EMPLOYEESHousing Units 9 12 /acreAverage unit size - sfEmployees 22 28 /acre
CONSTRUCTION COSTS FINANCIAL PERFORMANCETOTAL COSTS 10,749,730$ Rental
Land Costs 129,200$ $4 /sf Cash-on-Cash (After Year 3) 19.4%
Hard Costs 8,832,782$ IRR on Project Cost (Unleveraged Return) 14.9%Residential 2,468,184$ $275 /sf IRR on Investor Equity (Leveraged Return Before Tax) 28.3%Retail 5,162,700$ $210 /sf Debt Service Coverage Ratio (Year 3) 204.1%Office 1,201,898$ $220 /sf Owner
Project Rate of Return 0.0%Soft Costs 1,787,748$ Return to Equity 0.0%Other Costs -$ Subsidy
Demolition Costs -$ Subsidy Amount $ 1,816,164 Site Development Costs -$ % of Project Costs 17%Additional Infrastructure -$ Rent (sqft) Total (per year)
31,000$ Residential 1.00$ 102,317$ Retail 23.00$ 480,623$ Office 16.00$ 87,411$
Rent needed for 20% IRR
Residential 3.10$ 317,184$ Retail 45.50$ 950,797$ Office 38.00$ 207,601$
Historic church on Breckenridge is rehabilitated as small-scale retail. A separate project establishes Class A mixed use infill on the portion of the same parcel facing Niagara Street and extending into northern adjacent parcel.
Minimum Green Infrastructure
Costs
Map ID 6

ONE REGION FORWARD | Niagara Street Scenario Planning 25
Mixed Use Rehab1226 Niagara StreetBuffalo, NY, USA
BUILDING FORMLot area 1,379 sfLot area 0.03 acresBuilding Footprint 1,296 sfParking Footprint (Adjacent) - sfHeight 3 storiesFloor-area ratio 2.68 FARGross Building SqFt 3,694 SqftNet Building SqFt 3,384 Sqft
UNITS AND EMPLOYEESHousing Units 3 105 /acreAverage unit size - sfEmployees 5 159 /acre
CONSTRUCTION COSTS FINANCIAL PERFORMANCE
TOTAL COSTS 614,349$ Rental
Land Costs 80,000$ $58 /sf Cash-on-Cash (After Year 3) -49.4%
Hard Costs 775,812$ IRR on Project Cost (Unleveraged Return) 6.7%
Residential 512,036$ $210 /sf IRR on Investor Equity (Leveraged Return Before Tax) 13.5%Retail 263,776$ $210 /sf Debt Service Coverage Ratio (Year 3) 83.6%Office -$ $0 /sf Owner
Industrial -$ $0 Project Rate of Return 0.0%Public -$ $0 Return to Equity 0.0%Educational -$ $0 Subsidy
Hotel/Motel -$ $0 Subsidy Amount $ 410,000 Internal Parking -$ $0 % of Project Costs 40%
Soft Costs 168,537$ Rent (sqft) Total (per year)
Other Costs -$ Residential 1.00$ 27,796$ Demolition Costs -$ Retail 23.00$ 24,556$ Site Development Costs -$ Rent needed for 20% IRR
Additional Infrastructure -$ Residential 2.25$ 62,541$ Retail 37.25$ 39,771$
Bait and Tackle shop at corner of Breckenridge and Niagara Street with vacant residential units above is rehabilitated and fully-occupied into mixed use retail / residential.
Minimum Green Infrastructure Costs 3,466$
Map ID 7

ONE REGION FORWARD: Niagara Street Scenario Planning26
Mixed Use Rehab1277 Niagara StreetBuffalo, NY, USA
BUILDING FORMLot area 3,357 sfLot area 0.08 acresBuilding Footprint 1,846 sfParking Footprint (Adjacent) - sfHeight 2 storiesFloor-area ratio 1.24 FARGross Building SqFt 4,162 SqftNet Building SqFt 3,746 Sqft
UNITS AND EMPLOYEESHousing Units 1 16 /acreAverage unit size - sfEmployees 4 54 /acre
CONSTRUCTION COSTS FINANCIAL PERFORMANCETOTAL COSTS 644,927$ Rental
Land Costs 30,000$ $9 /sf Cash-on-Cash (After Year 3) 98.4%
Hard Costs 873,951$ IRR on Project Cost (Unleveraged Return) 8.7%
Residential 436,976$ $210 /sf IRR on Investor Equity (Leveraged Return Before Tax) 60.7%Retail 436,976$ $210 /sf Debt Service Coverage Ratio (Year 3) 95.6%
Owner
Project Rate of Return 0.0%Soft Costs 178,590$ Return to Equity 0.0%Other Costs -$ Subsidy
Demolition Costs -$ Subsidy Amount $ 437,614 Site Development Costs -$ % of Project Costs 40%Additional Infrastructure -$ Rent (sqft) Total (per year)
6,250$ Residential 1.00$ 23,722$ Retail 23.00$ 41,165$
Rent needed for 20% IRR
Residential 2.22$ 52,662$ Retail 34.52$ 61,540$
Project rehabilitates the two-story residential-style mixed use building at the corner of Niagara Street and Auburn Avenue and puts it back to use.
Minimum Green Infrastructure
Costs
Map ID 8

ONE REGION FORWARD | Niagara Street Scenario Planning 27
Mixed Use Rehab1273 Niagara StreetBuffalo, NY, USA
BUILDING FORMLot area 3,334 sfLot area 0.08 acresBuilding Footprint 2,667 sfParking Footprint (Adjacent) - sfHeight 2 storiesFloor-area ratio 1.72 FARGross Building SqFt 5,750 SqftNet Building SqFt 5,175 Sqft
UNITS AND EMPLOYEESHousing Units 1 19 /acreAverage unit size - sfEmployees 6 75 /acre
CONSTRUCTION COSTS FINANCIAL PERFORMANCE
TOTAL COSTS 853,698$ Rental
Land Costs 30,000$ $9 /sf Cash-on-Cash (After Year 3) -8.6%
Hard Costs 1,207,601$ IRR on Project Cost (Unleveraged Return) 10.5%
Residential 603,801$ $210 /sf IRR on Investor Equity (Leveraged Return Before Tax) 0.0%Retail 603,801$ $210 /sf Debt Service Coverage Ratio (Year 3) 104.5%
Owner
Project Rate of Return 0.0%Soft Costs 245,665$ Return to Equity 0.0%Other Costs -$ Subsidy
Demolition Costs -$ Subsidy Amount $ 629,569 Site Development Costs -$ % of Project Costs 42%Additional Infrastructure -$ Rent (sqft) Total (per year)
7,201$ Residential 1.00$ 32,778$ Retail 23.00$ 56,880$
Rent needed for 20% IRR
Residential 1.98$ 64,900$ Retail 32.40$ 79,853$
Project rehabilitates the two-story residential-style mixed use building at the corner of Niagara Street and Auburn Avenue and puts it back to use.
Minimum Green Infrastructure
Costs
Map ID 9

ONE REGION FORWARD: Niagara Street Scenario Planning
Mixed Use Infill1249 Niagara St and 86 Gelston StBuffalo, NY, USA
BUILDING FORMLot area 9,440 sfLot area 0.22 acresBuilding Footprint 8,496 sfParking Footprint (Adjacent) - sfHeight 3 storiesFloor-area ratio 2.57 FARGross Building SqFt 24,214 SqftNet Building SqFt 22,180 Sqft
UNITS AND EMPLOYEESHousing Units 17 78 /acreAverage unit size - sfEmployees 12 57 /acre
CONSTRUCTION COSTS FINANCIAL PERFORMANCETOTAL COSTS 6,856,242$ Rental
Land Costs 33,400$ $4 /sf Cash-on-Cash (After Year 3) -4.2%
Hard Costs 6,432,343$ IRR on Project Cost (Unleveraged Return) -3.5%
Residential 4,394,768$ $275 /sf IRR on Investor Equity (Leveraged Return Before Tax) 0.0%Retail 1,131,986$ $275 /sf Debt Service Coverage Ratio (Year 3) 59.7%Office 905,589$ $220 /sf Owner
Project Rate of Return 0.0%Return to Equity 0.0%
Soft Costs 390,499$ Subsidy
Other Costs -$ Subsidy Amount $ - Demolition Costs -$ % of Project Costs 0%Site Development Costs -$ Rent (sqft) Total (per year)
Additional Infrastructure -$ Residential 1.00$ 182,183$ 22,772$ Retail 63.25$ 80,474$
Office 16.00$ 65,861$ Rent needed for 20% IRR
Residential 4.03$ 734,198$ Retail 63.25$ 221,303$ Office 46.00$ 189,350$
Vacant pacels south of Better Wire Products are developed into a three-story mixed use building. Project includes rear parcel facing Gelston Street.
Minimum Green Infrastructure
Costs
Map ID 10

ONE REGION FORWARD | Niagara Street Scenario Planning 29
Future Sugar City1239 Niagara StreetBuffalo, NY, USA
BUILDING FORMLot area 4,352 sfLot area 0.10 acresBuilding Footprint 2,599 sfParking Footprint (Adjacent) 883 sfHeight 2 storiesFloor-area ratio 1.17 FARGross Building SqFt 5,094 SqftNet Building SqFt 4,330 Sqft
UNITS AND EMPLOYEESHousing Units - N/A /acreAverage unit size N/A sfEmployees 8 83 /acre
CONSTRUCTION COSTS FINANCIAL PERFORMANCETOTAL COSTS 52,151$ Rental
Land Costs -$ $0 /sf Cash-on-Cash (After Year 3) 91.8%
Hard Costs 49,668$ IRR on Project Cost (Unleveraged Return) 46.8%
Retail 49,668$ $39 /sf IRR on Investor Equity (Leveraged Return Before Tax) 91.1%Public -$ $0 Debt Service Coverage Ratio (Year 3) 950.4%
Owner
Project Rate of Return 0.0%Soft Costs 2,483$ Return to Equity 0.0%Other Costs -$ Subsidy
Demolition Costs -$ Subsidy Amount $ - Site Development Costs -$ % of Project Costs 0%Additional Infrastructure -$ Rent (sqft) Total (per year)
3,601$ Public 2.87$ 10,965$ Retail 11.50$ 12,449$
Rent needed for 20% IRR
Public - -Retail - -
Building is currently being used as a community public art and cultural space. This use would continue into the future with added retail space - bringing the building to full occupancy
Minimum Green Infrastructure
Costs
Map ID 11

ONE REGION FORWARD: Niagara Street Scenario Planning30
Mixed Use Rehab1233 Niagara StreetBuffalo, NY, USA
BUILDING FORMLot area 7,088 sfLot area 0.16 acresBuilding Footprint 3,686 sfParking Footprint (Adjacent) - sfHeight 2 storiesFloor-area ratio 1.17 FARGross Building SqFt 8,308 SqftNet Building SqFt 7,610 Sqft
UNITS AND EMPLOYEESHousing Units 4 23 /acreAverage unit size - sfEmployees 7 43 /acre
CONSTRUCTION COSTS FINANCIAL PERFORMANCE
TOTAL COSTS 749,320$ Rental
Land Costs 60,000$ $8 /sf Cash-on-Cash (After Year 3) 3.8%
Hard Costs 569,078$ IRR on Project Cost (Unleveraged Return) 6.6%
Residential 328,985$ $60 /sf IRR on Investor Equity (Leveraged Return Before Tax) 7.4%Retail 240,093$ $85 /sf Debt Service Coverage Ratio (Year 3) 135.1%
Owner
Project Rate of Return 0.0%Soft Costs 120,243$ Return to Equity 0.0%Other Costs -$ Subsidy
Demolition Costs -$ Subsidy Amount $ - Site Development Costs -$ % of Project Costs 0%Additional Infrastructure -$ Rent (sqft) Total (per year)
10,299$ Residential 0.49 30,629$ Retail 11.50 34,183$
Rent needed for 20% IRR
Residential 1.29 80,634$ Retail 17.30 48,109$
Currently vacant building is rehabilitated into a bar or restaurant on the first floor with four residential units above.
Minimum Green Infrastructure
Costs
Map ID 12

ONE REGION FORWARD | Niagara Street Scenario Planning 31
Mixed Use Infill1227 Niagara StreetBuffalo, NY, USA
BUILDING FORMLot area 4,327 sfLot area 0.10 acresBuilding Footprint 4,082 sfParking Footprint (Adjacent) - sfHeight 3 storiesFloor-area ratio 2.77 FARGross Building SqFt 12,001 SqftNet Building SqFt 10,993 Sqft
UNITS AND EMPLOYEESHousing Units 4 45 /acreAverage unit size - sfEmployees 8 82 /acre
CONSTRUCTION COSTS FINANCIAL PERFORMANCETOTAL COSTS 1,386,733$ Rental
Land Costs 8,600$ $2 /sf Cash-on-Cash (After Year 3) -1.8%
Hard Costs 1,146,545$ IRR on Project Cost (Unleveraged Return) 0.5%Residential 673,238$ $85 /sf IRR on Investor Equity (Leveraged Return Before Tax) -10.7%Retail 473,307$ $116 /sf Debt Service Coverage Ratio (Year 3) 83.3%
Owner
Project Rate of Return 0.0%Soft Costs 231,587$ Return to Equity 0.0%Other Costs -$ Subsidy
Demolition Costs -$ Subsidy Amount $ - Site Development Costs -$ % of Project Costs 0%Additional Infrastructure -$ Rent (sqft) Total (per year)
Residential 0.40$ 36,117$ Retail 11.50$ 48,746$
Rent needed for 20% IRR
Residential 1.63$ 147,178$ Retail 23.00$ 88,630$
Currently vacant lot undergoes infill development and is transformed into a Bar or Restaurant on the first floor with two floors of residential space above.
Minimum Green Infrastructure
Costs10,912$
Map ID 13

ONE REGION FORWARD: Niagara Street Scenario Planning32
Mixed Use Rehab1225 Niagara StreetBuffalo, NY, USA
BUILDING FORMLot area 1,748 sfLot area 0.04 acresBuilding Footprint 1,649 sfParking Footprint (Adjacent) - sfHeight 3 storiesFloor-area ratio 2.77 FARGross Building SqFt 4,848 SqftNet Building SqFt 4,484 Sqft
UNITS AND EMPLOYEESHousing Units 3 86 /acreAverage unit size - sfEmployees 12 302 /acre
CONSTRUCTION COSTS FINANCIAL PERFORMANCETOTAL COSTS 428,499$ Rental
Land Costs 40,000$ $23 /sf Cash-on-Cash (After Year 3) 75.3%
Hard Costs 320,306$ IRR on Project Cost (Unleveraged Return) 17.2%Residential 217,286$ $60 /sf IRR on Investor Equity (Leveraged Return Before Tax) 76.8%Retail 103,019$ $85 /sf Debt Service Coverage Ratio (Year 3) 173.2%
Owner
Project Rate of Return 0.0%Soft Costs 68,193$ Return to Equity 0.0%Other Costs -$ Subsidy
Demolition Costs -$ Subsidy Amount $ 155,000 Site Development Costs -$ % of Project Costs 36%Additional Infrastructure -$
Rent (sqft) Total (per year)
Residential 0.65$ 26,943$ Retail 11.50$ 11,847$
Rent needed for 20% IRR
Residential 0.76$ 31,502$
Project to rehab the historic mixed use building at the corner of Niagara and Breckenridge streets into a brick oven pizza restaurant and bar.
* Historic tax credits not applied to total cost, but expert interviews show the project could utilize themMinimum Green Infrastructure
Costs4,408$
Map ID 14

ONE REGION FORWARD | Niagara Street Scenario Planning 33
Residential Infill Development88, 90 Breckenridge StreetBuffalo, NY, USA
BUILDING FORMLot area 3,433 sfLot area 0.08 acresBuilding Footprint 2,918 sfParking Footprint (Adjacent) - sfHeight 3 storiesFloor-area ratio 2.42 FARGross Building SqFt 8,316 SqftNet Building SqFt 7,901 Sqft
UNITS AND EMPLOYEESHousing Units 7 91 /acreAverage unit size - sfEmployees - - /acre
CONSTRUCTION COSTS FINANCIAL PERFORMANCE
TOTAL COSTS 2,751,403$ Rental
Land Costs 3,700$ $1 /sf Cash-on-Cash (After Year 3) -7.6%
Hard Costs 2,287,022$ IRR on Project Cost (Unleveraged Return) -10.3%
Residential 2,287,022$ $275 /sf IRR on Investor Equity (Leveraged Return Before T 0.0%Retail -$ $0 /sf Debt Service Coverage Ratio (Year 3) 29.5%Office -$ $0 /sf Owner
Industrial -$ $0 Project Rate of Return 0.0%Public -$ $0 Return to Equity 0.0%Educational -$ $0 Subsidy
Hotel/Motel -$ $0 Subsidy Amount $ - Internal Parking -$ $0 % of Project Costs 0%
Soft Costs 460,681$ Rent (sqft) Total (per year)
Other Costs -$ Residential 1.00$ 94,807$ Demolition Costs -$ Rent needed for 20% IRR
Site Development Costs -$ Residential 4.42$ 419,049$ Additional Infrastructure -$
7 848$
The two vacant parcels at the corner of Breckenridge and Gelston streets are developed into a three-story, Class-A, residential building.
Minimum Green Infrastructure
Map ID 15

ONE REGION FORWARD: Niagara Street Scenario Planning34
Mixed Use Infill 1221,1219 Niagara StreetBuffalo, NY, USA
BUILDING FORMLot area 4,586 sfLot area 0.11 acresBuilding Footprint 4,357 sfParking Footprint (Adjacent) - sfHeight 3 storiesFloor-area ratio 2.71 FARGross Building SqFt 12,417 SqftNet Building SqFt 11,374 Sqft
UNITS AND EMPLOYEESHousing Units 8 74 /acreAverage unit size - sfEmployees 12 117 /acre
CONSTRUCTION COSTS FINANCIAL PERFORMANCE
TOTAL COSTS 3,972,224$ Rental
Land Costs 9,200$ $2 /sf Cash-on-Cash (After Year 3) -4.5%
Hard Costs 3,298,468$ IRR on Project Cost (Unleveraged Return) -4.7%
Residential 2,253,612$ $275 /sf IRR on Investor Equity (Leveraged Return Before T 0.0%Retail 580,476$ $275 /sf Debt Service Coverage Ratio (Year 3) 54.7%Office 464,381$ $220 /sf Owner
Project Rate of Return 0.0%
Soft Costs 664,556$ Return to Equity 0.0%
Other Costs -$ Subsidy
Demolition Costs -$ Subsidy Amount $ - Site Development Costs -$ % of Project Costs 0%Additional Infrastructure -$ Rent (sqft) Total (per year)
11,642$ Residential 1.00$ 93,422$ Retail 23.00$ 41,267$ Office 16.00$ 33,773$
Rent needed for 20% IRR
Residential 4.25$ 397,045$ Retail 71.50$ 128,285$ Office 52.00$ 109,763$
Project merges both parcels at corner of Breckenridge and Niagara St reets and sees a three-story mixed use infill building constructed.
Minimum Green Infrastructure
Costs
Map ID 16

ONE REGION FORWARD | Niagara Street Scenario Planning 35
Additional Rich Products Parking1195, 1215 Niagara StreetBuffalo, NY, USA
BUILDING FORMLot area 106,230 sfLot area 2.44 acresBuilding Footprint 7,811 sfParking Footprint (Adjacent) 93,498 sfHeight 2 storiesFloor-area ratio 0.14 FARGross Building SqFt 14,841 SqftNet Building SqFt 12,615 Sqft
UNITS AND EMPLOYEESHousing Units - N/A /acreAverage unit size N/A sfEmployees 25 10 /acre
CONSTRUCTION COSTS FINANCIAL PERFORMANCETOTAL COSTS 141,473$ Rental
Land Costs 65,000$ $1 /sf Cash-on-Cash (After Year 3) 0.0%
Hard Costs -$ IRR on Project Cost (Unleveraged Return) 0.0%
Residential -$ $0 /sf IRR on Investor Equity (Leveraged Return Before T 0.0%Retail -$ $0 /sf Debt Service Coverage Ratio (Year 3) 0.0%Office -$ $0 /sf Owner
Industrial -$ $0 Project Rate of Return 0.0%Public -$ $0 Return to Equity 0.0%Educational -$ $0 Subsidy
Hotel/Motel -$ $0 Subsidy Amount $ - Internal Parking -$ $0 % of Project Costs 0%
Soft Costs 11,649$
Other Costs 64,824$
Demolition Costs 40,000$ Site Development Costs -$ Additional Infrastructure 24,824$
66,256$
Rich products is seeking additional parking space for its employees. This project models the companies acquisition of 1215 Niagara Street and it's conversion into surface parking.
Minimum Green Infrastructure
Costs
Map ID 17

ONE REGION FORWARD: Niagara Street Scenario Planning36
Rich Products R&D, Office, Catering1130 Niagara Street, 17 Gull StreetBuffalo, NY, USA
BUILDING FORMLot area 71,557 sfLot area 1.64 acresBuilding Footprint 50,090 sfParking Footprint (Adjacent) - sfHeight 1 storiesFloor-area ratio 0.86 FARGross Building SqFt 61,861 SqftNet Building SqFt 52,582 Sqft
UNITS AND EMPLOYEESHousing Units - N/A /acreAverage unit size N/A sfEmployees 36 22 /acre
CONSTRUCTION COSTS FINANCIAL PERFORMANCE
TOTAL COSTS 34,068,720$ Rental
Land Costs 341,800$ $5 /sf Cash-on-Cash (After Year 3) -9.0%
Hard Costs 28,678,772$ IRR on Project Cost (Unleveraged Return) 0.0%
Residential -$ $0 /sf IRR on Investor Equity (Leveraged Return Before T 0.0%Retail 1,497,037$ $121 /sf Debt Service Coverage Ratio (Year 3) -23.9%Office 1,200,104$ $97 /sf Owner
Industrial 25,981,631$ $700 Project Rate of Return 0.0%Return to Equity 0.0%Subsidy
Soft Costs 5,998,718$ Subsidy Amount $ 1,170,000 Other Costs 219,430$ % of Project Costs 3%
Demolition Costs -$ NOI to Reach 12%IRR Total (per year)
Site Development Costs -$ Office 729,829$ Additional Infrastructure 219,430$ Retail 685,358$
136,488$ Industrial 1,994,409$ NOI to Reach 20%IRR
Office 1,042,613$ Retail 1,071,926$ Industatrial 3,102,415$
This building is acquired by Rich Products and rehabilitated to be used for Rich Products' Research & Development, offices and catering. The adjoining parcel (17 Gull St) is used open space for employees of Rich Products.
Minimum Green Infrastructure
Costs
Map ID 18

ONE REGION FORWARD | Niagara Street Scenario Planning 37
Brewing School1114 Niagara StreetBuffalo, NY, USA
BUILDING FORMLot area 32,187 sfLot area 0.74 acresBuilding Footprint 16,094 sfParking Footprint (Adjacent) - sfHeight 1 storiesFloor-area ratio 0.64 FARGross Building SqFt 20,503 SqftNet Building SqFt - Sqft
UNITS AND EMPLOYEESHousing Units - N/A /acreAverage unit size N/A sfEmployees 16 21 /acre
CONSTRUCTION COSTS FINANCIAL PERFORMANCE
TOTAL COSTS 5,085,895$ Rental
Land Costs 165,000$ $5 /sf Cash-on-Cash (After Year 3) 2.3%
Hard Costs 3,895,593$ IRR on Project Cost (Unleveraged Return) 4.3%
Residential -$ $0 /sf IRR on Investor Equity (Leveraged Return Before T 1.9%Debt Service Coverage Ratio (Year 3) 121.5%
Educational 3,895,593$ $190 Owner
Project Rate of Return 0.0%Return to Equity 0.0%
Soft Costs 837,803$ Subsidy
Other Costs 187,500$ Subsidy Amount $ - Demolition Costs 27,500$ % of Project Costs 0%Site Development Costs -$ Net Operating Income Total (per year)
160,000$ Educational 254,177$
Net Operating Income ro reach 20% IRR
Educational 707,000$
Brewing school proposed for current Oliver Gear building. It compliments the south adjoining parcels which will be used as a brew pub and event space. The back portion of building demolishesd and replaced with green space.
Minimum Green Infrastructure
Costs
Additional Infra. (Green Space)
45,142$
Map ID 19
ONE REGION FORWARD: Niagara Street Scenario Planning
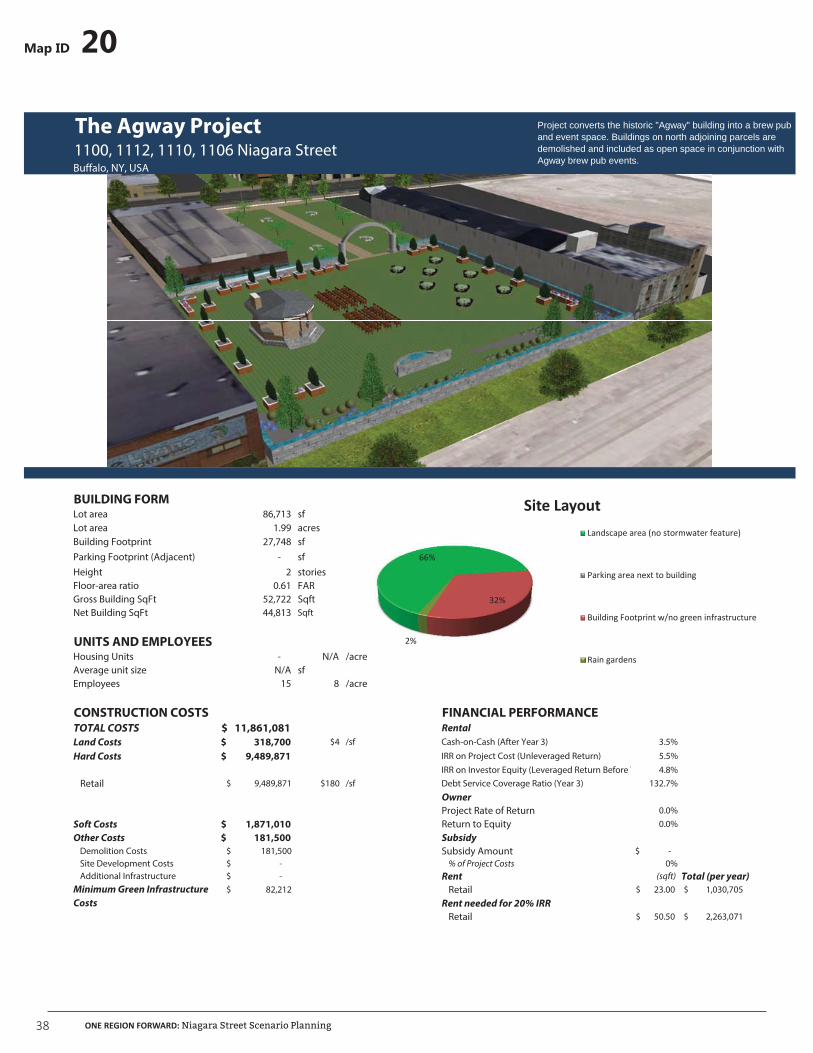
The Agway Project1100, 1112, 1110, 1106 Niagara StreetBuffalo, NY, USA
BUILDING FORMLot area 86,713 sfLot area 1.99 acresBuilding Footprint 27,748 sfParking Footprint (Adjacent) - sfHeight 2 storiesFloor-area ratio 0.61 FARGross Building SqFt 52,722 SqftNet Building SqFt 44,813 Sqft
UNITS AND EMPLOYEESHousing Units - N/A /acreAverage unit size N/A sfEmployees 15 8 /acre
CONSTRUCTION COSTS FINANCIAL PERFORMANCE
TOTAL COSTS 11,861,081$ Rental
Land Costs 318,700$ $4 /sf Cash-on-Cash (After Year 3) 3.5%
Hard Costs 9,489,871$ IRR on Project Cost (Unleveraged Return) 5.5%IRR on Investor Equity (Leveraged Return Before T 4.8%
Retail 9,489,871$ $180 /sf Debt Service Coverage Ratio (Year 3) 132.7%Owner
Project Rate of Return 0.0%Soft Costs 1,871,010$ Return to Equity 0.0%Other Costs 181,500$ Subsidy
Demolition Costs 181,500$ Subsidy Amount $ - Site Development Costs -$ % of Project Costs 0%Additional Infrastructure -$ Rent (sqft) Total (per year)
82,212$ Retail 23.00$ 1,030,705$ Rent needed for 20% IRR
Retail 50.50$ 2,263,071$
Project converts the historic "Agway" building into a brew pub and event space. Buildings on north adjoining parcels are demolished and included as open space in conjunction with Agway brew pub events.
Minimum Green Infrastructure
Costs
Map ID 20

ONE REGION FORWARD | Niagara Street Scenario Planning 39
Hotel and Condominiums1095 Niagara StreetBuffalo, NY, USA
BUILDING FORMLot area 45,383 sfLot area 1.04 acresBuilding Footprint 40,845 sfParking Footprint (Adjacent) - sfHeight 5 storiesFloor-area ratio 3.15 FARGross Building SqFt 142,956 SqftNet Building SqFt 130,090 Sqft
UNITS AND EMPLOYEESHousing Units 129 124 /acreAverage unit size - sfEmployees 57 55 /acre
CONSTRUCTION COSTS FINANCIAL PERFORMANCE
TOTAL COSTS 52,163,880$ Rental
Land Costs 22,500$ $0 /sf Cash-on-Cash (After Year 3) 12.5%
Hard Costs 43,414,087$ IRR on Project Cost (Unleveraged Return) 12.5%
Residential 15,725,210$ $275 /sf IRR on Investor Equity (Leveraged Return Before Tax) 19.3%Debt Service Coverage Ratio (Year 3) 215.9%
Hotel/Motel 23,587,814$ $275 Owner
Internal Parking 4,101,063$ $0 Project Rate of Return 76.3%Soft Costs 8,727,293$ Return to Equity 127.2%Other Costs -$ Subsidy
Demolition Costs -$ Subsidy Amount $ - Site Development Costs -$ % of Project Costs 0%Additional Infrastructure -$ *Revenue based on $170/night hotel fee.
48,883$ Income needed for 20% IRR
Hotel 250/night Hotel Fee
Vacant parcel developed as a five-story Class-A Hotel and condominium space with underground parking garage and views of the Niagara River on the upper floors.
Minimum Green Infrastructure
Costs
Map ID 21

ONE REGION FORWARD: Niagara Street Scenario Planning40
Sources
Scenario Modeling
Process Overview
Development Impacts
•
•
•
•
2012.
•
•
tenure.
•
•
•
•
•
•
•

ONE REGION FORWARD | Niagara Street Scenario Planning 41

ONE REGION FORWARD: Niagara Street Scenario Planning42

ONE REGION FORWARD | Niagara Street Scenario Planning 43

Learn more by visiting us online. www.oneregionforward.org