imaging of flames in cement kilns to study the influence ... · the cameras used in the cement...
TRANSCRIPT
General rights Copyright and moral rights for the publications made accessible in the public portal are retained by the authors and/or other copyright owners and it is a condition of accessing publications that users recognise and abide by the legal requirements associated with these rights.
Users may download and print one copy of any publication from the public portal for the purpose of private study or research.
You may not further distribute the material or use it for any profit-making activity or commercial gain
You may freely distribute the URL identifying the publication in the public portal If you believe that this document breaches copyright please contact us providing details, and we will remove access to the work immediately and investigate your claim.
Downloaded from orbit.dtu.dk on: Apr 03, 2020
Imaging of Flames in Cement Kilns To Study the Influence of Different Fuel Types
Pedersen, Morten Nedergaard; Nielsen, Mads; Clausen, Sønnik; Jensen, Peter Arendt; Jensen, LarsSkaarup; Dam-Johansen, KimPublished in:Energy and Fuels
Link to article, DOI:10.1021/acs.energyfuels.7b01954
Publication date:2017
Document VersionPeer reviewed version
Link back to DTU Orbit
Citation (APA):Pedersen, M. N., Nielsen, M., Clausen, S., Jensen, P. A., Jensen, L. S., & Dam-Johansen, K. (2017). Imaging ofFlames in Cement Kilns To Study the Influence of Different Fuel Types. Energy and Fuels, 31(10), 11424-11438. https://doi.org/10.1021/acs.energyfuels.7b01954

Subscriber access provided by DTU Library
Energy & Fuels is published by the American Chemical Society. 1155 Sixteenth StreetN.W., Washington, DC 20036Published by American Chemical Society. Copyright © American Chemical Society.However, no copyright claim is made to original U.S. Government works, or worksproduced by employees of any Commonwealth realm Crown government in the courseof their duties.
Article
Imaging of Flames in Cement Kilns toStudy the Influence of Different Fuel Types
Morten Nedergaard Pedersen, Mads NIelsen, Sønnik Clausen,Peter Arendt Jensen, Lars Skaarup Jensen, and Kim Dam-Johansen
Energy Fuels, Just Accepted Manuscript • DOI: 10.1021/acs.energyfuels.7b01954 • Publication Date (Web): 14 Sep 2017
Downloaded from http://pubs.acs.org on September 17, 2017
Just Accepted
“Just Accepted” manuscripts have been peer-reviewed and accepted for publication. They are postedonline prior to technical editing, formatting for publication and author proofing. The American ChemicalSociety provides “Just Accepted” as a free service to the research community to expedite thedissemination of scientific material as soon as possible after acceptance. “Just Accepted” manuscriptsappear in full in PDF format accompanied by an HTML abstract. “Just Accepted” manuscripts have beenfully peer reviewed, but should not be considered the official version of record. They are accessible to allreaders and citable by the Digital Object Identifier (DOI®). “Just Accepted” is an optional service offeredto authors. Therefore, the “Just Accepted” Web site may not include all articles that will be publishedin the journal. After a manuscript is technically edited and formatted, it will be removed from the “JustAccepted” Web site and published as an ASAP article. Note that technical editing may introduce minorchanges to the manuscript text and/or graphics which could affect content, and all legal disclaimersand ethical guidelines that apply to the journal pertain. ACS cannot be held responsible for errorsor consequences arising from the use of information contained in these “Just Accepted” manuscripts.

1
Imaging of Flames in Cement Kilns to Study the
Influence of Different Fuel Types
Morten Nedergaard Pedersen1*, Mads Nielsen
2†, Sønnik Clausen
1, Peter Arendt Jensen
1, Lars
Skaarup Jensen2, Kim Dam-Johansen
1
1Department of Chemical and Biochemical Engineering, Technical University of Denmark,
Søltofts Plads Building 229, 2800 Kgs. Lyngby, Denmark
2FLSmidth A/S, Vigerslev Allé 77, 2500 Valby, Denmark
KEYWORDS: Cement rotary kiln burner, alternative fuel, solid recovered fuel, camera
Page 1 of 45
ACS Paragon Plus Environment
Energy & Fuels
123456789101112131415161718192021222324252627282930313233343536373839404142434445464748495051525354555657585960
2
ABSTRACT
The cement industry aims to use an increased amount of alternative fuels to reduce production
costs and CO2 emissions. In this study three cement plants firing different kinds and percentages
of alternative fuel were studied. A specially developed camera setup was used to monitor the
flames in the three cement kilns and assess the effect of alternative fuels on the flame. It was
found that co-firing with solid recovered fuel (SRF) would delay the ignition point by about 2
meters and lower the intensity and temperature of the kiln flame compared to a fossil fuel flame.
This is related to a larger particle size and moisture content of the alternative fuels, which lowers
the conversion rate compared to fossil fuels. The consequences can be a lower kiln temperature
and cement quality. The longer conversion time may also lead to the possibility of localized
reducing conditions in the cement kiln, which can have a negative impact on the clinker quality
and process stability. The burner design may alleviate some of the issues encountered with SRF
co-firing. At one of the test plants the burner was changed from a design with an annular channel
for axial air to a jet design. This proved to be beneficial for an early ignition and improved
dispersion of the fuel and led to an increase in cement quality and higher use of SRF.
1. Introduction
Since the 90’s there has been a growing use of alternative fuels in the cement industry, especially
in Europe.1 The manufacture of cement is a very energy intensive process and traditionally about
30 % of the production cost is related to fuels.2 Alternative fuels are significantly cheaper than
conventional fossil fuels giving cement producers an opportunity to reduce their operating costs.
Page 2 of 45
ACS Paragon Plus Environment
Energy & Fuels
123456789101112131415161718192021222324252627282930313233343536373839404142434445464748495051525354555657585960

3
Additionally, partly biogenic fuels may help reduce the net CO2 emissions from the industry and
utilization of refuse derived fuels may limit the need for landfilling.3
Alternative fuels can be both solid or liquid and some of the most widely used fuels are old
tires, meat and bone meal, and paper and plastics refuse.4 Solid Recovered Fuel (SRF) is a
common term for the solid non-hazardous fuels derived by mechanical treatment of household or
commercial waste.5 SRF is a heterogeneous fuel consisting of mainly paper, wood, and plastics
as well as some non-combustible materials such as metals and glass.6 As a fuel, SRF is
characterized by a high heterogeneity with a wide range of physical and chemical properties that
affect the combustion in the cement kiln.7 Most notably is a high moisture content, typically 10-
20 wt.%8,9
, and large particle size with an equivalent particle diameter in the range 1-30 mm8,10
.
This increases combustion time and lowers the combustion temperature, compared to the
conventional fossil fuels.11,12
The increased combustion time can also lead to unconverted fuel
particles dropping into the clinker bed, resulting in local reducing conditions in the bed and an
increased vaporization of volatile sulfur, which may lead to deposit build-ups in the kiln or
preheater.11,13
The demand for alternative fuels has driven the development of cement kiln burners in recent
years. Today, most new kiln burners are supplied with multiple channels for both pulverized
fuels (coal and petcoke) and alternative fuels with larger particle sizes.7,14,15
In addition, the
burners include various nozzles for injecting primary air, both with an axial and a swirling
motion, in order to control the flame shape.11
The primary air and transport air for the fuel
typically constitutes 5-15 % of the total combustion air in the cement kiln.16
The remaining
combustion air is called secondary air, which is preheated to around 1000 °C, by recuperating the
heat from the clinker that leaves the kiln. If the secondary air is effectively mixed with the fuel, it
Page 3 of 45
ACS Paragon Plus Environment
Energy & Fuels
123456789101112131415161718192021222324252627282930313233343536373839404142434445464748495051525354555657585960
4
can help quickly heat and ignite the fuel, which is especially important for alternative fuels, that
are harder to ignite than fossil fuels.
The burning zone and the kiln hood of the cement kiln are characterized by a temperature
above 1000 °C and a high dust load, which makes measurements difficult. To monitor the
burning zone, cameras can be used. In some cases the cameras can also be used to estimate the
burning zone temperature.17
This helps the operator control the temperature and proper burning
of the clinker. The kiln images can also be used to increase the accuracy of statistic models for
prediction of e.g. NOx emissions, since the image intensity reflects the burning zone
temperature.18
The German Cement Works Association (VDZ) has used kiln cameras to evaluate
the burning zone in cement kilns. The method was used to investigate the effect of different fuels
and burner settings on the flame. However, only very sparse information on the outcome of the
project has been published.7,19
Thus, knowledge based on the visual observations of the burning
zone is still very limited.
The purpose of this paper is to fill out this knowledge gap. Specifically, camera measurements
have been carried out at three different cement plants operating with four different kiln burners
and various fractions of alternative fuels. The main goals of this article are:
• Study the impact of alternative fuels using a specially designed camera probe
• Discuss the limitations of alternative fuels firing
• Discuss burner design influence on SRF flames
Hopefully, this analysis will lead to an increased understanding of the impact that alternative
fuels will have on the cement kiln operation and highlight some methods to overcome
limitations.
2. Experimental Methods
Page 4 of 45
ACS Paragon Plus Environment
Energy & Fuels
123456789101112131415161718192021222324252627282930313233343536373839404142434445464748495051525354555657585960
5
2.1 Equipment
The cameras used in the cement kilns are typically installed at the back of the kiln hood to be
protected from the high temperatures in the kiln. However, the view can be obstructed by large
amounts of dust in the kiln hood.18
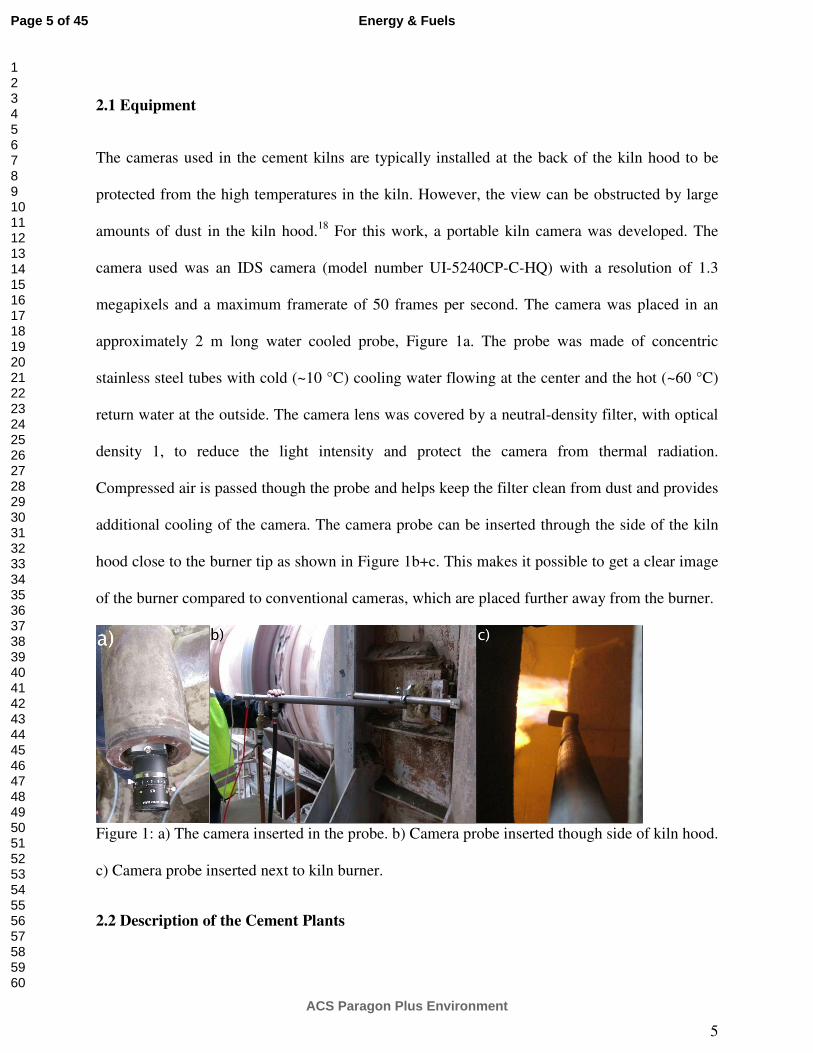
For this work, a portable kiln camera was developed. The
camera used was an IDS camera (model number UI-5240CP-C-HQ) with a resolution of 1.3
megapixels and a maximum framerate of 50 frames per second. The camera was placed in an
approximately 2 m long water cooled probe, Figure 1a. The probe was made of concentric
stainless steel tubes with cold (~10 °C) cooling water flowing at the center and the hot (~60 °C)
return water at the outside. The camera lens was covered by a neutral-density filter, with optical
density 1, to reduce the light intensity and protect the camera from thermal radiation.
Compressed air is passed though the probe and helps keep the filter clean from dust and provides
additional cooling of the camera. The camera probe can be inserted through the side of the kiln
hood close to the burner tip as shown in Figure 1b+c. This makes it possible to get a clear image
of the burner compared to conventional cameras, which are placed further away from the burner.
Figure 1: a) The camera inserted in the probe. b) Camera probe inserted though side of kiln hood.
c) Camera probe inserted next to kiln burner.
2.2 Description of the Cement Plants
Page 5 of 45
ACS Paragon Plus Environment
Energy & Fuels
123456789101112131415161718192021222324252627282930313233343536373839404142434445464748495051525354555657585960
6
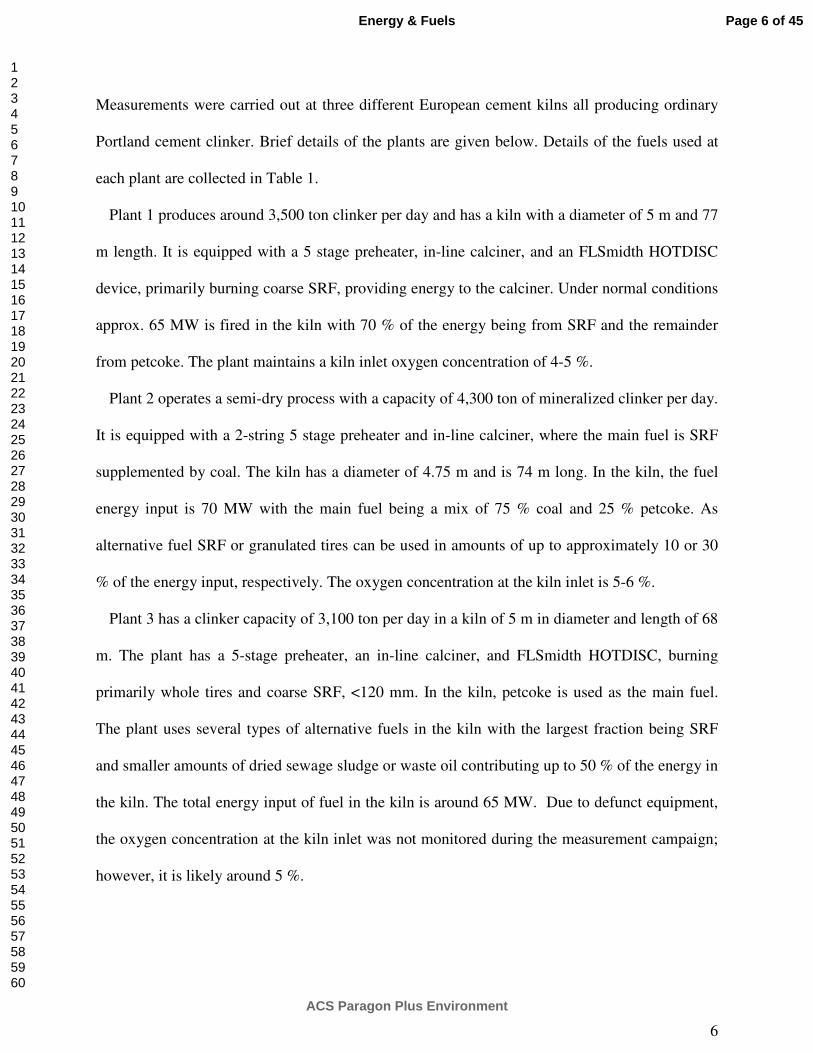
Measurements were carried out at three different European cement kilns all producing ordinary
Portland cement clinker. Brief details of the plants are given below. Details of the fuels used at
each plant are collected in Table 1.
Plant 1 produces around 3,500 ton clinker per day and has a kiln with a diameter of 5 m and 77
m length. It is equipped with a 5 stage preheater, in-line calciner, and an FLSmidth HOTDISC
device, primarily burning coarse SRF, providing energy to the calciner. Under normal conditions
approx. 65 MW is fired in the kiln with 70 % of the energy being from SRF and the remainder
from petcoke. The plant maintains a kiln inlet oxygen concentration of 4-5 %.
Plant 2 operates a semi-dry process with a capacity of 4,300 ton of mineralized clinker per day.
It is equipped with a 2-string 5 stage preheater and in-line calciner, where the main fuel is SRF
supplemented by coal. The kiln has a diameter of 4.75 m and is 74 m long. In the kiln, the fuel
energy input is 70 MW with the main fuel being a mix of 75 % coal and 25 % petcoke. As
alternative fuel SRF or granulated tires can be used in amounts of up to approximately 10 or 30
% of the energy input, respectively. The oxygen concentration at the kiln inlet is 5-6 %.
Plant 3 has a clinker capacity of 3,100 ton per day in a kiln of 5 m in diameter and length of 68
m. The plant has a 5-stage preheater, an in-line calciner, and FLSmidth HOTDISC, burning
primarily whole tires and coarse SRF, <120 mm. In the kiln, petcoke is used as the main fuel.
The plant uses several types of alternative fuels in the kiln with the largest fraction being SRF
and smaller amounts of dried sewage sludge or waste oil contributing up to 50 % of the energy in
the kiln. The total energy input of fuel in the kiln is around 65 MW. Due to defunct equipment,
the oxygen concentration at the kiln inlet was not monitored during the measurement campaign;
however, it is likely around 5 %.
Page 6 of 45
ACS Paragon Plus Environment
Energy & Fuels
123456789101112131415161718192021222324252627282930313233343536373839404142434445464748495051525354555657585960

7
The three plants have different burners from major burner suppliers. In plant 1 the burner was
recently changed to the JETFLEX burner from FLSmidth. This allowed a comparison of two
different burners at the same site. The JETFLEX Plus burner from FLSmidth is presented in
Figure 2. In the center of the burner a large pipe for solid alternative fuels is placed and below is
an additional channel, which is used to insert a lance for oxygen enrichment at Plant 1. The
center is surrounded by an annular channel with vanes for swirl air, followed by annular channels
for petcoke and then gas. On the outside are 20 nozzles for the axial air. The nozzles can turn
individually 360° and further help to shape the flame. The burner was a retro-fit and the coal and
gas channels were reused from the existing burner installation at the site.
Figure 2: The Jetflex Plus burner from FLSmidth installed at Plant 1.
Details of the fuels used at the three plants are shown in Table 1. The analysis of the fuel is on
a wet basis. The samples for coal and petcoke listed for Plant 2 and 3 are taken from the stock at
the respective plants. Thus, the moisture content is relatively high compared to that of Plant 1.
Before being used in the kiln the solid fossil fuels are grinded in mills to a particle size < 100 µm
Page 7 of 45
ACS Paragon Plus Environment
Energy & Fuels
123456789101112131415161718192021222324252627282930313233343536373839404142434445464748495051525354555657585960
8
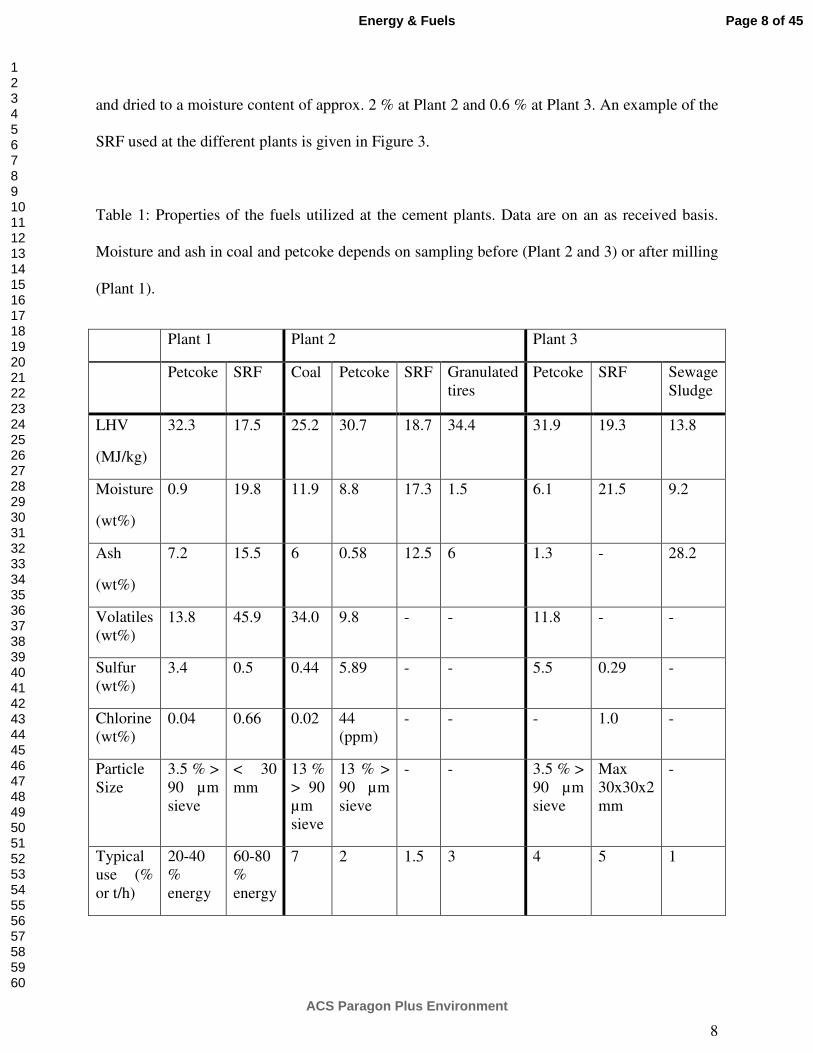
and dried to a moisture content of approx. 2 % at Plant 2 and 0.6 % at Plant 3. An example of the
SRF used at the different plants is given in Figure 3.
Table 1: Properties of the fuels utilized at the cement plants. Data are on an as received basis.
Moisture and ash in coal and petcoke depends on sampling before (Plant 2 and 3) or after milling
(Plant 1).
Plant 1 Plant 2 Plant 3
Petcoke SRF Coal Petcoke SRF Granulated
tires
Petcoke SRF Sewage
Sludge
LHV
(MJ/kg)
32.3 17.5 25.2 30.7 18.7 34.4 31.9 19.3 13.8
Moisture
(wt%)
0.9 19.8 11.9 8.8 17.3 1.5 6.1 21.5 9.2
Ash
(wt%)
7.2 15.5 6 0.58 12.5 6 1.3 - 28.2
Volatiles
(wt%)
13.8 45.9 34.0 9.8 - - 11.8 - -
Sulfur
(wt%)
3.4 0.5 0.44 5.89 - - 5.5 0.29 -
Chlorine
(wt%)
0.04 0.66 0.02 44
(ppm)
- - - 1.0 -
Particle
Size
3.5 % >
90 µm
sieve
< 30
mm
13 %
> 90
µm
sieve
13 % >
90 µm
sieve
- - 3.5 % >
90 µm
sieve
Max
30x30x2
mm
-
Typical
use (%
or t/h)
20-40
%
energy
60-80
%
energy
7 2 1.5 3 4 5 1
Page 8 of 45
ACS Paragon Plus Environment
Energy & Fuels
123456789101112131415161718192021222324252627282930313233343536373839404142434445464748495051525354555657585960

9
Figure 3: SRF used at plant 1 (a), Plant 2 (b), and Plant 3 (c).
Another important aspect of how the burners operate, is the use of primary air which is used to
shape the flame.7 This is typically divided into axial air, which adds axial momentum to the
flame, and swirl (radial) air, which may create internal recirculation zones and stabilize the
flame.20,21
Transport air is also used to pneumatically convey the fuel through the burner. In
addition air is used to cool the burner, often called central air, and occasionally some air can be
used to disperse alternative fuels.16
Table 2 contains an overview of the primary air used at the
kiln burners at the three different cement plants.
Table 2: Amount and pressure of primary air typically used in the burners at the three cement
plants. Plant 3 uses a burner with no separate swirl air channel.
Plant 1 Plant 2 Plant 3
Old Burner New Burner
Primary Air Amount (m3/h) 12000 12000 6200 6600
Axial Air Pressure (mbar) 230 210 300 220
Swirl Air Pressure (mbar) 240 150 40 -
Other Air Pressure (mbar) 50 10 70 100
Transport Air Amount (m3/h) 4000 4000 4400 4200
a) b) c)
Page 9 of 45
ACS Paragon Plus Environment
Energy & Fuels
123456789101112131415161718192021222324252627282930313233343536373839404142434445464748495051525354555657585960

10
Fraction Primary Air
(% of total combustion air)
~20 ~20 ~13 ~10
3. Results and Discussion
The main objective of this study has been to get an increased understanding of the effect that
alternative fuels have on the flame in the cement kiln based on visual observations. Several hours
of video footage under different operating conditions have been recorded at the cement plants
included in this study. In the following sections those hours of video recordings are condensed
into a few representative images of the flames. In addition, example videos are available as
supporting material.
The sketch in Figure 4a shows how the camera is inserted though the side of the kiln hood and
the approximate field of view into the kiln. The Image in Figure 4b shows the typical view seen
with the camera. On the right side of the image the burner tip is seen. The fuel is injected though
the burner forming a dark flame plume, which expands and becomes wider as it moves away
from the burner. At some point the fuel is ignited, giving a bright high intensity region. Below
the fuel plume, the hot clinker bed at the bottom of the kiln can be seen. Above the fuel plume
the opposite kiln wall can be observed. It is slightly darker than the clinker, indicating a lower
temperature. The camera can be moved around, which will change the view. For instance, the
camera can be turned downwards under the fuel plume, to observe if fuel drops to the clinker
bed. In the following the ignition point is defined as the distance from the burner where a sudden
change in image intensity is observed. The distance will be measured along the center of the fuel
plume. In Figure 4b this is seen as the point where the dark fuel plume changes color to bright
Page 10 of 45
ACS Paragon Plus Environment
Energy & Fuels
123456789101112131415161718192021222324252627282930313233343536373839404142434445464748495051525354555657585960

11
yellow/white. As seen in the image this occurs earlier at the top and bottom of the flame plume
compared to the center, but the center value will be used as the ignition point.
Figure 4: a) Sketch of the camera view (top view). b) Explanation of camera view.
The cement flame is characterized by a high degree of turbulent motion, which means that it is
constantly fluctuating. In addition, there can be various amounts of dust in the kiln, which can
influence the visibility. The images in Figure 5a-c are taken 0.4 seconds apart and show how the
flame ignition point and plume width change. To limit the effect of the short term variations an
average frame can be produced. The greyscale image in Figure 5d s has been averaged over 5
seconds. This concept will be used through the remainder of the paper, where images in color are
single frames from the recorded videos and images in greyscale are averaged over 5 seconds. In
the images, the distance to the burner tip has been estimated, with the numbers indicated in
meters. This will help estimate how much e.g. the ignition point is changed by different fuel
types. The description of how the distances are estimated is described in the supporting material.
Page 11 of 45
ACS Paragon Plus Environment
Energy & Fuels
123456789101112131415161718192021222324252627282930313233343536373839404142434445464748495051525354555657585960

12
Figure 5: a-c) Images taken 0.4 seconds apart showing the fluctuations in the kiln flame. d)
Frame averaged over 5 seconds. Images from Plant 1 during full petcoke load.
3.1. Results from Plant 1
3.1.1. Petcoke fired flame
A wholly petcoke fired flame from the old and new burners used at Plant 1 is seen in Figure 6.
First of all it is noticed that the petcoke is ignited relatively far from the burner with the earliest
ignition approximately 3 meters from the burner tip. This is generally one of the issues of using
petcoke in the cement kiln and is caused by the low volatile content of petcoke compared to coal,
cf. Table 1.22,23
It is seen that the new burner (Figure 6c+d) ignites the petcoke earlier than the
old burner (Figure 6a+b). As shown in Figure 5 the ignition point can fluctuate more than 1
meter in a short time, but on average the new burner has an ignition point between 3 and 4
meters from the burner, while the ignition point of the old burner is more than 4 meters away,
outside the frame of the image. The earlier ignition is caused by a more effective entrainment of
Page 12 of 45
ACS Paragon Plus Environment
Energy & Fuels
123456789101112131415161718192021222324252627282930313233343536373839404142434445464748495051525354555657585960
13
the hot secondary air into the fuel stream, which allows for a faster heat up of the fuel. This is
primarily achieved by three measures on the new burner. The swirl channel is located inside the
coal channel on the new burner, while it was located on the outside on the old burner. This has a
tendency to push the fuel outwards, where it meets with the hot secondary air.20
In addition, the
swirler channel vanes are angled more, which gives a higher tangential velocity to induce
swirling motion and increase mixing. Lastly, the axial air jets of the new burner will allow for an
increased secondary air entrainment compared to an annular air channel.11,24
It is generally
thought to be beneficial with a high amount of entrainment and early ignition as this gives a short
high temperature flame, where heat can easily be transferred to the clinker. An early ignition can
also help reduce NOx since less oxygen has had time to entrain into the flame.25,21
On the other
hand, when the swirl channel is located inside the petcoke channel, the fuel is pushed out into
more oxygen rich conditions, which may increase the NOx. 20,25,21
Page 13 of 45
ACS Paragon Plus Environment
Energy & Fuels
123456789101112131415161718192021222324252627282930313233343536373839404142434445464748495051525354555657585960

14
Figure 6: Images during full petcoke firing of old burner (a+b) and new burner (c+d). Old burner
operating with 250 mbar swirl air pressure and new burner operating with 190 mbar swirl air
pressure. Images from Plant 1.
3.1.2. Petcoke and SRF co-firing
Most of the time Plant 1 operates with a co-firing scenario where 60-80 % of the energy input is
supplied by SRF. The ratio between the fuels is used to control the burning zone temperature and
will typically be influenced by quality variations in the SRF. I.e. if the moisture content of the
SRF increases and the heating value decreases, it will be necessary to increase the amount of
petcoke to keep the temperature constant. Images of the co-firing case are seen in Figure 7. The
flame plume is narrower and lighter in color compared to the full petcoke cases shown in Figure
6 and the ignition point of the flames is moved further away from the burner. For the old burner,
Figure 7a+b, the ignition is still outside the image frame, more than 5 meters from the burner tip.
For the new burner, Figure 7c+d, the ignition point is around 5 meters from the burner, which is
Page 14 of 45
ACS Paragon Plus Environment
Energy & Fuels
123456789101112131415161718192021222324252627282930313233343536373839404142434445464748495051525354555657585960
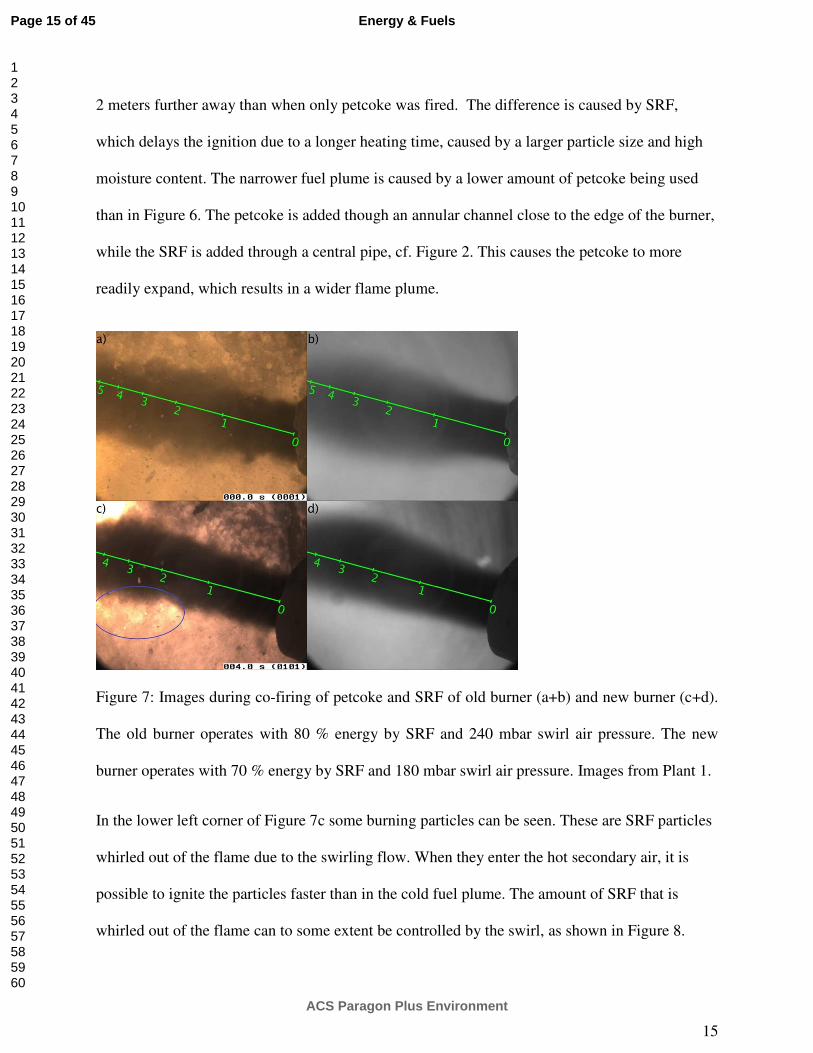
15
2 meters further away than when only petcoke was fired. The difference is caused by SRF,
which delays the ignition due to a longer heating time, caused by a larger particle size and high
moisture content. The narrower fuel plume is caused by a lower amount of petcoke being used
than in Figure 6. The petcoke is added though an annular channel close to the edge of the burner,
while the SRF is added through a central pipe, cf. Figure 2. This causes the petcoke to more
readily expand, which results in a wider flame plume.
Figure 7: Images during co-firing of petcoke and SRF of old burner (a+b) and new burner (c+d).
The old burner operates with 80 % energy by SRF and 240 mbar swirl air pressure. The new
burner operates with 70 % energy by SRF and 180 mbar swirl air pressure. Images from Plant 1.
In the lower left corner of Figure 7c some burning particles can be seen. These are SRF particles
whirled out of the flame due to the swirling flow. When they enter the hot secondary air, it is
possible to ignite the particles faster than in the cold fuel plume. The amount of SRF that is
whirled out of the flame can to some extent be controlled by the swirl, as shown in Figure 8.
Page 15 of 45
ACS Paragon Plus Environment
Energy & Fuels
123456789101112131415161718192021222324252627282930313233343536373839404142434445464748495051525354555657585960
16
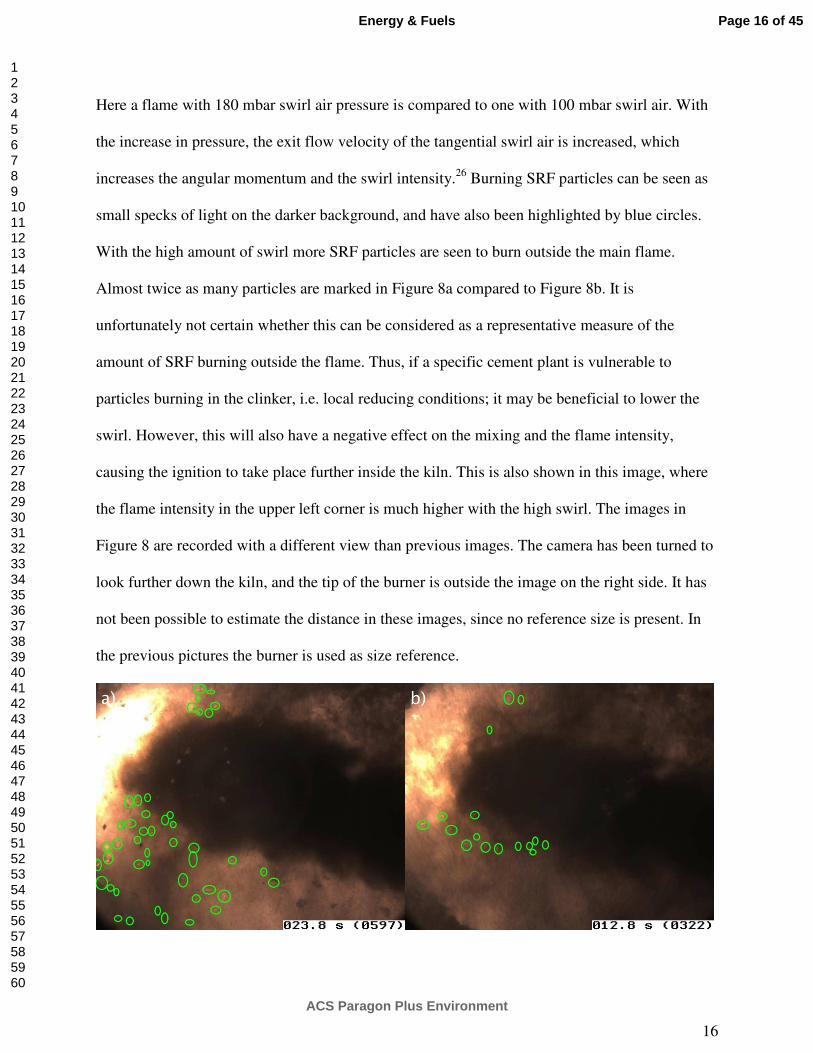
Here a flame with 180 mbar swirl air pressure is compared to one with 100 mbar swirl air. With
the increase in pressure, the exit flow velocity of the tangential swirl air is increased, which
increases the angular momentum and the swirl intensity.26
Burning SRF particles can be seen as
small specks of light on the darker background, and have also been highlighted by blue circles.
With the high amount of swirl more SRF particles are seen to burn outside the main flame.
Almost twice as many particles are marked in Figure 8a compared to Figure 8b. It is
unfortunately not certain whether this can be considered as a representative measure of the
amount of SRF burning outside the flame. Thus, if a specific cement plant is vulnerable to
particles burning in the clinker, i.e. local reducing conditions; it may be beneficial to lower the
swirl. However, this will also have a negative effect on the mixing and the flame intensity,
causing the ignition to take place further inside the kiln. This is also shown in this image, where
the flame intensity in the upper left corner is much higher with the high swirl. The images in
Figure 8 are recorded with a different view than previous images. The camera has been turned to
look further down the kiln, and the tip of the burner is outside the image on the right side. It has
not been possible to estimate the distance in these images, since no reference size is present. In
the previous pictures the burner is used as size reference.
Page 16 of 45
ACS Paragon Plus Environment
Energy & Fuels
123456789101112131415161718192021222324252627282930313233343536373839404142434445464748495051525354555657585960

17
Figure 8: Co-firing with the new burner at Plant 1 with 180 (a) and 100 (b) mbar swirl air
pressure. Images from Plant 1. Burning SRF particles are highlighted by green circles. Distances
are not indicated in the figure since no reference size is present.
3.1.3. SRF fired flame
The petcoke that is fired in an annular channel around the SRF blocks for a clear view of the
SRF flow and combustion behavior. At plant 1 it was possible to turn off the petcoke for a brief
period to study how the SRF behaves when injected into the kiln. In Figure 9 these results are
presented. A small amount of residual petcoke is present in the annular channel in the pictures of
the old burner (Figure 9a-c). The fuel flow from the old burner is characterized by a low degree
of dispersion, where the fuel follows the initial injection trajectory. The low degree of fuel
dispersion is detrimental to the combustion of the fuel, since it creates a dense cold core in the
flame, which inhibits ignition. When the camera view is changed, cf. Figure 9c, it can be seen
how the particles continue far inside the kiln without being ignited. It can be assumed that the
particles will eventually land in the clinker bed largely unconverted. The new burner is better at
dispersing the SRF particles. After an initial ~1 m where the SRF is densely packed, it starts to
spread out. Some particles still tend to follow the injection trajectory, which can be observed in
the averaged image of Figure 9f. This is primarily caused by denser lumps of particles, which are
difficult to disperse. One such lump can be tracked in Figure 9d and e, which are taken 0.3
seconds apart. These lumps are most likely caused by the feeding system. In this case the SRF is
fed through a rotary feeder located ~20 meters behind the burner. The feeder rotates and its
compartments are blown clean by the conveying air, which tends to generate the fuel lumps,
which can be observed at the burner tip. With a more uniform feeding, it would likely be easier
to disperse the particles properly.
Page 17 of 45
ACS Paragon Plus Environment
Energy & Fuels
123456789101112131415161718192021222324252627282930313233343536373839404142434445464748495051525354555657585960

18
Figure 9: Images during 100 % SRF firing for old burner (a+b+c) and new burner (d+e+f). The
old burner operates a swirl air pressure of 240 mbar. The new burner with a swirl air pressure of
150 mbar. The camera has been turned further downstream in image c, than in the other images.
The total primary air flow for the two burners is the same at approx. 12,000 m3/h, but the old
burner operates at a significantly higher swirl pressure, 240 mbar compared to 150 mbar. This
should allow for a higher tangential velocity and the possibility to obtain a higher angular
momentum. However, as evident from the images, the swirl is not utilized to affect the flow of
SRF. The design of the new burner with a higher angle of the swirl vanes and the channel located
close to the SRF seems highly beneficial for the dispersion of SRF in the kiln.
The main advantage of the higher dispersion of particles is a better mixing with the hot
secondary air, which leads to an earlier ignition. Some burning particles can be observed in the
top and bottom left corners of the images in Figure 9d and e, when the fuel leaves the cold fuel
core. The high degree of fuel spreading also causes some of the fuel particles to be whirled out of
Page 18 of 45
ACS Paragon Plus Environment
Energy & Fuels
123456789101112131415161718192021222324252627282930313233343536373839404142434445464748495051525354555657585960
19
the flame by the centrifugal forces generated by the swirl. In the cement industry, this is
traditionally viewed as a negative thing, since it can lead to local reducing conditions in the kiln
bed, which promotes brown clinker, stabilization of belite, and increased sulfur evaporation.13,27–
30 However, this does not appear to be a specific issue at the plant, where, generally, the quality
of the clinker is good, with an alite content above 65 wt.%. Brown clinker and build-ups have not
been reported by the plant operators, which suggests that the plant is insensitive to reducing
conditions. In fact, it may be beneficial to purposely spread the fuel near the kiln outlet, where
the oxygen concentration is high and the clinker nodules are already formed, since the
evaporation of sulfur will be limited by the smaller surface area for evaporation.27
In addition,
the energy contained in the fuel will be released before the clinker burning zone and contribute to
increasing the temperature here, presumably yielding an increased cement quality. Experiments
carried out by Nørskov16
have shown that injecting alternative fuels too far into the kiln limits
the possible substitution in the cement kiln, and just substitutes calciner firing. This will be
discussed in further detail later.
Table 3 contains measures of the key parameters that the burner performance is measured on.
Most importantly, with the new burner it was possible to achieve an increased use of SRF while
the petcoke consumption was lowered, resulting in a higher energy share of SRF. At the same
time the clinker alite content, which is a measure of the quality, increased. Operation of the old
burner was supported by oxygen enrichment at the burner where 460 Nm3/h of oxygen was used
to increase the combustion quality. With the new burner this was not necessary, and the oxygen
was only used on a few test days. The clinker production was slightly lower with the new burner.
In conclusion, the changes in the design were shown to give an earlier ignition and increased
dispersion of SRF, resulting in an improved performance.
Page 19 of 45
ACS Paragon Plus Environment
Energy & Fuels
123456789101112131415161718192021222324252627282930313233343536373839404142434445464748495051525354555657585960

20
Table 3: Comparison of key operating parameters for the old and new kiln burners at Plant 1.
Values are averages for one month of operation. Ignition point data from Figure 6 and Figure 7.
SRF Energy
Share
Clinker
Alite
Content
Oxygen
enrichment
at burner
Clinker
Production
Ignition Point
% Wt% Nm3/h t/h m
Old
Burner
62.7 65.3 460 147 Petcoke: >4 m
Co-firing: >5 m
New
Burner
67.5 67.5 37 144 Petcoke: 3-4 m
Co-firing: 5 m
Change
in %
7.7 3.5 -91.9 -1.8 -
3.2. Results from Plant 2
The fuel dosing during the test day at Plant 2 and the kiln drive power consumption are shown in
Figure 10. The power consumption of rotating the kiln is often used as a relative measure of the
kiln tempearture.31
As the temperature rises, more material will melt inside the kiln, which will
make it more difficult to rotate the kiln, increasing the kiln torque and power consumption.
However, the power will also be influenced by other factors such as the amount of material in the
kiln or the rotational speed.
Before 13:00, the kiln was fired exclusively with a mix of coal and petcoke. At 13:15 the SRF
amount was increased to 1.5 t/h. This level can normally be tolerated at plant without issues. Just
after 16:00 the SRF firing was increased to 4.5 t/h for 20 minutes, while the coal was reduced to
7.5 t/h. There are generally large fluctuations in the kiln drive power consumption during the day
Page 20 of 45
ACS Paragon Plus Environment
Energy & Fuels
123456789101112131415161718192021222324252627282930313233343536373839404142434445464748495051525354555657585960

21
even though the kiln firing is kept constant. This is caused by changes in the kiln feed and
calciner firing, which are not shown here. However, as the SRF is increased to 4.5 t/h there is a
sudden large drop in the kiln power, which is clear when observing Figure 10b, where the
gradient of the power consumption is shown. A rapid increase is seen as the SRF is reduced back
to 1.5 t/h. The drop in power consumption can indicate a lower temperature in the kiln, which
will lower the cement quality. The kiln operator also reported an increased amount of dust in the
cooler with increased SRF. This may indicate increased sulfur volatilization caused by local
reducing conditions.
Figure 10: a) Fuel dosing of coal/petcoke, and SRF and the kiln drive power consumption
(secondary axis) during the test day. b) Gradient of the power consumption. Data from Plant 2.
3.2.1 Fossil fuel fired flame
The fossil fired flame from Plant 2 is shown in Figure 11. The plant fires a mix of 75 % of coal
and 25 % petcoke. The flame is seen to ignite very close to the burner, around 1-2 meters from
the tip, compared to the 3-4 meters at Plant 1, which was shown in Figure 6. This is generally
due to the high volatility of the coal, compared to petcoke, cf. Table 1. The flame is seen to
ignite in an uneven pattern, which is clear in Figure 11a and c. The burner is designed with a
number of axial air jets surrounding the coal inlet. Four larger gaps are made between some of
Page 21 of 45
ACS Paragon Plus Environment
Energy & Fuels
123456789101112131415161718192021222324252627282930313233343536373839404142434445464748495051525354555657585960

22
the jets, which allows for a place where additional secondary air can entrain into the fuel jet. This
heats up the fuel quickly and ignites it. The three images in Figure 11 underline the turbulent
nature of the kiln flame, which constantly fluctuates. In Figure 11a, the ignition point is very
close to the burner, while it is more removed in Figure 11b.
Figure 11: Images of the coal/petcoke fired flame with 10.5 t/h coal/petcoke. Images from Plant
2.
3.2.2 Co-fired flame
Example images from the recorded videos with SRF co-firing are seen in Figure 12. The ignition
point is between 2-4 meters from the burner, which is 2 meters further away than in the coal fired
flame. The flame also appears less intense, indicating a lower flame temperature. This is a
similar observation to the co-firing case seen at Plant 1 and is likely caused by a reduction in the
coal amount and a longer heating and burning time of the larger SRF particles, which delays the
ignition.
The flame appears to ignite earlier at the bottom. This may be due to high radiation from the
hot clinker below the flame, which gives an uneven heating of the fuel. It may also be caused by
the flow of the secondary air from the clinker cooler, which is mainly coming from below.32
The
ignition at the side is no longer as pronounced as for the coal fired flame, although it is still seen
to some extent e.g. in Figure 12c. The longer ignition time and lower flame intensity are
Page 22 of 45
ACS Paragon Plus Environment
Energy & Fuels
123456789101112131415161718192021222324252627282930313233343536373839404142434445464748495051525354555657585960

23
expected to cause a lower temperature near the burner, which also lowers the clinker burning
zone temperature. As seen in Figure 10, there is also a slight reduction in the kiln drive power
consumption, when the SRF firing is increased to 4.5 t/h. This is also an indication of a lowered
temperature in the kiln caused by the SRF.
Figure 12: Images of co-firing of coal/petcoke with SRF. 7.5 t/h coal/petcoke is used with 4.5 t/h
SRF (30 % SRF energy input). Images from Plant 2.
A side by side comparison of the coal/petcoke fired flame and the flame co-fired with SRF is
shown in Figure 13. In this figure, the videos have been averaged over 5 seconds. This evens out
the turbulent changes, which are observed in Figure 11 and Figure 12 and makes the comparison
more straightforward. It becomes evident how the ignition point is moved away from the burner,
when SRF is fired and how the intensity of the flame is also lowered, indicating a lower
temperature.
Page 23 of 45
ACS Paragon Plus Environment
Energy & Fuels
123456789101112131415161718192021222324252627282930313233343536373839404142434445464748495051525354555657585960

24
Figure 13: Comparison of the coal/petcoke fired flame (a) with the SRF co-fired flame (b).
Images are averaged over 5 seconds. Images from Plant 2.
Figure 14 shows a view under the flame along the wall of the kiln. This is done by turning the
camera downwards compared to the normal view used in Figure 11 and Figure 12. This view
gives an opportunity to track if particles have dropped out of the flame. During full fossil fuel
firing, there is no fuel to be seen outside the flame as indicated in
Figure 14a. When SRF is added to the flame, some particles fall out of the flame and they burn
on the wall or charge as shown in
Figure 14b+c. Only a very small number of particles are observed to drop out of the flame. It can
thus be concluded that most of the SRF stays in the flame, until the particles cannot be tracked
any longer due to the limited visibility. However, there are signs that the particles are not fully
converted in the flame, and will cause reducing conditions further downstream in the kiln.
Page 24 of 45
ACS Paragon Plus Environment
Energy & Fuels
123456789101112131415161718192021222324252627282930313233343536373839404142434445464748495051525354555657585960

25
Figure 14: View along the kiln wall and charge under the burner for coal-fired case (a) and co-
fired case (b+c). The kiln wall is seen in the left side of the images. The kiln bed can be seen on
the right side of the images having a more orange color than the wall. Burning particles are
bright spots in the images, which have been highlighted with green circles Images from Plant 2.
The high amount of SRF firing, 4.5 t/h, was only upheld for 20 minutes before the amount was
reduced to 1.5 t/h. The operator reported an increased dust load during the testing and there were
indications of a lower kiln temperature based on the kiln drive power consumption (cf. Figure
10). The increased dust load is presumably caused by local reducing conditions, since the SRF is
not fully converted while in suspension. The reducing conditions promote the decomposition of
CaSO4 and the evaporation of SO2, which results in recirculation and accumulation of sulfur.13
The sulfur creates a separate melt that is immiscible with the main clinker phases and has a low
viscosity and surface tension.33
It may thus have an adverse effect on the clinker nodulization
and increase the dust load,34
if too much sulfate melt is present. Excessive dust in the cooler and
kiln inhibit the heat transfer and cools the burning zone.35
Comparing the images from Plant 2
with those of Plant 1 also show a significantly lower visibility in Plant 2, presumably due to a
high dust load. One of the reasons for this is that the kiln manufactures mineralized clinker,
where fluoride and sulfur are used as mineralizers/fluxes to lower the burning zone temperature
requirement.36,37
Mineralized clinker may be burnt at temperatures around 200 °C lower than
Page 25 of 45
ACS Paragon Plus Environment
Energy & Fuels
123456789101112131415161718192021222324252627282930313233343536373839404142434445464748495051525354555657585960

26
normal clinker.36
This may first appear promising for the use of alternative fuels (AF), which
tend to burn at lower temperatures.12
However, the mineralized clinker is also more sensitive to
process changes38
and as observed at Plant 2, even relatively small amounts of AF cannot be
handled, due to increased sulfur volatility.
3.3. Results from Plant 3
The fuel dosing used during the test day at Plant 3 is shown in Figure 15a and selected process
measurements are shown in Figure 15b. Specifically, the measurements include the kiln torque
and a number of temperature measurements to indicate the kiln burning zone temperature. The
plant uses an infrared pyrometer and thermographic camera to gauge the temperature in the near
burner zone of the kiln as well as a thermocouple measuring the temperature in the kiln hood.
Initially, the SRF dosing has been 6 t/h, but due to a low temperature in the kiln, at 15:30 the
dosing was lowered to 5 t/h and the petcoke dosing increased. This resulted in a temperature
increase, which can be seen by the pyrometer or camera temperature in Figure 15b. The petcoke
was deliberately shut off from 16:00 to 16:30, in order to better observe the SRF flight behavior
in the kiln. In the meantime, gas was used instead to keep the energy input to the kiln constant.
Page 26 of 45
ACS Paragon Plus Environment
Energy & Fuels
123456789101112131415161718192021222324252627282930313233343536373839404142434445464748495051525354555657585960

27
Figure 15: a) Fuel dosing to the kiln burner during the test day. b) Temperatures as measured by
pyrometer, thermographic camera, kiln hood thermocouple and the kiln torque during the test
day. Gas and kiln torque are plotted on secondary axes. Data from Plant 3.
3.3.1. Co-fired flame
The co-fired flame from Plant 3 is shown in Figure 16. It takes approximately 4 meters from the
burner tip before the flame is ignited. This is somewhat similar to what was seen in Plant 1,
where petcoke and SRF is also used, while Plant 2 had a very early ignition due to the volatile
coal. The images in the figure also underline the large changes that can occur in kiln conditions
when firing alternative fuels. The images of Figure 16b and c are recorded one hour apart, and
the intensity in Figure 16c is much higher, indicating a higher burning zone temperature. This is
caused by increasing the petcoke dosing by 1 t/h and reducing the SRF dosing by 1 t/h, and the
change is also consistent with the higher temperature measurements, as seen in Figure 15.
Page 27 of 45
ACS Paragon Plus Environment
Energy & Fuels
123456789101112131415161718192021222324252627282930313233343536373839404142434445464748495051525354555657585960

28
Figure 16: Flame of petcoke co-fired with SRF and sewage sludge. a+b) 3 t/h petcoke, 1.5 t/h
sewage sludge, 6 t/h SRF (60 % AF energy input), recorded at 14:56. c) 4.3 t/h petcoke, 1.5 t/h
sewage sludge, 5 t/h SRF (45 % AF energy input), recorded at 15:45. Images from Plant 3.
The flame at Plant 3 is sometimes very divergent compared to Plant 1 and 2, which can cause the
flame to impinge on the bed as shown in Figure 17a. This should generally be avoided since it
may overheat the refractory and contribute to local reducing conditions.16
The design of the
burner differs from that used at the other plants. The other burners have separate channels for
axial and swirl air, while the Plant 3 burner has only one channel, where the swirl level is
adjusted by increasing the tangential angle of the air inlets. If the angle becomes too high, it
seems that the burner lacks axial momentum to stabilize the flame, causing a very diverging
flame. A relatively small amount of SRF particles are whirled out of the flame close to the burner
as also indicated in Figure 17a. Further inside the kiln, just around the point where the petcoke
ignites approximately 6 meters from the burner, some burning particles can be observed in the
kiln bed, see Figure 17b. In the videos, several burning particles can be seen around this point,
which indicates that it is where the SRF particles begin to drop out of the flame.
Page 28 of 45
ACS Paragon Plus Environment
Energy & Fuels
123456789101112131415161718192021222324252627282930313233343536373839404142434445464748495051525354555657585960

29
Figure 17: View of the co-fired flame from the side (a) and under the burner (b). Flames in bed
are located by green circles. Fuels: 4.3 t/h petcoke, 5 t/h SRF, 1.5 t/h sewage sludge (45 % AF
energy input). Images from Plant 3.
3.3.2. Flame with Natural Gas
The SRF is fired though a pipe at the center of the burner, which is surrounded by an annular
channel for the injection of petcoke. Similarly to Plant 1 the visibility of the SRF flow is
obstructed by the petcoke. In an attempt to understand the SRF flow better the petcoke was
turned off for a brief amount of time. To keep the heat input to the kiln, gas was supplied instead,
as shown in Figure 15 at around 16:15. While the gas flow is increased, from 0 to approx. 500
Nm3/h, the ignition point moves closer to the burner tip from approx. 6 meters to 2 meters, cf.
Figure 18. The combustion also becomes more intense, with the image becoming more
oversaturated. It would seem that this could be quite a viable method to increase the ignitability
of the co-fired flame and obtain a high temperature region close to the burner. However, the
price of natural gas in most countries will probably make this kind of operation unfeasible. Per
unit of energy, gas may be more than four times as expensive as petcoke.39
The pyrometer
measuring the flame temperature is seen to increase from around 1000 °C to 1050 °C, with a
Page 29 of 45
ACS Paragon Plus Environment
Energy & Fuels
123456789101112131415161718192021222324252627282930313233343536373839404142434445464748495051525354555657585960

30
peak at 1100 °C, around the time where the petcoke dosing is lowered. The kiln hood
temperature increases in the same period, which also indicates an increased temperature near the
kiln outlet. The temperature measured by the kiln camera installed at the plant, however, has a
lower reading, while the gas is being fired. The kiln torque is also seen to decrease, which may
indicate less heating further inside the kiln. Gas flames normally produce small amounts of soot
compared to coal flames, which results in a lower flame emissivity.40
The heat transfer from
flame to clinker bed can thus be inhibited. This could explain the lower clinker temperatures
measured by the camera and the lower kiln torque.
Figure 18: Different flame shapes while the gas flow is increased over 200 seconds from 0 (a+d)
to 500 (c+f) Nm3/h. Petcoke dosing is constant at 4.3 t/h. Top row shows single frames and
bottom row are images averaged over 5 seconds. Images from Plant 3.
Some images of the SRF and gas fired flame without petcoke are shown in Figure 19. The
visibility of the SRF changes from frame to frame as shown in the sequence of images in Figure
19, which is mainly due to the natural variations in flame ignition. In Figure 19b it is seen that
Page 30 of 45
ACS Paragon Plus Environment
Energy & Fuels
123456789101112131415161718192021222324252627282930313233343536373839404142434445464748495051525354555657585960

31
the SRF is quite hard to ignite, and it passes at least 6 meters from the burner tip without being
ignited, and then disappears in the gas flame. It is very likely to continue further inside before
being properly ignited and the conversion in the flame may be low. The SRF is not packed as
densely as seen in Plant 1 (cf. Figure 9) when it enters, which is likely due to a lower feeding
rate. The dispersion of the SRF appears to be better than for the old burner in Plant 1, and similar
to what is achieved for the new burner at Plant 1. A significant amount of small flames can be
seen in the bed, in the lower part of the images of Figure 19. This indicates that a large fraction
of the SRF may burn in contact with the clinker rather than in suspension.
Figure 19: SRF and gas fired flame. 5 t/h SRF, 1.5 t/h sewage sludge, and 4500 Nm3/h natural
gas (45 % AF energy input). Images from Plant 3.
3.5 Limiting Factors for Alternative Fuel Firing
It is highly beneficial to understand the limiting factors for alternative fuel (AF) firing in order to
eventually increase the amount of AF firing. Thus, some of the issues encountered at the three
plants when firing AF will be discussed in further details here.
Plant 1 fires the highest amount of alternative fuels in the kiln of the three plants studied here.
The plant produces clinker with an alite content above 65 %, which is a typical level for Portland
cement.41
Issues with brown clinker or build-ups in the kiln or preheater have not been observed
during the measurements with SRF. The plant has a chlorine by-pass and several air blasters are
Page 31 of 45
ACS Paragon Plus Environment
Energy & Fuels
123456789101112131415161718192021222324252627282930313233343536373839404142434445464748495051525354555657585960

32
installed in the preheater tower to combat build-ups. The main limitation is the lower combustion
temperatures obtained during SRF firing. If the SRF firing gets too high, the kiln temperature is
lowered. Thus, petcoke is needed to create a high temperature zone to get adequate clinker
quality. The petcoke is also used to adjust the burning zone temperature when the SRF heating
value or moisture content changes. The plant has previously used oxygen enrichment in the kiln
to stabilize the operation at high SRF firing and lower the petcoke consumption. The installation
of the new burner has been beneficial for Plant 1. It has been possible to increase the alite
content of the clinker, which resulted in increased compressive strength of cement mortar.
Furthermore, the substitution with SRF was increased and oxygen enrichment was no longer
used. The main difference between the designs of the two burners has been discussed in chapter
3.1, and is related to the mixing intensity achieved by the burners and the ability of the new
burner to spread the SRF in the combustion zone.
Plant 2 fires the lowest amount of AF and has a low tolerance. This appears to be mainly
caused by the manufacture of mineralized clinker, which is more sensitive to reducing conditions
since the sulfur loading is higher than for ordinary clinker. The limit of SRF firing appears to be
around 2 t/h, while the plant can tolerate up to 3 t/h of the granulated tire. In a study by Nielsen
et al.42
, tire granulate was found to be able to release more sulfur from cement raw materials than
plastic and wood, which are the main constituents of SRF. Thus, the reason that a higher amount
of granulated tires can be tolerated is most likely related to the smaller particle size. This results
in a faster conversion of the fuel, resulting in less fuel ending up in the kiln bed to induce
reducing conditions.
Plant 3 uses an intermediate amount of alternative fuels in the kiln. The produced clinker has
an alite content above 60 % (calculated by Bogue formulas43,44
). Plant 3 sometimes encounters
Page 32 of 45
ACS Paragon Plus Environment
Energy & Fuels
123456789101112131415161718192021222324252627282930313233343536373839404142434445464748495051525354555657585960

33
problems with reducing conditions, when firing too much alternative fuels. This is seen as brown
cores in the cement clinker and some deposit build-ups in the calciner and cement kiln. The plant
recently installed a by-pass to reduce the volatile circulation, which is expected to alleviate some
of the problems with build-ups, and may allow for a further increase in the use of alternative
fuels.
An interesting difference between Plant 1 and Plant 3 is shown in Figure 20. The figure shows
the relationship between the fraction of alternative fuels firing at the main burner and the energy
input at the main burner and calciner (Hotdisc included) for Plant 1 (Figure 20a) and for Plant 3
(Figure 20b). The data plotted in the figure are based on hourly averages from one month of
operation giving a large degree of data scatter. The Pearson correlation coefficient45
has been
calculated as a measure for the relationship between the variables. Normally, around 60 % of the
total fuel used in the cement process will be fired in the calciner and the remainder in the kiln.
This is because the calcination of limestone is highly endothermic requiring 1800 kJ/kg.46
This is
also the balance at both plants when no AF is fired in the kiln. At Plant 1, the heat input at the
burner and calciner is rather independent of the amount of AF fired at the main burner. However,
at Plant 3, the energy input at the kiln is increased as the amount of AF in the kiln is increased,
while the firing in the calciner is reduced. This shifts the balance between kiln and calciner firing
and when high amounts of AF are utilized around 60 % of the energy is fired in the kiln. This
indicates that the fuel energy form the AF is not released quickly enough to contribute to
increasing the clinker burning zone temperature, and rather substitutes firing in the calciner. At
Plant 1, the correlation is small, indicating that the fuel fired in the main burner is actually
utilized in the kiln. Thus, there are indications that AF burns closer to the kiln exit at Plant 1 than
at Plant 3. Nørskov16
made some experiments with different injection velocities of AF and found
Page 33 of 45
ACS Paragon Plus Environment
Energy & Fuels
123456789101112131415161718192021222324252627282930313233343536373839404142434445464748495051525354555657585960

34
that an injection velocity of 30 m/s was to be preferred over a velocity of 50 m/s. The high
injection velocity causes the fuel to be injected too far into the kiln, and the energy is not
released in a proper location to contribute in rising the clinker temperature. It is possible that a
lower injection velocity of AF at plant 3 could ensure that the SRF is not injected too far into the
kiln, which allows for the energy to be released in the clinker burning zone.
Figure 20: Relationship between the energy from alternative fuels firing at the main burner (MB)
and the energy input in the kiln (red dots) and the calciner (black x) for Plant 1 (a) and Plant 3
(b). Data are based on hourly averages for one month of operation. ρ is Pearson correlation
coefficient.
Another large difference between the plants is their tolerance to reducing conditions. At Plant 1
neither brown clinker or deposits were observed during testing, at Plant 2 the dust load in the kiln
is increased when utilizing high amounts of AF due to sulfur evaporation, and at Plant 3 brown
clinker and deposits are sometimes encountered. The difference may largely be caused by the
sulfur evaporation in the kiln. The sulfur evaporation may be limited if there is a high amount of
alkalis in the clinker, since alkali sulfates are less volatile than calcium sulfate. One measure is
the sulfur modulus calculated as:47
(a) (b)
Page 34 of 45
ACS Paragon Plus Environment
Energy & Fuels
123456789101112131415161718192021222324252627282930313233343536373839404142434445464748495051525354555657585960

35
���� =
���
80
��
94+ ��
62
The sulfur modulus calculated for the clinker of the three plants is on average 0.64, 1.51, and
0.84. A value around 1 is adequate to ensure that there is sufficient alkali to combine with the
sulfur.47
It can thus be seen that Plant 2 operates at a high sulfur modulus, due to the high input
of sulfur in the mineralized clinker, but this also means that it is more susceptible to sulfur
evaporation caused by reducing conditions. The sulfur modulus for Plant 1 and Plant 3 are low
enough that most of the sulfur should be able to combine with alkalis. However, comparing the
fuels of Plant 1 and 3, cf. Table 1, it is seen that the sulfur content of the petcoke used in Plant 3
is higher than that in Plant 1 and the chlorine content of the SRF is higher. The plant will thus
have a higher input of sulfur and chlorine though the fuel, which may set a limit for the
utilization of alternative fuels. In addition, Plant 3 did not have a by-pass to lower the amount of
recirculating species. Thus, Plant 3 is likely to be more vulnerable to reducing conditions causing
sulfur evaporation and deposits than Plant 1.
Brown core clinker is also sometimes encountered at Plant 3. The brown color is caused by a
reduction of Fe3+
to Fe2+
, which may substitute MgO in the ferrite phase (C4AF), which
otherwise gives cement its dark grey color. The reduced iron can also affect the formation of
alite, lowering the cement quality.28–30
Alternative fuels are burned in contact with the bed in
both Plant 1 and Plant 3, but Plant 1 tolerates it better, with no formation of brown clinker. It
may be related to where the AF mainly burns, which was discussed above and illustrated in
Figure 20. If the AF burns too far inside the kiln it may drop into a bed of un-nodulized clinker,
with a large surface area which may be more prone to iron reduction.27
If the AF mainly burns
close to the burner where the nodules have already formed, the surface area for evaporation of
Page 35 of 45
ACS Paragon Plus Environment
Energy & Fuels
123456789101112131415161718192021222324252627282930313233343536373839404142434445464748495051525354555657585960
36
sulfur and iron reduction is significantly smaller and the oxygen concentration will be higher.
The brown clinker cores may also be related to the rate of clinker cooling. Locher29
showed that
the adverse effects of burning under reducing conditions could be limited by a rapid cooling
from 1250 °C in air. Perhaps high clinker porosity will be beneficial to counter brown cores,
since it will help oxygen to diffuse in and reoxidize the clinker during cooling.
In summary, all three plants are limited by the conversion rate of the alternative fuels. For
Plant 1 the main limitation is that the AF does not burn quickly enough to obtain sufficiently
high temperatures. Thus, some petcoke is needed to maintain a high temperature and proper heat
transfer to the clinker. At Plant 2 and Plant 3 the main limitation is that the fuel is not converted
quickly enough before ending in the bed, eventually leading to localized reducing conditions in
the kiln. It would be interesting to study if the utilization could be improved by drying or milling
of SRF to obtain faster conversion of the fuel. Excess heat typically available in the off-gasses
could be used to dry alternative fuels, but milling of SRF is difficult due to the soft paper and
plastic fractions48
and impurities that may damage the mill.
4. Conclusions
A specially developed camera setup has been used to study the kiln flames at 3 different cement
plants. The probe was designed so it could be inserted directly in the cement kiln hood where the
temperature is around 1000 °C and the dust load is high. This allowed for a detailed study of the
influence of alternative fuels on the cement kiln flame.
An overview of the flames studied at the three different cement plants is given in
Table 4. Adding alternative fuel to the flame had at all three cement plants a negative impact
on the flame. At Plant 1 the ignition point was between 3-4 meters from the burner tip when
petcoke was fired alone, and when SRF was added to the flame the ignition point was between 5-
Page 36 of 45
ACS Paragon Plus Environment
Energy & Fuels
123456789101112131415161718192021222324252627282930313233343536373839404142434445464748495051525354555657585960

37
6 meters from the burner tip. At Plant 3 the ignition point was at a similar distance while co-
firing petcoke and SRF. The flame at Plant 2 ignited within 1 meter. A mix of coal and petcoke
was used, which ignites more readily than the petcoke at Plant 1 and 3 due to a higher volatile
content of the coal. At Plant 2 the ignition point was also shifted approx. 2 meters when SRF was
added to the flame. At all three plants, the flame intensity was also lowered when using AF,
which indicates a lower combustion temperature. This is mainly due to the high moisture content
and large particle size of alternative fuels compared to conventional fuels, which results in a
lower conversion rate of the fuel. At Plant 2 and Plant 3 measurements of the kiln drive power
consumption also suggested that the temperature in the kiln was decreased when co-firing AF.
The lower temperatures in the kiln may negatively affect the clinker quality.
Table 4: Overview of the impact of alternative fuels on the flame ignition point at the three
cement plants. C: Coal, PC: Petcoke, SRF: Solid Recovered Fuel, SS: Sewage Sludge
Plant 1 Plant 2 Plant 3
Old Burner New Burner
Flame Fossil Co-
fired
Fossil Co-
fired
Fossil Co-
fired
Co-
fired 1
Co-
fired 2
Figure 6 a+b 7 a+b 6 c+d 7 c+d 11 + 13
a
12 + 13
b
16 c 18 c+f
Fuel
(t/h)
-
- -
- PC: 2.1
C: 8.4
SRF: 0
PC: 1.5
C: 6
SRF:
4.5
PC: 4.3
SRF: 5
SS: 1.5
PC: 4.3
SRF: 5
SS: 1.5
Gas:
500
Nm3
AF
Energy
0 80 0 70 0 30 45 45
Page 37 of 45
ACS Paragon Plus Environment
Energy & Fuels
123456789101112131415161718192021222324252627282930313233343536373839404142434445464748495051525354555657585960

38
Share
(%)
Ignitio
n Point
(m)
> 4 > 5 3-4 ~5 1-2 2-4 ~4 ~2
At all three plants, it was observed how some of the SRF drops out of the flame and burns in
contact with the cement clinker. At Plant 2 and 3 this leads to problems with sulfur evaporation
or brown cored clinker, while Plant 1 appears to be more robust to local reducing conditions.
Why this is the case is not fully understood, but Plant 2 is sensitive to reducing conditions due to
manufacturing mineralized clinker and has a low Alkali-Sulfur Ratio, which makes sulfur
evaporation more probable. For Plant 1 and Plant 2 there may be a difference in where the SRF
mainly burns or there could be a difference in the cooling which can prevent reduced clinker.
The burner design does have a significant influence on the flame. The burner design at Plant 2
could create ignition sources, by allowing secondary air to be entrained into the fuel stream in a
few locations. A clear difference in the two burner designs tested at Plant 1 was observed. The
change from an annular axial air channel to axial air jets benefited the ignition when using
petcoke. The design of the swirl channel influences the flame swirl level, increasing the
dispersion of SRF particles in the flame. The old burner at Plant 1 had very little dispersion of
the SRF. This creates a cold core of SRF in the flame, which will be difficult to ignite and the
SRF will continue far into the kiln and eventually land in the clinker bed, likely largely
unconverted. Alternatively, the SRF can be spread as much as possible, which occurs with the
new burner at Plant 1. This will evidently result in more SRF dropping out of the flame and
ending up in the clinker bed close to the burner. On the other hand, the energy in the fuel will be
released earlier, contributing better to maintain a high temperature in the clinker burning zone.
Page 38 of 45
ACS Paragon Plus Environment
Energy & Fuels
123456789101112131415161718192021222324252627282930313233343536373839404142434445464748495051525354555657585960

39
Based on the results presented here, the second option with a high degree of fuel dispersion
appears beneficial. It may also reduce the problems with localized reducing conditions induced
by fuel in the bed, since the fuel will be in contact with nodulized clinker, which has a relatively
small surface area, in the part of the kiln where the oxygen concentration is highest. By changing
the burner at Plant 1, it was possible to increase the alite content of the clinker while increasing
the substitution of SRF.
Page 39 of 45
ACS Paragon Plus Environment
Energy & Fuels
123456789101112131415161718192021222324252627282930313233343536373839404142434445464748495051525354555657585960

40
ASSOCIATED CONTENT
Selected videos from the three plants
Description of distance estimation in images
AUTHOR INFORMATION
Corresponding Author
* E-mail address: [email protected].
Present Addresses
†Dall Energy, Venlighedsvej 2, 2970 Hørsholm, Denmark
ACKNOWLEDGMENT
The work of this article is established within the framework of the advanced technology
platform ''Minerals and Cement Process Technology'' funded by the Danish National Advanced
Technology Foundation, FLSmidth A/S, Hempel A/S, and the Technical University of Denmark.
The authors wish to thank our industrial collaborators, who have allowed us to do measurements
at their plants. The help of Jens Henry Poulsen of DTU who manufactured the video probes used
for this study is highly appreciated. Christian Andersen of FLSmidth A/S who helped during
measurements is also thanked.
ABBREVIATIONS
AF, Alternative Fuel; ASR, Alkali-Sulfur Ratio; C, Coal; MB, Main burner; PC, Petcoke; SRF,
Solid Recovered Fuel; SS, Sewage Sludge
Page 40 of 45
ACS Paragon Plus Environment
Energy & Fuels
123456789101112131415161718192021222324252627282930313233343536373839404142434445464748495051525354555657585960

41
REFERENCES
(1) Sarc, R.; Lorber, K.; Pomberger, R.; Rogetzer, M.; Sipple, E. Waste management &
research 2014, 32 (7), 565–585.
(2) Mokrzycki, E.; Uliasz- Bochenczyk, A. Applied Energy 2003, 74 (1–2), 95–100.
(3) Usón, A. A.; López-Sabirón, A. M.; Ferreira, G.; Llera Sastresa, E. Renewable and
Sustainable Energy Reviews 2013, 23, 242–260.
(4) Larsen, M. B. Alternative Fuels in Cement Production, PhD Thesis, Technical University
of Denmark: Kgs. Lyngby, Denmark, 2007.
(5) Velis, C. A.; Longhurst, P. J.; Drew, G. H.; Smith, R.; Pollard, S. J. T. Critical Reviews in
Environmental Science and Technology 2010, 40 (12).
(6) Krüger, B.; Mrotzek, A.; Wirtz, S. Waste Management 2014, 34 (2), 390–401.
(7) Wirthwein, R.; Emberger, B. Cement International 2010, 8 (4), 42–46.
(8) Liedmann, B.; Arnold, W.; Krüger, B.; Becker, A.; Krusch, S.; Wirtz, S.; Scherer, V. Fuel
2017, 200, 252–271.
(9) Vainikka, P.; Bankiewicz, D.; Frantsi, A.; Silvennoinen, J.; Hannula, J.; Yrjas, P.; Hupa,
M. Fuel 2011, 90 (5), 2055–2063.
(10) Dunnu, G.; Hilber, T.; Schnell, U. Energy & Fuels 2006, 20 (4), 1685–1690.
(11) Emberger, B.; Hoenig, V. Cement International 2011, 9 (5), 48–60.
Page 41 of 45
ACS Paragon Plus Environment
Energy & Fuels
123456789101112131415161718192021222324252627282930313233343536373839404142434445464748495051525354555657585960

42
(12) Hiromi Ariyaratne, W. K.; Malagalage, A.; Melaaen, M. C.; Tokheim, L.-A. International
Journal of Modeling and Optimization 2014, 4 (4), 263–272.
(13) Cortada Mut, M. D. M.; Nørskov, L. K.; Frandsen, F. J.; Glarborg, P.; Dam-Johansen, K.
Energy and Fuels 2015, 29 (7), 4076–4099.
(14) D’Hubert, X. Global Cement Magazine 2017, No. February, 12–23.
(15) D’Hubert, X. Global Cement Magazine 2017, No. March, 10–18.
(16) Nørskov, L. K. Combustion of solid alternative fuels in cement kiln burners, PhD Thesis,
Technical University of Denmark, 2012.
(17) Schmidt, D. In 2007 IEEE Cement Industry Technical Conference Record; IEEE, 2007;
pp 140–146.
(18) Lin, B.; Jørgensen, S. B. Journal of Process Control 2011, 21 (4), 547–553.
(19) Verein Deutscher Zementwerke (VDZ). VDZ Activity Report 2005-2007; Düsseldorf,
Germany, 2008.
(20) Nobis, R. H. IEEE Transactions on Industry Applications 1991, 27 (5), 798–806.
(21) Vaccaro, M. H. IEEE-IAS/PCS 2002 Cement Industry Technical Conference. Conference
Record 2002, No. May, 265–270.
(22) Mullinger, P. J.; Jenkins, B. G. World Cement 1987, No. 2, 48–56.
(23) Roy, G. World cement 2002, 33 (4).
(24) Wagner, A. Cement International 2004, 2, 88–97.
Page 42 of 45
ACS Paragon Plus Environment
Energy & Fuels
123456789101112131415161718192021222324252627282930313233343536373839404142434445464748495051525354555657585960

43
(25) Lowes, T. M.; Evans, L. P. Zement-Kalk-Gips 1993, No. 12, 761–768.
(26) Chigier, N. A. Astronautica Acta 1972, 17, 387–395.
(27) Choi, G.-S.; Glasser, F. Cement and Concrete Research 1988, 18 (3), 367–374.
(28) Long, G. R. Philosphical Transactions of the Royal Society A 1983, 310, 43–51.
(29) Locher, F. W. World Cement Technology 1980, 11 (2), 67–73.
(30) Ichikawa, M.; Komukai, Y. Cement and Concrete Research 1993, 23 (4), 933–938.
(31) Young, G. L.; Miller, F. M. In Innovations in Portland Cement Manufacturing; Bhatty, J.
I., Miller, F. M., Kosmatka, S. H., Bohan, R. P., Eds.; Portland Cement Association:
Skokie, Illinois, USA, 2011; pp 311–342.
(32) Moles, F. D.; Watson, D.; Lain, P. B. Journal of the Institute of Fuel 1973, 353–362.
(33) Borgholm, H. E.; Herfort, D.; Rasmussen, S. World Cement 1995, No. 8, 27–33.
(34) Petersen, I. F.; Johansen, V. Cement and Concrete Research 1979, 9 (5), 631–639.
(35) Tackie, E. N.; Watkinson, A. P.; Brimacombe, J. K. The Canadian Journal of Chemical
Engineering 1989, 67, 806–817.
(36) Moir, G. K. Philosophical Transactions of the Royal Society A: Mathematical and
Physical 1983, 310 (1511), 127–138.
(37) Emanuelson, A.; Hansen, S.; Viggh, E. Cement and Concrete Research 2003, 33 (10),
1613–1621.
(38) Bhatty, J. I. Use of Fluxes and Mineralizers in the Cement Industry: A Survey.; 1996.
Page 43 of 45
ACS Paragon Plus Environment
Energy & Fuels
123456789101112131415161718192021222324252627282930313233343536373839404142434445464748495051525354555657585960
44
(39) Greco, C.; Picciotti, G.; Greco, R. M.; Ferreira, G. M. In Innovations in Portland Cement
Manufacturing; Bhatty, J. I., Miller, F. M., Kosmatka, S. H., Bohan, R. P., Eds.; Portland
Cement Association: Skokie, Illinois, USA, 2011; pp 239–308.
(40) Hewlett, P. C. Lea’s Chemistry of Cement and Concrete, 4th ed.; Butterworth-Heinemann,
1998.
(41) Schorct, F.; Kourti, I.; Scalet, B. M.; Roudier, S.; Sancho, L. D. Best Available Techniques
(BAT) Reference Document for the Production of Cement, Lime and Magnesium Oxide;
Sevilla, Spain, 2013.
(42) Nielsen, A. R.; Larsen, M. B.; Glarborg, P.; Dam-Johansen, K. Energy & Fuels 2011, 25
(9), 3917–3924.
(43) Bogue, R. H. Industrial and Engineering Chemistry Analytical Edition 1929, 1 (4), 192–
197.
(44) Taylor, H. F. W. In Cement Chemistry; Thomas Telford, 1997.
(45) Benesty, J.; Chen, J.; Huang, Y.; Cohen, I. In Noise Reduction in Speech Processing;
Springer: Berlin, 2009; Vol. 2, pp 37–40.
(46) CRC Handbook of Chemistry and Physics, 97th ed.; Haynes, W. M., Ed.; CRC Press,
2016.
(47) Theisen, K.; Jøns, E.; Osbæck, B. In Innovations in Portland Cement Manufacturing;
Bhatty, J. I., Miller, F. M., Kosmatka, S. H., Bohan, R. P., Eds.; Portland Cement
Association: Skokie, Illinois, USA, 2011; pp 365–400.
Page 44 of 45
ACS Paragon Plus Environment
Energy & Fuels
123456789101112131415161718192021222324252627282930313233343536373839404142434445464748495051525354555657585960

45
(48) Maier, J.; Gerhardt, A.; Dunnu, G. In Solid Biofuels for Energy; Grammelis, P., Ed.;
Springer: London, 2011; pp 75–94.
Page 45 of 45
ACS Paragon Plus Environment
Energy & Fuels
123456789101112131415161718192021222324252627282930313233343536373839404142434445464748495051525354555657585960