imaging life with bright x-rays
TRANSCRIPT

ImaginglifewithbrightX-raysRajmundMoksoMaxIVLaboratory

I. IntroductiontoMAXIVI. Sourceandbeamlines
II. Currentlyavailabletechniques
I. Nanoprobeandscattering
III. SelectedSciencecases(futurecapabilitiesatMAXIV)I. Invivosmallanimals,variousfixedtissues

Electronsource
Ring(528mcircumf)
Linearaccelerator(ca250m)
Ring(96mcircumf)
Experimentalstations
TheMAXIVAccelerators
Properties:
Wide band
High intensity/Brilliance
Polarization
Time structure
PicturesandanimationbyS.Werin

MAXIVmagnetticdesign
SimonC.LeemannDESYBeschleuniger-Betriebsseminar,Travemünde,October31–November3,2016
TheMAXIV3GeVStorageRing(cont.)
25
• 528mcircumference,500mAwithtop-up,20achromats• 19longstraights(4.6m)forusers,1forinjecHon• 40shortstraights(1.3m)forRF&diagnosHcs• 7-bendachromat:5unitcells(3°)&2matchingcells(1.5°LGB)• 328pmradbarelaSceemiiance(εyadjustedto2-8pmrad)
PRST-AB12,120701(2009)
IPAC’11,THPC059,p.3029
JSR21,862-877(2014)
15x [m]
y [m]
5 10 20 25
2.0 MC UC MCUC UC UCUC

The7bendachromatEachachromatconsistsof5unitcellsplus2matchingcells

MAXIVmagnets
achromat 3D cad assembly:
M1
U1 U2
U3
U4
U5
M2
• Each cell is realized as one mechanical unit containing all magnet elements.
• Each unit consists of a bottom and a top yoke half, machined out of one solid iron block, 2.3-3.4 m long.
Martin Johansson, Workshop on Accelerator R&D for Ultimate Storage Rings, Huairou, Beijing, China, Oct 30-Nov 1, 2012
4/19
SimonC.LeemannDESYBeschleuniger-Betriebsseminar,Travemünde,October31–November3,2016
TheMAXIV3GeVStorageRing(cont.)
25
• 528mcircumference,500mAwithtop-up,20achromats• 19longstraights(4.6m)forusers,1forinjecHon• 40shortstraights(1.3m)forRF&diagnosHcs• 7-bendachromat:5unitcells(3°)&2matchingcells(1.5°LGB)• 328pmradbarelaSceemiiance(εyadjustedto2-8pmrad)
PRST-AB12,120701(2009)
IPAC’11,THPC059,p.3029
JSR21,862-877(2014)
MC UC MCUC UC UCUC

MAXIVstoragering
SimonC.LeemannDESYBeschleuniger-Betriebsseminar,Travemünde,October31–November3,2016
TheMAXIV3GeVStorageRing(cont.)
21
• 528mcircumference,500mAwithtop-up,20achromats
PRST-AB12,120701(2009)
IPAC’11,THPC059,p.3029
JSR21,862-877(2014)
• Duringthe2000sMAX-labbecomesconvincedithasthetechnologytorealizeanMBAlaSce– compactmagnets(narrowgaps➔shortbutstrong),magnetintegraHon(commonmagnetblock=“girder”),useofcombined-funcHonmagnets
SimonC.LeemannDESYBeschleuniger-Betriebsseminar,Travemünde,October31–November3,2016
MAXIVOrigins(cont.)
12
25mm
PhotocourtesyA.Nyberg

MedMAX
DiffMAX

X-raySynchrotronTechniques X-raySynchrotronBeamlines
MAXIVBeamlines
FLEXENHET, ÖSTRA TORN 27:12, LUNDS KOMMUN2017-01-16
FÅGELPERSPEKTIV FRÅN SYDOST
MedMAX
MedMAX?

MAXIVLIFEBiologyatdifferentlengthandtimescales
NanoMAXSoftiMAXMedMAXI BioMAXMedMAXIII MicroMAX
CellsTissues BiomoleculesOrgans
CellbiologyHistology/Histopathology
MolecularMedicine/ChemicalBiology
Smallanimals/diseasemodels
Animals
10-6m 10-9m 10-10m
AtomsMicro-structures
coSAXS
Molecularcomplexes
BalderDiffMAX
MembranesSurfaces
FemtoMAX
MolecularBiology/Biochemistry
MedMAXII
“in/exvivo” “Insolution”

TheMaxIVimagingbeamlines
11
MedMAXThebiomedicalimagingbeamline
(preparingCDR)
NanoMAXThenanofocusbeamline(usersin2017)
SoftiMAXSoftX-rays(inconstruction->2018)
DanMAXImaging&diffraction(inconstruction->2018)
2016 2017 2018 2019-20

I. IntroductiontoMAXIVI. Sourceandbeamlines
II. Currentlyavailabletechniques
I. Nanoprobeandscattering
III. SelectedSciencecases(futurecapabilitiesatMAXIV)I. Invivosmallanimals,variousfixedtissues

Title
March4,2019 [email protected]
x"
y"
! ! !! ! ! ! !!!
o Diffrac'on*
o !Ptychography*
o Fluorescence*
o Absorp'on*
2D!&!3D!!Structure!&!strain!
Elemental!distribu5on!Morphology!!
Bone!inner!structure!by!Ptychography!M"Dierolf"et*al."Nature*2010""467,"4364439""
Ga!density!map!by!XRF!G."Mar9nez4Criado"et*al**Nano*Le;."(2012)"12,"5829*
Strain!in!SiGe!device!by!Bragg!ptychography!S."O."Hruszkewycz"et"al."arXiv:1506.01262v1""
[cond4mat.mtrl4sci]""
o Materials*science*
o Life*science*
Malaria!pigment!in!red!blood!cell!by!XRF!F."Dubasr"et"al."Chem."Commun"2012"48,"910"
V
Structure!and!transport!in!GaAsby!InESitu!XRD!G."Bussone"te"al.*Nano*Le;."2015,"15"981*
Focusingbeamto~40nm(10nm)Cleanandwithhighdegreeofcoherence

source
S=150m
5 µm
Nanoimaging,Fluorescencespectroscopy
March4,2019 [email protected]
A neuron cell phase image
Mokso,Cloetensetal.,APL2007
Chemical element distribution
levels of iron, we studied two different cell culture models,PC12 cells and primary midbrain neurons, over-expressing α-synuclein after viral vector infection. Over-expression of α-synuclein in these models resulted in α-synuclein accumula-tion in the perinuclear region, similarly to previously de-scribed results, e.g., in COS-7 cells infected with the samerecombinant α-synuclein adenovirus [31]. Similar resultswere also obtained with different systems of α-synucleinover-expression, such as in SH-SY5Y cells transfected withwild-type α-synuclein [32] and in cortical neurons transfectedwith wild-type α-synuclein-GFP fusion protein [33].
Our study reveals that α-synuclein over-expression both inprimary midbrain neurons and PC12 cells exposed to excess
iron results in increased iron levels compared to cells express-ing endogenous levels of α-synuclein. Previous studies haveshown thatα-synuclein could bind iron, either Fe(III) or Fe(II)[13], and thatα-synuclein was shown to act as a ferrireductase[24], but a direct evidence for Fe increase inα-synuclein over-expressing cells was missing. Our data present iron-rich inclu-sions accumulating within perinuclear regions where α-synuclein is over-expressed. This further supports the bindingbetween iron and α-synuclein which may explain the accu-mulation of intracellular iron in the cells over-expressing α-synuclein compared to control cells after iron treatment(Fig. 6). Although our data do not directly evidence the olig-omerization and aggregation of α-synuclein, it is noteworthy
Fig. 5 Optical views and nano-SXRF imaging of chemical element distributions in a a PC12 cell treated with excess Fe (null vector, U0+Fe) and b aPC12 cell over-expressing α-synuclein and treated with excess Fe (α-Syn+Fe). Scale bar 5 μm
Table 1 Number and sizedistribution of Fe-rich inclusionsin PC12 cells over-expressing α-synuclein (Syn+Fe) and in null-vector control cells (U0+Fe), bothexposed to excess iron. ANOVAanalysis of variance
U0+Fe Syn+Fe ANOVA
Number of cells analyzed 9 11 –
Mean number±SD of Fe-rich grains (>200 nm)/cell 69±37 34±27 0.0246
Percentage of Fe-rich grains±SD of diameter <600 nm 91±7 65±23 0.0046
Percentage of Fe-rich grains±SD of diameter >600 nm 9±7 35±23 0.0047
Mol Neurobiol (2016) 53:1925–1934 1929
Ortega.,Mol.Neurobiol.2016
NanoMAX

NanoMAXFluorescenceCamappingEmbryonicmousegrowthplate
Phasecontrastx-raytomography(TOMCAT,PSI)Distalhumerus,mouseTS24
Growthplate,hypertrophiczone,MouseTS23
NanoMAX:firstusers
HannaIsaksson,LundUniversityNiamhNowlan,ImperialCollage,London
1µm
20µm

Humannervecells–diabetestype2
XRFimagingofhumannervecellsofdiabetestype2person.SamplesstainedwithOsmium.Leftimage25x20um2.CourtesyofLarsDahlin&MartinBech,BMCLundUniversity.
XRF-Osselected

Humanperipheralnerves
17
L.Dahlin,M.Bech,LundUni.
ExperimentatESRF,ID16A

Humanperipheralnerves(diabetes)
LarsDahlinandMartinBech,MedicalFaculty,LundUniversity
NodeofRanvier=normalnervefibers
=regenerativeclusters
MedMAX : sub-micrometer resolution 3D histology

Fluorescencespectroscopicimagingin3D
March4,2019 [email protected]
observed by de Jong et al.,76 and while they do not commenton this, we suspect that it was likely due to the use of an air-dried sample rather than radiation damage, necessitated by thepioneering nature of the work. However, as with any X-rayexposure intensive method, the possibility of radiation damage
is a significant concern, and this is discussed in section 2.11. Inthe interests of clarity, we note that coordinate systemsalternative to that shown in Figure 23 are often employed; forexample, the z-direction is often defined as the direction of theX-ray beam with x being the orthogonal horizontal axis and ybeing vertical.Just as with two-dimensional chemically specific imaging,
chemically specific fluorescence tomography is a practicalexperiment, and at least one report has been published.77 Anexample is shown in Figure 25, of a seedling of the two-groovedmilk vetch (Astragalus bisulcatus) germinated in 5 mM selenatesolution. Unlike adult plants grown in the absence of selenate,26
seedlings tolerate high concentrations of selenate without anyapparent ill effects. The tomography in this example clearlyshows the selenate in the transport vessels of the seedling withorganic selenium forms in the tissues. We note that μ-XAS inwhich an XAS spectrum of a specific voxel can be acquired isnot practical with fluorescence tomography, although this hasbeen reported for transmittance tomography.72,78 Tomographicreconstruction artifacts develop if inadequate numbers of anglesφ are collected, and these appear as radial lines (spokes) intomographic reconstructions. We note that these are present toa small degree in Figure 25. Artifacts due to attenuation of theincident and fluorescent X-rays are not likely to be importantfor small samples such as the diatom examined by de Jong etal.,76 but for large samples correction for attenuation of boththe incident and the fluorescent X-ray beams may be important.For samples that have significant internal variation in X-raycross section, this will be a function both of X-ray energy and ofthe orientation of the sample within the experiment, so thatdifferent corrections may be needed for different values of x, φ,and y (Figure 23), making absorption correction a very
Figure 24. X-ray fluorescence tomography of an air-dried single-celledfreshwater diatom Cyclotella meneghiniana. The silicacious frustule hasbeen removed to show inner detail. Adapted with permission from ref76. Copyright 2010 National Academy of Sciences.
Figure 25. Chemically specific fluorescence tomographic reconstruction of a seedling from the selenium hyperaccumulating plant Astragalusbisulcatus. Absorbance (a) and fluorescence X-ray maps at low (b) and high energies (c) (12 661.08 and 12 667.28 eV, respectively) together withthickness (d) and chemically specific maps (amounts) for Se-methyl-selenocysteine (e), and selenate (f). The radicle (r) and cotyledons (ct) areshown in (a). Sinograms for absorbance (g) and fluorescence at low (h) and high (i) energies are also shown. The dotted lines in (a)−(c) show thez-value used for the tomography. Tomographic reconstruction of the data in (a)−(i) is shown in (k)−(n), the tomogram for Se-methyl-selenocysteine (k), selenate (l), and transmittance (m). The tricolor plot in (n) compares the localizations of Se-methyl-selenocysteine (red),selenate (green), and calcium (blue). The circle visible in the tomographic reconstruction of transmittance (m) corresponds to the sample support, aclear plastic metal-free drinking straw. The faint radial structures visible in the figure are artifacts of the tomographic reconstruction. Data werecollected on SSRL 9-3.
Chemical Reviews Review
dx.doi.org/10.1021/cr4007297 | Chem. Rev. 2014, 114, 8499−85418517
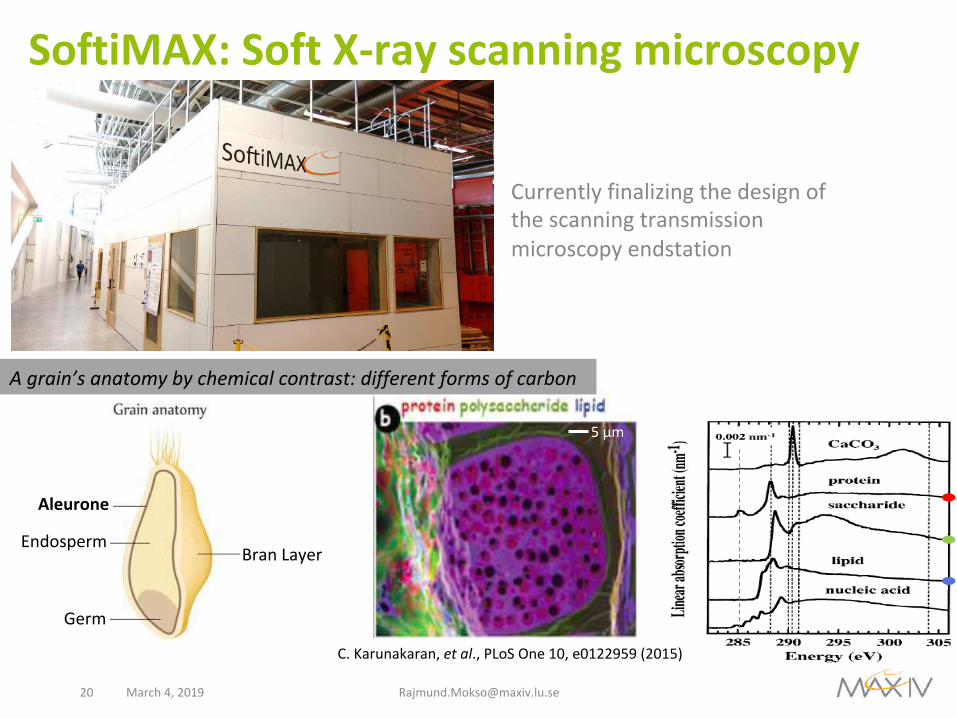
SoftiMAX:SoftX-rayscanningmicroscopy
March4,2019 [email protected]
Currentlyfinalizingthedesignofthescanningtransmissionmicroscopyendstation
5µm
AleuroneEndosperm
Germ
BranLayer
C.Karunakaran,etal.,PLoSOne10,e0122959(2015)
Agrain’sanatomybychemicalcontrast:differentformsofcarbon

21RajmundMokso
PRINCIPLES DENSITY TIME SPACE
SoftX-raymicroscopy
spatialresolution~30nm
Soft X-ray tomography of rapidly frozen Saccharomyces cerevisiae cells imaged at each phase of cell cycle – G1, S, M, and G2. Organelles are color- coded as follows: blue, nucleus; orange, nucleolus; gray, mitochondria; ivory, vacuoles; green, lipid bodies.
Larabell & Nugent, Current Opinion in Structural Biology (2010)
Imaging cells with hard X-rays still a big challenge.
While it is almost a routine with soft X-rays
2μm
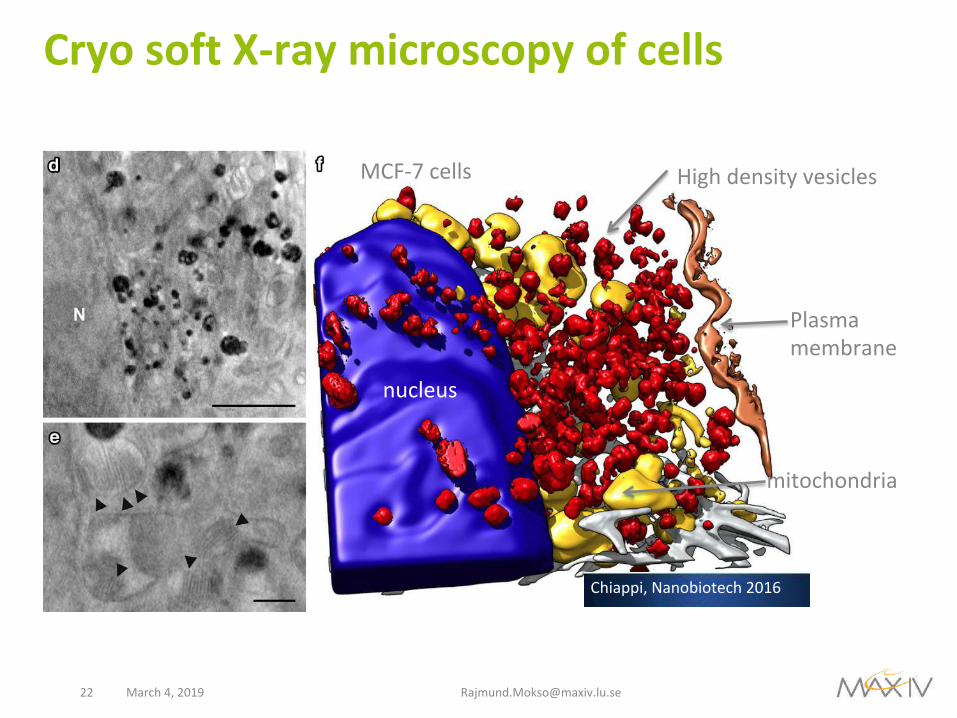
CryosoftX-raymicroscopyofcells
March4,201922 [email protected]
Page 4 of 10Chiappi et al. J Nanobiotechnol (2016) 14:15
and after cell vitrification, in cryo-conditions (Fig. 2c) to assure that no cell rearrangement was induced by vit-rification (Additional file 3: Figure S2). Reconstructed cryo-SXT volumes had a resolution of ~60 nm, suffi-cient to visualise mitochondrial cristae (Fig. 2d, e, arrow-heads). We also observed other cellular components such as intermediate filaments, actin bundles (Fig. 2f, grey) or plasma membrane (Fig. 2d, f, brown), as well as organelles such as the nucleus, including nucleolus and chromatin condensations (Fig. 2d, f; Additional file 4: Figure S3).
Cryo-soft X-ray tomograms of SPION-incubated MCF-7 cells showed an increase in high-absorption clus-ters at longer incubation times, which correlated with the
LysoTracker Red signal (Fig. 2; Additional files 2 and 4: Figures S1D–F and S3). Three-dimensional reconstruc-tion of whole cells showed high-absorption clusters con-centrated mainly near the nucleus, although they were also found scattered throughout the cytoplasm; they were never found inside the nucleus (Fig. 2f; Additional file 4: Figure S3). These results coincide with the increase in SPION-loaded endocytic vesicles reported using clas-sical 2D techniques [10, 12]. Volumetric representa-tion of cells showed mitochondrial exclusion to the cell periphery caused by high-absorption cluster accumula-tion near the nucleus (Fig. 2f, yellow; Additional file 5: Movie 2). The high-absorption clusters inside cells had a non-homogeneous internal substructure, consistent with
Fig. 2 Fluorescent and cryo-SXT correlative workflow. a In vivo differential interference contrast (DIC) image of MCF-7 cells cultured on Au-HZBII grid and incubated 24 h with SPION (0.25 mg ml−1). Bar 200 μm. b In vivo fluorescent image from the area in the yellow square in a. Bar 20 μm. Nucleus, blue (DAPI), acidic vesicles, red (LysoTracker Red). c Cryo-epifluorescent image (red channel) from the area in the yellow square in b. Bar 5 μm. d Cryo-SXT plane from the area in the yellow square in c. N, nucleus. Bar 2 μm. e Cryo-SXT plane showing ultrastructural details of the cell. Arrowheads indicate mitochondrial cristae. Bar 500 nm. f Volumetric representation of the tomogram in d. High-absorption vesicles (red), seg-mented applying a threshold adapted to the volume containing the highest densities, are condensed near the nucleus (blue), displacing the mitochondrial network (yellow). Grey filaments, orange plasma membrane. Dataset acquired at HZB-BESSYII
Highdensityvesicles
nucleus
mitochondria
Plasmamembrane
Chiappi,Nanobiotech2016
MCF-7cells

DanMAX:tomographyanddiffractionformaterials
- studyrealmaterialsatrealconditionsatrealtimescales.- CombiningpowderX-raydiffraction(PXRD)andfullfieldimagingMAX$IV$Laboratory$is$a$na1onal$laboratory$hosted$by$Lund$University.$
Major&Funders:&The&Swedish&Research&Council&/&VINNOVA&/&Lund&University&/&Skåne&Regional&Council&/&Knut&and&Alice&Wallenberg&FoundaHon&/&Chalmers&University&of&Technology&/&Karlstad&
University&/&Karolinska&InsHtutet&/&KTH&Royal&InsHtute&of&Technology&/&Linköping&University&/&Luleå&University&of&Technology&/&Stockholm&University&/&Swedish&University&of&Agricultural&Sciences&/&Umeå&University&/&University&of&Gothenburg&/&Uppsala&University&/&Estland&/&Finland&/&Danmark&
MAX$IV$Laboratory$
Imaging$Beamlines$at$
X=ray$source$(IVU)& undulator&Energy$(wavelength)$
range&12$=$40$keV$(1$–$0.3$Å)$&
X=ray$energy$bandwidth& ΔE/E$~$0.1=1$%&Beam$modes& $parallel$beam,$focused$beam,$expanded$beam&Focusing$optics& Kirkpatrick=Baez$(KB)$mirror$pair$(VFM,$HFM)&Beam$size$at$sample& Without$op1cs$~$1x1$mm$
With$beam$expandor:$25x25$mm$
&Flux$at$sample$at$0.5$Å& 1014$photons/s&
&Experiment$set=up& Microtomographic$endsta1on,$in$vivo$small$rodent$
imager&&
Spa1al$resolu1on& 30$=>$1$μm,$200$nm$in$case$of$focused$beam$
Alexander)Björling,)Gerardina)Carbone,)Ulf)Johansson,)Sebas:an)Kalbfleisch,)Innokenty)Kantor,))Rajmund)Mokso,)Jörg)Schwenke,)Tomas)Stankevic,)and)Karina)Thånell))&&The&MAX&IV&imaging&group&consists&of&four&beamlines:&NanoMAX&entered&user&operaHon&in&2017;&SoWiMAX&is&in&construcHon&and&MedMAX& and& iMAX& is& in& design& phase.& The& group& is& complemented& by& the& DanMAX& beamline& which& will& devote& half& of& the&operaHon& Hme& to& imaging.& All& four& beamlines& will& be& situated& on& the& 3& GeV& ring.& NanoMAX& and& SoWiMAX& are& opHmized& as&scanning&nanoprobes,&while&DanMAX&will&host&a&full\fieldµtomography&instrument&and&MedMAX&will&address&soW&ma^er&and&biological&samples&with&the&main&design&goal&being&longitudinal&in&vivo&studies&at&sub\10&um&spaHal&resoluHon.&
2016 2018 2020
2017 2019 Science cases
&conceptual
design
Detailed design&
funding update construction
procurement &
construction
first experiments
Acute&in\vivo&and&ex\vivo&tomography&at&the&Hssue&scale&(1&μm&resoluHon)&&&
StaHc&tomography&at&the&cellular&scale&(0.2\1&μm&resoluHon)&
&
In&vivo&
longitudinal&
whole&animal&
scale&&
(15\30&μm&
resoluHon)&
&
&&&&&&&&&The&pordolio&of&MAX&IV&imaging&beamlines NanoMAX Coherent&diffracHon&imaging Materials,&bio Now&in&2D,&later&in&3D
SoWiMAX Scanning&and&holographic&methods materials,&bio Mainly&2D
MedMAX In&vivo&(fast)&tomographicµscopy Bio,&soW&ma^er Hme&resolved&X\ray&movies&(4D)
DanMAX Tomographicµscopy&&&diffracHon materials time resolved X-ray movies (4D)
iMAX In&situ&(fast)&tomographicµscopy materials Hme&resolved&X\ray&movies&(4D)
x"
y"
! ! !! ! ! ! !!!
o Diffrac'on*
o !Ptychography*
o Fluorescence*
o Absorp'on*
2D!&!3D!!Structure!&!strain!
Elemental!distribu5on!Morphology!!
Bone!inner!structure!by!Ptychography!M"Dierolf"et*al."Nature*2010""467,"4364439""
Ga!density!map!by!XRF!G."Mar9nez4Criado"et*al**Nano*Le;."(2012)"12,"5829*
Strain!in!SiGe!device!by!Bragg!ptychography!S."O."Hruszkewycz"et"al."arXiv:1506.01262v1""
[cond4mat.mtrl4sci]""
o Materials*science*
o Life*science*
Malaria!pigment!in!red!blood!cell!by!XRF!F."Dubasr"et"al."Chem."Commun"2012"48,"910"
V
Structure!and!transport!in!GaAsby!InESitu!XRD!G."Bussone"te"al.*Nano*Le;."2015,"15"981* [email protected]
ScanningTransmissionX-raymicroscopy
•Thebeamline providescoherent monochromaticx-rays ontoazoneplate.•Thezoneplate projectsanano-sizedbeamontothesample.•Thesampleisscanned throughthebeam.•Theintensityofthetransmitted x-raybeamismeasuredineachspot.•Thex-rayenergyisscannedthroughanabsorptionedge.
700 710 720 730Energy(eV)
Fe
Fe
The&Hard&and&SoW&X\ray&Nanoprobe&Beamlines&SoftiMAX:
Scanning&transmission&X\rayµscopy&Coherent&X\ray&imaging&(ptychography)&&
First&users&in&Dec&2016&
Starts&operaHon&end&2018&
Scienceexamples–STXM
C.Everettetal.,JROYALSOCINTERFACE11,20140165(2014)
STXMimagesandcarbonK-edgespectraofanAβ/iron(III)peptide(incubated)
Raster-scanningmethodwithsmallprobesize
• Sensitivetoabsorptionandphasegradient
CarbonK-edge IronL-edge
Tomographic&Microscopy&Beamlines&MedMAX: Biomedical and soft matter tomography
DanMAX: Tomography and diffraction for materials
See&poster:&&&
P7$\ICTMS2017\122&&&
In&design&phase&
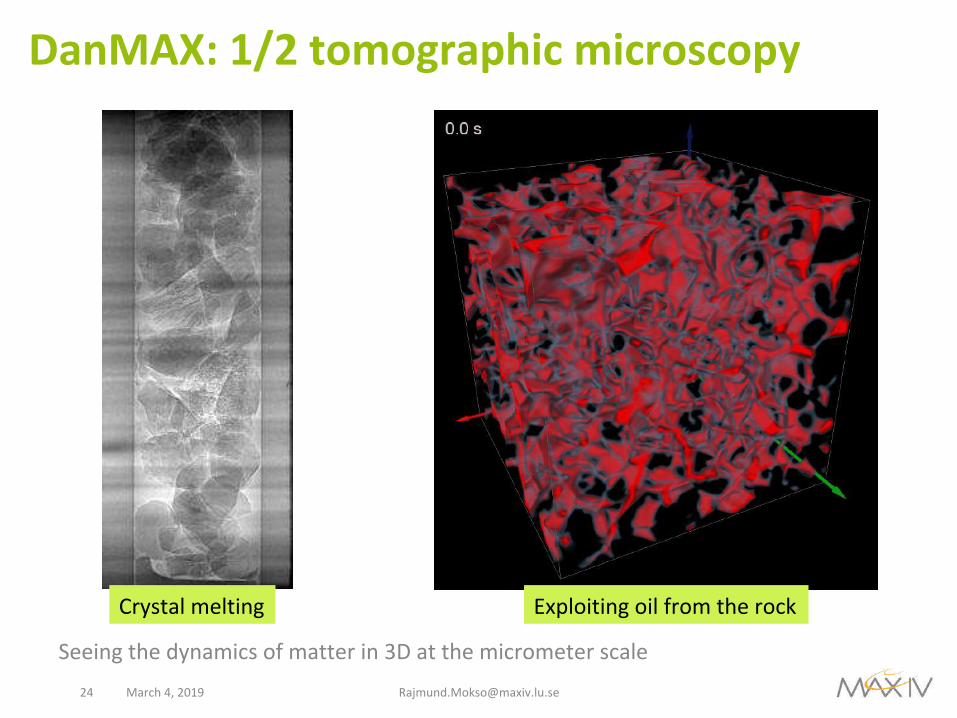
DanMAX:1/2tomographicmicroscopy
March4,2019 [email protected]
Seeingthedynamicsofmatterin3Datthemicrometerscale
Crystalmelting Exploitingoilfromtherock

I. IntroductiontoMAXIVI. Sourceandbeamlines
II. Currentlyavailabletechniques
I. Nanoprobeandscattering
III. SelectedSciencecases(futurecapabilitiesatMAXIV)I. Invivosmallanimals,variousfixedtissues

Tomographicmicroscopyatsynchrotron
Bending magnet source(B = 2.9 T)
Monochromator(E = 21 keV)
Ultra-fastCMOS Detector
Swiss Light Source storage ring(E = 2.4 GeV)
Visible lightoptics
Slits(and Shutter)
Mouse sample
4-axis sample holder
Scintillator
Pixelsize: 11->0.3µm FOV:22x22->1x1mm2
Projections:300–2000Exposuretimes:0.1–300ms
Totalscantime:0.05to500s
Storage ring (3GeV)
X-raysource
Radiographic projection clinics
Tomographic reconstruction Synchrotron
26


Medicalimaging:CT
March4,201928 [email protected]
XX--ray Computed Tomography (CT)ray Computed Tomography (CT)x-raytube
collimatedx-ray beam
detectorarray
•• conventional xconventional x--rays are projection rays are projection images, and overlying structures can images, and overlying structures can obscure anatomical details obscure anatomical details
•• inin CT slice projections (profiles) CT slice projections (profiles) through patient measured by a through patient measured by a detector arraydetector array
tube and detectorarray rotatedaround patient
detectorarray
•• by rotating the tube and detector by rotating the tube and detector array, profiles are taken at multiple array, profiles are taken at multiple anglesangles
•• a computer then processes the a computer then processes the profiles using a mathematical profiles using a mathematical algorithm (convolution) to create a algorithm (convolution) to create a crosscross--sectional image on a video sectional image on a video screen screen
Resolution:0.5mmSpeed:seconds+highresolution-Radiationdose
RadiationdoseperCTscan~3-5mGy

March4,201929 [email protected]

March4,201930 [email protected]

MedicalandpreclinicalCT
31 Radiationdose
Spatialresolution
1μm
50μm
1mm
100Gy1Gy10mGy
Chapter 4. X-ray instrumentation
B. Isoflurane outflow
A. Heating lamp
C. ECG device
F. Isoflurane absorber G. Alignment pin with laserE. Isoflurane blender
D. FlexiVent ventilator
Figure 4.19. In-vivo endstation with its main components. The beam direction is indicatedfrom left to right by the pink arrow. Upon the beginning of the imaging experiment, the animalis placed at the position of the alignment pin (visible in A and G). In A, also the laser pointeris visible that is used for aligning the region of interest (ROI).
74
TheX-raydosescaleswithresolution3
Chapter 4. X-ray instrumentation
4.3.2 Dose calculations
For simplicity reasons, in the following we assume a homogeneous object and monochromaticX-rays. The total absorbed dose is then defined as the mean energy transferred to the matter(object) per unit mass, or more specifically in the case of X-rays, the mean energy transferredto the electrons contributing to ionization. Thus it is written as:
D =Eabs
m=
Eabs
V%(4.32)
where D is the radiation dose in Gray [Gy] (SI system of units), Eabs is the absorbed energyin Joule [J] and m is the mass in kilogram [kg]. Often, the mass is rather expressed by itsvolume V and density %. As we have learned before in Sec. 3.2.2, X-ray interactions withmatter are described according to the Beer-Lambert-Bouguer law and by defining appropriatecross-sections for each interaction process. In a similar way, by the use of the so-called massenergy absorption coefficient µen/%, the absorbed energy can be expressed by the number ofphotons and their energy h⌫. From Eq. (3.13) (Sec. 3.2.2), the X-ray absorption complies toan exponential attenuation law and reads as:
Eabs = (I0 � I1)h⌫=
I0 � I0e�⇣µen%
⌘%�l
�h⌫= I0
1� e�
⇣µen%
⌘%�l
�h⌫, (4.33)
where I0 is the number of incident photons and �l is the length of the object. In contrast tothe previously defined mass attenuation coefficient, the mass energy-absorption coefficient in-volves the further emission of radiation produced by charged particles when travelling throughthe medium [123]. Thus, it is of particular interest for dosimetric considerations of X-ray ab-sorption. The above relations are sketched in Fig. 4.15 whereas the object length (in thisexample) is given as �l = 5�x .
An often used and more generic representation of radiation dose is given through thedefinition of the so-called entrance skin dose (often also called skin dose or entrance dose),which is derived in the following. We consider the previously introduced bulk object andimagine it as being sectioned in slices of thicknesses �x perpendicular to the X-ray direction,as shown in Fig. 4.15.
With the knowledge from before we can immediately derive the absorbed dose in the firstslice by:
D =Eabs
m=�Ih⌫V%
=(I0 � I1)h⌫%A�x
with (I0 � I1) = I0 ·
1� e�
⇣µen%
⌘%�x
�, (4.34)
where Eabs is the absorbed energy, �I the number of absorbed photons with energy h⌫, I0 isthe number of photons impinging on the object and I1 is the reduced number of photons afterbeing partly absorbed by the object, V is the volume of the object with density %, A is the areaof the object’s cross section with object thickness�x and µen/% is the mass energy-absorptioncoefficient. We now introduce the following substitution:
y := ��xµen (4.35)
66
Absorbeddose:
Resolution:300μm->3μmDose: 3mGy->3kGy


Phasecontrastinfreespacepropagation
March4,201933D= 4 mm
Three phase fibers Fresnel diffraction Partiallycoherentillumination
D a
D= 4 mm D= 62 mm D= 500 mm
phase map

34RajmundMokso
PRINCIPLES DENSITY TIME SPACE
flight muscles of a fly fast tomography 30%ofdetectordynamicrange
absorption & edge phase map
Moksoetal.,J.Phys.D,2013
• Refractive index n
δ >> βn = 1 - δ + i β
Phase tomography Phase contrast tomography
34

I. ExistingandsoonavailableinstrumentsI. NanoMAX,SoftiMAX,DanMAX
II. Biomedicaltomographicmicroscopy
I. TheMedMAXproject
III. ExamplesI. Invivosmallanimals,variousfixedtissues
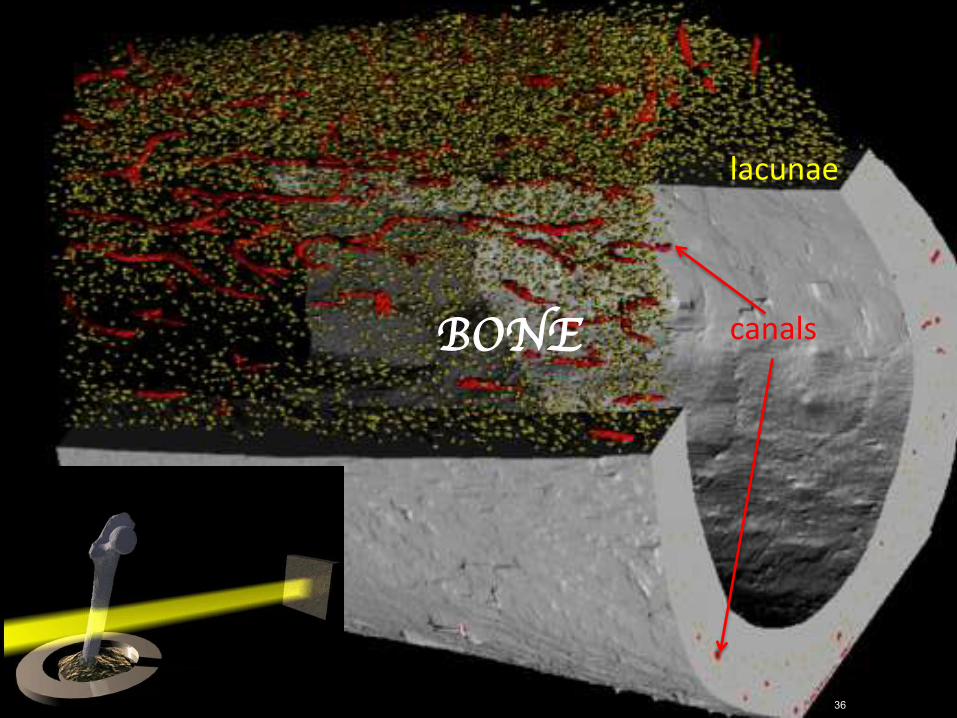
36RajmundMokso 36
BONE canals
lacunae

37
High-throughputimaging:fromsamplealignmenttoQTLanalysis
Femur samples automatically aligned using goniometerand moved to region of interest using projections andimageprocessingscripts
Cortical Thickness (mm)
Cortical Thickness (mm) - 77% Heritable
0.2µm0.0µm
K.Mader,PhDThesis2013andK.Maderetal.,BMCGenomics2015
• Lc.V - Average Lacunar Volume (µm3)
• Lc.Vert - Lacuna Verticalness (Average Projection of Primary Lacuna Ori-entation along the Z axis)
• Lc.Vf (%) - Lacunar Volume Fraction (Total Volume of Lacunae / TotalVolume of Calcified Bone)
1
2
3
4
5
6
7
8
910
11
12
13
14
15
16
17
18
19
BMDCn.Align
Cn.DCn.NCn.V
Cn.VertCn.Vf (%)
Ct.ThCt.Th.R
Ct.Th.R.sdCt.Th.sdLc.Align
Lc.Align2Lc.D
Lc.Dt.ObLc.Dt.St
Lc.NLc.ObLc.StLc.V
Lc.VertLc.Vf (%)
Chromosome
Phen
otyp
e
PhenotypeBMDCn.AlignCn.DCn.NCn.VCn.VertCn.Vf (%) Ct.ThCt.Th.RCt.Th.R.sdCt.Th.sdLc.AlignLc.Align2Lc.DLc.Dt.ObLc.Dt.StLc.NLc.ObLc.StLc.VLc.VertLc.Vf (%)
lod1020
Figure 4: The graph shows the results from the single locus LOD scan performedon all of the phenotypes measured. The chromosomes are shown along the radial(✓) axis. Position within a chromosome is scaled by the maximum chromosomelength and then used to plot the radial position more exactly. The radius andcolor are used to separate the di↵erent phenotypes. The size of the dot plottedindicates the LOD score for a single locus at this point.
While these metrics characterize the given sample fairly well they poorlyaccount for the inhomogeneity inside a sample. This inhomogeneity could be
20
High-throughput:ROIselectionandalignment
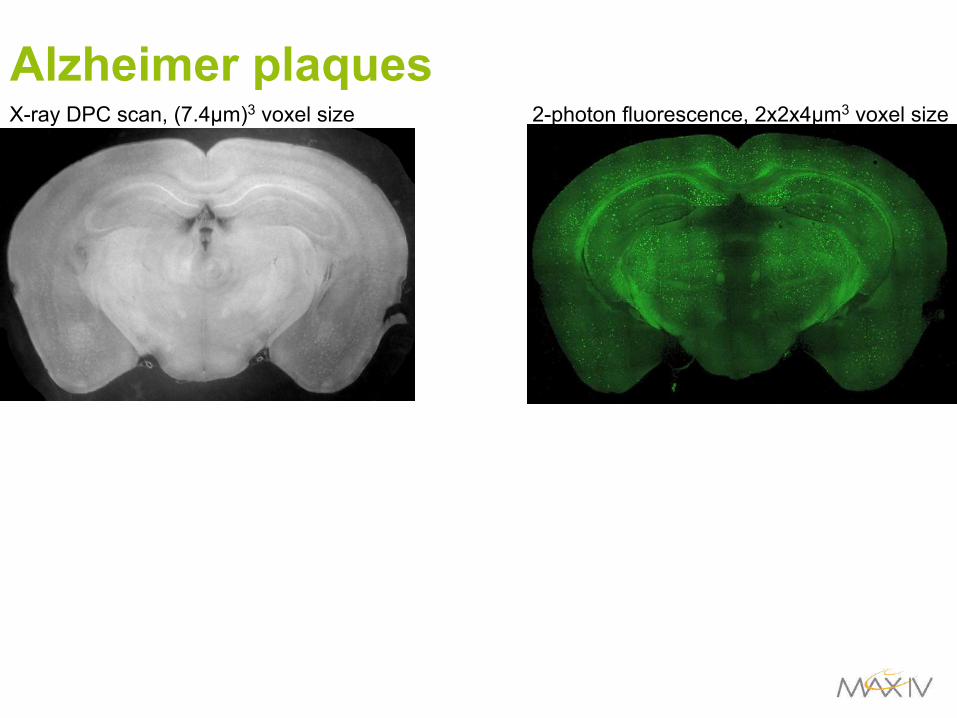
Alzheimer plaques
Bernd Pinzer 38
X-ray DPC scan, (7.4µm)3 voxel size 2-photon fluorescence, 2x2x4µm3 voxel size

Bernd Pinzer 39
Alzheimerplaques
MedMAX : sub-micrometer resolution 3D histology

Alzheimerplaques
March4,2019 [email protected]
Sunday, August 12th, 2012 72Stampanoni -- PSI Summerschool - Zugerberg - Switzerland
Pathogenesis of Alzheimer’s plaques
Phase contrast CT Two-photon microscopy
male
female
B. R. Pinzer et al., Neuroimage 2012
male
female
19 weeks 39 weeks 70 weeks
2 mm5x FAD Mouse Model
§ Full3Dstructuralanalysisispossible:§ Sizedistribution§ Plaqueload(volumetricdensity)§ Nearestneighbourdistance(andmuchmore)
Phase contrast tomographic microscopy
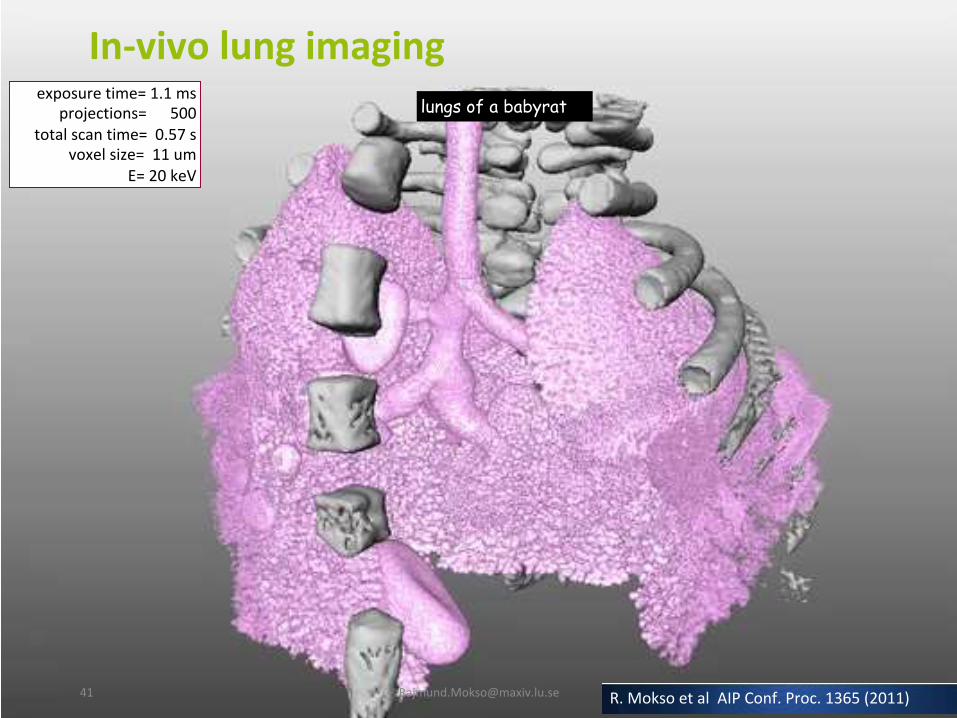
In-vivolungimaging
exposuretime=1.1msprojections=500
totalscantime=0.57svoxelsize=11um
E=20keV
lungs of a babyrat
R.MoksoetalAIPConf.Proc.1365(2011)
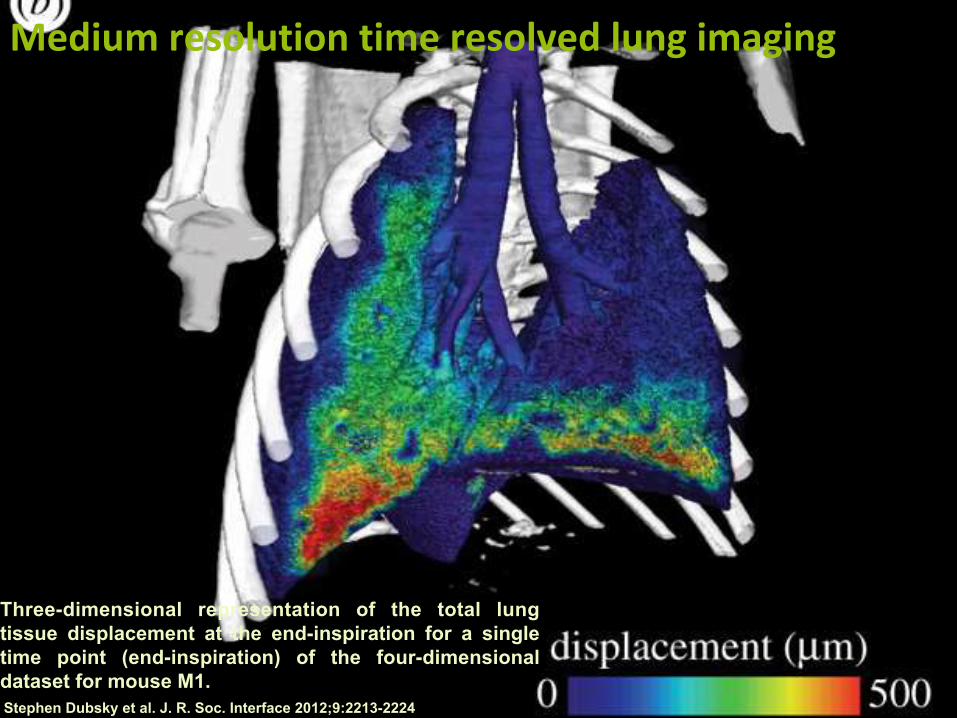
Three-dimensional representation of the total lung tissue displacement at the end-inspiration for a single time point (end-inspiration) of the four-dimensional dataset for mouse M1. Stephen Dubsky et al. J. R. Soc. Interface 2012;9:2213-2224
Mediumresolutiontimeresolvedlungimaging

Stephen Dubsky et al. J. R. Soc. Interface 2012;9:2213-2224
Distributionofairflowthroughanairwaytreeinrabbitlungs
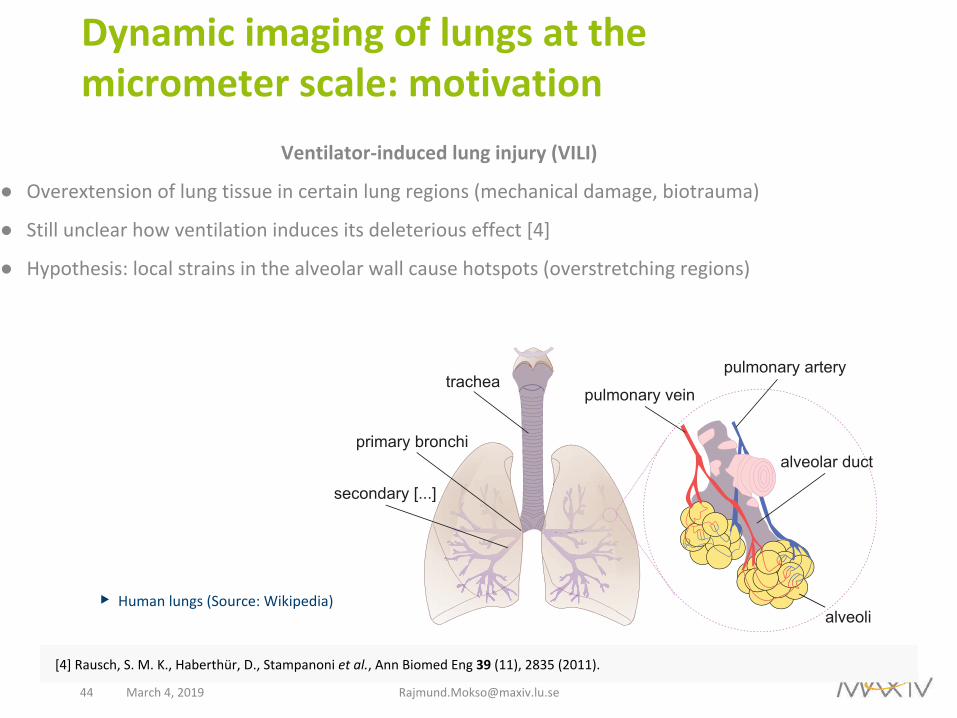
Dynamicimagingoflungsatthemicrometerscale:motivation
March4,2019 [email protected]
Ventilator-inducedlunginjury(VILI)
● Overextensionoflungtissueincertainlungregions(mechanicaldamage,biotrauma)
● Stillunclearhowventilationinducesitsdeleteriouseffect[4]
● Hypothesis:localstrainsinthealveolarwallcausehotspots(overstretchingregions)
▶Humanlungs(Source:Wikipedia)
tracheapulmonary vein
pulmonary artery
alveolar duct
alveoli
primary bronchi
secondary [...]
[4]Rausch,S.M.K.,Haberthür,D.,Stampanonietal.,AnnBiomedEng39(11),2835(2011).

Lungtissuequantification
March4,201945
Challengesinlungtissueanalysis● Howtodetectnon-linearandregionalchangesinthelung?● Howtoquantifythem?
G.Lovric,PhDthesis
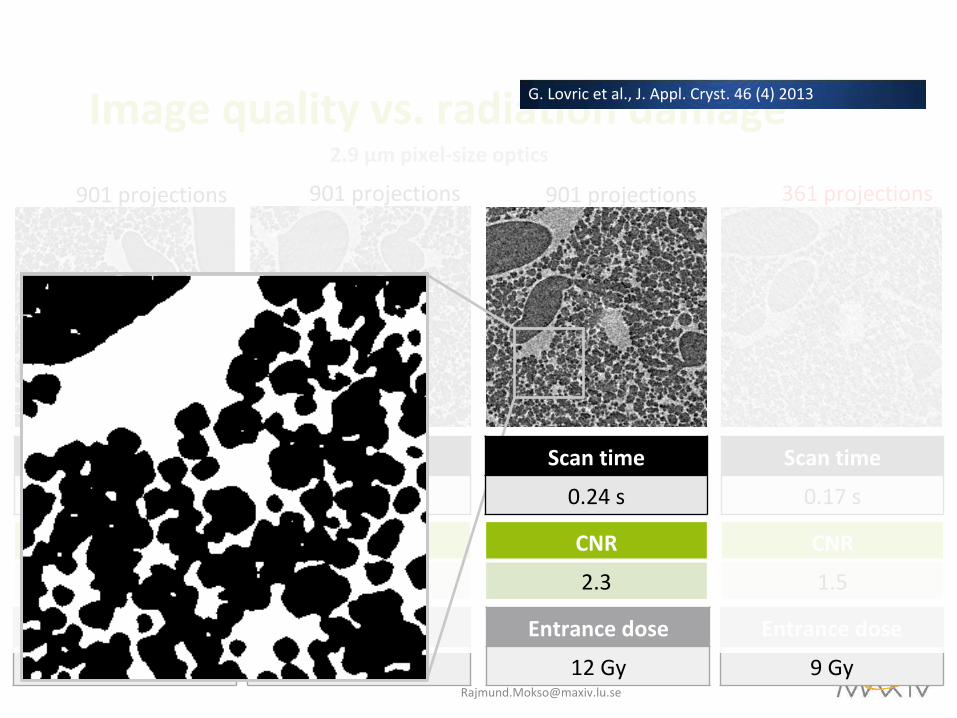
Imagequalityvs.radiationdamage
March 4, 2019
2.9µmpixel-sizeoptics
Scantime
1.12s
CNR
8.5
Entrancedose
58Gy
Scantime
0.34s
Scantime
0.17s
901projections
CNR
3.9
CNR
1.5
901projections 901projections 361projections
Entrancedose
18Gy
Entrancedose
9Gy
G.Lovricetal.,J.Appl.Cryst.46(4)2013
Scantime
0.24s
Entrancedose
12Gy
CNR
2.3
www.nature.com/scientificreports/
3SCIENTIFIC REPORTS | 7: 12545 | DOI:10.1038/s41598-017-12886-3
time was set in order to ignore spontaneous heartbeats that would occur earlier than the required delay time of the acquisition hardware. Only the coupling of all these aspects and the fact that ultra-short single-exposure times of a few milliseconds were employed finally led to motion-less CT reconstructions (Fig. 1c).
Technical validation. To fully evaluate the performance of the proposed imaging technique, we compared tomographic slices acquired with two different optics with pixel sizes of 2.9 × 2.9 µm2 and 1.1 × 1.1 µm2, respec-tively. With these two settings the scanned partial volumes were 5.8 × 5.8 × 2.7 mm3 and 2.2 × 2.2 × 2.2 mm3 in size, respectively. Tomographic acquisitions of selected lung regions were acquired first in vivo in anesthetized animals and shortly thereafter post mortem, both of them under constant breath-holds induced by the ventila-tor. As detailed in the Methods section, each post mortem scan was achieved after administering an overdose of pentobarbital to the anesthetized animal at the end of an in vivo scan. The direct comparisons (Fig. 2) yielded somewhat differing results between the two optics (magnifications). For the 2.9 µm-pixel-size optics the obtained image quality for both the in vivo and post mortem samples produced comparable results at a single-projection exposure time of 3 ms. For the 1.1 µm-pixel-size optics, however, the difference was quite significant due to the presence of heart-induced motion artifacts that were present in the lung during the in vivo scans. It shall be noted that for the 1.1 µm-pixel-size optics, due to the higher magnification (hence lower photon efficiency), a higher single-projection exposure time of 5 ms had to be used in order to produce comparable signal-to-noise ratios as in the case of the 2.9 µm-pixel-size optics.
From these results, we concluded that there was no appreciable improvement by using the higher magni-fication for the in vivo scanning mode. To further test this hypothesis, we randomly selected several alveolar regions in images acquired with both of the magnifications to qualitatively investigate their informative content in terms of visible biological features. There was indeed no improvement (Fig. 3), neither in signal-to-noise ratio nor in spatial resolution, when the higher magnifying optics were used. This result is significant in the sense that it appears to be directly linked to the required temporal resolution of the imaging systems. Namely, it indicates that even shorter X-ray exposure times than the ones that were applied here (5 ms) would be necessary and to be combined with accurate triggering within the cardiac cycle. To achieve this under the current imaging settings would necessitate a significant increase (4–5x) of the X-ray photon flux.
in vivo post mortem
▪ Pixel size: 2.9 x 2.9 µm2
▪ Number of projections: 478
▪ Single-projection exposure time: 3 ms
▪ Pixel size: 1.1 x 1.1 µm2
▪ Number of projections: 429
▪ Single-projection exposure time: 5 ms
Figure 2. Comparison of the image quality of in vivo and post mortem tomographic slices of lungs at two different magnifications. The red arrows exemplify the difference in lung tissue thickness, which was observed between the in vivo and post mortem case. The post mortem tomographic slice was acquired at 30 cmH2O, while all other images were acquired at 15 cmH2O.
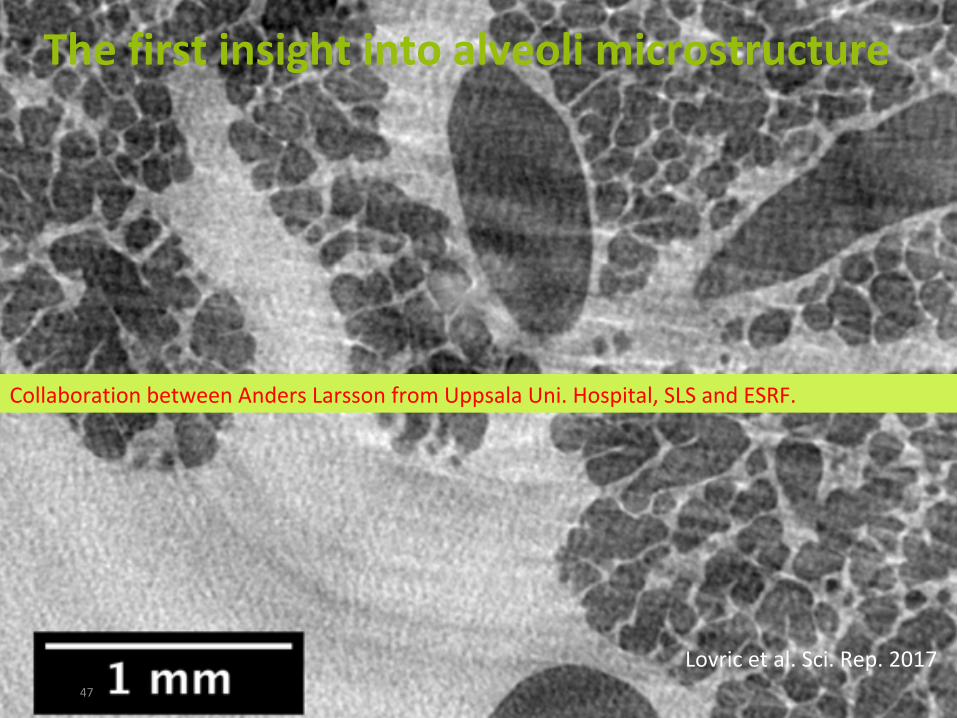
Thefirstinsightintoalveolimicrostructure
47
CollaborationbetweenAndersLarssonfromUppsalaUni.Hospital,SLSandESRF.
Lovricetal.Sci.Rep.2017

Lungtissuequantification
March4,201948
Challengesinlungtissueanalysis● Howtodetectnon-linearandregionalchangesinthelung?● Howtoquantifythem?
G.Lovric,PhDthesis

Alveolidynamicsquantification
March4,2019 [email protected]
Adetailedinsightintothelung● Applyquantificationandlabelingtools,previouslyusedforfoamandbonedata[14]and
dendriticmicrostructures[15]
Curvature
Thickness map Originaltomographicslice
25 cmH2O 30 cmH2O 35 cmH2O
[3.5 x 3.5 x 0.6 mm3] [3.5 x 3.5 x 0.6 mm3] [3.5 x 3.5 x 0.6 mm3]
G.Lovric,PhDthesis,Lovricetal.PLOSOn2017e

Image-basedquantitativeinformationretrieval
50
acquisition reconstruction segmentation
feedback
labeling quantification visualization
robust,simple&universal Customized&flexible
ScanningSampleconditioning
1TB/2min
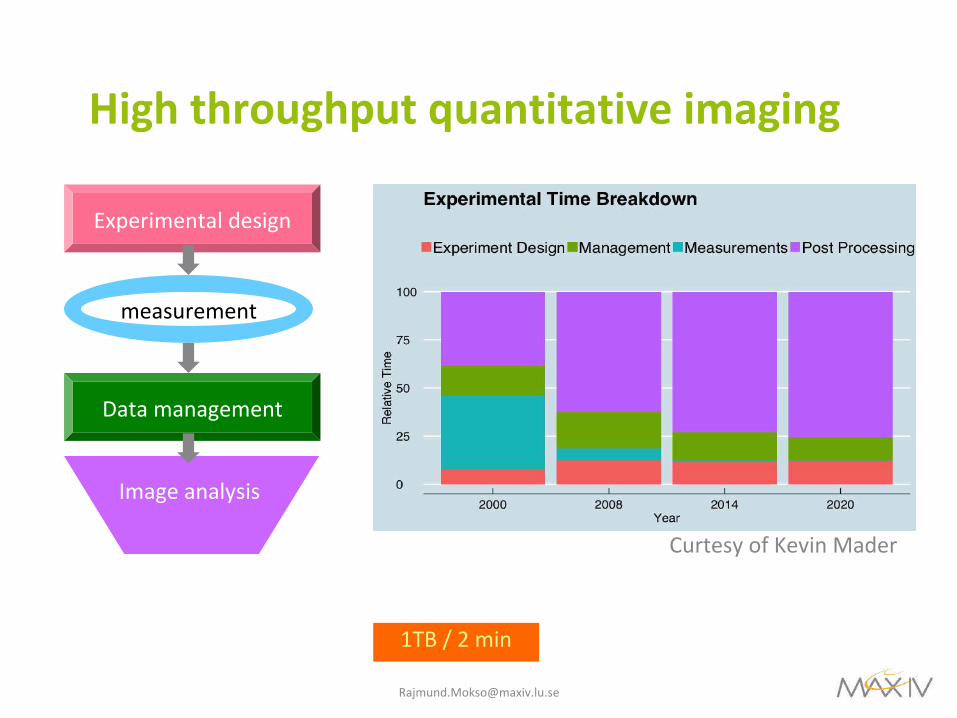
Highthroughputquantitativeimaging
51
1TB/2min
Experimentaldesign
measurement
Datamanagement
Imageanalysis
CurtesyofKevinMader

Theflightofinsects
SimonWalkerDanielSchwyn RajmundMokso
3 kHz effective temporal resolution
10-20 µm spatial resolution
Survival ~ 3 s

source
S=150m
5 µm
Nanoimaging,Fluorescencespectroscopy
March4,2019 [email protected]
A neuron cell phase image
Mokso,Cloetensetal.,APL2007
Chemical element distribution
levels of iron, we studied two different cell culture models,PC12 cells and primary midbrain neurons, over-expressing α-synuclein after viral vector infection. Over-expression of α-synuclein in these models resulted in α-synuclein accumula-tion in the perinuclear region, similarly to previously de-scribed results, e.g., in COS-7 cells infected with the samerecombinant α-synuclein adenovirus [31]. Similar resultswere also obtained with different systems of α-synucleinover-expression, such as in SH-SY5Y cells transfected withwild-type α-synuclein [32] and in cortical neurons transfectedwith wild-type α-synuclein-GFP fusion protein [33].
Our study reveals that α-synuclein over-expression both inprimary midbrain neurons and PC12 cells exposed to excess
iron results in increased iron levels compared to cells express-ing endogenous levels of α-synuclein. Previous studies haveshown thatα-synuclein could bind iron, either Fe(III) or Fe(II)[13], and thatα-synuclein was shown to act as a ferrireductase[24], but a direct evidence for Fe increase inα-synuclein over-expressing cells was missing. Our data present iron-rich inclu-sions accumulating within perinuclear regions where α-synuclein is over-expressed. This further supports the bindingbetween iron and α-synuclein which may explain the accu-mulation of intracellular iron in the cells over-expressing α-synuclein compared to control cells after iron treatment(Fig. 6). Although our data do not directly evidence the olig-omerization and aggregation of α-synuclein, it is noteworthy
Fig. 5 Optical views and nano-SXRF imaging of chemical element distributions in a a PC12 cell treated with excess Fe (null vector, U0+Fe) and b aPC12 cell over-expressing α-synuclein and treated with excess Fe (α-Syn+Fe). Scale bar 5 μm
Table 1 Number and sizedistribution of Fe-rich inclusionsin PC12 cells over-expressing α-synuclein (Syn+Fe) and in null-vector control cells (U0+Fe), bothexposed to excess iron. ANOVAanalysis of variance
U0+Fe Syn+Fe ANOVA
Number of cells analyzed 9 11 –
Mean number±SD of Fe-rich grains (>200 nm)/cell 69±37 34±27 0.0246
Percentage of Fe-rich grains±SD of diameter <600 nm 91±7 65±23 0.0046
Percentage of Fe-rich grains±SD of diameter >600 nm 9±7 35±23 0.0047
Mol Neurobiol (2016) 53:1925–1934 1929
Ortega.,Mol.Neurobiol.2016
NanoMAX

Holographicnanotomographyofhumancerebellum
March4,2019 [email protected]
www.advancedsciencenews.com
1700694 (5 of 9) © 2018 The Authors. Published by WILEY-VCH Verlag GmbH & Co. KGaA, Weinheim
www.advancedscience.com
Region-growing segmentation allows for the exclusion of cell soma, nuclear boundary, and structures within nucleus, while intensity thresholding helps differentiate between granule cell nuclei. We have observed Purkinje cells as large, pear-shaped neurons with an average soma diameter of 50 µm and an enve-lope curvature of 38 µm.
3. Discussion
Visualization plays an important role in medical research, as there is a direct correlation between abnormalities in size, shape, or topology of neurons and brain disorders. For example, many pathological brain conditions are associated with cell loss,[26] abnormal cellular, or dendritic morphology.[27] Similarly, changes at the subcellular level have been reported for neurodegenerative disorders, for example, membrane damage inducing curvature adaptation,[28] axon demyelination, and abnormal morphology of microglia in Alzheimer’s dis-ease. These pathological (sub)cellular changes are within the resolution range of XNH. The presented segmentations of cellular and subcellular structures can provide quantitative
measures, for example, volume or dimension values of subcel-lular structures, cell number, or shapes. For example, the soma diameter and the envelope curvature of the Purkinje cells were calculated.
The resolved subcellular structure should be reinter-preted to be assigned to specific organelles based on the comparison with clinically approved modality. For this study, virtual XNH slices were compared to the 2D H&E-stained histology sections. H&E staining, however, frequently used in histopathological investigations, is not the most powerful approach. For example, it is not optimized for the visualiza-tion of individual Purkinje cells with subcellular details. It was previously assumed that poor detectability of subcellular structures in H&E-stained histological sections is related to postmortem autolysis.[13b] The XNH data acquired allow for the identification of anatomical micro- and nanostruc-tures, including the nuclear boundary, in agreement with the related 2D histology data. While the comparison of XNH and light microscopy is suboptimal due to the resolution differ-ences, it did confirm that XNH can be used to identify (sub)cellular components. The current goal is to one-to-one corre-late the modalities to extract clinically useful information for
Adv. Sci. 2018 , 1700694
Figure 4. Automated segmentation of pyramidal neurons within a neocortex block, measured with an effective pixel size of 50 nm and a field of view with 100 µm height and 100 µm in diameter. To verify a,b) automated segmentation, c) semiautomated segmentation was performed.
Figure 5. A 3D rendering of (sub)cellular structures within a Purkinje cell, measured with an effective pixel size of 100 nm. Region-growing segmentation allows for the extraction of cell soma (green), nuclear envelope (blue), nuclear content (pink), and nucleolus (violet). Intensity thresholding (red) enables the discrimination of granule cell nuclei. Average diameter of Purkinje cell soma: 54 µm; average diameter of Purkinje cell nucleolus 3.5 µm.
FULL PAPER
1700694 (1 of 9) © 2018 The Authors. Published by WILEY-VCH Verlag GmbH & Co. KGaA, Weinheim
www.advancedscience.com
Hard X-Ray Nanoholotomography: Large-Scale, Label-Free, 3D Neuroimaging beyond Optical Limit
Anna Khimchenko, Christos Bikis, Alexandra Pacureanu, Simone E. Hieber, Peter Thalmann, Hans Deyhle, Gabriel Schweighauser, Jürgen Hench, Stephan Frank, Magdalena Müller-Gerbl, Georg Schulz, Peter Cloetens, and Bert Müller*
DOI: 10.1002/advs.201700694
being attributed to brain malfunction.[1] Micro- and nanomorphology of the neu-ronal network is tightly linked with the brain’s functionality. This has sparked significant interest and efforts aimed at uncovering hierarchically organized neu-ronal structures.[2] Currently available imaging methodologies, however, are lim-ited in their 3D representation of large specimens in a time-efficient manner with sufficient nanoscale isotropic resolution while preserving the biological context.
Although the sample preparation remains a complicated and error-prone process, substantial effort has been devoted to revealing the 3D microstructure of brain tissue ex vivo, with or without the require-ment for serial sectioning.[3] Despite continuous advances, the 3D analysis of subcellular structures based on 2D histological sections in combination with microscopy is limited by sectioning- or staining-related artefacts, and may lead to misinterpretation of the results due to the lack of volumetric information.[4] Serial sectioning or optical-ablative methods, in combination with 3D image reconstruc-
tion, are labor- and computation-intensive, requiring acquisi-tion times of days to obtain single-cell resolution,[5] and still hinder continuous observations.[6] Technically demanding pro-tocols for rendering tissue optically transparent, for example,
There have been great efforts on the nanoscale 3D probing of brain tissues to image subcellular morphologies. However, limitations in terms of tissue coverage, anisotropic resolution, stain dependence, and complex sample preparation all hinder achieving a better understanding of the human brain functioning in the subcellular context. Herein, X-ray nanoholotomography is introduced as an emerging synchrotron radiation-based technology for large-scale, label-free, direct imaging with isotropic voxel sizes down to 25 nm, exhibiting a spatial resolution down to 88 nm. The procedure is nondestruc-tive as it does not require physical slicing. Hence, it allows subsequent imaging by complementary techniques, including histology. The feasibility of this 3D imaging approach is demonstrated on human cerebellum and neocortex specimens derived from paraffin-embedded tissue blocks. The obtained results are compared to hematoxylin and eosin stained histological sections and showcase the ability for rapid hierarchical neuroimaging and automatic rebuilding of the neuronal architecture at the level of a single cell nucleolus. The findings indicate that nanoholotomography can complement microscopy not only by large isotropic volumetric data but also by morpho-logical details on the sub-100 nm level, addressing many of the present chal-lenges in brain tissue characterization and probably becoming an important tool in nanoanatomy.
Nanotomography
© 2018 The Authors. Published by WILEY-VCH Verlag GmbH & Co. KGaA, Weinheim. This is an open access article under the terms of the Creative Commons Attribution License, which permits use, distribution and reproduction in any medium, provided the original work is properly cited.
Dr. A. Khimchenko, Dr. C. Bikis, Dr. S. E. Hieber, Dr. P. Thalmann, Dr. H. Deyhle, Dr. G. Schulz, Prof. B. MüllerBiomaterials Science Center (BMC)Department of Biomedical EngineeringUniversity of Basel4123 Allschwil, SwitzerlandE-mail: [email protected]
The ORCID identification number(s) for the author(s) of this article can be found under https://doi.org/10.1002/advs.201700694.
Dr. A. Pacureanu, Dr. P. CloetensID16A-NI Nano-Imaging BeamlineEuropean Synchrotron Radiation Facility (ESRF)38043 Grenoble, FranceG. Schweighauser, Dr. J. Hench, Prof. S. FrankInstitute of PathologyDepartment of NeuropathologyBasel University Hospital4056 Basel, SwitzerlandProf. M. Müller-GerblMusculoskeletal Research GroupDepartment of BiomedicineUniversity of Basel4056 Basel, Switzerland
1. Introduction
In our aging society, incidence and prevalence of brain disor-ders are rapidly increasing, with almost one-third of disabilities
Adv. Sci. 2018, 1700694
www.advancedsciencenews.com
1700694 (4 of 9) © 2018 The Authors. Published by WILEY-VCH Verlag GmbH & Co. KGaA, Weinheim
www.advancedscience.com
2.2. One-to-One Correlation with Histology
3D XNH data contains comprehensive morphological infor-mation and can be displayed in grayscale (Figure 2) or false color (Figure 3a). To demonstrate the performance of the imaging modality, we compare the virtual sections obtained by XNH with corresponding histological sections stained with H&E—gold standard for the examination of tissue biopsies.[23] To mimic the H&E staining, the XNH data acquired with an effective pixel size of 100 nm was converted from grayscale to the red-green-blue color model (RGB) space, by using the inverse transformation, that is, RGB to grayscale, of the H&E-stained histology section (Figure 3b). For comparison, magnifi-cations emphasize cellular structures, that is, granule (top) and stellate cells (bottom). Although XNH data showcase the supe-rior to light microscopy resolution (Figure 3c), their correlation is important, linking the tomographic observations to the histo-logical features used in diagnostics.
2.3. Rebuilding Neuronal Architecture
The difference in the refractive index of the cell and the sur-rounding neuropil enables us to segment individual cells and to derive the related quantities. The contrast of our XNH data was sufficiently high for expert-based examination, yet insufficient for simple automated segmentation approaches. In the current study, even adaptive thresholding fails to seg-ment individual pyramidal neurons, since the refractive index of the cells does not differ enough from background values, that is, the surrounding neuropil. Interactive learning and segmentation, such as ilastik,[24] have been applied suc-cessfully to segment components in electron microscopic images. This software, however, fails to segment cells in the present case, because in microscopy data, the structures of interest are labeled, thus providing high contrast with
respect to the background. As a consequence, we developed a two-step framework for the fully automated segmentation of cortical pyramidal neurons. The structure rests upon a recently designed procedure that is combined with a sparse field method (SFM) of active contours implemented using level sets.[13b,25] In order to verify the automated procedure, we performed semiautomated segmentation using the Image Segmenter app implemented in MATLAB (2016a, The Math-Works, Inc., Natick, Massachusetts, USA), in combination with an SFM. Here, pyramidal neurons were visually iden-tified and individually annotated in a single slice by Image Segmenter. The SFM algorithm automatically extended these seeds up to the entire volume.
Using the neocortex specimen measured with an effective pixel size of 50 nm binned with a factor of four, we demon-strate the capabilities of our fully automated segmentation strategy for pyramidal neurons (Figure 4a): cells with a somata size within the specified range, not touching the sample border, were successfully segmented by automated (Figure 4a,b) and semiautomated (Figure 4c) approaches, resulting in an auto-mated method sensitivity of about 90%.
2.4. Segmenting Subcellular Structures
The data acquired not only assist in identifying individual neu-rons, but also provide sufficient resolution for discriminating nanostructures including cell soma, nuclear boundary, nucleus, and nucleolus. Furthermore, these structures have a distinc-tively higher electron density than surrounding cytoplasm, in which case an intensity-based, region-growing segmentation framework implemented in the commercially available software package VGStudio MAX 2.0 (Volume Graphics, Heidelberg, Germany) is sufficient.
Figure 5 displays a 3D rendering of (sub)cellular components within a Purkinje cell, using data with a voxel length of 100 nm.
Adv. Sci. 2018 , 1700694
Figure 3. Tomography volume visualized in the a) RGB color map in order to resemble the b) H&E-stained histological section. For comparison of granule (top) and stellate cells (bottom) XNH data were median-filtered over 20 slices. c) Combined image showcases the superior resolution of XNH compared to conventional histology. Scale bars correspond to a length of 20 µm.
histology

Bonenanostructure(SmallAngleX-rayscattering)
Collagenfibrilsnmscale
0.5mm
Trabecularbone
Singletrabeculammscale
1mm
Humanvertebra

Bonenanostructure(SmallAngleX-rayscattering)
0.5mm
TrabecularbonemicroCTInsitu(strainmaps)
Singletrabeculammscale
Collagenfibrilsnmscale
1mm
vertebradrawingPalomaAyala
ScanningSAXS
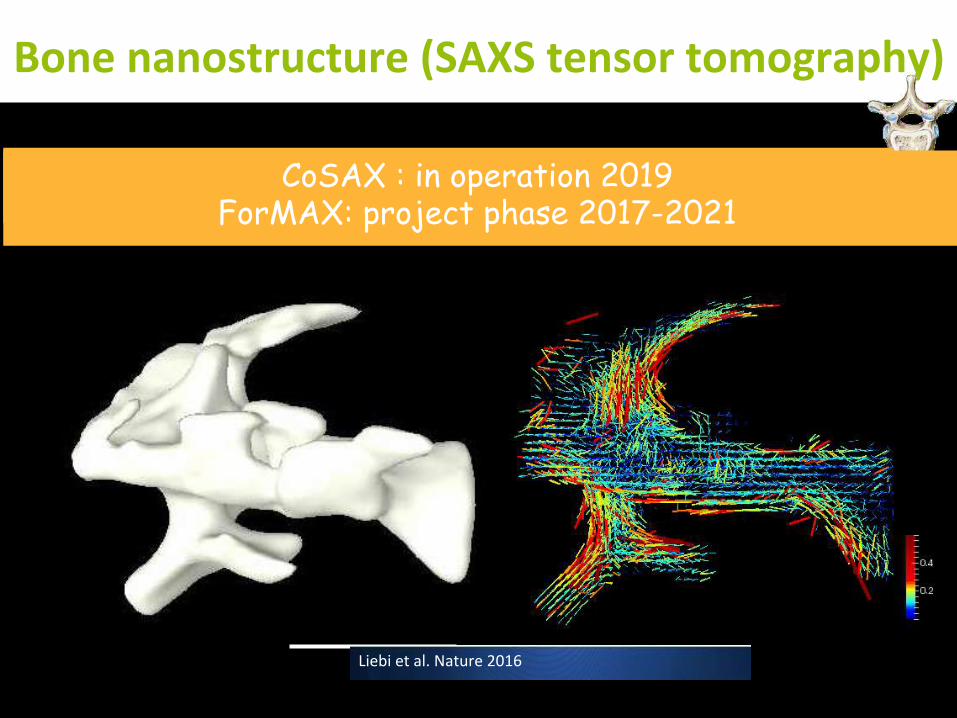
Bonenanostructure(SAXStensortomography)
Absorptiontomography SAXStensortomographyorientationofcollagenfibrils
0.5mm
CoSAX : in operation 2019 ForMAX: project phase 2017-2021
Liebietal.Nature2016

Hierarchicalimagingoftissues
March4,2019 [email protected]
10nm
100μm mGy
MGy 100μm
0.5m 0.1s
1h
Medical imaging and therapy (in vivo, medium resolution >30 um, low dose, large beam , large FOV)
Nano-scale imaging beamlines (fixed tissue, resolution ~ 100nm, high dose, small samples ~100um)
Down to a micrometer resolution (rarely in vivo, high resolution ~ 1um, higher dose, small FOV)
Thewholeorgan
Sunday, August 12th, 2012 72Stampanoni -- PSI Summerschool - Zugerberg - Switzerland
Pathogenesis of Alzheimer’s plaques
Phase contrast CT Two-photon microscopy
male
female
B. R. Pinzer et al., Neuroimage 2012
male
female
19 weeks 39 weeks 70 weeks
2 mm5x FAD Mouse Model
Bronchialwall
Zoomingintoorgans
Celllevel
3ordersofmagnitudeinspatialresolution
Longitudinalinvivo
Accuteinvivo
Fixedtissue
Page 4 of 10Chiappi et al. J Nanobiotechnol (2016) 14:15
and after cell vitrification, in cryo-conditions (Fig. 2c) to assure that no cell rearrangement was induced by vit-rification (Additional file 3: Figure S2). Reconstructed cryo-SXT volumes had a resolution of ~60 nm, suffi-cient to visualise mitochondrial cristae (Fig. 2d, e, arrow-heads). We also observed other cellular components such as intermediate filaments, actin bundles (Fig. 2f, grey) or plasma membrane (Fig. 2d, f, brown), as well as organelles such as the nucleus, including nucleolus and chromatin condensations (Fig. 2d, f; Additional file 4: Figure S3).
Cryo-soft X-ray tomograms of SPION-incubated MCF-7 cells showed an increase in high-absorption clus-ters at longer incubation times, which correlated with the
LysoTracker Red signal (Fig. 2; Additional files 2 and 4: Figures S1D–F and S3). Three-dimensional reconstruc-tion of whole cells showed high-absorption clusters con-centrated mainly near the nucleus, although they were also found scattered throughout the cytoplasm; they were never found inside the nucleus (Fig. 2f; Additional file 4: Figure S3). These results coincide with the increase in SPION-loaded endocytic vesicles reported using clas-sical 2D techniques [10, 12]. Volumetric representa-tion of cells showed mitochondrial exclusion to the cell periphery caused by high-absorption cluster accumula-tion near the nucleus (Fig. 2f, yellow; Additional file 5: Movie 2). The high-absorption clusters inside cells had a non-homogeneous internal substructure, consistent with
Fig. 2 Fluorescent and cryo-SXT correlative workflow. a In vivo differential interference contrast (DIC) image of MCF-7 cells cultured on Au-HZBII grid and incubated 24 h with SPION (0.25 mg ml−1). Bar 200 μm. b In vivo fluorescent image from the area in the yellow square in a. Bar 20 μm. Nucleus, blue (DAPI), acidic vesicles, red (LysoTracker Red). c Cryo-epifluorescent image (red channel) from the area in the yellow square in b. Bar 5 μm. d Cryo-SXT plane from the area in the yellow square in c. N, nucleus. Bar 2 μm. e Cryo-SXT plane showing ultrastructural details of the cell. Arrowheads indicate mitochondrial cristae. Bar 500 nm. f Volumetric representation of the tomogram in d. High-absorption vesicles (red), seg-mented applying a threshold adapted to the volume containing the highest densities, are condensed near the nucleus (blue), displacing the mitochondrial network (yellow). Grey filaments, orange plasma membrane. Dataset acquired at HZB-BESSYII

Microbeamradiationtherapy
March4,201959 [email protected]
MicrobeamirradiatednormalCNSofweanedpiglets(1.5cmx1.5cm~28mm-widebeams~210mmoncenter,625Gy).Thehistologicalsectionslooknormal,exceptfor"stripes"duetothedropoutofneuronal/astroglialnuclei.Thissharpspatialfractionationispreservedthroughoutthecerebellum.Notissuenecrosis,hemorrhageordemyelinationwasobserved.
E.Bräuer-Krisch,etal.Newirradiationgeometryformicrobeamradiationtherapy,PhysMedBiol50(2005)3103-3111.

60EUFOAM2012,July11,2012 RajmundMokso 60
Thank you