iifl sector report: weaving a digital story
TRANSCRIPT


1 | P a g e
Premia Research
Table of Contents
NSE
Table of Contents Page No.
Sectoral Outlook 2
Key Global markets trends 3-7
India’s growth on global trends 8-11
Favorable factors for sector 12-14
Digitization to drive mid-term growth 15-16
OTT platforms in India and its Impact 17-18
Zee Entertainment Enterprises Ltd 19-24
Sun TV Network Ltd 25-30
Shemaroo Entertainment Ltd 31-35
TV Today Network Ltd 36-40
Disclaimer 41

2 | P a g e
Premia Research
Weaving a digital story
Zee Entertainment Enterprises– BUY
CMP Target Upside
539 691 28%
Sun TV Network – BUY
CMP Target Upside
782 984 26%
Shemaroo Entertainment – BUY
CMP Target Upside
481 580 21%
TV Today Network – BUY
CMP Target Upside
412 517 25%
Prices as on 02/07/2018
Financials (`cr) ZEE Enter. FY19E FY20E
Rev. 7,868 9,190
EBITDA Mar (%) 31.4 32.1
PAT 1,738 2,076
P/E x 29.8 24.9
Sun TV FY19E FY20E
Rev. 3,515 4,062
EBITDA Mar (%) 68.1 67.4
PAT 1,401 1,649
P/E x 22.0 18.7
Shemaroo FY19E FY20E
Rev. 566 635
EBITDA Mar (%) 29.9 30.4
PAT 99 113
P/E x 13.2 11.6
TV Today Net. FY19E FY20E
Rev. 786 871
EBITDA Mar (%) 29.1 30.1
PAT 154 183
P/E x 16.0 13.4 Source: IIFL Research
The ‘Digital’ wave in India (as a medium of entertainment) on the back
of higher internet penetration will drive the next leg of growth for the
Media and Entertainment (M&E) industry. The launch of Jio has made
mobile data accessible and affordable for masses (avg. mobile data
price has dipped from ~`200/GB two years back to `3.2/GB currently).
Further, rising internet subscribers (from ~45cr in December, 2017 to
~83cr in FY21E) coupled with declining internet costs is leading the
consumption pattern towards digital. Moreover, with advent of Over
the Top (OTT) platforms, content has become an ‘Anytime, Anywhere’
service, benefiting broadcasters and content aggregators/producers.
Robust internet consumption to propel digital growth
Given the favorable infrastructure, the total Indian mobile data
traffic/month is expected to increase to 14 Exabyte (EB) by CY23E
(2.4EB in December, 2017). Moreover, rising affordability of devices
and falling data cost would result in ~3x growth of the digital platform
subscribers over CY17-20E. Hence, digital subscription revenue would
register CAGR of 72.7% over CY17-20E.
Advertisement spends to shift towards digital
The rising online video viewing audience in India is expected to
increase at CAGR of ~26% over CY17-20E to ~500mn, resulting in
higher time spent on internet. The trend of rising online video
consumption would lead to higher advertisement spends in the digital
space. Hence, digital advertising revenue would grow at CAGR of 21%
over CY17-20E and is projected to contribute ~22% of total advertising
revenues of M&E sector in CY20E (~17% in CY17).
We prefer (1) Zee Entertainment Enterprises, owing to launch of ZEE5
(OTT platform) with strong content inventory (1,00,000+ hours) and
portfolio of channels; (2) Sun TV Network, a similar player in south
region with digital platform SunNXT (4,000+ movies) and stable
financial position aiding its expansion plan; (3) TV Today Network,
given leadership of its flagship brand AajTak and acquisition of digital
business from parent; and (4) Shemaroo Entertainment, considering
its huge content inventory (3,400+ titles) driving robust growth of its
digital segment.
Analyst – Tushar Jain [email protected]
July 03, 2018

3 | P a g e
Premia Research
Key Global markets trends
Global internet users reached 3.6bn in CY17 Favorable infrastructure combined with rising affordability of devices
is driving overall internet consumption globally. Further, overall cost of
internet is also declining and global internet penetration has reached
~49% in CY17 from ~24% in CY09.
Exhibit 1: Rising global internet users
Source: Internet Trends 2018, IIFL Research
Rising digital media usage in developed countries
The hours spent (daily basis) on digital media grew at CAGR of ~9% to ~6hours over CY08-17 in US. This growth is led by time spent on mobile, which grew at CAGR of ~31% over the same period. The advertisement spends have followed the consumption pattern and mobile internet advertising revenue stood at $49.9bn in CY17 in US compared to negligible in CY08.
Exhibit 2: Daily time spent on digital media in US (hours)
Considered adult users only Source: Internet Trends 2018, eMarketer, IIFL Research
0
2
4
6
8
10
12
14
16
0
100
200
300
400
CY09 CY10 CY11 CY12 CY13 CY14 CY15 CY16 CY17
Global Internet Users (cr) LHS yoy growth (%) RHS
0
1
2
3
4
5
6
7
CY08 CY09 CY10 CY11 CY12 CY13 CY14 CY15 CY16 CY17
Other Connected devices Desktop/Laptop Mobile

4 | P a g e
Premia Research
Key Global markets trends
Exhibit 3: Internet advertising growth in US (US$ bn)
Source: IAB internet advertising revenue report 2017, IIFL Research
Investment in content leading to subscriber addition
Leading Global digital M&E company, Netflix’s content cost has
increased at CAGR of 23.9% over CY12-17 and subscribers have grown
from 33mn to 117mn over the same period. However, same has helped
the company in attaining a revenue CAGR of 26.5% over CY12-17.
Hence, adaptability and ability of a company to produce relevant
content and predict customer behavior is of vital importance for the
digital industry.
Exhibit 4: Netflix subscribers (mn)
Source: Netflix, Valuewalk.com, IIFL research
Geographical expansion
In CY10, Netflix launched its services in Canada, while in CY12, it became available in Europe (including UK, Ireland and Nordic countries). Further, in CY15, it was launched in Australia and New Zealand and since CY16 onwards, Netflix is available worldwide.
0
10
20
30
40
50
60
70
80
90
100
CY07 CY08 CY09 CY10 CY11 CY12 CY13 CY14 CY15 CY16 CY17
Non Mobile Mobile
0
20
40
60
80
100
120
140
CY12 CY13 CY14 CY15 CY16 CY17
US users Rest of the world
Continuous focus on relevant content
has led to rapid geographical
expansion
Facebook’s annualized revenue per
daily user reached to US$34 in Q1CY18
from US$ 16 in Q1CY15
5 | P a g e
Premia Research
Key Global markets trends
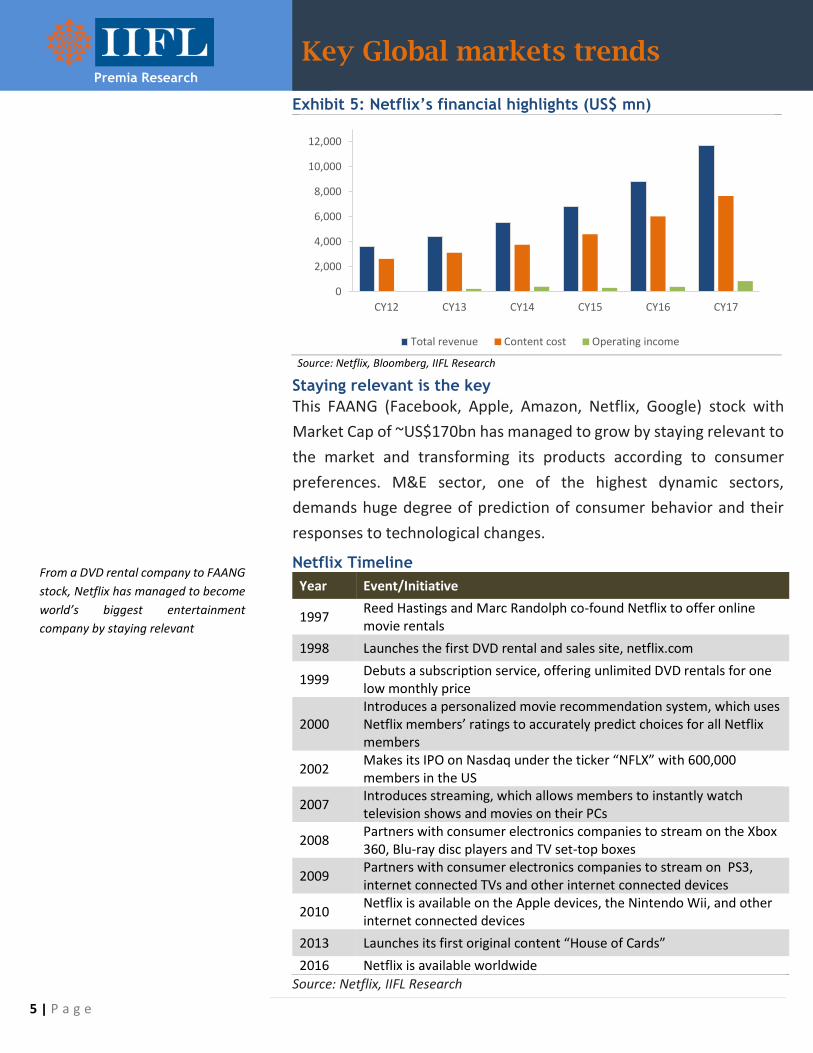
Exhibit 5: Netflix’s financial highlights (US$ mn)
Source: Netflix, Bloomberg, IIFL Research
Staying relevant is the key
This FAANG (Facebook, Apple, Amazon, Netflix, Google) stock with
Market Cap of ~US$170bn has managed to grow by staying relevant to
the market and transforming its products according to consumer
preferences. M&E sector, one of the highest dynamic sectors,
demands huge degree of prediction of consumer behavior and their
responses to technological changes.
Netflix Timeline
Year Event/Initiative
1997 Reed Hastings and Marc Randolph co-found Netflix to offer online movie rentals
1998 Launches the first DVD rental and sales site, netflix.com
1999 Debuts a subscription service, offering unlimited DVD rentals for one low monthly price
2000 Introduces a personalized movie recommendation system, which uses Netflix members’ ratings to accurately predict choices for all Netflix members
2002 Makes its IPO on Nasdaq under the ticker “NFLX” with 600,000 members in the US
2007 Introduces streaming, which allows members to instantly watch television shows and movies on their PCs
2008 Partners with consumer electronics companies to stream on the Xbox 360, Blu-ray disc players and TV set-top boxes
2009 Partners with consumer electronics companies to stream on PS3, internet connected TVs and other internet connected devices
2010 Netflix is available on the Apple devices, the Nintendo Wii, and other internet connected devices
2013 Launches its first original content “House of Cards”
2016 Netflix is available worldwide
Source: Netflix, IIFL Research
0
2,000
4,000
6,000
8,000
10,000
12,000
CY12 CY13 CY14 CY15 CY16 CY17
Total revenue Content cost Operating income
From a DVD rental company to FAANG
stock, Netflix has managed to become
world’s biggest entertainment
company by staying relevant

6 | P a g e
Premia Research
Key Global markets trends
Better quality of content leads to higher paid subscribers
Globally, subscribers are moving towards paid content. This can be
witnessed by the rise in the revenues of key players like Netflix, Spotify,
etc. Further, Global Music/Audio giant Spotify’s paid subscribers stood
at ~45% of monthly active users (MAU) in CY17 vs. ~26% in CY14.
Exhibit 6: Spotify subscribers (mn)
Source: Spotify, Internet Trends 2018, IIFL Research
Ad-spends to shift towards digital
In CY17, proportion of daily time spent on digital media by an individual
in US stood at ~49% of total time spent on media. While proportion of
advertising spends on digital media in US stood at ~41% of total media
advertising spends. Going forward, the advertisement spends would
move towards digital from traditional media given the popularity and
rising customer base of digital media.
Exhibit 7: Time spent on media vs. advertising spending (US)
Source: IAB internet advertising revenue report 2017, emarketer, Statista, IIFL Research
-
20
40
60
0
25
50
75
CY14 CY15 CY16 CY17
Subscribers(LHS) % of MAU (RHS)
-
10
20
30
40
50
60
70
Traditional media Mobile Other digital platforms
% of time spent % of advertisement spent
This conversion to paid subscribers is
dependent on user experiences

7 | P a g e
Premia Research
Key Global markets trends
China’s online video subscribers to increase 1.6x in 3 years
China’s subscription Video-on-demand (SVOD) viewers are expected to
reach ~234mn by CY20E (~144mn in CY17) aided by favorable internet
infrastructure. China’s online video subscribers are closing the gap
with the no. of Cable TV subscribers.
Exhibit 8: China’s SVOD viewers
Source: emarketer, IIFL Research
0
20
40
60
80
100
0
50
100
150
200
250
CY14 CY16 CY18E CY20E
SVOD viewes (mn, LHS) % of digital video viewers (RHS)
% of cable TV subscribers (RHS) % of broadband subscription (RHS)

8 | P a g e
Premia Research
India’s growth on global trends
Multifold increase in the average data usage
The last four years have seen boost in the data consumption owing to
decline in the data cost, better network availability and rising
smartphone penetration. According to Nokia MbIT report, 2018, in
CY17, India’s average 4G data consumption stood at record level of
~11GB/user/month.
Exhibit 9: Average data usage/user/month (MB)
Source: Nokia MbIT report, 2018, Analysys Mason, IIFL research
Subscriber base is expected to reach ~83cr by FY21E
India’s internet subscribers are expected to grow from ~446mn in
December, 2017 to ~829mn in FY21 owing to increasing affordability
of smartphone devices and falling data cost. As per the EY-FICCI report,
India is the second largest smart phone market in the world after
China.
Exhibit 10: Internet subscribers in India (mn)
Source: IBEF, TRAI, IIFL research
216 220 259 320680 753 849
2,970
11,04810,604
CY14 CY15 CY16 CY17
2G 3G 4G
0
100
200
300
400
500
600
700
800
900
FY06 FY07 FY08 FY09 FY10 FY11 FY12 FY13 FY14 FY15 FY16 FY17 FY18 FY21
As per Ericsson’s prediction, data
traffic is expected to reach
18GB/month/smartphone in CY23
As per Nokia MbiT report, installed
base of 3G and 4G capable devices
grew by 1.4x and 4.6x respectively
from CY15 to CY17

9 | P a g e
Premia Research
India’s growth on global trends
India’s exponential data consumption growth
4G continues to drive India’s overall data consumption. In December, 2017, 4G traffic consisted of ~82% of the total data traffic. Falling data prices, affordability of devices, development of indigenous video content and network expansion are the factors behind the spike in the data consumption. Further, with the advent of 5G, which India is aspiring to launch at par with developed countries, this data consumption trend is expected to continue on the same track.
Exhibit 11: India’s mobile data usage – per month
Source: Nokia MbIT report, 2018, Analysys Mason, Ericsson mobility report, IIFL research,
from CY13 to CY17, monthly data of December is taken; EB- Exabyte, PB- Petabyte
Indian online video audience to double by CY20E
Online video viewing audience in India is expected to grow at CAGR of
~26% over CY17-20E. The growth will be faster than the developed
countries like China and US, which are expected to grow at CAGR of
~6% and ~2% respectively over the same period.
Exhibit 12: Online video audience (mn)
Source: EY-FICCI March-18 report, IIFL Research
49PB 85PB 128PB1EB
2.4EB
14EB
CY13 CY14 CY15 CY16 CY17 CY23E
0
100
200
300
400
500
600
700
Brazil US India China
CY17 CY20E
In December, 2017, India consumed
~2,360 petabytes data, which is 48x of
December, 2013 consumption
10 | P a g e
Premia Research
India’s growth on global trends
The impact on the media sector is clearly visible, as telecom giant
Reliance is investing heavily in content and OTT companies.
In July, 2017 it had invested `413cr in the content producer Balaji Telefilms, which gave it the access to content generated by Balaji Telefilms to be used by its platform Jio Cinema.
Further, in February, 2018, it has also announced Joint Partnership with Eros India to set up a `1,000cr fund to co-produce and consolidate content.
In March, 2018, It also executed definitive agreement for the combination of Saavn, a leading global music OTT platform with JioMusic.
Indian broadcasters have also launched their own OTT platforms like
Star launched Hotstar, TV18 launched VOOT and ZEE launched ZEE5.
Further, distributor TATA Sky has launched its mobile app for
competing against Mobile TV platforms launched by Telecom players
like Airtel TV, Jio TV, etc.

11 | P a g e
Premia Research
India’s growth on global trends
Indian channels leading on YouTube
Indian YouTube channels are clearly leading in terms of cumulative
views compared to international channels in the same category. As on
June 29, 2018, SET India and Zee TV channels have crossed 19.7bn and
17.1bn total views on YouTube respectively, which is higher than
some of the leading international channels like ABS-CBN, ChuChu TV,
etc.
Exhibit 13: YouTube stats (TV channels)
Channels Subscribers (mn) Views* (bn) Base Country
SET India 26.2 19.7 India
Zee TV 15.2 17.1 India
ABS-CBN Entertainment
10.6 15.3 Philippines
ChuChu TV (Kids Songs)
18.1 14.4 Global
SAB TV 9.4 8.6 India
Ch3Thailand 9.8 8.4 Thailand
Colors TV 10.8 7.3 India
one31 9.1 6.5 Thailand
GMA Network 5.2 6.3 Philippines
Disney Junior UK 4.3 5.1 United Kingdom
Source: socialbakers.com, YouTube, IIFL Research
*Total uploaded video views
Further, in film industry channels category also, the Indian channels
like YRF, Rajshri and Shemaroo are amongst the top viewed YouTube
channels with total views of 6.7bn, 4.1bn and 3.9bn respectively.
Exhibit 14: YouTube stats (Film Industry)
Channels Subscribers (mn) Views* (bn) Base Country
DisneyChannelLA 8.9 7.1 Global
YRF 11.9 6.8 India
Teremok TV 4.0 5.1 Russia
Rajshri 7.5 4.2 India
Shemaroo 9.0 4.0 India
Warner Bros. Pictures
5.5 3.3 Global
DreamWorks TV 4.4 3.0 Global
Walt Disney Animation Studios
3.0 2.1 Global
Telugu Filmnagar 4.0 2.0 India
Sony Pictures Entertainment
2.4 2.0 US
Source: socialbakers.com, YouTube, IIFL Research
*Total uploaded video views

12 | P a g e
Premia Research
Favorable factors for sector
Gaming and Digital will be the fastest growing segments: Digital media and Online Gaming are the driving factors for the growth of the Indian M&E sector going ahead. The M&E sector is expected to reach `2 lakh cr by CY20E from `1.5 lakh cr in CY17, a CAGR of 11.3%. The Digital Media segment is expected to register CAGR of 23.5% over the same period, and would overtake Filmed Entertainment by CY20E.
Exhibit 15: Segment wise growth of Indian M&E sector
Segment (`Cr) CY16 CY17 CY18E CY20E CAGR (%)
(CY17-20E)
Television 59,400 66,000 73,400 86,200 9.3
Print 29,600 30,300 33,100 36,900 6.8
Filmed Ent. 12,200 15,600 16,600 19,200 7.2
Digital media 9,200 11,900 15,100 22,400 23.5
Animation and VFX 5,400 6,700 8,000 11,400 19.2
Live events 5,600 6,500 7,700 10,900 18.8
Online gaming 2,600 3,000 4,000 6,800 31.6
Out Of Home media 3,200 3,400 3,700 4,300 8.1
Radio 2,400 2,600 2,800 3,400 9.4
Music 1,200 1,300 1,400 1,800 11.5
Total 1,30,800 1,47,300 1,66,000 2,03,200 11.3 All Figures are gross of taxes Source: EY-FICCI March-18 report, IIFL Research
Digital subscription revenues to outperform advertising revenues Indian OTT players are projected to reflect the growth pattern of Netflix and Spotify in increasing the number of subscribers. Rapid growth of device base and better connectivity will drive faster digital subscription revenue vs. advertising revenue. Subscription revenues stood at ~3% of total digital revenues in CY17, which is expected to grow to ~10% in CY20E.
Exhibit 16: Digital subscription and advertising revenues (`Cr)
Source: EY-FICCI March-18 report, IIFL research
-
500
1,000
1,500
2,000
2,500
5,000
10,000
15,000
20,000
25,000
30,000
CY16 CY17 CY18E CY20E
Advertising (LHS) Subscription (RHS)
Digital media is expected to overtake
Filmed entertainment by CY20E
The digital subscription and
advertising revenues are expected to
grow at a CAGR of 72.7% and 21% over
CY17-20E respectively

13 | P a g e
Premia Research
Favorable factors for sector
Rising income level to drive demand
The rising proportion of high income group in overall population will drive future growth for internet consumption and smartphones. The proportion of aspirers in overall households will increase from 15% in CY17 to 20% by CY25E.
Exhibit 17: Indian households’ income groups (%)
Source: IBEF, IIFL research
Further, as per EY-FICCI report, the shift in the consumption pattern will be more on the basis of ability to pay rather than on geographic, gender and age criteria. Hence, by CY20E, tactical digital consumers (using Pay TV and Pay OTT) are expected to grow 3.3x from CY17, faster than mass consumers (TV+ Free OTT), which are expected to grow 2.5x over the same period.
Exhibit 18: Customer segment in India
Segment CY17 CY20E
Digital only (No TV) 1-1.5mn subscribers 4mn subscribers
Tactical digital consumers (Pay TV + Pay OTT)
6mn subscribers 20mn subscribers
Mass consumers (Pay TV or Free TV + Free OTT)
200+ mn subscribers 500+ mn subscribers
Source: EY-FICCI March-18 report, IIFL Research
0
20
40
60
80
100
CY05 CY16 CY17 CY25E
Elite (>US$30,800) Affluent (US$15,400-30,800)
Aspirers (US$7,700-15,400) Next billion (US$2,300-7,700)
Strugglers (US$2,300)
Large working population with lower
expenses on M&E activities presents a
potential opportunity for the M&E
industry in India
By CY20E, tactical digital consumers are
expected to grow ~3.3x from CY17,
while mass consumers are expected to
grow 2.5x

14 | P a g e
Premia Research
Favorable factors for sector
M&E sectors’ growth is parallel to the economy
In past, the growth patterns of advertising revenue of M&E sector have always been faster but in the same direction of the real GDP growth of the country. Further, World Bank is forecasting India’s growth rate at 7.5% both in CY19E and CY20E (aided by reforms like implementation of GST, Insolvency and Bankruptcy Code, etc.). Going forward, we expect the advertising revenue to grow parallel to economy at CAGR of 11.4% over CY17-20E.
Exhibit 19: Advertisement revenue growth vs. Real GDP (%)
Source: EY-FICCI March-18 report, IIFL Research
2
4
6
8
10
12
14
16
CY12 CY13 CY14 CY15 CY16 CY17
Advertising revenue growth in M&E Industry (%) Real GDP growth (%)

15 | P a g e
Premia Research
Digitization to drive mid-term growth
The cable TV Digitization amendment bill was passed in 2011, which has transformed the Indian TV distribution industry. Digitization bill mandated all analog cable distributors to digital addressable system. It was implemented in four phases. Digitization is providing significant advantages to entire TV Value Chain in terms of transparency and reduction in the revenue leakages, which would result in an ARPU increase across value chain and higher taxes for the government.
As a result of forced digitization, the digital cable subscribers are expected to reach 82mn by CY20E.
Exhibit 20: Indian TV subscriber split by distribution platform (mn)
Source: FICCI-KPMG 2017 report, IIFL research
Higher revenue collection from end use customers has resulted in higher share for Multi System Operators (MSOs) and broadcasters.
Prior to digitization, Local Cable Operators (LCOs) used to under report the actual number of subscribers and availed ~70% of the customer ARPU (Average Revenue Per User). Post digitization, due to higher transparency, it has come down to ~50%. This has resulted in increase in the Broadcasters’ share from ~15% to ~25% of the total customer ARPUs.
Exhibit 21: Customer ARPU share for various players in India
Stakeholders Before Digitisation (%) After Digitisation (%)
Consumer ARPU 100 100
LCOs 65-80 45-55
MSOs 10-20 15-25
Broadcasters 10-20 20-30
Source: EY-FICCI March-18 report, IIFL Research
69 7047
1 1
19 2945
76 82
3440 54 78 84910
2231
31
0
50
100
150
200
250
CY12 CY14 CY16 CY18E CY20E
Analog Cable Digital Cable Pay DTH Free Dish
Currently, ~83% of the total TV
households are paying subscribers

16 | P a g e
Premia Research
Digitization to drive mid-term growth
Increase in the ARPU shares for broadcasters will help them gain subscription revenue CAGR of 8.1% over CY17-20E. TV penetration in India has reached 64% taking the total number of TV viewing households to 183mn in CY17. This accounts for ~780mn viewers. TV viewing households are expected to reach to 198mn in CY20E.
Exhibit 22: Indian Broadcaster’s revenue mix (`Cr)
Source: EY-FICCI March-18 report, IIFL research
Digitization phases
Phases Implementation
Phase I Covered four metros (Mumbai, Delhi, Kolkata and Chennai) to be digitised
Phase II Focused on the 38 top cities with population more than 1mn
Phase III Rest of the urban area
Phase IV Rest of India
Digitization has resulted in significant capital requirements for cable
and DTH platforms, as set top boxes were made mandatory for all the
households. This can be witnessed by recent consolidations and
investments.
In July, 2017, GTPL Hathway got listed and raised ~`485cr, out of which `240cr was fresh issue. Dish TV and Videocon D2H also amalgamated their businesses to gain synergy benefits.
In November, 2017, Reliance Communication Ltd sold its DTH business, Reliance Big TV Ltd to Pantel Technologies, an Information Technology and Communication devices hardware company.
9,000 9,900 10,900 11,700 12,500
24,300 26,700
30,400 33,500
36,800
-
10,000
20,000
30,000
40,000
50,000
60,000
CY16 CY17 CY18E CY19E CY20E
Subscription Advertising
Increased transparency due to
digitization will lead to reduction in
revenue leakages for broadcasters

17 | P a g e
Premia Research
OTT platforms in India and its impact
Indian platforms are still cheaper than Netflix
With the advent of Netflix all the broadcasters have launched own OTT platforms. Netflix has gained huge popularity in developed countries owing to its huge content inventory. However, Indian OTT platforms are way cheaper than Netflix. Leading Indian platforms like Hotstar, Zee5, SunNXT and Sonyliv have monthly subscription fees ranging from ~`40 to ~`83. While Netflix’s subscription fee is ~`800/month.
Exhibit 23: Various OTT platforms in India
OTT Platform Revenue model Monthly price (`) Global entrants
Netlfix SVOD ~800
Amazon prime SVOD ~83
Broadcasters
Hotstar Freemium ~83
VOOT AVOD -
Sony liv Freemium ~42
Zee5 Freemium ~83
SunNXT SVOD ~40
New entrants
TVF AVOD -
Producers
ALT Freemium ~25
EROS Freemium ~79
Audio
Saavn Freemium ~83
Gaana Freemium ~33
Telcos
Jio Cinema Free -
Source: IIFL Research; AVOD- Advertising Video-on-demand, SVOD- Subscription Video-on-demand
In freemium model, companies offer
free subscription for some episodes,
while some content is provided on paid
basis.

18 | P a g e
Premia Research
OTT platforms in India and its impact
Segment wise impact of OTT platforms
Players Impact Reasons
Broadcasters Neutral Launched own OTT platforms. All channels are available on Telecom platforms like Jio TV, Airtel TV, etc.
Content Producers/Aggregators
Positive Competition intensity of OTT players and Telecom operators will drive overall content demand.
Exhibitors Moderate
Film producers may sell rights of small budget movies directly to OTT platforms. Big budget movies with special effects are bound to go for theatrical releases in order to realize higher costs.
DTH/Cable operators Negative
Declining internet costs will take away the lower cost advantage of distributors in medium term. However, for small cities and rural markets, the threat is limited in medium term due to lower internet penetration.
Radio/Print Media Neutral
No impact expected on Print Media/Radio from OTT players, as both these serve different purposes to the consumers.
19 | P a g e
Premia Research
Zee Entertainment Enterprises Ltd CMP: ` 539; 1-year target: ` 691
Sector M&E
Recommendation BUY
Upside 28%
Stock Data
Sensex 35,264
52 Week h/l (`) 619/477
Market cap (` Cr) 51,768
BSE Code 505537
NSE Code ZEEL
FV (`) 1
Div yield (%) 0.51
Shareholding Pattern
Sep-17 Dec-17 Mar-18
Promoters 43.07 43.07 41.62
DII+FII 50.52 50.65 52.18
Individuals 6.41 6.27 6.20
Source: ACE Equity, IIFL Research
Share Price Trend
Prices as on 02/07/2018
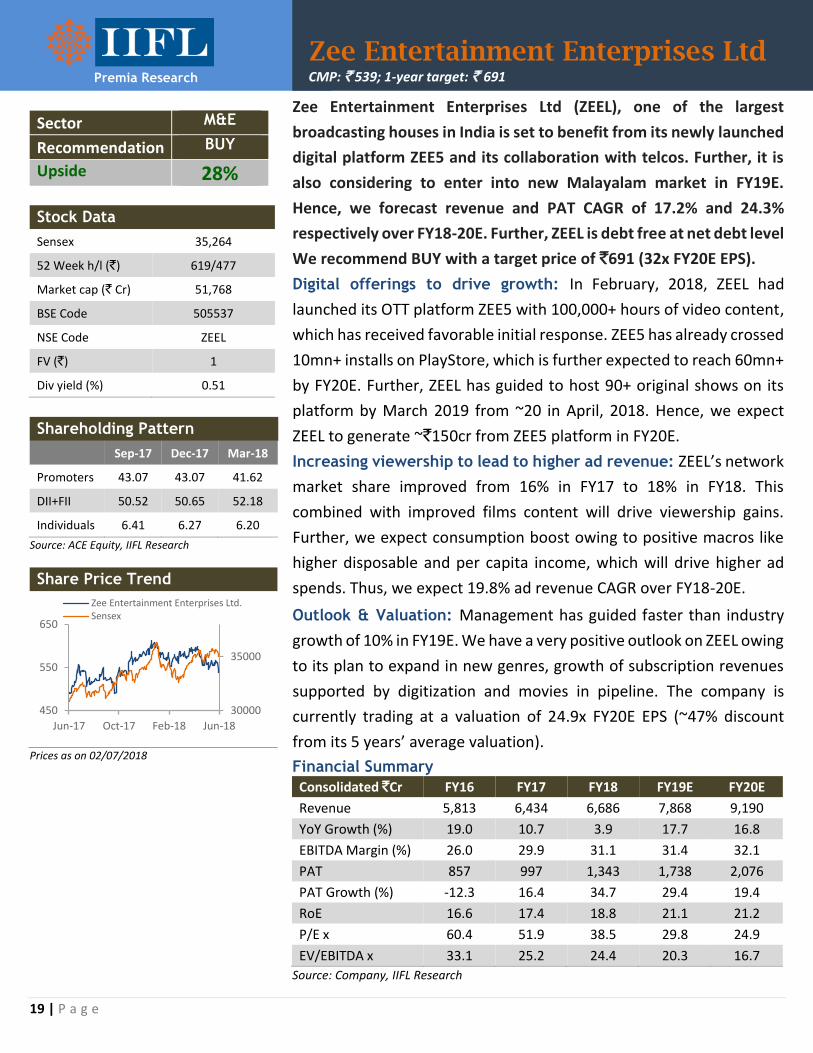
Zee Entertainment Enterprises Ltd (ZEEL), one of the largest
broadcasting houses in India is set to benefit from its newly launched
digital platform ZEE5 and its collaboration with telcos. Further, it is
also considering to enter into new Malayalam market in FY19E.
Hence, we forecast revenue and PAT CAGR of 17.2% and 24.3%
respectively over FY18-20E. Further, ZEEL is debt free at net debt level
We recommend BUY with a target price of `691 (32x FY20E EPS).
Digital offerings to drive growth: In February, 2018, ZEEL had
launched its OTT platform ZEE5 with 100,000+ hours of video content,
which has received favorable initial response. ZEE5 has already crossed
10mn+ installs on PlayStore, which is further expected to reach 60mn+
by FY20E. Further, ZEEL has guided to host 90+ original shows on its
platform by March 2019 from ~20 in April, 2018. Hence, we expect
ZEEL to generate ~`150cr from ZEE5 platform in FY20E.
Increasing viewership to lead to higher ad revenue: ZEEL’s network
market share improved from 16% in FY17 to 18% in FY18. This
combined with improved films content will drive viewership gains.
Further, we expect consumption boost owing to positive macros like
higher disposable and per capita income, which will drive higher ad
spends. Thus, we expect 19.8% ad revenue CAGR over FY18-20E.
Outlook & Valuation: Management has guided faster than industry
growth of 10% in FY19E. We have a very positive outlook on ZEEL owing
to its plan to expand in new genres, growth of subscription revenues
supported by digitization and movies in pipeline. The company is
currently trading at a valuation of 24.9x FY20E EPS (~47% discount
from its 5 years’ average valuation).
Financial Summary
Consolidated `Cr FY16 FY17 FY18 FY19E FY20E
Revenue 5,813 6,434 6,686 7,868 9,190
YoY Growth (%) 19.0 10.7 3.9 17.7 16.8
EBITDA Margin (%) 26.0 29.9 31.1 31.4 32.1
PAT 857 997 1,343 1,738 2,076
PAT Growth (%) -12.3 16.4 34.7 29.4 19.4
RoE 16.6 17.4 18.8 21.1 21.2
P/E x 60.4 51.9 38.5 29.8 24.9
EV/EBITDA x 33.1 25.2 24.4 20.3 16.7
Source: Company, IIFL Research
30000
35000
450
550
650
Jun-17 Oct-17 Feb-18 Jun-18
Zee Entertainment Enterprises Ltd.Sensex
20 | P a g e
Premia Research
Zee Entertainment Enterprises Ltd
Company Overview
ZEEL is present across broadcasting, movies, music, live entertainment and digital businesses, both within India and overseas. It has more than 240,000 hours of television content, offered through 32 domestic and 39 international channels.
ZEEL houses the world’s largest Hindi film library and has rights to more than 4,200 movie titles across various languages. ZEEL has also produced several movies for theatrical release and is the fastest growing music label in India. It has recently launched digital platform, ZEE5, with 100,000 hours of multilingual content.
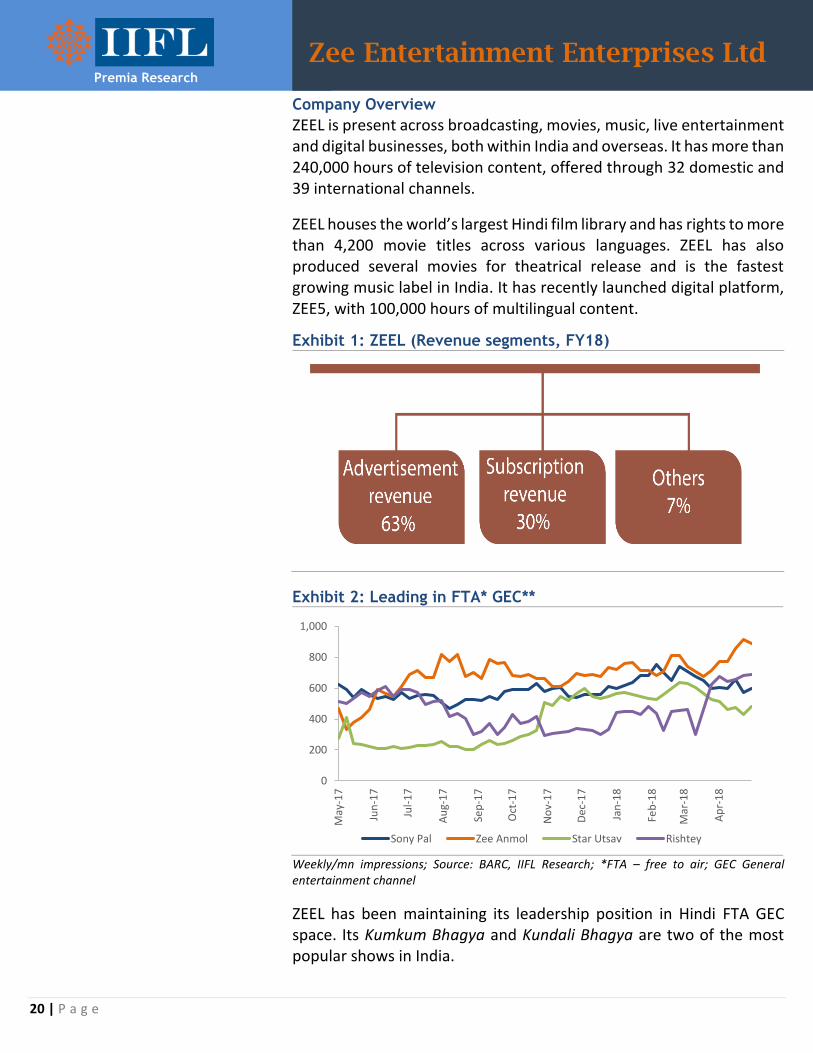
Exhibit 1: ZEEL (Revenue segments, FY18)
Exhibit 2: Leading in FTA* GEC**
Weekly/mn impressions; Source: BARC, IIFL Research; *FTA – free to air; GEC General entertainment channel
ZEEL has been maintaining its leadership position in Hindi FTA GEC space. Its Kumkum Bhagya and Kundali Bhagya are two of the most popular shows in India.
0
200
400
600
800
1,000
May
-17
Jun
-17
Jul-
17
Au
g-1
7
Sep
-17
Oct
-17
No
v-1
7
Dec
-17
Jan
-18
Feb
-18
Mar
-18
Ap
r-1
8
Sony Pal Zee Anmol Star Utsav Rishtey

21 | P a g e
Premia Research
Zee Entertainment Enterprises Ltd
Exhibit 3: Clear winner in Marathi
Weekly/mn impressions, Source: BARC, IIFL Research
Exhibit 4: Stiff competition in Telugu space
Weekly/mn impressions, Source: BARC, IIFL Research
Exhibit 5: Hindi GEC pay channel: Competing with Colors
Weekly/mn impressions, Source: BARC, IIFL Research
0
50
100
150
200
250
300
350
May
-17
Jun
-17
Jul-
17
Jul-
17
Au
g-1
7
Sep
-17
Sep
-17
Oct
-17
No
v-1
7
No
v-1
7
Dec
-17
Jan
-18
Jan
-18
Feb
-18
Mar
-18
Ap
r-1
8
Ap
r-1
8
May
-18
Zee Marathi Colors Marathi Zee Talkies Star Pravah
200
250
300
350
400
450
500
550
600
650
May
-17
Jun
-17
Jul-
17
Jul-
17
Au
g-1
7
Sep
-17
Sep
-17
Oct
-17
No
v-1
7
No
v-1
7
Dec
-17
Jan
-18
Jan
-18
Feb
-18
Mar
-18
Ap
r-1
8
Ap
r-1
8
May
-18
ETV Telugu Maa TV Zee Telugu Gemini TV
100
200
300
400
500
600
700
800
May
-17
Jun
-17
Jul-
17
Jul-
17
Au
g-1
7
Sep
-17
Sep
-17
Oct
-17
No
v-1
7
No
v-1
7
Dec
-17
Jan
-18
Jan
-18
Feb
-18
Mar
-18
Ap
r-1
8
Ap
r-1
8
May
-18
Star Plus Colors Zee TV Sony
In Marathi space, Zee Marathi got ~270mn weekly average impressions in last one year vs. ~93mn and ~90mn of Colors Marathi and Star Pravah
In Hindi Primary GEC space, Zee TV got ~594mn weekly average impressions in last one year vs. ~546mn of Colors

22 | P a g e
Premia Research
Zee Entertainment Enterprises Ltd
Exhibit 6: Growth of subscription revenues
Source: Company, IIFL Research
We expect ZEEL’s subscription revenue CAGR of ~12.4% over FY18-20E driven by digitization and increase in ARPU. Consolidation of distribution platform operators (DPOs) will give them greater pricing power, which ultimately bodes well for the company. Further, its partnership with telcos will also drive subscription revenues.
Margin expansion to improve return ratios: The company’s EBITDA margin is estimated to expand from 31.1% in FY18 to 32.1% in FY20E owing to expected viewership gains, higher advertisement revenues, sell of loss making sports business and partnership with telcos. The higher margin will drive growth of return ratios going forward. We expect ROE and ROCE to expand by ~230bps and ~340bps to 21.2% and 24.8% by FY20E.
Exhibit 7: EBITDA margins and return ratios
Source: Company, IIFL Research
-15
-10
-5
-
5
10
15
20
-
500
1,000
1,500
2,000
2,500
3,000
FY16 FY17 FY18 FY19E FY20E
Subscription revenue (Rs cr) LHS Growth (%) RHS
20
22
24
26
28
30
32
34
15
17
19
21
23
25
27
29
31
FY16 FY17 FY18 FY19E FY20E
EBITDA margins (%) RHS ROE (%) LHS ROCE (%) LHS
ROCE and ROE would increase on account of improving margin profile and low debt
Digitization has increased transparency, which is leading to lesser leakages of revenues for Broadcasters
23 | P a g e
Premia Research
Zee Entertainment Enterprises Ltd
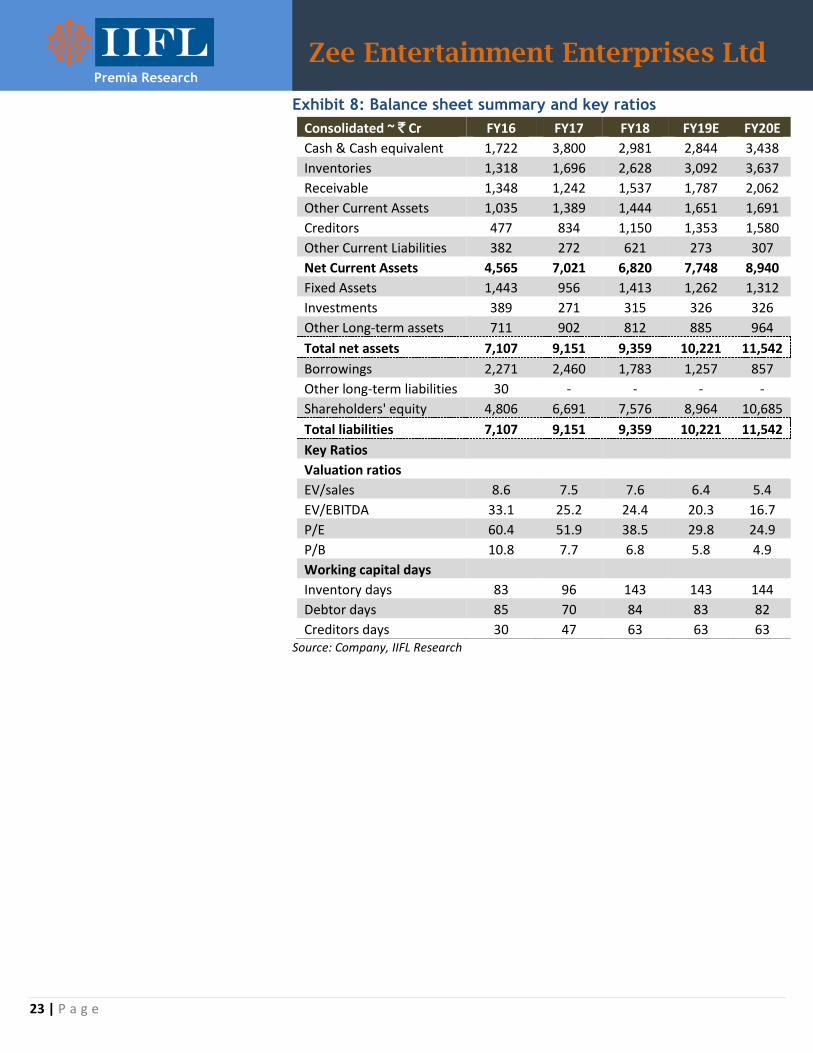
Exhibit 8: Balance sheet summary and key ratios
Consolidated ~ ` Cr FY16 FY17 FY18 FY19E FY20E
Cash & Cash equivalent 1,722 3,800 2,981 2,844 3,438
Inventories 1,318 1,696 2,628 3,092 3,637
Receivable 1,348 1,242 1,537 1,787 2,062
Other Current Assets 1,035 1,389 1,444 1,651 1,691
Creditors 477 834 1,150 1,353 1,580
Other Current Liabilities 382 272 621 273 307
Net Current Assets 4,565 7,021 6,820 7,748 8,940
Fixed Assets 1,443 956 1,413 1,262 1,312
Investments 389 271 315 326 326
Other Long-term assets 711 902 812 885 964
Total net assets 7,107 9,151 9,359 10,221 11,542
Borrowings 2,271 2,460 1,783 1,257 857
Other long-term liabilities 30 - - - -
Shareholders' equity 4,806 6,691 7,576 8,964 10,685
Total liabilities 7,107 9,151 9,359 10,221 11,542
Key Ratios Valuation ratios EV/sales 8.6 7.5 7.6 6.4 5.4
EV/EBITDA 33.1 25.2 24.4 20.3 16.7
P/E 60.4 51.9 38.5 29.8 24.9
P/B 10.8 7.7 6.8 5.8 4.9
Working capital days
Inventory days 83 96 143 143 144
Debtor days 85 70 84 83 82
Creditors days 30 47 63 63 63 Source: Company, IIFL Research

24 | P a g e
Premia Research
Zee Entertainment Enterprises Ltd
Rationale for PE multiple: We have assigned target multiple of 32x
FY20E EPS, which is at ~16% discount to its 5 years’ average valuation
considering its expected increase in the content cost. However,
considering its high return ratios, debt free position at net debt level
and launch of its OTT platform, ZEE5, it deserves such valuation. The
stock is currently trading at a valuation of 24.9x FY20E EPS.
Exhibit 9: 1-Year forward PE band
Source: ACE Equity, IIFL Research
Key Risks
Rising content cost may affect its margins.
Pricing pressure due to competition intensity may affect advertisement revenues.
15
20
25
30
35
40
45
50
Jun
-14
Sep
-14
Dec
-14
Mar
-15
Jun
-15
Sep
-15
Dec
-15
Mar
-16
Jun
-16
Sep
-16
Dec
-16
Mar
-17
Jun
-17
Sep
-17
Dec
-17
Mar
-18
Jun
-18

25 | P a g e
Premia Research
Sun TV Network Ltd
CMP: ` 782; 1-year target: ` 984
Sector M&E
Recommendation BUY
Upside 26%
Stock Data
Sensex 35,264
52 Week h/l (`) 1097/652
Market cap (` Cr) 30,799
BSE code 532733
NSE code SUNTV
FV (`) 5
Div yield (%) 1.08
Shareholding Pattern
Sep-17 Dec-17 Mar-18
Promoters 75.00 75.00 75.00
DII+FII 16.82 16.99 16.86
Individuals 8.18 8.01 8.14
Source: ACE Equity, IIFL Research
Share Price Trend
Prices as on 02/07/2018
Sun TV Network Ltd (STV) is a part of one of the largest Indian media
conglomerates – the Sun Group. STV is set to benefit from TRAI’s
pricing order for ala carte offerings post which ARPUs are expected
to grow. To ride on the OTT wave, it has already launched its digital
platform SunNXT with 4,000+ movies, originals and live TV. It already
has 5mn+ installs on PlayStore, which we expect to cross 20mn by
FY20E. Hence, we project revenue CAGR of ~17% and PAT CAGR of
~21% over FY18-20E. STV is debt free with RoE and RoCE of ~26% and
~37% (FY18) respectively. We recommend BUY with target price of
`984 (23.5x FY20E EPS).
Digitization to drive subscription revenues: Currently, 4.5mn
households have been digitized in Tamil Nadu and ~9mn more
households are expected to be digitized by FY19E. STV has also
concluded an agreement with Tamil Nadu’s Arasu Cable TV
Corporation. ARPU for Arasu has increased from ~`70 to ~`90, out of
this ~`40 ARPU share is expected for STV, driving domestic
subscription revenue CAGR of ~19% over FY18-20E.
STV’s share in Tamil GEC and movie market to improve: STV
continues to hold more than 50% market share in Tamil GEC and movie
market and which is expected to improve further. We expect STV to
launch second Tamil GEC channel and enter a new regional market in
FY19E driving advertising revenue CAGR of ~12% over FY18-20E.
Outlook & Valuation: We have a very positive outlook on STV given
optimization in movie capex, IPL franchisee turning profitable, fading
political headwinds and strong ad revenue growth. The company is
currently trading at a valuation of 18.7x FY20E EPS. (~26% discount
from its 2 years’ average valuation).
Financial Summary
Consolidated `Cr FY16 FY17 FY18 FY19E FY20E
Revenue 2,474 2,646 2,963 3,515 4,062
YoY Growth (%) 3.3 7.0 12.0 18.6 15.6
EBITDA Margin (%) 70.0 66.9 67.6 68.1 67.4
PAT 904 1,030 1,135 1,401 1,649
PAT Growth(%) 15.6 14.0 10.2 23.4 17.7
RoE 26.1 27.5 26.0 27.2 26.6
P/E x 33.4 29.9 27.1 22.0 18.7
EV/EBITDA x 17.1 16.7 14.4 11.9 10.0 Source: Company, IIFL Research
30000
32000
34000
36000
38000
650
850
1050
Jun-17 Oct-17 Feb-18 Jun-18
Sun TV Network Ltd. Sensex

26 | P a g e
Premia Research
Sun TV Network Ltd
Company Overview
Sun TV Network is part of India’s largest media conglomerate – the Sun Group, run by Kalanithi Maran. The network has a power packed 33 TV channels in four south Indian languages. These channels are present in general entertainment, news, movies and kids’ entertainment genres with the reach of more than 95mn households in India.
Primarily, it caters to the south Indian markets. Moreover, its channels can be viewed in 27 foreign countries. Further, it has huge movie library with perpetual rights. In CY12, the company had acquired Hyderabad franchise of Indian Premier League (IPL). Its production studio, Sun Pictures has also produced movies like Enthiran and Siragugal starring Rajinikanth and Vikram respectively.
Exhibit 1: STV (Revenue segments, FY18)
Subscription revenues include international subscription as well
Caters to strongest TV market of the country: As per EY-FICCI
report, daily time spent by south Indian individuals on TV is higher by
~38mm than that of other Hindi speaking markets (HSM; Week 40-52,
2017). Further, daily and weekly tune-ins are also higher for south
Indian market.
Exhibit 2: Individual tune-ins on TV and daily time spent in India
Geographies Weekly Tune-
ins (%) Daily
Tune-ins (%) Daily Time spent on TV
(HH:MM:SS)
HSM 91.80 68.40 03:31:36
South 94.80 78.30 04:09:25
India 92.70 71.50 03:44:28 Source: EY-FICCI, All India/Individual/Week 40-52, 2017, IIFL Research

27 | P a g e
Premia Research
Sun TV Network Ltd
Exhibit 3: Overall TV Industry viewership by geographies (bn)
Source: EY-FICCI, All India/Individual/Week 40-52, 2017, IIFL Research
Strong foothold in Tamil and Kannada market: South India is the strongest market for TV broadcasters in terms of viewership and daily time spent. STV has clear leadership in Tamil market. Its flagship channel, Sun TV, has generated ~952mn weekly average impressions compared to ~405mn of Star Vijay.
Exhibit 4: Maintaining leadership in Tamil Market
Weekly/mn impressions, Source: BARC, IIFL Research
18.1
11.1
HSM South
80
280
480
680
880
1080
1280
May
-17
Jun
-17
Jul-
17
Jul-
17
Au
g-1
7
Sep
-17
Sep
-17
Oct
-17
No
v-1
7
No
v-1
7
Dec
-17
Jan
-18
Jan
-18
Feb
-18
Mar
-18
Ap
r-1
8
Ap
r-1
8
May
-18
Sun TV Zee Tamil Star Vijay
Digitization in Tamil Nadu leading to greater visibility which bodes well for STV
South geographies include
Telngana/AP, Tamilnadu/pondicherry,
Karnataka, Kerala

28 | P a g e
Premia Research
Sun TV Network Ltd
STV’s another channel Udaya TV has been gaining viewership continuously over last one year (refer Exhibit 5). As per BARC data, its average weekly impressions for first four weeks of May, 2018 stood at ~214mn compared to ~147mn in June, 17.
Exhibit 5: Udaya gaining viewership in Kannada
Weekly/mn impressions, Source: BARC, IIFL Research
However, there is no clear winner in Telugu market. Its channel Gemini TV faces tough competition from Maa TV and Zee Telugu (refer Exhibit 6).
Exhibit 6: Stiff competition in Telugu market for Gemini
Weekly/mn impressions, Source: BARC, IIFL Research
Robust revenue growth ahead: Digitization, ARPU increase and IPL
franchisee’s increasing popularity will aid STV to clock ~12% and ~19%
advertising and domestic subscription revenue CAGR over FY18-20E
respectively. Further, consumption boost, entry into new regional
markets and higher internet penetration bodes well for the company.
050
100150200250300350400450500
May
-17
Jun
-17
Jul-
17
Jul-
17
Au
g-1
7
Sep
-17
Sep
-17
Oct
-17
No
v-1
7
No
v-1
7
Dec
-17
Jan
-18
Jan
-18
Feb
-18
Mar
-18
Ap
r-1
8
Ap
r-1
8
May
-18
Colors Kannada Udaya TV Suvarna Zee Kannada
100
200
300
400
500
600
700
May
-17
Jun
-17
Jul-
17
Jul-
17
Au
g-1
7
Sep
-17
Sep
-17
Oct
-17
No
v-1
7
No
v-1
7
Dec
-17
Jan
-18
Jan
-18
Feb
-18
Mar
-18
Ap
r-1
8
Ap
r-1
8
May
-18
ETV Telugu Maa TV Zee Telugu Gemini TV

29 | P a g e
Premia Research
Sun TV Network Ltd
Exhibit 7: Advertising and domestic subscription revenues
Source: Company, IIFL Research
IPL franchisee turning profitable: We expect the company’s IPL franchisee to turn profitable in FY19E, as IPL franchisee cost is decided at ~20% revenue share vs. `85.5cr fee earlier. STV’s Hyderabad franchisee won its maiden IPL title in 2016, while stood second in 2018.
Rationale for PE multiple: In our opinion, a company like STV
deserves premium valuation considering its high return ratios, debt
free position and strong foothold in South market. Further, political
headwinds are also fading, as the ruling party in Tamil Nadu is in its
second term and is no longer as powerful as it was during Jayalalitha’s
Era. The stock is currently trading at 18.7x FY20E EPS. We have valued
the stock at its last 2 years’ average valuation of 23.5x.
Exhibit 8: 1 Year Forward PE band
Source: Ace Equity, IIFL Research
-5
0
5
10
15
20
25
0
500
1000
1500
2000
2500
FY16 FY17 FY18E FY19E FY20E
Advertising revenues Subscription revenues
Advertising revenue growth yoy (%) Subscription revenue growth yoy (%)
0
5
10
15
20
25
30
35
Jul-
16
Au
g-1
6
Sep
-16
Oct
-16
No
v-1
6
Dec
-16
Jan
-17
Feb
-17
Mar
-17
Ap
r-1
7
May
-17
Jun
-17
Jul-
17
Au
g-1
7
Sep
-17
Oct
-17
No
v-1
7
Dec
-17
Jan
-18
Feb
-18
Mar
-18
Ap
r-1
8
May
-18
Jun
-18
As per EY-FICCI report, overall industry
subscription and advertising revenues
are expected to grow at a CAGR of 8.3%
and 11.4% over CY17-20E
Strong balance sheet with debt free
position will help company to fund for
expansion plans in newer geographies
with internal accruals

30 | P a g e
Premia Research
Sun TV Network Ltd
Exhibit 9: Balance Sheet summary and key ratios
Consolidated ~ ` Cr FY16 FY17 FY18 FY19E FY20E
Cash & Cash equivalent 1,149 1,334 1,888 2,428 3,444
Inventories 1 1 0 1 2
Receivable 776 773 1,064 1,252 1,436
Other Current Assets 396 156 149 217 262
Creditors 56 72 84 96 111
Other Current Liabilities 192 208 409 278 321
Net Current Assets 2,075 1,982 2,608 3,525 4,713
Fixed Assets 846 1,213 1,189 1,138 1,108
Investments 392 615 636 680 680
Other Long-term assets 200 287 350 364 380
Total net assets 3,512 4,098 4,782 5,707 6,881
Borrowings - - - - -
Other long-term liabilities 35 65 90 92 94
Shareholders' equity 3,477 4,032 4,692 5,615 6,786
Total liabilities 3,512 4,098 4,782 5,707 6,881
Key Ratios Valuation ratios
EV/sales 12.0 11.1 9.8 8.1 6.7
EV/EBITDA 17.1 16.7 14.4 11.9 10.0
P/E 33.4 29.9 27.1 22.0 18.7
P/B 8.9 7.6 6.6 5.5 4.5
Working capital days Inventory days 0 0 0 0 0
Debtor days 115 107 131 130 129
Creditors days 8 10 10 10 10 Source: Company, IIFL Research
Key Risks
Competitive intensity in south Indian market may put pricing pressure on the company.
Rise in the content cost may affect its margins.
Political instability might put regulatory risk on the company in the Tamil market.

31 | P a g e
Premia Research
Shemaroo Entertainment Ltd
CMP: ` 481; 1-year target: ` 580
Sector M&E
Recommendation BUY
Upside 21%
Stock Data
Sensex 35,264
52 Week h/l (`) 595/325
Market cap (` Cr) 1,310
BSE code 538685
NSE code SHEMAROO
FV (`) 10
Div yield (%) 0.31
Shareholding Pattern
Sep-17 Dec-17 Mar-18
Promoters 65.82 65.82 65.82
DII+FII 18.24 18.12 16.59
Individuals 15.94 16.06 17.59
Source: ACE Equity, IIFL Research
Share Price Trend
Prices as on 02/07/2018
Shemaroo Entertainment Ltd (Shemaroo), one of the largest content
aggregators of India is set to benefit from rising internet usage
leading to robust growth of its digital business. We forecast revenue
CAGR of ~14% over FY18-20E. Further, Reduction in debt leading to
reduction in finance cost will drive PAT CAGR of 26% over FY18-20E.
Considering its strengthening balance sheet with ROE and ROCE of
17.5% and 23.7% (FY18) respectively, we recommend BUY with a
target price of `580 (14x FY20E EPS).
Robust growth of Digital segment: The average price for mobile data
has fallen from ~`200/GB two years back to `3.2/GB currently.
Currently, Shemaroo’s content gets ~700mn monthly views on
YouTube compared to ~300mn two years back. This bodes well for the
company’s digital segment. Hence, we expect digital revenue CAGR of
~23% over FY18-20E.
Investment phase is over: Company’s inventory grew by ~`72cr p.a.
over FY13-18 due to heavy investment in movie titles. However, going
forward we expect it to grow by only ~`40cr p.a. in both FY19E/20E, as
company now has sufficient inventory (+3,400 titles) to monetize from.
Hence, we expect the net debt to equity to come down from ~0.4x in
FY18 to ~0.2x in FY20E.
Outlook & Valuation: We are positive on Shemaroo owing to its
strong movie inventory, launch of new spiritual applications and higher
content expenditure guidance by the broadcasters (customers of
Shemaroo). Company is reasonably priced at 11.3x FY20E EPS (trading
at a discount to Balaji Telefilms, 33.8x FY20E EPS).
Financial Summary
Consolidated `Cr FY16 FY17 FY18 FY19E FY20E
Revenue 375 426 489 566 635
YoY Growth (%) 16.0 13.5 14.8 15.9 12.1
EBITDA Margin (%) 28.7 30.0 29.1 29.9 30.4
PAT 52 61 71 99 113
PAT Growth (%) 27.5 17.9 15.7 38.9 14.3
RoE 15.3 15.5 15.4 18.2 17.5
P/E x 25.1 21.3 18.4 13.2 11.6
EV/EBITDA x 14.1 12.6 10.6 8.7 7.4
Source: Company, IIFL Research
30000
32000
34000
36000
38000
330
430
530
Jun-17 Oct-17 Feb-18 Jun-18
Shemaroo Entertainment Ltd.
Sensex

32 | P a g e
Premia Research
Shemaroo Entertainment Ltd
Company Overview
Shemaroo is an established Filmed Entertainment “content house” with activities across content aggregation & ownership, value addition to content and content distribution with a library of over 3,400 titles. Shemaroo is engaged in the distribution of content for satellite channels, physical formats and emerging digital technologies like mobile, internet, broadband and DTH among others.
Shemaroo purchases titles of movies from TIPS, Sohail Khan Productions, Viacom 18, etc. Its customers include OTT players like Netflix, Broadcasters like Star Gold, Set Max, Zee Cinema, etc. It also sells it content to other media like overseas and in flight.
Company typically participates in the second and subsequent cycles of film monetization, which is after 5-7 years of release of the movies. These subsequent cycles contribute 5-10% of the producers’ revenue. There is a lower risk in these cycles due to visibility of performance of movies during first cycle of launch.
The company has agreements with major telecom operators namely Airtel, Vodafone, Idea, etc. It also distributes its contents to other media platforms like In-flight entertainment, Overseas, International Film festivals, etc., with presence in US, UK, Canada, UAE, Australia, Singapore, etc. Exhibit 1: Mobile internet consumption in India
Source: FICCI-KPMG 2017 report, IIFL Research
Video content is dominating mobile internet usage and going forward the same trend is expected to continue further. The contribution from videos in overall internet consumption is expected to grow to ~75% in CY21E from ~49% in CY16.
CY16
File sharing Video
CY21E
Streaming Audio Other
Installed base of 3G and 4G capable
device base grew by 1.4x and 4.6x
respectively from CY15 to CY17
India is second largest smart phone
market in the world after China

33 | P a g e
Premia Research
Shemaroo Entertainment Ltd
Exhibit 2: Shemaroo’s content views on YouTube (lakhs per day)
Source: Company, IIFL Research
Shemaroo is amongst the most viewed channel partners for YouTube in India. It has more than 40 channels of its own on YouTube. Till now, its two flagship channels Shemaroo and FilmiGaane have already crossed 4bn and 3bn cumulative views respectively.
Shemaroo’s digital segment to outperform traditional business
Rising internet penetration will drive faster digital revenue growth at a CAGR of 23% over FY18-20E compared to 10.5% of traditional over the same period. Digital revenue contribution is expected to reach to ~31% by FY20E in overall revenue from ~27% in FY18.
Exhibit 3: Traditional and Digital segment revenues
Source: Company, IIFL Research
0
10
20
30
40
50
60
70
80
-
100
200
300
400
500
FY16 FY17 FY18 FY19E FY20ETraditional Media (Cr) Digital Media (Cr)
Traditional Media growth (%) Digital Media growth (%)
Overall industry’s digital media is
expected to grow at a CAGR of 23.5%
over CY17-20E
Shemaroo’s content on YouTube gets over
7,000lakhs views a month or more than
200lakhs hits per day

34 | P a g e
Premia Research
Shemaroo Entertainment Ltd
Exhibit 4: Return ratios to improve with margin expansion
Source: Company, IIFL Research
We expect ROE and ROCE to expand by ~210bps and ~440bps to 17.5% and 23.7% respectively owing to margin expansion. Increase in the monetization opportunities going forward will help company to expand its PAT margin by ~320bps over the same period. Rationale for PE multiple and peer comparision: Current scenario of rising internet penetration with higher per capita disposable income bodes well for content players. We prefer Shemaroo over EROS and Balaji Telefilms considering its consistency in the profitability and higher return ratios. Hence, we assign it a target multiple of 14x FY20E EPS. Stock is currently trading at 11.3x FY20E EPS, which is at a huge discount from its peer Balaji Telefilms’ multiple of 33.8x FY20E EPS.
Exhibit 5: 1 Year forward PE
Source: ACE Equity, IIFL Research
0
5
10
15
20
25
5
10
15
20
25
30
35
FY16 FY17 FY18 FY19E FY20E
EBITDA margin (%) LHS PAT margin (%) LHS
ROE (%) RHS ROCE (%) RHS
4
6
8
10
12
14
16
18
Oct
-14
Dec
-14
Feb
-15
Ap
r-1
5
Jun
-15
Au
g-1
5
Oct
-15
Dec
-15
Feb
-16
Ap
r-1
6
Jun
-16
Au
g-1
6
Oct
-16
Dec
-16
Feb
-17
Ap
r-1
7
Jun
-17
Au
g-1
7
Oct
-17
Dec
-17
Feb
-18
Ap
r-1
8
Jun
-18

35 | P a g e
Premia Research
Shemaroo Entertainment Ltd
Exhibit 6: Peer comparison P/E EV/EBITDA ROE FY19E FY20E FY19E FY20E FY19E FY20E
Balaji Telefilms 38.2 33.8 16.3 13.4 3.1 3.3
Shemaroo Enter 13.2 11.6 8.7 7.4 18.2 17.5 Source: Bloomberg, IIFL Research
Exhibit 7: Balance Sheet summary and key ratios
Consolidated ~ ` Cr FY16 FY17 FY18E FY19E FY20E
Cash & Cash equivalent 2 2 1 2 3
Inventories 388 500 530 565 615
Receivable 107 191 141 157 174
Other Current Assets 68 36 16 34 38
Creditors 11 19 18 21 24
Other Current Liab. 18 34 17 19 22
Net Current Assets 535 677 653 717 784
Fixed Assets 31 35 33 33 33
Investments 8 7 10 11 11
Other Long-term assets 9 9 3 3 4
Total net assets 584 728 700 765 831
Borrowings 212 296 202 171 131
Other long-term liab. 7 8 5 5 6
Shareholders' equity 364 423 493 589 695
Total liabilities 584 728 700 765 831
Key Ratios
Valuation ratios
EV/sales 4.0 3.8 3.1 2.6 2.3
EV/EBITDA 14.1 12.6 10.6 8.7 7.4
P/E 25.1 21.3 18.4 13.2 11.6
P/B 3.6 3.1 2.6 2.2 1.9
Working capital days
Inventory days 377 429 396 366 354
Debtor days 104 164 105 101 100
Creditors days 10 16 14 14 14 Source: Company, IIFL Research
Key Risks:
Competition intensity may negatively affect realizations for its
content.
Content library management is always a challenge; any
irrelevant content acquisition can lead to cash burns.

36 | P a g e
Premia Research
TV Today Network Ltd
CMP: ` 412; 1-year target: ` 517
Sector M&E
Recommendation BUY
Upside 25%
Stock Data
Sensex 35,264
52 Week h/l (`) 558/211
Market cap (` Cr) 2,462
BSE code 532515
NSE code TVTODAY
FV (`) 5
Div yield (%) 0.43
Shareholding Pattern
Sep-17 Dec-17 Mar-18
Promoters 57.42 57.42 57.42
DII+FII 20.78 21.96 22.81
Individuals
21.18 20.62 19.76
Source: ACE Equity
Share Price Trend
Prices as on 29/06/2018
TV Today Networks Ltd (TTNL) is one of the leading media companies
with flagship channel Aaj Tak in Hindi new genre. TTNL is set to
benefit from strong TV broadcasting revenue growth owing to
digitization and acquisition of digital segment from parent. Hence,
we expect revenue CAGR of ~10% over FY18-20E. Further, the sale of
loss making radio business will drive PAT CAGR of ~17% over the
same period. Currently, it is debt free with RoE and RoCE of 21.7%
and 26.9% (FY18) respectively. We recommend BUY with target price
of `517. (16x FY20E EPS).
Acquisition of digital business from parent: In Q3FY18, it had
acquired digital business from its parent at a reasonable valuation of
0.33x price/sales. Rising time spend on the internet is driving
advertisement shift towards digital. Hence, we expect the company to
post digital revenue CAGR of ~22% over FY18-20E.
Margin expansion owing to sale of radio business: Company has
recently announced its exit from radio business. Its radio segment
reported losses of ~14cr in FY18. It is selling all 3 radio stations to
Entertainment Network for which it is awaiting Ministry of Information
and Broadcasting’s approval. With this sale, we expect expansion of
company’s EBITDA margin by ~130bps to 30.1% over FY18-20E.
Outlook & Valuation: We have a positive outlook on TTNL given
expected breakeven in its print segment by FY20E and cash rich
balance sheet providing opportunities of expansion/acquisition.
Further, going forward, the election years will aid company to clock
broadcasting revenue CAGR of ~11% over FY18-20E. The stock is
currently trading at a valuation of 13.4x FY20E EPS (trading at a
discount to Zee Media, ~21x FY20E EPS).
Financial Summary
Consolidated `Cr FY16 FY17 FY18 FY19E FY20E
Revenue 582 652 721 786 871
YoY Growth (%) 22.0 12.1 10.5 9.1 10.8
EBITDA Margin (%) 27.8 24.9 28.8 29.1 30.1
PAT 92 92 133 154 183
PAT Growth (%) 13.6 -0.2 44.5 15.6 19.0
RoE 20.0 17.4 21.4 21.4 21.7
P/E x 26.7 26.8 18.5 16.0 13.4
EV/EBITDA x 14.3 13.6 10.9 9.4 7.8 Source: Company, IIFL Research
30000
35000
200
400
Jun-17 Oct-17 Feb-18 Jun-18
TV Today Network Ltd. Sensex

37 | P a g e
Premia Research
TV Today Network Ltd
Company Overview
TV Today Network (TTNL), is one of the leading Indian news television networks. Company’s segments include TV broadcasting, radio broadcasting, newspaper publishing and digital. Its flagship channel Aajtak is leader in Hindi news genre, while other channels include India Today, Tez and Dilli Aaj Tak. The company also operates three radio stations under brand ISHQ 104.8 FM in Delhi, Mumbai and Kolkata.
Its newspaper publication business publishes Mail Today newspaper in Delhi covering stories like politics, entertainment, automobiles, fashion, etc. Its digital business includes e-newspaper, websites and mobile applications.
Exhibit 1: TV Today Network (Revenue segments, FY18)
Aaj Tak amongst leaders on YouTube: Aaj Tak is clearly a leader in terms of subscribers on YouTube amongst its peer channels. As on June 29, 2018, Aaj Tak has 7.4mn subscribers while India TV and ABP News have 5.2mn and 4.9mn subscribers respectively. In terms of total views, it has 2.3bn views, which is just behind India TV’s views (2.5bn views).
Exhibit 2: YouTube stats (TV channels)
Channels Subscribers (mn) Views* (bn)
India TV 5.2 2.5
Aaj Tak 7.4 2.3
ABP News 4.9 1.9
News 18 India 1.5 0.3 Source: socialbakers.com, YouTube, IIFL Research *Total uploaded video views

38 | P a g e
Premia Research
TV Today Network Ltd
TV Broadcasting revenues to benefit from digitization
Digitization has led to reduction in the revenue leakages for broadcasters. This will be very positive for the company, as Aaj Tak is leader in both rural and urban areas. Hence, we expect TV broadcasting revenues to grow at CAGR of ~11% over FY18-20E.
Exhibit 3: TV Broadcasting revenues (`Cr)
Source: Company, IIFL Research
We expect company to attain breakeven in its Print business by FY20E. Further, with the sale of radio business, EBITDA margins are expected to expand by ~130bps over FY18-20E. This will aid the company to improve its return ratios.
Exhibit 4: Strong EBITDA margin and return ratios
Source: Company, IIFL Research
0
2
4
6
8
10
12
14
16
18
0
100
200
300
400
500
600
700
800
FY16 FY17 FY18 FY19E FY20E
TV Broadcasting revenues Growth (%) yoy
10
15
20
25
30
35
10
12
14
16
18
20
22
24
26
28
30
FY16 FY17 FY18 FY19E FY20E
ROE (%) LHS ROCE (%) LHS EBITDA margin (%) RHS
As per EY-FICCI, overall industry broadcasters’ revenue is expected to grow at a CAGR of 10.4% over CY17-20E

39 | P a g e
Premia Research
TV Today Network Ltd
Strong balance sheet with cash surplus: Company has a debt free balance sheet with disciplined working capital cycle. This will lead to continuous increase in the cash surplus for the company. We expect company to have cash surplus of ~`410cr by FY20E from ̀ 200cr in FY18 given its disciplined working capital cycle. This gives the company ability to acquire/expand for continues market share gains and growth.
Exhibit 5: Cash rich balance sheet (`Cr)
Source: Company, IIFL Research
Rationale for PE multiple: Company is currently trading at a valuation of 13.4x FY20E EPS, which is at cheaper valuation than its peer Zee Media (~21x FY20E EPS) despite better return ratios. Further, considering its debt free position of the company, strong foothold in Hindi news genre, acquisition of digital business and upcoming elections we assign it a multiple of 16x FY20E EPS.
Exhibit 6: 1 Year forward PE band (x)
Source: Ace Equity, IIFL Research
0
100
200
300
400
500
600
700
800
900
1000
FY16 FY17 FY18 FY19E FY20E
Equity Cash and Cash Equivalents Total Debt
0
5
10
15
20
25
Jun
-14
Sep
-14
Dec
-14
Mar
-15
Jun
-15
Sep
-15
Dec
-15
Mar
-16
Jun
-16
Sep
-16
Dec
-16
Mar
-17
Jun
-17
Sep
-17
Dec
-17
Mar
-18
Jun
-18

40 | P a g e
Premia Research
TV Today Network Ltd
Exhibit 7: Peer comparison
Company P/E EV/EBITDA ROE
FY19E FY20E FY19E FY20E FY19E FY20E
Zee Media 27.3 21 11.6 9.9 6.8 7.8
TV Today 16.0 13.4 9.4 7.8 21.4 21.7 Source: Bloomberg, IIFL Research
Exhibit 8: Balance Sheet summary and key ratios
Consolidated ~ ` Cr FY16 FY17 FY18 FY19E FY20E
Cash & Cash equivalent 170 263 199 298 420
Inventories 1 2 2 2 4
Receivable 151 179 185 200 219
Other Current Assets 57 63 71 77 85
Creditors 70 91 87 95 105
Other Current Liabilities 47 49 73 80 88
Net Current Assets 263 366 297 402 535
Fixed Assets 219 204 255 259 264
Investments 7 6 5 6 6
Other Long-term assets 41 50 117 120 122
Total net assets 531 627 674 786 926
Borrowings 49 35 - - -
Other long-term liabilities
9 11 13 13 14
Shareholders' equity 472 581 662 773 912
Total liabilities 531 627 674 786 926
Key Ratios
Valuation ratios
EV/sales 4.0 3.4 3.1 2.7 2.3
EV/EBITDA 14.3 13.6 10.9 9.4 7.8
P/E 26.7 26.8 18.5 16.0 13.4
P/B 5.2 4.2 3.7 3.2 2.7
Working capital days
Inventory days 1 1 1 1 2
Debtor days 95 100 94 93 92
Creditors days 44 51 44 44 44
Source: Company, IIFL Research
Key Risks:
Too much dependency on Aaj Tak. Launch of new Hindi news channels, increasing competitive
intensity, aggressive pricing strategy by competitors.
Poaching of Anchors by other news channels

41 | P a g e
Premia Research
Disclaimer
Recommendation Parameters for Fundamental/Technical Reports: Buy – Absolute return of over +10% Accumulate – Absolute return between 0% to +10% Reduce – Absolute return between 0% to -10% Sell – Absolute return below -10% Please refer to http://www.indiainfoline.com/research/disclaimer for recommendation parameter, analyst disclaimer and other disclosures. IIFL Securities Limited (Formerly ‘India Infoline Limited’), CIN No.: U99999MH1996PLC132983, Corporate Office – IIFL Centre, Kamala City, Senapati Bapat Marg, Lower Parel, Mumbai – 400013 Tel: (91-22) 4249 9000. Fax: (91-22) 40609049, Regd. Office – IIFL House, Sun Infotech Park, Road No. 16V, Plot No. B-23, MIDC, Thane Industrial Area, Wagle Estate, Thane – 400604 Tel: (91-22) 25806650. Fax: (91-22) 25806654 E-mail: [email protected] Website: www.indiainfoline.com, Refer www.indiainfoline.com for detail of Associates. Stock Broker SEBI Regn.: INZ000164132, PMS SEBI Regn. No. INP000002213, IA SEBI Regn. No. INA000000623, SEBI RA Regn.:- INH000000248 For Research related queries, write at [email protected] For Sales and Account related information, write to customer care: [email protected] or call on 91-22 4007 1000