iifl holdings limited iifl in
TRANSCRIPT
1
www.iifl.com
May 03, 2018
IIFL Holdings Limited
For the quarter and year ended March 2018
Bloomberg: IIFL IN
2
Index
I: IIFL Group Performance Overview
(i) IIFL Finance
(ii) IIFL Wealth
(iii) IIFL Securities
3
9
15
20
23 II: Ownership, Management and Governance
24
3
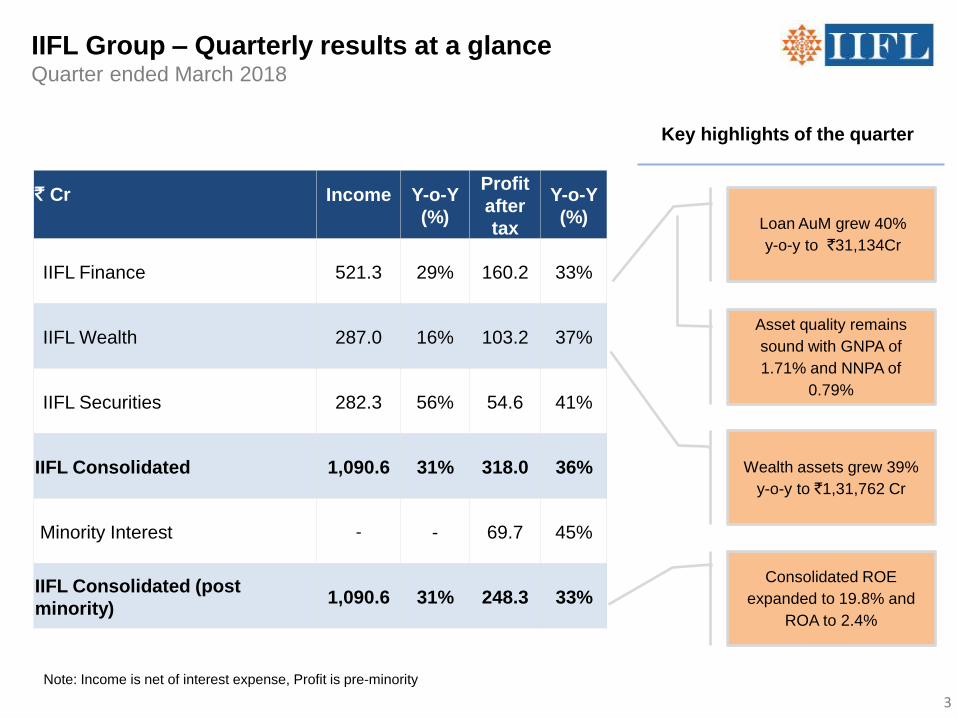
IIFL Group – Quarterly results at a glance Quarter ended March 2018
` Cr
Income
Y-o-Y (%)
Profit after tax
Y-o-Y (%)
IIFL Finance 521.3 29% 160.2 33%
IIFL Wealth 287.0 16% 103.2 37%
IIFL Securities 282.3 56% 54.6 41%
IIFL Consolidated 1,090.6 31% 318.0 36%
Minority Interest - - 69.7 45%
IIFL Consolidated (post minority)
1,090.6 31% 248.3 33%
Key highlights of the quarter
Asset quality remains sound with GNPA of 1.71% and NNPA of
0.79%
Wealth assets grew 39% y-o-y to `1,31,762 Cr
Consolidated ROE expanded to 19.8% and
ROA to 2.4%
Note: Income is net of interest expense, Profit is pre-minority
Loan AuM grew 40% y-o-y to `31,134Cr

4
IIFL Group – Yearly results at a glance Year ended March 2018
` Cr
Income
Y-o-Y (%)
Profit after tax
Y-o-Y (%)
IIFL Finance 1,893.3 37% 554.3 31%
IIFL Wealth 1,074.9 36% 385.3 54%
IIFL Securities 895.5 39% 222.5 50%
IIFL Consolidated 3,863.7 37% 1,162.1 41%
Minority Interest - - 250.8 84%
IIFL Consolidated (post minority)
3,863.7 37% 911.3 33%
Key highlights of the year
NIM expanded 54bps y-o-y to 7.08% in FY18
Pan India network of 1,378 branches in 25 states, up 24% y-o-y
Presence in 23 locations globally, including 8
overseas
Shareholders’ funds
reached `5,066 Cr
Note: Income is net of interest expense, Profit is pre-minority

5
` Cr Q4FY18 Q4FY17 Y-o-Y Q3FY18 Q-o-Q FY18 FY17 Y-o-Y
Revenue from Operations 1,732.4 1,335.2 30% 1,627.3 6% 6,254.9 4,759.9 31%
Other income 31.2 59.1 (47%) 59.5 (48%) 204.2 147.6 38%
Total Income 1,763.6 1,394.3 26% 1,686.8 5% 6,459.1 4,907.5 32%
Operating cost 77.1 65.9 17% 67.9 14% 271.7 188.5 44%
Employee cost 309.9 227.1 36% 277.4 12% 1,060.8 784.0 35%
Administration and other expenses 235.9 162.8 45% 195.7 21% 796.5 564.8 41%
Total expenses 622.9 455.8 37% 541.0 15% 2,128.9 1,537.3 38%
EBITDA 1,140.7 938.5 22% 1,145.8 (0%) 4,330.2 3,370.2 28%
Interest costs 673.0 561.1 20% 699.2 (4%) 2,595.4 2,092.2 24%
Depreciation and amortization 19.1 14.4 33% 16.9 13% 67.1 54.0 24%
Profit before tax 448.6 363.0 24% 429.7 4% 1,667.7 1,224.0 36%
Provision for taxation 130.6 128.5 2% 128.5 2% 505.6 401.8 26%
Profit after tax before minority 318.0 234.5 36% 301.2 6% 1,162.1 822.2 41%
Minority Interest 69.7 48.1 45% 65.5 6% 250.8 136.1 84%
Profit after tax after minority 248.3 186.4 33% 235.7 5% 911.3 686.1 33%
IIFL Group – Consolidated results Quarter ended March 2018
Note: Previous periods figures have been regrouped / rearranged wherever necessary
6
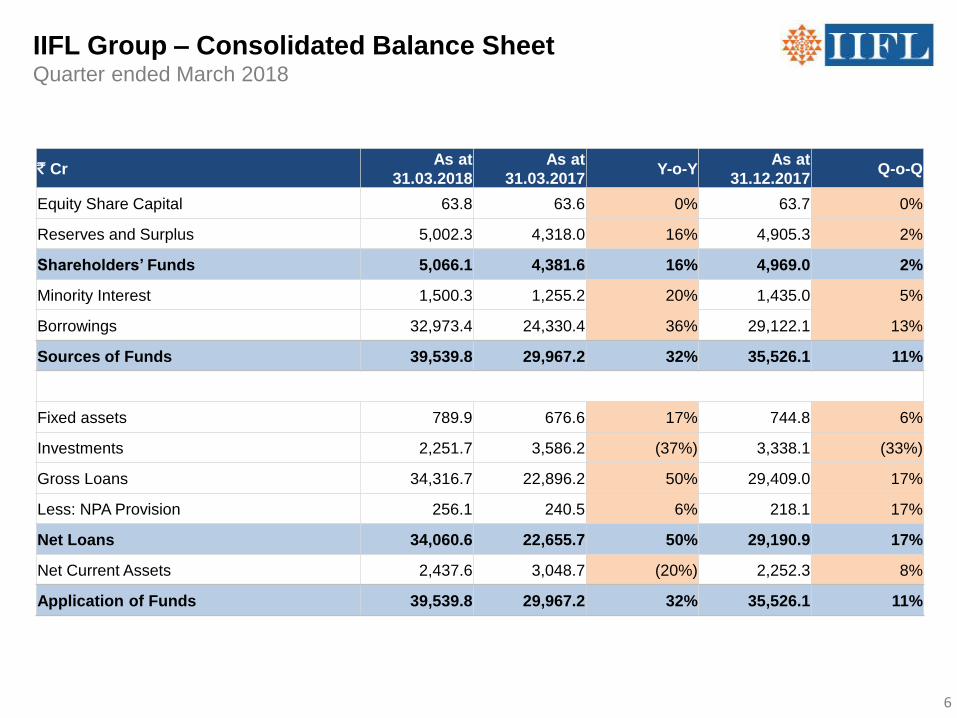
IIFL Group – Consolidated Balance Sheet Quarter ended March 2018
` Cr As at
31.03.2018 As at
31.03.2017 Y-o-Y
As at 31.12.2017
Q-o-Q
Equity Share Capital 63.8 63.6 0% 63.7 0%
Reserves and Surplus 5,002.3 4,318.0 16% 4,905.3 2%
Shareholders’ Funds 5,066.1 4,381.6 16% 4,969.0 2%
Minority Interest 1,500.3 1,255.2 20% 1,435.0 5%
Borrowings 32,973.4 24,330.4 36% 29,122.1 13%
Sources of Funds 39,539.8 29,967.2 32% 35,526.1 11%
Fixed assets 789.9 676.6 17% 744.8 6%
Investments 2,251.7 3,586.2 (37%) 3,338.1 (33%)
Gross Loans 34,316.7 22,896.2 50% 29,409.0 17%
Less: NPA Provision 256.1 240.5 6% 218.1 17%
Net Loans 34,060.6 22,655.7 50% 29,190.9 17%
Net Current Assets 2,437.6 3,048.7 (20%) 2,252.3 8%
Application of Funds 39,539.8 29,967.2 32% 35,526.1 11%
7
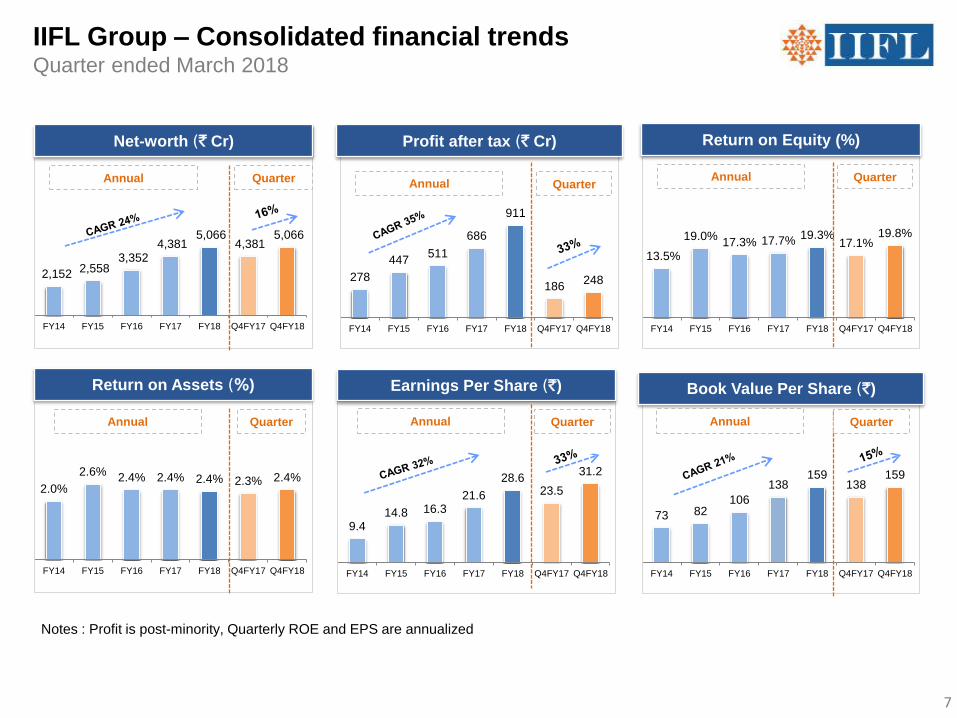
278 447 511
686
911
186 248
FY14 FY15 FY16 FY17 FY18 Q4FY17 Q4FY18
9.4 14.8 16.3
21.6
28.6 23.5
31.2
FY14 FY15 FY16 FY17 FY18 Q4FY17 Q4FY18
73 82 106
138 159
138 159
FY14 FY15 FY16 FY17 FY18 Q4FY17 Q4FY18
13.5%
19.0% 17.3% 17.7% 19.3% 17.1%
19.8%
FY14 FY15 FY16 FY17 FY18 Q4FY17 Q4FY18
2.0% 2.6% 2.4% 2.4% 2.4% 2.3% 2.4%
FY14 FY15 FY16 FY17 FY18 Q4FY17 Q4FY18
2,152 2,558 3,352
4,381 5,066
4,381 5,066
FY14 FY15 FY16 FY17 FY18 Q4FY17 Q4FY18
IIFL Group – Consolidated financial trends Quarter ended March 2018
Notes : Profit is post-minority, Quarterly ROE and EPS are annualized
Return on Assets (%)
Annual
Annual
Profit after tax (` Cr)
Net-worth (` Cr)
Annual Quarter Annual
Return on Equity (%)
Annual
Book Value Per Share (`)
Earnings Per Share (`)
Annual Quarter Quarter Quarter
Quarter Quarter

8
I: IIFL Group Performance Overview
(i) IIFL Finance
(ii) IIFL Wealth
(iii) IIFL Securities
II: Ownership, Management and Governance

9
` Cr Q4FY18 Q4FY17 Y-o-Y Q3FY18 Q-o-Q FY18 FY17 Y-oY
Loan book 27,615.5 19,279.8 43% 23,561.8 17% 27,615.5 19,279.8 43%
Securitised assets 3,518.1 3,001.2 17% 3,726.3 (6%) 3,518.1 3,001.2 17%
Assets under management 31,133.6 22,281.0 40% 27,288.1 14% 31,133.6 22,281.0 40%
Interest income 963.4 805.6 20% 918.6 5% 3,595.2 3,030.4 19%
Interest expense 515.9 447.6 15% 508.7 1% 1,963.7 1,789.4 10%
Net Interest income 447.5 358.0 25% 409.9 9% 1,631.5 1,241.0 31%
Other income 73.8 46.2 60% 88.7 (17%) 261.8 137.6 90%
Total income 521.3 404.2 29% 498.6 5% 1,893.3 1,378.6 37%
Operating expense 225.4 157.2 43% 189.8 19% 741.1 553.5 34%
Loan losses & provision 56.3 61.8 (9%) 89.8 (37%) 313.0 175.9 78%
Profit before tax 239.6 185.2 29% 219.0 9% 839.2 649.2 29%
Provision for tax 79.4 64.7 23% 73.4 8% 284.9 226.0 26%
Profit after tax 160.2 120.5 33% 145.6 10% 554.3 423.2 31%
IIFL Finance – Consolidated results Quarter ended March 2018 (NBFC, HFC and MFI)

10
IIFL Finance – Consolidated Balance Sheet Quarter ended March 2018 (NBFC, HFC and MFI)
` Cr As at
31.03.2018 As at
31.03.2017 Y-o-Y
As at 31.12.2017
Q-o-Q
Equity Share Capital 280.7 280.5 0% 280.7 0%
Preference Share Capital - 75 - - -
Reserves and Surplus 3,647.9 3,189.40 14% 3,580.2 2%
Shareholders’ funds 3,928.6 3,544.9 11% 3,860.9 2%
Minority Interest 3.7 3.7 0% 3.6 3%
Borrowings 24,905.9 18,104.10 38% 21,661.2 15%
Sources of Funds 28,838.2 21,652.7 33% 25,525.7 13%
Fixed assets 91.9 73.7 25% 79.4 16%
Investments 1,089.8 1,487.0 (27%) 1,531.1 (29%)
Gross Loans 27,615.5 19,279.8 43% 23,561.8 17%
Less: NPA Provision 256.1 240.5 6% 218.1 17%
Net Loans 27,359.4 19,039.3 44% 23,343.7 17%
Net Current Assets 297.1 1,052.7 (72%) 571.5 (48%)
Application of Funds 28,838.2 21,652.7 33% 25,525.7 13%
11
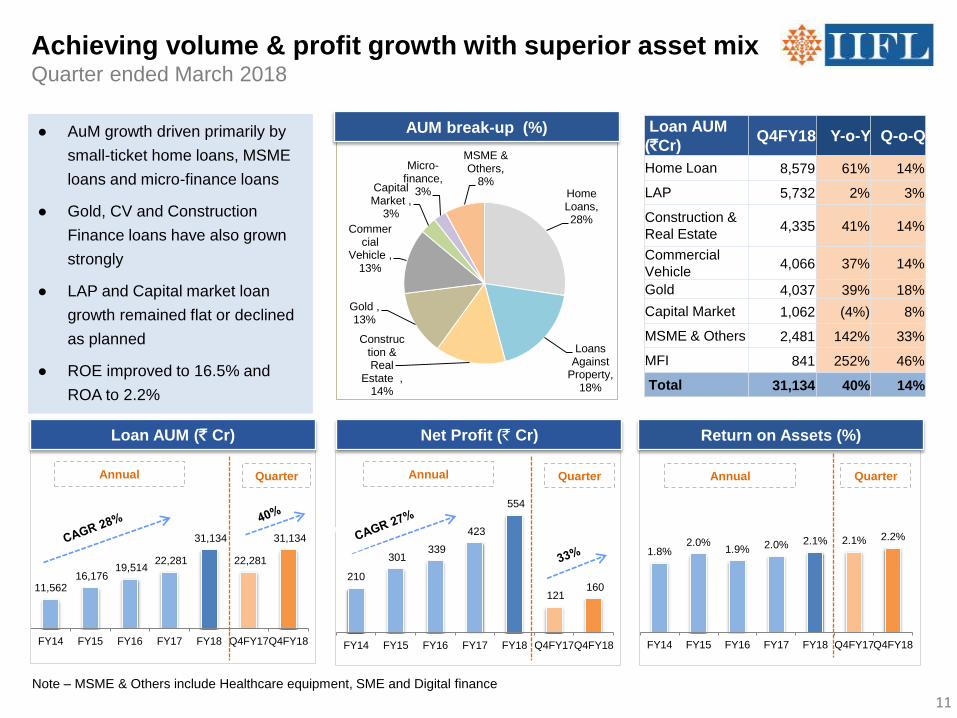
11,562 16,176
19,514 22,281
31,134
22,281
31,134
FY14 FY15 FY16 FY17 FY18 Q4FY17Q4FY18
1.8% 2.0%
1.9% 2.0% 2.1% 2.1% 2.2%
FY14 FY15 FY16 FY17 FY18 Q4FY17Q4FY18
210
301 339
423
554
121 160
FY14 FY15 FY16 FY17 FY18 Q4FY17Q4FY18
Achieving volume & profit growth with superior asset mix Quarter ended March 2018
Note – MSME & Others include Healthcare equipment, SME and Digital finance
Net Profit (` Cr)
Annual
Return on Assets (%)
Annual
Loan AUM (` Cr)
● AuM growth driven primarily by
small-ticket home loans, MSME
loans and micro-finance loans
● Gold, CV and Construction
Finance loans have also grown
strongly
● LAP and Capital market loan
growth remained flat or declined
as planned
● ROE improved to 16.5% and
ROA to 2.2%
Home Loans, 28%
Loans Against
Property, 18%
Construction & Real
Estate , 14%
Gold , 13%
Commercial
Vehicle , 13%
Capital Market ,
3%
Micro-finance,
3%
MSME & Others,
8%
Annual Quarter Quarter Quarter
AUM break-up (%) Loan AUM (`Cr)
Q4FY18 Y-o-Y Q-o-Q
Home Loan 8,579 61% 14%
LAP 5,732 2% 3%
Construction & Real Estate 4,335 41% 14%
Commercial Vehicle 4,066 37% 14%
Gold 4,037 39% 18%
Capital Market 1,062 (4%) 8%
MSME & Others 2,481 142% 33%
MFI 841 252% 46%
Total 31,134 40% 14%
12
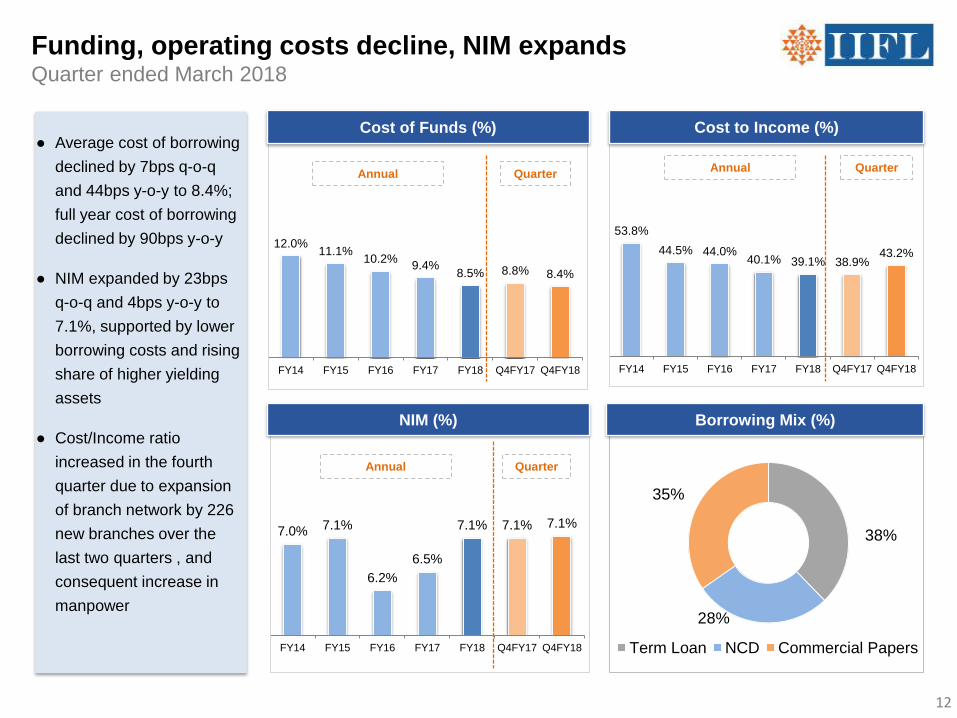
38%
28%
35%
Term Loan NCD Commercial Papers
7.0% 7.1%
6.2% 6.5%
7.1% 7.1% 7.1%
FY14 FY15 FY16 FY17 FY18 Q4FY17 Q4FY18
53.8%
44.5% 44.0% 40.1% 39.1% 38.9%
43.2%
FY14 FY15 FY16 FY17 FY18 Q4FY17 Q4FY18
● Average cost of borrowing
declined by 7bps q-o-q
and 44bps y-o-y to 8.4%;
full year cost of borrowing
declined by 90bps y-o-y
● NIM expanded by 23bps
q-o-q and 4bps y-o-y to
7.1%, supported by lower
borrowing costs and rising
share of higher yielding
assets
● Cost/Income ratio
increased in the fourth
quarter due to expansion
of branch network by 226
new branches over the
last two quarters , and
consequent increase in
manpower
Funding, operating costs decline, NIM expands Quarter ended March 2018
Annual Quarter
12.0% 11.1%
10.2% 9.4% 8.5% 8.8% 8.4%
FY14 FY15 FY16 FY17 FY18 Q4FY17 Q4FY18
Annual Quarter
Annual Quarter
Cost of Funds (%) Cost to Income (%)
NIM (%) Borrowing Mix (%)
13
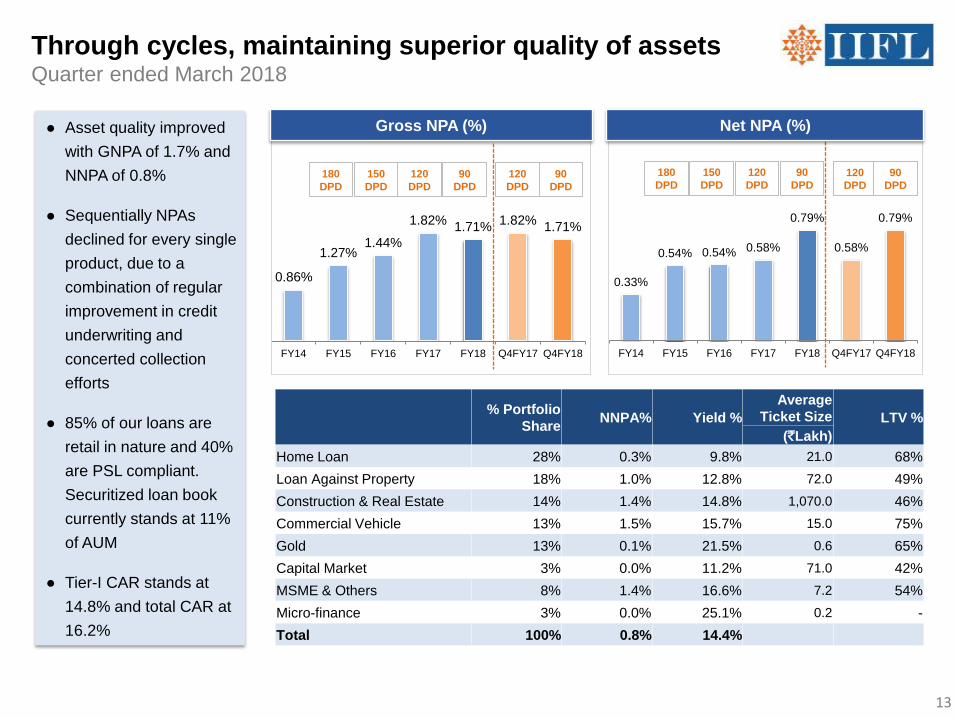
0.86%
1.27% 1.44%
1.82% 1.71% 1.82% 1.71%
FY14 FY15 FY16 FY17 FY18 Q4FY17 Q4FY18
0.33%
0.54% 0.54% 0.58%
0.79%
0.58%
0.79%
FY14 FY15 FY16 FY17 FY18 Q4FY17 Q4FY18
Through cycles, maintaining superior quality of assets Quarter ended March 2018
Gross NPA (%) ● Asset quality improved
with GNPA of 1.7% and
NNPA of 0.8%
● Sequentially NPAs
declined for every single
product, due to a
combination of regular
improvement in credit
underwriting and
concerted collection
efforts
● 85% of our loans are
retail in nature and 40%
are PSL compliant.
Securitized loan book
currently stands at 11%
of AUM
● Tier-I CAR stands at
14.8% and total CAR at
16.2%
150 DPD
180 DPD
120 DPD
120 DPD
90 DPD
Net NPA (%)
% Portfolio
Share NNPA% Yield %
Average Ticket Size LTV %
(`Lakh) Home Loan 28% 0.3% 9.8% 21.0 68%
Loan Against Property 18% 1.0% 12.8% 72.0 49%
Construction & Real Estate 14% 1.4% 14.8% 1,070.0 46%
Commercial Vehicle 13% 1.5% 15.7% 15.0 75%
Gold 13% 0.1% 21.5% 0.6 65%
Capital Market 3% 0.0% 11.2% 71.0 42%
MSME & Others 8% 1.4% 16.6% 7.2 54%
Micro-finance 3% 0.0% 25.1% 0.2 -
Total 100% 0.8% 14.4%
150 DPD
180 DPD
120 DPD
120 DPD
90 DPD
90 DPD
90 DPD
14
I: IIFL Group Business Overview
(i) IIFL Finance
(ii) IIFL Wealth
(iii) IIFL Securities
II: Ownership, Management and Governance

15
` Cr Q4FY18 Q4FY17 Y-o-Y Q3FY18 Q-o-Q FY18 FY17 Y-o-Y
Assets under advice, management and distribution 1,31,762 94,919 39% 1,28,175 3% 1,31,762 94,919 39%
Fee based income 233.0 185.4 26% 218.7 7% 881.1 583.0 51%
Direct Cost 22.7 14.6 55% 16.2 40% 79.7 41.9 90%
Net Commission / Fee Income 210.3 170.8 23% 202.5 4% 801.4 541.1 48%
Fund based income 219.7 181.7 21% 252.6 (13%) 832.0 499.1 67%
Interest expense 143.1 105.0 36% 172.4 (17%) 558.5 248.6 125%
Net fund based income 76.6 76.7 (0%) 80.2 (4%) 273.5 250.5 9%
Total income 286.9 247.5 16% 282.7 1% 1,074.9 791.6 36%
Employee cost 109.4 75.9 44% 105.6 4% 392.6 264.8 48%
Other operating expense 48.6 46.0 6% 44.2 10% 171.4 133.7 28%
Provision charges 3.8 13.7 (72%) 4.1 (7%) 14.9 30.1 (50%)
Total expenses 161.8 135.6 19% 153.9 5% 578.9 428.6 35%
Profit before tax 125.1 111.9 12% 128.8 (3%) 496.0 363.0 37%
Tax expense 21.9 36.6 (40%) 28.7 (24%) 110.7 112.5 (2%)
Profit after tax 103.2 75.3 37% 100.1 3% 385.3 250.5 54%
IIFL Wealth – Consolidated results Quarter ended March 2018
16
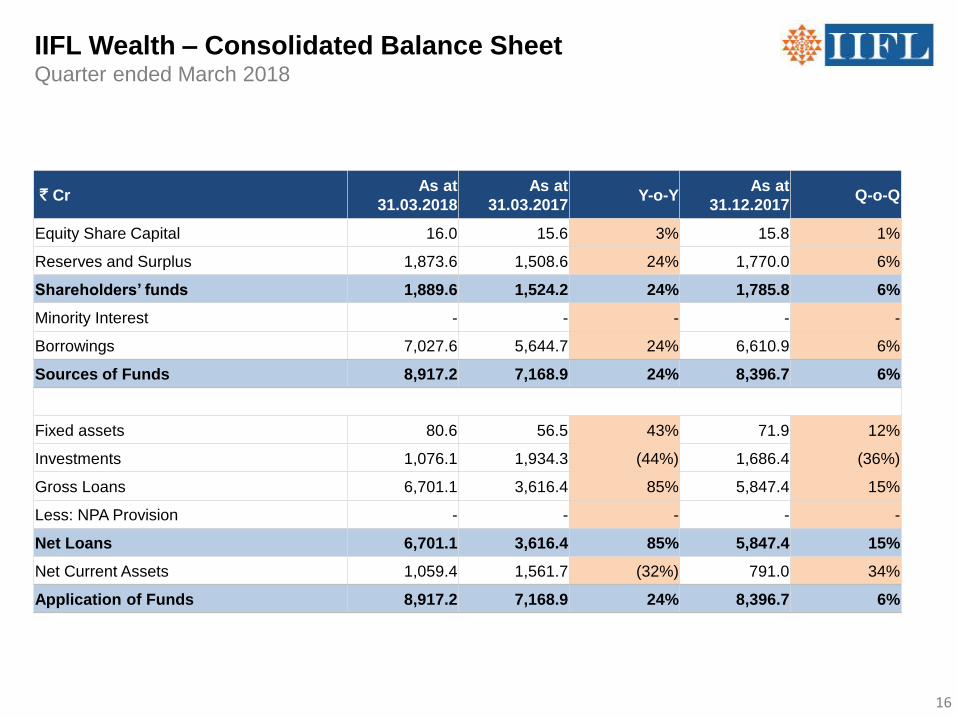
IIFL Wealth – Consolidated Balance Sheet Quarter ended March 2018
` Cr As at
31.03.2018 As at
31.03.2017 Y-o-Y
As at 31.12.2017
Q-o-Q
Equity Share Capital 16.0 15.6 3% 15.8 1%
Reserves and Surplus 1,873.6 1,508.6 24% 1,770.0 6%
Shareholders’ funds 1,889.6 1,524.2 24% 1,785.8 6%
Minority Interest - - - - -
Borrowings 7,027.6 5,644.7 24% 6,610.9 6%
Sources of Funds 8,917.2 7,168.9 24% 8,396.7 6%
Fixed assets 80.6 56.5 43% 71.9 12%
Investments 1,076.1 1,934.3 (44%) 1,686.4 (36%)
Gross Loans 6,701.1 3,616.4 85% 5,847.4 15%
Less: NPA Provision - - - - -
Net Loans 6,701.1 3,616.4 85% 5,847.4 15%
Net Current Assets 1,059.4 1,561.7 (32%) 791.0 34%
Application of Funds 8,917.2 7,168.9 24% 8,396.7 6%
17
51
112
169
251
385
75 103
FY14 FY15 FY16 FY17 FY18 Q4FY17 Q4FY18
7,293 10,405
8,459
22,535 25,053
FY14 FY15 FY16 FY17 FY18
35,631 56,672 62,164
94,919
1,31,762
94,919
1,31,762
FY14 FY15 FY16 FY17 FY18 Q4FY17 Q4FY18
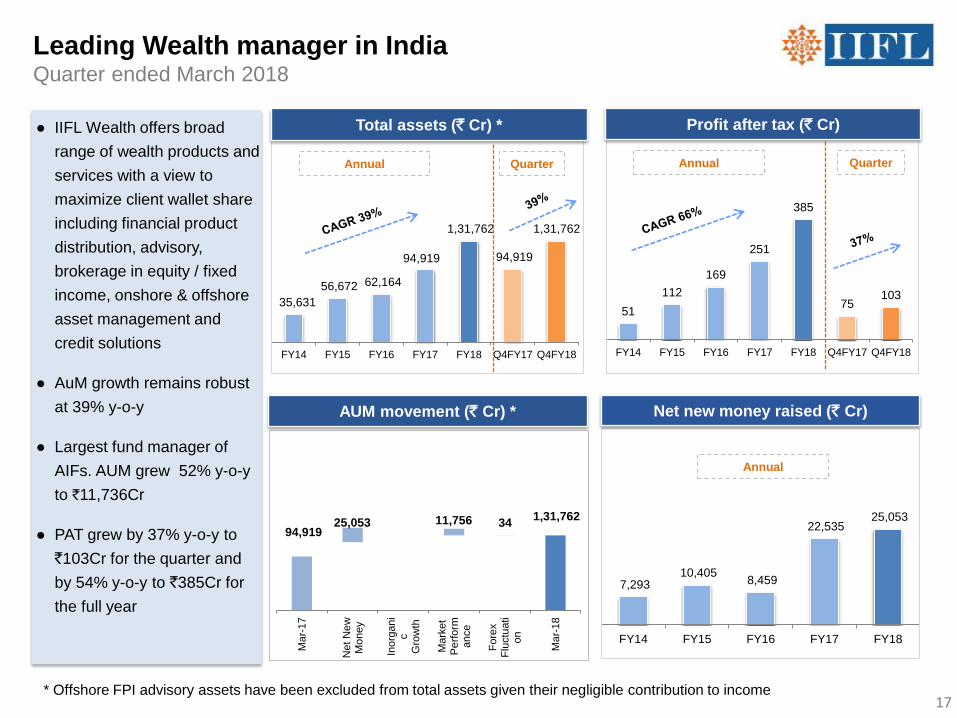
Leading Wealth manager in India Quarter ended March 2018
● IIFL Wealth offers broad
range of wealth products and
services with a view to
maximize client wallet share
including financial product
distribution, advisory,
brokerage in equity / fixed
income, onshore & offshore
asset management and
credit solutions
● AuM growth remains robust
at 39% y-o-y
● Largest fund manager of
AIFs. AUM grew 52% y-o-y
to `11,736Cr
● PAT grew by 37% y-o-y to
`103Cr for the quarter and
by 54% y-o-y to `385Cr for
the full year
Total assets (` Cr) *
Annual Quarter
Profit after tax (` Cr)
Annual
Net new money raised (` Cr)
Quarter
Annual
AUM movement (` Cr) *
94,919 1,31,762 25,053 11,756 34
Mar
-17
Net
New
Mon
ey
Inor
gani
cG
row
th
Mar
ket
Per
form
ance
For
exF
luct
uati
on
Mar
-18
* Offshore FPI advisory assets have been excluded from total assets given their negligible contribution to income

18
72% 67% 70% 68% 65%
4% 5% 9% 10% 10% 2%
3% 11% 17% 24% 26% 18% 11% 8%
FY14 FY15 FY16 FY17 FY 18
Distribution AMC/Discretionary
Advisory Discretionary (Offshore)
78 69 71 77 65
8 32 24 35
23
FY16 FY17 FY18 Q4FY17 Q4FY18
Net commission/fee income Fund Based activities
101 95 88
Annual
92 86
Broadening advisory and asset management services Quarter ended March 2018
● Wealth NBFC, which
mainly offers loans
against securities, grew
its loan book 15% q-o-q
and 85% y-o-y to
`6,701Cr
● Presence in 23 Offices
across 9 geographies
● Hired 13 bankers during
Q4FY18 taking the total
number to 330, to
further drive the growth
momentum
● For the quarter ended
March 31, 2018, the
retention yield stands at
88 bps
3,615 4,305
4,852 5,847
6,701
Q4FY17 Q1FY18 Q2FY18 Q3FY18 Q4FY18
Retention yield ex-FPI assets (bps)
Wealth NBFC assets (` Cr)
Quarter
Quarter
123 139
195 226
330
FY14 FY15 FY16 FY17 FY18
No. of bankers
Annual
Annual
Break-up of Wealth assets (%) *
* Offshore FPI advisory assets have been excluded from total assets given their negligible contribution to income
19
I: IIFL Group Performance Overview
(i) IIFL Finance
(ii) IIFL Wealth
(iii) IIFL Securities
II: Ownership, Management and Governance

20
4.3% 3.8% 4.0% 3.9% 4.0%
Q4FY17 Q1FY18 Q2FY18 Q3FY18 Q4FY18
Quarter
2.2% 1.9% 2.0% 2.1% 2.0%
Q4FY17 Q1FY18 Q2FY18 Q3FY18 Q4FY18
10,324 11,063 13,269
14,924 17,455
Q4FY17 Q1FY18 Q2FY18 Q3FY18 Q4FY18
1,126 1,112 1,220 1,411
1,563
Q4FY17 Q1FY18 Q2FY18 Q3FY18 Q4FY18
IIFL Securities – Turnover and market share Quarter ended March 2018
Quarter
Quarter
● IIFL is a key player in both
retail and institutional
segments with a 4% share
of daily cash turnover
● Average daily cash turnover
was up 39% y-o-y to `1,563
Cr. versus 30% y-o-y growth
in exchange cash turnover
● Average daily F&O turnover
was up 73% y-o-y to
`15,891 Cr. versus 85%
y-o-y growth in exchange
F&O turnover
● Total average daily turnover
(including F&O) was up
69% y-o-y to `17,455 Cr.
versus 76% y-o-y growth in
exchange turnover
Note - Exchange turnover includes both NSE and BSE turnover for equity segment
Average daily turnover – Cash (` Cr) Average daily turnover - Total (` Cr)
NSE Market Share – Total (%)
NSE Market Share - Cash (%)
Quarter
21
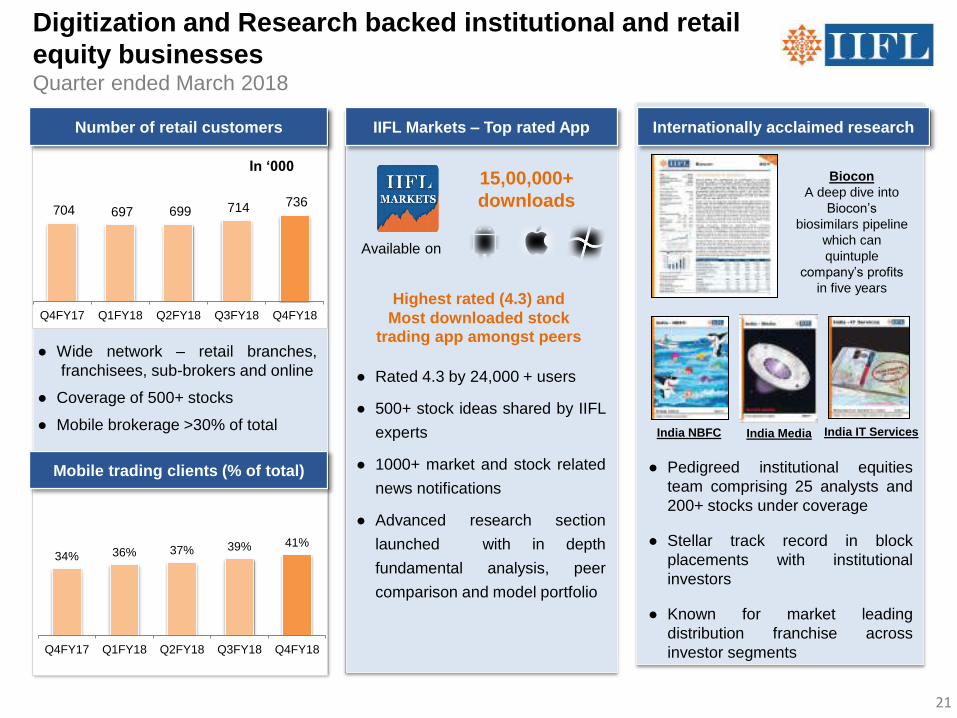
● Wide network – retail branches, franchisees, sub-brokers and online
● Coverage of 500+ stocks
● Mobile brokerage >30% of total
● Pedigreed institutional equities team comprising 25 analysts and 200+ stocks under coverage
● Stellar track record in block placements with institutional investors
● Known for market leading distribution franchise across investor segments
Digitization and Research backed institutional and retail equity businesses Quarter ended March 2018
34% 36% 37% 39% 41%
Q4FY17 Q1FY18 Q2FY18 Q3FY18 Q4FY18
Mobile trading clients (% of total)
IIFL Markets – Top rated App
15,00,000+ downloads
Available on
● Rated 4.3 by 24,000 + users
● 500+ stock ideas shared by IIFL
experts
● 1000+ market and stock related
news notifications
● Advanced research section
launched with in depth
fundamental analysis, peer
comparison and model portfolio
Highest rated (4.3) and Most downloaded stock
trading app amongst peers
Internationally acclaimed research
704 697 699 714 736
Q4FY17 Q1FY18 Q2FY18 Q3FY18 Q4FY18
In ‘000
Number of retail customers
Biocon A deep dive into
Biocon’s biosimilars pipeline
which can quintuple
company’s profits
in five years
India NBFC India Media India IT Services

22
Future Supply Chain Solutions
IPO
`650 Cr (December 2017)
Investment Banking has made significant strides Quarter ended March 2018
Marquee Issues
IIFL Ranks #1 in raising Equity for private sector clients in FY18*
FY18 has been the best year for IIFL’s Investment Banking business since inception 27 transactions were completed during the year including 11 IPOs and 8 follow-on transactions involving listed
companies The advisory business was ramped up and a number of private equity and pre-IPO transactions were closed There continues to be a substantial pipeline of transactions at various stages of execution
*Source – Prime Database. Issue type : – Equity IPOs, Equity FPOs, InvIT IPOs and Equity QIPs. Rankings are from April 1, 2017 to March 31, 2018 on full credit basis based on amount raised
`505 Cr (December 2017)
Shalby Hospitals
IPO IPO
ICICI Securities
`35,149 Cr (March 2018)
`1,896 Cr (March 2018)
QIP
Housing Development Finance Corp
QIP
`150 Cr (January 2018)
Deepak Nitrite
Reliance AMC
IPO
`1,542 Cr (October 2017)
`5,700 Cr (September 2017)
ICICI Lombard General Insurance
IPO IPO
IRB InvIT Fund
`5,033 Cr (May 2017)
`15,000 Cr (June 2017)
QIP
State Bank of India
QIP
`2,500 Cr (June 2017)
Federal Bank
23
I: IIFL Group Business Overview
(i) IIFL Finance
(ii) IIFL Wealth
(iii) IIFL Securities
II: Ownership, Management and Governance
24
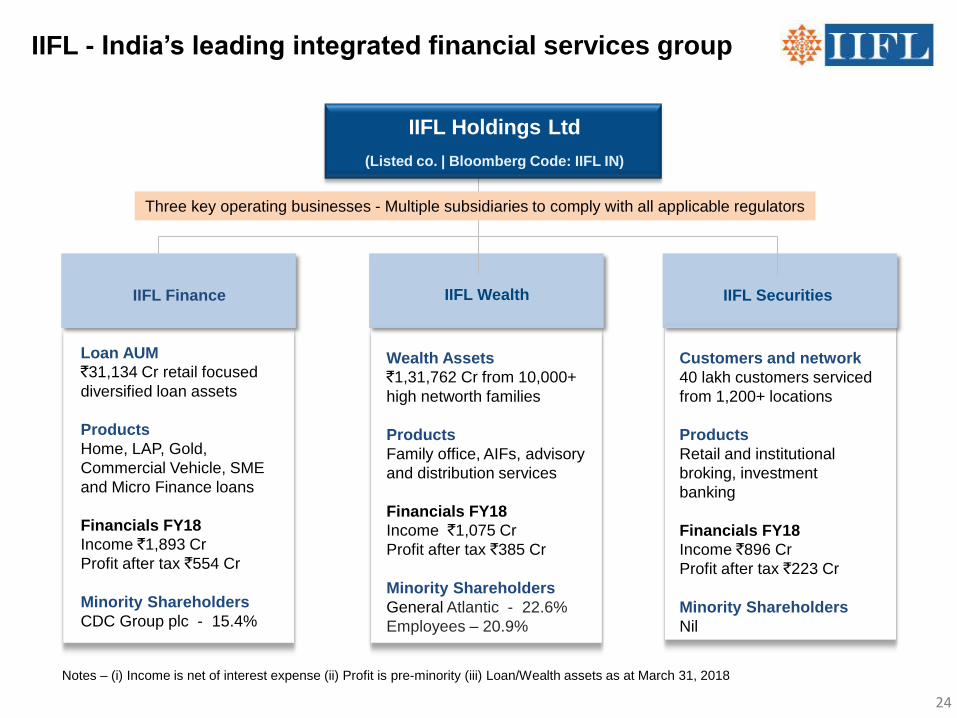
IIFL - India’s leading integrated financial services group
Loan AUM `31,134 Cr retail focused diversified loan assets Products Home, LAP, Gold, Commercial Vehicle, SME and Micro Finance loans Financials FY18 Income `1,893 Cr Profit after tax `554 Cr Minority Shareholders CDC Group plc - 15.4%
IIFL Finance IIFL Wealth
IIFL Holdings Ltd
(Listed co. | Bloomberg Code: IIFL IN)
Notes – (i) Income is net of interest expense (ii) Profit is pre-minority (iii) Loan/Wealth assets as at March 31, 2018
IIFL Securities
Three key operating businesses - Multiple subsidiaries to comply with all applicable regulators
Wealth Assets `1,31,762 Cr from 10,000+ high networth families Products Family office, AIFs, advisory and distribution services Financials FY18 Income `1,075 Cr Profit after tax `385 Cr Minority Shareholders General Atlantic - 22.6% Employees – 20.9%
Customers and network 40 lakh customers serviced from 1,200+ locations Products Retail and institutional broking, investment banking Financials FY18 Income `896 Cr Profit after tax `223 Cr Minority Shareholders Nil

25
Doubling Revenue 2x
Net profit 2.5x over FY16-FY20
Durability Reducing volatility and
cyclicality of earnings in all businesses
De-risking Diversifying revenue
sources with focus on financial services
Values
Consistent Vision and Values since inception for the foundation of corporate culture
Vision
Fairness Integrity Transparency
“To become the Most Respected Company in the financial services space”
Vision 2020*
*The information is based on management’s internal goals and is subject to change without notice. The actual performance can be materially different.
Transparency in all our dealings with stakeholders, media,
investors, and the public at large
Fairness in our transactions with all stakeholders including
employees, customers, and vendors, bereft of fear or favour
Integrity and honesty of the utmost nature, in letter, in spirit,
and in all our dealings with people, internal or external
26
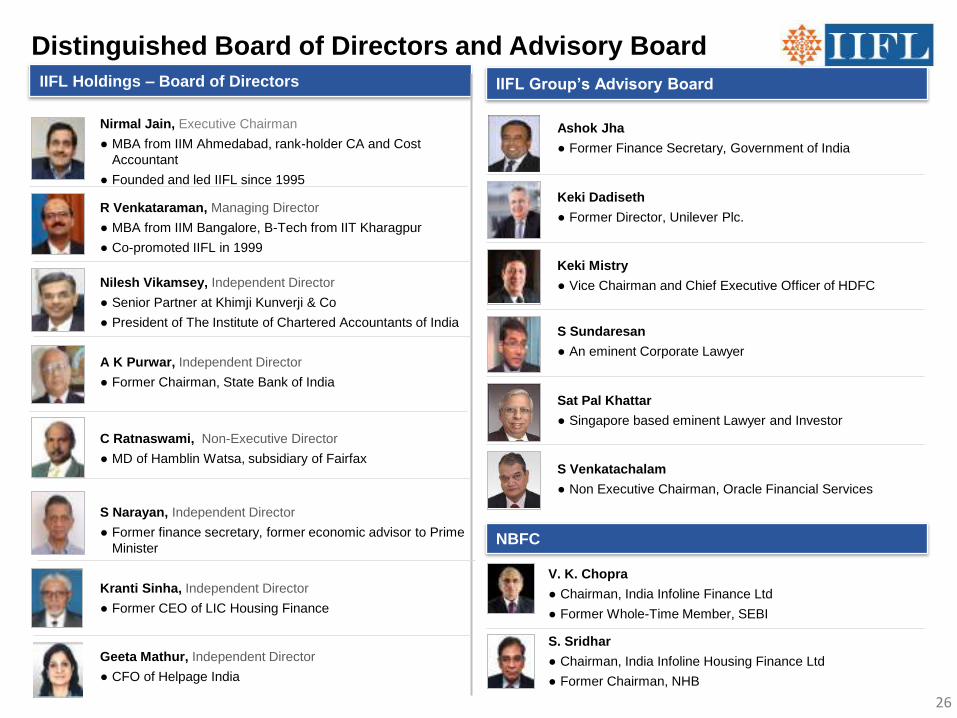
Nirmal Jain, Executive Chairman
● MBA from IIM Ahmedabad, rank-holder CA and Cost Accountant
● Founded and led IIFL since 1995
C Ratnaswami, Non-Executive Director
● MD of Hamblin Watsa, subsidiary of Fairfax
Kranti Sinha, Independent Director
● Former CEO of LIC Housing Finance
A K Purwar, Independent Director
● Former Chairman, State Bank of India
Nilesh Vikamsey, Independent Director
● Senior Partner at Khimji Kunverji & Co
● President of The Institute of Chartered Accountants of India
R Venkataraman, Managing Director
● MBA from IIM Bangalore, B-Tech from IIT Kharagpur
● Co-promoted IIFL in 1999
S Narayan, Independent Director
● Former finance secretary, former economic advisor to Prime Minister
Geeta Mathur, Independent Director
● CFO of Helpage India
IIFL Holdings – Board of Directors IIFL Group’s Advisory Board
Ashok Jha
● Former Finance Secretary, Government of India
Keki Dadiseth
● Former Director, Unilever Plc.
Keki Mistry
● Vice Chairman and Chief Executive Officer of HDFC
S Sundaresan
● An eminent Corporate Lawyer
Sat Pal Khattar
● Singapore based eminent Lawyer and Investor
S Venkatachalam
● Non Executive Chairman, Oracle Financial Services
Distinguished Board of Directors and Advisory Board
NBFC
V. K. Chopra
● Chairman, India Infoline Finance Ltd
● Former Whole-Time Member, SEBI
S. Sridhar
● Chairman, India Infoline Housing Finance Ltd
● Former Chairman, NHB

27 27
Chairman Nirmal Jain
Managing Director R. Venkataraman
Institutional Equities
Wealth Management
Offshore Asset Management
Investment Banking
Karan Bhagat
Amit Shah
Nipun Goel
Housing Finance Monu Ratra
PMS & Retail Broking Arindam Chanda
H. Nemkumar
Realty Services Balaji Raghavan
Compliance
Finance
Company Secretary
Prabodh Agrawal
Technology
Strategy
Subhash Kelkar
Aniruddha Dange
R. Mohan
Gajendra Thakur
Marquee Investors
Management team with rich domain experience and ownership
Notes : Shareholding pattern as at March 31, 2018
Promoters 29.0%
Fairfax Group 35.4%
Foreign Investors
14.1%
Domestic Institution
2.5%
NRI 7.2%
Public & Others 11.7%
IIFL Holdings Ltd
IIFL Holdin
gs 84.5%
CDC 15.4%
Employees 0.1%
IIFL Finance#
IIFL Holdin
gs 56.4%
Employees
20.9%
IIFL Wealth
General Atlantic 22.6%
28 28
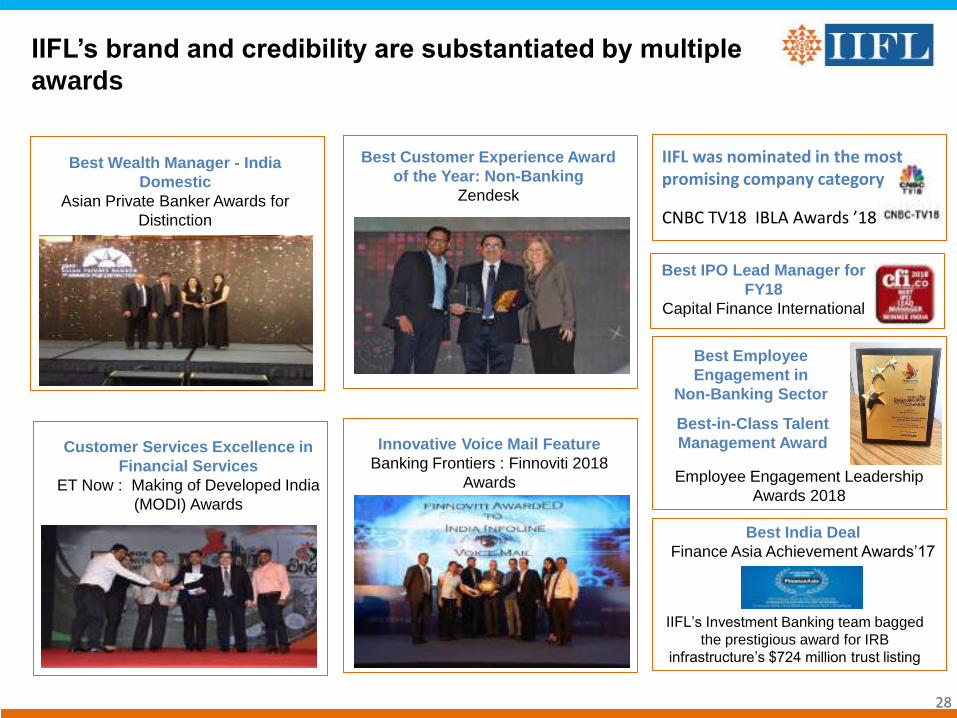
IIFL’s brand and credibility are substantiated by multiple
awards
Best India Deal Finance Asia Achievement Awards’17
IIFL’s Investment Banking team bagged the prestigious award for IRB
infrastructure’s $724 million trust listing
Customer Services Excellence in Financial Services
ET Now : Making of Developed India (MODI) Awards
Best Customer Experience Award of the Year: Non-Banking
Zendesk
Innovative Voice Mail Feature Banking Frontiers : Finnoviti 2018
Awards
Best Employee Engagement in
Non-Banking Sector
Best-in-Class Talent Management Award
Employee Engagement Leadership Awards 2018
Best Wealth Manager - India Domestic
Asian Private Banker Awards for Distinction
Best IPO Lead Manager for FY18
Capital Finance International
CNBC TV18 IBLA Awards ’18
IIFL was nominated in the most promising company category
29
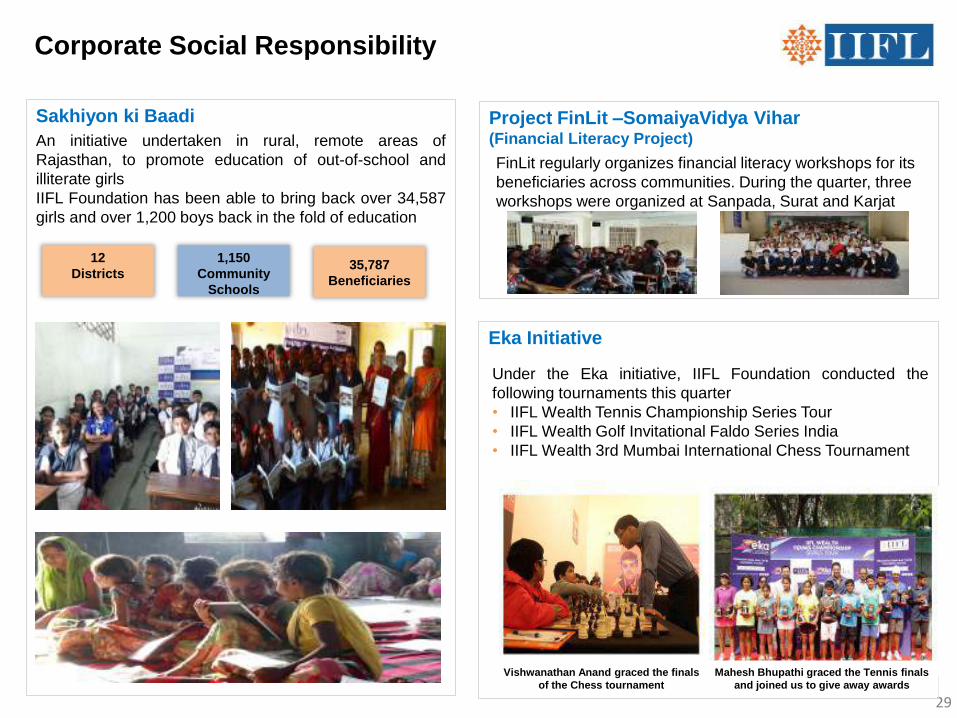
Corporate Social Responsibility Sakhiyon ki Baadi An initiative undertaken in rural, remote areas of Rajasthan, to promote education of out-of-school and illiterate girls IIFL Foundation has been able to bring back over 34,587 girls and over 1,200 boys back in the fold of education
Project FinLit –SomaiyaVidya Vihar (Financial Literacy Project)
12 Districts
35,787 Beneficiaries
1,150 Community
Schools
Eka Initiative
Mahesh Bhupathi graced the Tennis finals and joined us to give away awards
FinLit regularly organizes financial literacy workshops for its beneficiaries across communities. During the quarter, three workshops were organized at Sanpada, Surat and Karjat
Vishwanathan Anand graced the finals of the Chess tournament
Under the Eka initiative, IIFL Foundation conducted the following tournaments this quarter • IIFL Wealth Tennis Championship Series Tour • IIFL Wealth Golf Invitational Faldo Series India • IIFL Wealth 3rd Mumbai International Chess Tournament
30
Thank you
Published in May 2018 © IIFL Holdings Ltd 2018-19. IIFL Holdings Ltd. All rights reserved. Regd. Off: IIFL House, Sun Infotech Park, Road No. 16V, Plot No.B-23, Thane Industrial Area, Wagle Estate, Thane – 400604. Tel.: +(91 22)4007 7000 Fax: 2685 0451. This report is for information purposes only and does not construe to be any investment, legal or taxation advice. It is not intended as an offer or solicitation for the purchase and sale of any financial instrument. Any action taken by you on the basis of the information contained herein is your responsibility alone and IIFL Holdings Ltd (hereinafter referred as IHL) and its subsidiaries or its employees or directors, associates will not be liable in any manner for the consequences of such action taken by you. We have exercised due diligence in checking the correctness and authenticity of the information contained herein, but do not represent that it is accurate or complete. IHL or any of its subsidiaries or associates or employees shall not be in any way responsible for any loss or damage that may arise to any person from any inadvertent error in the information contained in this publication. The recipients of this report should rely on their own investigations. IHL and/or its subsidiaries and/or directors, employees or associates may have interests or positions, financial or otherwise in the securities mentioned in this report.