igniting startups for economic growth and social change€¦ · igniting startups for economic...
TRANSCRIPT
Chapter 1: A Short Chapter Title
Global Entrepreneurship Monitor South Africa (GEM SA)
2019/2020 report
Angus Bowmaker-Falconer and Mike Herrington
Igniting startups for economic growth and social change
PAID
PAID
PAID
PAID
Authors: Angus Bowmaker-Falconer. Research fellow, Stellenbosch University Business School (USB).
Digital Economy Africa Research (DEAR).
Mike Herrington. Established the Global Entrepreneurship Monitor South Africa (GEM SA) in 2001.
Previously the executive director of the Global Entrepreneurship Research Association (GERA).
Editing, design and productionWriting and editing: Jorisna Bonthuys and Anneke Potgieter.
Design, illustration and layout: Roulé le Roux and Ronel van Heerden.
Printing: African Sun Media. Contact [email protected]
© Stellenbosch University together with the Global Entrepreneurship Monitor South Africa (GEM SA), 2020.
All rights reserved. Bowmaker-Falconer, A., and Herrington, M., GEM SA 2019/2020 Report.
PAID
PAID
PAID
PAID
Global Entrepreneurship Monitor South Africa (GEM SA) 2019/2020 report
Acknowledgements
The authors wish to express their gratitude to the following
contributors, partners and stakeholders, without whom this
research would not have been possible:
The national experts who provided insights into and
perspectives on the topic. We value your opinions.
The GERA team and specifically Jonathan Carmona, Forrest
Wright, Alicia Coduras and Chris Aylett for their guidance and
assistance.
Prof. Marius Ungerer and Dr Marietjie Theron-Wepener for their
support in establishing GEM SA at USB.
Dr Njeri Mwagiru, Senior Futurist: Africa at the Institute for
Futures Research (IFR), Stellenbosch University (SU), for her
analysis of entrepreneurship and the digital economy in Africa
and South Africa in Section 4 of this report.
The Small Enterprise Development Agency (Seda) for their
generous sponsorship as a member of the GEM SA steering
committee.
Nielsen South Africa for conducting the Adult Population Survey
(APS).
The entrepreneurs who contribute to innovation and new
economic development opportunities in South Africa.
Government, academic institutions, organisations in the public
and private sectors, and individuals who are committed to the
support and nurturing of entrepreneurial success in our country.
Angus Bowmaker-Falconer and Mike Herrington
Igniting startups for economic growth and social change
Glossary of terms
ACTFA Africa Continental Free Trade Area
APS Adult Population Survey
EBO Established business ownership
EEA Entrepreneurial employee activity
EFC Entrepreneurial framework conditions
GDP Gross domestic product
NECI National Entrepreneurship Context Index
NES National Expert Survey
NFC National framework conditions
OECD Organisation for Economic Co-operation and Development
SDG Sustainable Development Goals
SEA Social entrepreneurial activity
SMEs Small and medium-sized enterprises
SMMEs Small, medium and micro enterprises
TEA Total early-stage entrepreneurial activity
DefinitionAdult population Working-age adults, i.e. adults between the ages of 18 and 64 years.
i
ContentsExecutive summary .................................................................................................................................................................................................. iv
Section 1: Exploring the global context ............................................................................................................................................................. 1The GEM story ........................................................................................................................................................................................................................... 1The GEM conceptual framework ........................................................................................................................................................................................ 2How do we measure entrepreneurial activity? .............................................................................................................................................................. 5The GEM methodology ........................................................................................................................................................................................................ 6
About the Adult Population Survey (APS) ................................................................................................................................................................ 6About the National Expert Survey (NES) .................................................................................................................................................................. 6About the National Entrepreneurship Context Index (NECI) ............................................................................................................................... 6
What makes GEM unique? ....................................................................................................................................................................................................7
Section 2: Mapping entrepreneurship in South Africa ............................................................................................................................... 9What shapes entrepreneurship in South Africa? ........................................................................................................................................................... 9
Societal values regarding entrepreneurship ............................................................................................................................................................. 9Self-perceptions and intentions ...................................................................................................................................................................................10Total early-stage entrepreneurial activity (TEA) ....................................................................................................................................................10A global perspective ...................................................................................................................................................................................................... 12
Sustainability of entrepreneurship ..................................................................................................................................................................................14Open or closed for business? .......................................................................................................................................................................................14Meet South Africa’s entrepreneurs ............................................................................................................................................................................. 15The entrepreneur’s profile ............................................................................................................................................................................................. 15
Age .................................................................................................................................................................................................................................. 15Gender and race ..........................................................................................................................................................................................................16
Level of Education ................................................................................................................................................................................................................. 17The impact of entrepreneurs .............................................................................................................................................................................................. 18
- on industry sectors ....................................................................................................................................................................................................... 18- on job creation ...............................................................................................................................................................................................................19
Mapping interventions and innovation to support entrepreneurs .........................................................................................................................20Across the globe ..............................................................................................................................................................................................................20Local efforts .....................................................................................................................................................................................................................20
Seda for change .........................................................................................................................................................................................................20
Section 3: The South African entrepreneurial ecosystem ....................................................................................................................... 23Understanding the context ................................................................................................................................................................................................ 23Ease of doing business in South Africa ..........................................................................................................................................................................24We ask the experts ............................................................................................................................................................................................................... 25Unpacking the entrepreneurial framework conditions ............................................................................................................................................. 25Creating a fostering ecosystem ........................................................................................................................................................................................26Government policies and initiatives ................................................................................................................................................................................26Market openness ................................................................................................................................................................................................................... 27Education and training ........................................................................................................................................................................................................29Availability of and access to finance ...............................................................................................................................................................................29Taking stock of progress and challenges .......................................................................................................................................................................29
The National Entrepreneurial Context Index (NECI) .............................................................................................................................................29
Section 4: Minding the gap: Igniting entrepreneurship in the digital economy ........................................................................... 35Perspectives on women and youth in entrepreneurship .......................................................................................................................................... 35
Section 5: Conclusions and recommendations .............................................................................................................................................41
Appendix: Economy profiles (African region) ...................................................................................................................................................................47
ii
List of figuresFigure 1: The GEM conceptual framework. .........................................3
Figure 2: Entrepreneurial phases and GEM’s entrepreneurship
indicators .......................................................................................................4
Figure 3: Total early-stage entrepreneurial (TEA) activity and
established business ownership rates (as percentage of adult
population) ................................................................................................. 12
Figure 4: Overall country scores on the National
Entrepreneurship Context Index (NECI) ......................................... 32
Figure 5: National Expert Survey (NES) top-ranked framework
conditions: Current constraints on and future focus areas for
improving entrepreneurial activity in South Africa ....................... 33
List of tablesTable 1: Participating economies in the GEM APS research study
of 2019/2020, by geographic region and income level ..................2
Table 2: Societal attitudes regarding entrepreneurship in South
Africa in 2003–2019 (as percentage of adult population) .............9
Table 3: Entrepreneurial perceptions and competencies in the
South African adult population in 2001–2019 (as percentage of
adult population) ....................................................................................... 11
Table 4: Entrepreneurial intentions in South Africa in 2003–2019
(as percentage of adult population) .................................................... 11
Table 5: Prevalence rates of entrepreneurial activity among the
adult population in South Africa in 2001–2019 (as percentage of
adult population) ....................................................................................... 11
Table 6: Ranking of types of entrepreneurial activity,
by region, as per the GEM 2019 report (as percentage
of adult population................................................................................... 13
Table 7: Reasons for business exits in South Africa in 2006–2019
(as percentage of entrepreneurs who exited a business in the
previous year) ........................................................................................... 14
Table 8: Total early-stage entrepreneurial (TEA) activity in
South Africa in 2001–2019, by age group (as percentage of adult
population) ................................................................................................. 15
Table 9: Total early-stage entrepreneurial (TEA) activity in
South Africa in 2005–2019, by gender (as percentage of adult
population) ................................................................................................. 16
Table 10: Total early-stage entrepreneurial activity (TEA) in
South Africa in 2005–2019, by race (as percentage of adult
population) ................................................................................................. 16
Table 11: Educational levels of early-stage entrepreneurs in
South Africa in 2001–2019 (as percentage of adult early-stage
entrepreneurs) ........................................................................................... 17
Table 12: Distribution of total early-stage entrepreneurial
activity (TEA) across sectors in South Africa in 2015–2019 (as
percentage of adult population) .......................................................... 18
Table 13: Job growth expectations among early-stage
entrepreneurs in South Africa in 2005–2019 (as percentage of
adult population) ...................................................................................... 19
Table 14: Policy interventions in support of entrepreneurship in
various countries ...................................................................................... 20
Table 15: Knowledge of Seda in 2017 and 2019, by age group
(as percentage of adult population) ................................................... 21
Table 16: Knowledge of Seda in 2017 and 2019, by region (as
percentage of adult population) .......................................................... 21
Table 17: Effectiveness of government agencies in assisting
small businesses in South Africa in 2019 (as percentage of adult
population) ................................................................................................. 21
Table 18: South Africa’s rankings on the conditions of the Global
Competitiveness Index in 2016–2020................................................ 24
Table 19: “Ease of doing business” ranking: South Africa
compared to higher-ranking African economies ........................... 25
Table 20: The national entrepreneurship framework conditions
(NFCs) ......................................................................................................... 26
Table 21: Entrepreneurial framework conditions scores in
2015–2019 ...................................................................................................27
Table 22: Expert ratings of seven aspects of government policies
around entrepreneurship in 2016–2019............................................. 28
Table 23: Expert ratings of the success of government
programmes for entrepreneurship in South Africa in 2016–2019 ..
....................................................................................................................... 28
Table 24: Expert ratings of market openness in South Africa in
2016–2019 .................................................................................................. 28
Table 25: Expert ratings of the availability of entrepreneurial
finance in South Africa in 2016–2019 ................................................. 30
Table 26: Expert ratings of the success of entrepreneurial
education and training in South Africa in 2016–2019 ................... 30
Table 27: The National Entrepreneurship Context Index (NECI)
for 54 economies in 2019 ....................................................................... 31
iii
Foreword from the sponsor
We look forward to facilitating the implementation of this
study’s recommendations, particularly with regard to the
development of programmes and policies in support of small
business development across the ecosystem.
About SedaSeda is an agency of the Department of Small Business
Development. It was established through the National Small
Business Amendment Act, Act 29 of 2004. Seda is mandated
to implement the South African government’s small business
strategy; design and implement a standard and common
national delivery network for small enterprise development; and
integrate government-funded small enterprise support agencies
across all tiers of government.
Seda’s target market covers small, medium and micro
enterprises – including cooperatives.
About the University of Stellenbosch Business School (USB)The USB is a triple-accredited African business school focused
on responsible leadership development and is a part of SU, the
top-ranked research university in Africa.
One of the USB’s key social engagement initiatives is its
Small Business Academy, which offers a nine-month business
development programme to small business owners from
low-income communities. Its engaged learning programmes
allow students to have a positive social impact by facilitating
entrepreneurial development.
The Small Enterprise Development Agency (Seda) is proud to
be an organisation dedicated to supporting entrepreneurship as
well as small business development and research.
We are very excited to partner with Stellenbosch University (SU)
and the Global Entrepreneurship Research Association (GERA)
in undertaking the Global Entrepreneurship Monitor South
Africa (GEM SA) study. This study provides fundamental insights
for entrepreneurship development in South Africa.
GEM’s research outputs continue to serve as a longitudinal
entrepreneurial development yardstick as we work towards
facilitating entrepreneurship that is embedded in and
implemented throughout the entire small business ecosystem.
Our focus is on ensuring meaningful partnerships that involve
both the public and private sectors. Moving ahead, Seda is
reviewing its role in the business development ecosystem.
We foresee a growing strategic emphasis on facilitation in our
operational model. This will optimise the implementation of
the organisation’s mandate, enabling more small businesses
and entrepreneurs to access our services. In this regard, shared
access to a comprehensive database of small businesses at the
district level, business development support practitioners and
entrepreneurship research remains vital.
National Information Centre
Contact: 0860 103 703 or [email protected]
www.seda.org.za
The USB is pleased to announce our custodianship, from this
point forward, of the GEM SA research study. GEM’s research is
recognised as the most authoritative, informative and ambitious
annual research study on global entrepreneurship.
The 2019/2020 GEM SA report is our inaugural contribution to
national entrepreneurship research in the country.
iv
Igniting startups for economic growth and social change
Executive summary
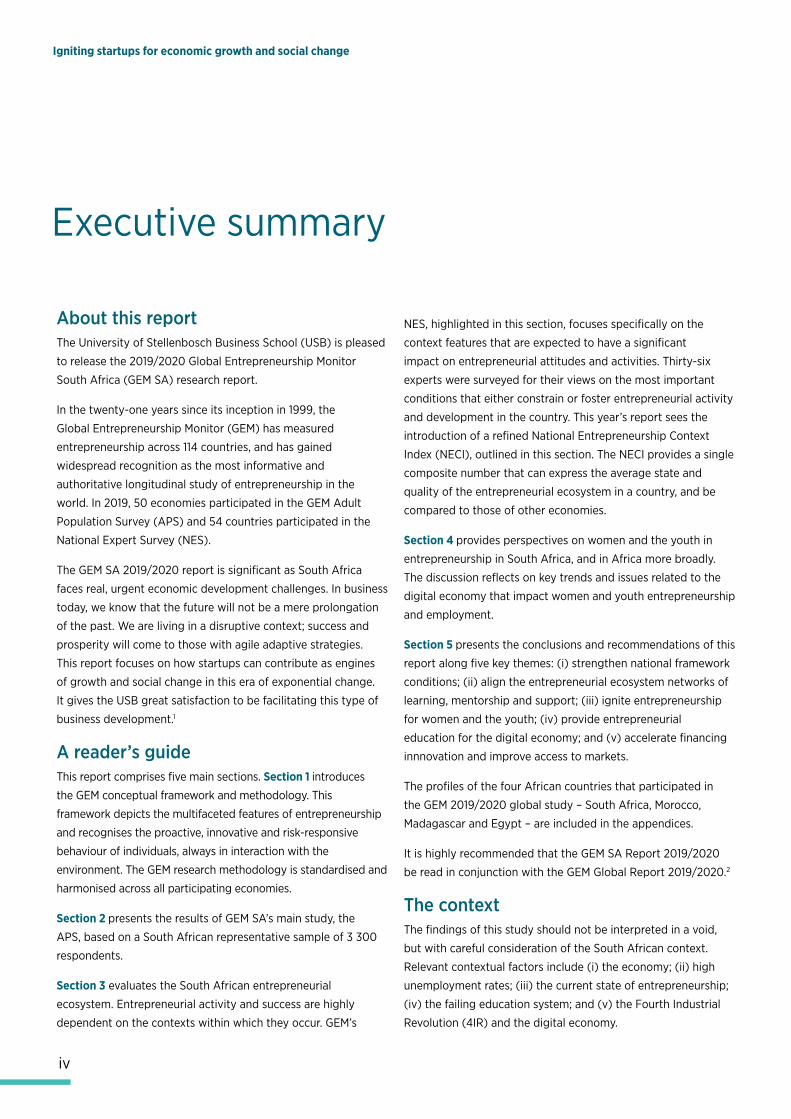
About this reportThe University of Stellenbosch Business School (USB) is pleased
to release the 2019/2020 Global Entrepreneurship Monitor
South Africa (GEM SA) research report.
In the twenty-one years since its inception in 1999, the
Global Entrepreneurship Monitor (GEM) has measured
entrepreneurship across 114 countries, and has gained
widespread recognition as the most informative and
authoritative longitudinal study of entrepreneurship in the
world. In 2019, 50 economies participated in the GEM Adult
Population Survey (APS) and 54 countries participated in the
National Expert Survey (NES).
The GEM SA 2019/2020 report is significant as South Africa
faces real, urgent economic development challenges. In business
today, we know that the future will not be a mere prolongation
of the past. We are living in a disruptive context; success and
prosperity will come to those with agile adaptive strategies.
This report focuses on how startups can contribute as engines
of growth and social change in this era of exponential change.
It gives the USB great satisfaction to be facilitating this type of
business development.1
A reader’s guideThis report comprises five main sections. Section 1 introduces
the GEM conceptual framework and methodology. This
framework depicts the multifaceted features of entrepreneurship
and recognises the proactive, innovative and risk-responsive
behaviour of individuals, always in interaction with the
environment. The GEM research methodology is standardised and
harmonised across all participating economies.
Section 2 presents the results of GEM SA’s main study, the
APS, based on a South African representative sample of 3 300
respondents.
Section 3 evaluates the South African entrepreneurial
ecosystem. Entrepreneurial activity and success are highly
dependent on the contexts within which they occur. GEM’s
NES, highlighted in this section, focuses specifically on the
context features that are expected to have a significant
impact on entrepreneurial attitudes and activities. Thirty-six
experts were surveyed for their views on the most important
conditions that either constrain or foster entrepreneurial activity
and development in the country. This year’s report sees the
introduction of a refined National Entrepreneurship Context
Index (NECI), outlined in this section. The NECI provides a single
composite number that can express the average state and
quality of the entrepreneurial ecosystem in a country, and be
compared to those of other economies.
Section 4 provides perspectives on women and the youth in
entrepreneurship in South Africa, and in Africa more broadly.
The discussion reflects on key trends and issues related to the
digital economy that impact women and youth entrepreneurship
and employment.
Section 5 presents the conclusions and recommendations of this
report along five key themes: (i) strengthen national framework
conditions; (ii) align the entrepreneurial ecosystem networks of
learning, mentorship and support; (iii) ignite entrepreneurship
for women and the youth; (iv) provide entrepreneurial
education for the digital economy; and (v) accelerate financing
innnovation and improve access to markets.
The profiles of the four African countries that participated in
the GEM 2019/2020 global study – South Africa, Morocco,
Madagascar and Egypt – are included in the appendices.
It is highly recommended that the GEM SA Report 2019/2020
be read in conjunction with the GEM Global Report 2019/2020.2
The contextThe findings of this study should not be interpreted in a void,
but with careful consideration of the South African context.
Relevant contextual factors include (i) the economy; (ii) high
unemployment rates; (iii) the current state of entrepreneurship;
(iv) the failing education system; and (v) the Fourth Industrial
Revolution (4IR) and the digital economy.
v
Executive summary
The economyThe South African economy is underdeveloped, but has great
potential as well as access to abundant natural and other
resources. South Africa has the most industrialised economy
on the African continent and is a leader in most sectors. Over
the past decade, however, the economy has consistently
underperformed, with the real gross domestic product (GDP)
per capita declining since 2011.
The full-year 2019 GDP growth forecasts were around 0.4%
or lower, and consensus economic growth forecasts for 2020
are now below 1% (according to the South African Reserve
Bank, International Monetary Fund, World Bank and Moody’s
Investors Service). This sluggish growth will translate into
limited job creation and could deepen the existing rifts caused
by unemployment and financial inequality.
The South African economy, like many others, was deeply
affected by the 2008 financial crisis. Various domestic
challenges have resulted in a slow recovery and economic
flatlining. Business confidence remains fragile domestically, and
the country is well out of favour on the global investment-grade
indices. The domestic challenges that plague the economy most
include, amongst others, governmental overspending, rising
government debt, poor state delivery capabilities, governance
and corruption challenges in both the public and private sectors,
the unreliability and unpredictability of electricity supply, the
education system’s lack of delivery, and extreme unemployment.
Also, failing state-owned enterprises and policy-related
uncertainties around land appropriation without compensation
are spooking international investors.
This range of challenges affects South Africa’s efforts to
make progress on several United Nations (UN) Sustainable
Development Goals (SDGs). The SDGs, also known as the
“Global Goals”, were adopted by UN member states in 2015 as
a universal call to action to end poverty, protect the planet and
ensure that all people enjoy peace and prosperity by 2030.
The following two SDGs are the most relevant to
entrepreneurship in South Africa:
• SDG 1: End poverty in all its forms everywhere
• SDG 10: Reduce inequality within and among countries
These two SDGs pose major challenges, given the country’s
low economic growth. On the one hand, unemployment trends
1 Prof. Piet Naudé, Director: USB.
2 Bosma, N. et al. (2020). GEM Global Report 2019/2020. Retrieved from http://www.gemconsortium.org/report
3 Economic Policy, National Treasury. (2019). Economic Transformation, Inclusive Growth, and Competitiveness: Towards an Economic Strategy for South Africa. Re-
trieved from http://www.treasury.gov.za/comm_media/press/2019/Towards%20an%20Economic%20Strategy%20for%20SA.pdf
4 Retrieved from https://tradingeconomics.com/country-list/unemployment-rate
are likely to exacerbate poverty and create further reliance on
government grants. On the other, the lack of robust economic
growth will cement inequality, keeping a more inclusive society
out of reach.
As part of efforts to address the current economic situation,
the Economic Policy division of the National Treasury in
2019 published a position paper on long-term economic
transformation, inclusive growth and competitiveness.3 The
analysis and recommendations in this report are not fully
supported by all stakeholders, but clearly identify the policy
reforms needed to ignite the economy.
Unemployment crisisUnemployment is a crisis that can only be addressed through
structural reforms in the economy, supported by investment
in and systemic changes to the education system. With an
unemployment rate of 29.1%, South Africa faces significantly
greater employment challenges than the other countries in the
BRICS group of emerging national economies (compare Brazil at
11%, Russia at 4.6%, India at 7.2% and China at 3.6%).4
Entrepreneurship mattersAcross the Organisation for Economic Co-operation and
Development (OECD), comprising 36 countries from North and
South America to Europe and Asia-Pacific, small and medium-
sized enterprises (SMEs) account for 99% of all businesses and
between 50% and 60% of value added. Nearly one third of
people in OECD member countries are employed in a micro-
enterprise with less than 10 employees, and two thirds are
employed in SMEs. In many regions and cities, SMEs have been
the main drivers of job creation, and they often contribute to
the identity and social cohesion of local communities. As the
predominant form of business and employment, they are also
key actors in the promotion of more inclusive and sustainable
growth, economic resilience and social cohesion.5
vi
Igniting startups for economic growth and social change
The 2019 OECD review acknowledges that, even in the more developed economies, SMEs face ongoing challenges. Firstly, SMEs constitute a very heterogeneous population with differences being influenced by economy size, market structures, institutions and regulation, the prevailing business environment and other factors.6 Secondly, although SMEs are driving job growth, there is a need for greater investment in skills, innovation and technology to boost wages and productivity.7
South Africa still has some way to go towards developing entrepreneurship as a significant driver of economic development and job creation. The comparatively high data costs in the country is one of the major challenges faced by South African entrepreneurs. This is an important market issue to address, given that the digital economy is where many entrepreneurial opportunities lie. Additionally, there is significant over-regulation of small businesses with unnecessary bureaucratic burdens, and there remain various labour market
rigidities.
Education remains vitalSouth Africa’s economic stagnation is inextricably linked to the
failure of its education system as the development of human
capital is vital not only to individual progression but also
national development.10 Although the country has experienced a
rapid expansion in access to education and increased enrolment
in recent decades, the quality of education has remained poor
and characterised by ongoing inequality.11
The dynamics of the educational system outcomes are complex
and not a reflection of the degree of financial investment in
education by the government. The fundamental challenge is
that there remains a dual education system: one for a minority
wealthy segment, delivering the requisite educational outcomes,
and the other for the majority poor population, ill-equipping
young people for post-school opportunities and further
development. The result is the reinforcement of social and
income inequality.12
There is a lack of understanding at government level of the
extent of the country’s education crisis, according to Prof.
Jonathan Jansen of SU’s Faculty of Education.13 Jansen agrees
that the first big problem in South Africa is inequality and the
second, its two unequal school systems. He points out that
the country’s education system is inefficient, getting very little
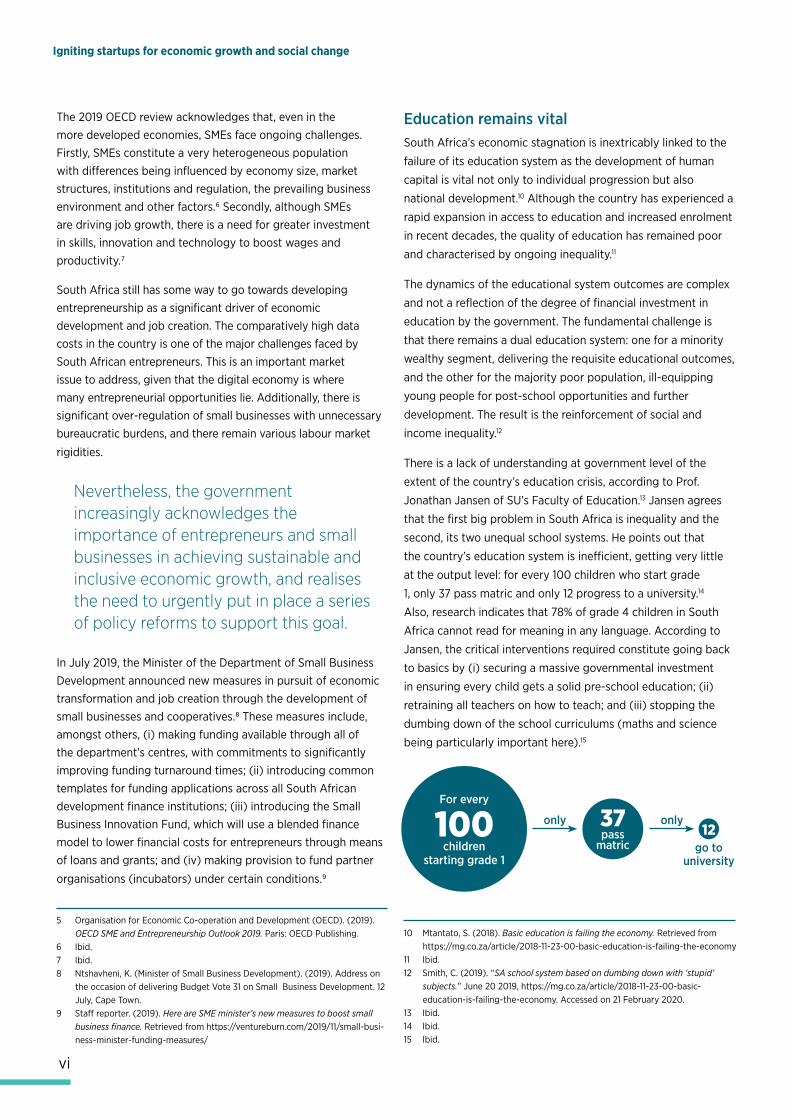
at the output level: for every 100 children who start grade
1, only 37 pass matric and only 12 progress to a university.14
Also, research indicates that 78% of grade 4 children in South
Africa cannot read for meaning in any language. According to
Jansen, the critical interventions required constitute going back
to basics by (i) securing a massive governmental investment
in ensuring every child gets a solid pre-school education; (ii)
retraining all teachers on how to teach; and (iii) stopping the
dumbing down of the school curriculums (maths and science
being particularly important here).15
10 Mtantato, S. (2018). Basic education is failing the economy. Retrieved from https://mg.co.za/article/2018-11-23-00-basic-education-is-failing-the-economy
11 Ibid.12 Smith, C. (2019). “SA school system based on dumbing down with ‘stupid’
subjects.” June 20 2019, https://mg.co.za/article/2018-11-23-00-basic-education-is-failing-the-economy. Accessed on 21 February 2020.
13 Ibid.14 Ibid.15 Ibid.
For every
100children
starting grade 1
only 37pass
matric12
go to university
only
Nevertheless, the government increasingly acknowledges the importance of entrepreneurs and small businesses in achieving sustainable and inclusive economic growth, and realises the need to urgently put in place a series of policy reforms to support this goal.
5 Organisation for Economic Co-operation and Development (OECD). (2019). OECD SME and Entrepreneurship Outlook 2019. Paris: OECD Publishing.
6 Ibid.7 Ibid.8 Ntshavheni, K. (Minister of Small Business Development). (2019). Address on
the occasion of delivering Budget Vote 31 on Small Business Development. 12 July, Cape Town.
9 Staff reporter. (2019). Here are SME minister’s new measures to boost small business finance. Retrieved from https://ventureburn.com/2019/11/small-busi-ness-minister-funding-measures/
In July 2019, the Minister of the Department of Small Business Development announced new measures in pursuit of economic transformation and job creation through the development of small businesses and cooperatives.8 These measures include, amongst others, (i) making funding available through all of the department’s centres, with commitments to significantly improving funding turnaround times; (ii) introducing common templates for funding applications across all South African development finance institutions; (iii) introducing the Small Business Innovation Fund, which will use a blended finance model to lower financial costs for entrepreneurs through means of loans and grants; and (iv) making provision to fund partner
organisations (incubators) under certain conditions.9
Over and above the education system considerations, there is
also the importance of delivering entrepreneurial education
and developing entrepreneurial knowledge and skills. The
key considerations here include determining what education
is relevant in the context of the 4IR and the digital economy;
when in the education life cycle entrepreneurial learning should
commence (research indicates the earlier, the better) and how
it should develop in depth and complexity; and how educators
may be equipped to prepare the youth for the possibility of
entrepreneurship as a career and life choice.
The Fourth Industrial Revolution (4IR) and the digital economyThe 4IR that is currently underway is likely to be more
profound than any previous stages of extreme innovation.
Industrial revolutions occur when new technologies and
world views propel significant shifts in economic systems and
social structures.16 The reality we currently live and work in is
pivoting towards a fusion of the physical and the virtual worlds.
Interoperability, advanced artificial intelligence and autonomy
are becoming integral parts of a new industrial era.17
Building on the digital revolution, multiple technologies are
leading to unparalleled paradigm shifts in the economy,
business, society and individuals. Waves of technological
breakthroughs are occurring at the same time; the fusion of
these technologies and their interaction across the physical,
digital and biological domains is what sets the 4IR apart from its
predecessors.18
Technological progress is spreading via the internet at
relatively low costs, influencing every aspect of human life.
Digital technologies have had a profound impact on the world,
transforming entire industries while enabling new entrants with
great ideas and business models to achieve exponential growth
never before witnessed.19 This digital transformation of markets
provides significant growth opportunities for the economy
as greater connectivity between participants in different
ecosystems potentially drives a more inclusive and prosperous
society.20
Still of great concern is the low rating given to the quality of the education system (119 out of 141), which has shown no significant improvement over the years. This could have a dramatic impact on levels of entrepreneurial activity in the future.
South Africa also continues to rank low on the labour market indicators, i.e. flexibility of wage determinations (124 out of 141) and hiring and firing practices (129 out of 141).
The World Bank Doing Business 2020 study measured regulations in 12 areas of business activity across 190 economies. South Africa ranked at position 84, with an overall “ease of doing business” score of 67 out of 100. Only two African economies ranked in the top 50 on this ease of doing
business measurement.
Overall findings
South Africa’s international rankings The NECI provides a single composite number representing the average quality of the entrepreneurial ecosystem in a given country, for comparison with other countries. In 2019, South Africa ranked 49th out of 54 economies, ahead of only Croatia, Guatemala, Paraguay, Puerto Rico and Iran.
On the rankings of the Global Competitiveness Report 2019, South Africa’s overall position improved from 67 out of 140 economies in 2018, to 60 out of 141 economies in 2019. There was, however, a decline on some rankings, such as the burden of government regulations (to 101 out of 141) and the time required to start a business (to 129 out of 141).
In the future, digital technologies will increasingly propel entrepreneurial activity as they hold the potential to disrupt existing market dominances and create new market and customer opportunities.
16 Schwab, K.M. (2016). Welcome to The Fourth Industrial Revolution. Rotman Management Magazine: The Disruptive Issue, Fall 2016, 18–24. Retrieved from http://www.rotman.utoronto.ca/Connect/Rotman-MAG/Back-Issues/2016/Back-Issues---2016/Fall2016-TheDisruptiveIssueo
17 Schwab, K. (2016). The Fourth Industrial Revolution. Geneva: World Economic Forum.
18 Ibid.19 Gupta, S. (2018). Driving Digital Strategy: A Guide to Reimagining Your Busi-
ness. United States: Harvard Business Review Press.20 Department of Economic Development and Tourism, Western Cape Govern-
ment. (2017). Sector Digital Disruption Impact Assessment. Retrieved from https://www.westerncape.gov.za/general-publication/western-cape-sec-tor-digital-disruption-impact-assessment
21 Bukht, R. & Weeks, R. (2018). Development Implications of Digital Economies.Paper No. 6: Digital Economy Policy in Developing Countries. Manchester: Centre for Development Informatics, University of Manchester Global De-velopment Institute, SEED. Retrieved from https://diodeweb.files.wordpress.com/2018/03/digital-economy-policy-diode-paper.pdf
The digital economy is growing rapidly, especially in developing
countries, yet it still undershoots its potential in the majority of
the latter locations. In this way, growth in the digital economy
is also exacerbating digital exclusion, inequality and adverse
incorporation.21 Even with access to digital opportunities, many
South African’s ability to make full use of them is limited by the
affordability of this access.
Executive summary
vii
viii
Igniting startups for economic growth and social change
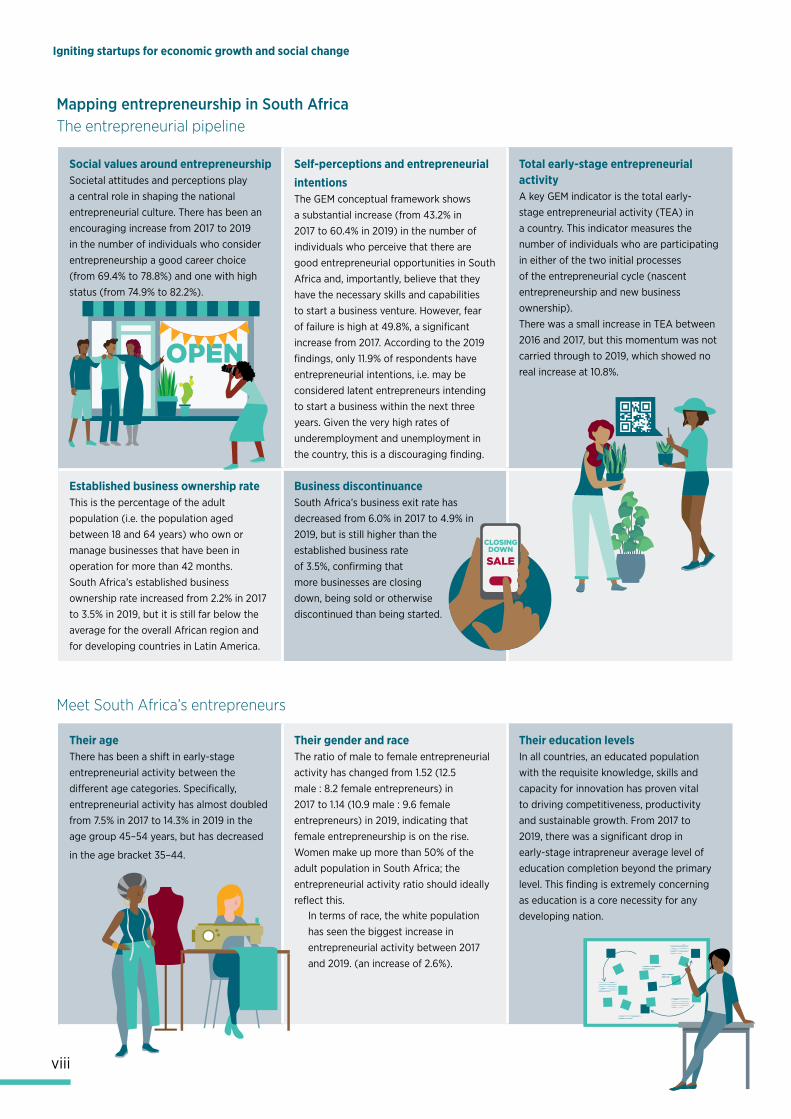
Social values around entrepreneurshipSocietal attitudes and perceptions play a central role in shaping the national entrepreneurial culture. There has been an encouraging increase from 2017 to 2019 in the number of individuals who consider entrepreneurship a good career choice (from 69.4% to 78.8%) and one with high status (from 74.9% to 82.2%).
Self-perceptions and entrepreneurial intentionsThe GEM conceptual framework shows a substantial increase (from 43.2% in 2017 to 60.4% in 2019) in the number of individuals who perceive that there are good entrepreneurial opportunities in South Africa and, importantly, believe that they have the necessary skills and capabilities to start a business venture. However, fear of failure is high at 49.8%, a significant increase from 2017. According to the 2019 findings, only 11.9% of respondents have entrepreneurial intentions, i.e. may be considered latent entrepreneurs intending to start a business within the next three years. Given the very high rates of underemployment and unemployment in the country, this is a discouraging finding.
Total early-stage entrepreneurial activityA key GEM indicator is the total early-stage entrepreneurial activity (TEA) in a country. This indicator measures the number of individuals who are participating in either of the two initial processes of the entrepreneurial cycle (nascent entrepreneurship and new business ownership). There was a small increase in TEA between 2016 and 2017, but this momentum was not carried through to 2019, which showed no real increase at 10.8%.
Established business ownership rateThis is the percentage of the adult population (i.e. the population aged between 18 and 64 years) who own or manage businesses that have been in operation for more than 42 months. South Africa’s established business ownership rate increased from 2.2% in 2017 to 3.5% in 2019, but it is still far below the average for the overall African region and for developing countries in Latin America.
Business discontinuanceSouth Africa’s business exit rate has decreased from 6.0% in 2017 to 4.9% in 2019, but is still higher than the established business rate of 3.5%, confirming that more businesses are closing down, being sold or otherwise discontinued than being started.
Mapping entrepreneurship in South AfricaThe entrepreneurial pipeline
OPEN
Their ageThere has been a shift in early-stage entrepreneurial activity between the different age categories. Specifically, entrepreneurial activity has almost doubled from 7.5% in 2017 to 14.3% in 2019 in the age group 45–54 years, but has decreased
in the age bracket 35–44.
Their gender and raceThe ratio of male to female entrepreneurial activity has changed from 1.52 (12.5 male : 8.2 female entrepreneurs) in 2017 to 1.14 (10.9 male : 9.6 female entrepreneurs) in 2019, indicating that female entrepreneurship is on the rise. Women make up more than 50% of the adult population in South Africa; the entrepreneurial activity ratio should ideally reflect this.
Their education levelsIn all countries, an educated population with the requisite knowledge, skills and capacity for innovation has proven vital to driving competitiveness, productivity and sustainable growth. From 2017 to 2019, there was a significant drop in early-stage intrapreneur average level of education completion beyond the primary level. This finding is extremely concerning as education is a core necessity for any developing nation.
Meet South Africa’s entrepreneurs
In terms of race, the white population has seen the biggest increase in entrepreneurial activity between 2017 and 2019. (an increase of 2.6%).
Executive summary
What we learnt from the National Expert Survey (NES)The success of entrepreneurial activity is highly dependent on the context within which it occurs. Ecosystem factors such as government policy frameworks and legislation, economic development and performance, education and a host of social dynamics directly influence and uniquely shape entrepreneurial activity and development at a country level.
The NES is the vehicle for collecting data and expert opinions on the nine primary framework conditions used in the GEM
The top-line findings for four of the NFCs (selected on the
combined basis of current ratings and their importance for
improving the entrepreneurial ecosystem in South Africa) are
summarised below.
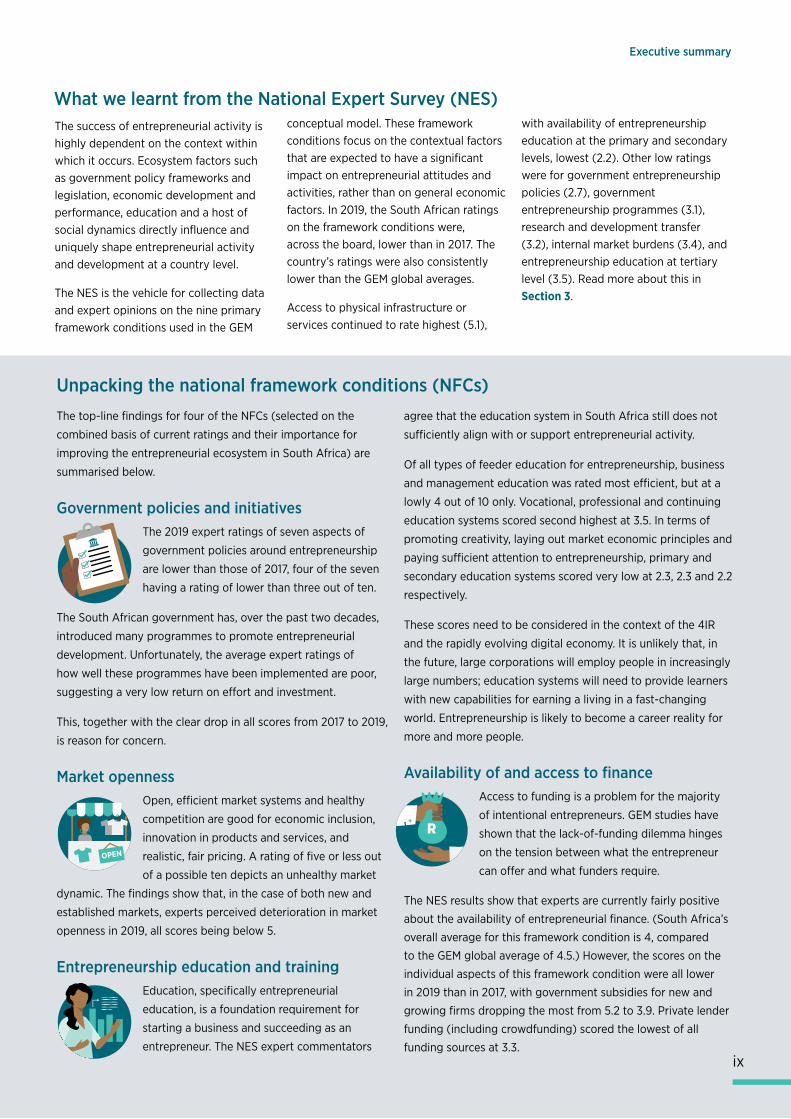
Government policies and initiativesThe 2019 expert ratings of seven aspects of
government policies around entrepreneurship
are lower than those of 2017, four of the seven
having a rating of lower than three out of ten.
The South African government has, over the past two decades,
introduced many programmes to promote entrepreneurial
development. Unfortunately, the average expert ratings of
how well these programmes have been implemented are poor,
suggesting a very low return on effort and investment.
This, together with the clear drop in all scores from 2017 to 2019,
is reason for concern.
Market opennessOpen, efficient market systems and healthy
competition are good for economic inclusion,
innovation in products and services, and
realistic, fair pricing. A rating of five or less out
of a possible ten depicts an unhealthy market
dynamic. The findings show that, in the case of both new and
established markets, experts perceived deterioration in market
openness in 2019, all scores being below 5.
Entrepreneurship education and trainingEducation, specifically entrepreneurial
education, is a foundation requirement for
starting a business and succeeding as an
entrepreneur. The NES expert commentators
Unpacking the national framework conditions (NFCs)agree that the education system in South Africa still does not
sufficiently align with or support entrepreneurial activity.
Of all types of feeder education for entrepreneurship, business
and management education was rated most efficient, but at a
lowly 4 out of 10 only. Vocational, professional and continuing
education systems scored second highest at 3.5. In terms of
promoting creativity, laying out market economic principles and
paying sufficient attention to entrepreneurship, primary and
secondary education systems scored very low at 2.3, 2.3 and 2.2
respectively.
These scores need to be considered in the context of the 4IR
and the rapidly evolving digital economy. It is unlikely that, in
the future, large corporations will employ people in increasingly
large numbers; education systems will need to provide learners
with new capabilities for earning a living in a fast-changing
world. Entrepreneurship is likely to become a career reality for
more and more people.
Availability of and access to financeAccess to funding is a problem for the majority
of intentional entrepreneurs. GEM studies have
shown that the lack-of-funding dilemma hinges
on the tension between what the entrepreneur
can offer and what funders require.
The NES results show that experts are currently fairly positive
about the availability of entrepreneurial finance. (South Africa’s
overall average for this framework condition is 4, compared
to the GEM global average of 4.5.) However, the scores on the
individual aspects of this framework condition were all lower
in 2019 than in 2017, with government subsidies for new and
growing firms dropping the most from 5.2 to 3.9. Private lender
funding (including crowdfunding) scored the lowest of all
funding sources at 3.3.
Executive summary
ix
conceptual model. These framework conditions focus on the contextual factors that are expected to have a significant impact on entrepreneurial attitudes and activities, rather than on general economic factors. In 2019, the South African ratings on the framework conditions were, across the board, lower than in 2017. The country’s ratings were also consistently lower than the GEM global averages.
Access to physical infrastructure or services continued to rate highest (5.1),
with availability of entrepreneurship education at the primary and secondary levels, lowest (2.2). Other low ratings were for government entrepreneurship policies (2.7), government entrepreneurship programmes (3.1), research and development transfer (3.2), internal market burdens (3.4), and entrepreneurship education at tertiary level (3.5). Read more about this in Section 3.
Igniting startups for economic growth and social change
funding institutions
academic and research institutions
interviews a year
years of data
1143M100+
GEM at a glance
200+
20200 000+300+
Since 1999, GEM has:
36 000
Types of entrepreneurs
of adults are starting or running a new business
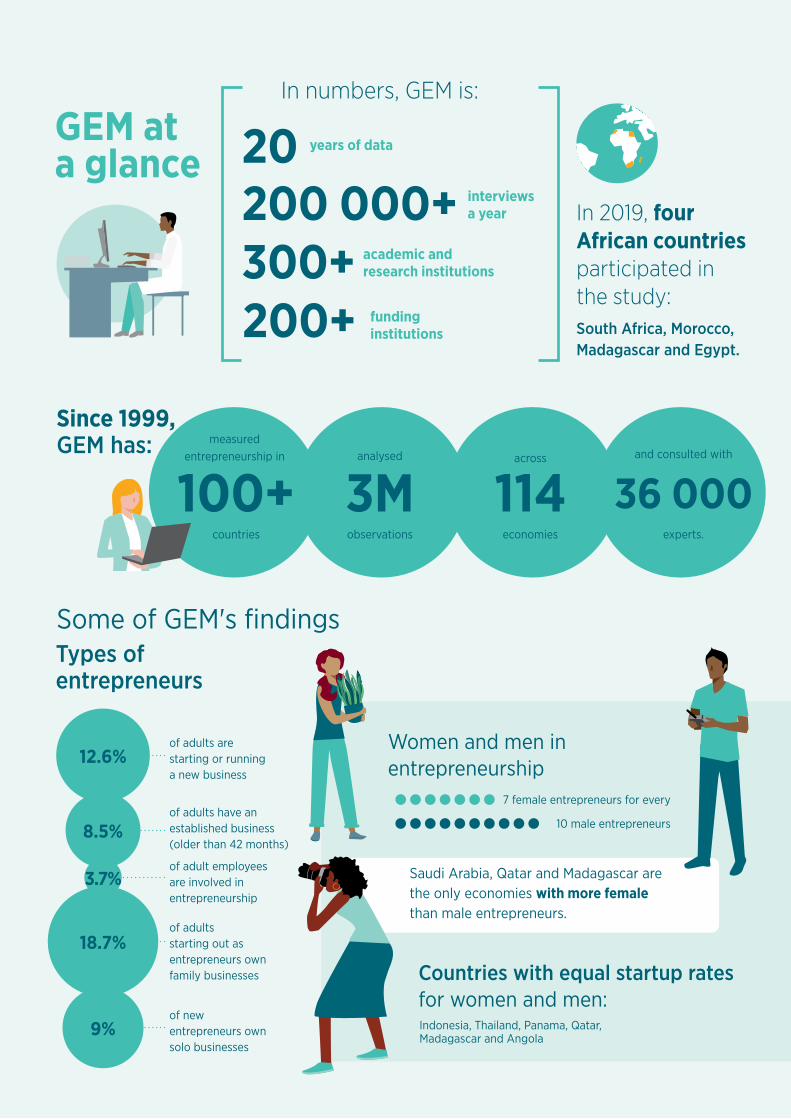
12.6%
8.5%of adults have an established business (older than 42 months)
3.7%of adult employees are involved in entrepreneurship
18.7%of adults starting out as entrepreneurs own family businesses
9%of new entrepreneurs own solo businesses
Women and men in entrepreneurship
7 female entrepreneurs for every
10 male entrepreneurs
Saudi Arabia, Qatar and Madagascar are the only economies with more female than male entrepreneurs.
Countries with equal startup rates for women and men:Indonesia, Thailand, Panama, Qatar, Madagascar and Angola
South Africa, Morocco, Madagascar and Egypt.
In 2019, four African countries participated in the study:
In numbers, GEM is:
countries
measured entrepreneurship in and consulted with
experts.
analysed
observations
across
economies
Some of GEM's findings
1
SECTION 1
50Exploring the global contextOver the past twenty years, the GEM research consortium has tracked this evolution of entrepreneurship within countries, identifying the scale of its contributions to jobs and the economy, alongside strategies and policies to support new ventures or new business creations.
The GEM storyIn the two decades since its inception in 1999, the GEM has measured entrepreneurship in
114 countries, covering all geographic regions and all economic levels.
During this period, the annual GEM reports have gained widespread recognition as the
most informative and authoritative longitudinal study of entrepreneurship in the world.
GEM is a large-scale international research collaboration that measures entrepreneurship
and its associated characteristics in a manner that is consistent over both time and space.
This enables the rate and nature of entrepreneurship development to be monitored
by directly comparing different economies at a given point in time, and by tracing the
evolution of entrepreneurship within a given economy over a period of time.
The GEM consortium consists of national teams that each use the same precise research
methodology, sample design and survey tools to collect nationally representative data on
entrepreneurship.
Since 1999, GEM has cumulatively surveyed over 3 million adults across the globe. This
constitutes the world’s largest and most extensive study of entrepreneurial activity to date.
GEM’s research has made a significant contribution to the international understanding of
the entrepreneurial phenomenon, and to the development and monitoring of policies to
promote entrepreneurship.
GEM combines representative surveys conducted amongst each participating country’s
adult populations with data obtained from experts in entrepreneurship. The GEM
population data include more than 36 000 expert assessments of national framework
conditions (NFC) for entrepreneurship.22
Surveys are conducted annually by in-country teams who collect primary data through two
structured national surveys. The first survey, the Adult Population Survey (APS), is used
to interview a nationally representative sample of at least 2 000 respondents between the
ages of 18 and 64 years (henceforth simply referred to as “the adult population”).
22 Bosma, N. et al. (2020). GEM Global Report 2019/2020. Retrieved from http://www.gemconsortium.org/report
In 2019, fifty economies participated in GEM’s research, including four from Africa.
Section 1: Exploring the global contextSection 1: Exploring the global context
2
Igniting startups for economic growth and social change
In 2019, the average country sample size was just over 3 000.23
The second survey, the National Expert Survey (NES), is aimed
at understanding the country-specific contexts for enterprise
and is used to survey at least 36 carefully selected individuals
who have national expertise in entrepreneurship across a broad
range of categories, as outlined in this report.
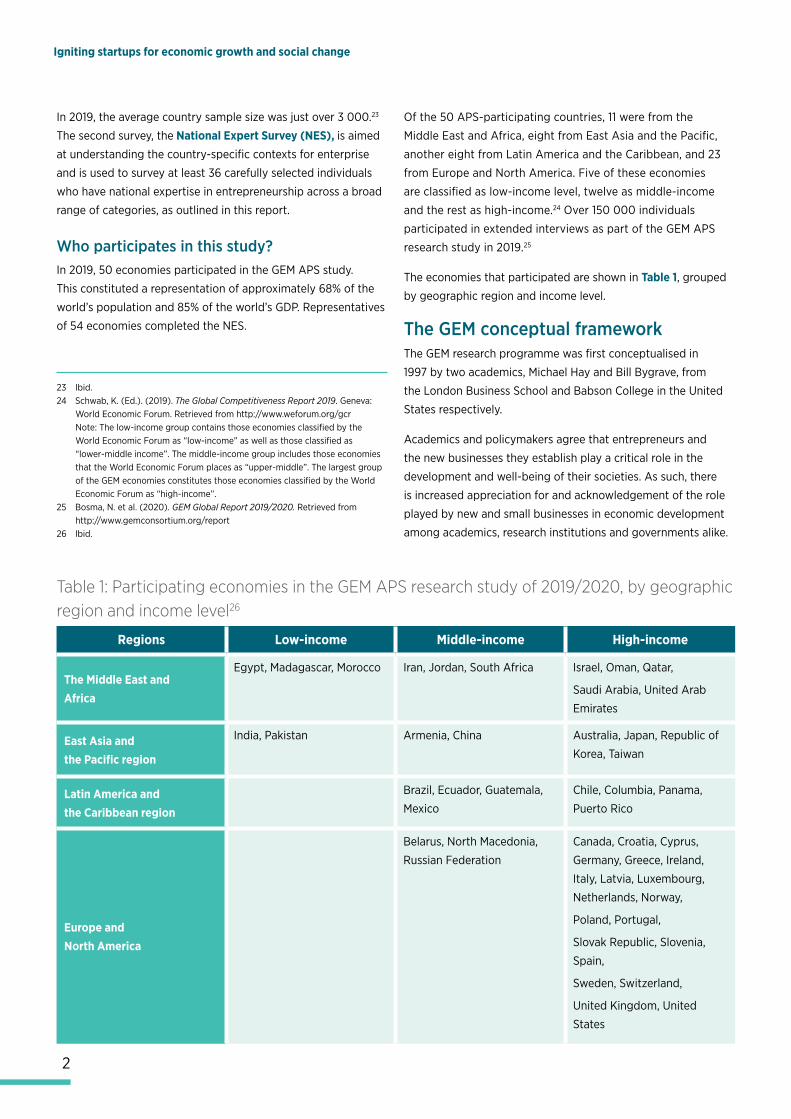
Who participates in this study?In 2019, 50 economies participated in the GEM APS study.
This constituted a representation of approximately 68% of the
world’s population and 85% of the world’s GDP. Representatives
of 54 economies completed the NES.
Of the 50 APS-participating countries, 11 were from the
Middle East and Africa, eight from East Asia and the Pacific,
another eight from Latin America and the Caribbean, and 23
from Europe and North America. Five of these economies
are classified as low-income level, twelve as middle-income
and the rest as high-income.24 Over 150 000 individuals
participated in extended interviews as part of the GEM APS
research study in 2019.25
The economies that participated are shown in Table 1, grouped
by geographic region and income level.
The GEM conceptual frameworkThe GEM research programme was first conceptualised in
1997 by two academics, Michael Hay and Bill Bygrave, from
the London Business School and Babson College in the United
States respectively.
Academics and policymakers agree that entrepreneurs and
the new businesses they establish play a critical role in the
development and well-being of their societies. As such, there
is increased appreciation for and acknowledgement of the role
played by new and small businesses in economic development
among academics, research institutions and governments alike.
23 Ibid.24 Schwab, K. (Ed.). (2019). The Global Competitiveness Report 2019. Geneva:
World Economic Forum. Retrieved from http://www.weforum.org/gcr Note: The low-income group contains those economies classified by the World Economic Forum as “low-income” as well as those classified as “lower-middle income”. The middle-income group includes those economies that the World Economic Forum places as “upper-middle”. The largest group of the GEM economies constitutes those economies classified by the World Economic Forum as “high-income”.
25 Bosma, N. et al. (2020). GEM Global Report 2019/2020. Retrieved from http://www.gemconsortium.org/report
26 Ibid.
Table 1: Participating economies in the GEM APS research study of 2019/2020, by geographic region and income level26
Regions Low-income Middle-income High-income
The Middle East andAfrica
Egypt, Madagascar, Morocco Iran, Jordan, South Africa Israel, Oman, Qatar,
Saudi Arabia, United Arab
Emirates
East Asia andthe Pacific region
India, Pakistan Armenia, China Australia, Japan, Republic of
Korea, Taiwan
Latin America and the Caribbean region
Brazil, Ecuador, Guatemala,
Mexico
Chile, Columbia, Panama,
Puerto Rico
Europe and North America
Belarus, North Macedonia,
Russian Federation
Canada, Croatia, Cyprus,
Germany, Greece, Ireland,
Italy, Latvia, Luxembourg,
Netherlands, Norway,
Poland, Portugal,
Slovak Republic, Slovenia,
Spain,
Sweden, Switzerland,
United Kingdom, United
States
Section 1: Exploring the global contextSection 1: Exploring the global context
The GEM research programme looks at how
enterprise creation and business development
contributes to economic growth.
The GEM research programme was
conceptualised recognising the
interdependency between entrepreneurship,
the specific country context and economic
development. The purpose was threefold:
• To uncover factors that encourage or
hinder entrepreneurial activity, especially
those related to societal values, personal
attributes and the entrepreneurship
ecosystem.
• To provide a platform for assessing the
extent to which entrepreneurial activity
influences economic growth within
individual economies.
• To identify policy implications for
entrepreneurship and ensure that they
enhance entrepreneurial capacity in the
given context.
GEM’s conceptual framework depicts the
multifaceted features of entrepreneurship,
recognising the proactive, innovative and risk-
responsive behaviour of individuals, always
in interaction with the environment. The
framework derives from the basic assumptions
that national economic growth is the result
of the personal capabilities of individuals to
identify and seize opportunities, and that this
process is affected by environmental factors
that influence individuals’ decisions whether or
not to pursue entrepreneurial initiatives.
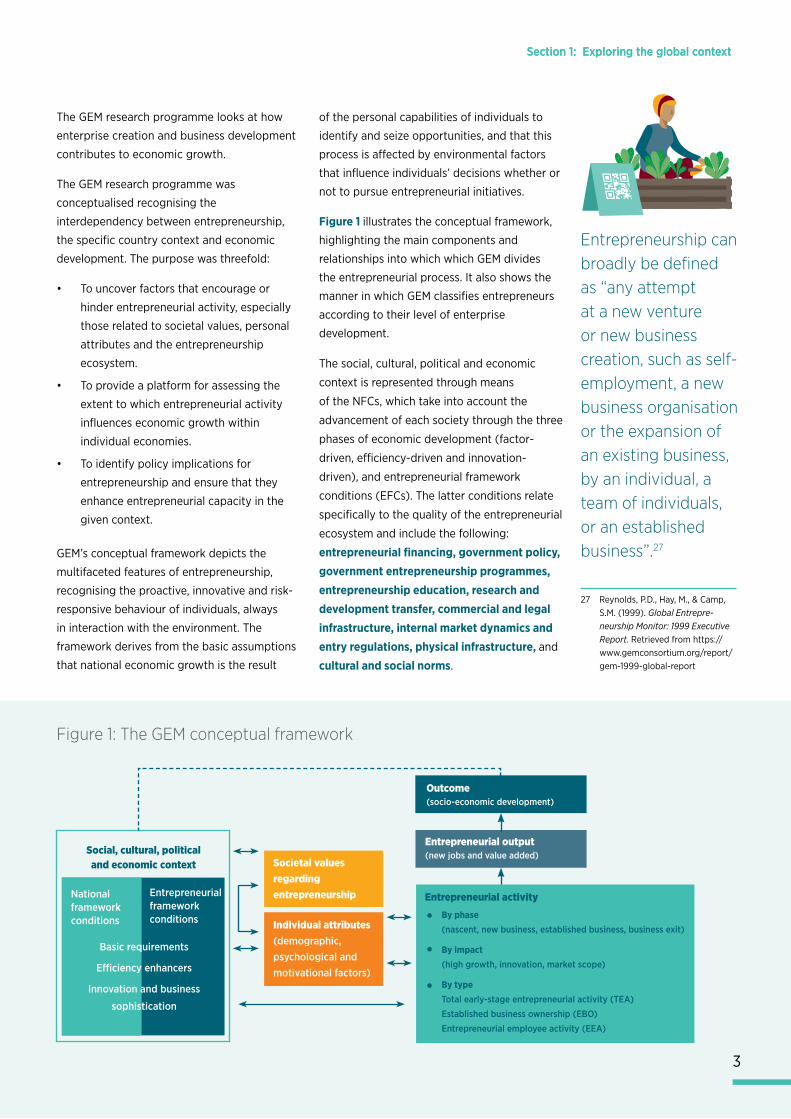
Figure 1 illustrates the conceptual framework,
highlighting the main components and
relationships into which which GEM divides
the entrepreneurial process. It also shows the
manner in which GEM classifies entrepreneurs
according to their level of enterprise
development.
The social, cultural, political and economic
context is represented through means
of the NFCs, which take into account the
advancement of each society through the three
phases of economic development (factor-
driven, efficiency-driven and innovation-
driven), and entrepreneurial framework
conditions (EFCs). The latter conditions relate
specifically to the quality of the entrepreneurial
ecosystem and include the following:
entrepreneurial financing, government policy, government entrepreneurship programmes, entrepreneurship education, research and development transfer, commercial and legal infrastructure, internal market dynamics and entry regulations, physical infrastructure, and
cultural and social norms.
Figure 1: The GEM conceptual framework
Social, cultural, political and economic context
National framework conditions
Entrepreneurial framework conditions
Basic requirements
Efficiency enhancers
Innovation and business
sophistication
Societal values regarding entrepreneurship
Individual attributes (demographic, psychological and motivational factors)
Outcome (socio-economic development)
Entrepreneurial output (new jobs and value added)
Entrepreneurial activity
By phase(nascent, new business, established business, business exit)
By impact(high growth, innovation, market scope)
By typeTotal early-stage entrepreneurial activity (TEA)
Established business ownership (EBO)
Entrepreneurial employee activity (EEA)
Entrepreneurship can broadly be defined as “any attempt at a new venture or new business creation, such as self-employment, a new business organisation or the expansion of an existing business, by an individual, a team of individuals, or an established business”.27
3
27 Reynolds, P.D., Hay, M., & Camp, S.M. (1999). Global Entrepre-neurship Monitor: 1999 Executive Report. Retrieved from https://www.gemconsortium.org/report/gem-1999-global-report
4
Igniting startups for economic growth and social change
As indicated in Figure 1, the framework recognises
that entrepreneurship is part of a complex feedback
system and it makes explicit the relationships that
exist between social values, personal attributes
and various forms of entrepreneurial activity. The
framework also recognises that entrepreneurship
can mediate the effect of the NFCs on employment
opportunities.
Entrepreneurial activity is thus understood as the
result of the interaction between an individual’s
perception of an opportunity, their capacity
(motivation and skills) to act upon this opportunity,
and the distinct conditions of the specific
environment in which they are located. Also, while
entrepreneurial activity is influenced by the NFCs of
the environment in question — that is, the ecosystem
in which it takes place — the activity ultimately also
benefits this environment through adding social
value and facilitating economic development.
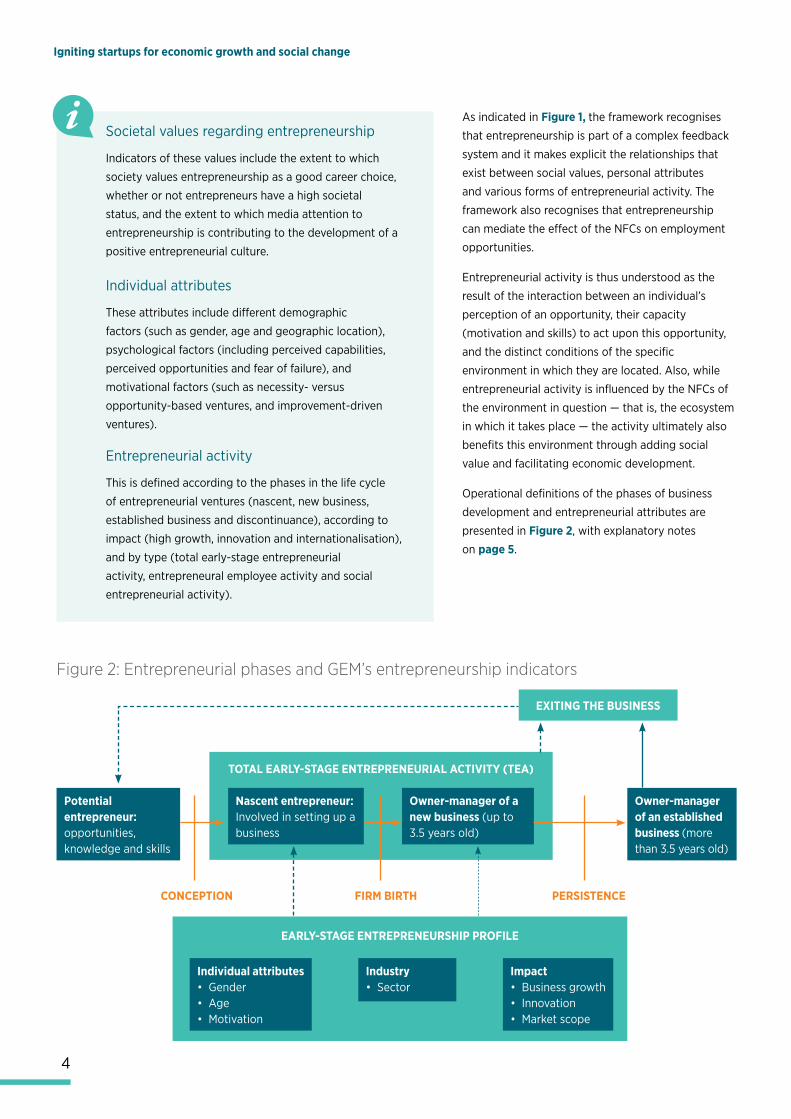
Operational definitions of the phases of business
development and entrepreneurial attributes are
presented in Figure 2, with explanatory notes
on page 5.
Societal values regarding entrepreneurship
Indicators of these values include the extent to which
society values entrepreneurship as a good career choice,
whether or not entrepreneurs have a high societal
status, and the extent to which media attention to
entrepreneurship is contributing to the development of a
positive entrepreneurial culture.
Individual attributes
These attributes include different demographic
factors (such as gender, age and geographic location),
psychological factors (including perceived capabilities,
perceived opportunities and fear of failure), and
motivational factors (such as necessity- versus
opportunity-based ventures, and improvement-driven
ventures).
Entrepreneurial activity
This is defined according to the phases in the life cycle
of entrepreneurial ventures (nascent, new business,
established business and discontinuance), according to
impact (high growth, innovation and internationalisation),
and by type (total early-stage entrepreneurial
activity, entrepreneural employee activity and social
entrepreneurial activity).
Figure 2: Entrepreneurial phases and GEM’s entrepreneurship indicators
EXITING THE BUSINESS
Potential entrepreneur: opportunities, knowledge and skills
Owner-manager of an established business (more than 3.5 years old)
CONCEPTION FIRM BIRTH PERSISTENCE
TOTAL EARLY-STAGE ENTREPRENEURIAL ACTIVITY (TEA)
Nascent entrepreneur: Involved in setting up a business
Owner-manager of a new business (up to 3.5 years old)
EARLY-STAGE ENTREPRENEURSHIP PROFILE
Individual attributes• Gender • Age • Motivation
Industry• Sector
Impact • Business growth• Innovation• Market scope
5
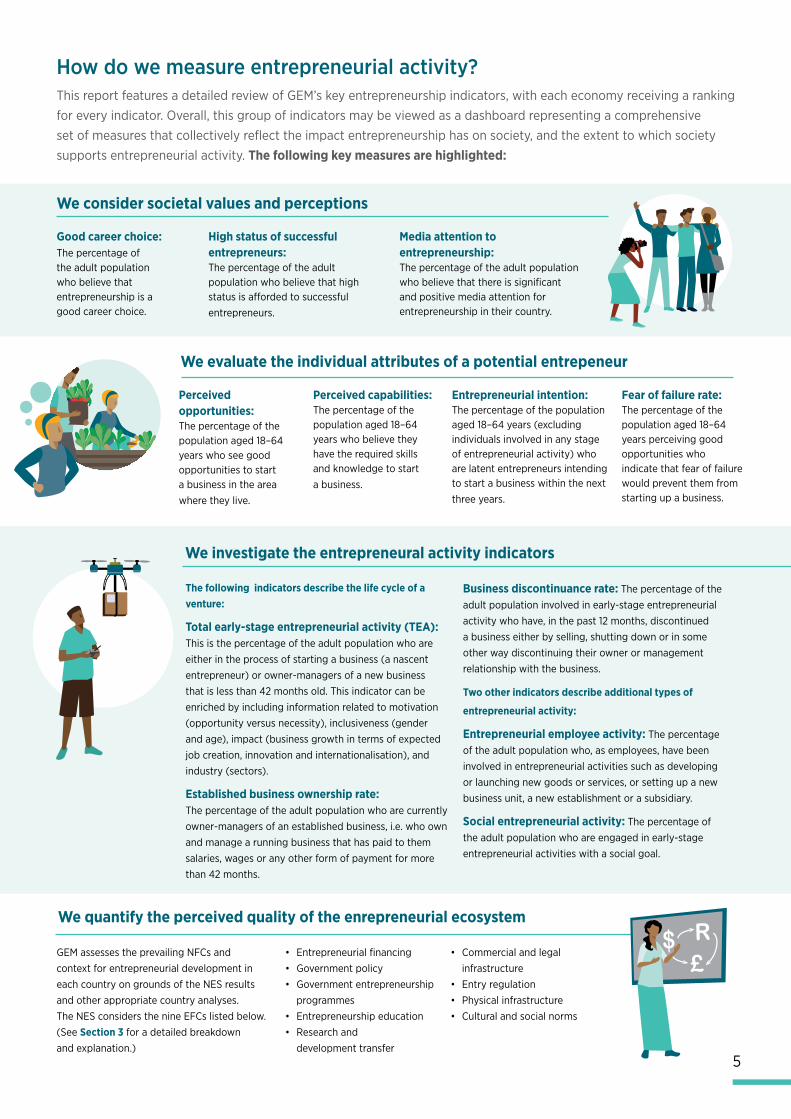
How do we measure entrepreneurial activity? This report features a detailed review of GEM’s key entrepreneurship indicators, with each economy receiving a ranking for every indicator. Overall, this group of indicators may be viewed as a dashboard representing a comprehensive set of measures that collectively reflect the impact entrepreneurship has on society, and the extent to which society supports entrepreneurial activity. The following key measures are highlighted:
We consider societal values and perceptions
Good career choice: The percentage of the adult population who believe that entrepreneurship is a good career choice.
We evaluate the individual attributes of a potential entrepeneur
Perceived opportunities: The percentage of the population aged 18–64 years who see good opportunities to start a business in the area where they live.
We investigate the entrepreneural activity indicators
We quantify the perceived quality of the enrepreneurial ecosystem
GEM assesses the prevailing NFCs and context for entrepreneurial development in each country on grounds of the NES results and other appropriate country analyses. The NES considers the nine EFCs listed below. (See Section 3 for a detailed breakdown and explanation.)
The following indicators describe the life cycle of a venture:
Total early-stage entrepreneurial activity (TEA): This is the percentage of the adult population who are either in the process of starting a business (a nascent entrepreneur) or owner-managers of a new business that is less than 42 months old. This indicator can be enriched by including information related to motivation (opportunity versus necessity), inclusiveness (gender and age), impact (business growth in terms of expected job creation, innovation and internationalisation), and industry (sectors).
Established business ownership rate: The percentage of the adult population who are currently owner-managers of an established business, i.e. who own and manage a running business that has paid to them salaries, wages or any other form of payment for more than 42 months.
High status of successful entrepreneurs: The percentage of the adult population who believe that high status is afforded to successful entrepreneurs.
Media attention to entrepreneurship: The percentage of the adult population who believe that there is significant and positive media attention for entrepreneurship in their country.
Perceived capabilities: The percentage of the population aged 18–64 years who believe they have the required skills and knowledge to start a business.
Entrepreneurial intention: The percentage of the population aged 18–64 years (excluding individuals involved in any stage of entrepreneurial activity) who are latent entrepreneurs intending to start a business within the next three years.
Fear of failure rate: The percentage of the population aged 18–64 years perceiving good opportunities who indicate that fear of failure would prevent them from starting up a business.
Business discontinuance rate: The percentage of the adult population involved in early-stage entrepreneurial activity who have, in the past 12 months, discontinued a business either by selling, shutting down or in some other way discontinuing their owner or management relationship with the business.
Two other indicators describe additional types of
entrepreneurial activity:
Entrepreneurial employee activity: The percentage of the adult population who, as employees, have been involved in entrepreneurial activities such as developing or launching new goods or services, or setting up a new business unit, a new establishment or a subsidiary.
Social entrepreneurial activity: The percentage of the adult population who are engaged in early-stage entrepreneurial activities with a social goal.
• Entrepreneurial financing• Government policy• Government entrepreneurship
programmes• Entrepreneurship education• Research and
development transfer
• Commercial and legal infrastructure
• Entry regulation• Physical infrastructure• Cultural and social norms
Section 1: Exploring the global context
6
Igniting startups for economic growth and social change
The GEM methodology GEM data are obtained using a research design that is
harmonised across all participating countries. The data are
gathered on an annual basis from two main sources. The key
entrepreneurship indicators are measured in the APS and the
NES.
The APS provides detailed information about entrepreneurial activity in a given economy. This activity does not, however, take place in isolation, but within an economic, social and political context that may either encourage and support or discourage and constrain entrepreneurial activity. To delineate and understand the country-specific context for enterprise, the APS is complemented by the NES, which is used to survey carefully selected individuals who were identified as having specific
national expertise and knowledge.
About the Adult Population Survey (APS)Academic teams in each participating economy administer and oversee this survey. The APS is conducted at the same time every year (between May and July), using a standardised questionnaire provided by the GEM global data team. The questionnaire is translated into local languages and back-translated for the purposes of a validity check.
In 2019, Nielsen South Africa was retained as the accredited vendor for conducting the APS in South Africa. The research involved 3 300 face-to-face interviews with a random selection of members of the adult population in both rural and urban areas, and across demographics.
The interviews were conducted in respondents’ homes and in the preferred language of the relevant respondent, using a structured questionnaire. Households were selected using Nielsen’s computerised household register of close to 6 million addresses in urban areas, and from maps in the case of rural sampling. The sample was stratified by race (within race, by gender) and by region (within region, by community size).
The individual countries only gain access to the data once the GEM global data team experts have analysed the raw data for the purposes of quality assurance and have checked the uniformity of statistical calculations. Because the GEM research design harmonises the data, it is possible to conduct reliable
cross-national and intra-country comparisons over time.
About the National Experts Survey (NES)The results of this survey provide information on the local
context faced by startup entrepreneurs. It is used to gather
information around the nine EFCs. NES data are collected by
interviewing experts that were identified by the in-country
teams. Interviews are offered in a face-to-face, telephonic or
electronic format.
Experts are chosen for their depth of experience, seniority
within organisations, areas of specialisation and affiliation. In
some instances, the head of an institution suggests individuals
they consider best positioned to provide the necessary insights
for this research project.
About the expert interviews
To ensure the construction of a balanced and representative sample of experts, GEM has set a list of three criteria that must be met in their selection:
• At least four experts from each of the EFC categories must be interviewed, translating to a minimum total of 36 experts per country.
• A minimum of 25% of these experts must be entrepreneurs or business people, and 50% must be professionals.
• Additional criteria such as geographical distribution, race, gender, involvement in the public versus private sector, and level of experience are to be taken into account when
balancing the sample.
About the National Entrepreneurship Context Index (NECI)The first step in the formulation of a NES composite index was to review the recent literature on composite indices, exploring the different aspects and selecting the ones most relevant for this purpose.
It was important to solve two critical questions. The first centred on what weights could be used to measure the influence of each variable on the output. The second was how the weights can be assigned to reflect the desired importance of the relevant variable.
These questions were derived from the 36 key informants’ levels of agreement with the designated framework conditions, as measured on a ten-point Likert scale. The experts also evaluated the importance scores for each statement in the index representing the extent each condition plays a key role in stimulating and supporting entrepreneurship in their country in a particular year.
The name chosen for this index is the “National Entrepreneurial Context Index” (NECI). The index is calculated based upon a typical weighted average model.
S1 to S12 are the summaries applied to each block in the NES, from finance for entrepreneurs (S1) to social and cultural norms (S12). W1 to W12 represent the weights of these variables in terms of the importance that expert key informants apply to the 12 framework conditions.
Each expert’s ratings of the statements (re-scaled to ten points) are multiplied by their importance values. The results for all statements on each framework condition are then summed
Section 1: Exploring the global context
7
and divided by the sum of the importance values to generate an individual weighted score. These scores are then averaged over all experts to arrive at a NECI value for each framework condition. This index was first considered in the GEM 2018/2019 Global Report.28
The NECI intends to fill the gap in the entrepreneurship literature by providing a single composite number that can express the average state and quality of the entrepreneurial ecosystem in any one country and compare it to other countries.
The advantage of this overall ranking is that participating countries have comparative benchmarks and information.
This provides answers to critical questions such as:
• What are the conditions that need to be prioritised for improvement? (This is particularly important in developing countries.)
• How does a given country compare to other countries of similar development and income levels and what lessons can be learned from that country?
However, before normalisation, the maximum attainable value of NECI is nine points and the minimum one. The value can, however, be normalised on a scale of 10 using the following formula:
Interpreting the NECI results
NECI normalised = NECI value x 10
9
0–3
The state of the EFC is of very low quality and needs serious review.
3–5
The state of the EFC is low and the main conditions need to be reviewed.
7–10
The state of the EFC is good, even excellent if the score is 8 points or higher.
5–7
The state of the EFC is reasonable, but policymakers need to look at those parts that are low and in need of intervention.
What makes GEM unique?
We map the entrepreneurial pipeline
A key difference between GEM and most other quantitative entrepreneurial research is GEM’s focus on people. Available data on companies and enterprises mostly cover the number and size of businesses, new business registrations and closures, and company revenues and profits.
GEM is one of the few studies in the world that includes primary research on individuals and their entrepreneurial aspirations, perceptions, intentions and business profiles. This creates a unique profile of entrepreneurship in a given society. The importance of this profile lies in the fact that it is the attitudes, activities and ambitions of people (together with societal perceptions and norms) that drive national entrepreneurial culture and the entrepreneurial process – from identifying new opportunities, to setting up a new business, to managing an established enterprise.29
Surveying individuals can also help to capture information on the informal economy, i.e. the diverse set of economic activities, enterprises and jobs that are neither regulated nor protected by the state. Some individuals who report to be working for themselves may not necessarily have a registered business, but are simply taking advantage of trading opportunities
as and when they arise.30 This informal activity is obviously not captured by official statistics, but may be a significant contributor to the national economy.31
GEM sees entrepreneurial activity as a continuous process rather than as individual events. For this reason, the APS is designed for the measurement and assessment of individual participation across the range of phases comprising entrepreneurial activity: potential entrepreneurship, entrepreneurial intentions, nascent and new business activity, progression into established business ownership, and business discontinuance.
This process can be viewed as a pipeline, where people participating in each phase form the base for potential advancement to the next phase.
28 Bosma, N., & Kelley, D. (2019). Global Entrepreneurship Monitor 2018/2019 Global Report. Retrieved from https://www.gemconsortium.org/report/gem-2018-2019-global-report
29 Bosma, N. et al. (2020). GEM Global Report 2019/2020. Retrieved from http://www.gemconsortium.org/report
30 Ibid.31 A recent (October 2019) International Labour Organisation report estimated
that the informal sector constituted up to 60% of total employment across the 99 countries sampled (cf. Small Matters: Global Evidence on the Contribution to Employment by the Self-employed, Micro-enterprises and SMEs. (2019). Geneva: International Labour Organisation). Society loses out when informal businesses do not pay taxes or comply with labour laws.
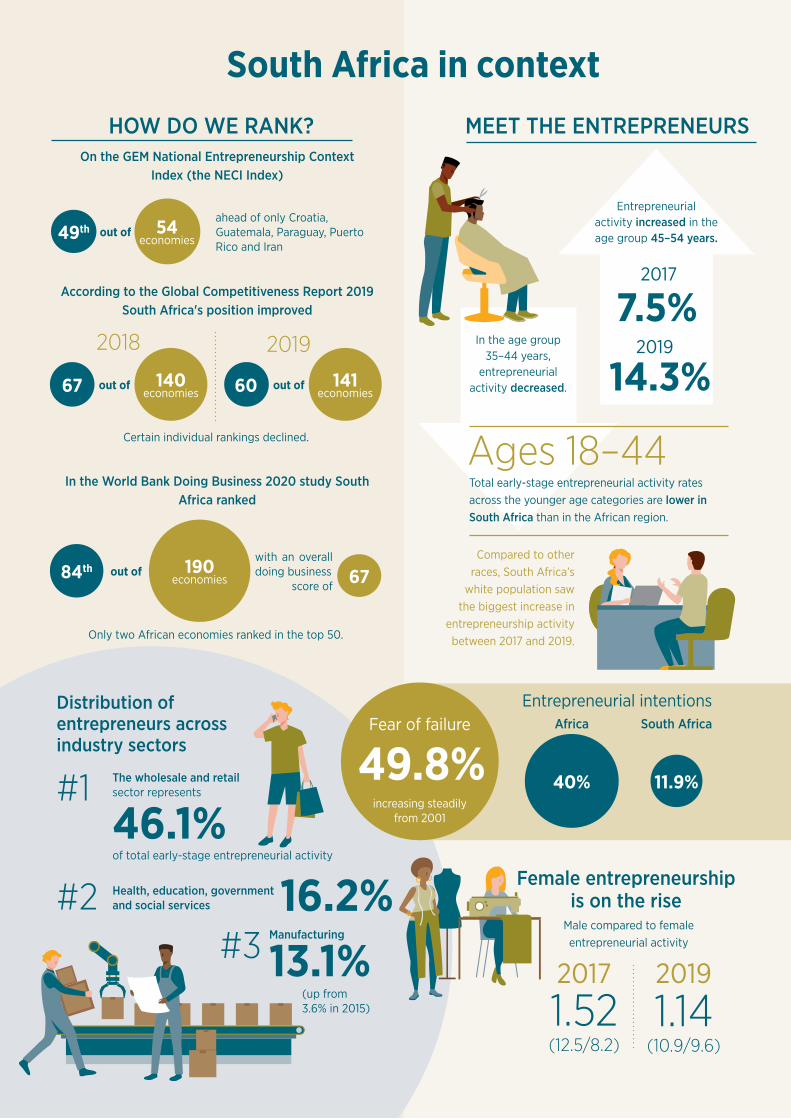
8
Igniting startups for economic growth and social change
HOW DO WE RANK?On the GEM National Entrepreneurship Context
Index (the NECI Index)
with an overall doing business
score of
ahead of only Croatia, Guatemala, Paraguay, Puerto Rico and Iran
49th 54economies
out of
Certain individual rankings declined.
2018 2019
67 140economies
out of 60 141economies
out of
84th 190economies
out of
In the World Bank Doing Business 2020 study South Africa ranked
Only two African economies ranked in the top 50.
67
MEET THE ENTREPRENEURS
7.5%
Entrepreneurial activity increased in the age group 45–54 years.
2017
14.3%2019In the age group
35–44 years, entrepreneurial
activity decreased.
Total early-stage entrepreneurial activity ratesacross the younger age categories are lower in South Africa than in the African region.
Ages 18–44
1.52 (12.5/8.2)
2017
1.14 (10.9/9.6)
2019
Female entrepreneurship is on the rise
Male compared to female entrepreneurial activity
Compared to other races, South Africa’s
white population saw the biggest increase in
entrepreneurship activity between 2017 and 2019.
49.8%Fear of failure
increasing steadily from 2001
40%
Entrepreneurial intentions
11.9%
Africa South AfricaDistribution of entrepreneurs across industry sectors
46.1%The wholesale and retail sector represents
of total early-stage entrepreneurial activity
#1
#2 Health, education, government and social services 16.2%
Manufacturing
13.1%(up from 3.6% in 2015)
South Africa in context
According to the Global Competitiveness Report 2019 South Africa's position improved
#3

SECTION 2
Mapping entrepreneurship in South AfricaThere is a clear need to define and reflect on the current entrepreneurial landscape in South Africa. In this section, we explore everything from societal attitudes and self-perceptions regarding entrepreneurship to how the age and gender of entrepreneurs influence startups. What will it take to unleash more entrepreneurs in society? And once this force awakens, how will we support them?
9
Overall, the African region scores high on the societal values dimension, and the factors driving these scores are likely to include others than media attention alone.
In this report, the GEM team considers South Africa’s entrepreneurial behaviour over
several years, with a particular focus on the changes that have occurred in the last 12
months. The latter reflect and define the current entrepreneurial landscape in the country.
This longitudinal view highlights trends in entrepreneurial activity, thereby assisting
stakeholders, including policymakers, in making more informed decisions about how best
to support and drive entrepreneurship, and enhance SMME development.
What shapes entrepreneurship in South Africa?
Societal values regarding entrepreneurshipSocietal attitudes and perceptions play a central role in shaping the entrepreneurship
ecosystem and the national entrepreneurial culture. This is because entrepreneurial
activities are leveraged by people living in specific cultural and social conditions.The
positive or negative perceptions that a given society has about entrepreneurship have
a direct influence on the entrepreneurial ambitions and influence the extent to which
entrepreneurial activity is supported.
The GEM research assesses whether people think that entrepreneurship is a good
career choice, whether entrepreneurs are believed to have a high status, and whether
entrepreneurs garner significant levels of positive media attention.
Table 2: Societal attitudes regarding entrepreneurship in South Africa in 2003–2019 (as percentage of adult population)
High status attributed to successful entrepreneurs
Considered a good career choice
Sufficient media attention given to entrepreneurship
*Read as “48% of South African adults in 2003 regarded entrepreneurship as a good career choice”.**The African region includes a limited sample of four countries: Egypt, Madagascar, Morocco and South Africa.
48.0*48,047,5
55,256,054,4
64,662,269,2
77,577,678,6
69,672,972,6
72,678,174,2
69,474,972,7
78.882.280.6
83,779,369,6
100%
80%
60%
40%
20%
0%2003 2005 2008 2011 2014 2016 2017 2019 African region
2019 (average)**
78%The percentage of individuals surveyed in 2019 who see entrepreneurship as a good career choice (compared to 69,4% of people surveyed in 2017).

Section 2: Mapping entrepreneurship in South Africa
10
Igniting startups for economic growth and social change
As can be seen from Table 2, societal values regarding
entrepreneurship in South Africa show a very positive upward
trend over the period 2003–2019. Specifically, there has been
an encouraging increase from 2017 to 2019 in the number
of individuals who see entrepreneurship as a good career
choice (from 69.4% in 2017 to 78.8% in 2019) and consider
entrepreneurship a career with high status (from 74.9% in 2017
to 82.2% in 2019).
This may partially be attributed to the significant increase in
media attention (from 72.7% in 2017 to 80.6% in 2019) given
to entrepreneurship. Media attention plays a vital role in
positioning entrepreneurship as a good alternative to finding
employment elsewhere.
Self-perceptions and intentionsThe GEM conceptual framework (Figure 1) considers both
perceptions of good opportunities for starting a business and
views on having the required skills to successfully engage with
these opportunities.
Views, perceptions and startupsOpportunities (or the perception of good opportunities) play
an important role in determining whether an individual would
even consider starting a business. The number and quality
of the opportunities that people perceive to exist, and their
beliefs about their own capabilities, are influenced by external factors in their environment, such as the prevailing economic
conditions, levels and types of education, and the national
entrepreneurial culture.
Another consideration to take into account in interpreting the
self-perceptions of entrepreneurs is the fear of failure. This fear
is influenced by intrinsic personality traits, societal norms and
the prevailing regulatory environment. In some countries, for
example, the legal and social ramifications of business failure
may act as a strong deterrent, thereby reducing the pool of
potential entrepreneurs.
Table 2 shows a substantial increase of 40% (from 43.2% in 2017
to 60.4% in 2019) in the number of individuals who perceive
that there are good entrepreneurial opportunities in South
Africa and, importantly, believe that they have the skills and
capabilities necessary to start a business venture.
However, fear of failure is high at 49.8%, shows an upward
trend from 2001 and has increased significantly from 2017.
This factor is likely a key deterrent for individuals to actually
start a business. This is borne out by the static movement,
between 2003 and 2019, in the percentage of individuals who
actually intend to start a business, as is evident in Table 3 (on
entrepreneurial intention).
Total early-stage entrepreneurial activity (TEA)A central GEM indicator is the TEA in a country as mentioned
earlier. This indicator measures individuals who are participating
in either the two initial processes of the entrepreneurial cycle,
i.e. nascent entrepreneurs who have committed resources to
starting a business but have not yet paid salaries or wages for
more than three months; and new business owners who have
Entrepreneurial activity
This is the percentage of the population aged 18–64 years
(excluding individuals involved in any stage of entrepreneurial
activity) who are latent entrepreneurs intending to start a
business within the next three years.
Potential entrepreneurs see good opportunities for starting
a business, and believe that they have the necessary skills,
knowledge and experience to do so. However, this does
not necessarily lead to intentions or to starting a business.
Individuals assess the opportunity and the costs, risks and
rewards of starting a business against other employment
preferences and options if these are indeed available.
Also, they identify potential opportunities under the
assumption that the context is one of an enabling, supportive
entrepreneurial ecosystem in the context of an enabling and
supportive entrepreneurial ecosystem.
This perception is vital as individuals are not likely to start a business if they think they do not have the skills necessary to be successful. A similar pattern is observed in the African region results.
In the African region in 2019, entrepreneurial intentions were more than three times higher at 40% than in South Africa (11.9%).
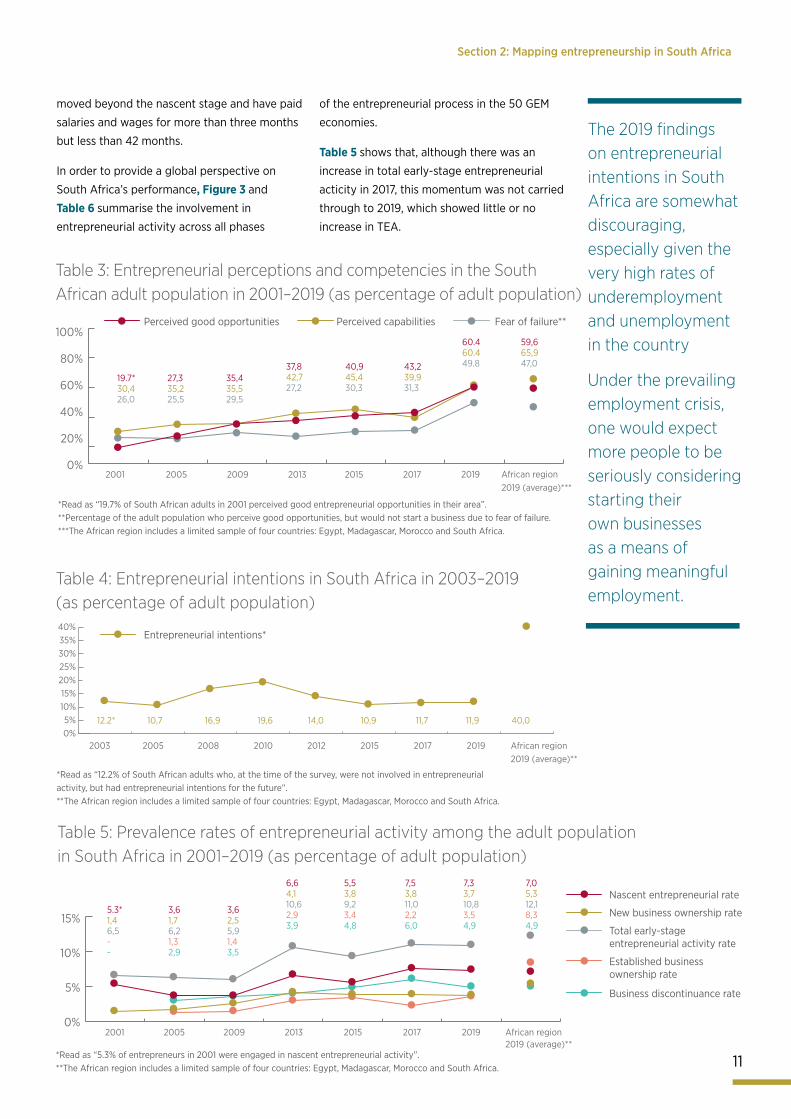
11
Section 2: Mapping entrepreneurship in South Africa
moved beyond the nascent stage and have paid
salaries and wages for more than three months
but less than 42 months.
In order to provide a global perspective on
South Africa’s performance, Figure 3 and
Table 6 summarise the involvement in
entrepreneurial activity across all phases
of the entrepreneurial process in the 50 GEM
economies.
Table 5 shows that, although there was an
increase in total early-stage entrepreneurial
acticity in 2017, this momentum was not carried
through to 2019, which showed little or no
increase in TEA.
Table 3: Entrepreneurial perceptions and competencies in the South African adult population in 2001–2019 (as percentage of adult population)
The 2019 findings on entrepreneurial intentions in South Africa are somewhat discouraging, especially given the very high rates of underemployment and unemployment in the country
Under the prevailing employment crisis, one would expect more people to be seriously considering starting their own businesses as a means of gaining meaningful employment.
Table 5: Prevalence rates of entrepreneurial activity among the adult population in South Africa in 2001–2019 (as percentage of adult population)
New business ownership rate
Nascent entrepreneurial rate
Total early-stage entrepreneurial activity rate
Business discontinuance rate
Established business ownership rate
5.3*1,46,5--
3,61,76,21,32,9
3,62,55,91,43,5
6,64,110,62,93,9
5,53,89,23,44,8
7,53,811,02,26,0
7,33,710,83,54,9
7,05,312,18,34,9
*Read as “5.3% of entrepreneurs in 2001 were engaged in nascent entrepreneurial activity”.**The African region includes a limited sample of four countries: Egypt, Madagascar, Morocco and South Africa.
2001 2005 2009 2013 2015 2017 2019 African region 2019 (average)**
15%
10%
5%
0%
Table 4: Entrepreneurial intentions in South Africa in 2003–2019 (as percentage of adult population)
*Read as “12.2% of South African adults who, at the time of the survey, were not involved in entrepreneurial activity, but had entrepreneurial intentions for the future”.**The African region includes a limited sample of four countries: Egypt, Madagascar, Morocco and South Africa.
Entrepreneurial intentions*
12.2* 10,7 16,9 19,6 14,0 10,9 11,7 11,9 40,0
40%35%30%25%20%15%10%5%0%
2003 2005 2008 2010 2012 2015 2017 2019 African region2019 (average)**
Perceived capabilitiesPerceived good opportunities Fear of failure**
*Read as “19.7% of South African adults in 2001 perceived good entrepreneurial opportunities in their area”.**Percentage of the adult population who perceive good opportunities, but would not start a business due to fear of failure.***The African region includes a limited sample of four countries: Egypt, Madagascar, Morocco and South Africa.
19.7*30,426,0
27,335,225,5
35,435,529,5
40,945,430,3
43,239,931,3
60.460.449.8
59,665,947,037,8
42,727,2
100%
80%
60%
40%
20%
0%2001 2005 2009 2013 2015 2017 2019 African region
2019 (average)***
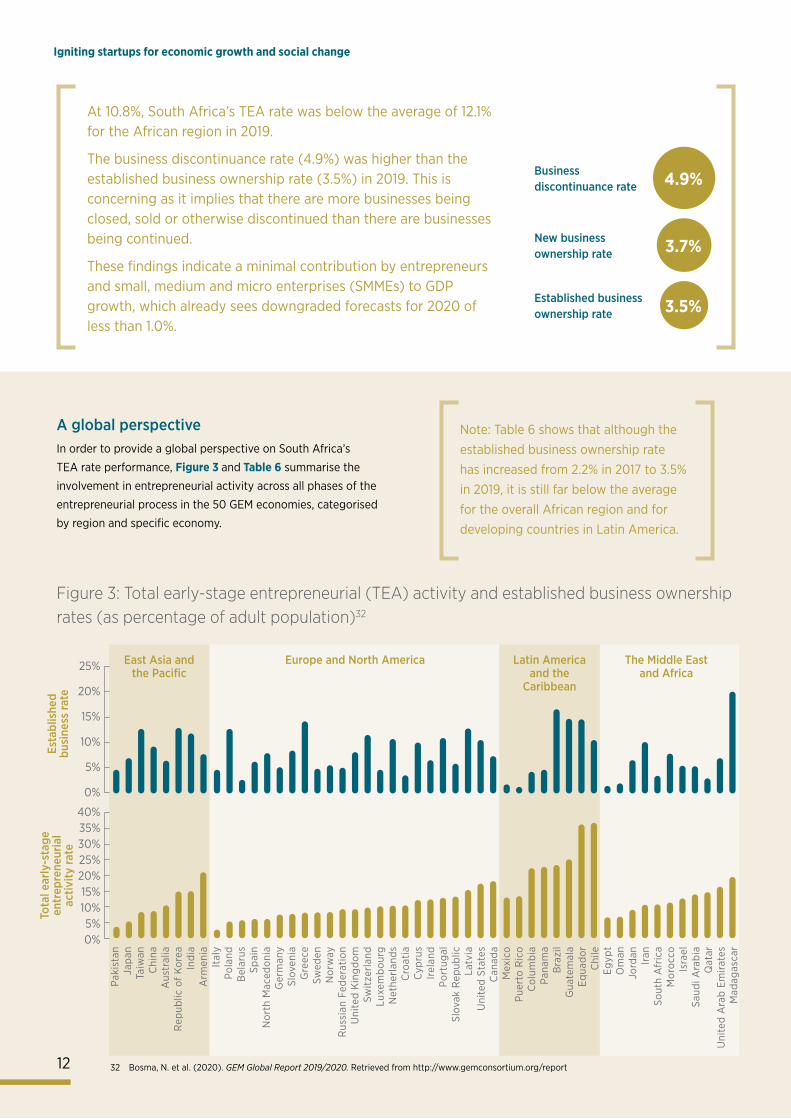
Section 2: Mapping entrepreneurship in South Africa Igniting startups for economic growth and social change
A global perspectiveIn order to provide a global perspective on South Africa’s
TEA rate performance, Figure 3 and Table 6 summarise the
involvement in entrepreneurial activity across all phases of the
entrepreneurial process in the 50 GEM economies, categorised
by region and specific economy.
Note: Table 6 shows that although the established business ownership rate has increased from 2.2% in 2017 to 3.5% in 2019, it is still far below the average for the overall African region and for developing countries in Latin America.
Figure 3: Total early-stage entrepreneurial (TEA) activity and established business ownership rates (as percentage of adult population)32
At 10.8%, South Africa’s TEA rate was below the average of 12.1% for the African region in 2019.
The business discontinuance rate (4.9%) was higher than the established business ownership rate (3.5%) in 2019. This is concerning as it implies that there are more businesses being closed, sold or otherwise discontinued than there are businesses being continued.
These findings indicate a minimal contribution by entrepreneurs and small, medium and micro enterprises (SMMEs) to GDP growth, which already sees downgraded forecasts for 2020 of less than 1.0%.
New business ownership rate
Business discontinuance rate
Established business ownership rate
4.9%
3.5%
3.7%
Paki
stan
Japa
nTa
iwan
Chi
naA
ustr
alia
Rep
ublic
of
Kor
eaIn
dia
Arm
enia
Ital
yPo
land
Bel
arus
Spai
nN
orth
Mac
edon
iaG
erm
any
Slov
enia
Gre
ece
Swed
enN
orw
ayR
ussi
an F
eder
atio
nU
nite
d K
ingd
omSw
itze
rlan
dLu
xem
bour
gN
ethe
rlan
dsC
roat
iaC
ypru
sIr
elan
dPo
rtug
alSl
ovak
Rep
ublic
Latv
iaU
nite
d St
ates
Can
ada
Mex
ico
Puer
to R
ico
Col
umbi
aPa
nam
aB
razi
lG
uate
mal
aEq
uado
rC
hile
Egyp
tO
man
Jord
anIr
anSo
uth
Afr
ica
Mor
occo
Isra
elSa
udi A
rabi
aQ
atar
Uni
ted
Ara
b Em
irat
esM
adag
asca
r
East Asia and the Pacific
Europe and North America Latin America and the
Caribbean
The Middle East and Africa
Tota
l ear
ly-s
tage
en
trep
rene
uria
l ac
tivity
rate
Esta
blis
hed
busi
ness
rate
25%
20%
15%
10%
5%
0%
40%35%30%25%20%15%10%5%0%
32 Bosma, N. et al. (2020). GEM Global Report 2019/2020. Retrieved from http://www.gemconsortium.org/report12
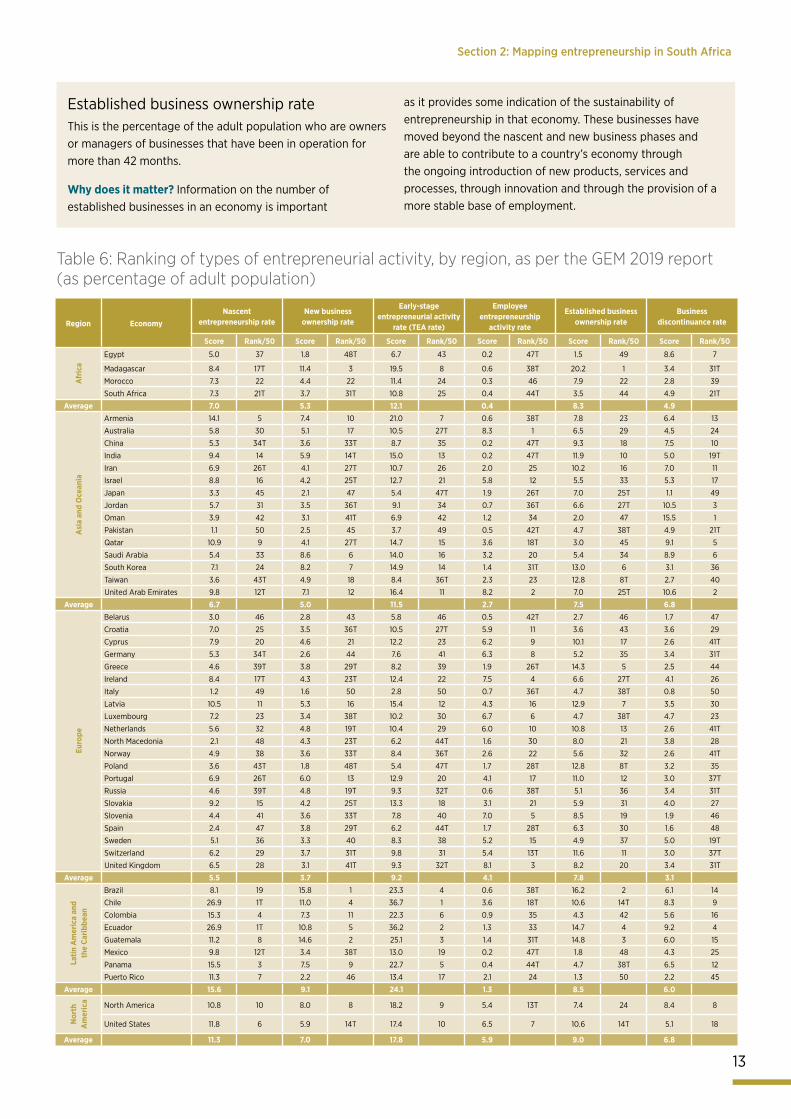
Section 2: Mapping entrepreneurship in South Africa
13
Table 6: Ranking of types of entrepreneurial activity, by region, as per the GEM 2019 report(as percentage of adult population)
Region EconomyNascent
entrepreneurship rateNew business
ownership rate
Early-stage entrepreneurial activity
rate (TEA rate)
Employee entrepreneurship
activity rate
Established business ownership rate
Business discontinuance rate
Score Rank/50 Score Rank/50 Score Rank/50 Score Rank/50 Score Rank/50 Score Rank/50
Afr
ica
Egypt 5.0 37 1.8 48T 6.7 43 0.2 47T 1.5 49 8.6 7
Madagascar 8.4 17T 11.4 3 19.5 8 0.6 38T 20.2 1 3.4 31T
Morocco 7.3 22 4.4 22 11.4 24 0.3 46 7.9 22 2.8 39
South Africa 7.3 21T 3.7 31T 10.8 25 0.4 44T 3.5 44 4.9 21T
Average 7.0 5.3 12.1 0.4 8.3 4.9
Asi
a an
d O
cean
ia
Armenia 14.1 5 7.4 10 21.0 7 0.6 38T 7.8 23 6.4 13
Australia 5.8 30 5.1 17 10.5 27T 8.3 1 6.5 29 4.5 24
China 5.3 34T 3.6 33T 8.7 35 0.2 47T 9.3 18 7.5 10
India 9.4 14 5.9 14T 15.0 13 0.2 47T 11.9 10 5.0 19T
Iran 6.9 26T 4.1 27T 10.7 26 2.0 25 10.2 16 7.0 11
Israel 8.8 16 4.2 25T 12.7 21 5.8 12 5.5 33 5.3 17
Japan 3.3 45 2.1 47 5.4 47T 1.9 26T 7.0 25T 1.1 49
Jordan 5.7 31 3.5 36T 9.1 34 0.7 36T 6.6 27T 10.5 3
Oman 3.9 42 3.1 41T 6.9 42 1.2 34 2.0 47 15.5 1
Pakistan 1.1 50 2.5 45 3.7 49 0.5 42T 4.7 38T 4.9 21T
Qatar 10.9 9 4.1 27T 14.7 15 3.6 18T 3.0 45 9.1 5
Saudi Arabia 5.4 33 8.6 6 14.0 16 3.2 20 5.4 34 8.9 6
South Korea 7.1 24 8.2 7 14.9 14 1.4 31T 13.0 6 3.1 36
Taiwan 3.6 43T 4.9 18 8.4 36T 2.3 23 12.8 8T 2.7 40
United Arab Emirates 9.8 12T 7.1 12 16.4 11 8.2 2 7.0 25T 10.6 2
Average 6.7 5.0 11.5 2.7 7.5 6.8
Euro
pe
Belarus 3.0 46 2.8 43 5.8 46 0.5 42T 2.7 46 1.7 47
Croatia 7.0 25 3.5 36T 10.5 27T 5.9 11 3.6 43 3.6 29
Cyprus 7.9 20 4.6 21 12.2 23 6.2 9 10.1 17 2.6 41T
Germany 5.3 34T 2.6 44 7.6 41 6.3 8 5.2 35 3.4 31T
Greece 4.6 39T 3.8 29T 8.2 39 1.9 26T 14.3 5 2.5 44
Ireland 8.4 17T 4.3 23T 12.4 22 7.5 4 6.6 27T 4.1 26
Italy 1.2 49 1.6 50 2.8 50 0.7 36T 4.7 38T 0.8 50
Latvia 10.5 11 5.3 16 15.4 12 4.3 16 12.9 7 3.5 30
Luxembourg 7.2 23 3.4 38T 10.2 30 6.7 6 4.7 38T 4.7 23
Netherlands 5.6 32 4.8 19T 10.4 29 6.0 10 10.8 13 2.6 41T
North Macedonia 2.1 48 4.3 23T 6.2 44T 1.6 30 8.0 21 3.8 28
Norway 4.9 38 3.6 33T 8.4 36T 2.6 22 5.6 32 2.6 41T
Poland 3.6 43T 1.8 48T 5.4 47T 1.7 28T 12.8 8T 3.2 35
Portugal 6.9 26T 6.0 13 12.9 20 4.1 17 11.0 12 3.0 37T
Russia 4.6 39T 4.8 19T 9.3 32T 0.6 38T 5.1 36 3.4 31T
Slovakia 9.2 15 4.2 25T 13.3 18 3.1 21 5.9 31 4.0 27
Slovenia 4.4 41 3.6 33T 7.8 40 7.0 5 8.5 19 1.9 46
Spain 2.4 47 3.8 29T 6.2 44T 1.7 28T 6.3 30 1.6 48
Sweden 5.1 36 3.3 40 8.3 38 5.2 15 4.9 37 5.0 19T
Switzerland 6.2 29 3.7 31T 9.8 31 5.4 13T 11.6 11 3.0 37T
United Kingdom 6.5 28 3.1 41T 9.3 32T 8.1 3 8.2 20 3.4 31T
Average 5.5 3.7 9.2 4.1 7.8 3.1
Latin
Am
eric
a an
d th
e Ca
ribbe
an
Brazil 8.1 19 15.8 1 23.3 4 0.6 38T 16.2 2 6.1 14
Chile 26.9 1T 11.0 4 36.7 1 3.6 18T 10.6 14T 8.3 9
Colombia 15.3 4 7.3 11 22.3 6 0.9 35 4.3 42 5.6 16
Ecuador 26.9 1T 10.8 5 36.2 2 1.3 33 14.7 4 9.2 4
Guatemala 11.2 8 14.6 2 25.1 3 1.4 31T 14.8 3 6.0 15
Mexico 9.8 12T 3.4 38T 13.0 19 0.2 47T 1.8 48 4.3 25
Panama 15.5 3 7.5 9 22.7 5 0.4 44T 4.7 38T 6.5 12
Puerto Rico 11.3 7 2.2 46 13.4 17 2.1 24 1.3 50 2.2 45
Average 15.6 9.1 24.1 1.3 8.5 6.0
Nor
th
Am
eric
a North America 10.8 10 8.0 8 18.2 9 5.4 13T 7.4 24 8.4 8
United States 11.8 6 5.9 14T 17.4 10 6.5 7 10.6 14T 5.1 18
Average 11.3 7.0 17.8 5.9 9.0 6.8
Established business ownership rate This is the percentage of the adult population who are owners or managers of businesses that have been in operation for more than 42 months.
Why does it matter? Information on the number of established businesses in an economy is important
as it provides some indication of the sustainability of entrepreneurship in that economy. These businesses have moved beyond the nascent and new business phases and are able to contribute to a country’s economy through the ongoing introduction of new products, services and processes, through innovation and through the provision of a more stable base of employment.
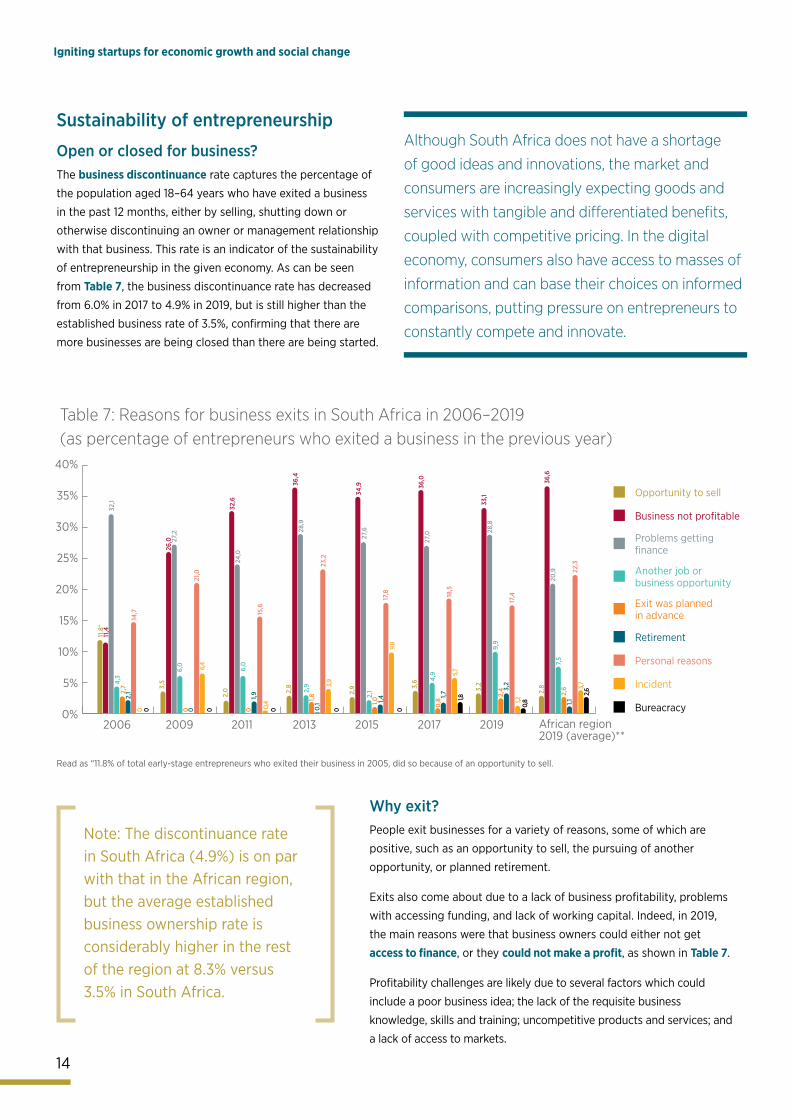
Section 2: Mapping entrepreneurship in South Africa
14
Igniting startups for economic growth and social change
Sustainability of entrepreneurship
Open or closed for business?The business discontinuance rate captures the percentage of
the population aged 18–64 years who have exited a business
in the past 12 months, either by selling, shutting down or
otherwise discontinuing an owner or management relationship
with that business. This rate is an indicator of the sustainability
of entrepreneurship in the given economy. As can be seen
from Table 7, the business discontinuance rate has decreased
from 6.0% in 2017 to 4.9% in 2019, but is still higher than the
established business rate of 3.5%, confirming that there are
more businesses are being closed than there are being started.
Why exit?People exit businesses for a variety of reasons, some of which are
positive, such as an opportunity to sell, the pursuing of another
opportunity, or planned retirement.
Exits also come about due to a lack of business profitability, problems
with accessing funding, and lack of working capital. Indeed, in 2019,
the main reasons were that business owners could either not get
access to finance, or they could not make a profit, as shown in Table 7.
Profitability challenges are likely due to several factors which could
include a poor business idea; the lack of the requisite business
knowledge, skills and training; uncompetitive products and services; and
a lack of access to markets.
Although South Africa does not have a shortage
of good ideas and innovations, the market and
consumers are increasingly expecting goods and
services with tangible and differentiated benefits,
coupled with competitive pricing. In the digital
economy, consumers also have access to masses of
information and can base their choices on informed
comparisons, putting pressure on entrepreneurs to
constantly compete and innovate.
Note: The discontinuance rate in South Africa (4.9%) is on par with that in the African region, but the average established business ownership rate is considerably higher in the rest of the region at 8.3% versus 3.5% in South Africa.
Table 7: Reasons for business exits in South Africa in 2006–2019 (as percentage of entrepreneurs who exited a business in the previous year)
40%
35%
30%
25%
20%
15%
10%
5%
0%
11.8
*
Read as “11.8% of total early-stage entrepreneurs who exited their business in 2005, did so because of an opportunity to sell.
Opportunity to sell
Business not profitable
Problems getting finance
Another job or business opportunity
Exit was planned in advance
Retirement
Personal reasons
Incident
Bureacracy
2006 2009 2011 2013 2015 2017 2019 African region2019 (average)**
32,1
11,4
0 0
4,3
2,7
2,1
14,7
3,5
27,2
26,0
6,4
6,0
0 021
,0
0
2,0
24,0
32,6
0,4
6,0
01,9
15,6
0
2,8
28,9
36,4
3,9
2,9
1,80,
123
,2
0
2,9
27,6
34,9
9,8
2,1
1,0 1,417
,8
0
3,6
27,0
36,0
5,7
4,9
0,8 1,7
18,5
1,8
3,2
28,8
33,1
1,2
9,9
2,4 3,
217
,4
0,8
2,8
20,9
36,6
3,7
7,5
2,6
1,122
,3
2,6
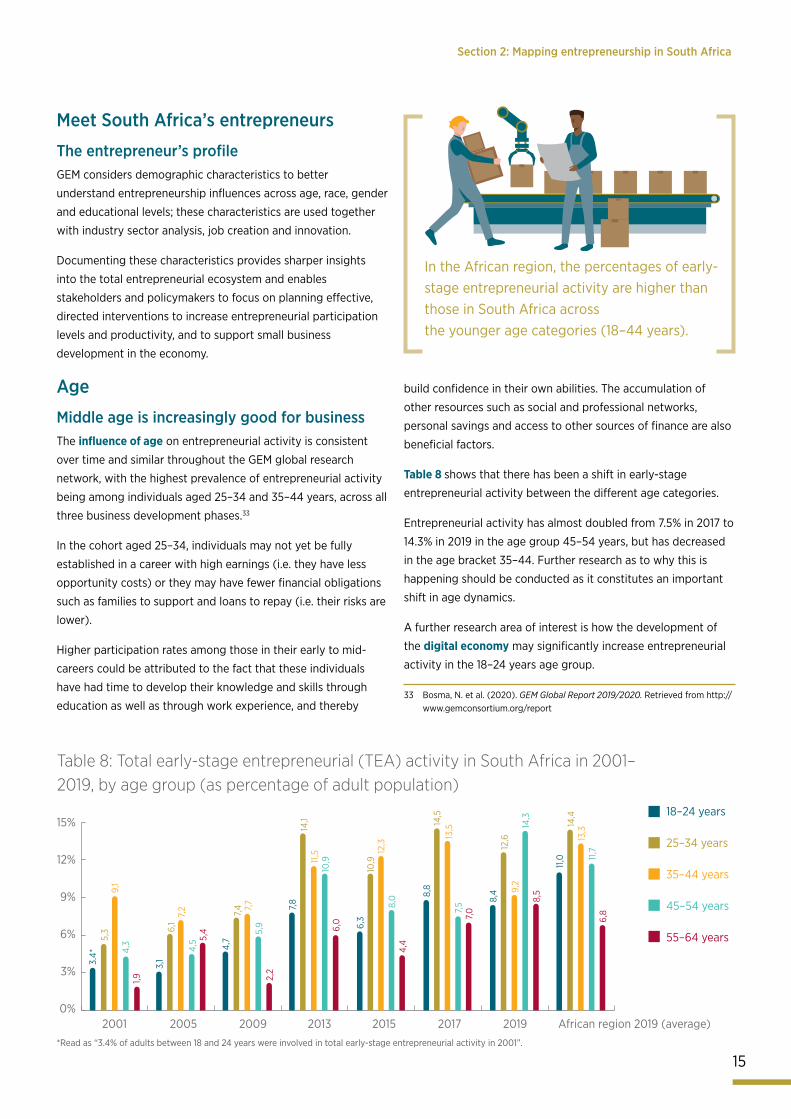
Section 2: Mapping entrepreneurship in South Africa
15
Meet South Africa’s entrepreneurs
The entrepreneur’s profileGEM considers demographic characteristics to better
understand entrepreneurship influences across age, race, gender
and educational levels; these characteristics are used together
with industry sector analysis, job creation and innovation.
Documenting these characteristics provides sharper insights
into the total entrepreneurial ecosystem and enables
stakeholders and policymakers to focus on planning effective,
directed interventions to increase entrepreneurial participation
levels and productivity, and to support small business
development in the economy.
Age
Middle age is increasingly good for businessThe influence of age on entrepreneurial activity is consistent
over time and similar throughout the GEM global research
network, with the highest prevalence of entrepreneurial activity
being among individuals aged 25–34 and 35–44 years, across all
three business development phases.33
In the cohort aged 25–34, individuals may not yet be fully
established in a career with high earnings (i.e. they have less
opportunity costs) or they may have fewer financial obligations
such as families to support and loans to repay (i.e. their risks are
lower).
Higher participation rates among those in their early to mid-
careers could be attributed to the fact that these individuals
have had time to develop their knowledge and skills through
education as well as through work experience, and thereby
build confidence in their own abilities. The accumulation of
other resources such as social and professional networks,
personal savings and access to other sources of finance are also
beneficial factors.
Table 8 shows that there has been a shift in early-stage
entrepreneurial activity between the different age categories.
Entrepreneurial activity has almost doubled from 7.5% in 2017 to
14.3% in 2019 in the age group 45–54 years, but has decreased
in the age bracket 35–44. Further research as to why this is
happening should be conducted as it constitutes an important
shift in age dynamics.
A further research area of interest is how the development of
the digital economy may significantly increase entrepreneurial
activity in the 18–24 years age group.
Table 8: Total early-stage entrepreneurial (TEA) activity in South Africa in 2001–2019, by age group (as percentage of adult population)
33 Bosma, N. et al. (2020). GEM Global Report 2019/2020. Retrieved from http://www.gemconsortium.org/report
In the African region, the percentages of early-stage entrepreneurial activity are higher than those in South Africa across the younger age categories (18–44 years).
*Read as “3.4% of adults between 18 and 24 years were involved in total early-stage entrepreneurial activity in 2001”.
African region 2019 (average)
15%
12%
9%
6%
3%
0%2001 2005 2009 2013 2015 2017 2019
18–24 years
25–34 years
35–44 years
45–54 years
55–64 years
3.4*
5,3
9,1
1,94,
3
3,1
6,1
7,2
5,4
4,5
4,7
7,4 7,
7
2,2
5,9
7,8
14,1
11,5
6,0
10,9
6,3
10,9
12,3
4,4
8,0 8,
814
,513
,5
7,07,
5 8,4
12,6
9,2
8,5
14,3
11,0
14,4
13,3
6,8
11,7
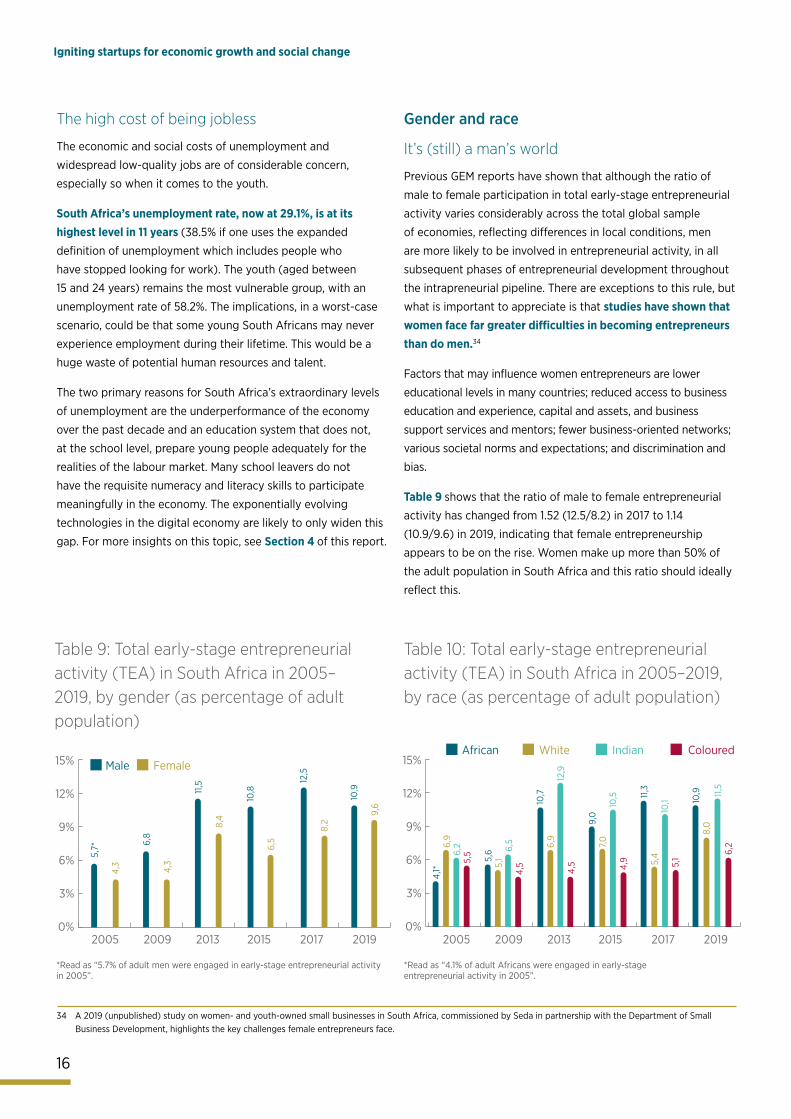
Section 2: Mapping entrepreneurship in South Africa
16
Igniting startups for economic growth and social change
The high cost of being jobless
The economic and social costs of unemployment and
widespread low-quality jobs are of considerable concern,
especially so when it comes to the youth.
South Africa’s unemployment rate, now at 29.1%, is at its highest level in 11 years (38.5% if one uses the expanded
definition of unemployment which includes people who
have stopped looking for work). The youth (aged between
15 and 24 years) remains the most vulnerable group, with an
unemployment rate of 58.2%. The implications, in a worst-case
scenario, could be that some young South Africans may never
experience employment during their lifetime. This would be a
huge waste of potential human resources and talent.
The two primary reasons for South Africa’s extraordinary levels
of unemployment are the underperformance of the economy
over the past decade and an education system that does not,
at the school level, prepare young people adequately for the
realities of the labour market. Many school leavers do not
have the requisite numeracy and literacy skills to participate
meaningfully in the economy. The exponentially evolving
technologies in the digital economy are likely to only widen this
gap. For more insights on this topic, see Section 4 of this report.
Gender and race
It’s (still) a man’s world
Previous GEM reports have shown that although the ratio of
male to female participation in total early-stage entrepreneurial
activity varies considerably across the total global sample
of economies, reflecting differences in local conditions, men
are more likely to be involved in entrepreneurial activity, in all
subsequent phases of entrepreneurial development throughout
the intrapreneurial pipeline. There are exceptions to this rule, but
what is important to appreciate is that studies have shown that women face far greater difficulties in becoming entrepreneurs than do men.34
Factors that may influence women entrepreneurs are lower
educational levels in many countries; reduced access to business
education and experience, capital and assets, and business
support services and mentors; fewer business-oriented networks;
various societal norms and expectations; and discrimination and
bias.
Table 9 shows that the ratio of male to female entrepreneurial
activity has changed from 1.52 (12.5/8.2) in 2017 to 1.14
(10.9/9.6) in 2019, indicating that female entrepreneurship
appears to be on the rise. Women make up more than 50% of
the adult population in South Africa and this ratio should ideally
reflect this.
*Read as “4.1% of adult Africans were engaged in early-stageentrepreneurial activity in 2005”.
*Read as “5.7% of adult men were engaged in early-stage entrepreneurial activityin 2005”.
Table 10: Total early-stage entrepreneurial activity (TEA) in South Africa in 2005–2019, by race (as percentage of adult population)
Table 9: Total early-stage entrepreneurial activity (TEA) in South Africa in 2005–2019, by gender (as percentage of adult population)
34 A 2019 (unpublished) study on women- and youth-owned small businesses in South Africa, commissioned by Seda in partnership with the Department of Small Business Development, highlights the key challenges female entrepreneurs face.
15%
12%
9%
6%
3%
0%20172005 2009 2013 2015 2019
Male Female
5,7*
4,3
6,8
4,3
11,5
8,4
10,8
6,5
12,5
8,2
10,9
9,6
15%
12%
9%
6%
3%
0%20172005 2009 2013 2015 2019
African White Indian Coloured
4,1*
6,9
5,56,
2
5,6
5,1
4,5
6,5
10,7
6,9
4,5
12,9
9,0
7,0
4,9
10,5 11
,35,
4
5,1
10,1 10
,98,
0
6,2
11,5
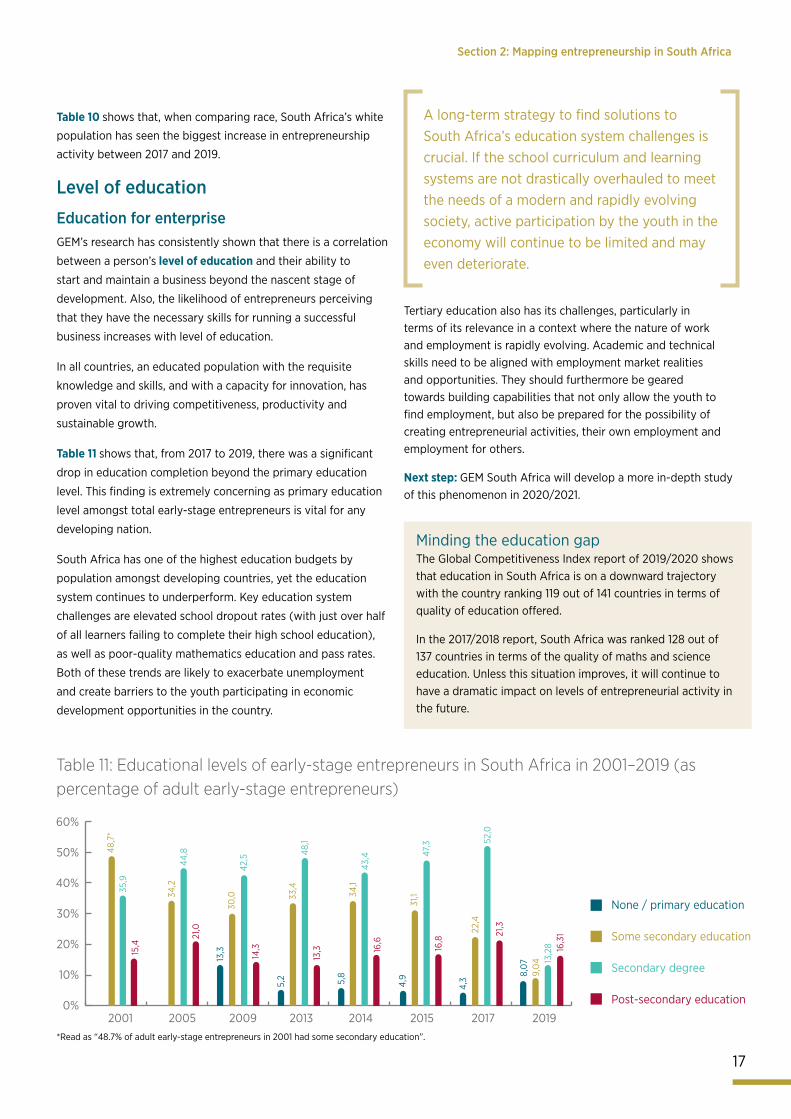
Section 2: Mapping entrepreneurship in South Africa
17
Table 10 shows that, when comparing race, South Africa’s white
population has seen the biggest increase in entrepreneurship
activity between 2017 and 2019.
Level of education
Education for enterpriseGEM’s research has consistently shown that there is a correlation
between a person’s level of education and their ability to
start and maintain a business beyond the nascent stage of
development. Also, the likelihood of entrepreneurs perceiving
that they have the necessary skills for running a successful
business increases with level of education.
In all countries, an educated population with the requisite
knowledge and skills, and with a capacity for innovation, has
proven vital to driving competitiveness, productivity and
sustainable growth.
Table 11 shows that, from 2017 to 2019, there was a significant
drop in education completion beyond the primary education
level. This finding is extremely concerning as primary education
level amongst total early-stage entrepreneurs is vital for any
developing nation.
South Africa has one of the highest education budgets by
population amongst developing countries, yet the education
system continues to underperform. Key education system
challenges are elevated school dropout rates (with just over half
of all learners failing to complete their high school education),
as well as poor-quality mathematics education and pass rates.
Both of these trends are likely to exacerbate unemployment
and create barriers to the youth participating in economic
development opportunities in the country.
Tertiary education also has its challenges, particularly in terms of its relevance in a context where the nature of work and employment is rapidly evolving. Academic and technical skills need to be aligned with employment market realities and opportunities. They should furthermore be geared towards building capabilities that not only allow the youth to find employment, but also be prepared for the possibility of creating entrepreneurial activities, their own employment and employment for others.
Next step: GEM South Africa will develop a more in-depth study of this phenomenon in 2020/2021.
Table 11: Educational levels of early-stage entrepreneurs in South Africa in 2001–2019 (as percentage of adult early-stage entrepreneurs)
Minding the education gapThe Global Competitiveness Index report of 2019/2020 shows that education in South Africa is on a downward trajectory with the country ranking 119 out of 141 countries in terms of quality of education offered.
In the 2017/2018 report, South Africa was ranked 128 out of 137 countries in terms of the quality of maths and science education. Unless this situation improves, it will continue to have a dramatic impact on levels of entrepreneurial activity in the future.
A long-term strategy to find solutions to South Africa’s education system challenges is crucial. If the school curriculum and learning systems are not drastically overhauled to meet the needs of a modern and rapidly evolving society, active participation by the youth in the economy will continue to be limited and may even deteriorate.
None / primary education
Some secondary education
Secondary degree
Post-secondary education
*Read as “48.7% of adult early-stage entrepreneurs in 2001 had some secondary education”.
60%
50%
40%
30%
20%
10%
0%20152005 2009 2013 2014 2017 20192001
48,7
*
15,4
35,9
34,2
21,0
44,8
30,0
14,3
42,5
13,3
33,4
13,3
48,1
5,2
34,1
16,6
43,4
5,8
31,1
16,8
47,3
4,9
22,4
21,3
52,0
4,3
9,0
4
16,3
113
,28
8,07
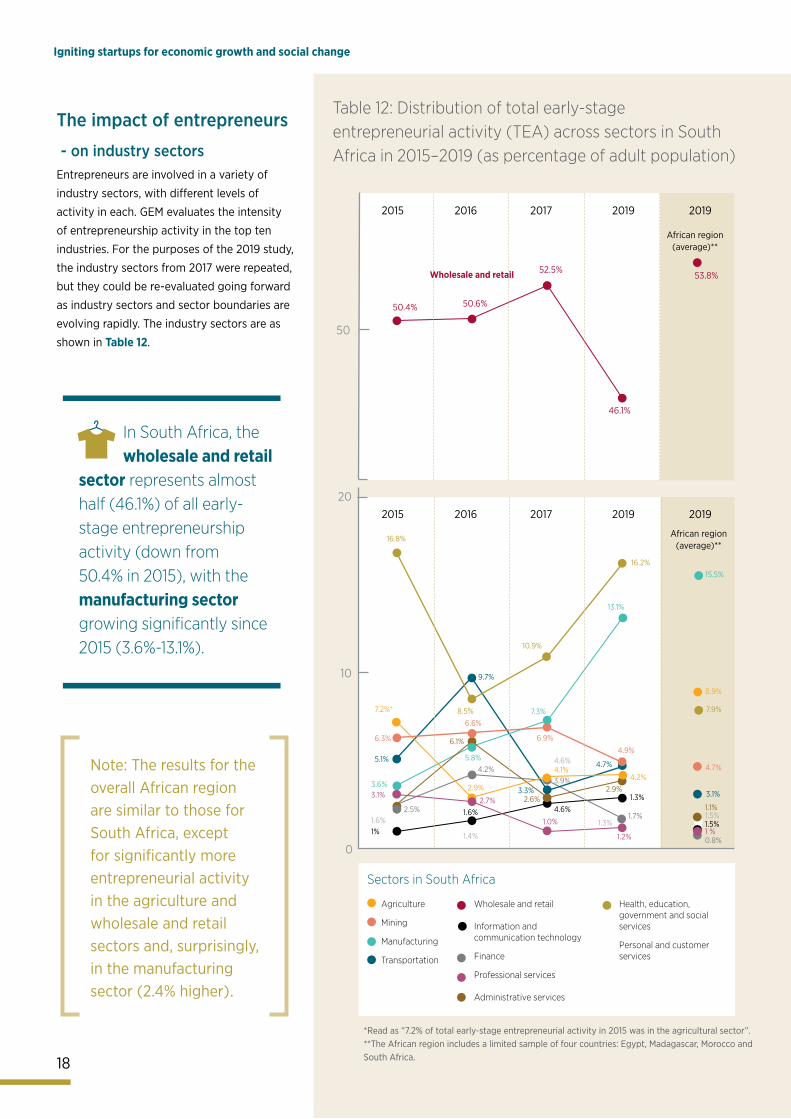
Section 2: Mapping entrepreneurship in South Africa
18
Igniting startups for economic growth and social change
50
African region (average)**
African region (average)**
20
10
0
50.4% 50.6%
52.5%
46.1%
53.8%
16.8%
8.5%
9.7%
5.1%
3.3%
4.7%
3.6%3.1%
1%
1.6% 4.6%1.3%
1.5%
2.5%1.6%
1.4%
4.6%
1.3%1.5%
4.2%3.9%
1.7%
0.8%
6.1%
2.6%2.9%
1.1%2.7%
1.0%
1.2%1 %
5.8%
7.3%
13.1%
15.5%
6.3%
7.2%*
2.9%
4.1%4.2%
8.9%
6.6%
6.9%
4.9%
4.7%
3.1%
10.9%
16.2%
7.9%
Agriculture
Mining
Manufacturing
Transportation
Wholesale and retail
Information and communication technology
Finance
Professional services
Administrative services
Health, education, government and social services
Personal and customer services
The impact of entrepreneurs
- on industry sectorsEntrepreneurs are involved in a variety of
industry sectors, with different levels of
activity in each. GEM evaluates the intensity
of entrepreneurship activity in the top ten
industries. For the purposes of the 2019 study,
the industry sectors from 2017 were repeated,
but they could be re-evaluated going forward
as industry sectors and sector boundaries are
evolving rapidly. The industry sectors are as
shown in Table 12.
In South Africa, the wholesale and retail
sector represents almost half (46.1%) of all early-stage entrepreneurship activity (down from 50.4% in 2015), with the manufacturing sector growing significantly since 2015 (3.6%-13.1%).
Note: The results for the overall African region are similar to those for South Africa, except for significantly more entrepreneurial activity in the agriculture and wholesale and retail sectors and, surprisingly, in the manufacturing sector (2.4% higher).
Table 12: Distribution of total early-stage entrepreneurial activity (TEA) across sectors in South Africa in 2015–2019 (as percentage of adult population)
*Read as “7.2% of total early-stage entrepreneurial activity in 2015 was in the agricultural sector”.**The African region includes a limited sample of four countries: Egypt, Madagascar, Morocco and South Africa.
2015
2015
2016
2016
2017
2017
2019
2019
2019
2019
Sectors in South Africa
Wholesale and retail

Section 2: Mapping entrepreneurship in South Africa
19
The prominence of the wholesale and retail sector in total
early-stage entrepreneurship activity specifically is not
surprising as the barriers to entry in terms of skills and capital
are comparatively low. This sector is highly over-traded and
extremely price competitive, which results in many startups
in the sector ultimately failing. Furthermore, this sector is
dominated by a few large retailers who have the buying power
to purchase at highly competitive rates, making it difficult for
smaller entrepreneurs to compete and survive.
This sector emphasis partially accounts for the differences
between the rate of early-stage entrepreneurship, the low rate
of established businesses and the high rate of discontinuance in
the South African entrepreneurial ecosystem.
The industry sector with the second-highest level of
entrepreneurial activity is health, education, government and social services at 16.2%, followed by manufacturing at
13.1%. It is especially encouraging that entrepreneurship in the
manufacturing sector has been steadily increasing over the
years (growing from 3.6% in 2015 to 13.1% in 2019) as this sector
holds the greatest potential to accelerate job creation.
Sectors that need urgent stimulation are information and
communication technology (including biotechnology) and
professional services, both of which require high levels of
knowledge and skills. The onus is on the education system
as feeder system to better build individuals’ capabilities for
participation in these and other emerging sectors.
- on job creation Entrepreneurship activity aims to create value for its founders,
partners and investors, but is also a potentially great
employment creator. It is important to track and understand
the extent to which entrepreneurs and small businesses actually
contribute to employment creation.
GEM’s research asks early-stage entrepreneurs how many
employees (other than the owners) they currently have and how
many they expect to have in the next five years. The difference
between these two numbers indicates growth expectations.
The GEM global research results of 2019/2020 show that the
majority of entrepreneurs in the low-income countries do not
expect to create any jobs in the next five years.
Table 13 shows that there has been little change between
2015 and 2019 in the percentage of entrepreneurs in South
Africa who believe that they will create zero jobs over the
next five years. Similarly, expectations of creating one to five
or more jobs have also not changed during this period. These
findings are particularly relevant in the context of high levels of
unemployment in the country.
Job creation expectations are even lower in the African region.
This signals a need for entrepreneurship activities to be
sustainable and show growth in order to create more jobs than
is currently expected.
Table 13: Job growth expectations among total early-stage entrepreneurs in South Africa in 2005–2019 (as percentage of adult population)
*Read as “82.9% of total early-stage entrepreneurs in 2005 expected to create between one and five jobs in the following five years”.**The African region includes a limited sample of four countries: Egypt, Madagascar, Morocco and South Africa.
1–5 jobs
6+ jobs
No jobs
100%
80%
60%
40%
20%
0
2005 2009 2013 2015 2017 2019 2019
African region (average)**
9
0 0
8.2
29.8
20.7 22.6
41.933.1 34.7
25.7
32 30.6
22.2
82.9*
66.9
57.1
44.5 47.3 46.8
41.9
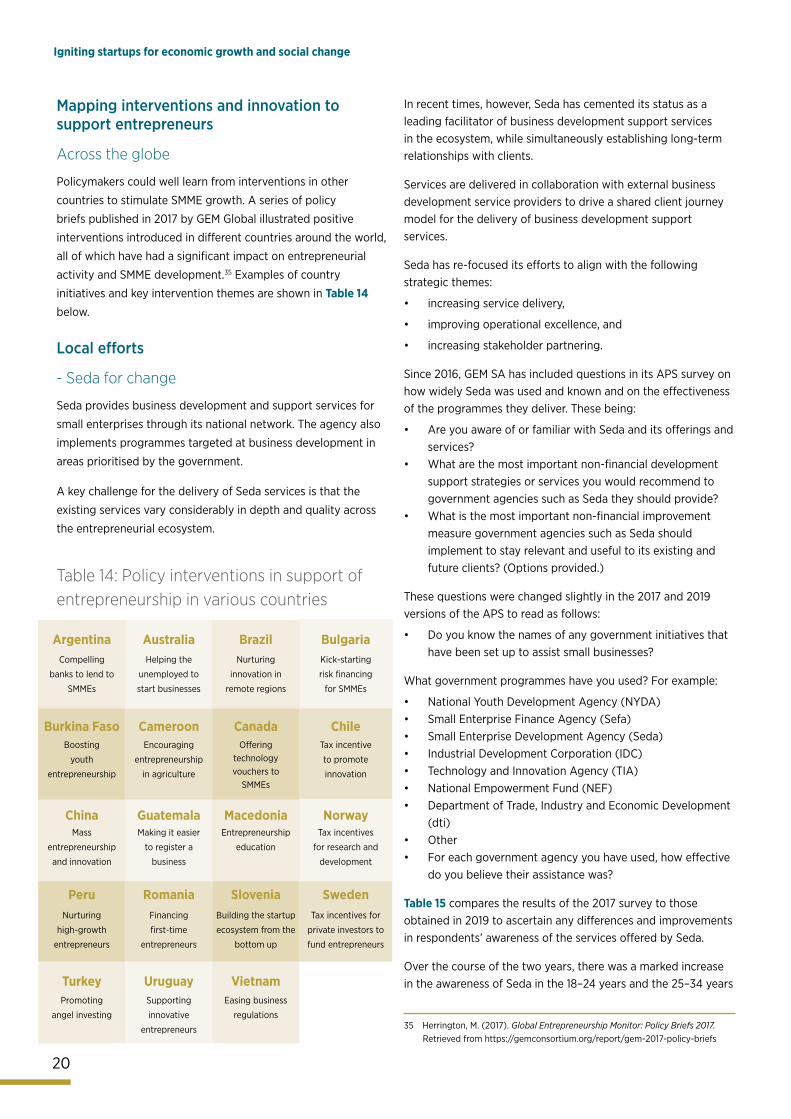
Section 2: Mapping entrepreneurship in South Africa
20
Igniting startups for economic growth and social change
Mapping interventions and innovation to support entrepreneurs
Across the globe
Policymakers could well learn from interventions in other
countries to stimulate SMME growth. A series of policy
briefs published in 2017 by GEM Global illustrated positive
interventions introduced in different countries around the world,
all of which have had a significant impact on entrepreneurial
activity and SMME development.35 Examples of country
initiatives and key intervention themes are shown in Table 14 below.
Local efforts
- Seda for change
Seda provides business development and support services for
small enterprises through its national network. The agency also
implements programmes targeted at business development in
areas prioritised by the government.
A key challenge for the delivery of Seda services is that the
existing services vary considerably in depth and quality across
the entrepreneurial ecosystem.
In recent times, however, Seda has cemented its status as a leading facilitator of business development support services in the ecosystem, while simultaneously establishing long-term relationships with clients.
Services are delivered in collaboration with external business development service providers to drive a shared client journey model for the delivery of business development support services.
Seda has re-focused its efforts to align with the following strategic themes:
• increasing service delivery,
• improving operational excellence, and
• increasing stakeholder partnering.
Since 2016, GEM SA has included questions in its APS survey on how widely Seda was used and known and on the effectiveness of the programmes they deliver. These being:
• Are you aware of or familiar with Seda and its offerings and services?
• What are the most important non-financial development support strategies or services you would recommend to government agencies such as Seda they should provide?
• What is the most important non-financial improvement measure government agencies such as Seda should implement to stay relevant and useful to its existing and future clients? (Options provided.)
These questions were changed slightly in the 2017 and 2019 versions of the APS to read as follows:
• Do you know the names of any government initiatives that have been set up to assist small businesses?
What government programmes have you used? For example:
• National Youth Development Agency (NYDA)• Small Enterprise Finance Agency (Sefa)• Small Enterprise Development Agency (Seda)• Industrial Development Corporation (IDC)• Technology and Innovation Agency (TIA)• National Empowerment Fund (NEF)• Department of Trade, Industry and Economic Development
(dti)• Other• For each government agency you have used, how effective
do you believe their assistance was?
Table 15 compares the results of the 2017 survey to those obtained in 2019 to ascertain any differences and improvements in respondents’ awareness of the services offered by Seda.
Over the course of the two years, there was a marked increase in the awareness of Seda in the 18–24 years and the 25–34 years
35 Herrington, M. (2017). Global Entrepreneurship Monitor: Policy Briefs 2017. Retrieved from https://gemconsortium.org/report/gem-2017-policy-briefs
Table 14: Policy interventions in support of entrepreneurship in various countries
Argentina Australia Brazil Bulgaria
Burkina Faso Cameroon Canada Chile
China Guatemala Macedonia Norway
Peru Romania Slovenia Sweden
Turkey Uruguay Vietnam
Compelling
banks to lend to
SMMEs
Helping the
unemployed to
start businesses
Nurturing
innovation in
remote regions
Kick-starting
risk financing
for SMMEs
Boosting
youth
entrepreneurship
Encouraging
entrepreneurship
in agriculture
Offering technology vouchers to
SMMEs
Tax incentive
to promote
innovation
Making it easier
to register a
business
Mass
entrepreneurship
and innovation
Entrepreneurship
education
Tax incentives
for research and
development
Nurturing
high-growth
entrepreneurs
Financing
first-time
entrepreneurs
Building the startup
ecosystem from the
bottom up
Tax incentives for
private investors to
fund entrepreneurs
Promoting
angel investing
Supporting
innovative
entrepreneurs
Easing business
regulations
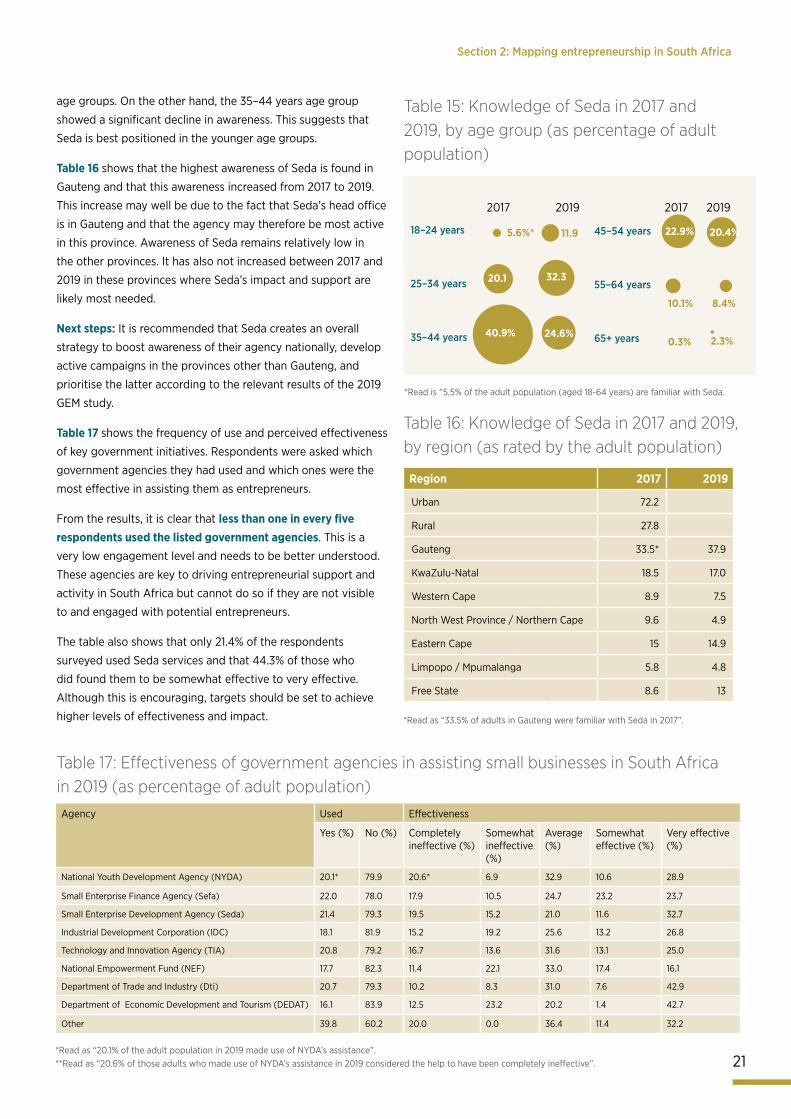
Section 2: Mapping entrepreneurship in South Africa
21
age groups. On the other hand, the 35–44 years age group
showed a significant decline in awareness. This suggests that
Seda is best positioned in the younger age groups.
Table 16 shows that the highest awareness of Seda is found in
Gauteng and that this awareness increased from 2017 to 2019.
This increase may well be due to the fact that Seda’s head office
is in Gauteng and that the agency may therefore be most active
in this province. Awareness of Seda remains relatively low in
the other provinces. It has also not increased between 2017 and
2019 in these provinces where Seda’s impact and support are
likely most needed.
Next steps: It is recommended that Seda creates an overall
strategy to boost awareness of their agency nationally, develop
active campaigns in the provinces other than Gauteng, and
prioritise the latter according to the relevant results of the 2019
GEM study.
Table 17 shows the frequency of use and perceived effectiveness
of key government initiatives. Respondents were asked which
government agencies they had used and which ones were the
most effective in assisting them as entrepreneurs.
From the results, it is clear that less than one in every five respondents used the listed government agencies. This is a
very low engagement level and needs to be better understood.
These agencies are key to driving entrepreneurial support and
activity in South Africa but cannot do so if they are not visible
to and engaged with potential entrepreneurs.
The table also shows that only 21.4% of the respondents
surveyed used Seda services and that 44.3% of those who
did found them to be somewhat effective to very effective.
Although this is encouraging, targets should be set to achieve
higher levels of effectiveness and impact.
Table 15: Knowledge of Seda in 2017 and 2019, by age group (as percentage of adult population)
Table 16: Knowledge of Seda in 2017 and 2019, by region (as rated by the adult population)
Table 17: Effectiveness of government agencies in assisting small businesses in South Africa in 2019 (as percentage of adult population)
*Read is “5,5% of the adult population (aged 18-64 years) are familiar with Seda.
18–24 years
25–34 years
35–44 years
45–54 years
55–64 years
65+ years
5.6%* 11.9
32.3
24.6%
22.9%
10.1% 8.4%
0.3% 2.3%
20.4%
20.1
40.9%
2017 20172019 2019
*Read as “33.5% of adults in Gauteng were familiar with Seda in 2017”.
Region 2017 2019
Urban 72.2
Rural 27.8
Gauteng 33.5* 37.9
KwaZulu-Natal 18.5 17.0
Western Cape 8.9 7.5
North West Province / Northern Cape 9.6 4.9
Eastern Cape 15 14.9
Limpopo / Mpumalanga 5.8 4.8
Free State 8.6 13
*Read as “33.5% of adults in Gauteng were familiar with Seda in 2017”.
*Read as “20.1% of the adult population in 2019 made use of NYDA’s assistance”.**Read as “20.6% of those adults who made use of NYDA’s assistance in 2019 considered the help to have been completely ineffective”.
Agency Used Effectiveness
Yes (%) No (%) Completely ineffective (%)
Somewhat ineffective (%)
Average (%)
Somewhat effective (%)
Very effective (%)
National Youth Development Agency (NYDA) 20.1* 79.9 20.6* 6.9 32.9 10.6 28.9
Small Enterprise Finance Agency (Sefa) 22.0 78.0 17.9 10.5 24.7 23.2 23.7
Small Enterprise Development Agency (Seda) 21.4 79.3 19.5 15.2 21.0 11.6 32.7
Industrial Development Corporation (IDC) 18.1 81.9 15.2 19.2 25.6 13.2 26.8
Technology and Innovation Agency (TIA) 20.8 79.2 16.7 13.6 31.6 13.1 25.0
National Empowerment Fund (NEF) 17.7 82.3 11.4 22.1 33.0 17.4 16.1
Department of Trade and Industry (Dti) 20.7 79.3 10.2 8.3 31.0 7.6 42.9
Department of Economic Development and Tourism (DEDAT) 16.1 83.9 12.5 23.2 20.2 1.4 42.7
Other 39.8 60.2 20.0 0.0 36.4 11.4 32.2
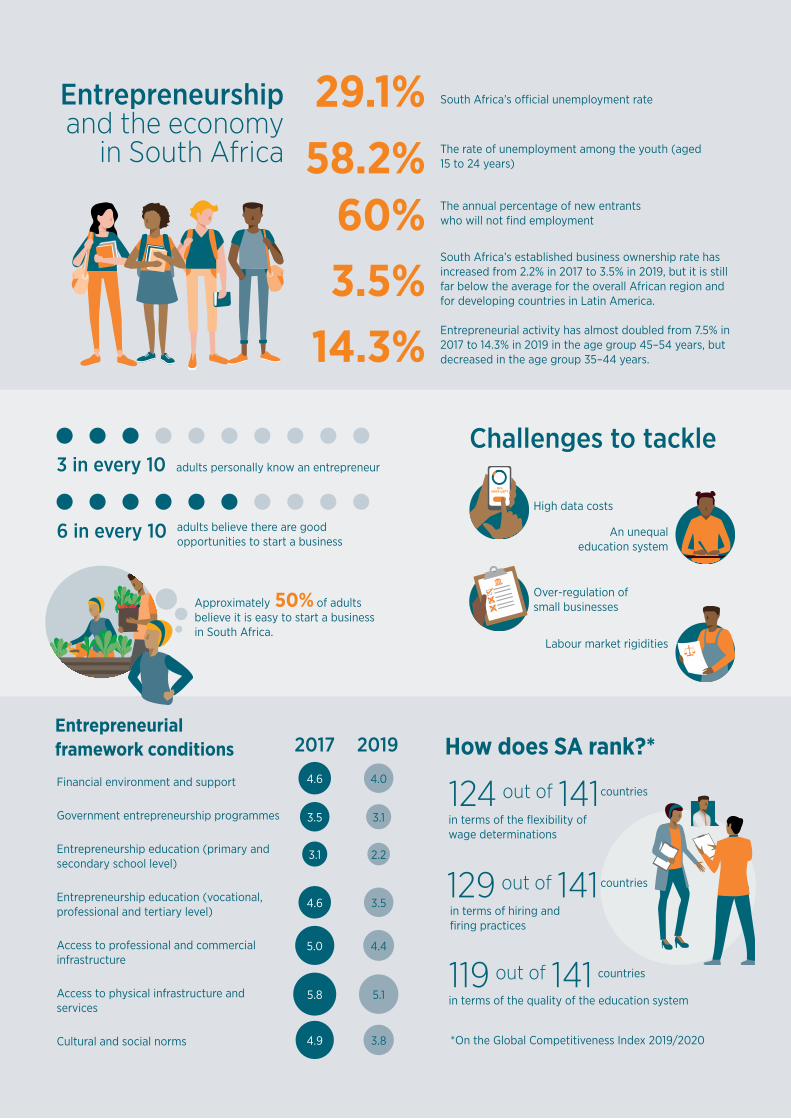
Approximately 50% of adults believe it is easy to start a business in South Africa.
Over-regulation of small businesses
Entrepreneurship and the economy
in South Africa
South Africa’s official unemployment rate29.1%58.2% The rate of unemployment among the youth (aged
15 to 24 years)
60% The annual percentage of new entrants who will not find employment
3.5%South Africa’s established business ownership rate has increased from 2.2% in 2017 to 3.5% in 2019, but it is still far below the average for the overall African region and for developing countries in Latin America.
Entrepreneurial activity has almost doubled from 7.5% in 2017 to 14.3% in 2019 in the age group 45–54 years, but decreased in the age group 35–44 years.14.3%
Challenges to tackle10%
DATA LEFT
3 in every 10 adults personally know an entrepreneur
6 in every 10
in terms of hiring and firing practices
124 out of 141How does SA rank?*
in terms of the flexibility of wage determinations
129 out of 141
High data costs
An unequal education system
Labour market rigidities
119 out of 141in terms of the quality of the education system
Entrepreneurial framework conditions
Financial environment and support
Government entrepreneurship programmes
Entrepreneurship education (primary and secondary school level)
Entrepreneurship education (vocational, professional and tertiary level)
Access to professional and commercial infrastructure
Access to physical infrastructure and services
Cultural and social norms
2017 2019
4.6 4.0
3.5 3.1
3.1 2.2
4.6 3.5
5.0 4.4
5.8 5.1
4.9 3.8
adults believe there are good opportunities to start a business
countries
countries
*On the Global Competitiveness Index 2019/2020
countries
23
SECTION 3
The South African entrepreneurial ecosystemIt is well understood that entrepreneurs need the right conditions to blossom. Yet the evidence is clear that efforts to support entrepreneurs have not always been effective in South Africa. We unpack options to provide a supportive entrepreneurial ecosystem and explore ways to foster entrepreneurship in the country.
People’s fear of failure in entrepreneurship is high and has increased from 2017.
49.8%
Understanding the contextGEM’s primary source of information is the APS. Its results are interpreted in the context of
the prevailing framework conditions, as understood from the selected in-country experts’
opinions, gained through the NES. GEM also relies on information and data provided by
other leading international organisations such as the World Economic Forum, the World
Bank Group and the United Nations, to mention but a few.
An example of the prevailing global comparative conditions, as shown in Table 18, is how
South Africa ranked on the Global Competitiveness Index in 2016–2019. In 2018, the format
of the Global Competitiveness Index was adjusted (to version GCI 4.0); direct comparisons
between data from 2019 and data from 2016/2017 or 2017/2018 are not exact as some of
the conditions have changed. Nevertheless, it is still of value to compare data from those
conditions that remained unchanged. The GCI 4.0 provides a detailed overview of the
factors and attributes that drive productivity, growth and human development in the era of
the Fourth Industrial Revolution (4IR).36
South Africa’s overall ranking on the GCI 4.0 improved from 67 out of 140 economies in
2018 to 60 out of 141 economies in 2019.
Table 18 shows that there has been a decline in the country’s rankings on some conditions,
especially those relating to the regulatory environment, namely the burden of government
regulations (101/141) and the time required to start a business (129/141). The availability of
financial services has also declined markedly (to 96/141), but this may be due to the fact
that this indicator now refers to the financing of SMMEs rather than large
corporate businesses.
36 Schwab, K. (Ed). (2019). The Global Competitiveness Report 2019 vii, South African Rankings, 534–537. Geneva: World Eco-nomic Forum. Retrieved from http://www3.weforum.org/docs/WEF_TheGlobalCompetitive-nessReport2019.pdf
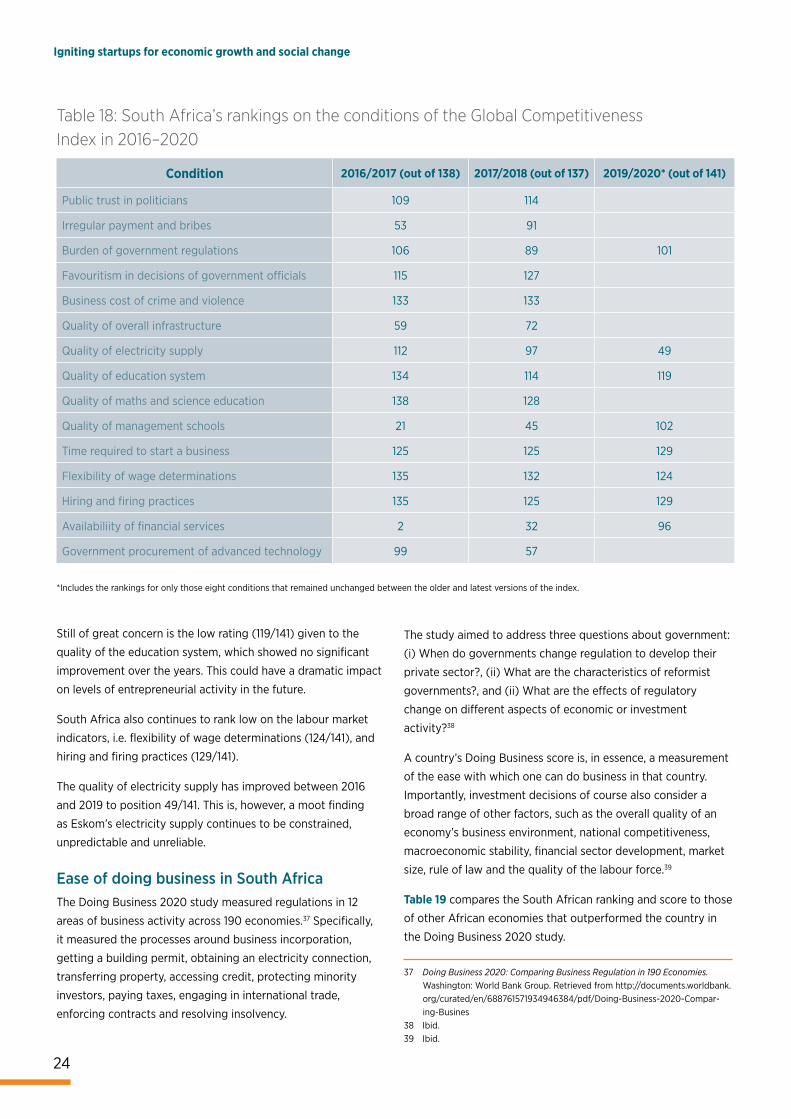
Section 3: The South African entrepreneurial ecosystem
24
Igniting startups for economic growth and social change
Table 18: South Africa’s rankings on the conditions of the Global Competitiveness Index in 2016–2020
Condition 2016/2017 (out of 138) 2017/2018 (out of 137) 2019/2020* (out of 141)
Public trust in politicians 109 114
Irregular payment and bribes 53 91
Burden of government regulations 106 89 101
Favouritism in decisions of government officials 115 127
Business cost of crime and violence 133 133
Quality of overall infrastructure 59 72
Quality of electricity supply 112 97 49
Quality of education system 134 114 119
Quality of maths and science education 138 128
Quality of management schools 21 45 102
Time required to start a business 125 125 129
Flexibility of wage determinations 135 132 124
Hiring and firing practices 135 125 129
Availabiliity of financial services 2 32 96
Government procurement of advanced technology 99 57
*Includes the rankings for only those eight conditions that remained unchanged between the older and latest versions of the index.
Still of great concern is the low rating (119/141) given to the
quality of the education system, which showed no significant
improvement over the years. This could have a dramatic impact
on levels of entrepreneurial activity in the future.
South Africa also continues to rank low on the labour market
indicators, i.e. flexibility of wage determinations (124/141), and
hiring and firing practices (129/141).
The quality of electricity supply has improved between 2016
and 2019 to position 49/141. This is, however, a moot finding
as Eskom’s electricity supply continues to be constrained,
unpredictable and unreliable.
Ease of doing business in South AfricaThe Doing Business 2020 study measured regulations in 12
areas of business activity across 190 economies.37 Specifically,
it measured the processes around business incorporation,
getting a building permit, obtaining an electricity connection,
transferring property, accessing credit, protecting minority
investors, paying taxes, engaging in international trade,
enforcing contracts and resolving insolvency.
The study aimed to address three questions about government:
(i) When do governments change regulation to develop their
private sector?, (ii) What are the characteristics of reformist
governments?, and (ii) What are the effects of regulatory
change on different aspects of economic or investment
activity?38
A country’s Doing Business score is, in essence, a measurement
of the ease with which one can do business in that country.
Importantly, investment decisions of course also consider a
broad range of other factors, such as the overall quality of an
economy’s business environment, national competitiveness,
macroeconomic stability, financial sector development, market
size, rule of law and the quality of the labour force.39
Table 19 compares the South African ranking and score to those
of other African economies that outperformed the country in
the Doing Business 2020 study.
37 Doing Business 2020: Comparing Business Regulation in 190 Economies. Washington: World Bank Group. Retrieved from http://documents.worldbank.org/curated/en/688761571934946384/pdf/Doing-Business-2020-Compar-ing-Busines
38 Ibid.39 Ibid.
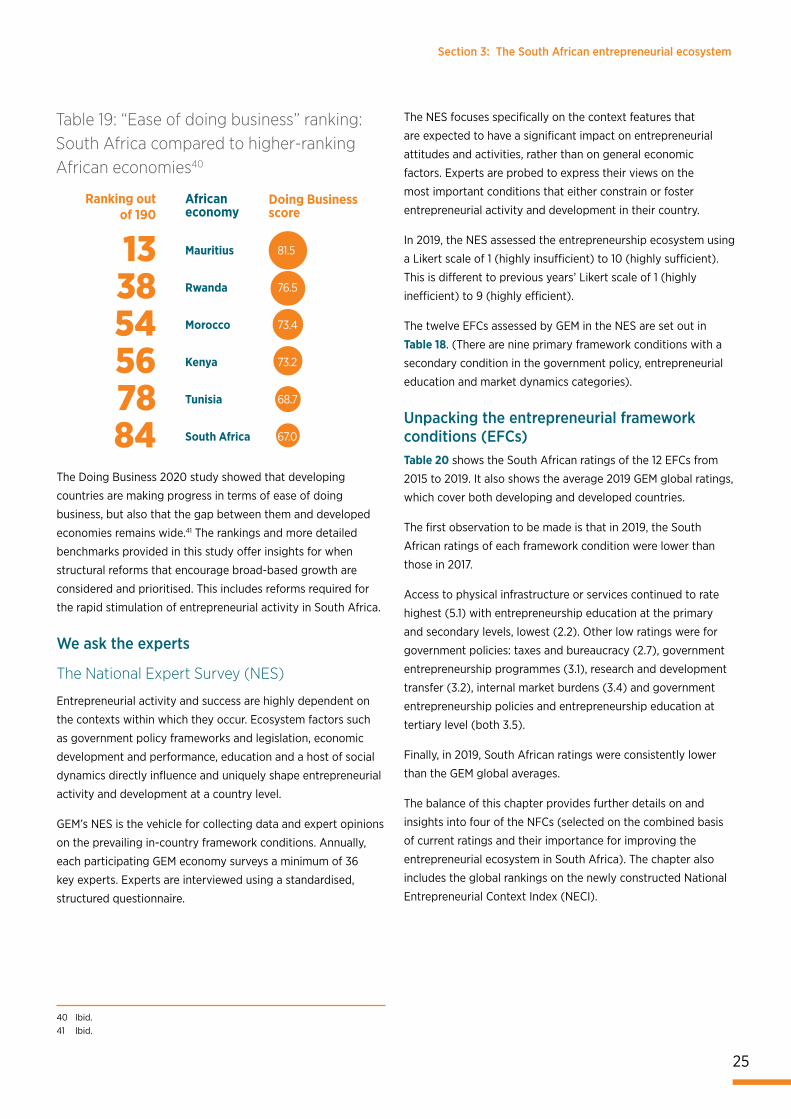
Section 3: The South African entrepreneurial ecosystem
25
Table 19: “Ease of doing business” ranking: South Africa compared to higher-ranking African economies40
Ranking out of 190
African economy
Doing Business score
133854567884
Mauritius
Rwanda
Morocco
Kenya
Tunisia
South Africa
81.5
76.5
73.4
73.2
68.7
67.0
The Doing Business 2020 study showed that developing
countries are making progress in terms of ease of doing
business, but also that the gap between them and developed
economies remains wide.41 The rankings and more detailed
benchmarks provided in this study offer insights for when
structural reforms that encourage broad-based growth are
considered and prioritised. This includes reforms required for
the rapid stimulation of entrepreneurial activity in South Africa.
We ask the experts
The National Expert Survey (NES)
Entrepreneurial activity and success are highly dependent on
the contexts within which they occur. Ecosystem factors such
as government policy frameworks and legislation, economic
development and performance, education and a host of social
dynamics directly influence and uniquely shape entrepreneurial
activity and development at a country level.
GEM’s NES is the vehicle for collecting data and expert opinions
on the prevailing in-country framework conditions. Annually,
each participating GEM economy surveys a minimum of 36
key experts. Experts are interviewed using a standardised,
structured questionnaire.
The NES focuses specifically on the context features that
are expected to have a significant impact on entrepreneurial
attitudes and activities, rather than on general economic
factors. Experts are probed to express their views on the
most important conditions that either constrain or foster
entrepreneurial activity and development in their country.
In 2019, the NES assessed the entrepreneurship ecosystem using
a Likert scale of 1 (highly insufficient) to 10 (highly sufficient).
This is different to previous years’ Likert scale of 1 (highly
inefficient) to 9 (highly efficient).
The twelve EFCs assessed by GEM in the NES are set out in
Table 18. (There are nine primary framework conditions with a
secondary condition in the government policy, entrepreneurial
education and market dynamics categories).
Unpacking the entrepreneurial framework conditions (EFCs)Table 20 shows the South African ratings of the 12 EFCs from
2015 to 2019. It also shows the average 2019 GEM global ratings,
which cover both developing and developed countries.
The first observation to be made is that in 2019, the South
African ratings of each framework condition were lower than
those in 2017.
Access to physical infrastructure or services continued to rate
highest (5.1) with entrepreneurship education at the primary
and secondary levels, lowest (2.2). Other low ratings were for
government policies: taxes and bureaucracy (2.7), government
entrepreneurship programmes (3.1), research and development
transfer (3.2), internal market burdens (3.4) and government
entrepreneurship policies and entrepreneurship education at
tertiary level (both 3.5).
Finally, in 2019, South African ratings were consistently lower
than the GEM global averages.
The balance of this chapter provides further details on and
insights into four of the NFCs (selected on the combined basis
of current ratings and their importance for improving the
entrepreneurial ecosystem in South Africa). The chapter also
includes the global rankings on the newly constructed National
Entrepreneurial Context Index (NECI).
40 Ibid.41 Ibid.
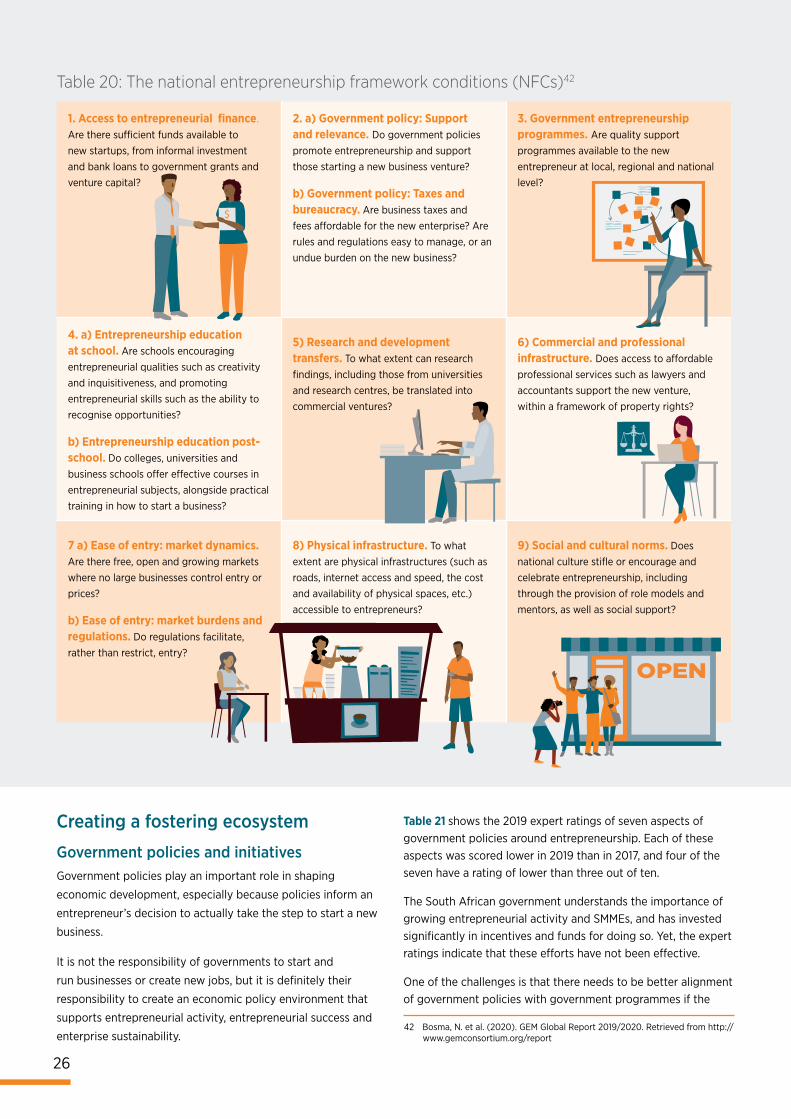
Section 3: The South African entrepreneurial ecosystem
26
Igniting startups for economic growth and social change
42 Bosma, N. et al. (2020). GEM Global Report 2019/2020. Retrieved from http://www.gemconsortium.org/report
Creating a fostering ecosystem
Government policies and initiativesGovernment policies play an important role in shaping
economic development, especially because policies inform an
entrepreneur’s decision to actually take the step to start a new
business.
It is not the responsibility of governments to start and
run businesses or create new jobs, but it is definitely their
responsibility to create an economic policy environment that
supports entrepreneurial activity, entrepreneurial success and
enterprise sustainability.
Table 21 shows the 2019 expert ratings of seven aspects of government policies around entrepreneurship. Each of these aspects was scored lower in 2019 than in 2017, and four of the seven have a rating of lower than three out of ten.
The South African government understands the importance of growing entrepreneurial activity and SMMEs, and has invested significantly in incentives and funds for doing so. Yet, the expert ratings indicate that these efforts have not been effective.
One of the challenges is that there needs to be better alignment of government policies with government programmes if the
1. Access to entrepreneurial finance. Are there sufficient funds available to new startups, from informal investment and bank loans to government grants and venture capital?
2. a) Government policy: Support and relevance. Do government policies promote entrepreneurship and support those starting a new business venture?
b) Government policy: Taxes and bureaucracy. Are business taxes and fees affordable for the new enterprise? Are rules and regulations easy to manage, or an undue burden on the new business?
3. Government entrepreneurship programmes. Are quality support programmes available to the new entrepreneur at local, regional and national level?
4. a) Entrepreneurship education at school. Are schools encouraging entrepreneurial qualities such as creativity and inquisitiveness, and promoting entrepreneurial skills such as the ability to recognise opportunities?
b) Entrepreneurship education post-school. Do colleges, universities and business schools offer effective courses in entrepreneurial subjects, alongside practical training in how to start a business?
5) Research and development transfers. To what extent can research findings, including those from universities and research centres, be translated into commercial ventures?
6) Commercial and professional infrastructure. Does access to affordable professional services such as lawyers and accountants support the new venture, within a framework of property rights?
7 a) Ease of entry: market dynamics. Are there free, open and growing markets where no large businesses control entry or prices?
b) Ease of entry: market burdens and regulations. Do regulations facilitate, rather than restrict, entry?
8) Physical infrastructure. To what extent are physical infrastructures (such as roads, internet access and speed, the cost and availability of physical spaces, etc.) accessible to entrepreneurs?
9) Social and cultural norms. Does national culture stifle or encourage and celebrate entrepreneurship, including through the provision of role models and mentors, as well as social support?
Table 20: The national entrepreneurship framework conditions (NFCs)42
OPEN
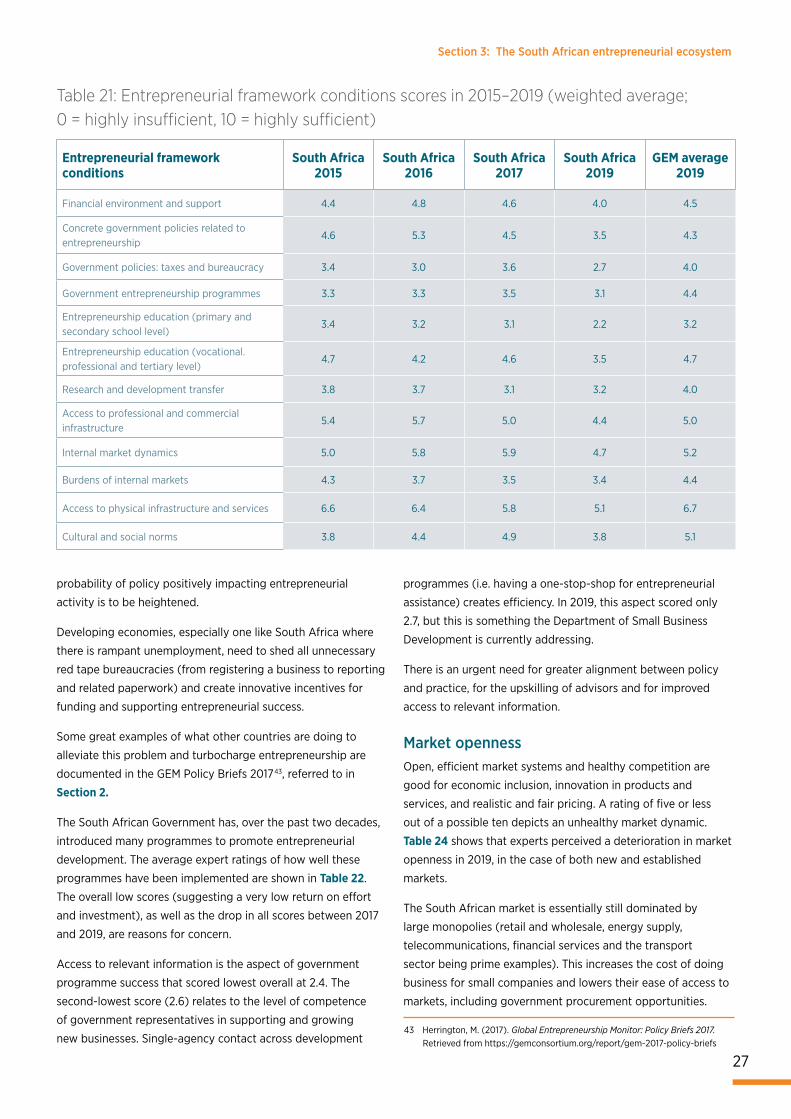
Section 3: The South African entrepreneurial ecosystem
27
Table 21: Entrepreneurial framework conditions scores in 2015–2019 (weighted average; 0 = highly insufficient, 10 = highly sufficient)
Entrepreneurial framework conditions
South Africa 2015
South Africa 2016
South Africa 2017
South Africa 2019
GEM average 2019
Financial environment and support 4.4 4.8 4.6 4.0 4.5
Concrete government policies related to entrepreneurship
4.6 5.3 4.5 3.5 4.3
Government policies: taxes and bureaucracy 3.4 3.0 3.6 2.7 4.0
Government entrepreneurship programmes 3.3 3.3 3.5 3.1 4.4
Entrepreneurship education (primary and secondary school level)
3.4 3.2 3.1 2.2 3.2
Entrepreneurship education (vocational. professional and tertiary level)
4.7 4.2 4.6 3.5 4.7
Research and development transfer 3.8 3.7 3.1 3.2 4.0
Access to professional and commercial infrastructure
5.4 5.7 5.0 4.4 5.0
Internal market dynamics 5.0 5.8 5.9 4.7 5.2
Burdens of internal markets 4.3 3.7 3.5 3.4 4.4
Access to physical infrastructure and services 6.6 6.4 5.8 5.1 6.7
Cultural and social norms 3.8 4.4 4.9 3.8 5.1
probability of policy positively impacting entrepreneurial
activity is to be heightened.
Developing economies, especially one like South Africa where
there is rampant unemployment, need to shed all unnecessary
red tape bureaucracies (from registering a business to reporting
and related paperwork) and create innovative incentives for
funding and supporting entrepreneurial success.
Some great examples of what other countries are doing to
alleviate this problem and turbocharge entrepreneurship are
documented in the GEM Policy Briefs 2017 43, referred to in
Section 2.
The South African Government has, over the past two decades,
introduced many programmes to promote entrepreneurial
development. The average expert ratings of how well these
programmes have been implemented are shown in Table 22.
The overall low scores (suggesting a very low return on effort
and investment), as well as the drop in all scores between 2017
and 2019, are reasons for concern.
Access to relevant information is the aspect of government
programme success that scored lowest overall at 2.4. The
second-lowest score (2.6) relates to the level of competence
of government representatives in supporting and growing
new businesses. Single-agency contact across development
programmes (i.e. having a one-stop-shop for entrepreneurial
assistance) creates efficiency. In 2019, this aspect scored only
2.7, but this is something the Department of Small Business
Development is currently addressing.
There is an urgent need for greater alignment between policy
and practice, for the upskilling of advisors and for improved
access to relevant information.
Market opennessOpen, efficient market systems and healthy competition are
good for economic inclusion, innovation in products and
services, and realistic and fair pricing. A rating of five or less
out of a possible ten depicts an unhealthy market dynamic.
Table 24 shows that experts perceived a deterioration in market
openness in 2019, in the case of both new and established
markets.
The South African market is essentially still dominated by
large monopolies (retail and wholesale, energy supply,
telecommunications, financial services and the transport
sector being prime examples). This increases the cost of doing
business for small companies and lowers their ease of access to
markets, including government procurement opportunities.
43 Herrington, M. (2017). Global Entrepreneurship Monitor: Policy Briefs 2017. Retrieved from https://gemconsortium.org/report/gem-2017-policy-briefs
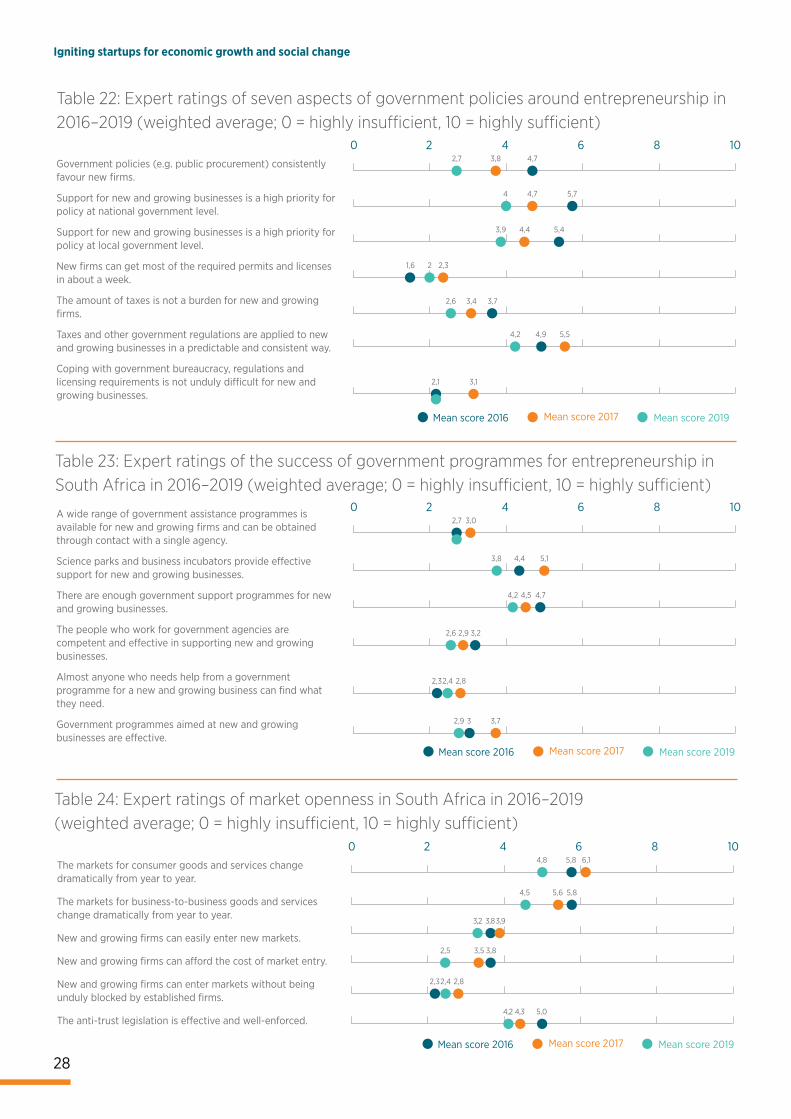
Section 3: The South African entrepreneurial ecosystem
28
Igniting startups for economic growth and social change
Table 22: Expert ratings of seven aspects of government policies around entrepreneurship in 2016–2019 (weighted average; 0 = highly insufficient, 10 = highly sufficient)
0 2 4 106 8
Mean score 2016 Mean score 2017 Mean score 2019
2,7 3,8 4,7
4 4,7 5,7
3,9 4,4 5,4
2 2,31,6
2,6 3,4 3,7
4,2 5,54,9
3,12,1
Government policies (e.g. public procurement) consistently favour new firms.
Support for new and growing businesses is a high priority for policy at national government level.
Support for new and growing businesses is a high priority for policy at local government level.
New firms can get most of the required permits and licenses in about a week.
The amount of taxes is not a burden for new and growing firms.
Taxes and other government regulations are applied to new and growing businesses in a predictable and consistent way.
Coping with government bureaucracy, regulations and licensing requirements is not unduly difficult for new and growing businesses.
Table 23: Expert ratings of the success of government programmes for entrepreneurship in South Africa in 2016–2019 (weighted average; 0 = highly insufficient, 10 = highly sufficient)
0 2 4 106 8
Mean score 2016 Mean score 2017 Mean score 2019
2,7 3,0
3,8 5,14,4
4,2 4,5 4,7
2,6 2,9 3,2
2,4 2,82,3
2,9 3,73
A wide range of government assistance programmes is available for new and growing firms and can be obtained through contact with a single agency.
Science parks and business incubators provide effective support for new and growing businesses.
There are enough government support programmes for new and growing businesses.
The people who work for government agencies are competent and effective in supporting new and growing businesses.
Almost anyone who needs help from a government programme for a new and growing business can find what they need.
Government programmes aimed at new and growing businesses are effective.
Table 24: Expert ratings of market openness in South Africa in 2016–2019 (weighted average; 0 = highly insufficient, 10 = highly sufficient)
0 2 4 106 8
Mean score 2016 Mean score 2017 Mean score 2019
4,5 5,6 5,8
3,2 3,93,8
2,4 2,82,3
4,2 4,3 5,0
The markets for consumer goods and services change dramatically from year to year.
The markets for business-to-business goods and services change dramatically from year to year.
New and growing firms can easily enter new markets.
New and growing firms can afford the cost of market entry.
New and growing firms can enter markets without being unduly blocked by established firms.
The anti-trust legislation is effective and well-enforced.
5,8 6,14,8
2,5 3,83,5
Section 3: The South African entrepreneurial ecosystem
29
Education and trainingEducation, specifically entrepreneurial education, is a foundation
requirement for starting a business and succeeding as an
entrepreneur.
GEM’s research has repeatedly shown that the higher their
level of education, the more likely the entrepreneur is to start
a business and for the business to grow and prosper. In a
broader sense, there is a direct correlation between the levels of
perceived capabilities (this admittedly not being determined by
education level alone) and the TEA level in the country. The GEM
findings also show that education is linked to entrepreneurial
intentions.
Historically, the NES expert commentators agreed that the
education system in South Africa did and still does not
sufficiently align with or support entrepreneurial activity.
Table 25 shows that, of all types of feeder education for
entrepreneurship, business and management education was
rated most efficient at 4. Vocational, professional and continuing
education systems scored second highest at 3.5. These are both
still low scores (10 being the highest score possible). Primary
and secondary education (in terms of promoting creativity,
laying out market economic principles and paying sufficient
attention to entrepreneurship) scored very low at 2.3 and 2.2
respectively.
As before, these scores need to be considered in the context of
the 4IR and the rapidly evolving digital economy. It is unlikely
that large corporations will in the future employ more people
(rather, they will contract); education systems will need to
provide learners with new capabilities for a fast changing world.
In particular, they need to be prepared for entrepreneurial
activity becoming a reality for more and more people.
Availability of and access to financeAccess to funding is a universal problem for most intentional
entrepreneurs. GEM studies have shown that the lack-of-funding
dilemma hinges on the tension between what the entrepreneur
can offer and what funders require.
At a very basic level, entrepreneurs need to be able to present
an acceptable business plan that clearly demonstrates
differentiation from other products and services (digital
platforms, product uniqueness and service proposition).
Market research is vital, but entrepreneurs often fail to properly
investigate the market. And then, of course, entrepreneurship
is also about having the requisite personal attributes such as
resilience and passion. Dealing with all of these business realities
and requirements demands knowledge, skill and the ability to
integrate.
There are plenty of potential funders in South Africa. For
a variety of reasons, though, the available funding is not
successfully channelling to those entrepreneurs who need it
most. Part of this challenge, as indicated above, is that pitching
to funders requires a deep dive into the business idea and a
great deal of thinking, testing and preparation.
Table 26 shows that the experts interviewed are fairly positive
about the availability of entrepreneurial finance. (South Africa’s
overall average for this framework condition is 4, compared to
the GEM global average of 4.5.)
All scores were lower in 2019 than in 2017, with government
subsidies for new and growing firms dropping the most (from
5.2 to 3.9). Private lender funding (including crowdfunding)
scored the lowest of all funding sources at 3.3.
Taking stock of progress and challenges
The National Entrepreneurial Context Index (NECI)
About the NECI
This index was introduced and discussed in Section 1 of this report. The NECI intends to fill the gap in the entrepreneurship literature by providing a single composite number that is able to express the average state and quality of the entrepreneurial ecosystem in any one country and compare it to that of other economies.
In essence, a country’s NECI index score is an indication of the ease with which its entrepreneurs can start and develop a business.
As can be seen from Tables 26 and Figure 444, South Africa is ranked 49th out of 54 economies, ahead of only Croatia,
Guatemala, Paraguay, Puerto Rico and Iran.
The conclusion is clear: South Africa’s entrepreneurial ecosystem is rated one of the worst in the sample of participating economies in 2019 and, from the detailed results
shown in this chapter, exhibited little sign of improvement over
the past few years; in many cases, it is on the decline.
The government should be the leading stakeholder by setting
new policy directions for supporting economic development in
general and entrepreneurial activity specifically. It is, however,
unrealistic to expect the government to be the sole driver of
change.
All stakeholders – including government, trade unions, the
private sector and the education sector – need to align their
thinking and their efforts to ensure a vibrant framework for
growth and inclusive economic participation.
44 GEM Adult Population Survey 2019. In Bosma, N. et al. (2020). GEM Global Report 2019/2020. Retrieved from http://www.gemconsortium.org/report
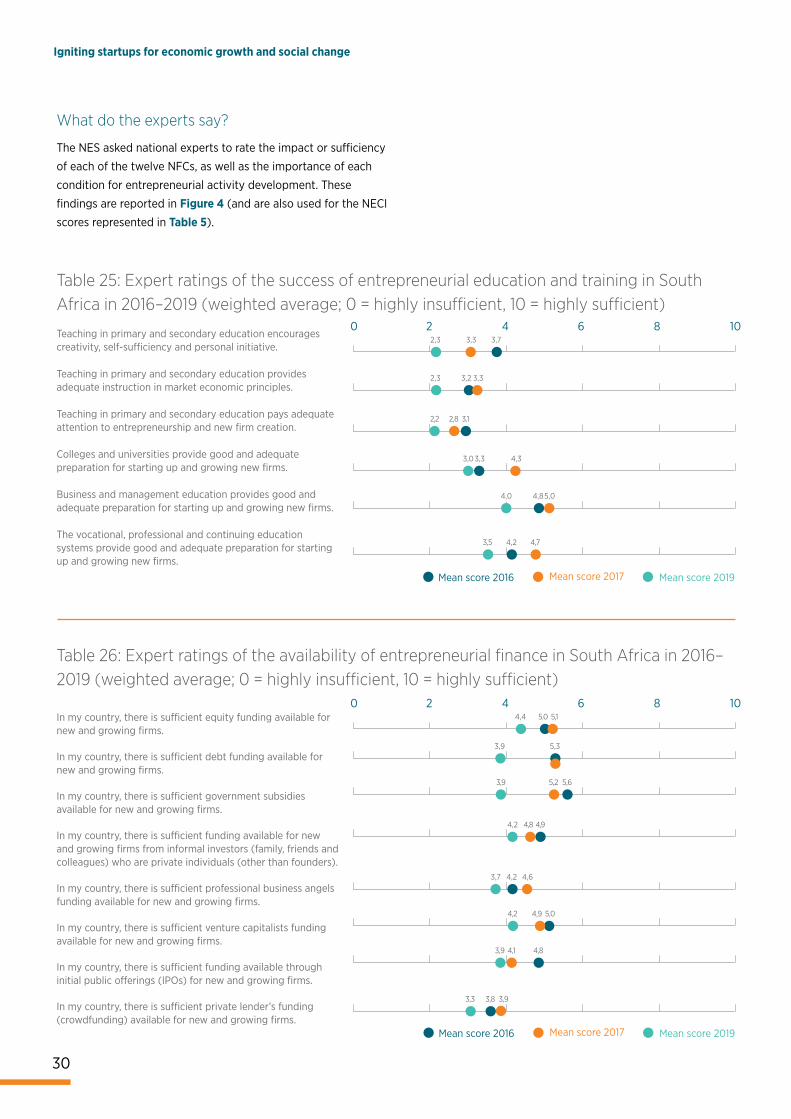
Section 3: The South African entrepreneurial ecosystem
30
Igniting startups for economic growth and social change
Table 26: Expert ratings of the availability of entrepreneurial finance in South Africa in 2016–2019 (weighted average; 0 = highly insufficient, 10 = highly sufficient)
Table 25: Expert ratings of the success of entrepreneurial education and training in South Africa in 2016–2019 (weighted average; 0 = highly insufficient, 10 = highly sufficient)
0 2 4 106 8
Mean score 2016 Mean score 2017 Mean score 2019
2,3 3,33,2
2,2 2,8 3,1
4,0 5,04,8
3,5 4,74,2
Teaching in primary and secondary education encourages creativity, self-sufficiency and personal initiative.
Teaching in primary and secondary education provides adequate instruction in market economic principles.
Teaching in primary and secondary education pays adequate attention to entrepreneurship and new firm creation.
Colleges and universities provide good and adequate preparation for starting up and growing new firms.
Business and management education provides good and adequate preparation for starting up and growing new firms.
The vocational, professional and continuing education systems provide good and adequate preparation for starting up and growing new firms.
3,73,32,3
3,03,3 4,3
0 2 4 106 8
Mean score 2016 Mean score 2017 Mean score 2019
3,9 5,3
3,9 5,2 5,6
3,7 4,64,2
4,2 4,9 5,0
In my country, there is sufficient equity funding available for new and growing firms.
In my country, there is sufficient debt funding available for new and growing firms.
In my country, there is sufficient government subsidies available for new and growing firms.
In my country, there is sufficient funding available for new and growing firms from informal investors (family, friends and colleagues) who are private individuals (other than founders).
In my country, there is sufficient professional business angels funding available for new and growing firms.
In my country, there is sufficient venture capitalists funding available for new and growing firms.
In my country, there is sufficient funding available through initial public offerings (IPOs) for new and growing firms.
In my country, there is sufficient private lender’s funding (crowdfunding) available for new and growing firms.
5.0 5,14,4
4,2 4,94,8
3,9 4,1 4,8
3,3 3,93,8
What do the experts say?
The NES asked national experts to rate the impact or sufficiency
of each of the twelve NFCs, as well as the importance of each
condition for entrepreneurial activity development. These
findings are reported in Figure 4 (and are also used for the NECI
scores represented in Table 5).
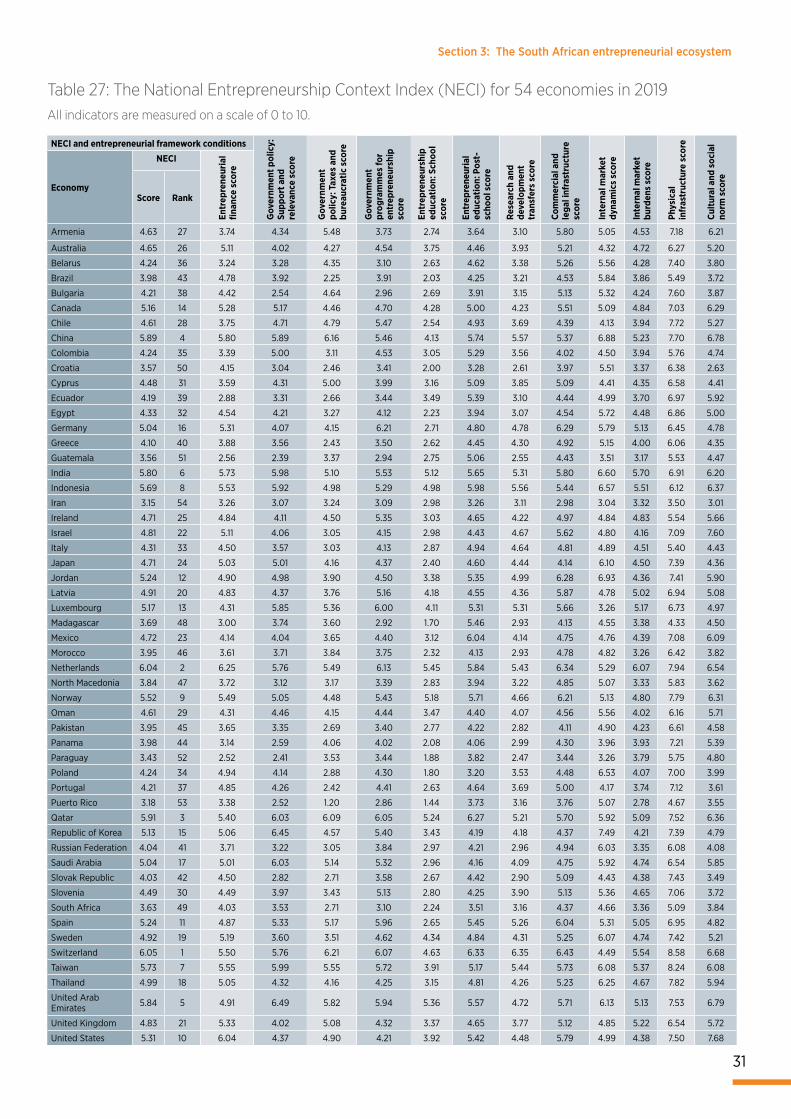
Section 3: The South African entrepreneurial ecosystem
31
Table 27: The National Entrepreneurship Context Index (NECI) for 54 economies in 2019All indicators are measured on a scale of 0 to 10.
NECI and entrepreneurial framework conditions
Gov
ernm
ent p
olic
y:
Supp
ort a
nd
rele
vanc
e sc
ore
Gov
ernm
ent
polic
y: T
axes
and
bu
reau
crat
ic s
core
Gov
ernm
ent
prog
ram
mes
for
entr
epre
neur
ship
sc
ore
Entr
epre
neur
ship
ed
ucat
ion:
Sch
ool
scor
e
Entr
epre
neur
ial
educ
atio
n: P
ost-
scho
ol s
core
Rese
arch
and
de
velo
pmen
t tr
ansf
ers
scor
e
Com
mer
cial
and
le
gal i
nfra
stru
ctur
e sc
ore
Inte
rnal
mar
ket
dyna
mic
s sc
ore
Inte
rnal
mar
ket
burd
ens
scor
e
Phys
ical
in
fras
truc
ture
sco
re
Cultu
ral a
nd s
ocia
l no
rm s
core
Economy
NECI
Entr
epre
neur
ial
finan
ce s
core
Score Rank
Armenia 4.63 27 3.74 4.34 5.48 3.73 2.74 3.64 3.10 5.80 5.05 4.53 7.18 6.21
Australia 4.65 26 5.11 4.02 4.27 4.54 3.75 4.46 3.93 5.21 4.32 4.72 6.27 5.20
Belarus 4.24 36 3.24 3.28 4.35 3.10 2.63 4.62 3.38 5.26 5.56 4.28 7.40 3.80
Brazil 3.98 43 4.78 3.92 2.25 3.91 2.03 4.25 3.21 4.53 5.84 3.86 5.49 3.72
Bulgaria 4.21 38 4.42 2.54 4.64 2.96 2.69 3.91 3.15 5.13 5.32 4.24 7.60 3.87
Canada 5.16 14 5.28 5.17 4.46 4.70 4.28 5.00 4.23 5.51 5.09 4.84 7.03 6.29
Chile 4.61 28 3.75 4.71 4.79 5.47 2.54 4.93 3.69 4.39 4.13 3.94 7.72 5.27
China 5.89 4 5.80 5.89 6.16 5.46 4.13 5.74 5.57 5.37 6.88 5.23 7.70 6.78
Colombia 4.24 35 3.39 5.00 3.11 4.53 3.05 5.29 3.56 4.02 4.50 3.94 5.76 4.74
Croatia 3.57 50 4.15 3.04 2.46 3.41 2.00 3.28 2.61 3.97 5.51 3.37 6.38 2.63
Cyprus 4.48 31 3.59 4.31 5.00 3.99 3.16 5.09 3.85 5.09 4.41 4.35 6.58 4.41
Ecuador 4.19 39 2.88 3.31 2.66 3.44 3.49 5.39 3.10 4.44 4.99 3.70 6.97 5.92
Egypt 4.33 32 4.54 4.21 3.27 4.12 2.23 3.94 3.07 4.54 5.72 4.48 6.86 5.00
Germany 5.04 16 5.31 4.07 4.15 6.21 2.71 4.80 4.78 6.29 5.79 5.13 6.45 4.78
Greece 4.10 40 3.88 3.56 2.43 3.50 2.62 4.45 4.30 4.92 5.15 4.00 6.06 4.35
Guatemala 3.56 51 2.56 2.39 3.37 2.94 2.75 5.06 2.55 4.43 3.51 3.17 5.53 4.47
India 5.80 6 5.73 5.98 5.10 5.53 5.12 5.65 5.31 5.80 6.60 5.70 6.91 6.20
Indonesia 5.69 8 5.53 5.92 4.98 5.29 4.98 5.98 5.56 5.44 6.57 5.51 6.12 6.37
Iran 3.15 54 3.26 3.07 3.24 3.09 2.98 3.26 3.11 2.98 3.04 3.32 3.50 3.01
Ireland 4.71 25 4.84 4.11 4.50 5.35 3.03 4.65 4.22 4.97 4.84 4.83 5.54 5.66
Israel 4.81 22 5.11 4.06 3.05 4.15 2.98 4.43 4.67 5.62 4.80 4.16 7.09 7.60
Italy 4.31 33 4.50 3.57 3.03 4.13 2.87 4.94 4.64 4.81 4.89 4.51 5.40 4.43
Japan 4.71 24 5.03 5.01 4.16 4.37 2.40 4.60 4.44 4.14 6.10 4.50 7.39 4.36
Jordan 5.24 12 4.90 4.98 3.90 4.50 3.38 5.35 4.99 6.28 6.93 4.36 7.41 5.90
Latvia 4.91 20 4.83 4.37 3.76 5.16 4.18 4.55 4.36 5.87 4.78 5.02 6.94 5.08
Luxembourg 5.17 13 4.31 5.85 5.36 6.00 4.11 5.31 5.31 5.66 3.26 5.17 6.73 4.97
Madagascar 3.69 48 3.00 3.74 3.60 2.92 1.70 5.46 2.93 4.13 4.55 3.38 4.33 4.50
Mexico 4.72 23 4.14 4.04 3.65 4.40 3.12 6.04 4.14 4.75 4.76 4.39 7.08 6.09
Morocco 3.95 46 3.61 3.71 3.84 3.75 2.32 4.13 2.93 4.78 4.82 3.26 6.42 3.82
Netherlands 6.04 2 6.25 5.76 5.49 6.13 5.45 5.84 5.43 6.34 5.29 6.07 7.94 6.54
North Macedonia 3.84 47 3.72 3.12 3.17 3.39 2.83 3.94 3.22 4.85 5.07 3.33 5.83 3.62
Norway 5.52 9 5.49 5.05 4.48 5.43 5.18 5.71 4.66 6.21 5.13 4.80 7.79 6.31
Oman 4.61 29 4.31 4.46 4.15 4.44 3.47 4.40 4.07 4.56 5.56 4.02 6.16 5.71
Pakistan 3.95 45 3.65 3.35 2.69 3.40 2.77 4.22 2.82 4.11 4.90 4.23 6.61 4.58
Panama 3.98 44 3.14 2.59 4.06 4.02 2.08 4.06 2.99 4.30 3.96 3.93 7.21 5.39
Paraguay 3.43 52 2.52 2.41 3.53 3.44 1.88 3.82 2.47 3.44 3.26 3.79 5.75 4.80
Poland 4.24 34 4.94 4.14 2.88 4.30 1.80 3.20 3.53 4.48 6.53 4.07 7.00 3.99
Portugal 4.21 37 4.85 4.26 2.42 4.41 2.63 4.64 3.69 5.00 4.17 3.74 7.12 3.61
Puerto Rico 3.18 53 3.38 2.52 1.20 2.86 1.44 3.73 3.16 3.76 5.07 2.78 4.67 3.55
Qatar 5.91 3 5.40 6.03 6.09 6.05 5.24 6.27 5.21 5.70 5.92 5.09 7.52 6.36
Republic of Korea 5.13 15 5.06 6.45 4.57 5.40 3.43 4.19 4.18 4.37 7.49 4.21 7.39 4.79
Russian Federation 4.04 41 3.71 3.22 3.05 3.84 2.97 4.21 2.96 4.94 6.03 3.35 6.08 4.08
Saudi Arabia 5.04 17 5.01 6.03 5.14 5.32 2.96 4.16 4.09 4.75 5.92 4.74 6.54 5.85
Slovak Republic 4.03 42 4.50 2.82 2.71 3.58 2.67 4.42 2.90 5.09 4.43 4.38 7.43 3.49
Slovenia 4.49 30 4.49 3.97 3.43 5.13 2.80 4.25 3.90 5.13 5.36 4.65 7.06 3.72
South Africa 3.63 49 4.03 3.53 2.71 3.10 2.24 3.51 3.16 4.37 4.66 3.36 5.09 3.84
Spain 5.24 11 4.87 5.33 5.17 5.96 2.65 5.45 5.26 6.04 5.31 5.05 6.95 4.82
Sweden 4.92 19 5.19 3.60 3.51 4.62 4.34 4.84 4.31 5.25 6.07 4.74 7.42 5.21
Switzerland 6.05 1 5.50 5.76 6.21 6.07 4.63 6.33 6.35 6.43 4.49 5.54 8.58 6.68
Taiwan 5.73 7 5.55 5.99 5.55 5.72 3.91 5.17 5.44 5.73 6.08 5.37 8.24 6.08
Thailand 4.99 18 5.05 4.32 4.16 4.25 3.15 4.81 4.26 5.23 6.25 4.67 7.82 5.94
United Arab Emirates 5.84 5 4.91 6.49 5.82 5.94 5.36 5.57 4.72 5.71 6.13 5.13 7.53 6.79
United Kingdom 4.83 21 5.33 4.02 5.08 4.32 3.37 4.65 3.77 5.12 4.85 5.22 6.54 5.72
United States 5.31 10 6.04 4.37 4.90 4.21 3.92 5.42 4.48 5.79 4.99 4.38 7.50 7.68
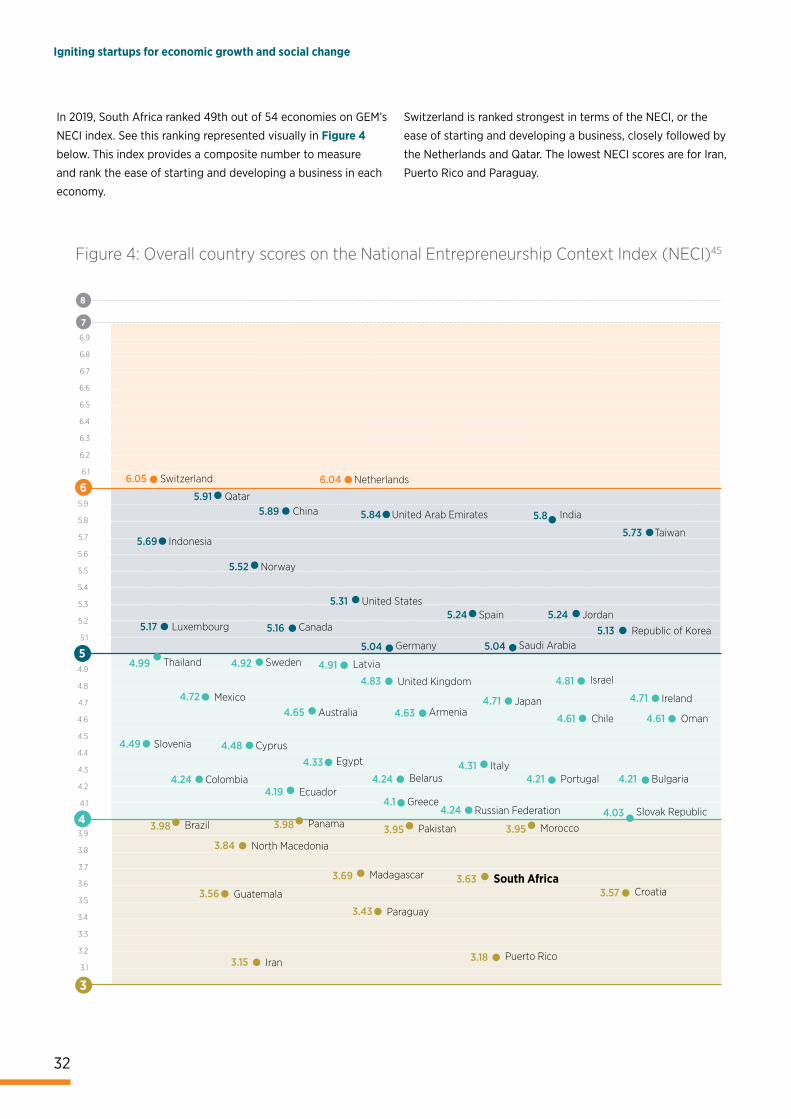
Section 3: The South African entrepreneurial ecosystem
32
Igniting startups for economic growth and social change
Figure 4: Overall country scores on the National Entrepreneurship Context Index (NECI)45
5.1
4.1
3.1
6.1
5.2
4.2
3.2
6.2
5.3
4.3
3.3
6.3
5.4
4.4
3.4
6.4
5.5
4.5
3.5
6.5
5.6
4.6
3.6
6.6
5.7
4.7
3.7
6.7
5.8
4.8
3.8
6.8
5.9
4.9
3.9
6.9
Switzerland Netherlands
QatarChina United Arab Emirates
6.05 6.04
5.915.89 5.84
6
India
TaiwanIndonesia
Norway
United StatesSpain Jordan
Luxembourg Canada Republic of KoreaGermany Saudi Arabia
Thailand Sweden Latvia
United Kingdom Israel
CroatiaGuatemala
Paraguay
Puerto RicoIran
Slovenia Cyprus
Egypt Italy Portugal Bulgaria
Brazil Panama Pakistan Morocco
EcuadorGreece
Colombia
Russian Federation
Belarus
North Macedonia
Madagascar South Africa
Mexico Japan IrelandAustralia Armenia
Slovak Republic
Chile Oman
5.8
5.735.69
5.52
5.315.24 5.24
5.17 5.16 5.135.04 5.04
4.99 4.92 4.914.83 4.81
3.573.56
3.43
3.183.15
4.49 4.48
4.33 4.314.21 4.21
3.98 3.98 3.95 3.95
4.194.1
4.24
4.24
4.24
3.84
3.69 3.63
4.72 4.71 4.714.65 4.63
4.03
4.61 4.61
3
4
5
7
8
In 2019, South Africa ranked 49th out of 54 economies on GEM’s
NECI index. See this ranking represented visually in Figure 4
below. This index provides a composite number to measure
and rank the ease of starting and developing a business in each
economy.
Switzerland is ranked strongest in terms of the NECI, or the
ease of starting and developing a business, closely followed by
the Netherlands and Qatar. The lowest NECI scores are for Iran,
Puerto Rico and Paraguay.
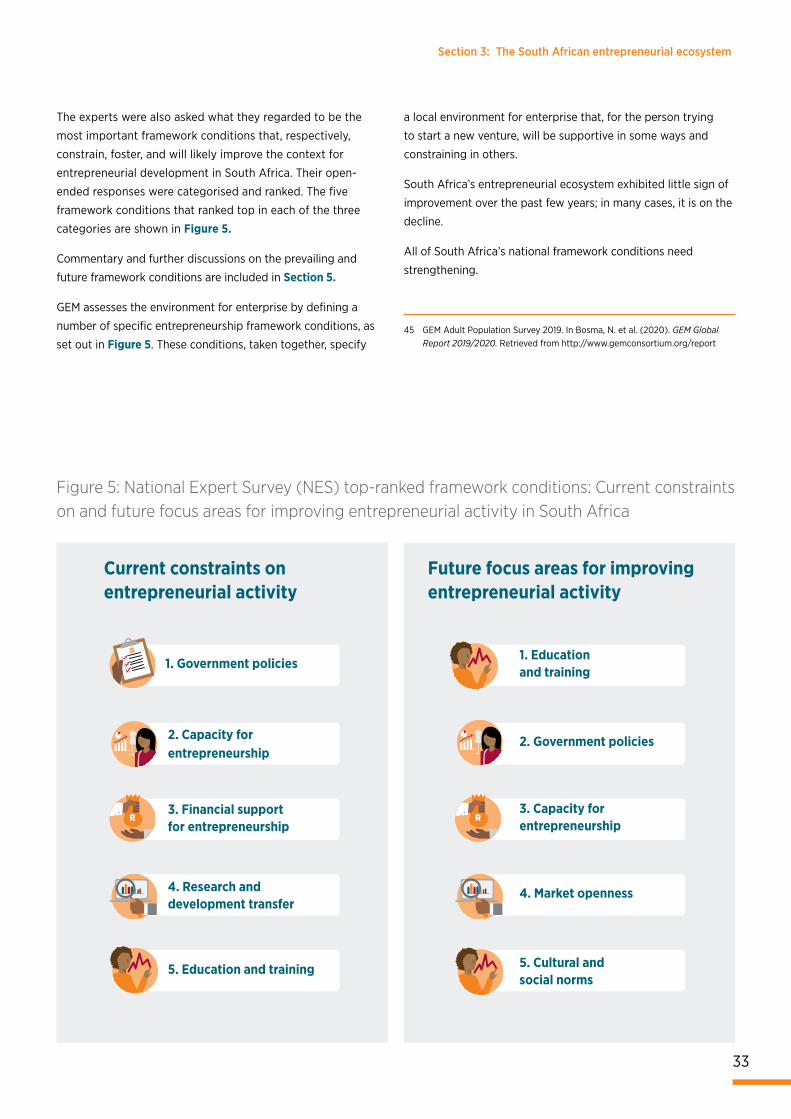
Section 3: The South African entrepreneurial ecosystem
33
45 GEM Adult Population Survey 2019. In Bosma, N. et al. (2020). GEM Global Report 2019/2020. Retrieved from http://www.gemconsortium.org/report
Figure 5: National Expert Survey (NES) top-ranked framework conditions: Current constraints on and future focus areas for improving entrepreneurial activity in South Africa
Current constraints on entrepreneurial activity
Future focus areas for improving entrepreneurial activity
1. Government policies
2. Capacity for entrepreneurship
3. Financial support for entrepreneurship
5. Education and training
4. Research and development transfer
1. Education and training
2. Government policies
3. Capacity for entrepreneurship
4. Market openness
5. Cultural and social norms
R R
The experts were also asked what they regarded to be the
most important framework conditions that, respectively,
constrain, foster, and will likely improve the context for
entrepreneurial development in South Africa. Their open-
ended responses were categorised and ranked. The five
framework conditions that ranked top in each of the three
categories are shown in Figure 5.
Commentary and further discussions on the prevailing and
future framework conditions are included in Section 5.
GEM assesses the environment for enterprise by defining a
number of specific entrepreneurship framework conditions, as
set out in Figure 5. These conditions, taken together, specify
a local environment for enterprise that, for the person trying
to start a new venture, will be supportive in some ways and
constraining in others.
South Africa’s entrepreneurial ecosystem exhibited little sign of
improvement over the past few years; in many cases, it is on the
decline.
All of South Africa’s national framework conditions need
strengthening.

PAID
PAID
PAID
PAID
35
SECTION 4
58.2%
Minding the gap:Igniting entrepreneurship in the digital economy
Gender disparities and lack of youth support in entrepreneurship continue to deplete the stock of new businesses and thereby drain economic potential. Although women are increasingly assuming a stronger, more robust role in the economy, they still lag behind men significantly in many areas. In this section, we provide some perspectives on the role of women and the youth in entrepreneurship, specifically within the context of the digital economy in Africa and, more locally, South Africa.
Perspectives on women and youth in entrepreneurshipby Dr Njeri Mwagiru, Senior Futurist: Africa, Institute for Futures Research (IFR), University
of Stellenbosch Business School (USB)
OverviewA futures-oriented view is shared here in a brief reflection on the emerging 4IR and digital
economy trends. The focus is on opportunities and challenges presented for women
and youth in entrepreneurship, with a spotlight on the African region and South Africa
specifically.
The discussion reflects on digital economy trends and issues that impact women and youth
entrepreneurship at three main levels:
• the macro or global level (4IR digitisation trends, resultant shifts in the world of work,
and entrepreneurship opportunities);
• the continental or regional level (the new emerging policy environment under the
ambit of the Africa Continental Free Trade Area (ACTFA), and implications for business
growth and development); and
• the national or country level (the South African socio-political and economic context).
High-impact intervention points for the nurturing of women and youth entrepreneurs in a
digital economy are indicated in closing.
Unemployment rate among the youth (aged between 15 and 24 years)
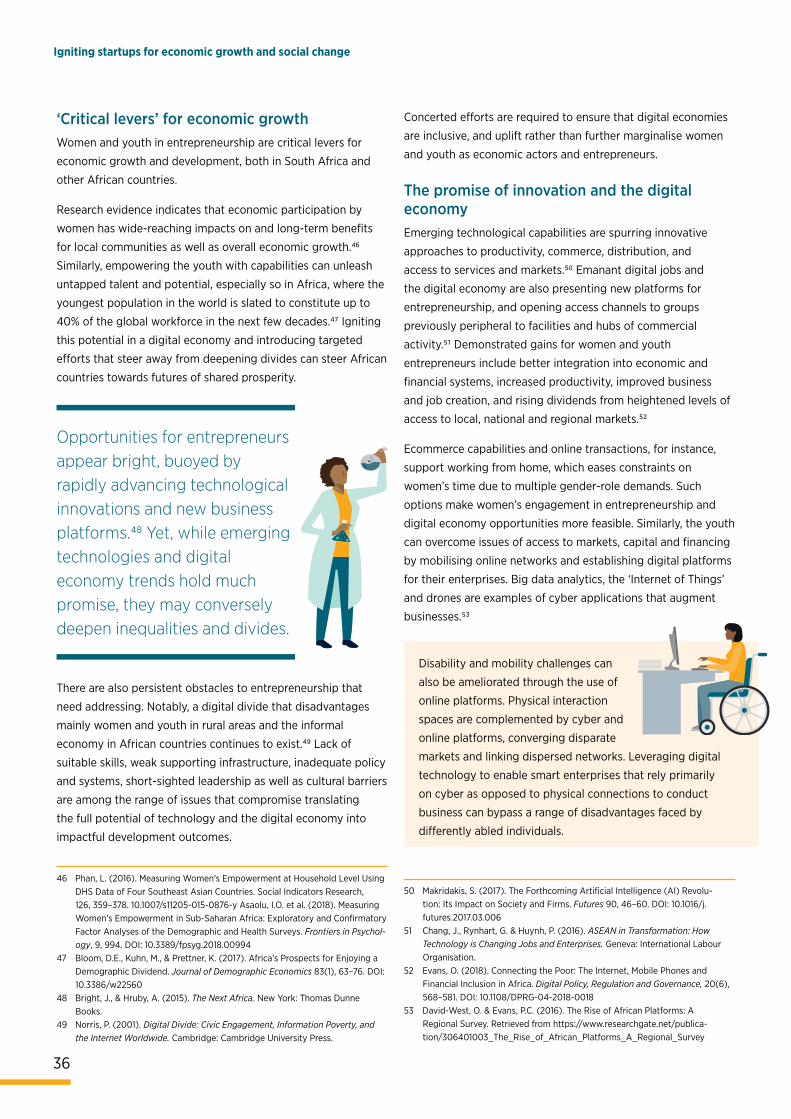
Section 4: Minding the gap: Igniting entrepreneurship in the digital economy
36
Igniting startups for economic growth and social change
‘Critical levers’ for economic growthWomen and youth in entrepreneurship are critical levers for
economic growth and development, both in South Africa and
other African countries.
Research evidence indicates that economic participation by
women has wide-reaching impacts on and long-term benefits
for local communities as well as overall economic growth.46
Similarly, empowering the youth with capabilities can unleash
untapped talent and potential, especially so in Africa, where the
youngest population in the world is slated to constitute up to
40% of the global workforce in the next few decades.47 Igniting
this potential in a digital economy and introducing targeted
efforts that steer away from deepening divides can steer African
countries towards futures of shared prosperity.
There are also persistent obstacles to entrepreneurship that
need addressing. Notably, a digital divide that disadvantages
mainly women and youth in rural areas and the informal
economy in African countries continues to exist.49 Lack of
suitable skills, weak supporting infrastructure, inadequate policy
and systems, short-sighted leadership as well as cultural barriers
are among the range of issues that compromise translating
the full potential of technology and the digital economy into
impactful development outcomes.
Concerted efforts are required to ensure that digital economies
are inclusive, and uplift rather than further marginalise women
and youth as economic actors and entrepreneurs.
The promise of innovation and the digital economyEmerging technological capabilities are spurring innovative
approaches to productivity, commerce, distribution, and
access to services and markets.50 Emanant digital jobs and
the digital economy are also presenting new platforms for
entrepreneurship, and opening access channels to groups
previously peripheral to facilities and hubs of commercial
activity.51 Demonstrated gains for women and youth
entrepreneurs include better integration into economic and
financial systems, increased productivity, improved business
and job creation, and rising dividends from heightened levels of
access to local, national and regional markets.52
Ecommerce capabilities and online transactions, for instance,
support working from home, which eases constraints on
women’s time due to multiple gender-role demands. Such
options make women’s engagement in entrepreneurship and
digital economy opportunities more feasible. Similarly, the youth
can overcome issues of access to markets, capital and financing
by mobilising online networks and establishing digital platforms
for their enterprises. Big data analytics, the ‘Internet of Things’
and drones are examples of cyber applications that augment
businesses.53
46 Phan, L. (2016). Measuring Women’s Empowerment at Household Level Using DHS Data of Four Southeast Asian Countries. Social Indicators Research, 126, 359–378. 10.1007/s11205-015-0876-y Asaolu, I.O. et al. (2018). Measuring Women’s Empowerment in Sub-Saharan Africa: Exploratory and Confirmatory Factor Analyses of the Demographic and Health Surveys. Frontiers in Psychol-ogy, 9, 994. DOI: 10.3389/fpsyg.2018.00994
47 Bloom, D.E., Kuhn, M., & Prettner, K. (2017). Africa’s Prospects for Enjoying a Demographic Dividend. Journal of Demographic Economics 83(1), 63–76. DOI: 10.3386/w22560
48 Bright, J., & Hruby, A. (2015). The Next Africa. New York: Thomas Dunne Books.
49 Norris, P. (2001). Digital Divide: Civic Engagement, Information Poverty, and the Internet Worldwide. Cambridge: Cambridge University Press.
Opportunities for entrepreneurs appear bright, buoyed by rapidly advancing technological innovations and new business platforms.48 Yet, while emerging technologies and digital economy trends hold much promise, they may conversely deepen inequalities and divides.
Disability and mobility challenges can
also be ameliorated through the use of
online platforms. Physical interaction
spaces are complemented by cyber and
online platforms, converging disparate
markets and linking dispersed networks. Leveraging digital
technology to enable smart enterprises that rely primarily
on cyber as opposed to physical connections to conduct
business can bypass a range of disadvantages faced by
differently abled individuals.
50 Makridakis, S. (2017). The Forthcoming Artificial Intelligence (AI) Revolu-tion: Its Impact on Society and Firms. Futures 90, 46–60. DOI: 10.1016/j.futures.2017.03.006
51 Chang, J., Rynhart, G. & Huynh, P. (2016). ASEAN in Transformation: How Technology is Changing Jobs and Enterprises. Geneva: International Labour Organisation.
52 Evans, O. (2018). Connecting the Poor: The Internet, Mobile Phones and Financial Inclusion in Africa. Digital Policy, Regulation and Governance, 20(6), 568–581. DOI: 10.1108/DPRG-04-2018-0018
53 David-West, O. & Evans, P.C. (2016). The Rise of African Platforms: A Regional Survey. Retrieved from https://www.researchgate.net/publica-tion/306401003_The_Rise_of_African_Platforms_A_Regional_Survey
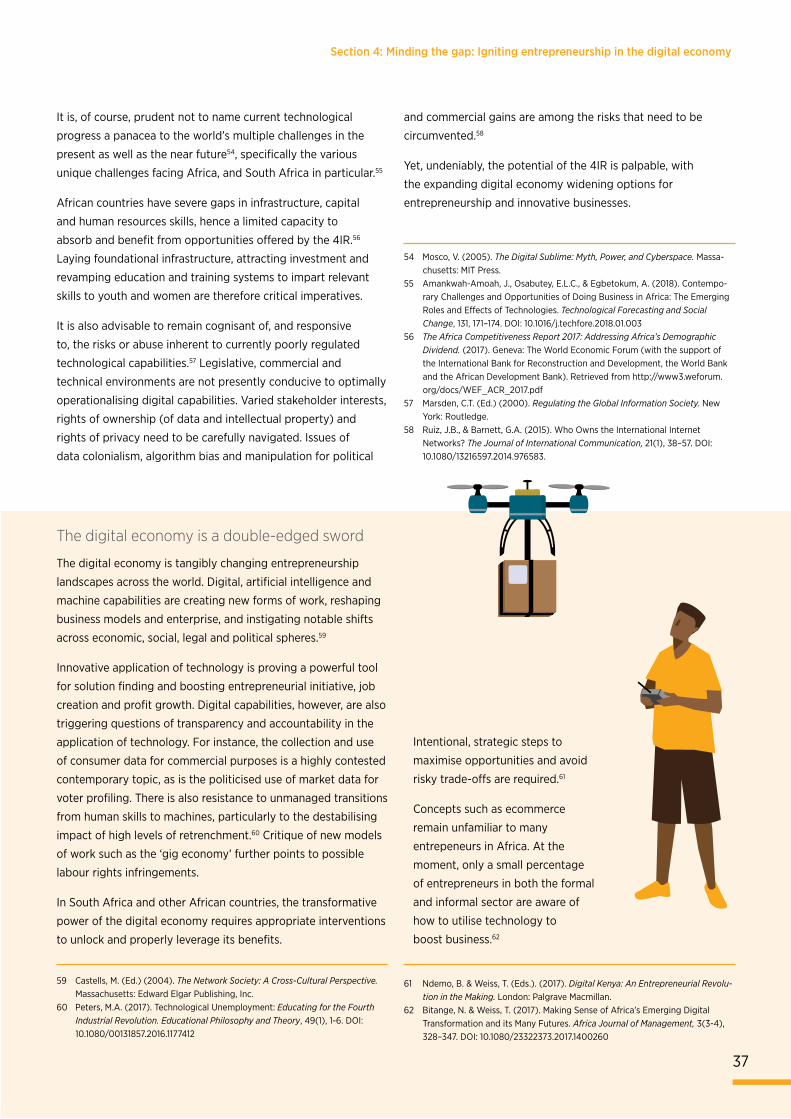
Section 4: Minding the gap: Igniting entrepreneurship in the digital economy
It is, of course, prudent not to name current technological
progress a panacea to the world’s multiple challenges in the
present as well as the near future54, specifically the various
unique challenges facing Africa, and South Africa in particular.55
African countries have severe gaps in infrastructure, capital
and human resources skills, hence a limited capacity to
absorb and benefit from opportunities offered by the 4IR.56
Laying foundational infrastructure, attracting investment and
revamping education and training systems to impart relevant
skills to youth and women are therefore critical imperatives.
It is also advisable to remain cognisant of, and responsive
to, the risks or abuse inherent to currently poorly regulated
technological capabilities.57 Legislative, commercial and
technical environments are not presently conducive to optimally
operationalising digital capabilities. Varied stakeholder interests,
rights of ownership (of data and intellectual property) and
rights of privacy need to be carefully navigated. Issues of
data colonialism, algorithm bias and manipulation for political
The digital economy is a double-edged sword
The digital economy is tangibly changing entrepreneurship
landscapes across the world. Digital, artificial intelligence and
machine capabilities are creating new forms of work, reshaping
business models and enterprise, and instigating notable shifts
across economic, social, legal and political spheres.59
Innovative application of technology is proving a powerful tool
for solution finding and boosting entrepreneurial initiative, job
creation and profit growth. Digital capabilities, however, are also
triggering questions of transparency and accountability in the
application of technology. For instance, the collection and use
of consumer data for commercial purposes is a highly contested
contemporary topic, as is the politicised use of market data for
voter profiling. There is also resistance to unmanaged transitions
from human skills to machines, particularly to the destabilising
impact of high levels of retrenchment.60 Critique of new models
of work such as the ‘gig economy’ further points to possible
labour rights infringements.
In South Africa and other African countries, the transformative
power of the digital economy requires appropriate interventions
to unlock and properly leverage its benefits.
and commercial gains are among the risks that need to be
circumvented.58
Yet, undeniably, the potential of the 4IR is palpable, with
the expanding digital economy widening options for
entrepreneurship and innovative businesses.
Intentional, strategic steps to
maximise opportunities and avoid
risky trade-offs are required.61
Concepts such as ecommerce
remain unfamiliar to many
entrepeneurs in Africa. At the
moment, only a small percentage
of entrepreneurs in both the formal
and informal sector are aware of
how to utilise technology to
boost business.62
54 Mosco, V. (2005). The Digital Sublime: Myth, Power, and Cyberspace. Massa-chusetts: MIT Press.
55 Amankwah-Amoah, J., Osabutey, E.L.C., & Egbetokum, A. (2018). Contempo-rary Challenges and Opportunities of Doing Business in Africa: The Emerging Roles and Effects of Technologies. Technological Forecasting and Social Change, 131, 171–174. DOI: 10.1016/j.techfore.2018.01.003
56 The Africa Competitiveness Report 2017: Addressing Africa’s Demographic Dividend. (2017). Geneva: The World Economic Forum (with the support of the International Bank for Reconstruction and Development, the World Bank and the African Development Bank). Retrieved from http://www3.weforum.org/docs/WEF_ACR_2017.pdf
57 Marsden, C.T. (Ed.) (2000). Regulating the Global Information Society. New York: Routledge.
58 Ruiz, J.B., & Barnett, G.A. (2015). Who Owns the International Internet Networks? The Journal of International Communication, 21(1), 38–57. DOI: 10.1080/13216597.2014.976583.
59 Castells, M. (Ed.) (2004). The Network Society: A Cross-Cultural Perspective. Massachusetts: Edward Elgar Publishing, Inc.
60 Peters, M.A. (2017). Technological Unemployment: Educating for the Fourth Industrial Revolution. Educational Philosophy and Theory, 49(1), 1-6. DOI: 10.1080/00131857.2016.1177412
61 Ndemo, B. & Weiss, T. (Eds.). (2017). Digital Kenya: An Entrepreneurial Revolu-tion in the Making. London: Palgrave Macmillan.
62 Bitange, N. & Weiss, T. (2017). Making Sense of Africa’s Emerging Digital Transformation and its Many Futures. Africa Journal of Management, 3(3-4), 328–347. DOI: 10.1080/23322373.2017.1400260
37
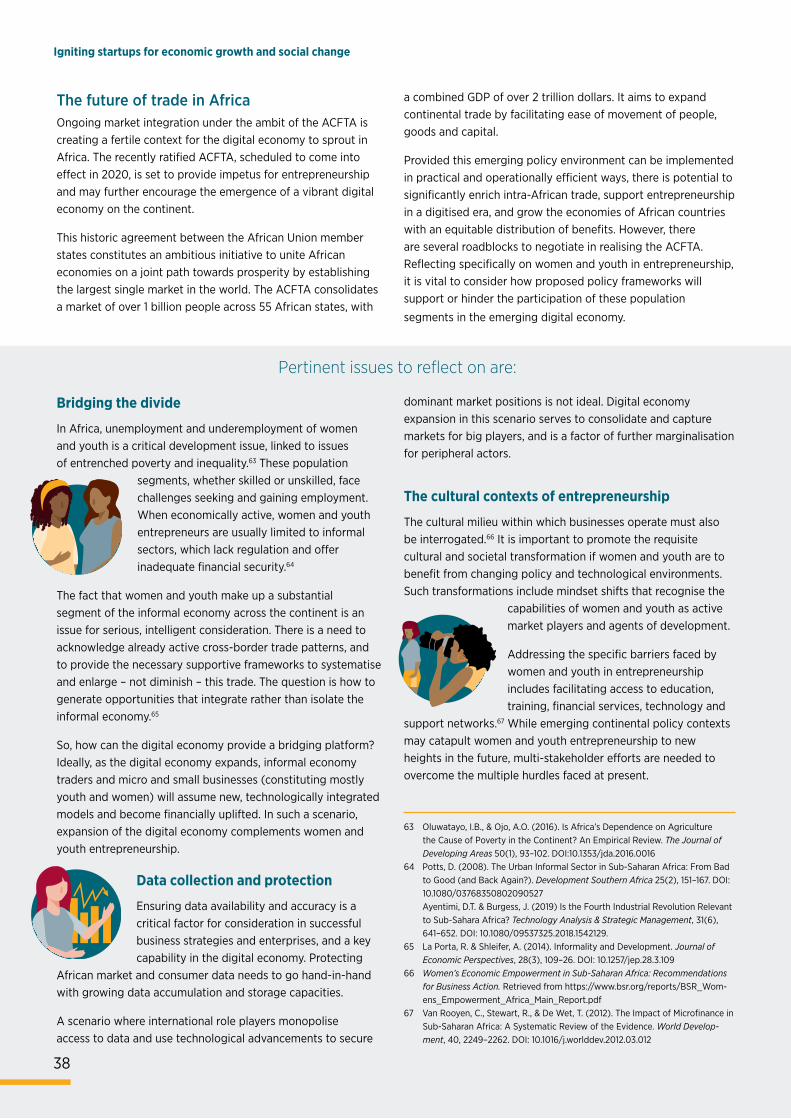
Section 4: Minding the gap: Igniting entrepreneurship in the digital economy
38
Igniting startups for economic growth and social change
The future of trade in AfricaOngoing market integration under the ambit of the ACFTA is creating a fertile context for the digital economy to sprout in Africa. The recently ratified ACFTA, scheduled to come into effect in 2020, is set to provide impetus for entrepreneurship and may further encourage the emergence of a vibrant digital economy on the continent.
This historic agreement between the African Union member states constitutes an ambitious initiative to unite African economies on a joint path towards prosperity by establishing the largest single market in the world. The ACFTA consolidates a market of over 1 billion people across 55 African states, with
a combined GDP of over 2 trillion dollars. It aims to expand continental trade by facilitating ease of movement of people, goods and capital.
Provided this emerging policy environment can be implemented in practical and operationally efficient ways, there is potential to significantly enrich intra-African trade, support entrepreneurship in a digitised era, and grow the economies of African countries with an equitable distribution of benefits. However, there are several roadblocks to negotiate in realising the ACFTA. Reflecting specifically on women and youth in entrepreneurship, it is vital to consider how proposed policy frameworks will support or hinder the participation of these population
segments in the emerging digital economy.
Bridging the divide
In Africa, unemployment and underemployment of women and youth is a critical development issue, linked to issues of entrenched poverty and inequality.63 These population
segments, whether skilled or unskilled, face challenges seeking and gaining employment. When economically active, women and youth entrepreneurs are usually limited to informal sectors, which lack regulation and offer inadequate financial security.64
The fact that women and youth make up a substantial segment of the informal economy across the continent is an issue for serious, intelligent consideration. There is a need to acknowledge already active cross-border trade patterns, and to provide the necessary supportive frameworks to systematise and enlarge – not diminish – this trade. The question is how to generate opportunities that integrate rather than isolate the informal economy.65
So, how can the digital economy provide a bridging platform? Ideally, as the digital economy expands, informal economy traders and micro and small businesses (constituting mostly youth and women) will assume new, technologically integrated models and become financially uplifted. In such a scenario, expansion of the digital economy complements women and youth entrepreneurship.
Data collection and protection
Ensuring data availability and accuracy is a critical factor for consideration in successful business strategies and enterprises, and a key capability in the digital economy. Protecting
African market and consumer data needs to go hand-in-hand with growing data accumulation and storage capacities.
A scenario where international role players monopolise access to data and use technological advancements to secure
dominant market positions is not ideal. Digital economy expansion in this scenario serves to consolidate and capture markets for big players, and is a factor of further marginalisation for peripheral actors.
The cultural contexts of entrepreneurship
The cultural milieu within which businesses operate must also be interrogated.66 It is important to promote the requisite cultural and societal transformation if women and youth are to benefit from changing policy and technological environments. Such transformations include mindset shifts that recognise the
capabilities of women and youth as active market players and agents of development.
Addressing the specific barriers faced by women and youth in entrepreneurship includes facilitating access to education, training, financial services, technology and
support networks.67 While emerging continental policy contexts may catapult women and youth entrepreneurship to new heights in the future, multi-stakeholder efforts are needed to overcome the multiple hurdles faced at present.
Pertinent issues to reflect on are:
63 Oluwatayo, I.B., & Ojo, A.O. (2016). Is Africa’s Dependence on Agriculture the Cause of Poverty in the Continent? An Empirical Review. The Journal of Developing Areas 50(1), 93–102. DOI:10.1353/jda.2016.0016
64 Potts, D. (2008). The Urban Informal Sector in Sub-Saharan Africa: From Bad to Good (and Back Again?). Development Southern Africa 25(2), 151–167. DOI: 10.1080/03768350802090527
Ayentimi, D.T. & Burgess, J. (2019) Is the Fourth Industrial Revolution Relevant to Sub-Sahara Africa? Technology Analysis & Strategic Management, 31(6), 641–652. DOI: 10.1080/09537325.2018.1542129.
65 La Porta, R. & Shleifer, A. (2014). Informality and Development. Journal of Economic Perspectives, 28(3), 109–26. DOI: 10.1257/jep.28.3.109
66 Women’s Economic Empowerment in Sub-Saharan Africa: Recommendations for Business Action. Retrieved from https://www.bsr.org/reports/BSR_Wom-ens_Empowerment_Africa_Main_Report.pdf
67 Van Rooyen, C., Stewart, R., & De Wet, T. (2012). The Impact of Microfinance in Sub-Saharan Africa: A Systematic Review of the Evidence. World Develop-ment, 40, 2249–2262. DOI: 10.1016/j.worlddev.2012.03.012
38
Section 4: Minding the gap: Igniting entrepreneurship in the digital economy
39
Hurdles to entrepreneurship in South AfricaThe South African economy is currently teetering on the brink of
a recession, registering a 43% decline in GDP growth in the just-
completed 2010s decade, compared to the 2000s decade. This
marked economic decline is intensifying national unemployment
rates, which are at 29% – the highest rate recorded in the
last decade. Employment rates among the youth and women
are showing a concerning deterioration.39 Additionally, crime
statistics are bleak and the political context is unpredictable.
The issue of xenophobia is another dimension to note in the
context of the ACFTA.
This context has evident consequences for business and
entrepreneurship, with low investor confidence adding to the
cycle of poor economic performance and social discontent.
Several core issues underpin current national challenges
in South Africa and directly impact women and youth
entrepreneurship including:
• a public sector that has suffered under the strain of
mismanagement and poor leadership over the past decade,
thereby creating unfriendly business environments and
compromising economic growth;
• an education sector that is poorly resourced,
underperforming and ill-equipped to train entrepreneurs in
preparation for the 4IR; and
• continued inequalities held in place by sustained socio-
economic stratifications. (Women and youth entrepreneurs,
particularly those from informal sectors and rural areas,
face constricted market access.)
State-led transformation for an equitable futureThe commitment of the South African government to economic
and social transformation among previously disadvantaged
populations must be acknowledged. Several mechanisms,
e.g. broad-based black economic empowerment, have been
activated and supported by the state, in collaboration with
various partners. These efforts are contributing – to some
extent – to redressing historical legacies of exclusion and
marginalisation.
Mandated by South African president Cyril Ramaphosa,
the YES initiative aims to be an engine of job creation by
leveraging emerging technological landscapes. The intention is
to transform business practices and nurture entrepreneurship,
enterprise development and growth, thereby “actively building
new ways to create new jobs, in new places.”
Another recent notable example is the establishment of
the South African Presidential Commission on the 4IR,
also appointed by President Ramaphosa. The 31-member
commission is an advisory group mandated to assist the
government’s development of 4IR policies and frameworks for
implementation. The commission is developing a multi-sectoral
4IR strategy which requires the coordination, monitoring and
assessment of multi-sectoral initiatives. The aim is to ready
South Africa’s response to rapid digitisation while positioning
the economy as smart, connected, regionally influential and
globally competitive.
An unconnected Africa
African countries continue to be
affected by the digital divide, half
the continent’s population not
having access to mobile broadband
or the internet.68 The largest
proportion of this number is made
up of women, mostly located in rural areas. It is
estimated that up to half a billion rural and low-
income African women do not have a mobile phone
or internet access. The gender-based digital divide is
an important issue to address if the challenges that
women entrepreneurs in these regions already face
are not to be compounded.
The Youth Employment Service (YES) initiative is a recent notable example targeted at assisting youth with skills training, business development and access to markets and employment opportunities. As a unique collaboration between the government, business and labour sectors, the initiative is a step towards solving youth unemployment.
68 Mutsvairo, B., & Ragnedda, M. (2019). Mapping the Digital Divide in Africa: A Mediated Analysis. Amsterdam: Amsterdam University Press.69 Magwentshu, N., Rajagopaul, A., Chui, M. & Singh, A. (2019). The future of work in South Africa: Digitisation, Productivity and Job Creation. Retrieved from https://
www.mckinsey.com/~/media/mckinsey/featured%20insights/middle%20east%20and%20africa/the%20future%20of%20work%20in%20south%20africa%20digitisa-tion%20productivity%20and%20job%20creation/the-future-of-work-in-south-africa.ashx
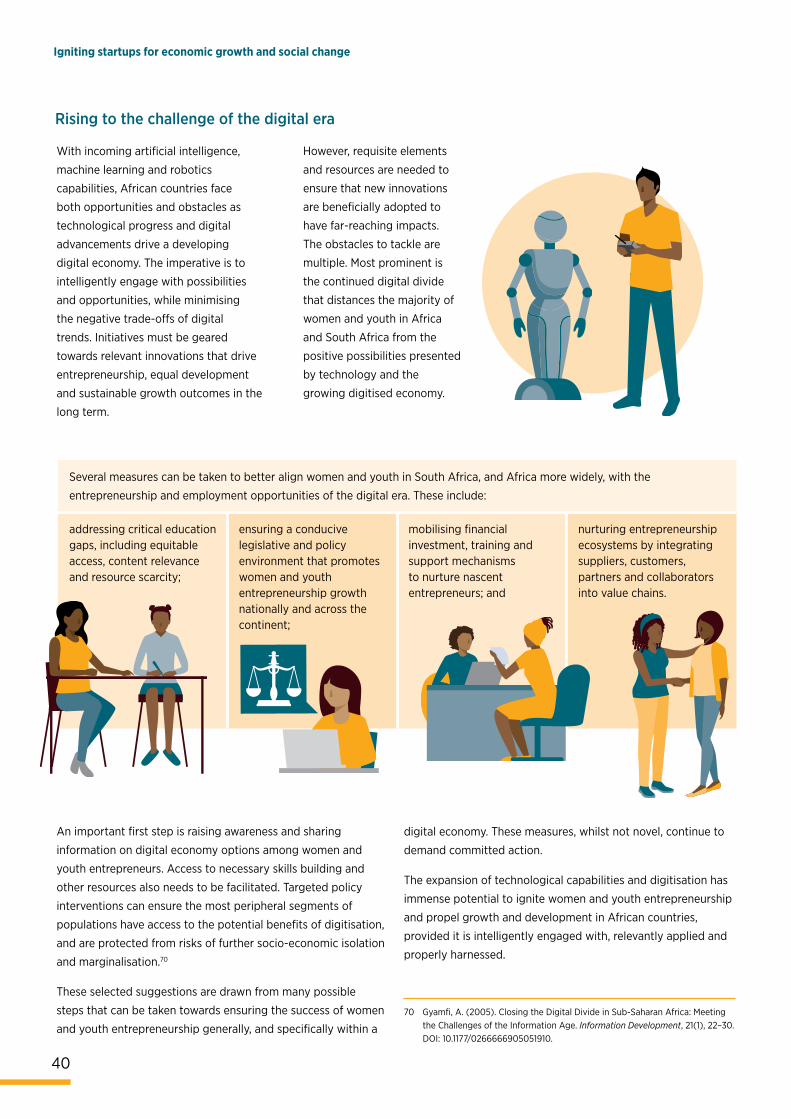
40
Igniting startups for economic growth and social change
Rising to the challenge of the digital era
An important first step is raising awareness and sharing
information on digital economy options among women and
youth entrepreneurs. Access to necessary skills building and
other resources also needs to be facilitated. Targeted policy
interventions can ensure the most peripheral segments of
populations have access to the potential benefits of digitisation,
and are protected from risks of further socio-economic isolation
and marginalisation.70
These selected suggestions are drawn from many possible
steps that can be taken towards ensuring the success of women
and youth entrepreneurship generally, and specifically within a
However, requisite elements
and resources are needed to
ensure that new innovations
are beneficially adopted to
have far-reaching impacts.
The obstacles to tackle are
multiple. Most prominent is
the continued digital divide
that distances the majority of
women and youth in Africa
and South Africa from the
positive possibilities presented
by technology and the
growing digitised economy.
With incoming artificial intelligence,
machine learning and robotics
capabilities, African countries face
both opportunities and obstacles as
technological progress and digital
advancements drive a developing
digital economy. The imperative is to
intelligently engage with possibilities
and opportunities, while minimising
the negative trade-offs of digital
trends. Initiatives must be geared
towards relevant innovations that drive
entrepreneurship, equal development
and sustainable growth outcomes in the
long term.
digital economy. These measures, whilst not novel, continue to
demand committed action.
The expansion of technological capabilities and digitisation has
immense potential to ignite women and youth entrepreneurship
and propel growth and development in African countries,
provided it is intelligently engaged with, relevantly applied and
properly harnessed.
Several measures can be taken to better align women and youth in South Africa, and Africa more widely, with the
entrepreneurship and employment opportunities of the digital era. These include:
addressing critical education gaps, including equitable access, content relevance and resource scarcity;
ensuring a conducive legislative and policy environment that promotes women and youth entrepreneurship growth nationally and across the continent;
mobilising financial investment, training and support mechanisms to nurture nascent entrepreneurs; and
nurturing entrepreneurship ecosystems by integrating suppliers, customers, partners and collaborators into value chains.
70 Gyamfi, A. (2005). Closing the Digital Divide in Sub-Saharan Africa: Meeting the Challenges of the Information Age. Information Development, 21(1), 22–30. DOI: 10.1177/0266666905051910.
SECTION 5
41
IntroductionFrom a global perspective, South Africa’s performance on key entrepreneurship activity
drivers is disappointing. In 2019, the country ranked a lowly 49 out of 54 economies on
GEM’s NECI and 60 out of 141 economies on the Global Competitiveness Index (only a slight
improvement from 2018). It also ranked 84 out of 190 economies in the World Bank Doing
Business 2020 study.
The GEM SA 2019/2020 results, as detailed in this report, indicate that there have not been many tangible entrepreneurship gains from 2017 and that, in many instances, there has
been a regression. Undoubtedly, these results have been affected by prevailing economic
and related domestic realities.
The findings and recommendations below are formulated on the basis of the 2019/2020
GEM SA findings. It assumes a positive outlook on the emergent government intentions
to turn the economy around, and holds an expectation that the private sector and other
stakeholders will align on the entrepreneurship development agenda to make a positive,
definitive impact on inclusive economic growth and revival.
The findings and recommendations relate to four core factors: South Africa’s national
framework conditions (NFCs), the entrepreneurial ecosystem network, education and
training, and funding. As will be made apparent in this section, South Africa needs to
strengthen its NFCs for maximum entrepreneurial impact; align the entrepreneurial
ecosystem networks of learning, mentorship and support; provide entrepreneurial
education for the 4IR and the digital economy; and accelerate financing innovation and
access to markets.
Conclusions and recommendations
To move from startup to scale requires the right support from the government and the private sector alike. In this section, we consider how entrepreneurship can and should be strengthened and explore new ways to accelerate entrepreneurial innovation. We leave the reader with answers to the pivotal question posed by the GEM SA results: how do we ensure that more entrepreneurs flourish in South Africa?
71 Bosma, N. et al. (2020). GEM Global Report 2019/2020, 13. Retrieved from http://www.gemconsortium.org/report
“Entrepreneurship is an
essential driver of societal
health and wealth, and
a formidable engine
of economic growth. It
promotes the innovation
required not only to exploit
new opportunities, promote
productivity and create
employment, but also to help
address some of society’s
toughest challenges, as
stated in the United Nations
Sustainable Development
Goals (SDGs). Many of the
world’s governments, think
tanks, non-governmental
and international
organisations now look
towards entrepreneurship
as a key part of the solution
to ending poverty and
social inequity, promoting
women’s empowerment,
and implementing business
solutions to the world’s
environmental challenges,
including climate change.”71
Section 5: Conclusions and recommendations
42
Igniting startups for economic growth and social change
Strengthen national framework conditions (NFCs) for maximum entrepreneurial impactEntrepreneurial activity and success are highly dependent on
the environment as contextual factors (economic, political,
social and other) directly influence the creation of unique
business and entrepreneurial contexts.
Fifty-four economies participated in the 2019 GEM National
Expert Survey (NES) in which experts assessed the GEM-defined
framework conditions for supporting entrepreneurship. The GEM
global findings for 2019/2020 show that physical infrastructure
is universally rated as the most developed of the framework
conditions, and entrepreneurship education at school level as
the least developed, weakest condition.72
In 2019, the South African ratings on the NES framework
conditions were, across the board, lower than in 2017. From
the 2019 NECI rankings, the conclusion is clear: South Africa’s entrepreneurial ecosystem is one of the worst in the sample of participating economies and exhibited little sign of
improvement over the past few years; in many cases, it is on the
decline.
All of the South African NFCs require strengthening. However,
the first recommendation offered here focuses specifically
on the following framework conditions: education in general
and entrepreneurial education at the primary and secondary
levels more specifically; government policies and programmes relating to entrepreneurship activity and the development
of small, medium en micro enterprises (SMMEs); research and development transfer; and internal market burdens.
From the open-ended responses to the expert interviews, it is
recommended that another two conditions be added, namely
building capacity for entrepreneurship and creating a deeper culture of entrepreneurship in the country.
As indicated in this report, a key characteristic of the
entrepreneurial ecosystem is heterogeneity, also in terms of
geographical differentiators. The Department of Small Business
Development has identified spatial differentiation as an
important consideration for inclusive SMME development.73
The recommendation here is that the framework conditions
are further researched for increased granularity regarding the
differences between provinces, between rural and urban zones
in the same province, and between developed economic zones
and townships in cities.
For example, from his February 2020 budget speech 74, it
is clear that the Finance Minister sees startups as economic
firestarters and believes that the tax system supports them
in a number of ways, including through the preferential small
business tax regime, the VAT registration threshold and turnover
tax.
Regarding company registration and compliance, BizPortal75 is
a digital platform developed by the Companies and Intellectual
Property Commission (CIPC) for the simplification of company
registration and related services. It aims to improve the ease
of doing business in South Africa, specifically when it comes
to starting a business. In this regard, the goal is to enable new
businesses to be registered in a single day (including registering
with the CIPC, SARS, the Unemployment Insurance Fund and
the Compensation Fund).
These developments are encouraging, but are they enough
and will they sufficiently reduce the cost and complexity of
compliance for entrepreneurs? Ideally, SMMEs’ compliance
should be simplified to the point where they are self-reliant.
For these enterprises, the ease and costs of doing business
are key challenges worldwide, and it is recommended that a
comparative study of recent lessons (2018–2020) be conducted.
To facilitate the ease of doing business for SMMEs, the
Department of Small Business Development has proposed
three urgent interventions: introducing generic by-laws for
informal traders to conduct business in municipalities; reducing
the costs of tender documents and scrapping unnecessary
compulsory briefings to participate in tenders; and tabling the
SMME Ombudsman Services Bill to provide a less costly dispute
resolution mechanism.76
72 Bosma, N. et al. (2020). GEM Global Report 2019/2020. Retrieved from http://www.gemconsortium.org/report73 Ntshavheni, K. (Minister of Small Business Development). (2019). Address on the occasion of delivering Budget Vote 31 on Small Business Development. 12 July, Cape Town.74 Mboweni, T.T. (Minister of Finance). (2020). 2020 Budget Speech. Retrieved from http://www.treasury.gov.za/documents/national%20budget/2020/speech/speech.pdf75 https://bizportal.gov.za76 Ntshavheni, K. (Minister of Small Business Development). (2019). Address on the occasion of delivering Budget Vote 31 on Small Business Development. 12 July, Cape Town
The government increasingly acknowledges the importance of entrepreneurs and small businesses in achieving sustainable, inclusive economic growth and realises the need to urgently put in place a series of policy reforms to support this goal.
Section 5: Conclusions and recommendations
43
A further measure is to standardise funding application
templates across all development finance institutions in South
Africa (Small Business and Innovation Fund, Public Investment
Corporation, Industrial Development Corporation of SA,
National Empowerment Fund, Land Bank, etc.) and then lobby
commercial banks to adopt these templates. This will lower the
burden on SMME’s and create clarity of application requirements
for new enterprises.77
The government is responsible for setting new policy directions
for supporting economic development and entrepreneurial
activity. It is, however, unrealistic to expect the government
to be the sole driver of change. All stakeholders – including
government, the private sector, the education sector, and
others – need to align their thinking and their efforts to ensure a
vibrant entrepreneurial ecosystem.
The payments to SMMEs for products and services, and
specifically the late payment by government, has a negative
impact on the survival and growth of SMMEs. This needs to be
urgently addressed at all levels of government.
Align the entrepreneurial ecosystem networks of learning, mentorship and supportEntrepreneurship involves identifying unique opportunities in
the market for value creation or, at the other end of the scale,
any attempt to create an opportunity to make a living. In
both instances, networks of support and learning make a real
difference to entrepreneurs’ chances at success.
There are various institutions and organisations across the public
and private sectors that provide support to entrepreneurs. Seda,
for example, has established incubators across the country.
There are also many good private sector incubators and most
universities have established innovation, technology and
intellectual property transfer and commercialisation initiatives,
most of which are located in urban areas.
It is crucial that entrepreneurs have access to information, and
opportunities to test their ideas before going to market. The key question, therefore, is how accessible these institutions and organisations are to new business owners, or to those
needing advice and guidance on how to start and develop their
enterprises. The Department of Small Business Development
has suggested that entrepreneurial support should be evaluated
at a national level through the development of a SMME business index that measures the impact of support initiatives among
stakeholders involved in such enterprises.78
Access to networks, peers, role models and mentors is more
likely in the key urban areas, the need for expansion into
townships and rural areas being clear. Conferences and expos
are aplenty, but they are expensive to attend. It is proposed
that both the public and private sectors be called on to sponsor
young entrepreneurs to attend such events.
A further consideration around entrepreneurial support is
how to rectify its currently unequal differentiation across
business types and sectors, stages of growth (startup, early
establishment, established) and size of business (micro, small
and medium). Furthermore, the informal sector should be
supported, regardless of whether or not informal initiatives
eventually transition to formal businesses, as they contribute
significantly to job creation and skills development.
The GEM global data suggest an increase in entrepreneurship
activity over the past two decades, albeit at a slower pace than
what the hype and rhetoric around entrepreneurship would
suggest.79 South Africa, as a developing middle-income country,
clearly has great potential for ramping up entrepreneurial
activity development.
Whilst entrepreneurship can result in wealth creation, it also
provides opportunities for innovation and job creation,
and can be purpose driven to make a difference in society.
Facilitating and nourishing a culture of entrepreneurship in South Africa will encourage more people to see starting their
own enterprise as a positive alternative to employment and a
career path of choice. The media have an important role to play
in this regard.
The challenge of existing labour legislation and its applicability to startups was again highlighted in
the national expert interviews. There
are two issues here, the first being
the applicability and feasibility of
quite rigid labour regulations to small
businesses. The second, broader
issue is that the world is evolving
and full-time employment as the
common standard is changing rapidly,
especially so in the digital economy,
where knowledge and skills are often
traded across multiple employment
opportunities.
77 Ibid.78 Ntshavheni, K. (Minister of Small Business Development). (2019). Address on
the occasion of delivering Budget Vote 31 on Small Business Development. 12 July, Cape Town.
79 Bosma, N. et al. (2020). GEM Global Report 2019/2020. Retrieved from http://www.gemconsortium.org/report
Section 5: Conclusions and recommendationsIgniting startups for economic growth and social change
Entrepreneurial success stories abound in South Africa, media coverage of such
stories having increased on different platforms over the past few years. These stories
are excellent material for learning and sharing. As such, it is proposed that funding be
made available by government and the private sector to research and develop these
narratives into case studies that are made freely available to the public.
Women and the youth in entrepreneurship
Women and youth in entrepreneurship are critical levers for inclusive economic growth and development in South Africa.
But are more women coming on board as entrepreneurs?
The ratio of male to female entrepreneurial activity in South
Africa has changed from 1.52 in 2017 to 1.14 in 2019, indicating
that female entrepreneurship is indeed on the rise. Women
make up more than 50% of the adult population in South Africa
and this ratio should ideally reflect this statistic.
As indicated in Section 4, research shows that economic
participation by women has wide-reaching impacts and holds
benefits for both communities and the economy.
• The Presidential Youth Employment
Intervention will be implemented over
the next five years to reduce youth
unemployment through means of the
following priority actions: (i) creating
pathways for young people into the
economy; (ii) improving youth entrepreneurship support;
(iii) expanding the Youth Employment Service (YES); and
(iv) establishing a Presidential Youth Service programme.
One percent of the national budget is to be reallocated to
youth employment initiatives.
• The National Youth Development Agency
and the Department of Small Business
Development will provide grant funding
and business support to 1 000 young
entrepreneurs in the next 100 days. This
forms part of a more ambitious programme
to assist 100 000 young entrepreneurs over the next three
years in accessing business skills training, funding and
markets.
• Women will be empowered for inclusive economic growth
through the introduction of the SheTradesZA platform that
will assist women-owned businesses in
participating in global value chains and
markets.
• The Industrial Development Corporation
will target R10 billion of its own and
partners’ funding for women-empowered businesses over
the next five years.
• The South African government will
designate 1 000 locally produced
products that must be procured from
SMMEs to help create a larger market
for small businesses.
These strategies are commendable and, if successful, will impact
massively on entrepreneurial development in the country.
80 Ramaphosa, C. (President of South Africa). 2020. State of the Nation Address. 13 February. Retrieved from https://www.parliament.gov.za/state-nation-ad-dress-president-cyril-ramaphosa-13-february-2020
Similarly, empowering the youth with capabilities can unleash untapped talent and potential, which is sorely needed in South
Africa where youth unemployment is currently at record levels.
The commitment of the South African government to economic
and social transformation among previously disadvantaged
populations is seen both in policy interventions and various
programmes of action. In his State of the Nation Address
in February 2020, President Cyril Ramaphosa announced
specific, far-reaching national strategies for bolstering entrepreneurship amongst women and the youth. Some
highlights include:80
44
Section 5: Conclusions and recommendations
4545
Provide entrepreneurial education for the 4IR and the digital economyIn all countries, an educated population with the requisite
knowledge and skills, and with a capacity for innovation, has
proven vital to driving competitiveness, productivity and
sustainable growth.
The challenges faced by South Africa’s overall education
system were highlighted in this report. Over and above the
general education system’s underperformance, the delivery of
entrepreneurial education, knowledge and skills also needs to
be addressed.
From the GEM SA results, we saw that expert commentators
continue to concur that the education system in South Africa does not align with or support entrepreneurial knowledge development. Entrepreneurial education, specifically on
market economic principles and entrepreneurship and new firm
creation, scored extremely low on the NES in 2019, even lower
than in 2017. These low scores also need to be considered in the
context of the 4IR and the rapidly evolving digital economy.
Primary and secondary education institutions in particular need
to align their curricula to provide learners with new capabilities for succeeding in a rapidly changing world. Entrepreneurial
education is also important in artisan training and other
technical vocational programmes, as these professions are
ideally suited to enterprise development.
A final point regarding entrepreneurial education relates
to sector development. New enterprise development has
traditionally flourished in sectors with lower barriers to entry
such as wholesale and retail trades, personal care services,
business services and construction. For their own benefit and
that of the economy, entrepreneurs should ideally have a greater share of higher-value sectors. This will require capital
raising and, most importantly, greater entrepreneurial education
and knowledge.
Apart from entrepreneurial education, other challenges
too remain in the context of the 4IR. A critical issue for
entrepreneurs in the digital economy is data costs, which
are high in South Africa. Many of the future’s entrepreneurial
opportunities will exist on digital platforms; data costs will need to come down significantly if these opportunities are to be seized. The Competition Commission in February released
its report on data costs and made overall recommendations for
data pricing in prepaid monthly bundles, as well as pro-poor
and zero-rating recommendations. However, it is likely that
data pricing will only really find balance once the Independent
Communications Authority of South Africa concludes the
licensing of high-demand spectrum for industry via auction,
hopefully this year.
A very positive development is the establishment of the South African Presidential Commission on the 4IR, appointed and
chaired by President Ramaphosa in 2019. The commission will
soon be reporting on its findings, which will inform national
policy and 4IR economic sector strategies and initiatives for
global competitiveness.
Accelerate financing innovation and improve access to markets Access to funding is a universal problem among entrepreneurs.
The dilemma is not necessarily that there is no funding for
entrepreneurship development, but rather that there is a natural tension between the entrepreneurial idea and the funding risk.
There is, in fact, an abundance of potential funders in South
Africa. The experts interviewed are fairly positive about the
availability of entrepreneurial finance. The South African overall
average for this framework condition is 4, compared to the
GEM Global average of 4.5. The real challenge perhaps lies in
the fact that pitching to funders requires a viable business idea, a business plan and differentiation, and a great deal of preparation.
The following steps are recommended in revising entrepreneurial education:
(i) consider what education
is relevant in the context
of the 4IR and the digital
economy; (ii) determine
when in the education
life cycle entrepreneurial
learning should commence
and how it should evolve
and intensify in depth and
complexity; and (iii) consider
how best to equip educators
to properly prepare the youth for the possibility of
entrepreneurship as a career and life choice.
46
Igniting startups for economic growth and social change
A key recommendation here is that incubators and other
support systems prepare and educate entrepreneurs on how
to approach funders, and on what kind of funding is most
appropriate for the life cycle and specific needs of their
enterprise.
Funding-related suggestions from national entrepreneurship experts (in 2019 and previously) include the following:
• allow angel investors and venture capitalists to write off
their investment in the first year rather than having to
amortise it over many years, which increases their risk;
• persuade banks, other financial institutions and the
government to improve their turnaround times on financial
support and to set targets for doing so;
• provide national and provincial funding fairs and
competitions for entrepreneurs, sponsored by public-
private partnerships;
• develop new mechanisms and criteria for funding decisions
beyond strictly asset-based approaches that hinge on
collateral requirements; and
• build a culture of and greater awareness and support for
crowdfunding opportunities.
In support of the above, it is recommended that a national digital platform is developed that can match funders to
opportunities and entrepreneurs to funders, and that the public
and private sector jointly invest in its development.
Finally, on the topic of more affordable finance for SMMEs,
the recent announcement of the introduction of a blended financing model by the Department of Small Business
Development is a great leap forward.11 This model will mix grants
(a grant portion constituting up to a maximum of R2.5 million
per enterprise) and loans to ensure the sustainability of new
enterprises for maximum development impact. The Small
Enterprise Finance Agency (Sefa) will collaborate with the
Department of Small Business Development, other government
entities and the private sector to deliver blended financing
through the new Small Business and Innovation Fund (a joint
fund of the Department of Small Business Development and
the Department of Higher Education, Science and Technology).
The budget for 2019/2020 is R1 billion and the target is to fund
100 000 young entrepreneurs in this period.
Open, efficient market systems with healthy competition is good
for economic inclusion, innovation in products and services,
and realistic and fair pricing. The GEM SA findings show that
experts perceived a deterioration in market openness in 2019,
compared to 2017.
The South African market is essentially still dominated by large monopolies (especially in the retail and wholesale, energy
supply, telecommunications and financial services sectors). This
increases the cost of doing business for small companies and
prevents them from having ease of access to markets, including
government procurement opportunities.
In President Ramaphosa’s State of the Nation Address in
February, it was announced that new regulations published
in the Government Gazette will enable investigation into and
action against price discrimination and abuse of buyer power;
this will help even the playing field for small businesses and
emerging entrepreneurs.12
Whilst monopolistic dominance in key sectors needs to be
addressed in the longer term, the immediate term needs to
see the private sector opening up its value chains for SMME
participation, not for compliance reasons (B-BBEE) but to
genuinely contribute to enterprise development and economic
growth. SMMEs rely far too heavily on government support – the
private sector needs to step up.
81 Ntshavheni, K. (Minister of Small Business Development). (2019). Address on the occasion of delivering Budget Vote 31 on Small Business Development. 12 July, Cape Town.
82 Ramaphosa, C. (President of South Africa). (2020). State of the Nation Address. 13 February. Retrieved from https://www.parliament.gov.za/state-na-tion-address-president-cyril-ramaphosa-13-february-2020
R R
Economy profiles
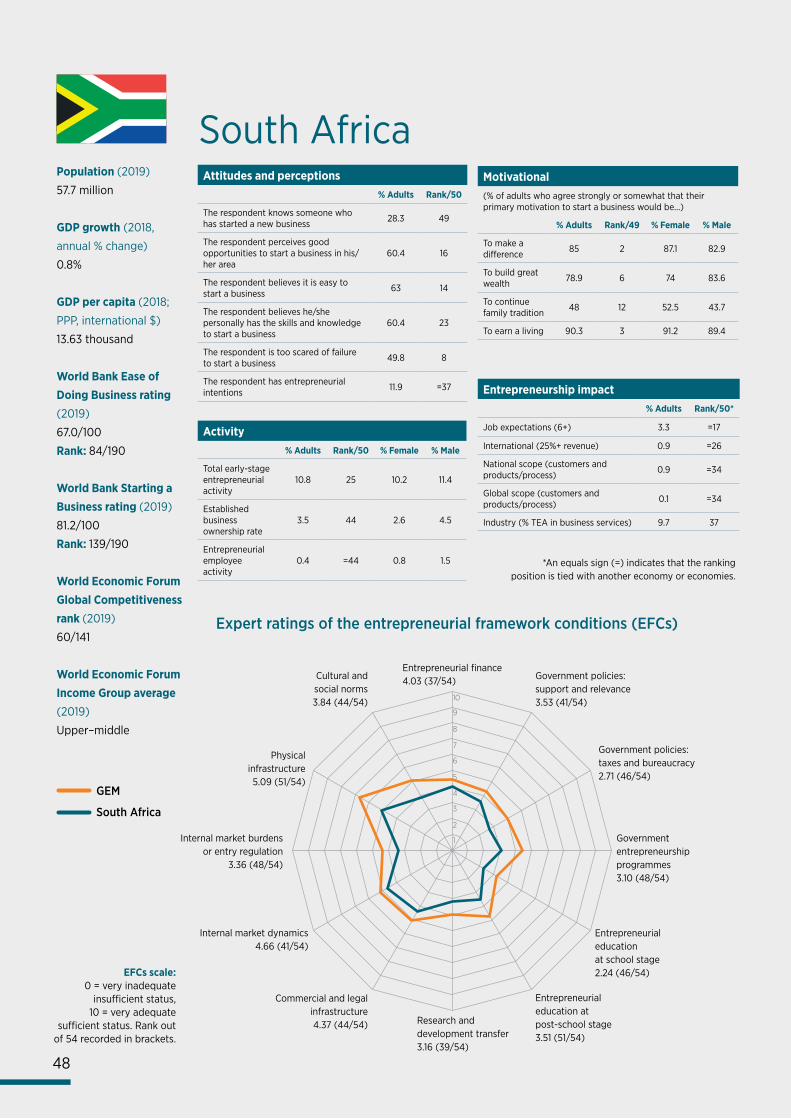
10
9
8
7
6
5
4
3
2
1
Entrepreneurial finance4.03 (37/54) Government policies:
support and relevance3.53 (41/54)
Government policies:taxes and bureaucracy2.71 (46/54)
Governmententrepreneurshipprogrammes3.10 (48/54)
Entrepreneurial educationat school stage2.24 (46/54)
Entrepreneurial education atpost-school stage3.51 (51/54)
Research and development transfer3.16 (39/54)
Commercial and legalinfrastructure4.37 (44/54)
Internal market dynamics4.66 (41/54)
Internal market burdensor entry regulation
3.36 (48/54)
Physicalinfrastructure5.09 (51/54)
Cultural andsocial norms3.84 (44/54)
EFCs scale:0 = very inadequate
insufficient status,10 = very adequate
sufficient status. Rank out of 54 recorded in brackets.
Expert ratings of the entrepreneurial framework conditions (EFCs)
Population (2019)
57.7 million
GDP growth (2018,
annual % change)
0.8%
GDP per capita (2018;
PPP, international $)
13.63 thousand
World Bank Ease ofDoing Business rating(2019)
67.0/100
Rank: 84/190
World Bank Starting aBusiness rating (2019)
81.2/100
Rank: 139/190
World Economic ForumGlobal Competitivenessrank (2019)
60/141
World Economic ForumIncome Group average(2019)
Upper–middle
*An equals sign (=) indicates that the rankingposition is tied with another economy or economies.
South AfricaAttitudes and perceptions
% Adults Rank/50
The respondent knows someone who has started a new business 28.3 49
The respondent perceives good opportunities to start a business in his/her area
60.4 16
The respondent believes it is easy to start a business 63 14
The respondent believes he/she personally has the skills and knowledge to start a business
60.4 23
The respondent is too scared of failure to start a business 49.8 8
The respondent has entrepreneurial intentions 11.9 =37
Motivational(% of adults who agree strongly or somewhat that their primary motivation to start a business would be...)
% Adults Rank/49 % Female % Male
To make a difference 85 2 87.1 82.9
To build great wealth 78.9 6 74 83.6
To continue family tradition 48 12 52.5 43.7
To earn a living 90.3 3 91.2 89.4
Entrepreneurship impact% Adults Rank/50*
Job expectations (6+) 3.3 =17
International (25%+ revenue) 0.9 =26
National scope (customers and products/process) 0.9 =34
Global scope (customers and products/process) 0.1 =34
Industry (% TEA in business services) 9.7 37
Activity% Adults Rank/50 % Female % Male
Total early-stage entrepreneurial activity
10.8 25 10.2 11.4
Established business ownership rate
3.5 44 2.6 4.5
Entrepreneurial employee activity
0.4 =44 0.8 1.5
GEM
South Africa
48
Policy roadmapThe South African economy remains sluggish, with real GDP per capita declining
since 2011. The full-year 2019 GDP growth forecasts were around 0.4% or lower, and
consensus economic growth forecasts for 2020 are now below 1%. South Africa’s official
unemployment rate, now at 29.1%, is at its highest level in 11 years. If the expanded
definition of unemployment (which includes people who have stopped looking for work)
is to be used, the country’s unemployment rate looks even more dismal at an estimated
38.5%. The youth (specifically persons aged between 15 and 24 years) remain the most
vulnerable group, currently with an unemployment rate of 58.2%.
The South African government increasingly acknowledges the importance of entrepreneurs
and small businesses in achieving sustainable and inclusive economic growth, as well as the
need to urgently implement a series of policy reforms to support this goal.
In July 2019, the Minister of the Department of Small Business Development announced
new measures in pursuit of economic transformation and job creation through the
development of small businesses and cooperatives. 83 These measures include, amongst
others, (i) making funding available through all of the department’s centres, with
commitments to significantly improving funding turnaround times; (ii) introducing
common templates for funding applications across all South African development finance
institutions; (iii) introducing the Small Business Innovation Fund, which will use a blended
finance model to lower financial costs for entrepreneurs through means of loans and
grants; and (iv) making provision to fund partner organisations (incubators) under certain
conditions. 84
The South African government increasingly acknowledges the importance of entrepreneurs and small businesses in achieving sustainable and inclusive economic growth, as well as the need to urgently implement a series of policy reforms to support this goal.
83 Ntshavheni, K. (Minister of Small Business Development). (2019). Address on the occasion of delivering Budget Vote 31 on Small Business Development. 12 July, Cape Town.
84 Staff reporter. (2019). Here are SME minister’s new measures to boost small business finance. Retrieved from https://ventureburn.com/2019/11/small-business-minister-funding-measures
49
Institution Team Funders APS vendor Contact
Lead institutionUniversity of Stellenbosch Business School (USB)
Team leaderAngus Bowmaker-Falconer
Small Enterprise Development Agency (Seda)
Nielsen South Africa
Type of institutionUniversity
Team memberMike Herrington
Websitehttps://www.usb.ac.za
Steering committeeDr Marietjie Theron-Wepener (Chair), Small Business Academy, USB
Prof. Marius Ungerer, Strategy and Leadership, USB
Mduduzi Dlamini, Manager Research and Development, Seda
Caswell Maloka, Specialist Research and Development, Seda
Other institutions involvedSeda
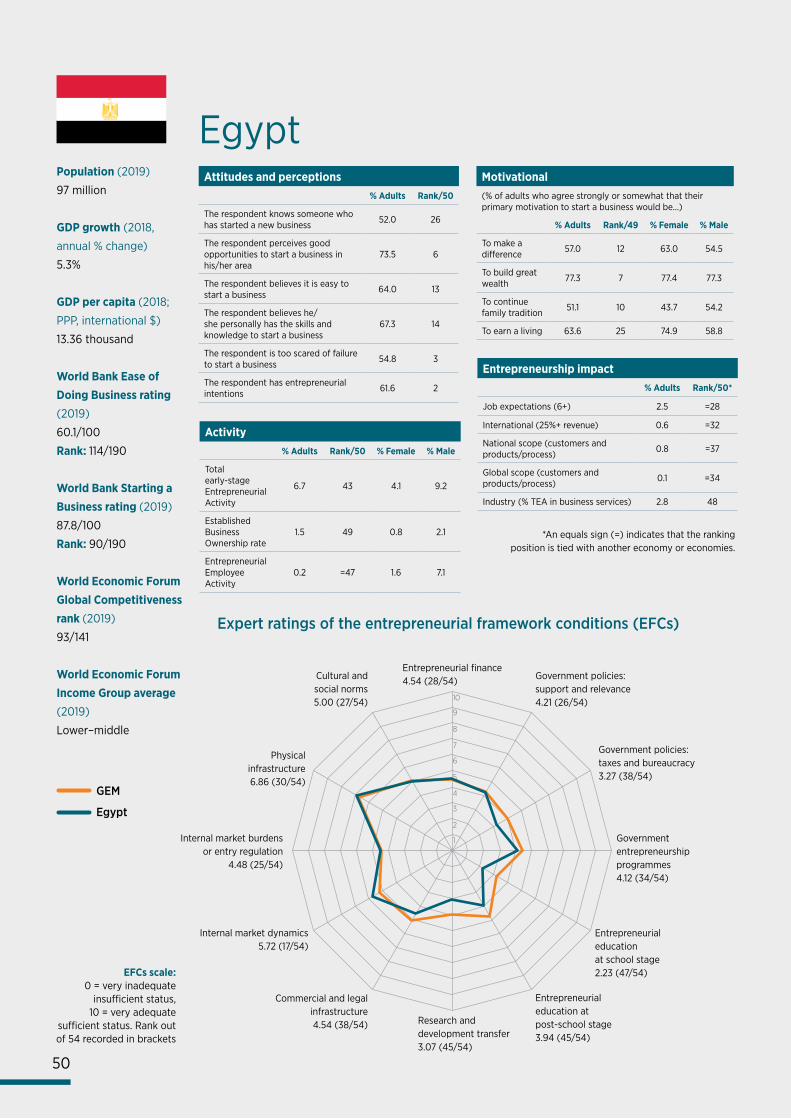
Entrepreneurial finance4.54 (28/54) Government policies:
support and relevance4.21 (26/54)
Government policies:taxes and bureaucracy3.27 (38/54)
Governmententrepreneurshipprogrammes4.12 (34/54)
Entrepreneurial educationat school stage2.23 (47/54)
Entrepreneurial education atpost-school stage3.94 (45/54)
Research and development transfer3.07 (45/54)
Commercial and legalinfrastructure4.54 (38/54)
Internal market dynamics5.72 (17/54)
Internal market burdensor entry regulation
4.48 (25/54)
Physicalinfrastructure6.86 (30/54)
Cultural andsocial norms5.00 (27/54)
EFCs scale:0 = very inadequate
insufficient status,10 = very adequate
sufficient status. Rank out of 54 recorded in brackets
Population (2019)
97 million
GDP growth (2018,
annual % change)
5.3%
GDP per capita (2018;
PPP, international $)
13.36 thousand
World Bank Ease ofDoing Business rating(2019)
60.1/100
Rank: 114/190
World Bank Starting aBusiness rating (2019)
87.8/100
Rank: 90/190
World Economic ForumGlobal Competitivenessrank (2019)
93/141
World Economic ForumIncome Group average(2019)
Lower–middle
*An equals sign (=) indicates that the rankingposition is tied with another economy or economies.
EgyptAttitudes and perceptions
% Adults Rank/50
The respondent knows someone who has started a new business 52.0 26
The respondent perceives good opportunities to start a business in his/her area
73.5 6
The respondent believes it is easy to start a business 64.0 13
The respondent believes he/she personally has the skills and knowledge to start a business
67.3 14
The respondent is too scared of failure to start a business 54.8 3
The respondent has entrepreneurial intentions 61.6 2
Motivational(% of adults who agree strongly or somewhat that their primary motivation to start a business would be...)
% Adults Rank/49 % Female % Male
To make a difference 57.0 12 63.0 54.5
To build great wealth 77.3 7 77.4 77.3
To continue family tradition 51.1 10 43.7 54.2
To earn a living 63.6 25 74.9 58.8
Entrepreneurship impact% Adults Rank/50*
Job expectations (6+) 2.5 =28
International (25%+ revenue) 0.6 =32
National scope (customers and products/process) 0.8 =37
Global scope (customers and products/process) 0.1 =34
Industry (% TEA in business services) 2.8 48
Activity% Adults Rank/50 % Female % Male
Total early-stage Entrepreneurial Activity
6.7 43 4.1 9.2
Established Business Ownership rate
1.5 49 0.8 2.1
Entrepreneurial Employee Activity
0.2 =47 1.6 7.1
GEM
Egypt
10
9
8
7
6
5
4
3
2
1
50
Expert ratings of the entrepreneurial framework conditions (EFCs)
51
Policy roadmapIn 2019, Egypt and the World Bank signed a $200 million agreement to support
entrepreneurs and SMEs. This agreement focuses on increasing the volume of credit
available to SMEs, thereby enhancing their access to credit. It also aims to remove
obstacles faced by young men and women in starting a business.
The UN Development Programme (UNDP) also continues its support of the Egyptian Micro,
Small and Medium Enterprises Development Agency (MSMEDA) in its development of the
MSME sector both directly and through the coordination of entrepreneurial stakeholders.
Through the UNDP–MSMEDA partnership, MSMEDA has disbursed over 11.2 billion Egyptian
pounds (EGP) as loans to MSMEs, reaching 526 858 micro and small enterprises and
creating over 800 000 jobs.
Women in particular have benefited from this financial support, making up 48% of the
beneficiaries. Moreover, 45% of beneficiaries were aged between 20 and 35.
Financing for SMEs in Egypt was ramped up by 91.5% to reach EGP8.5 billion at the end of
March 2018, compared to EGP4.9 billion in 2017.
The GEM Egypt NES numbers show a noticeable increase in the education sector in both
school and post-school stages.
Several regulatory reforms and support programmes have been implemented in Egypt
over the past three years. However, most of these reforms focus more on larger companies
than on startups, micro and small enterprises. Major administrative reforms are needed to
reduce red tape and improve the operating environment for the latter group.
Women in particular have benefited from the financial support of the UNDP-MSMEDA partnership, making up 48% of the beneficiaries. Moreover, 45% of beneficiaries were aged between 20 and 35.
Institution Team Funders APS vendor Contact
Lead institutionThe American University in Cairo School of Business
Team leaderProf. Ayman Ismail, PhD
Drosos Foundation
Oxfam Novib (Danish Arab Partnership Programme)
Hivos
PHI Knowledge [email protected]
Type of institutionBusiness school
Team membersProf. Ahmed Tolba, PhD
Dr Shima Barakat, PhD
Dr Hakim Adel Hakim Meshreki, PhD
Seham Ghalwash, MSc
Websitehttps://business.aucegypt.edu
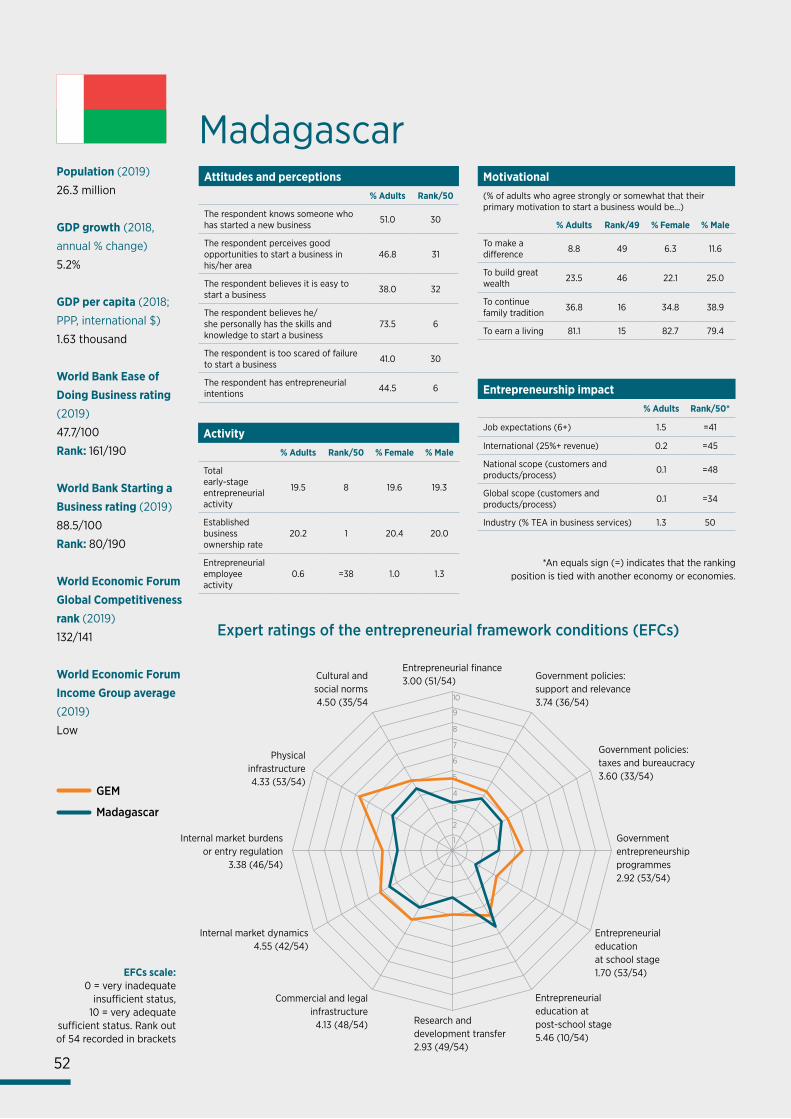
Entrepreneurial finance3.00 (51/54) Government policies:
support and relevance3.74 (36/54)
Government policies:taxes and bureaucracy3.60 (33/54)
Governmententrepreneurshipprogrammes2.92 (53/54)
Entrepreneurial educationat school stage1.70 (53/54)
Entrepreneurial education atpost-school stage5.46 (10/54)
Research and development transfer 2.93 (49/54)
Commercial and legalinfrastructure
4.13 (48/54)
Internal market dynamics4.55 (42/54)
Internal market burdensor entry regulation
3.38 (46/54)
Physicalinfrastructure4.33 (53/54)
Cultural andsocial norms4.50 (35/54
EFCs scale:0 = very inadequate
insufficient status,10 = very adequate
sufficient status. Rank out of 54 recorded in brackets
Population (2019)
26.3 million
GDP growth (2018,
annual % change)
5.2%
GDP per capita (2018;
PPP, international $)
1.63 thousand
World Bank Ease ofDoing Business rating(2019)
47.7/100
Rank: 161/190
World Bank Starting aBusiness rating (2019)
88.5/100
Rank: 80/190
World Economic ForumGlobal Competitivenessrank (2019)
132/141
World Economic ForumIncome Group average(2019)
Low
*An equals sign (=) indicates that the rankingposition is tied with another economy or economies.
MadagascarAttitudes and perceptions
% Adults Rank/50
The respondent knows someone who has started a new business 51.0 30
The respondent perceives good opportunities to start a business in his/her area
46.8 31
The respondent believes it is easy to start a business 38.0 32
The respondent believes he/she personally has the skills and knowledge to start a business
73.5 6
The respondent is too scared of failure to start a business 41.0 30
The respondent has entrepreneurial intentions 44.5 6
Motivational(% of adults who agree strongly or somewhat that their primary motivation to start a business would be...)
% Adults Rank/49 % Female % Male
To make a difference 8.8 49 6.3 11.6
To build great wealth 23.5 46 22.1 25.0
To continue family tradition 36.8 16 34.8 38.9
To earn a living 81.1 15 82.7 79.4
Entrepreneurship impact% Adults Rank/50*
Job expectations (6+) 1.5 =41
International (25%+ revenue) 0.2 =45
National scope (customers and products/process) 0.1 =48
Global scope (customers and products/process) 0.1 =34
Industry (% TEA in business services) 1.3 50
Activity% Adults Rank/50 % Female % Male
Total early-stage entrepreneurial activity
19.5 8 19.6 19.3
Established business ownership rate
20.2 1 20.4 20.0
Entrepreneurial employee activity
0.6 =38 1.0 1.3
GEM
Madagascar
10
9
8
7
6
5
4
3
2
1
52
Expert ratings of the entrepreneurial framework conditions (EFCs)
53
Madagascar’s development strategy for rural entrepreneurship
was broadened, resulting in the creation of 1 287 formal
enterprises in 2018. The strategy focuses on encouraging
women’s participation in business through a gender-based
policy for women in entrepreneurship, and the Fihariana
Programme Initiative, which provides entrepreneurship and
entrepreneurial culture training to women. Madagascar is
also targeting young people with a trophy competition for
young entrepreneurs and through “Thursday entrepreneurial
platforms” – round table discussions in which the student
entrepreneurs club shares knowledge about entrepreneurship in
Madagascar.
However, access to finance continues to slow entrepreneurship
development, as does a lack of supervision, training, resources
and knowledge for startups. According to the Doing Business
2019 report, major changes in investment conditions have
contributed to these obstacles. To address these challenges, an
assessment system for borrowers will be established through a
credit bureau.
According to the results of GEM 2019, areas deserving special
attention include (i) the revision of government policies in terms
of gender equality, youth empowerment, rural areas and the
social domain; (ii) the financing of entrepreneurship; (iii) good
governance; and (iv) entrepreneurship education and training.
Regarding the financing of entrepreneurship, the fear of failure
among those surveyed was higher in 2019 at 41% than in 2018
(36.6%). Among nascent and new entrepreneurs, only 5.4% of
those surveyed are undertaking social activities.
Success in meeting the UN SDGs depends on enterprise creation
and the innovations it brings. Job creation (Goal 8: Decent work
and economic growth) is at the core of Madagascar’s goals.
In 2019, expert recommendations focused on the workforce,
including the development of entrepreneurship in Madagascar,
the TEA rate having been relatively stable over the last three
years (21.8% in 2017, 20.7% in 2018 and 19.5% in 2019).
Arrangements are underway to facilitate young people’s
access to finance, this having been identified as an area for
improvement in the encouragement of entrepreneurship
development. The Central Bank of Madagascar has created
a credit information bureau, the Bureau d’Information sur le
Crédit, to address the asymmetry of information between
lenders and borrowers. This tool allows creditors to respond
positively to potential borrowers’ credit applications based on
the reputation guarantee gained from a scoring system. Training
and entrepreneurial education are also helping to reduce risk
and fear of failure.
The Fihariana Programme remains relevant as the GEM results
show gender equity in the business community. Of the 1 287
formal enterprises created in 2018, 83% were in the primary
sector where women outnumber men. With its continued
focus on encouraging individuals of 18 and older to pursue
entrepreneurship, the youth incentive policy is expected to
achieve the targets set in SDG Goal 8b by 2020.
Institution Team Funders APS vendor Contact
Lead institutionInstitut National des Sciences Comptables et de l’Administration d’Entreprises (INSCAE)
Team leaderProf. Claudine Ratsimbazafy, PhD
Centre de Recherche pour le Développement International du Canada (CRDI)
Institut National de la Statistique (INSTAT)
Type of institutionBusiness school
Team membersProf. Ida Clément Rajaonera, PhD
Prof. Harimino Oliarilanto Rakoto, PhD
Prof. Gilde Paul Ralandison, PhD
Prof. Félix Rasoloarijaona, PhD
Prof. Mamy Tiana Rasolofoson, PhD
Prof. Faly Hery Rakotomanana, PhD
Andriamahery Ferdinand Rasolonjatovo
Websitehttp://www.inscae.mg
Other institutions involvedUniversité du Québec à Trois-Rivières (UQTR)
Policy roadmap
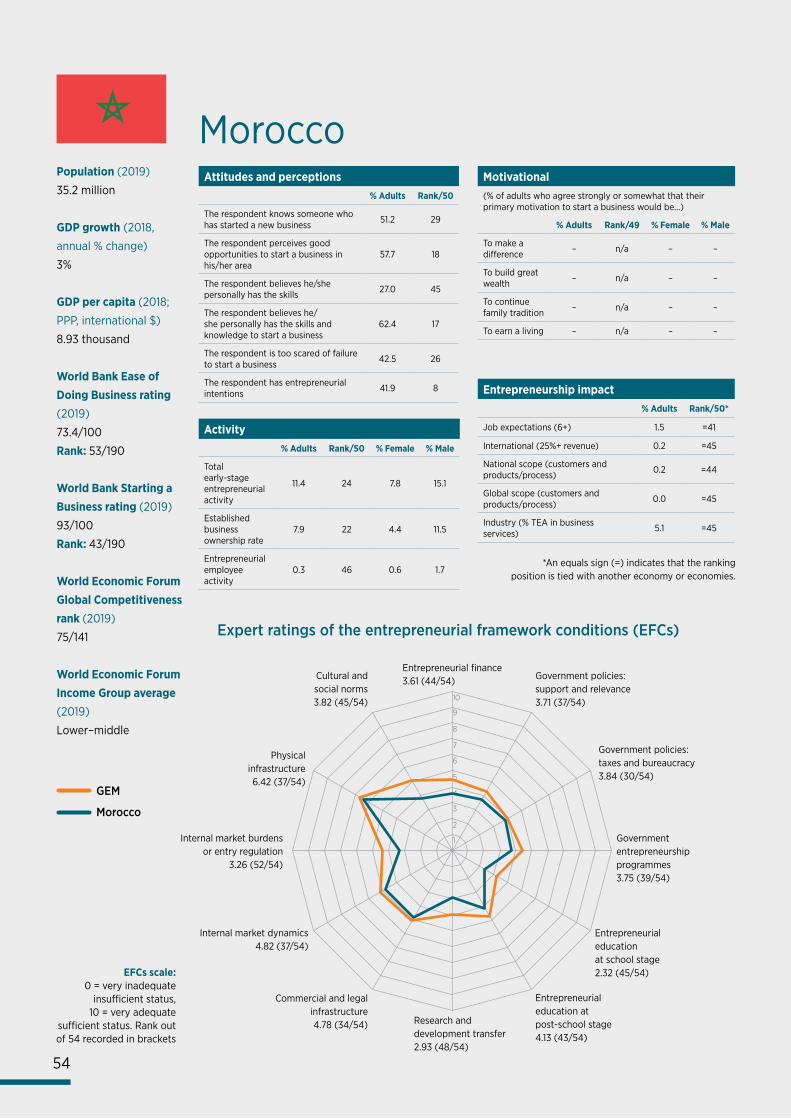
54
Entrepreneurial finance3.61 (44/54) Government policies:
support and relevance3.71 (37/54)
Government policies:taxes and bureaucracy3.84 (30/54)
Governmententrepreneurshipprogrammes3.75 (39/54)
Entrepreneurial educationat school stage2.32 (45/54)
Entrepreneurial education atpost-school stage4.13 (43/54)
Research and development transfer2.93 (48/54)
Commercial and legalinfrastructure4.78 (34/54)
Internal market dynamics4.82 (37/54)
Internal market burdensor entry regulation
3.26 (52/54)
Physicalinfrastructure6.42 (37/54)
Cultural andsocial norms3.82 (45/54)
EFCs scale:0 = very inadequate
insufficient status,10 = very adequate
sufficient status. Rank out of 54 recorded in brackets
Population (2019)
35.2 million
GDP growth (2018,
annual % change)
3%
GDP per capita (2018;
PPP, international $)
8.93 thousand
World Bank Ease ofDoing Business rating(2019)
73.4/100
Rank: 53/190
World Bank Starting aBusiness rating (2019)
93/100
Rank: 43/190
World Economic ForumGlobal Competitivenessrank (2019)
75/141
World Economic ForumIncome Group average(2019)
Lower–middle
*An equals sign (=) indicates that the rankingposition is tied with another economy or economies.
MoroccoAttitudes and perceptions
% Adults Rank/50
The respondent knows someone who has started a new business 51.2 29
The respondent perceives good opportunities to start a business in his/her area
57.7 18
The respondent believes he/she personally has the skills 27.0 45
The respondent believes he/she personally has the skills and knowledge to start a business
62.4 17
The respondent is too scared of failure to start a business 42.5 26
The respondent has entrepreneurial intentions 41.9 8
Motivational(% of adults who agree strongly or somewhat that their primary motivation to start a business would be...)
% Adults Rank/49 % Female % Male
To make a difference – n/a – –
To build great wealth – n/a – –
To continue family tradition – n/a – –
To earn a living – n/a – –
Entrepreneurship impact% Adults Rank/50*
Job expectations (6+) 1.5 =41
International (25%+ revenue) 0.2 =45
National scope (customers and products/process) 0.2 =44
Global scope (customers and products/process) 0.0 =45
Industry (% TEA in business services) 5.1 =45
Activity% Adults Rank/50 % Female % Male
Total early-stage entrepreneurial activity
11.4 24 7.8 15.1
Established business ownership rate
7.9 22 4.4 11.5
Entrepreneurial employee activity
0.3 46 0.6 1.7
GEM
Morocco
10
9
8
7
6
5
4
3
2
1
Expert ratings of the entrepreneurial framework conditions (EFCs)
The Moroccan economy is currently characterised by
macroeconomic stability and low levels of inflation thanks to
exports, tourism and a boom in private investment. In 2019,
Morocco launched the third phase of the National Initiative
for Human Development, which aims to build human capital
and enhance youth inclusion, with a wide financing envelope.
Significant foreign direct investments continue to flow into
logistics, trade services and the automotive industry.
The entrepreneurial ecosystem is improving and almost
all GEM indicators have increased. The implementation of
targeted measurements like Innov Invest and the establishment
of the “self-entrepreneur” status have contributed to this
improvement. Integrating the informal economy is a national
priority, as is clear from the flagship project of the Industrial
Acceleration Plan, which aims to encourage actors in the
informal sector to join the entrepreneurial ecosystem.
However, 2018/2019 marked a deceleration in economic growth.
A medium-term upward trajectory in national GDP is needed to
overcome entrenched socio-economic problems. Insufficient job
creation is increasing Morocco’s unemployment rate. Despite
recent efforts to introduce more dynamism into the territories,
interregional disparities in terms of growth persist.
The government is creating a new economic development
model based on enhanced education and vocational training
programmes, and bolder policies to boost job creation and
promote inclusive growth through a modernised social
protection system. Moroccan youth are expected to play a
priority role in achieving the goals of the 2030 Agenda for
Sustainable Development.
Morocco displays a positive attitude towards entrepreneurship
and boasts healthy pools of nascent entrepreneurs, but there is
a marked disparity between nascent and active entrepreneurs.
The relatively low levels of entrepreneurial activity among
the youth are concerning in the context of the severe
underemployment in this age group.
Early exposure to entrepreneurship training and increased
investment in human and immaterial capital could help
address this imbalance. Early-stage startups in knowledge and
technology fields usually struggle to secure equity investments,
so more initiatives are needed to encourage crowdfunding and
venture capital funds. A number of other regulations – including
education, research and development incentives and the Small
Business Act – must be implemented.
Development agencies indicate that Morocco has made
significant improvements in gender equality, although much
still remains to be done. There is near parity in girls’ and boys’
enrolment in schools, with resulting improvements in literacy
rates. This is, however, still to translate into increased labour
force participation among women.
Since Morocco joined the GEM consortium in 2014, the national
data collected have been used by academics, government policy
agencies and entrepreneurship support institutions. Public
stakeholders who create strategies and programmes have yet to
fully recognise the value and relevance of these data, although
evidence suggests that this information could have indirectly
influenced certain policy decisions.
Institution Team Funders APS vendor Contact
Lead institutionThe Entrepreneurship Research Laboratory (Faculty of Law, Economics and Social Sciences; University of Hassan II Casablanca)
Team leaderProf. Khalid El Ouazani, PhD
University of Hassan II Casablanca
ClaireVision [email protected]
Type of institutionUniversity
Team membersProf. Abdellatif Komat, PhD
Prof. Salah Koubaa, PhD
Prof. Fatima Boutaleb, PhD
Prof. Hind Malainine, PhD
Prof. Sara Yassine, PhD
Websitehttp://www.entrepreneurship.univcasa.ma
Policy roadmap
55


PAID
PAID
PAID
PAID
