iglas is among one of the twelve blocks of aligarh...
TRANSCRIPT

234
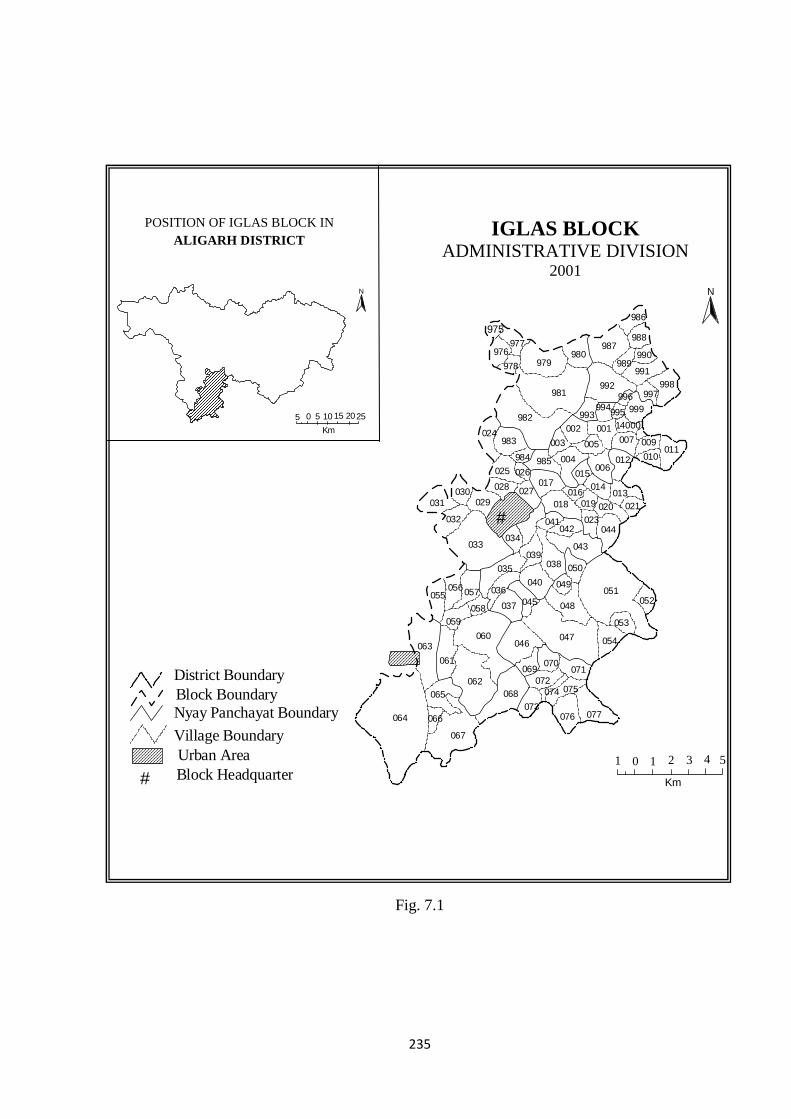
Iglas is among one of the twelve blocks of Aligarh district in Uttar Pradesh. It
is located in southern part of Aligarh district, at a distance of 24 km from district
headquarter. The block is bounded by Gonda block in the west, Lodha block in the
north, and Hathras district makes its eastern and southern boundary. River Karwan
flows from North West to South that divides the block into two parts. Iglas is the least
developed block among all the 12 blocks in the Aligarh district in terms of
availability, accessibility of existing socio-economic facilities and amenities.
It extends over an area of 253.49 sq.km, consist of 103 inhabited rural
settlements (table 7.1 and fig.7.1). As per 2001 census, the block has recorded a total
population of 155,032 persons, i.e., 7.29 per cent population of the district, of which
83,994 persons (54.18) are male and 71,038 persons (45.82) are females. There is
26.2 per cent of SC/ST population found in this block. It has population density of
704 persons/sq.km in 2001 as against 506 persons/sq.km in 1991. Agriculture is the
main source of livelihood of the people as 88.2 per cent population is engaged in
agricultural activity. Only 1.8 per cent people are working in household industries. As
per 2001 census, net area sown and gross area sown in this block is 22,166 hectares
and 36,463 hectares respectively.
Administratively the block is divided into 10 Nyay Panchayats namely
Gursaina, Hastpur, Muhraini, Byohi, Bisahuli, Kajroth, Karas, Gandhi Gram, Jawar,
and Barha Kalan and further divided into 64 Gram Panchayats. It consists of two
towns (Iglas and Beswan) covering an area of 3.67 and 5.51 sq.km. respectively (fig.
7.1).
235
5 10 15 202505
Km
N N
#
975
976
978 979
977980
981
982
986
987988
989990
991
992
993
997998
999
985
994995
996
004
003
002
005
001 14000
007 009
010011
983024
025
984
026
028 027029
030031
032
033
012
023044
018 020 021013
014
019016
017015
006
038
037
036
035
034
039
040
043
042041
047
048
049
054
053
052051
050
045
073
070071
072074 075
076 077
069
046
055056057
058
060
059
061
062
063
064
065
066
067
068
Nyay Panchayat Boundary
Urban AreaVillage Boundary
# Block Headquarter
Block BoundaryDistrict Boundary
1 2 3 4 51 0
Km
Fig. 7.1
POSITION OF IGLAS BLOCK IN ALIGARH DISTRICT
IGLAS BLOCK ADMINISTRATIVE DIVISION
2001

236
Table 7.1 Iglas Block: List of Rural Settlement with in each Nyay Panchayat (2001)
Block Name of
NyayPanchayat Name of Rural
Settlements Code number
Iglas 1.Gursaina 1. Dokauli 975 2. GadaKhera 976 3. ArniyanKwazaRaju 977 4.Pisaua 978 5.Jaitholi 979 6.Aliyaspur Bhanuara 980 7.Bhairagorva 981 8.Gursiana 982
2.Hastpur 9.Ramnagar 986 10.Mahoa 987 11.Jarauth 988 12.Udaipura 989 13.Barauth 990 14.Bichaula 991 15.Hastpur Chandfari 992 16.Nagla Mibhiya 993 17.Rampur 997 18.Bidaraka 998 3.Muhraini 19.Navanagar 985 20.Nagla Dayal 994 21.Bobala 995 22.Makhdumpur 996 23.Haivatpur 999 24.Naglachura 1400000 25.Muhraini 001 26.Taharpur 002 27.Sahara Kalan 003 28.Sahara Khurd 004 29.Navalpur 005 30.Manoharpur 006 31.Bijahara 007 32.Kauakhera 008 33.Rustampur Khojan 009 34.Rustampur Gotana 010 35.Pareela 011 4.Byohi 36.Agorana 012 37.Sikendarpur 013 38.Bhatoi 014 39.Kheriya Patal 015 40.Kishenpur 016 41.Tehara 017 42.Byohi 018 43.Nagla Mohan 019 44.Nagla Jar 020
45.Baj Garhi 021
46.Nagla Ahivasi 022
47.Nagla Nahchala 023
48.Basai 044
(Contd. ……)

237
5.Bisahuli 49.Kanchirauli 983
50.Gidauli 984
51.Bishanpur 024
52.Karthala 025
53.Badampur 026
54.Teekapur 027
55.Balrampur 028
56.Bheelpur 029
57.Balipur 030
58.Kaimawali 031
59.Matroi 032
60.Bisahuli 033
6.Kajroth 61.Lalpur 034
62.Bharatpur 035
63.Udambara 036
64.Simardhari 037
65.Kajroth 038
66.Madaura 039
67.Sitapur 040
68.Byohara 041
69.Nagla Phalahar 042
70.Kheriya Gurdev 043
7.Karas 71.Sirkurra 045
72.Rahatpur Imalliya 046
73.Karas 047
74.Belauth 048
75.Paharhipur 049
76.Naugavan 050
77.Tochhigarh 051
78.Bairam Garhi 052
79.Kanaura 053
80.Harrampur 054
81.Bahadurpur 069
8.Gandhi Gram 82.Satlauni Kalan 055
83.Satlauni Khurd 056
84.Kandali 057
85.Tarasara 058
86.Mohakampur 059
87.Subhashgram 060
88.Garhi Dhanu 061
89.Gandhi Gram 062
9.Jawar 90.Nayabas 063
91.Sathini 064
92.Makrol 065
(Contd. Table 7.1)
(Contd. ……)

238
93.Lal Garhi 066
94.Jawar 067
95.Nama 068
10.Barha Kalan 96.Barha Khurd 070
97.Sooraja 071
98.Barha Kalan 072
99.Toori 073
100.Daulatabad 074
101.Pilkhuniya 075
102.Manipur 076
103.Asroi 077
Source: District Statistical Handbook, Village Directory, 2001
7.1 Spatial organization of Rural Settlements
Spatial organization of rural settlements has been analysed in terms of their
distribution, size, spacing and dispersion.
7.1.1 Distribution of Rural Settlements
Distribution of rural settlements have been analysed by studying the
population, area, density and average space size of rural settlement considering nyay
panchayat as the unit of study. Table 7.2 and fig. 7.2 reveal nyay panchayat wise
distribution of settlements, population, and area in Iglas block. Table 7.2 shows that
highest percentage of rural settlements (16.50) has been recorded in Muhraini nyay
panchayat accommodating 9.64 per cent of population and occupies 8.27 per cent of
area whereas lowest percentage (5.82) of rural settlements has been recorded in Jawar
nyay panchayat accommodating 15.74 per cent of population and occupies 12.06 per
cent area in the block. Highest population has been recorded in Jawar nyay panchayat
(15.74 per cent) followed by Karas (15.09 per cent) while lowest population has been
found in Barha Kalan nyay panchayat (5.60 per cent) followed by Hastpur nyay
panchayat (8.16 per cent). Highest and lowest per cent of area in the block is
occupied by Karas (14.85 per cent) and Barha Kalan nyay Panchayat (5.79 per cent)
respectively.
(Contd. Table 7.1)

239
Table 7.2 Iglas Block: Distribution of Rural Settlements, Population and Area (2001)
S.No. Name of
NyayPanchayat Rural Settlements Population Area
No. % No. % Sq.Km. % 1. Gursaina 8 7.77 12848 8.29 26.06 10.28 2. Hastpur 10 9.71 12655 8.16 22.14 8.73 3. Muhraini 17 16.50 14954 9.64 20.96 8.27 4. Byohi 13 12.62 13470 8.69 21.24 8.38 5. Bisahuli 12 11.65 13430 8.66 32.80 12.94 6. Kajroth 10 9.71 14789 9.54 21.08 8.32 7. Karas 11 10.68 23399 15.09 37.64 14.85 8. Gandhi Gram 8 7.77 16418 10.59 26.31 10.38 9. Jawar 6 5.82 24383 15.74 30.57 12.06 10. BarhaKalan 8 7.77 8686 5.60 14.69 5.79
Iglas Block 103 100 155032 100 253.49 100 Source:Computed from District Census Hand Book, Village Directory, 2001
Fig. 7.2
Table 7.3 exhibits the distribution of rural settlements and population among
size group of settlements in Iglas block. Only one rural settlement has been recorded
in the population size group of < 250 persons and > 10,000 persons in each.
Maximum 35.92 per cent of rural settlement has been accounted in the population size
group 500-999 persons accommodating 17.85 per cent of total population of the
02468
10121416
Gur
sain
a
Has
tpur
Muh
rain
i
Byo
hi
Bis
ahul
i
Kaj
royh
Kar
as
Gan
dhi G
ram
Jaw
ar
Bar
ha K
alan
% o
f Se
ttle
men
t, P
opul
atio
n an
d A
rea
Nyay Panchayat
Settlement
Population
Area
Iglas Block Distribution of Settlements, Population and Area
(2001)

240
block. Figure 7.3 reveals cumulative frequency distribution of settlements and
population among different population size group of settlements in the block.
Cumulative frequency curve of settlements do not corresponds to the cumulative
frequency curve of population which concludes that both settlement and population
are disproportionately distributed among different size group of settlements.
Table 7.3 Iglas Block: Distribution of Rural Settlements and Population among Size Group of Settlements
(2001)
Population size group(persons)
Settlements Population No. Per cent Cumulative
Percentage No. Per cent Cumulative
Percentage < 250 1 0.97 0.97 217 0.14 0.14
250-499 9 8.74 9.71 3489 2.25 2.39 500-999 37 35.92 45.63 27666 17.85 20.24
1000-1499 30 29.13 74.76 36558 23.58 43.82 1500-1999 11 10.68 85.44 18625 12.01 55.83 2000-4999 11 10.68 96.12 38287 24.70 80.53 5000-9999 3 2.91 99.03 18905 12.19 92.72 > 10,000 1 0.97 100.00 11285 7.28 100.00
Total 103 100 155032 100 Source: Computed from District Census Hand Book, Village Directory, 2001
0102030405060708090
100
< 250 500-999 1500-1999 5000-9999
Cum
ulat
ive
Per
cent
age
Size Group of Settlements
Iglas block Cumulative Frequency Distribution of Settlements and Population
(2001)
Cumulative Percentage of Settlements
Cumulative Percentage of Population
Fig. 7.3

241
Table 7.4 shows the density, average space size, and mean spacing of rural
settlements taking nyay panchayat as the unit of study area. Highest density of rural
settlements (8.11 settlements /10 sq. km.) has been recorded in Muhraini nyay
panchayat witnessing lowest average space size of settlements (1.23 sq. km.).
Whereas lowest density (1.96 settlements/10 sq. km.) has been observed in Jawar with
highest average space size of rural settlements (5.10 sq. km.) showing inverse
relationship between density and space size of settlements. Mean spacing of
settlements ranges from 1.19 km to 2.43 km. out of which highest mean spacing has
been shown by Jawar i.e. 2.43 km and lowest mean spacing has been shown in
Muhraini i.e. 1.19 km (fig. 7.6). Mean spacing of rural settlement is directly related to
the average space size of settlement, as the mean spacing of settlement increases
space size also increases and vice versa. Figure 7.4 and 7.5 shows the density and
average space size of rural settlements in Iglas block.
Table 7.4 Iglas Block: Nyay Panchayat wise Density, Average Space Size and Mean Spacing of Rural Settlements
(2001)
S.No. Name of NyayPanchayat
Density of Settlements
(Sett/10sq.km.)
Average Space Size of
Settlements (sq.km.)
Mean Spacing of Settlements
(km)
1. Gursaina 3.07 3.26 1.94 2. Hastpur 4.52 2.21 1.60 3. Muhraini 8.11 1.23 1.19 4. Byohi 6.12 1.63 1.37 5. Bisahuli 3.66 2.73 1.78 6. Kajroth 4.74 2.11 1.56 7. Karas 2.93 3.42 1.99 8. Gandhi Gram 3.04 3.29 1.95 9. Jawar 1.96 5.10 2.43 10. BarhaKalan 5.45 1.84 1.46
Iglas Block 4.06 2.46 1.69 Source:Computed from District Census Hand Book, Village Directory, 2001

242
N
HighMediumLow < 3.46
> 5.20
Settlement/ 10 sq.km
Urban Area1 0 1 2 3 4
km
5
N
HighMediumLow< 2.12
> 3.20
Average Space Size (Km)
Urban Area1 0 1 2 3 4
km
5
Fig. 7.4 Fig. 7.5
Iglas Block
NyayPanchayat Wise Density of Rural Settlements
2001
Iglas Block
NyayPanchayat Wise Average Space Size of Rural Settlement
2001

243
N
HighMediumLow
>1.89<1.55
Kilometre
Urban Area1 2 3 4 51 0
Km
7.1.2 Dispersion of Rural Settlements
For measuring the dispersion of rural settlements technique of nearest
neighbour analysis has been used which is already being discussed in earlier chapter.
Table 7.5 reveals the dispersion of rural settlements considering nyay panchayat as a
unit of study. Random distributional pattern of rural settlements has been observed at
the block level as well as nyay panchayat level. Rn value at the nyay panchayat level
ranges from 0.81 to 1.16. Figure 7.7 and 7.8 shows the nearest neighbour distance at
block and nyay panchayat level.
Iglas Block NyayPanchayat Wise Mean Spacing of Rural Settlements
2001
Fig. 7.6

244
Table 7.5 Iglas Block: Dispersion of Rural Settlements (2001)
S.No. Name of
NyayPanchayat Mean
observed distance
(do)
Mean expected distance
(de)
Rn Index of Settlements
Nature of pattern
1. Gursaina 0.85 0.90 0.94 Random 2. Hastpur 0.78 0.75 1.04 Random 3. Muhraini 0.57 0.56 1.02 Random 4. Byohi 0.55 0.64 0.86 Random 5. Bisahuli 0.75 0.83 0.90 Random 6. Kajroth 0.76 0.72 1.06 Random 7. Karas 0.84 0.93 0.90 Random 8. Gandhi Gram 0.74 0.91 0.81 Random 9. Jawar 1.33 1.15 1.16 Random 10. Barhakalan 0.68 0.68 1 Random
Iglas Block 1.12 0.78 1.423 Random Source: Computed from District Census Hand Book, Village Directory, 2001
7.2 Spatial Distribution of Socio-Economic Facilities
After going through the empirical observations conducting field survey in
Iglas block,19 facilities and amenities are considered as most potential for rural
growth centre in the block. These facilities have been examined in terms of their
spatial organization, areal association, and areal differentiations for the sake of
diagnostic planning to achieve the goal of balanced regional development. Spatial
distribution of existing facilities and amenities is examined by using statistical
techniques i.e., Mather’s Model of mean spacing and Gini’s Coefficient of
Concentration as it has been done at district level analysis in preceding chapter.
Table 7.6 reveals the spatial distribution of socio-economic facilities in the
block. Among educational facilities, primary school, middle school, secondary school,
senior secondary school has been found in the block (fig.7.9). There are 111 primary
schools located in 96 rural settlements providing primary education facility to the
average population of 1,397 persons. Mean spacing of rural settlements having
primary school is 1.75 km which means that primary schools are located very close to
each other. Gini’s coefficient of concentration value (0.030) shows that primary

245
#
### #
# #
#
# ##
##
##
###
#
##
# ##
##
#
#
##
#
##
# #
## #
##
#
#
##
#
#
#
#
# ##
##
##
#
# # # #
#
# #
# #
#
#
#
# #
#
##
###
#
# #
## #
#
#
#
#
#
#
#
#
# #
#
#
##
#
#
#
#
#
#
#
##
#
#
1 2 3 4 51 0
Km
N#
### #
# #
#
# ##
##
##
###
#
##
# ##
##
#
###
#
##
# #
## #
##
#
#
##
#
#
#
#
# ##
##
##
#
# # # #
#
# #
# #
#
#
#
# ##
##
###
#
# #
## #
#
#
#
#
#
#
#
#
# #
#
#
##
#
#
#
#
#
#
#
##
#
#
N
1 2 3 4 51 0
Km
Iglas Block Nearest Neighbour Distance of Settlements
2001
NyayPanchayat of Iglas Block Nearest Neighbour Distance of Settlements
2001
Fig. 7.7 Fig. 7.8

246
school is uniformly distributed among all the size group of rural settlements. There
are 57 middle school distributed among 52 inhabited rural settlements with the mean
spacing of 2.37 km. On an average 2,720 persons are served by each middle school.
Gi value of 0.222 reveals its approaching uniform distribution among the size group
of rural settlements. Only two secondary schools and two senior secondary schools
have been found in the block serving an average population of 77,516 persons each.
Secondary school and senior secondary school are located at a mean spacing of 12.10
km. Gi value of secondary school (0.578) is greater than the Gi value of senior
secondary school (0.345) this is because the facility of secondary school is
concentrated at bigger size of rural settlements than the facility of senior secondary
Table 7.6 Iglas Block: Spatial Distribution of Socio-Economic Facilities (2011)
S.No. Name of the
Facility
Number of facility
Rural Settlement
having Facility
Mean spacing (in
km.) of rural
settlements having facility
Average population per facility
Gi value of rural
settlements having facility
1. PS 111 96 1.75 1,397 0.030 2. MS 57 52 2.37 2,720 0.222 3. SS 2 2 12.10 77,516 0.578 4. SSS 2 2 12.10 77,516 0.345 5. Hos. 1 1 17.11 155,032 0.204 6. MCWC 1 1 17.11 155,032 0.602 7. PHC 4 3 9.88 38,758 0.657 8. BS 7 7 6.47 22,147 0.398 9. PR - 93* 1.77 1,667** 0.023 10. PO 20 20 3.83 7,752 0.562 11. CB 4 4 8.55 38,758 0.893 12. EDP - 96* 1.75 1,615** 0.004 13. V.
Hos./Dis. 5 5 7.65
31,006 0.503
14. ABC 2 2 12.10 77,516 0.272 15. SSC 2 2 12.10 77,516 0.184 16. FPSC 2 2 12.10 77,516 0.578 17. PALCS 4 4 8.55 38,758 0.194 18. FPS 81 74 1.99 1,914 0.150 19. LM 4 4 8.55 38,758 0.697
Source: Based on field survey, 2011. Note: * Number of Rural Settlements having Facility. ** Population per Rural Settlement having Facility.

247
school. The units providing health facilities in the block includes hospital, maternity
and child welfare centre, and primary health centre. Only one ayurvedic hospital at
Taharpur in Muhraini nyay panchayat has been found in the Iglas block serving an
average population of 155,032 persons and mean spacing of rural settlement having
hospital facility is 17.11 km. Similarly single unit of maternity and child welfare
centre has been found in Mohkampur (Gandhigram nyay panchayat) serving an
average population of 155,032 persons with the mean spacing of 17.11 km. Gi value
of 0.602 reveals its disproportionate distribution among bigger size of rural
settlements in the block. There are 4 primary health centre distributed among 3
inhabited rural settlements facilitating to the average population of 38,758 persons in
the block. The settlements having primary health centre are located at the mean
spacing of 9.88 km. which are medium to bigger size defined by the Gi value 0.657.
The units providing transport and communication facilities in the block
include bus stop, pucca road, and post office. In the block, 7 rural settlements are
having bus stop facility, 93 rural settlements are having pucca road facility and 20
rural settlements are having post office facility with their mean spacing of 6.47 km.,
1.77km., and 3.83 km. respectively.
In the block, the existing veterinary and agro-economic facilities are
veterinary hospital/dispensary, artificial breeding centre, seed selling centre, fertilizer
and pesticide selling centre, and primary agricultural loan co-operative society. Total
5 rural settlements are having veterinary hospital/dispensary, 2 rural settlements are
having artificial breeding centre, 2 rural settlements are having seed selling centre, 2
rural settlements are having fertilizer and pesticide selling centre, 4 rural settlements
are having primary agricultural loan co-operative society with their mean spacing 7.65
km., 12.10 km., 12.10 km., 12.10 km., and 8.55 km. respectively.

248
N
Urban Area
#S Middle School
#· Secondary School"8 Senior Secondary School
# Primary School#S
#S
#S
#S
#S
#S
#S
#S
#S
#S
#S
#S
#S#S
#S
#S#S
#S
#S
#S
#S
#S
#S
#S
#S
#S
#S
#S#S
#S
#S #S
#S
#S#S
#S
#S
#S#S
#S
#S
#S
#S
#S
#S#S
#S
#S
#S
#S
#S
#S
#S
#S
#·
#·
"8#
#
#
#
#
##
#
#
#
#
#
#
#
#
#
#
#
#
#
#
#
#
#
#
#
#
#
#
#
#
#
#
#
#
#
#
#
#
#
#
#
#
#
#
#
#
#
#
#
#
#
#
#
#
#
##
#
#
# #
#
#
#
#
#
#
#
#
##
#
#
#
#
#
#
#
#
##
## #
#
#
#
#
#
#
#
#
#
#
1 2 3 4 51
KM
0
N
Urban Area
#/ Maternity and Child Welfare Centre
"8 Hospital
#³ Primary Health
#/
"8
#³
#³
#³
0
KM
1 54321
Iglas Block Distribution of Educational Facilities
(2011)
Iglas Block Distribution of Health Facilities
(2011)
Fig. 7.9 Fig. 7.10

249
N
Urban Area
#S Post Office
# Pucca Road#· Bus Stop
#S
#S
#S
#S
#S
#S
#S
#S
#S
#S
#S#S
#S
#S
#S
#S
#S
#S
#S
#S
#
#
#
#
#
#
#
#
#
#
#
#
#
#
# #
#
#
#
#
#
#
#
#
#
#
#
#
#
#
#
#
#
#
#
##
#
#
#
#
#
#
#
#
#
#
#
#
#
#
#
#
#
##
#
##
#
#
#
#
#
#
#
#
#
#
##
#
#
##
#
##
#
# #
#
##
#
##
#
#
##
#·
#·
#·
#·#·
#·
#·
0
KM
1 54321
N
Urban Area
#Y Veterinary Hospital/Dispensary
#³ Artificial Breeding Centre
#/ Seed Selling Centre
#0 Primary Agriculture Loan Co-operative Society
#· Fertiliser and Pesticide Selling Centre
#Y#Y
#Y#Y
#Y
#³#³
#/
#/#/
#0
#0
#0
#0#·
#·
0
KM
1 54321
Iglas Block Distribution of Transportation and Communication Facilities
(2011)
Iglas Block Distribution of Veterinary and Agro-Economic Facilities
(2011)
Fig. 7.11 Fig. 7.12

250
N
Urban Area
"8 Commercial Bank
# Fair Price Shop
#· Local Market
"8
"8
"8
"8
#
# #
#
#
##
#
#
#
#
# #
##
#
#
# #
# #
##
#
#
#
#
##
#
#
#
#
#
##
#
#
#
##
#
#
#
#
#
##
# #
#
#
#
#
#
#
#
#
##
#
# #
#
#
#
###
##
#
#
#
#·
#·
#·
#·
1 2 3 4 51
KM
0
In the block, 4 commercial bank are distributed in 4 inhabited rural settlements
serving an average population of 38,758 persons with the mean spacing of 8.55 km.
Gi value of 0.893 reveals its concentration in few bigger sizes of rural settlements.
There are 96 rural settlements having facility of electricity for domestic purpose with
the mean spacing of 1.75 km. All the settlements having this facility are uniformly
distributed having Gi value of 0.004.
Table 7.6 further reveals that total 81 fair price shops are distributed in 74
inhabited rural settlements serving an average population of 1,914 persons. Mean
spacing of rural settlements having fair price shop facility is 1.99 km and Gi value of
0.150 shows its approaching uniform distribution among all size group of settlements.
Iglas Block Distribution of Market and Finance Facilities
(2011)
Fig. 7.13

251
Only 4 rural settlements are having local market facility serving an average
population of 38,758 persons in the block. Each local market is located at the mean
spacing of 8.55 km. and Gi value of 0.697 shows its concentration at bigger size of
rural settlements.
7.3 Levels of Socio-Economic Development
In the present analysis levels of socio-economic development has been
examined using deprivation method as discussed in preceding chapter taking nyay
panchayat as the unit of study at block level. For the analysis of socio- economic
development seventeen variables has been selected. They are, number of primary
school per 1,000 persons (X1), number of middle school per 1,000 persons (X2),
number of secondary school per 1,000 persons (X3), number of senior secondary
school per 1,000 persons (X4), number of hospital per 1,000 persons (X5), number of
maternity and child welfare centre per 1,000 persons (X6), number of primary health
centre per 1,000 persons (X7), number of post office per 1,000 persons (X8), number
of bus stop per 100 sq. km. area (X9), settlements having pucca road to total
settlements (X10), number of commercial bank per 1,000 persons (X11), number of
veterinary hospital per 1,000 persons (X12), number of artificial breeding centre per
1,000 persons (X13), number of fair price shop per 1,000 persons (X14), number of
local market per 1,000 persons (X15), settlements having electricity for domestic
purpose to total settlements (X16), number of primary agricultural loan co-operative
society per 1,000 persons (X17).
Before using this method all the raw data of each variable has been transferred
into standard score, development index of each variable has been calculated and
finally composite score of development index has been taken to examine the level of

252
Table 7.7 Iglas Block: Development Index of each Socio-Economic Variable (2011)
S.No. Name of NyayPanchayat
Development Index of each Variable X1 X2 X3 X4 X5 X6 X7 X8 X9
1. Gursaina 0.304 0.203 0.000 0.000 0.000 0.000 0.000 0.328 0.000 2. Hastpur 0.565 0.360 0.000 0.000 0.000 0.000 1.000 1.000 0.473 3. Muhraini 1.000 0.999 0.000 0.581 0.998 0.000 0.000 0.846 1.000 4. Byohi 0.721 0.455 0.000 0.000 0.000 0.000 0.000 0.000 0.000 5. Bisahuli 0.610 0.318 0.000 0.000 0.000 0.000 0.000 0.628 0.000 6. Kajroth 0.072 0.000 0.000 0.000 0.000 0.000 0.000 0.571 0.994 7. Karas 0.001 0.020 0.994 0.000 0.000 0.000 0.541 0.541 0.278 8. Gandhigram 0.662 0.191 0.000 0.000 0.000 0.999 0.000 0.771 0.000 9. Jawar 0.293 0.235 0.954 0.000 0.000 0.000 0.000 0.346 0.343 10. BarhaKalan 0.768 0.699 0.000 1.000 0.000 0.000 0.000 0.486 0.000
S.No. Name of NyayPanchayat
Development Index of each Indicator
Composite Index
Rank in Socio-Economic
Development X10 X11 X12 X13 X14 X15 X16 X17 1. Gursaina 0.000 0.985 0.000 0.000 0.291 0.000 0.188 0.000 0.135 10 2. Hastpur 0.600 1.000 0.687 0.000 0.636 1.000 0.351 0.590 0.486 1 3. Muhraini 0.294 0.000 0.000 0.000 0.433 0.000 0.618 0.998 0.457 2 4. Byohi 0.692 0.000 0.000 0.000 0.712 0.000 0.001 0.000 0.152 9 5. Bisahuli 0.667 0.000 0.000 0.000 0.716 0.000 1.000 0.000 0.232 8 6. Kajroth 1.000 0.000 0.000 0.000 0.445 0.000 1.000 0.000 0.240 7 7. Karas 1.000 0.541 0.372 0.000 0.208 0.541 0.410 0.000 0.320 6 8. Gandhigram 1.000 0.000 0.530 0.000 0.333 0.000 1.000 0.000 0.323 5 9. Jawar 1.000 0.519 0.357 0.357 0.000 0.000 1.000 0.306 0.336 4 10. BarhaKalan 0.000 0.000 1.001 1.001 1.000 0.000 0.188 0.000 0.361 3
Source: Based on Field Survey (2011)

253
Table 7.8: Iglas Block: Level of Socio-Economic Development (2011)
Level of Socio-Economic
Development
Composite Score Number of NyayPanchayat
Name of NyayPanchayat
High Above 0.362 2 Hastpur, Muhraini Medium 0.362 - 0.246 4 Karas, Gandhigram,
Jawar, Barhakalan Low Below 0.246 4 Gursaina, Byohi,
Bisahuli, Kajroth Source: Based on field survey, 2011.
development of each nyay panchayat which is categorized under high, medium, and
low level of development (Table 7.7 and fig. 7.14).
High Level of Socio-Economic Development (> 0.362)
Table 7.7, 7.8 and fig. 7.14 reveals that two nyay panchayats i.e., Hastpur
(0.486) and Muhraini (0.457) with composite score more than 0.362 are included in
the high level of socio-economic development in the block. It contains 26.21 per cent
rural settlements having 17 per cent area and contains 17.80 per cent population of the
block. High level of socio-economic development in these nyay panchayat is
attributed to the ample availability of education facility, health facility, transportation
and communication and market facility as compared to other nyay panchayats lying
under medium and low level of socio-economic development.
Medium Level of Socio-Economic Development (0.362 - 0.246)
Medium level of socio-economic development has been shown by four nyay
panchayat i.e., Karas (0.320), Gandhigram (0.323), Jawar (0.336), and Barha Kalan
(0.361) having composite score of development index between 0.326 and 0.246. They
contain 32.04 per cent rural settlements, occupying 43.08 per cent area and 47.02 per
cent population of the district.
Low Level of Socio-Economic Development (< 0.246)
It is clear from the Table 7.7, 7.8 and fig.7.14 that, four nyay panchayat i.e.,

254
N
Urban Area
HighMediumLow
> 0.362< 0.246
Index
1 10 2 3 4 5
Km
Gursaina (0.135), Byohi (0.152), Bisahuli (0.232), and Kajroth (0.240) with
composite score below 0.246 come under this group. It accommodates 41.75 per cent
rural settlements, covers 39.92 per cent area and 35.18 per cent population of the
block. The causative factors for the low level of development are political biasness in
the allocation of facilities, inaccessibility of transportation and communication,
insufficient education and health facilities, and deficient in market facilities etc.
The analysis reveals that, a wide regional disparity in the level of socio-
economic development exists even within the block among nyay panchayat. Gursaina
Iglas Block Levels of Socio-Economic Development
(2011)
Fig. 7.14

255
is the least developed nyay panchayat in the block that needs higher attention for the
allocation of socio-economic facilities and amenities.
7.4 Identification of Rural Growth centres and their complimentary regions
Rural Growth centres are those service centres which have attained their
central entity to serve their surrounding settlements pertaining to their basic needs.
These central places/service centres are arranged in different levels of functional
hierarchy depending on the quantity and quality of services they perform. In an ideal
condition, the central places of one order are equi-distant from each other arranged in
a hexagonal pattern and nesting the central places of lower order. But in real world it
is impossible to exist such an ideal conditions because of existence of physico-cultural
and socio-economic variations in the region at micro level. Therefore, an attempt has
been made to identify the spatial location of rural growth centres and their
complementary region.
Identification of rural growth centre is based on availability and non
availability of central functions and functional inter-dependency of settlements.
Besides the quantitative principle, qualitative principle is endirely needed that is
accessibility, economic viability, socio-political desirability, social security,
environmental sustainability. Though these principle cannot be quantified because of
their normative character yet their importance in identification of rural growth centre
for viable functioning are very significant. Median population threshold and range of
goods has been considered as one of the basic principle for determination of rural
growth centres. Threshold population is defined as the minimum population required
for functioning of the service activity, below of which the activity will run at loss and

256
in long run it will face closure (Glasson, 1978)1. Whereas range of goods refers not
only the linear distance but also time, economic distance, social distance, cultural
distance. On the basis of median population threshold (table 7.9) all functions have
been arranged in ascending order. The arranged set of functions shows that there is
not a continuum and they tend to form a group and can be differentiated in two
distinct hierarchical levels i.e. lower order functions and higher order functions. After
determining the hierarchical level, the space preferences of people for centres for
specific functions at each of the hierarchic level has been analyzed by preparing inter-
linkages and inter- dependency ray diagram maps.
Table 7.9 Iglas Block: Median Population Threshold of Central Functions (2011)
S.No. Central Functions MPT MPTI
1. Primary School 339 1.00
2. Pucca Road 427 1.26
3. Electricity for Domestic Purpose 589 1.74
4. Fair Price Shop 999 2.95
5. Middle School 1084 3.20
6. Post Office 1994 5.88
7. Bus Stop 5499 16.22
8. Veterinary Hospital 6059 17.87
9. Bank 6619 19.53
10. Local Market 6739 19.88
11. Primary Agricultural Loan Cooperative Society 7499 22.12
12. Primary Health Centre 7499 22.12
13. Artificial Breeding Centre 8536 25.18
14. Secondary School 8662 25.55
15. Fertilizer and Pesticide Selling Centre 8662 25.55
16. Senior Secondary School 9071 26.76
17. Seed Selling Centre 9071 26.76
18. Hospital 10642 31.39
19. Maternity and Child Welfare Centre 10642 31.39 Source: Based on field survey, 2011.
1 Glasson, J., ‘An Introduction to Regional Planning’ Anchor Press Ltd., Great Britain, Tiptree, Essex, 1978, (2nd Edition)

257
Prim
ary
Sch
ool
Puc
ca R
oad
Ele
ctric
ity fo
r D
omes
tic
Fai
r P
rice
Sho
p
Mid
dle
Sch
ool
Pos
t o
ffice
Bus
Sto
p
Vet
erin
ary
Hos
pita
l
Ban
k
Loca
l m
arke
t
Prim
ary
Agr
icul
tura
l Loa
n C
oope
rativ
e S
ocie
ty
Prim
ary
Hea
lth C
entr
e
Art
ifici
al B
reed
ing
Cen
tre
Sec
onda
ry S
choo
l
Fer
tiliz
er a
nd P
estic
ide
Sel
ling
Cen
tre
Sen
ior
Sec
onda
ry S
choo
l
See
d S
ellin
g C
entr
e
Hos
pita
Mat
erni
ty a
nd C
hild
W
elfa
re C
entr
e
The operational role of a settlement as a growth centre and its level has been
identified on the bases of the criteria adopted by wanmali (1970)2 with a minor
modifications i.e.
i. It should have at least 50 per cent or more of the functions at any level of
functional hierarchy and
ii. It should serve at least two settlements in addition to its own for at least 25
per cent of the functions considered at that level.
2 Wanmali, S., ‘ Regional Planning for Social Facilities – An Examination of Central Place Concepts and their Application’, A Case Study of Maharashtra’, Hyderabad, 1970.
Above 5499
Higher Order Functions
Fig. 7.15
Ranges from 339-1994
Lower Order Function
Hierarchy of Socio-Economic Facilities

258
For this calculation the functions already available in dependent villages has been
excluded. Identification of complementary regions of central places involves the
determination of the extent of population and area dependent on the latter for the
services offered by them.
7.4.1 First order rural growth centres and their complementary region
23 rural growth centres or central places are identified at first level of
functional hierarchy, of which four central places i.e. Jirauli, Mauharia, Basgoi, and
Mursan lies outside the block.
Table 7.10 Iglas Block: First Order Rural Growth Centres and their complementary Regions
(2011) SI.No. Central villages Dependent
settlements Centrality
score Population
served Area served
1. Gursaina 4 26.13 6733 12.33 2. Mahoa 5 36.23 6431 11.91 3. HastpurChandfari 10 55.46 14583 27.94 4. Muhraini 2 21.18 4236 3.63 5. Sahara Khurd 7 41.68 8095 14.94 6. Pareela 3 28.58 4108 4.63 7. Iglas 10 64.54 23846 21.84 8. Matroi 2 20.93 3464 5.14 9. Kajroth 4 31.28 8788 13.11 10. Simardhari 2 16.98 4233 6.13 11. Mohakampur 1 14.03 2063 4.17 12. Subhashgram 1 32.08 9137 14.33 13. Beswan 3 43.38 11371 16.15 14. Jawar 2 21.18 6291 6.90 15. Karas 8 53.48 14124 23.81 16. Tochhigarh 3 21.68 9706 16.04 17. Asroi 2 27.33 4371 6.87 18. Gidauli 3 29.33 3697 3.92 19. Tarasara 2 21.18 4052 5.66 20. Jirauli 4 28.08 6229 7.70 21. Mauharia 2 28.08 3973 7.46 22. Basgoi 3 21.18 6361 9.36 23. Mursan 1 25.13 12618 4.66
Total 84 178510 - Self sufficient
settlement 2 19.03 - -
Central villages inside the Block
17 - - -
Total no. of villages 103 - - - Source: Based on field survey (2011). Note: Population and area of dependent settlements of central places include its own.

259
These are also designated as central villages performing lower order functions i.e.
primary school, pucca road, electricity for domestic purpose, fair price shop, middle
school and post office. Functions at this level are almost uniform in nature. Fig. 7.16
shows that there are 2 self-sufficient settlement i.e. Naugavan and Sathini (not serving
any other settlements) while 84 settlements are dependent on these central villages.
Table 7.10 exhibits that Iglas and Hastpur chandfari serves largest number of
settlements i.e. 10 followed by Karas and Sahara khurd serving 8 and 7 settlements
respectively. Out of 23 central places Iglas serves largest number of population, area
and centrality i.e. 23,846 persons, 64.54 sq. km, and 64.54 of the block respectively,
while Mohakampur serves lowest population, area, centrality i.e. 2,063 persons ,
14.03 sq.km, 14.03 of the block respectively. It is seen that out of total population and
area of the block, 13,930 persons and 19.03 sq.km belongs to self-sufficient
settlements not serving any other settlement.
Relationship between centrality score of first order rural growth centres and
their dependent population and dependent area
To examine the causal association, centrality score is taken as independent
variable (X) and dependent population & dependent area as dependent variable (Y &
Y1), taking 23 rural growth centres of first order as unit of study. Both centrality score
and dependent population are positively correlated at high degree with r value 0.836,
significant at 0.01 level. Same as previous correlation, both centrality score and
dependent area are positively and strongly correlated with r value 0.847, significant at
0.01 level. It is inferred that a rural growth centres with high functional importance
attracts large number of people from longer distance.
7.4.2 Second order rural growth centres and their complementary region
Six rural growth centres emerged from this study, two of which are outside

260
1 0 1 2 Km543
# CENTRES
AREA SERVED FROM OUTSIDE
SELF SUFFICIENT SETTLEMENTS
# VILLAGES SERVED
N
#
#
#
#
##
##
#
#
#
##
#
#
#
#
#
#
##
#
#
#
#
##
#
#
#
#
#
###
#
# ##
#
# ##
##
#
#
##
#
# ##
##
##
#
###
#
##
#
# ####
#
#
##
#
#
# #
#
##
#
#
##
#
#
#
#
#
#
#
#
#
# #
#
# #
#
#
##
#
# ##
#
Fig. 7.16
study area (Mursan and Sasni) (fig. 7.17). These rural growth centres are also termed
as service centre. Since the nature of functions at this level is non-ubiquitous, it is
interesting to note that there are no self-sufficient settlements (not serving any other
settlement) of the type which has been observed at first order of rural growth centres.
Among the second order rural growth centres or central place, Iglas with
highest centrality score i.e. 2642.01 serves total population of 85,058 persons
including its own population and covers largest area i.e., 126.79 sq. km.( table 7.11)
while lowest centrality score is shown by Tochhigarh i.e.142.99 serving population of
9,706 persons and serves area of 16.05 sq.km. Two central places i.e. Mursan and
Iglas Block Rural Growth Centres and their Complimentary Regions
(First Level of Functional Hierarchy)

261
1 0 1 2 3 4 5Km
#
#
#
#
#
#
#
#
#
#
#
#
#
#
##
#
###
#
#
##
#
#
##
#
#
#
##
#
#
##
#
#
#
#
#
#
#
#
#
# #
##
##
##
##
#
# #
#
#
#
#
#
#
#
#
#
#
#
#
#
#
# #
#
# #
# ##
#
##
#
#
#
#
#
#
#
#
#
###
#
#
#
#
#
#
# CENTRES
VILLAGES SERVED#
AREA SERVED FROM OUTSIDE
#
N
Iglas Block Rural Growth Centres and their Complementary Regions
(Second Level of Functional Hierarchy)
Table 7.11 Iglas Block: Second Order Rural Growth Centres and Their Complementary Region
(2011) SI.No. Service centre Dependent
settlements Centrality
score Population
served Area
served (Km)
1. Hastpurchandfari 22 186.5 26148 45.27 2. Iglas 55 2642.01 85058 126.79 3. Beswan 7 784.2 32690 57.67 4. Tochhigarh 3 142.99 9706 16.05 5. Mursan 11 567.38 27289 22.02 6. Sasni 3 424.2 18307 3.84 Total 101 4747.28 199198 271.64
Source: Based on field survey (2011).
Fig. 7.17

262
Sasni (lie outside the study area) serves total population 27,289 persons and 18,307
persons of the study block respectively while serves total area 22.02 sq.km and 3.84
sq.km of the study block respectively.
Relationship between centrality score of second order rural growth centres and
their dependent population and dependent area
Independent variable i.e. centrality score (X) has been correlated with
dependent variable i.e. dependent population (Y) and dependent area (Y1) taking 6
central places as units of study. It is observed that the correlation between centrality
score and dependent population is positively correlated at high degree i.e. r = 0.985
significant at 0.01 level whereas correlation between centrality score and dependent
area also show high positive correlation having r value 0.978 which is significant at
0.01 level.
7.5 Spatial pattern of Rural Growth Centre / central places
Spatial pattern of central places has special significance in the spatial planning
framework aiming at integrated socio-economic development of the region. It has
been analysed by taking into account the spacing and dispersion.
Table 7.12 Iglas Block: Spatial Pattern of Rural Growth Centres (2011)
S.No. Hierarchic Order of Rural Growth
Centres
No. of Rural Growth Centres
Mean Spacing (Km.)
Dispersion N-N Index Type
1. First order 23 11.84 1.16 Random 2. Second order 6 45.40 1.27 Random
Source: Based on field survey (2011).
The analysis reveals that, first order central places are located at the average
distance of 11.84 km and randomly distributed with Rn value 1.16 in the block.
Second order central places are located at the mean spacing 45.40 km and are
distributed randomly with Rn value 1.27 ( table 7.12).