ifc investor presentation (aug 2017)aug-2017).… · our company is one of the most respected two...
TRANSCRIPT

AUTO HOME BUSINESS
Investor PresentationIntact Financial Corporation (TSX: IFC)
August 2017

2
Canada’s largest home, auto and business insurer
5.9%
6.4%
9.1%
10.4%
17.3%
#5
#4
#3
#2
IFC
Largest market sharein a fragmented industry
10-year outperformance versus the industry
Distinct brands
Industry data: IFC estimates based on MSA Research Inc. Please refer to Important notes on page 3 of the Q1-2017 MD&A for further information.All data as at December 31, 2016.1 Premium growth includes the impact of industry pools.2 Combined ratio includes the market yield adjustment (MYA).3 ROEs reflect IFRS beginning in 2010. Since 2011, IFC's ROE is adjusted return on common shareholders' equity (AROE).
4.2 pts
3.3 pts
5.4 pts
Top 5 represent
49%market share
Premium growth 1
Combined ratio 2
Return on equity 3

3
Consistent outperformance
4.1 pts
7.4 pts
3.1 pts3.6 pts
Personal Auto PersonalProperty
CommercialP&C
CommercialAuto
Five-year average loss ratio outperformance gap
FY2016 outperformance
(for the period ended December 31, 2016)
(for the period ended December 31, 2016)
Sophisticated pricing and
underwriting
Broker relationships
Tailored investment
management
Multi-channel distribution
Proven acquisition
strategy
In-house claims
expertise
Scaleadvantage
2.4%
3.8%
99.6%
95.2%
5.2%
11.0%
Premium growth 1
Combined ratio 2
Return on equity 3
IFC Industry
Industry data: IFC estimates based on MSA Research Inc. Please refer to Important notes on page 3 of the Q1-2017 MD&A for further information.1 Premium growth includes the impact of industry pools.2 Combined ratio includes the market yield adjustment (MYA).3 IFC's ROE is adjusted return on common shareholders' equity (AROE).

4
What we are aiming to achieve
Our customers are our advocates
Our employees are engaged
Our company is one of the most respected
Two million advocates by 2020
One of Canada’s
best employers
Outperform industry ROE by
500 basis points every year
Grow NOIPS 10% per year
over time
� Unaided brand awareness is at an all-time high and continues to climb
� Highest broker satisfaction scores ever recorded
� For the second year in a row we were named one of Canada’s Top 100 Employers and one of the Best Employers in Canada
� Recognized as one of Canada's Top Employers for Young People
� The Globe and Mail’s Board Games ranked us #2 for the quality of our governance
� Made the Best 50 Corporate Citizens in Canada list for 4th straight year
Goal Target Progress

5
Progress on key financial objectives
$0.00
$1.00
$2.00
$3.00
$4.00
$5.00
$6.00
$7.00
2009 2010 2011 2012 2013 2014 2015 2016
Since we became a widely held Canadian company
in 2009 our net operating income per share has
grown at a compound growth rate of 11%. We target
NOIPS growth of 10% per year over time.
NOIPS growth We have regularly exceeded our 500 bps ROE
outperformance target versus the industry.
ROE outperformance
Industry data: IFC estimates based on MSA Research. Please refer to Important notes on page 3 of the Q1-2017 MD&A for further information.
IFC’s ROE corresponds to the AROE.
0
100
200
300
400
500
600
700
5-year avg. FY2016
500 bps
target

6
* Leaves 2 points to reinvest in customer experience
(price, product, service, brand)
Sustaining performance going forward
Beat industry ROE by 5 points every year
NOIPS growth of 10%per year over time
Capital management and
deployment3-5%
Organic
growth2-4%
Margin
improvement2-4%
Claims
management3 pts
Pricing &
Segmentation2 pts
Investments and
capital mgmt.2 pts

7
Industry outlook is conducive to our strategies
Growth numbers reflect Industry Top 20 for the 12 month period ended March 31, 2016. AMF (Québec) chartered insurance companies are not required to report on Q1 and Q3 results. As such, we have included estimates for non-reporters in the industry Top 20, based on publicly available information. Actual results may vary.
Next 12 months:• We expect low-to-mid single-digit
growth in personal auto.• Claims cost inflation should lead
to rate increases in all markets.
Next 12 months:• We expect low single-digit growth in
commercial lines.• These lines of business remain highly
competitive, mainly in the larger risks.
Next 12 months:• We expect mid single-digit growth
in personal property.• We expect the current firm market
conditions to continue.
Personal Auto Personal Property Commercial Lines
3.3% 6.1% 0.2%

8
Develop existing platforms 02
Firming market conditions 01
Consolidate Canadian market 03
Four avenues of growth
Near term Medium term
Multiple levers for profitable growth
Expand beyond existing markets 04

9
OneBeacon acquisitionStrong strategic rationale
� Creating a leading North American specialty insurer
� Focuses on small to mid-size businesses
� New growth pipeline
� New products and cross-border capabilities
� Brings high caliber management team
� Diversifies IFC’s business and geographic mix. Upon closing of the transaction in Q4-16:
� Specialty Solutions will represent 23% of our direct premiums written (DPW), up from 8%.
� The United States will represent 17% of Intact’s total business.
Source: 2016 direct written premium as reported in MSA (Intact) and 10-K (OneBeacon), using April 26th exchange rate

10
Accident
EnvironmentalEntertainment
Import expertise and expand product offering in Canada
Leverage Intact underwriting and pricing expertise to broaden offering in the US and drive profitable growth
Financial Institutions
Cross-Border1. Ability for both Intact and OneBeacon to service domestic
clients that do business in both countries2. Better compete with other North American insurers by
offering a seamless cross-border experience
Small to Mid-Size Commercial & Specialty Lines
Technology
OneBeacon acquisitionDriving cross market synergies

11
OneBeacon acquisitionFinancially compelling & conservatively structured
� NOIPS neutral in year one and mid-single digit accretive in 24 months
� Immediately accretive to BVPS
� Attractive IRR estimated to be in excess of 15%1
� Maintains strong financial position and robust capitalization:
� MCT above 200%
� Debt-to-total capital ratio returning below target level of 20% within 24 months
� Significant downside protection against adverse reserve development
� Thorough reserve assessment factored in valuation
� Reinsurance coverage of up to US$200M
1 Internal rate of return based on equity returns per proposed financing plan. 2 Purchase price based on 94.041mm outstanding shares as at March 31, 20173 Price to book value based on book value as at March 31, 2017.4 Price to earnings based on consolidated earnings for year ended December 31, 2016
Selected financial highlights
billion total purchase price, in Canadian dollars, or US$1.7 billion2.$2.3P/BV3 purchase price, or 15.8x P/E4.1.65x
estimated MCT at close.>200%
internal rate of return (IRR) target is expected to be exceeded.15%

12
A.M. Best DBRS Fitch Moody’s
Long-term issuer credit ratings of IFC a- A A- Baa1
IFC’s principal P&C insurance subsidiaries A+ AA (low) AA- A1
>$1 224%
billion in total excess
capital
Minimum Capital Test
(MCT)
debt-to-capital ratio, returning
below 20% within 24 months
* All data as of June 30, 20171 Refer to Section 12.2 – Ratings of the Q2-2017 MD&A for additional commentary.2 Refer to Section 14– Sensitivity analyses of the Q2-2017 MD&A for additional commentary.
Low sensitivity to capitalmarkets volatility2
-2 pts -1 pt
of MCT per 100 bps
increase in interest rates
of MCT per 5% decrease in
preferred share prices
-2 pts
of MCT per 10% decrease
in common share prices
22.8%
Strong financial position
Credit ratings1
Our balance sheet is solid

13
Strategic capital management
Maintain leverage ratio (target 20% debt-to-total capital)
Increase dividends
Debt-to-capital ratio
Quarterly common share dividends (per share)
Manage volatility
Invest in growth opportunities
Share buybacks $0.1
6 $0.2
5
$0.2
7
$0.3
1
$0.3
2
$0.3
4
$0.3
7
$0.4
0
$0.4
4
$0.4
8
$0.5
3
$0.5
8
$0.6
4
2005 2006 2007 2008 2009 2010 2011 2012 2013 2014 2015 2016 Q3-17 *
11.8%14.3%
22.9%
18.9% 18.7% 17.3% 16.6% 18.6%
22.8%
2009 2010 2011 2012 2013 2014 2015 2016 Q2-17
* Declared

14
Our people advantageWe will continue to invest in people and create a strong and diverse workplace
Depth of talent with an average of 7successors for each Senior Leadership role
Two more than last year
years of experience, on average, that Executive Committee members have with the organization in various roles16
Our efforts have been recognized …
* As of December 31, 2016

15
Key takeaways
2
3
4
1
15
Deep bench in place and growing talent reflective of the evolving environment
We have a strong financial position and a proven track record of consolidation
We have a sustainable competitive edge driven by strong fundamentals, scale and discipline
We are customer driven with diversified offers to meet changing needs

Appendices

17
P&C insurance in CanadaA $48 billion market representing approximately 3% of GDP
Industry DPW by line of business
Industry – premiums by province
• Fragmented market:
– Top five represent 49%, versus bank/lifecomarkets which are closer to 65-75%
– IFC is largest player with approx. 17% market share, versus largest bank/lifeco with 22-25% market share
– P&C insurance shares the same regulator as the banks and lifecos
• Home and commercial insurance rates unregulated; personal auto rates regulated in many provinces.
• Capital is regulated nationally by OSFI* and by provincial authorities in the case of provincial insurance companies.
• Brokers continue to control commercial lines and a large share of personal lines in Canada. However, the direct-to-consumer channel is growing.
• Distribution in the industry is currently about 60% through brokers and 40% through the direct/agency channel.
• Industry has grown at 5.1% CAGR and delivered ROE of ~10% over the last 30 years.
Industry data: IFC estimates based on MSA Research Inc. and Insurance Bureau of Canada. Please refer to Important notes on page 3 of the Q1-2017 MD&A for further information. All data as at December 31, 2016.* OSFI = Office of the Superintendent of Financial Institutions Canada
Personal Auto, 36%
Personal Property,
23%
Commercial P&C and
other, 34%
Commercial Auto, 7%
Ontario, 48%
Quebec, 14%
Alberta, 17%
Other provinces
and territories,
21%

18
P&C industry 10-year performance versus IFC
Return on equity Direct premiums written growth
Combined ratioIFC’s competitive advantages
• Scale advantage
• Sophisticated pricing and underwriting discipline
• In-house claims expertise
• Broker relationships
• Solid investment returns
• Strong organic growth potential
CAD Industry1
10-year avg.= 7.8%
10-year avg.= 13.1%2
CAD Industry1
10-year avg. = 99.2%
10-year avg.= 95.8%
10-yr CAGR= 7.5%
CAD Industry1
10-yr CAGR= 3.4%
(Base 100 = 2006)
90
110
130
150
170
190
210
230
2006 2007 2008 2009 2010 2011 2012 2013 2014 2015 20160%
5%
10%
15%
20%
25%
2007 2008 2009 2010 2011 2012 2013 2014 2015 2016
85%
90%
95%
100%
105%
110%
2007 2008 2009 2010 2011 2012 2013 2014 2015 2016
1 Industry data: IFC estimates based on SNL Financial and MSA Research excluding Lloyd’s, ICBC, SGI, SAF, MPI, Genworth and IFC. All data as at Dec 31, 2015. 2 ROEs reflect IFRS beginning in 2010. Since 2011, IFC's ROE is adjusted return on common shareholders' equity (AROE).
US Industry1
10-year avg.= 7.3%
US Industry1
10-year avg. = 100.7%
US Industry1
10-yr CAGR. = 1.9%

19
46%
25%
29%
Personal Auto
Personal Property
Commercial Lines
41%
27%
18%
14%
Ontario
Quebec
Alberta
Rest of Canada
28%
48%
9%
15%
Intact Insurance - Affiliated brokers
Intact Insurance - Other brokers
BrokerLink
Direct to consumer
2016 DPW by Business Line
2016 DPW by Geography
2016 DPW by Distribution Channel
A strong and diversified base for growth
* Excluding pools, as of December 31, 2016¹Affiliated brokers are either those in which we hold an equity investment or provide financing.
Operational snapshot
1
20
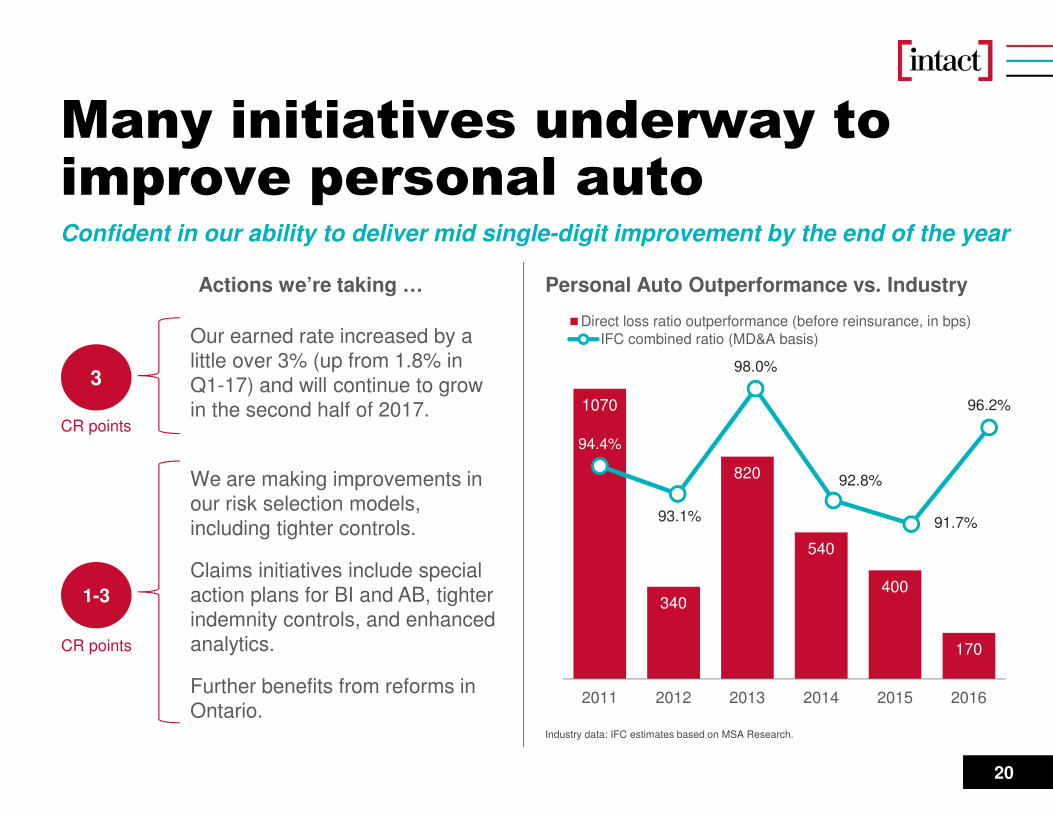
Many initiatives underway to improve personal autoConfident in our ability to deliver mid single-digit improvement by the end of the year
1070
340
820
540
400
170
2011 2012 2013 2014 2015 2016
Direct loss ratio outperformance (before reinsurance, in bps)Our earned rate increased by a little over 3% (up from 1.8% in Q1-17) and will continue to grow in the second half of 2017.
Personal Auto Outperformance vs. Industry
Industry data: IFC estimates based on MSA Research.
We are making improvements in our risk selection models, including tighter controls.
Claims initiatives include special action plans for BI and AB, tighter indemnity controls, and enhanced analytics.
Further benefits from reforms in Ontario.
Actions we’re taking …
3
1-3
CR points
CR points
94.4%
93.1%
98.0%
92.8%
91.7%
96.2%
IFC combined ratio (MD&A basis)

21
Source: OneBeacon1 Represents gross premiums written from continuing operations which excludes exited or discontinued lines and is further adjusted to exclude $11 million in fronting-
related premiums.2 Financial strength rating as of March 31, 2017
� OneBeacon is a Bermuda-domiciled company operating in the US and focused on specialty insurance
� Offers a range of specialty insurance products across 16 diversified business units
� Differentiated, multi-channel distribution approach with an attractive mix of retail (70% of GPW) and wholesale (30% of GPW) distribution
� Flexible and scalable technology platform
� 2016 GPW US$1.2bn | 2016 Net income US$107m | 2016 & 2017 Q1 combined ratio of 97.3% & 94.5% | Book value US$1bn
� Rated A by AM Best / A- by S&P / A3 by Moody’s / A by Fitch2
Operational objective to achieve a combined ratio in the low 90’s for OneBeacon.
Cross-border growth opportunity to better serve Canadian client base.
Total: US$1,190 million
2016 GPW1 by Line of Business
Accident12%
Technology11%
Ocean Marine
11%
Healthcare11%
Government Risks7% Entertainment
7%
Tuition Reimbursement
6%
Inland Marine
6%
Surety5%
Programs4%
Management Liability
4%
Financial Services4%
Specialty Property3%
Other Professional Lines3%
Environmental3%
Financial Institutions3%
OneBeacon is a unique pure-play specialty lines insurer

22
High quality investment portfolio
Fixed-income securities credit quality
$14.9 billion of high quality investments - strategically managed
P281%
P319%
Preferred shares credit quality
AAA44%
AA29%
A24%
BBB2%
• Nearly 97% of fixed-income securities are rated ‘A-’ or better.
• 81% of preferred shares are rated at least ‘P2L’.
• No exposure to leveraged securities.
Investment mix (as of June 30, 2017)
Fixed -income
strategies67%
Common equity
strategies13%
Preferred shares
9%
Cash and short-term
notes8%
Loans3%
BB and lower (including not rated)
1%

23
Track record of prudent reserving practices
� Quarterly and annual fluctuations in reserve development are normal
� 2005 reserve development was unusually high due to the favourable effects of certain auto insurance reforms
� Our consistent track record of positive reserve development reflects our preference to take a conservative approach to establishing and managing claims reserves
Rate of claims reserve development(favourable prior year development as a % of opening reserves)
0%
1%
2%
3%
4%
5%
6%
7%
8%
9%
2004 2005 2006 2007 2008 2009 2010 2011 2012 2013 2014 2015 2016

$702M
$428M
$859M $809M
$435M
$599M $550M$681M
$625M
$970M $1.03B
188%205%
232% 233%
197%205% 203% 209% 203%
218% 224%
-30%
250%
0
200
400
600
800
1000
1200
2007 2008 2009 2010 2011 2012 2013 2014 2015 2016 Q2-17
Total Excess Capital at 170% MCT
24
Strong capital base
* Total excess capital at 170% includes net liquid assets of the non regulated entities
Excess capital levels are maintained to ensure a very low probabilityof breaching a MCT of 170%

25
Further industry consolidation ahead
Our domestic acquisition strategy• Targeting large-scale acquisitions of $500 million or
more in direct premiums written
• Pursuing acquisitions in lines of business where we have expertise
• Acquisition target IRR of ≥15%
• Targets:
− Bring loss ratio of acquired book of business to our average loss ratio within 18 to 24 months
− Bring expense ratio to 2 pts below IFC ratio
Our track record of acquisitions
Canadian M&A environment
Environment more conducive to acquisitions now than in recent years:
• Industry ROEs, although slightly improved from trough levels of mid-2009, are well below prior peak
• Foreign parent companies are generally in less favourable capital position
• Demutualization likely for P&C insurance industry
Top 20 P&C insurers = 85% of market
Industry data: IFC estimates based on MSA Research. Please refer to Important notes on page 3 of the Q1-2017 MD&A for further information.All data as at December 31, 2016.
Year Company DPW
2015 Canadian Direct Insurance $143 million
2014 Metro General $27 million
2012 Jevco $350 million
2011 AXA Canada $2 billion
2004 Allianz $798 million
2001 Zurich $510 million
1999 Pafco $40 million
1998 Guardian $630 million
1997 Canadian Surety $30 million
1995 Wellington $311 million

26
Historical financials(in C$ millions, except as otherwise noted) H1-17 H1-16 2016 2015 2014 2013 2012
Income statement highlights
Direct premiums written 4,244 4,139 8,293 7,922 7,461 7,345 6,854
Underwriting income 138 161 375 628 519 142 451
Net investment income 210 208 414 424 427 406 389
Net operating income (NOI) 316 311 660 860 767 500 675
NOIPS to common shareholders (in C$) 2.34 2.29 4.88 6.38 5.67 3.62 5.00
Balance sheet highlights
Total investments 14,890 13,812 14,386 13,504 13,440 12,261 12,959
Debt outstanding 1,815 1,392 1,393 1,143 1,143 1,143 1,143
Common shareholders' equity 5,522 5,322 5,599 5,235 4,962 4,461 4,400
Performance metrics
Claims ratio 67.4% 64.7% 64.9% 61.3% 62.6% 66.9% 61.6%
Expense ratio 29.2% 31.1% 30.4% 30.4% 30.2% 31.1% 31.5%
Combined ratio 96.6% 95.8% 95.3% 91.7% 92.8% 98.0% 93.1%
Operating ROE (OROE) for the last 12 mo. 12.1% 14.6% 12.0% 16.6% 16.3% 11.2% 16.8%
Debt / Capital 22.8% 19.3% 18.6% 16.6% 17.3% 18.7% 18.9%
Combined ratios by line of business
Personal auto 100.2% 97.0% 99.9% 95.4% 94.5% 93.2% 95.7%
Personal property 96.2% 94.7% 90.9% 85.9% 89.0% 104.4% 93.5%
Commercial P&C 90.5% 95.3% 90.2% 86.8% 94.2% 103.9% 91.6%
Commercial auto 93.0% 93.9% 94.6% 99.0% 89.6% 93.3% 81.5%

27
Visit our online annual report!Please visit our online annual report to view videos, interactive features and additional information on how we are preparing for the future.
reports.intactfc.com/2016

28
Contact us
Media Inquiries
Stephanie Sorensen
Director, External Communications
1 (416) 344-8027
General Inquiries
Intact Financial Corporation700 University AvenueToronto, ON M5G 0A1
1 (416) 341-1464
1-877-341-1464 (toll-free in N.A.)
Investor Inquiries
1 (416) 941-5336
1-866-778-0774 (toll-free in N.A.)
Ken Anderson
VP Investor Relations & Treasurer
1 (855) 646-8228, ext. 87383
Neil Seneviratne
Director, Investor Relations
1 (416) 341-1464 ext. 45156

29
Forward-looking statementsCertain of the statements included in this presentation about the Company’s current and future plans, expectations and intentions, results, levels of activity, performance, goals or achievements or any other future events or developments constitute forward-looking statements. The words “may”, “will”, “would”, “should”, “could”, “expects”, “plans”, “intends”, “trends”, “indications”, “anticipates”, “believes”, “estimates”, “predicts”, “likely”, “potential” or the negative or other variations of these words or other similar or comparable words or phrases, are intended to identify forward-looking statements. This presentation contains forward-looking statements with respect to the financing structure for the acquisition (the “Acquisition”) of OneBeacon Insurance Group Ltd. (“OneBeacon”) and the completion of and timing for completion of the Acquisition.
Forward-looking statements are based on estimates and assumptions made by management based on management’s experience and perception of historical trends, current conditions and expected future developments, as well as other factors that management believes are appropriate in the circumstances. Many factors could cause the Company’s actual results, performance or achievements or future events or developments to differ materially from those expressed or implied by the forward-looking statements, including, without limitation, the following factors: the use of the net proceeds from the bought deal public offering (the “Offering”) of subscription receipts of the Company (the “Subscription Receipts”) and the sale of Subscription Receipts to private placement subscribers pursuant to concurrent private placements with the Offering (the “Concurrent Private Placements”); the timing and completion of the Acquisition; expected competition and regulatory processes and outcomes in connection with the Acquisition; the Company’s ability to implement its strategy or operate its business as management currently expects; its ability to accurately assess the risks associated with the insurance policies that the Company writes; unfavourable capital market developments or other factors which may affect the Company’s investments, floating rate securities and funding obligations under its pension plans; the cyclical nature of the P&C insurance industry; management’s ability to accurately predict future claims frequency and severity, including in the Ontario personal auto line of business, as well as catastrophe losses caused by severe weather and other weather-related losses; government regulations designed to protect policyholders and creditors rather than investors; litigation and regulatory actions; periodic negative publicity regarding the insurance industry; intense competition; the Company’s reliance on brokers and third parties to sell its products to clients and provide services to the Company; the Company’s ability to successfully pursue its acquisition strategy; the Company’s ability to execute its business strategy; the Company’s ability to achieve synergies arising from successful integration plans relating to acquisitions, as well as management's estimates and expectations in relation to NOIPS, BVPS, MCT and debt-to-capital ratio; the terms and conditions of the Acquisition; the Company’s financing plans for the Acquisition, including the availability of equity and debt financing in the future the Company’s participation in the Facility Association (a mandatory pooling arrangement among all industry participants) and similar mandated risk-sharing pools; terrorist attacks and ensuing events; the occurrence of catastrophe events, including a major earthquake; the Company’s ability to maintain its financial strength and issuer credit ratings; access to debt financing and the Company's ability to compete for large commercial business; the Company’s ability to alleviate risk through reinsurance; the Company’s ability to successfully manage credit risk (including credit risk related to the financial health of reinsurers); the Company’s ability to contain fraud and/or abuse; the Company’s reliance on information technology and telecommunications systems and potential failure of or disruption to those systems, including evolving cyber-attack risk; the Company’s dependence on key employees; changes in laws or regulations; general economic, financial and political conditions; the Company’s dependence on the results of operations of its subsidiaries and the ability of the Company’s subsidiaries to pay dividends; the volatility of the stock market and other factors affecting the trading prices of the Company’s securities (including the Subscription Receipts); the Company’s ability to hedge exposures, including those related to purchase price and book value related to the Acquisition, to fluctuations in foreign exchange rates; future sales of a substantial number of its common shares; changes in applicable tax laws, tax treaties or tax regulations or the interpretation or enforcement thereof; and the timing of the distribution of the Subscription Receipts pursuant to the Offering, including the expected closing date of the Offering and the distribution of common shares of the Company upon closing of the Acquisition.
All of the forward-looking statements included in this presentation are qualified by these cautionary statements, those made in the section entitled Risk management (Sections 17-21) of our MD&A for the year ended December 31, 2016 and those found in the Risk Factors section of the prospectus supplement dated May 4, 2017 related to the issuance of the Company’s subscription receipts. These factors are not intended to represent a complete list of the factors that could affect the Company. These factors should, however, be considered carefully. Although the forward-looking statements are based upon what management believes to be reasonable assumptions, the Company cannot assure investors that actual results will be consistent with these forward-looking statements. When relying on forward-looking statements to make decisions, investors should ensure the preceding information is carefully considered. Undue reliance should not be placed on forward-looking statements made herein. The Company and management have no intention and undertake no obligation to update or revise any forward-looking statements, whether as a result of new information, future events or otherwise, except as required by law.

30
Disclaimer
This Presentation does not constitute or form part of any offer for sale or solicitation of any offer to buy or subscribe for any securities nor shall it or any part of it form the basis of or be relied on in connection with, or act as any inducement to enter into, any contract or commitment whatsoever.
The information contained in this Presentation concerning the Company does not purport to be all-inclusive or to contain all the information that a prospective purchaser or investor may desire to have in evaluating whether or not to make an investment in the Company. The information is qualified entirely by reference to the Company’s publicly disclosed information.
No representation or warranty, express or implied, is made or given by or on behalf of the Company or any of its the directors, officers or employees as to the accuracy, completeness or fairness of the information or opinions contained in this Presentation and no responsibility or liability is accepted by any person for such information or opinions. In furnishing this Presentation, the Company does not undertake or agree to any obligation to provide the attendees with access to any additional information or to update this Presentation or to correct any inaccuracies in, or omissions from, this Presentation that may become apparent. The information and opinions contained in this Presentation are provided as at the date of this Presentation. The contents of this Presentation are not to be construed as legal, financial or tax advice. Each prospective purchaser should contact his, her or its own legal adviser, independent financial adviser or tax adviser for legal, financial or tax advice.
The Company uses both International Financial Reporting Standards (“IFRS”) and certain non-IFRS measures to assess performance. Non-IFRS measures do not have any standardized meaning prescribed by IFRS and are unlikely to be comparable to any similar measures presented by other companies. Management analyzes performance based on underwriting ratios such as combined, expense, loss and claims ratios, MCT, and debt-to-capital, as well as other non-IFRS financial measures, namely DPW, Underlying current year loss ratio, Underwriting income, NOI, NOIPS, OROE, ROE, AROE, Non-operating results, AEPS, Cash flow available for investment activities, and Market-based yield. These measures and other insurance related terms are defined in the Company’s glossary available on the Intact Financial Corporation web site at www.intactfc.com in the “Investors” section. Additional information about the Company, including the Annual Information Form, may be found online on SEDAR at www.sedar.com.