ies webinar: q2 energy outlook: what are the risks with renewables?
TRANSCRIPT

Q2 ENERGY OUTLOOK: WHAT ARE THE RISKS WITH RENEWABLES?Energy Market Outlook May 12, 2016
Presenters: Jonathan Lee, Senior Energy Market Intelligence Manager and
Ian Bowman, Director, Product Management, both with Ecova

DISTRIBUTED ENERGY RESOURCES
• Spotlight on five risks or sensitivities on onsite PV financial cases
ENERGY MARKET UPDATE: Q2 2016
• Why are energy prices still low, and can these be counted on to last?
• Electric generation and expected capacity changes coming this summer
Capitalize on low energy resources
• Wholesale natural gas and electricity prices are expected to slowly rise during 2016. Upside supply price risk is more likely than further downside moves
TODAY’S TOPICS

DISTRIBUTED ENERGY RESOURCES (DER)?
Opportunities, and challenges
• Falling costs yielding increasing variety of grid-competitive DER opportunities
• Outlook for DER opportunities to become increasingly interconnected from grid planning and tariffs, to client site
• Multiple Risks in Business Cases that Need to be Identified and Managed
DER is an emerging category name for:
• On & offsite renewables (Wind, Solar)
• Energy storage and demand response

DISTRIBUTED ENERGY RESOURCES SPOTLIGHT
Last Webinar: Many reasons to be excited about DER opportunities
This Webinar: Spotlight 5 (of many) Risks in PV financial cases

DISTRIBUTED ENERGY RESOURCES SPOTLIGHT
Spotlight on 5 (of Many) Risks in PV financial cases
1. “Average” Rate vs Avoidable
2. Intermittency impacts ability to avoid demand charges
3. Active Utility Rate-Making Reshapes Rate Increases
4. Wholesale On/Off Peak Market Shifts
5. Understated “Average” Panel Degradation

Average Rate VS Solar “AVOIDABLE” Grid Charges
Fixed Charges per Month are not avoidable
Demand Charges Range from 0-50% of commercial rates, and are only partially avoidable with solar PV.
KWH consumption charges are generally avoidable, but also subject to specifics of NET Metering
All-in “Average Rate” is definitely not a good benchmark for avoidable charges
Fixed $Per Month
DemandKw Charges
AvoidableDaytime$/kwh

PV Intermittency Dulls Demand Charge Avoidance
1. Demand charges often based on highest 15-60 minute period of net load. Brief sags in PV output due tor rain/clouds can negate demand impact
2. Demand Tariffs may include a Time of Day window that extends beyond solar production peak
1
2
Fixed $Per Month
DemandKw Charges
AvoidableDaytime$/kwh

Active Utility Ratemaking Reshapes Rate Increases
1-3% annual average rate increase has a long history, and seems like a reasonably conservative assumption, but . . .
46 States have some form of rate filing with rate structural implications for solar
– Many efforts started last year to raise fixed fees (not avoidable by PV).
– Demand Charges (partially avoidable)
– Net Metering / Value of solar tariffs
– Shifting On-Peak hours to later in the day
So, what if
– The average goes up 2%, but increases are largely in Demand Charges?
– The average goes up 2%, but daytime prices (solar production peak time) go down?

Solar Resets Wholesale Concept of Peak/OffPeak
10am to 2pm = LOW prices
– This is a forecast of average
– Some days . . . Much lower?
“Peak” moves later in the day
Implications . . .
– Corporates that can begin to “coast” buildings by around 5pm
– Retail, and others with extended hours
– Value of solar ownership

Panel Degradation Rates and Sensitivity

Q2 2016 ENERGY MARKET UPDATE

ELECTRIC AND NATURAL GAS MARKET DRIVERS11 May 2016
Bearish – Market Influencers Driving Prices Lower:
Natural Gas Production – Declining, but still in line with last year at this time.
Natural Gas Storage – Exited winter heating season at an all-time high. Currently 49% above last year.
Demand – Demand lower during the current shoulder period ahead of summer.
Economy – FOMC says economy appears to have slowed. Manufacturing growth declined last month.
Coal – Weak coal prices lower baseline electric generation costs.
Bullish – Market Influencers Driving Prices Higher:
Gas-Fired Electric Generation – At record high. Higher natural gas prices would drive electric prices higher.
Weather Forecast – Summer forecast pointing to increased A/C demand.
LNG – Sabine Pass LNG exporting supplies to global markets.
Environmental Regulations – Even though EPA Clean Power Plan stalled, impacts still present.
ISO Reliability – Retiring coal plants forcing ISO’s to evaluate grid reliability.
Interest Rate Hike – Fed interest rate hike increases the cost of capital and could slow natural gas and oil production.

NATURAL GAS 12-MONTH STRIP UP FROM 17-YR LOW$MMBtu – 11 May 2016
On February 25th, the strip fell to its lowest level since early-1999.
In 2002 and 2012, the last two times the 12-month strip operated at these rare depths, price-recovery to $3.00/MMbtu occurred within 38 and 19 days.
Katrina & Rita
Polar Vortex
Commodity Bubble & Collapse
Cold Winter, Supply/Demand
rebalance
Shale Gas Revolution
Soaring Production
Hurricane Ivan

ELECTRIC 12-MONTH STRIPS CLIMBING AHEAD OF SUMMER$MWh – 11 May 2016
12-MonthRolling Strip
NYMEX Correlation
ERCOT HZ 98.9%
NY ISO J 96.8%
PJM West 92.4%
NEPOOL 95.6%
MISO 92.6%
PG&E NP-15 99.1%
$20
$30
$40
$50
$60
$70
$80
$90
$/M
Wh
ERCOT AVG NY ISO J PJM NEPOOL MISO PG&E NP15 W

Natural gas production
peaked in Sept 2015 at
80.2 Bcf/day and again
in Feb 2016 at 80.1
Bcf/day.
But, growth anticipated
to return prior to winter
season in response to
increases in price,
demand, and LNG
exports.
NATURAL GAS PRODUCTION DECLININGEIA - May 2016

GAS SUPPLIES TO MAX OUT STORAGE CAPACITY?EIA – May 2016
• Record high storage exiting heating season.
• Around 1,800 Bcf of available storage capacity.
• Maximum storage capacity is around 4,300 Bcf.
• Five-year average injections around 2,300 Bcf.

SUMMER 2016 OUTLOOKAccuWeather, NOAA – May 2016
Above-normal temperatures expected throughout much of the nation.
Drought conditions expected to continue in the West and potentially emerge in the Midwest.
Hot summer in the East could drive increased A/C demand.

EL NIÑO POTENTIALLY TRANSITIONING TO LA NIÑANWS, NOAA – May 2016
La Niña typically brings colder-than-normal winters to Midwest, Northeast.

GAS-FIRED GENERATION PLAYING A MAJOR ROLE EIA - February 2016
Natural gas was the largest source of electric
generation the majority of 2015.
Expected to average about 34.0% of the total
share in 2016, while coal is forecast to average
30.5%.
U.S. to add about 18.7 GW of natural gas-fired generation capacity between 2016 and 2018.
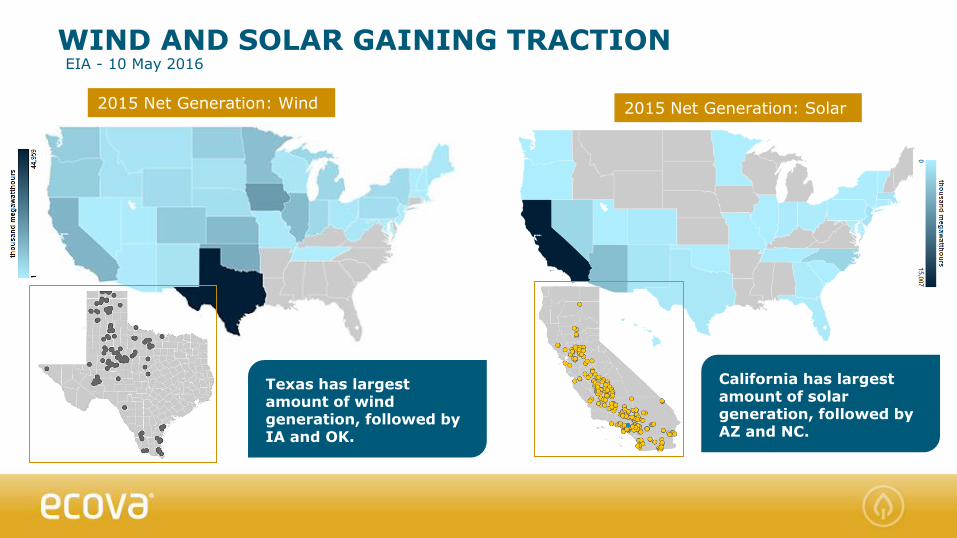
WIND AND SOLAR GAINING TRACTION EIA - 10 May 2016
2015 Net Generation: Wind 2015 Net Generation: Solar
Texas has largest amount of wind generation, followed by IA and OK.
California has largest amount of solar generation, followed by AZ and NC.

PJM CAPACITY PRICES LOWER IN 2016/2017 PJM - 11 May 2016
Blending multiple planning years mitigates impact of increases in 3 years.

MISO CHALLENGED BY CHANGING GENERATION FLEETMISO - 11 May 2016
Capacity prices in Ameren Illinois almost 50% lower than last year.

NEISO CAPACITY RISING TO MEET DEMANDNEISO - 11 May 2016
Significant jump in Boston (NEMA) capacity prices for 2016/2017 and 2017/2018.

NYISO STRIP CAPACITY PRICES DECLINING YOYNYISO - 11 May 2016
NYC strip capacity prices about $10/MWh lower than last summer.

MAJOR TAKEAWAYS
UNDERSTAND RISKS ASSOCIATED WITH PV FINANCIAL CASES WHEN DETERMINING WHETHER SOLAR IS THE RIGHT FIT.
WHOLESALE NATURAL GAS PRICES HOVERING AROUND 2012 LOWS.
• Supply and demand slowly rebalancing, but oversupply conditions still remain.
• ELECTRIC ISO’S WORKING TO MAINTAIN RELIABILITY IN CHANGING GENERATION LANDSCAPE.
• Capacity prices rising in most regions as retiring power plants, increased demand create challenges.
• DEPRESSED ENERGY PRICE LEVELS PRESENT OPPORTUNITY FOR LONG-TERM APPROACH TO DEREGULATED THIRD PARTY SUPPLY CONTRACTS.
• Wholesale natural gas and electricity prices are expected to slowly rise during 2016. Upside supply price risk is more likely than further downside moves.

HAVE YOU VISITED ECOVA.COM LATELY?
UPCOMING WEBINARS
INSIDE ENERGY & SUSTAINABILITY
Blue is the New Gold – Thursday, June 9th at 11A PST

Q&A

Thank You!