iea’s medium-term renewable energy - chicago · iea’s medium-term renewable energy ......
TRANSCRIPT

© OECD/IEA 2015© OECD/IEA 2015
The Role of Bioenergy in IEA’s Medium-Term Renewable Energy Market Report 2015
Adam Brown and Pharoah Le Feuvre
Renewable Energy Division
International Energy Agency
tcbiomass2015 - Technology for the Bioeconomy
Chicago 2-5 November 2015

© OECD/IEA 2014
Role of Bioenergy in IEA ETP Scenarios
IEA: Energy Technology Perspectives 2015
Bioenergy is largest primary energy carrier in 2 DS in 2050

© OECD/IEA 2015
The share of non-hydro renewable electricity generation is rising
……. however bioenergy’s share drops due to faster growth of onshore wind and PV.
Renewable electricty generation growing steadily
Renewable generation by technology (2005-20)
0
1 000
2 000
3 000
4 000
5 000
6 000
7 000
8 000
2005 2006 2007 2008 2009 2010 2011 2012 2013 2014 2015 2016 2017 2018 2019 2020
Gene
ratio
n (TWh)
Hydropower Bioenergy Onshore wind Offshore wind Solar PV Geothermal STE Ocean
54%
28%22%
Share of bioenergy in non-hydro
renewable generation
ForecastHistorical

© OECD/IEA 2015
Bioenergy generation by region (2006-20)
As growth slows in some major OECD bioenergy markets, higher levels of generation are anticipated in certain non-OECD countries with abundant resources and policy
drivers.
Medium-term market overview for bioenergy electricity by region
0
100
200
300
400
500
600
700
2005 2006 2007 2008 2009 2010 2011 2012 2013 2014 2015 2016 2017 2018 2019 2020
TWh
OECD Americas OECD Asia Oceania OECD Europe Africa Asia
China Non-OECD Europe Non-OECD Americas Middle East

© OECD/IEA 2015
Increased competition from other renewables
High levels of incentives are no longer necessary for solar PV and onshore wind in many markets. Support for bio-electricity focussing on the most cost-efficient applications.
Historical and forecast global weighted average generation costs for new
onshore wind and PV plants vs. selected reference bioenergy LCOEs
0
50
100
150
200
250
300
350
400
2010 2015 2020 2010 2015 2020 Dedicated
biomass
Co-firing
(woodchips &
pellets)
Wastes &
residues
Emerging
Technoligies
e.g.
gasification
Aenerobic
Digestion
Onshore wind Solar PV - utility scale Selected bioenergy technologies
USD
2014
/MWh

© OECD/IEA 2015
Notable marketplace adjustments 2014-15
Country Revision Market
Impact
Canada Coal to biomass conversions stimulated by phase out of coal in Ontario. ▲
BrazilRecent renewable energy Power Purchase Agreement (PPA) auctions held over the 2013-
14 period offered more favorable terms to bioenergy projects.▲
KoreaAnnual increase in requirements of Portfolio Standard (RPS) for 13 largest power
companies drives biomass co-firing.▲
Germany
Downward FIT adjustments, removal of some project-specific bonus tariffs, restriction of
new capacity eligible for support to 100 MW per year until 2017, with support then
phased out entirely for new plants above 100 kW.
▼
PolandSupport for biomass will reduced in existing green certificate scheme. Restrictions
increased on volume of certificates awarded for co-firing.▼
United Kingdom
No budget allocated for conversions within the initial Contracts for Difference (CfD)
auction round (besides two coal projects already confirmed), and changes introduced
which alter support for biomass unit conversions under the Renewables Obligation
scheme. Climate Change Levy exemption for renewables removed.
▼
Diverse policy adjustments affect bioenergy prospects in key markets.

© OECD/IEA 2015
Stabilisation of global biofuels production anticipated
World biofuels production by volume 2008-20
Global conventional biofuels production forecast to stabilise over the medium-term.
0.0
0.5
1.0
1.5
2.0
2.5
0
20
40
60
80
100
120
140
160
2005 2007 2009 2011 2013 2015 2017 2019
mb/d
Billion
litres
United States biofuels Brazil biofuels OECD Europe biofuels Rest of the world biofuels

© OECD/IEA 2015
Mandates effectively support global biofuels production
Blending mandates support demand, even with a low oil price environment.
Comparison of global biofuels production and oil prices 2007-20 (indexed)
0
50
100
150
200
250
2007 2008 2009 2010 2011 2012 2013 2014 2015 2016 2017 2018 2019 2020
2007
= 1
00
MTRMR 2015 global
biofuels production
IEA crude oil import
average price
Forecast
Forward assumption
Historical
© OECD/IEA 2015
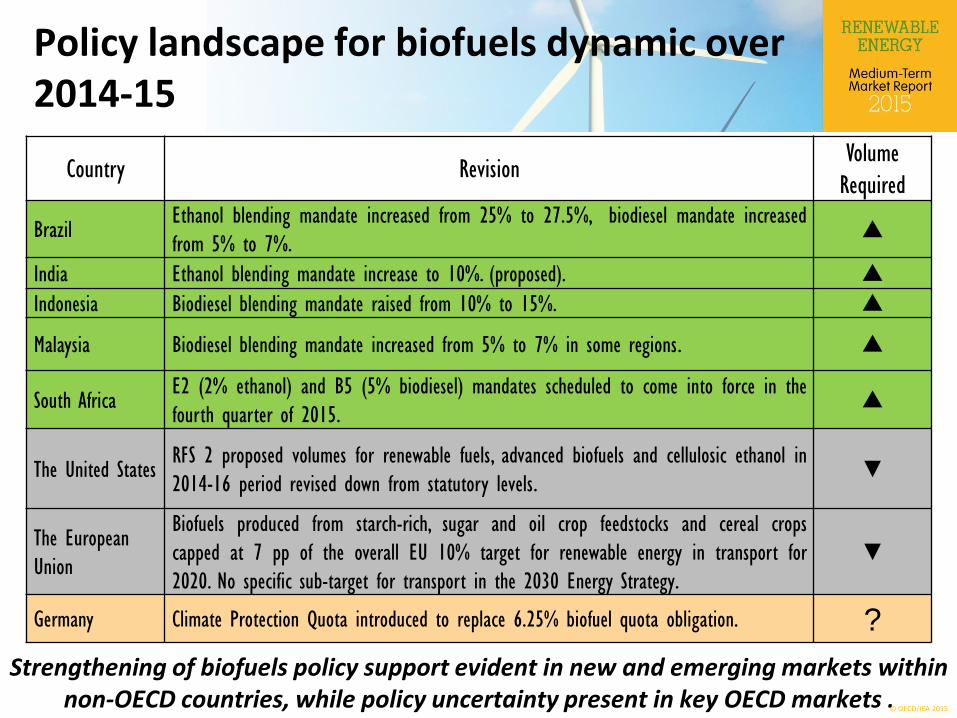
Policy landscape for biofuels dynamic over 2014-15
Country Revision Volume
Required
BrazilEthanol blending mandate increased from 25% to 27.5%, biodiesel mandate increased
from 5% to 7%.▲
India Ethanol blending mandate increase to 10%. (proposed). ▲Indonesia Biodiesel blending mandate raised from 10% to 15%. ▲
Malaysia Biodiesel blending mandate increased from 5% to 7% in some regions. ▲
South AfricaE2 (2% ethanol) and B5 (5% biodiesel) mandates scheduled to come into force in the
fourth quarter of 2015.▲
The United StatesRFS 2 proposed volumes for renewable fuels, advanced biofuels and cellulosic ethanol in
2014-16 period revised down from statutory levels.▼
The European
Union
Biofuels produced from starch-rich, sugar and oil crop feedstocks and cereal crops
capped at 7 pp of the overall EU 10% target for renewable energy in transport for
2020. No specific sub-target for transport in the 2030 Energy Strategy.
▼
Germany Climate Protection Quota introduced to replace 6.25% biofuel quota obligation. ?
Strengthening of biofuels policy support evident in new and emerging markets within non-OECD countries, while policy uncertainty present in key OECD markets .

© OECD/IEA 2015
Early commercialisation in the advanced biofuels sector
Commissioned commercial scale advanced biofuel plants
Advanced biofuels – needed for long-term decarbonisation of the transport sector –are starting to scale up.

© OECD/IEA 2015
Production costs assessment for cellulosic ethanol
Analysis of a breakeven crude oil price for cellulosic ethanol
Production costs for cellulosic ethanol anticipated to be above 2015 oil prices, but significant cost reduction potential identified within the industry.
2014-15 industry focused figures
≤40 50 60 70 80 90 100 110 120 130 140 150 160 170 180 190 200+
0.00
0.20
0.40
0.60
0.80
1.00
1.20
1.40
Gasolin
e US
D / Litre
Crude oil price Wholesale gasoline price (USD 10 margin) Advanced biofuel cost estimate (adj. for energy content)
Achievable with
industry expansion?

© OECD/IEA 2015
Further policy support required to accelerate growth in renewable heat
Consumption of modern renewable energy for heat 2008-20
Challenges persist to increasing the contribution of renewables and decarbonising the heat sector, however established renewable heat policies have proved successful.
0
2
4
6
8
10
12
14
16
18
20
2008 2009 2010 2011 2012 2013 2014 2015 2016 2017 2018 2019 2020
EJ
Geothermal Solar thermal Modern bioenergy

© OECD/IEA 2015
Lower heating oil prices mean increased competition for domestic biomass systems
3
4
5
6
7
8
9
1Q -
2012
3Q -
2012
1Q -
2013
3Q -
2013
1Q -
2014
3Q -
2014
1Q -
2015Eu
ro cen
t / kW
h
Domestic heating oil Consumer wood pellets
Natural gas
30
50
70
90
110
130
150
170
190
2012 2013 2014 2015 2016 2017 2018 2019 2020
Thou
sand
s
Total installed wood pellet stoves
Domestic <50kW wood pellet boilers
Forecast
Source: AIBIOM
(2015)
Historical
Medium-term forecasted growth in wood pellet system installation (left)
and delivered domestic fuel cost comparison 2012-15 (right) in Austria
Downward movement in heating oil costs has reduced running costs from oil-fired heating systems and closed the fuel price gap to pellets.

© OECD/IEA 2015
Biomass Supply
Source: Adapted from IPCC (2011), and supplemented with IEA data
c. 150 EJ needed to supply transport and heat and power needs (8-11 billion tonnes)Around ½ from residues/wastes, ½ from crops

© OECD/IEA 2015
IEA Biofuel Roadmap - Vision
Biofuel supply grows rapidly and reaches 32EJ in 2050
Diesel/kerosene-type biofuels particularly important to decarboniseheavy transport modes
Large-scale deployment of advanced biofuels will be key

© OECD/IEA 2015
Bioenergy must be part of a broader context?
Source: IEA (2014), Energy Technology perspectives 2014
Integration with
agriculture and forestry
- coproducts and
residues
Coproduction
with biobased
materials Biofuels
Bioenergy heat & power
Environmental
services
(emissions
reductions, wastes)

© OECD/IEA 2015
Conclusions
Renewable growth continues despite low fossil fuel price context and policy uncertainties
The effect of the lower oil price environment is less pertinent for bioenergy for power, but biofuels and heat sectors are impacted in some circumstances
Bio-electricity faces potential competition from lower cost renewables, with opportunities focused on low cost and well integrated projects
Continued policy action is needed for heat and biofuel sectors. Policy uncertainties risk undermining investor confidence and are dampening growth
Good progress in commercialisation of cellulosic ethanol and significant cost reduction potential but long term policy and market framework uncertain
Slow commercialization of thermal processes and energy crops
Integration is the key!

© OECD/IEA 2015
For further insights and analysis…
The Medium-Term Renewable Energy Market Report 2015 was launched on 02 October 2015 and can be purchased online at:
www.iea.org
Thank you for your attention!