medium-term renewable energy market report 2015
TRANSCRIPT

RENEWABLE ENERGYMedium-Term Market Report 2015
Market Analysis and Forecasts to 2020
Together
SecureSustainable
Please note that this PDF is subject to specific restrictions that limit its use and distribution. The terms and conditions are available online at www.iea.org/t&c/

RENEWABLE ENERGYMedium-Term Market Report 2015
Market Analysis and Forecasts to 2020
Together
SecureSustainable
Explore the data behind MTRMR 2015The IEA is expanding the availability of data used to create the Medium-Term Renewable Energy Market Report 2015 publication. Please
visit the restricted area of the MTMR website, www.iea.org/publications/mtrmr/. There you will find country data information including data
tables available for download. The website is evolving and will be continuously updated. Your username is “IEA_MTRMRuser” and password
“IEA_MTREmarkets2015”.
INTERNATIONAL ENERGY AGENCY
The International Energy Agency (IEA), an autonomous agency, was established in November 1974. Its primary mandate was – and is – two-fold: to promote energy security amongst its member
countries through collective response to physical disruptions in oil supply, and provide authoritative research and analysis on ways to ensure reliable, affordable and clean energy for its 29 member countries and beyond. The IEA carries out a comprehensive programme of energy co-operation among its member countries, each of which is obliged to hold oil stocks equivalent to 90 days of its net imports. The Agency’s aims include the following objectives:
n Secure member countries’ access to reliable and ample supplies of all forms of energy; in particular, through maintaining effective emergency response capabilities in case of oil supply disruptions.
n Promote sustainable energy policies that spur economic growth and environmental protection in a global context – particularly in terms of reducing greenhouse-gas emissions that contribute to climate change.
n Improve transparency of international markets through collection and analysis of energy data.
n Support global collaboration on energy technology to secure future energy supplies and mitigate their environmental impact, including through improved energy
efficiency and development and deployment of low-carbon technologies.
n Find solutions to global energy challenges through engagement and dialogue with non-member countries, industry, international
organisations and other stakeholders.IEA member countries:
Australia Austria
Belgium Canada
Czech RepublicDenmark
EstoniaFinland
FranceGermany
GreeceHungary
Ireland Italy
JapanKoreaLuxembourgNetherlandsNew Zealand NorwayPolandPortugalSlovak RepublicSpainSwedenSwitzerlandTurkey
United KingdomUnited States
The European Commission also participates in
the work of the IEA.
Please note that this publication is subject to specific restrictions that limit its use and distribution.
The terms and conditions are available online at www.iea.org/t&c/
© OECD/IEA, 2015International Energy Agency
9 rue de la Fédération 75739 Paris Cedex 15, France
www.iea.org
Together
SecureSustainable
FOREWORD
MEDIUM-TERM RENEWABLE ENERGY MARKET REPORT 2015 3
FOREWORD Recent dramatic declines in costs are facilitating deployment for the most dynamic renewable technologies, provided an appropriate enabling environment is in place. Energy-related CO2 emissions show signs of decoupling from economic growth, and both developed and developing countries have made unprecedented policy pledges ahead of the COP21 climate conference in Paris. Indeed, these trends are changing the nature of the negotiations on climate change. Governments are starting to realise that, even in the context of lower fossil fuel prices, affordable win-win solutions now exist for enhancing local energy security and reducing local pollution – and mitigating global climate change at the same time. As the first book published in my role as Executive Director, the fourth Medium-Term Renewable Energy Market Report reveals the importance of renewables in shaping a more secure and sustainable energy system. With strong energy diversification, security and environmental drivers continuing to underpin supportive policy frameworks, renewables should become the first source for electricity in the longer term. For markets with acute power needs, such as sub-Saharan Africa and India, renewables can cost-effectively improve energy access in rural areas and the provision of electricity in cities. Moreover, technology innovation and improved financing conditions are creating leapfrog opportunities for development mainly based on clean power, away from price-volatile fossil fuels. This transition can increasingly underpin, rather than threaten, economic growth. Still, this report highlights that the evolution of risks to such a vision over the next five years will be crucial. Renewable heat and biofuels for transport grow much more slowly than renewable electricity. Oil prices have fallen precipitously. Financing remains key to achieving sustained investment. Regulatory barriers, grid constraints, and macroeconomic conditions pose challenges, particularly in developing countries. In industrialised countries, the rapid deployment of renewables requires scaling down fossil-fired power plants, putting incumbent utilities under pressure. Wavering policy commitments to decarbonisation and diversification in response to such effects can undermine investor confidence, and retroactive changes can destroy it. Increased efforts are needed to avoid the destructive impacts of climate change. This report gives examples of policy enhancements to achieve an accelerated renewable transition, compatible with ambitious climate protection goals. These include a stable investment climate with long-term remuneration certainty and a market design that better values the electricity produced. To be sure, system and grid integration will be crucial for enabling high levels of wind and solar PV. The IEA remains at the forefront of addressing these issues, including possible impacts on electricity security. But while the variability of renewables is a challenge to which energy systems can learn to adapt, the variability of policies poses a far larger risk. Weaker fossil fuel prices should not encourage complacency. Rather, they afford policy makers rare breathing space to commit to a more profound transformation of energy markets. The analysis within this report, and across the set of IEA medium-term reports, provides key insights on anticipated market trends for the entire energy system over the next five years. In so doing, it provides crucial benchmarks for decision makers on the road to a sustainable energy system. Fatih Birol Executive Director International Energy Agency

ACKNOWLEDGEMENTS
ACKNOWLEDGEMENTS The Medium-Term Renewable Energy Market Report 2015 was prepared by the Renewable Energy Division of the International Energy Agency (IEA). The main authors of the report are Yasmina Abdelilah, Heymi Bahar, Karolina Daszkiewicz, Pharoah Le Feuvre and Michael Waldron, who led and co-ordinated the analysis. Simon Mueller authored the Feature Box on distributed solar PV with analysis by Emanuele Bianco and Zuzana Dobrotkova (consultant). Cédric Philibert authored the Feature Box on PV learning rates. Yasuhiro Sakuma authored the Feature Box on Japan electricity market reform and offshore development in Asia. Yanqiu Bi also provided valuable content input. Adam Brown provided important input on the renewable policy and technology analysis. Paolo Frankl, Head of the Renewable Energy Division, provided valuable guidance and input to this work, as did Keisuke Sadamori, Director of Energy Markets and Security.
This report has benefited from valuable administrative support provided by Michelle Adonis and Jane Berrington.
Other IEA colleagues who have also made important contributions to this work: Pierpaolo Cazzola and Marine Gorner authored the Feature Box on electric vehicles; Marco Baroni, David Bénazéraf, Stéphanie Bouckaert, Laura Cozzi, Dagmar Graczyk, Timur Guel, Veronica Gyuricza, Antoine Halff, Joerg Husar, Costanza Jacazio, Florian Kitt, Simone Landolina, Matthew Parry, Valerio Pilia, Roberta Quadrelli, Uwe Remme, Jesse Scott, Christopher Segar, Nora Selmet, Laszlo Varro, Brent Wanner, David Wilkinson, Matthew Wittenstein, Takuro Yamamoto and Georgios Zazias. Timely data from the IEA Energy Data Centre were fundamental to the report with particular assistance owed to Duncan Millard, Chief Statistician, and Pierre Boileau, Emmanouil Christinakis, Loïc Coent, Markus Fager-Pintila, Rémi Gigoux, Aidan Kennedy, Vladimir Kubecek, Roberta Quadrelli, and Gianluca Tonolo. OECD Environment Directorate colleagues Geraldine Ang and Olivier Durand-Lasserve also provided important comments.
This work benefited from extensive review and comments from the IEA Standing Group on Long-Term Co-operation, Renewable Energy Working Party, renewable energy Implementing Agreements, members of the Renewable Industry Advisory Board and experts from partner countries and other international institutions. The work also benefited from feedback by the IEA Committee on Energy Research and Technology.
In particular, thanks are due to the following organisations that provided important review comments or project inputs:
Abengoa Solar, Australia (Department of Industry), Acciona, Althesys, Austria (Austria Energy Agency and Federal Ministry of Science, Research and Economy), Belgium (Federal Public Service Economy), Belgium (Permanent Delegation of Belgium to the OECD), Berkeley Energy, Brazil (Centro de Pasquisas de Energia Eletrica and Ministry of Mines and Energy), Canada (Natural Resources Canada), Chile (Permanent Delegation of Chile to the OECD), China (Energy Research Institute/National Development and Reform Commission and China National Renewable Energy Centre), Citigroup Capital Markets, Inc., Dii, Dong Energy, EnerjiSA, E.ON Climate and Renewables, EDF, Egypt (Ministry of Electricity and Energy, New and Renewable Energy Authority), Eneco, Enel Green Power, European Commission (DG for Energy), European Bank for Reconstruction and
4 MEDIUM-TERM RENEWABLE ENERGY MARKET REPORT 2015
ACKNOWLEDGEMENTS
Development, European Investment Bank, European Wind Energy Association (EWEA), Estonia (Ministry of Economic Affairs and Communications), First Solar, France (Ministry of Ecology, Sustainable Development and Energy), General Electric, Geothermal Energy Association, Germany (Federal Ministry for Economic Affairs), Global Renewable Fuels Association, Global Wind Energy Council, GSE, IEA Bioenergy Implementing Agreement, IEA Geothermal Implementing Agreement, IEA Hydrogen Implementing Agreement, IEA Hydropower Implementing Agreement, IEA Ocean Energy Systems (OES), IEA Photovoltaic Power System Programme (IEA PVPS), IEA Renewable Energy Technology Deployment (RETD), IEA Solar Heating and Cooling Programme (IEA SHC), IEA Solar Power and Chemicals Energy Systems Implementing Agreement (SolarPACES), India (Ministry of New and Renewable Energy), Indonesia (DG New and Renewable Energy and Energy Conservation), International Renewable Energy Agency (IRENA), Italy (Gestore dei Servizi Energetici), Japan (Ministry of Economy, Trade and Industry, New Energy and Industrial Technology Development Organization, and The Institute of Energy Economics, Japan), J-Power, Korea (Korean Energy Agency), Mexico (SENER), Meyer Burger, Morocco (Ministry of Energy), New Zealand (Ministry of Business, Innovation and Employment), Norway (The Norwegian Ministry of Petroleum and Energy), Observatoire Méditerranéen de l’Energie, OCI, OECD Trade & Agriculture Directorate, Poland (Ministry of Economy and Department of Energy) PWC Advisors, Portugal (The National Laboratory for Energy and Geology and DGEG), REN 21 (Renewable Energy Policy Network for the 21st Century), RWE Innogy, Sharp, Siemens Wind Power, Slovak Republic (Slovak Innovation and Energy Agency), Solairedirect, South Africa (Department of Energy), SPV Market Research, State Grid Corporation China, Switzerland (Swiss Federal Office of Energy), The Netherlands (Ministry of Economic Affairs), University of British Columbia, University of Missouri, the United States (Bureau of Energy Resources, Department of Energy, Department of State, Lawrence Berkeley National Laboratory, National Renewable Energy Laboratory), Tecnalia, Total, Turkey, (Ministry of Energy and Natural resources), Vattenfall, Verbund, Vestas Wind Systems.
The authors would also like to thank Erin Crum for skilfully editing the manuscript and the IEA Communication and Information Office, in particular, Muriel Custodio, Astrid Dumond, Greg Frost, Rebecca Gaghen, Kevin Nellies, Katie Russell, Bertrand Sadin, Magdalena Sanocka, Kathleen Sullivan and Therese Walsh for their assistance.
Questions and comments?
Please write us at [email protected].
MEDIUM-TERM RENEWABLE ENERGY MARKET REPORT 2015 5
TABLE OF CONTENTS
6 MEDIUM-TERM RENEWABLE ENERGY MARKET REPORT 2015
TABLE OF CONTENTS
Executive summary .................................................................................................................... 14 Shifting technology and geographical drivers of renewable power deployment ................................. 14 Cost effectiveness of renewable power to further improve, but policies remain key ......................... 16 Renewables increase in other sectors, though growth lags that for electricity ................................... 17 With enhanced policy and market frameworks, renewable growth could accelerate ......................... 18
Analytical framework ................................................................................................................. 20 Renewable energy data present unique challenges ............................................................................. 20 Country-level approach underpins the renewable electricity analysis ................................................. 20 Outlooks for technology and investment guide the global picture ...................................................... 22 Biofuels for transport and renewable heat round out the analysis ...................................................... 23 References ............................................................................................................................................. 25
Renewable electricity: OECD ....................................................................................................... 26 Summary ............................................................................................................................................... 26 OECD Americas ...................................................................................................................................... 29 United States dashboard ....................................................................................................................... 38 OECD Asia Oceania ................................................................................................................................ 42 Japan dashboard ................................................................................................................................... 48 OECD Europe ......................................................................................................................................... 53 Turkey dashboard .................................................................................................................................. 60 United Kingdom dashboard .................................................................................................................. 62 References ............................................................................................................................................. 64
Renewable electricity: Non-OECD ............................................................................................... 66 Summary ............................................................................................................................................... 66 Africa ..................................................................................................................................................... 69 South Africa dashboard ......................................................................................................................... 78 Other SSA dashboard ............................................................................................................................ 82 Asia ........................................................................................................................................................ 90 India dashboard ..................................................................................................................................... 96 China .................................................................................................................................................... 100 Europe and Eurasia .............................................................................................................................. 105 Middle East .......................................................................................................................................... 110 Non-OECD Americas ............................................................................................................................ 115 Brazil dashboard .................................................................................................................................. 120 References ........................................................................................................................................... 122
TABLE OF CONTENTS
MEDIUM-TERM RENEWABLE ENERGY MARKET REPORT 2015 7
Renewable electricity: Global technologies ................................................................................ 125 Summary ............................................................................................................................................. 125 Global trends in renewable power: Geographic diffusion .................................................................. 128 Global trends in renewable power: Economic attractiveness ............................................................ 130 Bioenergy for power ............................................................................................................................ 135 Geothermal power .............................................................................................................................. 149 Hydropower......................................................................................................................................... 151 Ocean power ....................................................................................................................................... 157 Offshore wind ...................................................................................................................................... 159 Onshore wind ...................................................................................................................................... 166 Solar PV ............................................................................................................................................... 173 STE ....................................................................................................................................................... 192 References ........................................................................................................................................... 197
Investment in renewable power ................................................................................................ 203 Summary ............................................................................................................................................. 203 Trends in renewable capacity investment .......................................................................................... 204 Trends in renewable financing ............................................................................................................ 207 Medium-term outlook for investment in new renewable power capacity......................................... 212 References ........................................................................................................................................... 214
Renewable transport ................................................................................................................. 215 Summary ............................................................................................................................................. 215 Global overview ................................................................................................................................... 216 Regional forecasts ............................................................................................................................... 218 Advanced biofuels industry ................................................................................................................. 227 References ........................................................................................................................................... 238
Renewable heat ........................................................................................................................ 242 Summary ............................................................................................................................................. 242 Renewable energy use for heat: Market trends and forecast ............................................................ 243 Policy environment for renewable heat.............................................................................................. 246 Renewable heating technologies ........................................................................................................ 252 References ........................................................................................................................................... 257
Tables ....................................................................................................................................... 260
Glossary of definitions, terms and abbreviations ........................................................................ 264 Regional definitions ............................................................................................................................. 264 Abbreviations and acronyms ............................................................................................................... 265 Currency codes .................................................................................................................................... 266 Units of measure ................................................................................................................................. 266

TABLE OF CONTENTS
8 MEDIUM-TERM RENEWABLE ENERGY MARKET REPORT 2015
LIST OF FIGURES
Figure 1 Renewable power net additions to capacity under main and accelerated cases ............... 18 Figure 2 The renewable policy journey and changing policy priorities ............................................. 22 Figure 3 OECD renewable electricity net capacity additions and projection (GW) .......................... 26 Figure 4 OECD renewable electricity generation and projection (TWh) ........................................... 27 Figure 5 OECD incremental renewable capacity additions, main versus accelerated case .............. 29 Figure 6 OECD Americas historical and forecasted net additions to renewable capacity, generation
and investment .................................................................................................................... 31 Figure 7 OECD Americas power demand versus GDP growth .......................................................... 32 Figure 8 OECD Americas incremental renewable capacity additions, main versus
accelerated case .................................................................................................................. 37 Figure 9 OECD Asia Oceania historical and forecasted capacity additions, generation
and investment .................................................................................................................... 43 Figure 10 OECD Asia Oceania countries power demand versus GDP growth ..................................... 44 Figure 11 OECD Asia Oceania renewable capacity additions, main versus accelerated case ............. 46 Figure 12 OECD Europe historical and forecasted capacity additions, generation and investment .. 55 Figure 13 OECD Europe countries power demand versus GDP growth .............................................. 55 Figure 14 OECD Europe incremental renewable capacity additions, main versus accelerated case . 59 Figure 15 Non-OECD renewable net electricity capacity additions and projection (GW) .................. 66 Figure 16 Non-OECD renewable electricity generation and projection (TWh) ................................... 67 Figure 17 Non-OECD incremental renewable capacity additions, main versus accelerated case ...... 68 Figure 18 Africa power demand versus GDP growth .......................................................................... 70 Figure 19 Africa historical and forecasted net additions to renewable capacity, generation
and investment .................................................................................................................... 71 Figure 20 SSA (including South Africa) new renewable generation versus power demand growth .. 75 Figure 21 Africa incremental renewable capacity additions, main versus accelerated case ............. 76 Figure 22 Non-OECD Asia countries power demand versus GDP growth ........................................... 91 Figure 23 Non-OECD Asia historical and forecasted capacity additions, generation and investment 92 Figure 24 Non-OECD Asia incremental renewable capacity additions, main versus
accelerated case .................................................................................................................. 95 Figure 25 Non-OECD Europe and Eurasia power demand versus GDP growth ................................ 105 Figure 26 Non-OECD Europe and Eurasia historical and forecasted capacity additions, generation
and investment .................................................................................................................. 108 Figure 27 Non-OECD Europe and Eurasia incremental renewable capacity additions, main
versus accelerated case ..................................................................................................... 110 Figure 28 Middle East historical and forecasted capacity additions, generation and investment ... 112 Figure 29 Middle East countries power demand versus GDP growth .............................................. 112 Figure 30 Middle East incremental renewable capacity additions, main versus accelerated case .. 114 Figure 31 Non-OECD Americas power demand versus GDP growth................................................. 115 Figure 32 Non-OECD Americas historical and forecasted capacity additions, generation and
investment ......................................................................................................................... 116 Figure 33 Non-OECD Americas incremental renewable capacity additions, main versus
accelerated case ................................................................................................................ 119 Figure 34 World net additions to renewable power capacity, historical and forecast (GW) ........... 125 Figure 35 World renewable generation and forecast (TWh) ............................................................ 126

TABLE OF CONTENTS
MEDIUM-TERM RENEWABLE ENERGY MARKET REPORT 2015 9
Figure 36 World net additions to power capacity by region, 2014-20 ............................................. 126 Figure 37 World net additions to renewable capacity, absolute and percentage growth, 2014-20 127 Figure 38 OECD and non-OECD incremental renewable capacity additions, accelerated versus
main case ........................................................................................................................... 127 Figure 39 Net additions to non-hydro renewable capacity, share from top markets ...................... 129 Figure 40 Number of countries with non-hydro renewable capacity above 100 MW ..................... 129 Figure 41 Historical and forecast global weighted average LCOEs for new projects,
beginning year ................................................................................................................... 131 Figure 42 LCOE of gas-fired generation at March 2015 gas prices versus onshore wind
benchmark costs ............................................................................................................... 133 Figure 43 Historical gas prices by region versus price range for LCOE of new CCGT at
USD 60-80/MWh ............................................................................................................... 134 Figure 44 Recent announced PPAs (Brazil) and CFDs (the United Kingdom) by project
delivery year ...................................................................................................................... 139 Figure 45 Bioenergy power generation forecast by region .............................................................. 140 Figure 46 Wood pellet imports to Korea from Canada and selected Asian countries 2014-15........ 145 Figure 47 Geothermal power generation by region (TWh)............................................................... 150 Figure 48 Hydropower annual additions and potential by region .................................................... 156 Figure 49 Hydropower generation and forecast by region ............................................................... 157 Figure 50 Ocean power capacity and forecast by region (GW) ........................................................ 158 Figure 51 Ocean generation by region (TWh) ................................................................................... 159 Figure 52 CAPEX for a typical offshore wind project in Europe (2015 and 2020) ............................. 161 Figure 53 UK offshore transmission asset transfer value (GBP) for 15 projects, project
distance to shore (bubble size) and total cabling (km) ..................................................... 162 Figure 54 Historical electricity price for DK1 pricing point and modelled LCOE for Horns
Rev 3 offshore project ....................................................................................................... 163 Figure 55 Offshore wind generation forecast by region (TWh) ........................................................ 166 Figure 56 Equity market performance of selected wind turbine manufacturers ............................. 168 Figure 57 Typical onshore wind total investment costs per kW in selected countries (2010-20) .... 170 Figure 58 Historical and forecasted LCOEs for typical onshore systems, beginning year................. 170 Figure 59 Onshore wind generation forecast by region (TWh) ........................................................ 172 Figure 60 Onshore wind annual additions by region (main case) versus accelerated case
annual additions ................................................................................................................ 173 Figure 61 Solar PV manufacturing capacity by region (2015) versus global module
shipments (2014) ............................................................................................................... 174 Figure 62 Typical solar PV system prices, by segment, beginning year ............................................ 174 Figure 63 c-Si PV learning curve based on 1976-2014 average selling prices ................................... 176 Figure 6 c-Si PV learning curve based on 1976-2003 average selling prices .................................. 177 Figure 65 Historical and forecasted typical solar PV investment costs, beginning year ................... 178 Figure 66 Historical and forecasted LCOE range for typical utility-scale solar PV plants,
beginning year ................................................................................................................... 179 Figure 67 Historical and forecasted LCOEs for typical commercial- and residential-scale
solar PV plants, beginning year ......................................................................................... 180 Figure 68 Solar PV annual capacity additions, historical and forecasted by region (GW) ................ 183 Figure 69 Solar PV electricity generation and forecast by region ..................................................... 186 Figure 70 Solar PV capacity and deployment by market segment ................................................... 186
TABLE OF CONTENTS
10 MEDIUM-TERM RENEWABLE ENERGY MARKET REPORT 2015
Figure 71 Solar PV annual additions by region (main case) versus accelerated case annual additions ............................................................................................................................ 188
Figure 72 Cost, remuneration and cumulative capacity for residential and commercial solar PV in Germany and Italy, 2005-14 ............................................................................ 189
Figure 73 Historical and forecasted LCOEs for STE, beginning year.................................................. 192 Figure 74 STE generation and forecast by region ............................................................................. 196 Figure 75 Investment in new renewable power capacity, historical and forecasts, by technology . 204 Figure 76 World investment in new renewable power capacity, historical and forecasted ............ 205 Figure 77 Weighted average annual renewable investment costs, historical and forecasted ......... 207 Figure 78 Indexed annual renewable investment costs, historical and forecasted .......................... 207 Figure 79 Ten-year government bond average yield and indexed utility share prices by region ..... 208 Figure 80 Selected yieldco equity performances and market value ................................................. 210 Figure 81 World new investment in renewable power capacity, historical and forecasts ............... 212 Figure 82 World biofuels production 2008-20 .................................................................................. 216 Figure 83 Comparison of global biofuels production and oil prices 2007-20 (indexed) ................... 218 Figure 84 United States biodiesel production and imports (2013-15) .............................................. 219 Figure 85 Wholesale ethanol compared with wholesale gasoline, corn costs of ethanol
production and RFS2 RIN value in the United States (2013-15) ....................................... 220 Figure 86 US EPA RFS2 proposals 2014-16 compared with original statutory volumes for
total renewable fuels and advanced biofuels ................................................................... 221 Figure 87 Non-OECD Americas biofuels production 2008-20 (left) and a comparison of retail
ethanol, retail gasoline and traded sugar prices in Brazil 2013-15 (right) ........................ 223 Figure 8 OECD Europe biofuels production, 2008-20 .................................................................... 224 Figure 89 Non-OECD Asia, Africa, China and Middle East biofuel production 2008-20.................... 226 Figure 90 Comparison between proposed RFS2 cellulosic ethanol target volumes and
rated production capacity of commercial-scale plants ..................................................... 231 Figure 91 Advanced biofuels production forecast 2014-20 .............................................................. 233 Figure 92 EV share of passenger vehicle sales by country 2014 ....................................................... 235 Figure 93 Global EV sales and PHEV battery progress ...................................................................... 237 Figure 94 World final renewable energy use for heat (including commercial heat) 2008-20 .......... 242 Figure 95 Share of renewable energy in total FEH in different world regions, 2013 ........................ 245 Figure 96 Reductions in wholesale heating oil costs compared with Brent crude oil prices in
Europe ............................................................................................................................... 255 Figure 97 Delivered domestic fuel cost comparison 2012-15 (left) and medium-term
forecasted growth in wood pellet system installation (right) in Austria .......................... 255 Figure 98 United Kingdom conventional domestic heating fuel costs compared with an
indicative domestic wood pellet price band 2011-15 ....................................................... 256 LIST OF DASHBOARD FIGURES Figure D.1 Annual renewable capacity additions by technology (2013-20) ...................................... 38 Figure D.2 EPA’s CPP summary for selected states ............................................................................ 38 Figure D.3 US wind versus gas, estimated LCOEs .............................................................................. 38 Figure D.4 PJM coal plant retirements ............................................................................................... 38 Figure D.5 US New solar PV additions by segment ............................................................................ 40 Figure D.6 US utility-scale solar PV estimated. LCOEs ....................................................................... 40
TABLE OF CONTENTS
MEDIUM-TERM RENEWABLE ENERGY MARKET REPORT 2015 11
Figure D.7 Japan annual net additions to renewable capacity and new investment ........................ 48 Figure D.8 Japan electricity transmission system .............................................................................. 48 Figure D.9 Japan estimated solar PV LCOE ranges versus FiT and end-user price levels ................... 50 Figure D.10 Turkey renewable power capacity additions 2014-20 ..................................................... 60 Figure D.11 Turkey wind projectsremuneration choice ....................................................................... 60 Figure D.12 Turkey utility solar PV LCOEversus FiT .............................................................................. 60 Figure D.13 UK annual net additions to renewable capacity and new investment ............................. 62 Figure D.14 UK renewable power awarded under first CFD auction, February 2015.......................... 62 Figure D.15 South Africa’s historical and forecasted net additions to renewable capacity 2014-20 ...... 78 Figure D.16 Preferred bid prices from REIPPPPBid Windows (BWs) 1-4 ............................................. 78 Figure D.17 South Africa’s new renewable generation versus power demand growth ...................... 78 Figure D.18 South Africa’s transmission network ................................................................................ 80 Figure D.19 New solar PV net additions to capacity by segment ........................................................ 80 Figure D.20 SSA’s historical and forecasted net additions to renewable capacity 2014-20 ................ 82 Figure D.21 Hydropower capacity by region (2014-20) ....................................................................... 82 Figure D.23 Non-hydropower capacity additions by technology (2014-20) ........................................ 82 Figure D.24 Africa electrification per country ...................................................................................... 84 Figure D.25 Demand, electrification rate, and population (bubble size) ............................................. 84 Figure D.26 Electricity generation by source in SSA over 2000-13 (left) and in 2013 (right) .............. 86 Figure D.27 FiTs in select SSA markets ................................................................................................. 86 Figure D.28 Electrification rates versus targets ................................................................................... 86 Figure D.29 Sub-Saharan incremental renewable capacity additions, main versus
accelerated case ............................................................................................................... 88 Figure D.30 Renewable generation SSA (TWh) .................................................................................... 88 Figure D.31 Total RES-E versus demand in2013 and 2020 ................................................................... 88 Figure D.32 India annual net additions to renewable capacity and new investment ......................... 96 Figure D.33 Ten-year govt. bond interest rates ................................................................................... 96 Figure D.34 India LCOE of wind and PV vs power market price, new imported coal LCOE and RECs ........ 96 Figure D.35 Weighted average PPA bid prices in solar PV auctions, state and JNNSM, 2010-15........ 98 Figure D.36 Commercial power tariffs versus PV LCOEs and FiTs, selected states, 2014 .................... 98 Figure D.37 China annual net additions to renewable capacity and new investment ...................... 101 Figure D.38 China solar PV forecast capacity and deployment by market segment ......................... 103 Figure D.39 China incremental renewable capacity additions, main versus accelerated case ......... 103 Figure D.40 Brazil renewable power capacity additions 2014-20 ...................................................... 120 Figure D.41 Brazil power capacity auction results and prices ............................................................ 120
LIST OF TABLES
Table 1 Economic and technical lifetime assumptions in MTRMR 2015 (years) ................................ 23 Table 2 Central assumptions for global LCOE ranges by technology (beginning of 2015) ................. 24 Table 3 OECD Americas countries main targets and support policies for renewable electricity ....... 33 Table 4 OECD Americas main drivers and challenges to renewable energy deployment ................. 34 Table 5 OECD Americas cumulative renewable energy capacity in 2014 and 2020 .......................... 35 Table 6 Asia Oceania countries main targets and support policies for renewable electricity ........... 44 Table 7 OECD Asia Oceania, selected countries renewable energy capacity in 2014 and 2020 ........ 45 Table 8 OECD Asia Oceania main drivers and challenges to renewable energy deployment ............ 46

TABLE OF CONTENTS
12 MEDIUM-TERM RENEWABLE ENERGY MARKET REPORT 2015
Table 9 OECD Europe main drivers and challenges to renewable energy deployment ..................... 56 Table 10 OECD Europe countries main targets and support policies for renewable electricity .......... 57 Table 11 OECD Europe, selected countries renewable energy capacity in 2014 and 2020 ................. 58 Table 12 Africa countries main targets and support policies for renewable electricity ...................... 72 Table 13 Africa main drivers and challenges to renewable energy deployment ................................. 73 Table 14 Africa, selected countries renewable energy capacity in 2014 and 2020 ............................. 74 Table 15 Non-OECD Asia countries main targets and support policies for renewable electricity ....... 93 Table 16 Non-OECD Asia, selected countries renewable energy capacity in 2014 and 2020 .............. 94 Table 17 Non-OECD Asia main drivers and challenges to renewable energy deployment .................. 94 Table 18 Non-OECD Europe and Eurasia countries main targets and support policies
for renewable electricity ...................................................................................................... 107 Table 19 Non-OECD Europe and Eurasia main drivers and challenges to renewable
energy deployment .............................................................................................................. 108 Table 20 Non-OECD Europe and Eurasia, selected countries renewable capacity in 2014 and 2020....... 109 Table 21 Middle East countries main targets and support policies for renewable electricity ........... 113 Table 22 Middle East main drivers and challenges to renewable energy deployment ..................... 113 Table 23 Middle East, selected countries renewable energy capacity in 2014 and 2020 .................. 114 Table 24 Non-OECD Americas countries main targets and support policies for renewable electricity .... 117 Table 25 Non-OECD Americas main drivers and challenges to renewable energy deployment ........ 118 Table 26 Non-OECD Americas, selected countries renewable energy capacity in 2014 and 2020 .... 119 Table 25 World renewable electricity capacity and forecast (main case) (GW) ................................ 128 Table 26 Top five countries, forecasted increase in generation (TWh) over 2014-20 by technology ....... 129 Table 27 Top five countries, forecasted increase in generation (% change) over 2014-20
by technology ....................................................................................................................... 130 Table 28 Historical and forecast global LCOE range assumptions (USD 2014/MWh), beginning year ..... 135 Table 29 Reference LCOE value for bioenergy technologies .............................................................. 138 Table 30 Bioenergy capacity forecast by region (GW) ....................................................................... 143 Table 31 Geothermal power capacity and forecast by region (GW) .................................................. 151 Table 32 Hydropower capacity and forecast by region (GW) ............................................................ 155 Table 33 Offshore transmission asset cost allocation, ownership and connection risks ................... 164 Table 34 Offshore wind power capacity and forecast by region (GW) .............................................. 165 Table 35 Onshore wind capacity and forecast by region (GW) .......................................................... 171 Table 36 Solar PV capacity and forecast by region (GW) ................................................................... 181 Table 37 Solar PV deployment category assumptions in MTRMR 2014 ............................................ 187 Table 38 STE capacity and forecast by region (GW) ........................................................................... 194 Table 39 World biofuels production forecast 2014-20 ...................................................................... 216 Table 40 Global main targets and support policies for liquid biofuels ............................................... 217 Table 41 OECD country main targets and support policies for renewable heating and cooling ....... 250 Table 42 Non-OECD select country targets and support policies for renewable heating and cooling ..... 251 Table 43 Solar thermal heating installed capacity (GWth) .................................................................. 253 Table 44 United Kingdom domestic pellet boiler and heating oil investment comparison ............... 256 Table 45 Ethanol production (billion litres) ........................................................................................ 260 Table 46 Biodiesel production (billion litres) ...................................................................................... 261 Table 47 Total renewable electricity capacity (GW) ........................................................................... 262 Table 48 Total renewable electricity generation (TWh) ..................................................................... 263

TABLE OF CONTENTS
MEDIUM-TERM RENEWABLE ENERGY MARKET REPORT 2015 13
LIST OF DASHBOARDS TABLES Table D.1 Recent developments in solar PV policy design in selected US states ............................. 40 Table D.2 US renewable energy capacity(2014-20) .......................................................................... 40 Table D.3 Solar PV capacity vs assessed integration capacity and demand, by EPCO, Jan 2015 ..... 50 Table D.4 Japan renewable power capacity ..................................................................................... 50 Table D.5 Turkey renewable power capacity .................................................................................... 60 Table D.6 UK renewable power capacity (GW) ................................................................................. 62 Table D.7 South Africa renewable energy capacity (2014-20) ......................................................... 78 Table D.8 Municipality schemes for small-scale embedded generation .......................................... 80 Table D.9 Sub Saharan Africa renewable energy capacity (2014-20) ............................................... 82 Table D.10 National targets for renewable electricity ........................................................................ 86 Table D.11 Sub-Saharan selected countries renewable energy capacity 2014-20 ............................. 88 Table D.12 India national renewable targets ...................................................................................... 96 Table D.13 India renewable power forecast ....................................................................................... 98 Table D.14 China main targets and support policies for renewable electricity ................................ 101 Table D.15 China renewable power capacity forecast ..................................................................... 103 Table D.16 Brazil renewable power capacity forecast (2014-20) ..................................................... 120 LIST OF BOXES Box 1 Advances in Japan’s power sector reforms to guide longer-term renewable scale-up ........... 47 Box 2 Asia Oceania offshore renewables: Long-term ambitions but challenges
to near-term scale-up ............................................................................................................... 52 Box 3 Key recent developments and future prospects for coal-to-biomass conversions ............... 147 Box 4 Offshore wind transmission cost drivers: An example from the United Kingdom ................. 161 Box 5 Drivers of balance-of-system costs for onshore wind projects .............................................. 169 Box 6 What is the actual learning rate of solar PV? ......................................................................... 175 Box 7 Solar PV deployment segments vary by market ..................................................................... 186 Box 8 The challenging forecast of distributed PV ............................................................................ 188 Box 9 Guide to the renewable investment outlook ......................................................................... 205 Box 10 The role of G20 countries in renewable power capacity investment over the medium term ...... 213 Box 11 Changing utility business models: Opportunities and challenges for renewable investment ...... 213 Box 12 RFS2 biofuel volume targets for 2014-16 proposed by the US EPA ....................................... 220 Box 13 Prospects for biofuels in the European Union clarified by updated legislation ..................... 224 Box 14 An update on market, technology and policy developments for electric vehicles ................ 234 Box 15 Heat pumps overview ............................................................................................................. 256

EXECUTIVE SUMMARY
14 MEDIUM-TERM RENEWABLE ENERGY MARKET REPORT 2015
EXECUTIVE SUMMARY Supported by policies aimed at enhancing energy security and sustainability, renewable electricity expanded at its fastest rate to date (130 GW [gigawatts]) in 2014 and accounted for more than 45% of net additions to world capacity in the power sector. Renewable generation costs continued to decline in many parts of the world and the announcement of some very low contract prices over the past year should support further development with reduced remuneration levels in areas as diverse as Brazil, India, the Middle East, South Africa and the United States. Even in a lower fossil fuel price environment, the policy drivers for renewable electricity – energy diversification, local pollution and decarbonisation aims – remain robust. And some key countries, such as the People’s Republic of China (hereafter, “China”) and India, have bolstered their deployment ambitions going forward. As a result, renewables are expected to be the largest source of net additions to power capacity over the medium term. They account for almost two thirds of the expansion by 2020, with non-hydro sources nearly half of the total.1 The renewable share of generation rises from 22% in 2013 to over 26% in 2020 and renewable generation reaches a level more than today’s total combined demand of China, India and Brazil. But the annual deployment trend is expected to slow due to persistent policy and market integration uncertainties in some areas, notably Europe and Japan, as well as financing, access and integration challenges in developing countries. Consequently, global growth under the Medium-Term Renewable Energy Market Report (MTRMR) main case forecast is not as fast as it could be and falls short of what’s needed to put renewables on track to meet longer-term climate change objectives. However, enhanced policies driven by the energy security, local pollution and climate benefits of renewables can trigger a virtuous cycle, putting development on a more firm path to meet long-term climate change goals. This report’s accelerated case projection assesses the impacts of possible policy changes in key countries, which could accelerate cumulative renewable power growth by 25% with rising annual deployment. Shifting technology and geographical drivers of renewable power deployment Onshore wind leads the global renewable growth, accounting for over one-third of the renewable capacity and generation increase. Solar PV is the second-largest source of new capacity, another third of deployment. Hydropower accounts for one-fifth of new renewable additions, and over a quarter of generation growth. Meanwhile, other renewable technologies grow slower on an absolute basis, but still scale up significantly. For example, bioenergy is supported by coal-to-biomass conversions in Europe and a significant scale-up in non-OECD Asia using domestic resources. Offshore wind should more than triple by 2020, with expected decreases in generation costs and additions from a large project pipeline in Europe. In the countries of the Organisation for Economic Co-operation and Development (OECD), renewables account for virtually all net additions to power capacity, when accounting for fossil fuel and nuclear retirements, mostly from non-hydro sources. But the OECD comprises only one-third of renewable growth as annual deployment stabilises at lower levels. Amid generally sluggish demand growth, OECD power systems face challenges to maintain long-term policy frameworks while shifting 1 Analysis from the IEA Medium-Term Renewable Energy Market Report 2015 and the forthcoming IEA World Energy Outlook 2015.

EXECUTIVE SUMMARY
MEDIUM-TERM RENEWABLE ENERGY MARKET REPORT 2015 15
away from high incentive levels and integrating higher variable renewable penetrations. The European Union-28 (EU-28) is the second largest market in absolute terms (after China), but annual deployment declines. Even with persistently low gas prices, the United States, the third largest market, remains dynamic, but uncertainty over federal incentives creates a volatile deployment pattern. In Japan, a tight power supply situation and a generous support scheme spur strong solar PV growth, though grid integration challenges cause a declining annual trend. Still, some newer markets with robust demand are emerging (e.g. Mexico). With fast-growing power demand, diversification needs and local pollution concerns, China, India and Brazil and other developing countries account for two-thirds of the renewable expansion over the medium term. In the non-OECD, renewables account for almost half of net additions to power capacity, but the role of fossil fuels remains large, pointing to significant upside potential for renewables to meet fast-growing demand needs. China alone accounts for 40% of global renewable capacity growth, an amount triple the current total power capacity of the United Kingdom. China requires almost one-third of cumulative new investment to 2020. China’s generation needs, pollution concerns and a favourable policy environment with ambitious targets drive the forecast. Announced power sector reforms to support the integration of higher levels of variable renewables should help reinforce their role. Robust expansion is expected in onshore wind, whose cumulative capacity more than doubles, and solar PV, whose cumulative capacity almost quadruples. The annual growth of hydropower slows, but cumulative hydropower capacity growth is as large as the current total power capacity of Australia. The renewables market is also expanding strongly in other non-OECD countries. India’s renewable growth is poised to accelerate, with ambitious new government targets for solar PV and wind. In Brazil, non-hydro renewables are playing an important diversification role amid regional drought conditions. Hydropower expands most strongly in Asia, and non-hydro sources begin to take off in Egypt, Thailand and emerging areas, such as the Middle East. Still, many non-OECD markets remain at the initiation phase of development and face challenges related to market access barriers, grid constraints, policy and market design, or the cost and availability of financing. Current trends suggest some markets in Sub-Saharan Africa (SSA) are poised to leapfrog to an economic development paradigm based on affordable renewables. With huge resources, improving economics and policy momentum, renewables should meet almost two-thirds of power demand growth in SSA through 2020. Given its large remaining potential, hydropower continues to play an important role in meeting new demand needs across the region. In South Africa, price competition through transparent and well-designed auctions has spurred rapid cost reductions in onshore wind and solar PV. Elsewhere, rising demand and strong diversification needs drive a portfolio of renewable growth in markets such as Ethiopia and Kenya though policy and market access challenges may limit the pace in a number of other markets. Moreover, affordable small-scale solar PV can help energy access in rural areas and improve electricity provision in urban zones, where grid-connected power is not always reliable. Overall, however, realising higher levels of renewable penetration in the entire region would require addressing persistent barriers, improving financing conditions, adopting new business models and good policies and governance.

EXECUTIVE SUMMARY
16 MEDIUM-TERM RENEWABLE ENERGY MARKET REPORT 2015
Cost effectiveness of renewable power to further improve, but policies remain key The effect of the lower oil price environment on global renewable power deployment is more perception than reality. While oil may compete more directly with biofuels for transport and renewable heat, its impact in the power sector is limited only to oil-fired peaking plants and gas generation in areas with oil indexation, such as in Europe and in Asian liquefied natural gas markets. Renewable attractiveness depends more on government willingness to maintain policy support and appropriate market design. Persistent uncertainties in these areas pose a far larger forecast risk. The MTRMR main case forecast sees annual investment in new renewable capacity to 2020 averaging around USD 230 billion annually, lower than the near USD 270 billion in 2014. This trend is driven mainly by slowing capacity growth, but also by decreasing investment costs for the most dynamic technologies. Onshore wind and solar PV comprise nearly two-thirds of new investment. Renewable generation costs are forecast to continue decreasing. From 2010-15, indicative global average onshore wind generation costs for new plants fell by an estimated 30% on average while that for new utility-scale solar PV declined by two-thirds. Over 2015-20, the MTRMR forecasts new onshore wind costs to decline by a further 10% while new utility-scale solar PV declines by an additional quarter. High levels of incentives are no longer necessary for solar PV and onshore wind, but their economic attractiveness still strongly depends on the regulatory framework and market design. Meanwhile, some technologies (offshore wind, solar thermal electricity and some bioenergy) require continued policy support to bring them down the learning curve.
Map 1 Recent announced long-term remuneration contract prices for renewable power (e.g. preferred bidders, PPAs or FiTs) to be commissioned over 2015-19
Note: Values reported in nominal USD; PPAs = power purchase agreements. US values are calculated excluding tax credits; US wind value corresponds to Interior Region for commissioned projects in 2014. Other values reported correspond to projects that are expected to be commissioned over 2015-2019. Delivered project costs may ultimately be different than those reported at the time of the auction or the signature of the PPA. For full sourcing explanation, see “Renewable Technologies: Global Technologies” chapter.

EXECUTIVE SUMMARY
MEDIUM-TERM RENEWABLE ENERGY MARKET REPORT 2015 17
Recent announced long-term remuneration contract prices offer evidence of such indicative forecasted costs and suggest even lower generation costs are possible in the next few years with technology progress, better financing and expansion into newer markets with better resources. New onshore wind can be contracted today in a number of countries at USD 60-80/MWh, with the best cases around USD 50/MWh (e.g. Brazil, Egypt, South Africa, some US states). Meanwhile, new utility-scale solar PV projects can be contracted at USD 80-100/MWh with the best cases at USD 60/MWh (e.g. United Arab Emirates, Jordan, South Africa, some US states). As technology costs have declined, financing conditions, which vary across countries and over time, play a more important role. And the lowest prices have emerged in countries with a combination of price competition for long-term contracts, good resources and financial de-risking measures and/or concessional financing. These conditions are not present in all markets, but they do indicate potential ahead for some countries to leapfrog to development based on more affordable clean power. While onshore wind and solar PV have not yet achieved widespread competitiveness versus fossil fuels, benchmark cost ranges are increasingly comparable with generation costs from gas, even in the current fuel price regime. In countries such as Brazil and South Africa, onshore wind can represent a more cost-effective source of new generation than fossil fuels. But comparability in low-price gas markets, such as the United States, would require further cost reductions. These ranges remain generally higher than that for new coal-fired generation, except in higher-priced coal markets or in the presence of robust carbon pricing. Meanwhile, hydropower, geothermal and bioenergy are largely competitive versus fossil fuels, but face risks related to financing, project development and social acceptance. This improving cost trend does not automatically imply that solar PV and onshore wind are competitive or cost-effective versus alternatives. Competitiveness also depends on the value of the generation and the system costs associated with integrating higher shares of variable renewables. The potential hedge value of renewables against fuel price volatility and the environmental externalities associated with fossil fuels would also need to be accounted for. In any case, their improving economics suggest that renewables are an increasingly valuable option in a well-diversified portfolio of energy investments from both the investor and system perspective. Renewables increase in other sectors, though growth lags that for electricity To date, the progress of renewables in the heating sector, which comprises almost half of total final energy consumption, and transport, accounting for a quarter of consumption, has been slower than in electricity. Renewables are crucial to the diversification and decarbonisation of these sectors as well, but development is falling well short of what is needed to meet climate change objectives. Global renewable energy use for heat, excluding traditional biomass, grows only moderately over the medium term. Renewable heat support schemes, particularly in OECD Europe, remain important growth drivers and a number of non-OECD countries have policies to support small-scale solar thermal systems. Initiatives that encourage district heating networks are also expected to help facilitate the integration of renewable heat. While renewable heat technologies can be cost-effective options, an extended period of lower oil prices could undermine growth, particularly in bioenergy markets. The use of renewables for heat in industry has large potential, particularly in non-OECD countries, though the market is growing slowly. Encouraging applications for the provision of process heat in industry are coming about. Yet, stronger uptake of renewable heat overall requires deeper and more widespread policy frameworks.

EXECUTIVE SUMMARY
18 MEDIUM-TERM RENEWABLE ENERGY MARKET REPORT 2015
Blending mandates are expected to support biofuels for transport demand and production, even with the lower oil price environment. Overall, biofuels growth is forecast to stabilise, reaching over 4% of road transport demand in 2020. In the past year, mandates and supportive policies have been strengthened in key markets such as Brazil, India, Indonesia and Malaysia. Lower oil prices have actually facilitated the removal of fossil fuel subsidies in several countries, which should improve the attractiveness of biofuels. But a number of risks limit growth. The United States continues to face structural challenges in scaling up ethanol to more than 10% of gasoline demand while the EU-28 has introduced a 7 percentage point (pp) cap on the contribution of conventional biofuels towards the 10% renewable transport target for 2020. Moreover, a continued low oil price environment may lead to increased scrutiny of support policies for biofuels going forward and the decline in gasoline and diesel prices has already affected discretionary blending economics in certain markets. Significant development of advanced biofuels is necessary for diversification and decarbonisation of transport in the longer term, particularly in challenging sectors such as aviation, but the sector requires further policy support. Since 2013 advanced biofuels have made good progress, with nine commercial-scale plants commissioned, seven of these in 2014-15. Policies that mandate blending levels and provide capital incentives, along with the development of secure local feedstock supply chains, have been fundamental. New projects may require oil prices around USD 100/bbl or above to be attractive. There is significant potential to reduce the costs. But a sustained long-term policy commitment would be needed, which may face risks from the lower oil price environment. With enhanced policy and market frameworks, renewable growth could accelerate Driven by a stronger embrace of the energy security, local pollution and climate benefits, cumulative renewable power growth over 2014-20 could be 25% higher than in the main case forecast, with a rising annual market. Under this accelerated case projection, annual investment could reach over USD 315 billion by 2020. Achieving the accelerated case would require policy makers to send clearer signals to phase out the oldest and most polluting power plants while developing countries, in particular, would need to address market access and investment risks that keep financing costs elevated.
Figure 1 Renewable power net additions to capacity under main and accelerated cases
0
20
40
60
80
100
120
140
160
180
2006 2007 2008 2009 2010 2011 2012 2013 2014 2015 2016 2017 2018 2019 2020
GW
United States Japan EU-28 Other OECD India China Brazil Other non-OECD Accelerated case
Historical Forecast

EXECUTIVE SUMMARY
MEDIUM-TERM RENEWABLE ENERGY MARKET REPORT 2015 19
A set of OECD enhanced policy changes would need to include: • A clear signal in the United States on the durability of federal tax incentives and the
implementation of the Environmental Protection Agency (EPA) Clean Power Plan. • The rapid clarification of renewable policy uncertainties in some markets where renewables
are starting to accelerate (e.g. Mexico, Turkey). • The implementation of stable and sustainable policy frameworks that give greater certainty
about the long-term revenue streams of renewable projects (e.g. EU-28 target governance). • Greater measures to ensure the grid and system integration of variable renewables
(e.g. Japan, European regional markets). • Implementation of fair rules and appropriate electricity rate design for reaping the benefits
from fast-growing distributed solar PV while allocating the network costs (e.g. United States and Europe).
A set of enhanced policy changes in developing countries would need to include: • More certainty over the credible implementation of ambitious long-term policy frameworks
in some markets (e.g. India). • Greater measures to reduce regulatory barriers and improve the system and grid
integration of variable renewables (e.g. China, South Africa), particularly distributed solar PV.
• Improved market access and strengthened financial sustainability in the power sector through, for example, the removal of fossil fuel subsidies and the use of well-designed price competition mechanisms to help spur cost reductions.
• Improved financing conditions with greater stakeholder consultation during policy design, development institution participation to reduce off taker risks and concessional financing.
While energy security and local sustainability concerns provide a first-order motivation for adopting enhanced policies, the improving affordability of renewables can have positive ramifications for global climate change negotiations. Energy remains at the heart of global climate change solutions and a dramatic scale-up of renewable investment, along with increased energy efficiency and other measures, remains central. Policies to spur an accelerated renewable growth profile, as described here, would put the global power system on a firmer path to limit the long-term global average temperature increase to 2°C. At the same time, a clear supportive outcome from the COP 21 climate conference in December 2015 could create a virtuous cycle for renewable deployment. Such a situation would provide further policy certainty that would decrease renewable investment risks and reduce financing costs, thus making local energy security and sustainability aims more attainable.
ANALYTICAL FRAMEWORK
20 MEDIUM-TERM RENEWABLE ENERGY MARKET REPORT 2015
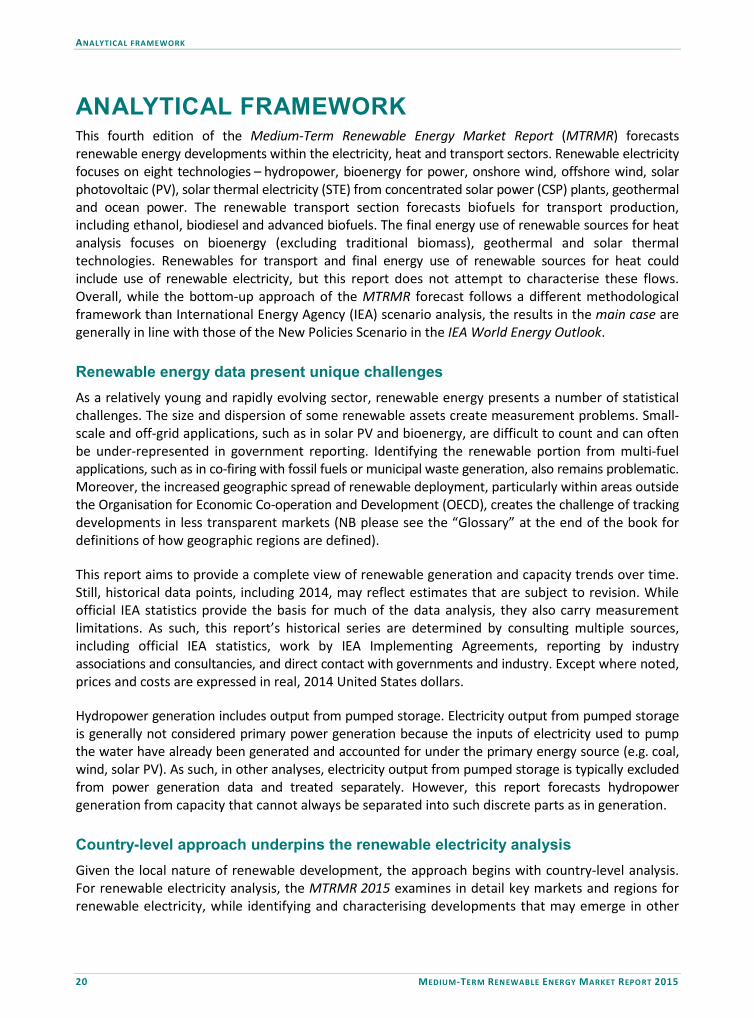
ANALYTICAL FRAMEWORK This fourth edition of the Medium-Term Renewable Energy Market Report (MTRMR) forecasts renewable energy developments within the electricity, heat and transport sectors. Renewable electricity focuses on eight technologies – hydropower, bioenergy for power, onshore wind, offshore wind, solar photovoltaic (PV), solar thermal electricity (STE) from concentrated solar power (CSP) plants, geothermal and ocean power. The renewable transport section forecasts biofuels for transport production, including ethanol, biodiesel and advanced biofuels. The final energy use of renewable sources for heat analysis focuses on bioenergy (excluding traditional biomass), geothermal and solar thermal technologies. Renewables for transport and final energy use of renewable sources for heat could include use of renewable electricity, but this report does not attempt to characterise these flows. Overall, while the bottom-up approach of the MTRMR forecast follows a different methodological framework than International Energy Agency (IEA) scenario analysis, the results in the main case are generally in line with those of the New Policies Scenario in the IEA World Energy Outlook. Renewable energy data present unique challenges As a relatively young and rapidly evolving sector, renewable energy presents a number of statistical challenges. The size and dispersion of some renewable assets create measurement problems. Small-scale and off-grid applications, such as in solar PV and bioenergy, are difficult to count and can often be under-represented in government reporting. Identifying the renewable portion from multi-fuel applications, such as in co-firing with fossil fuels or municipal waste generation, also remains problematic. Moreover, the increased geographic spread of renewable deployment, particularly within areas outside the Organisation for Economic Co-operation and Development (OECD), creates the challenge of tracking developments in less transparent markets (NB please see the “Glossary” at the end of the book for definitions of how geographic regions are defined). This report aims to provide a complete view of renewable generation and capacity trends over time. Still, historical data points, including 2014, may reflect estimates that are subject to revision. While official IEA statistics provide the basis for much of the data analysis, they also carry measurement limitations. As such, this report’s historical series are determined by consulting multiple sources, including official IEA statistics, work by IEA Implementing Agreements, reporting by industry associations and consultancies, and direct contact with governments and industry. Except where noted, prices and costs are expressed in real, 2014 United States dollars. Hydropower generation includes output from pumped storage. Electricity output from pumped storage is generally not considered primary power generation because the inputs of electricity used to pump the water have already been generated and accounted for under the primary energy source (e.g. coal, wind, solar PV). As such, in other analyses, electricity output from pumped storage is typically excluded from power generation data and treated separately. However, this report forecasts hydropower generation from capacity that cannot always be separated into such discrete parts as in generation. Country-level approach underpins the renewable electricity analysis Given the local nature of renewable development, the approach begins with country-level analysis. For renewable electricity analysis, the MTRMR 2015 examines in detail key markets and regions for renewable electricity, while identifying and characterising developments that may emerge in other

ANALYTICAL FRAMEWORK
MEDIUM-TERM RENEWABLE ENERGY MARKET REPORT 2015 21
important markets. Forecasts stem from both quantitative and qualitative analysis. Country-level examinations start with an assessment of the prevailing renewable project pipeline, which is established using various country-level sources as well as the renewable energy projects database of Bloomberg New Energy Finance (2015). This pipeline is analysed in the context of a country’s power demand outlook, power generation situation, grid and system integration issues, and current policy environment and the economic attractiveness of renewable deployment. Based on IEA analysis for each of the key regions and markets, main case forecasts are made for renewable electricity capacity by source through 2020. Generation forecasts are then derived using country- and technology-specific capacity factors, while recognising that resource quality, the timing of new additions, curtailment issues and weather may cause actual performance to differ from assumptions. Country-level generation forecasts can be found in the online data appendix of the report. A country’s total power demand outlook is based on expectations for real gross domestic product (GDP). This analysis is done in close co-ordination with other IEA medium-term reports. Assumptions for GDP growth stem from the International Monetary Fund publication (IMF) World Economic Outlook, released in April 2015. For some countries, e.g. emerging markets, power demand growth acts as a driver for renewable generation; for others, e.g. more mature markets, demand growth (or lack thereof) can act as a neutral variable or even a constraint on development. An evaluation of the prevailing policy framework, including announced policies as of July 2015, is a key determinant of the main case forecast. Both the overall enabling environment and the design and implementation of renewable policies are important. The enabling environment includes cross-cutting enablers that can support, or hinder, the successful implementation of policies and the creation of an attractive investment climate, based on five categories (described in more detail in IEA, 2015): • regulatory and institutional factors • financial and economic factors • technical, infrastructure and innovation factors • social factors • environmental factors. Moreover, countries go through different phases of renewable development as deployment grows and costs and prices reduce and converge with international norms: Inception, Take-off and Mainstreaming (IEA, 2011). The policy priorities between the phases differ. Initially, a very secure investment climate, and an appropriate regulatory framework must be put in place to attract investors into a new market where supply chains are less mature and system prices can be still relatively high compared to international benchmarks. Once deployment takes off, the emphasis shifts to encouraging cost reduction and to managing support costs. In the mainstreaming phase, physical and market integration become the key challenges (Figure 2). The position of a given market within this journey and the effectiveness of its policy design and implementation in meeting associated priorities significantly impact the trajectory and sustainability of renewable deployment going forward. Aside from policy, the MTRMR 2015 looks at economic attractiveness and power system integration as deployment factors. Attractiveness assessments stem from few variables, including levelised costs of electricity (LCOE), policy incentives, economic resource potentials, macroeconomic developments and the market design of the power system. For each country, an

ANALYTICAL FRAMEWORK
22 MEDIUM-TERM RENEWABLE ENERGY MARKET REPORT 2015
assessment is made as to whether the power grid can absorb the forecasted generation mix and variability. For many countries the potential exists for policy improvements or non-economic barrier changes over the medium term.
Figure 2 The renewable policy journey and changing policy priorities
Initiation phase Take-off phase Mainstreaming phase
• The first examples of the technology deployment under commercial terms.
• Secure support needed to encourage early investors.
• Local supply chain absent. • Define regulatory framework
e.g. permitting procedures may be unclear or lengthy.
• The market starts to grow rapidly.
• Policy priority is to encourage costs to converge with international benchmarks.
• Manage total support costs remain within the expected envelope.
• Refine regulatory procedures.
• The annual market has reached a significant scale.
• The supply chain is well established.
• Generation prices are consistent with international norms and approach fossil-based alternatives.
• Technical and market integration becomes key issues.
Source: IEA (2015), Enabling Renewable Energy and Energy Efficiency Technologies: Opportunities in Eastern Europe, Caucasus, Central Asia, Southern and Eastern Mediterranean. This report includes an accelerated case projection in order to show the potential impacts on deployment from certain market and policy enhancements that help to address challenges to renewable deployment. Under the accelerated case, the most dynamic renewable electricity sources (i.e. solar and wind) could grow faster than the main case. A number of country-specific developments, as described within each regional outlook, would need to occur for this result to occur. Given uncertainties over such enhancements occurring in concert, the accelerated case is represented by a range and is indicative of the potential upside for annual renewable deployment over the medium term. Outlooks for technology and investment guide the global picture Key market assessments under the main case are judged against developments in renewable technologies and investment. The technology chapter describes system properties of different renewable technologies, industry and manufacturing developments, and recent technology cost developments, including discussion of LCOEs. The primary assumptions used to display the ranges for the main LCOE graphs are listed in the table at the end of this “Analytical Framework” chapter. The chapter characterises recent market developments by technology and provides a forecast for market development through 2020. It consolidates, by technology, the country-level forecasts; identifies the key markets; and addresses potential deployment barriers that lie ahead.
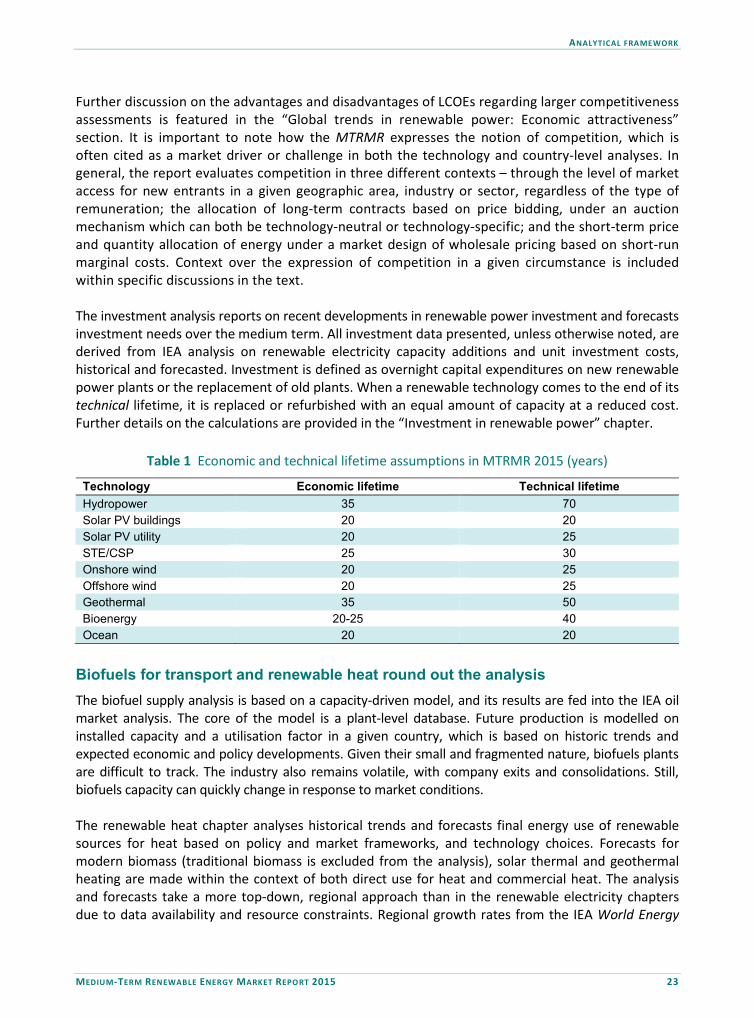
ANALYTICAL FRAMEWORK
MEDIUM-TERM RENEWABLE ENERGY MARKET REPORT 2015 23
Further discussion on the advantages and disadvantages of LCOEs regarding larger competitiveness assessments is featured in the “Global trends in renewable power: Economic attractiveness” section. It is important to note how the MTRMR expresses the notion of competition, which is often cited as a market driver or challenge in both the technology and country-level analyses. In general, the report evaluates competition in three different contexts – through the level of market access for new entrants in a given geographic area, industry or sector, regardless of the type of remuneration; the allocation of long-term contracts based on price bidding, under an auction mechanism which can both be technology-neutral or technology-specific; and the short-term price and quantity allocation of energy under a market design of wholesale pricing based on short-run marginal costs. Context over the expression of competition in a given circumstance is included within specific discussions in the text. The investment analysis reports on recent developments in renewable power investment and forecasts investment needs over the medium term. All investment data presented, unless otherwise noted, are derived from IEA analysis on renewable electricity capacity additions and unit investment costs, historical and forecasted. Investment is defined as overnight capital expenditures on new renewable power plants or the replacement of old plants. When a renewable technology comes to the end of its technical lifetime, it is replaced or refurbished with an equal amount of capacity at a reduced cost. Further details on the calculations are provided in the “Investment in renewable power” chapter.
Table 1 Economic and technical lifetime assumptions in MTRMR 2015 (years)
Technology Economic lifetime Technical lifetime Hydropower 35 70 Solar PV buildings 20 20 Solar PV utility 20 25 STE/CSP 25 30 Onshore wind 20 25 Offshore wind 20 25 Geothermal 35 50 Bioenergy 20-25 40 Ocean 20 20
Biofuels for transport and renewable heat round out the analysis The biofuel supply analysis is based on a capacity-driven model, and its results are fed into the IEA oil market analysis. The core of the model is a plant-level database. Future production is modelled on installed capacity and a utilisation factor in a given country, which is based on historic trends and expected economic and policy developments. Given their small and fragmented nature, biofuels plants are difficult to track. The industry also remains volatile, with company exits and consolidations. Still, biofuels capacity can quickly change in response to market conditions. The renewable heat chapter analyses historical trends and forecasts final energy use of renewable sources for heat based on policy and market frameworks, and technology choices. Forecasts for modern biomass (traditional biomass is excluded from the analysis), solar thermal and geothermal heating are made within the context of both direct use for heat and commercial heat. The analysis and forecasts take a more top-down, regional approach than in the renewable electricity chapters due to data availability and resource constraints. Regional growth rates from the IEA World Energy
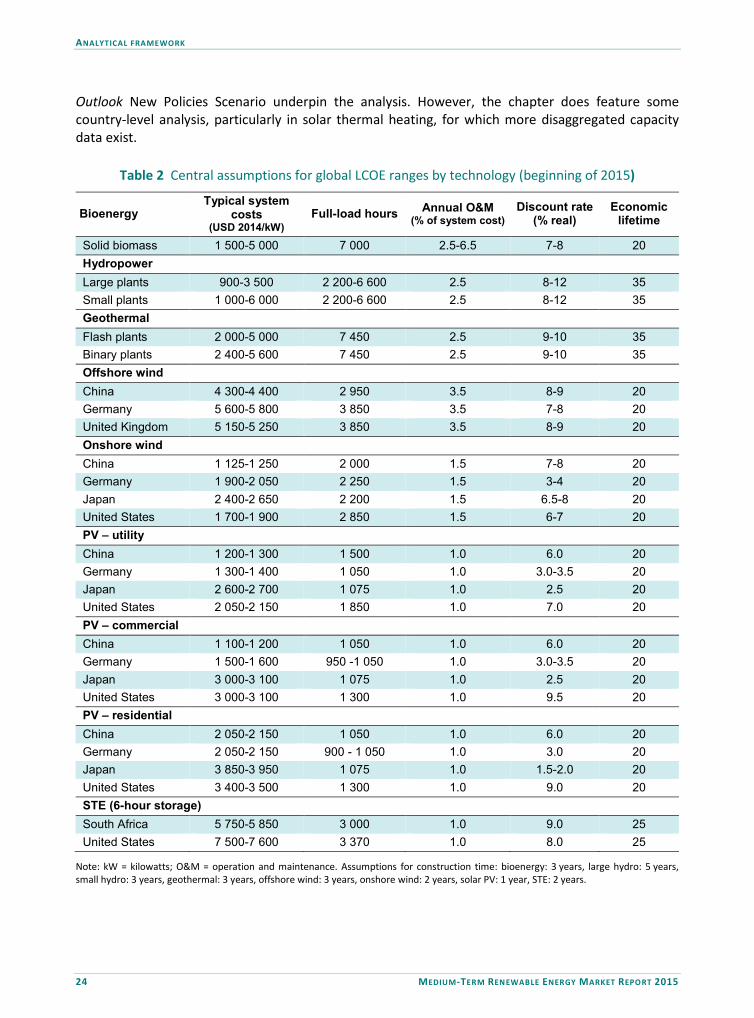
ANALYTICAL FRAMEWORK
24 MEDIUM-TERM RENEWABLE ENERGY MARKET REPORT 2015
Outlook New Policies Scenario underpin the analysis. However, the chapter does feature some country-level analysis, particularly in solar thermal heating, for which more disaggregated capacity data exist.
Table 2 Central assumptions for global LCOE ranges by technology (beginning of 2015)
Bioenergy Typical system
costs (USD 2014/kW)
Full-load hours Annual O&M (% of system cost)
Discount rate (% real)
Economic lifetime
Solid biomass 1 500-5 000 7 000 2.5-6.5 7-8 20 Hydropower Large plants 900-3 500 2 200-6 600 2.5 8-12 35 Small plants 1 000-6 000 2 200-6 600 2.5 8-12 35 Geothermal Flash plants 2 000-5 000 7 450 2.5 9-10 35 Binary plants 2 400-5 600 7 450 2.5 9-10 35 Offshore wind China 4 300-4 400 2 950 3.5 8-9 20 Germany 5 600-5 800 3 850 3.5 7-8 20 United Kingdom 5 150-5 250 3 850 3.5 8-9 20 Onshore wind China 1 125-1 250 2 000 1.5 7-8 20 Germany 1 900-2 050 2 250 1.5 3-4 20 Japan 2 400-2 650 2 200 1.5 6.5-8 20 United States 1 700-1 900 2 850 1.5 6-7 20 PV – utility China 1 200-1 300 1 500 1.0 6.0 20 Germany 1 300-1 400 1 050 1.0 3.0-3.5 20 Japan 2 600-2 700 1 075 1.0 2.5 20 United States 2 050-2 150 1 850 1.0 7.0 20 PV – commercial China 1 100-1 200 1 050 1.0 6.0 20 Germany 1 500-1 600 950 -1 050 1.0 3.0-3.5 20 Japan 3 000-3 100 1 075 1.0 2.5 20 United States 3 000-3 100 1 300 1.0 9.5 20 PV – residential China 2 050-2 150 1 050 1.0 6.0 20 Germany 2 050-2 150 900 - 1 050 1.0 3.0 20 Japan 3 850-3 950 1 075 1.0 1.5-2.0 20 United States 3 400-3 500 1 300 1.0 9.0 20 STE (6-hour storage) South Africa 5 750-5 850 3 000 1.0 9.0 25 United States 7 500-7 600 3 370 1.0 8.0 25
Note: kW = kilowatts; O&M = operation and maintenance. Assumptions for construction time: bioenergy: 3 years, large hydro: 5 years, small hydro: 3 years, geothermal: 3 years, offshore wind: 3 years, onshore wind: 2 years, solar PV: 1 year, STE: 2 years.

ANALYTICAL FRAMEWORK
MEDIUM-TERM RENEWABLE ENERGY MARKET REPORT 2015 25
References BNEF (Bloomberg New Energy Finance) (2015), Renewable Energy Projects Database, Bloomberg New Energy Finance, London. IEA (2015), Enabling Renewable Energy and Energy Efficiency Technologies: Opportunities in Eastern Europe, Caucasus, Central Asia, Southern and Eastern Mediterranean, OECD/IEA, Paris, www.iea.org/publications/insights/insightpublications/EnablingRenewableEnergyandEnergyEfficiencyTechnologies.pdf. IEA (International Energy Agency) (2011), Deploying Renewables: Best and Future Policy Practice, OECD/IEA, Paris. IMF (International Monetary Fund) (2015), World Economic Outlook, April 2015, IMF, Washington, D.C.

RENEWABLE ELECTRICITY : OECD
26 MEDIUM-TERM RENEWABLE ENERGY MARKET REPORT 2015
RENEWABLE ELECTRICITY: OECD Summary • After several years of increasing growth, markets in the Organisation for Economic Co-operation
and Development (OECD) continue to transition to a slower but stable renewable electricity capacity expansion. Despite the fall in oil prices and sharp reductions in gas prices in some regions, the forecast expansion for renewables is higher than that in the Medium-Term Renewable Energy Market Report (MTRMR) 2014. Overall, OECD member countries represent 35% of global new renewable additions, and 40% of non-hydro additions, through 2020.
• Within the OECD, renewable growth is driven by strong policy support for decarbonisation, diversification aims and retirements of conventional plants. The clarification of some market uncertainties in some areas (e.g. Japan, Germany) over the past year, along with continued declines in costs of the most dynamic technologies, solar photovoltaics (PV) and onshore wind, and expected rising deployment from other technologies (e.g. offshore wind) support the outlook. Meanwhile, strong is expected in some dynamic markets (e.g. Chile, Mexico, Turkey), where demand and resource drivers are robust, though needed policy clarifications and non-economic barriers limit the forecast.
• OECD power systems with slow demand growth but new supply needs (e.g. the United States, Japan, some European markets) and those with overcapacity face diverse challenges to maintain long-term policy frameworks while shifting from high incentive levels and integrating higher penetrations of variable renewables. The persistence of some uncertainties over policies and grid and system integration measures in this group of countries, as well as notable near-term changes to incentive schemes, explain an anticipated dip in 2016-17 and slow growth of OECD renewable capacity additions thereafter. However, under accelerated case conditions, as described below, annual renewable deployment could rise to higher levels.
Figure 3 OECD renewable electricity net capacity additions and projection (GW)
0
10
20
30
40
50
60
70
2005 2006 2007 2008 2009 2010 2011 2012 2013 2014 2015 2016 2017 2018 2019 2020
GW
OECD Americas OECD Asia Oceania OECD Europe Accelerated case Note: GW = gigawatts.
Source: Historical OECD capacity derived from IEA (2015a), “OECD - Net capacity of renewables”, IEA Renewables Information Statistics (database).
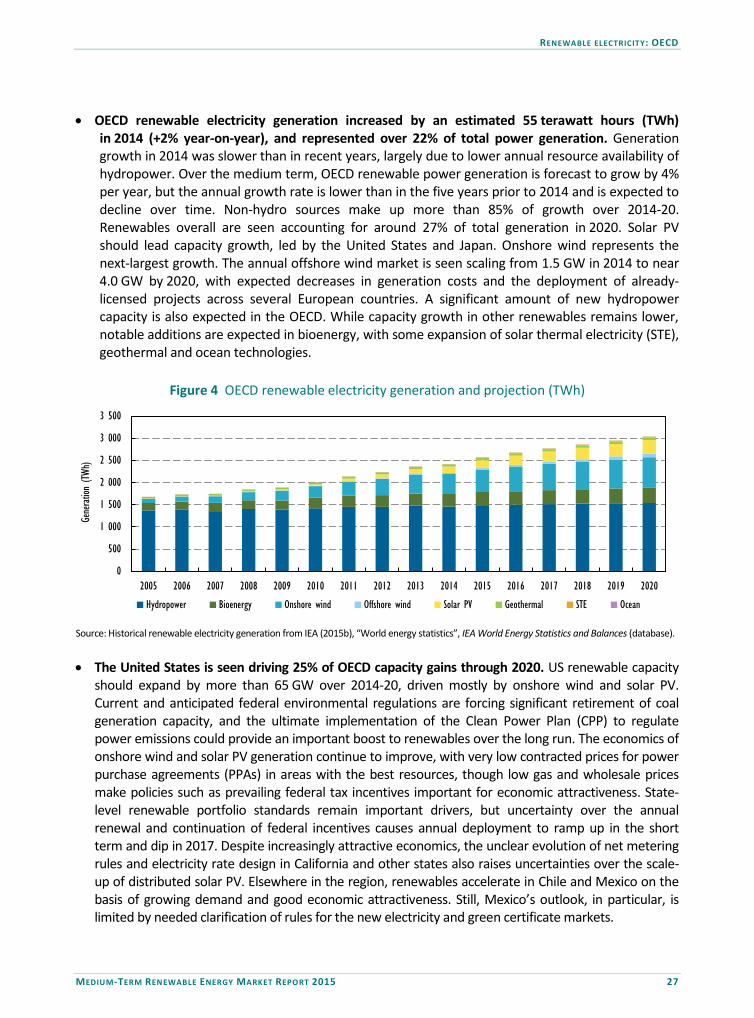
RENEWABLE ELECTRICITY: OECD
MEDIUM-TERM RENEWABLE ENERGY MARKET REPORT 2015 27
• OECD renewable electricity generation increased by an estimated 55 terawatt hours (TWh)
in 2014 (+2% year-on-year), and represented over 22% of total power generation. Generation growth in 2014 was slower than in recent years, largely due to lower annual resource availability of hydropower. Over the medium term, OECD renewable power generation is forecast to grow by 4% per year, but the annual growth rate is lower than in the five years prior to 2014 and is expected to decline over time. Non-hydro sources make up more than 85% of growth over 2014-20. Renewables overall are seen accounting for around 27% of total generation in 2020. Solar PV should lead capacity growth, led by the United States and Japan. Onshore wind represents the next-largest growth. The annual offshore wind market is seen scaling from 1.5 GW in 2014 to near 4.0 GW by 2020, with expected decreases in generation costs and the deployment of already-licensed projects across several European countries. A significant amount of new hydropower capacity is also expected in the OECD. While capacity growth in other renewables remains lower, notable additions are expected in bioenergy, with some expansion of solar thermal electricity (STE), geothermal and ocean technologies.
Figure 4 OECD renewable electricity generation and projection (TWh)
0
500
1 000
1 500
2 000
2 500
3 000
3 500
2005 2006 2007 2008 2009 2010 2011 2012 2013 2014 2015 2016 2017 2018 2019 2020
Generat
ion (T
Wh)
Hydropower Bioenergy Onshore wind Offshore wind Solar PV Geothermal STE Ocean
Source: Historical renewable electricity generation from IEA (2015b), “World energy statistics”, IEA World Energy Statistics and Balances (database). • The United States is seen driving 25% of OECD capacity gains through 2020. US renewable capacity
should expand by more than 65 GW over 2014-20, driven mostly by onshore wind and solar PV. Current and anticipated federal environmental regulations are forcing significant retirement of coal generation capacity, and the ultimate implementation of the Clean Power Plan (CPP) to regulate power emissions could provide an important boost to renewables over the long run. The economics of onshore wind and solar PV generation continue to improve, with very low contracted prices for power purchase agreements (PPAs) in areas with the best resources, though low gas and wholesale prices make policies such as prevailing federal tax incentives important for economic attractiveness. State-level renewable portfolio standards remain important drivers, but uncertainty over the annual renewal and continuation of federal incentives causes annual deployment to ramp up in the short term and dip in 2017. Despite increasingly attractive economics, the unclear evolution of net metering rules and electricity rate design in California and other states also raises uncertainties over the scale-up of distributed solar PV. Elsewhere in the region, renewables accelerate in Chile and Mexico on the basis of growing demand and good economic attractiveness. Still, Mexico’s outlook, in particular, is limited by needed clarification of rules for the new electricity and green certificate markets.
RENEWABLE ELECTRICITY : OECD
28 MEDIUM-TERM RENEWABLE ENERGY MARKET REPORT 2015
• Stronger-than-expected renewable growth is occurring in Japan, which comprises 15% of new OECD capacity over the medium term. Japan’s renewable capacity should rise by nearly 40 GW over 2014-20, with a strong push to diversify the power sector backed by robust incentives. The forecast is more optimistic versus MTRMR 2014 due to higher solar PV. Despite minimal expected demand growth, the power situation remains tight due to uncertainty over the return of nuclear generation. Japan’s generous feed-in tariff (FiT) scheme has stimulated a large project pipeline of solar PV, and significant ongoing reforms of the power sector should ultimately help to integrate higher levels of variable renewables. Still, uncertainties remain over whether grid integration aims will be achieved in practice and how support policies will evolve. In the absence of greater progress and clarity in these areas, the annual deployment pattern is forecast to be strong in the near term and decline over time. Elsewhere in OECD Asia Oceania, Australia’s forecast is relatively unchanged. Although the government revised down the Renewable Energy Target for 2020, the resolution of more than a year of policy uncertainty around the change is allowing developers to re-establish project pipelines with greater confidence over the medium-term objective.
• OECD Europe accounts for 40% of OECD additions over the medium term. Still, annual renewable growth dips in 2016-17, largely due to incentive changes to solar PV and onshore wind in the United Kingdom, and only slowly rises thereafter. The rapid deployment of renewables amid weak electricity demand growth and overcapacity in several markets can require scaling down part of the existing power system, which can put incumbent utilities under pressure and create policy uncertainty. While the economic attractiveness for renewables has improved, all power generators are struggling where there is oversupply and low wholesale prices. In some markets, strong demand-side (e.g. Turkey) or supply-side (e.g. United Kingdom) needs counteract this general trend. And the commissioning of a large pipeline of offshore wind projects increasingly supports the forecast during the second half of the outlook period. Policy frameworks remain important to stimulating new development and integrating higher shares of variable renewables. A number of countries in OECD Europe are transitioning from fixed FiTs/feed-in premiums or green certificates to auction mechanisms and contracts for difference, which seek to stimulate more cost-effectively renewables deployment and require greater participation of generators in short-term energy markets. Several regional uncertainties characterise the outlook, including progress on the build-out of a pan-European grid, the attainment of a European Union 2020 target for 10% interconnection and the nature of the governance system to achieve longer-term (2030) renewable targets. Moreover, a number of country-level uncertainties persist.
• Under this report’s accelerated case – which is market-specific to each region – total renewable growth in the OECD could be up to 70 GW higher over 2014-20 than under the main case. In addition to faster-than-expected reductions in renewable costs, this result could come about through the rapid clarification of policy uncertainties in some markets (e.g. the United States, Mexico, Turkey); the implementation of stable and sustainable policy frameworks that give greater certainty about the long-term revenue streams of renewable projects; greater measures to ensure the grid and system integration of variable renewables (e.g. Japan, European regional market); and implementation of fair rules and appropriate electricity rate design for allocating the costs and benefits from fast-growing distributed solar PV (e.g. United States). Still, there is a high degree of uncertainty over enhancements occurring in concert within and between markets.
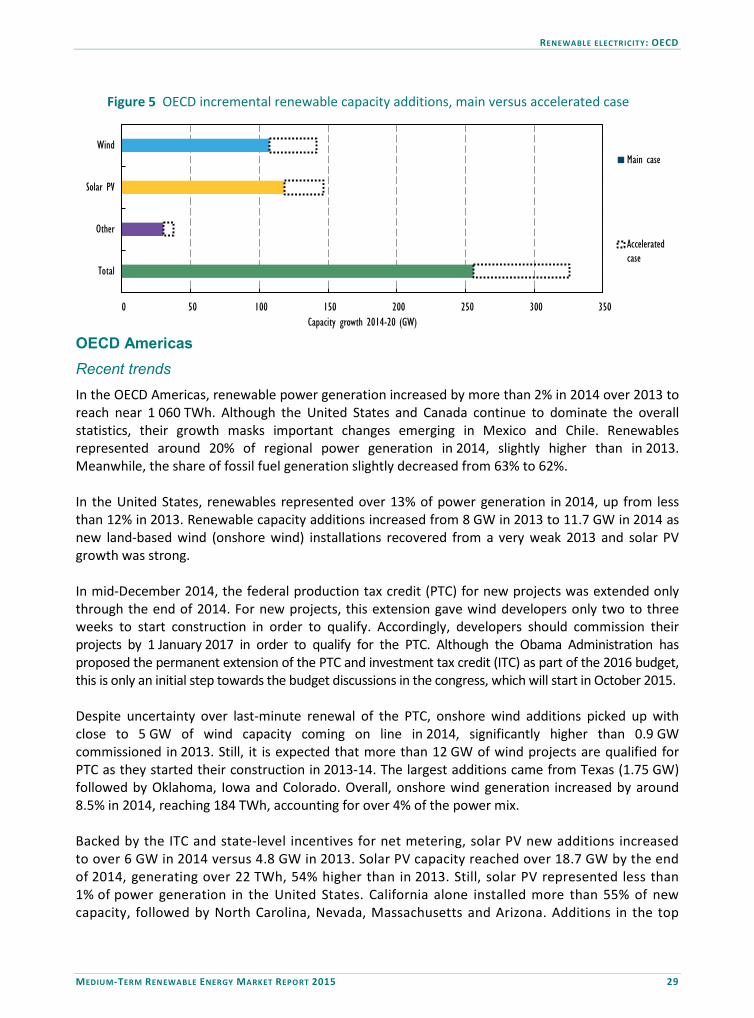
RENEWABLE ELECTRICITY: OECD
MEDIUM-TERM RENEWABLE ENERGY MARKET REPORT 2015 29
Figure 5 OECD incremental renewable capacity additions, main versus accelerated case
0 50 100 150 200 250 300 350
Total
Other
Solar PV
Wind
Capacity growth 2014-20 (GW)
Main case
Acceleratedcase
OECD Americas Recent trends In the OECD Americas, renewable power generation increased by more than 2% in 2014 over 2013 to reach near 1 060 TWh. Although the United States and Canada continue to dominate the overall statistics, their growth masks important changes emerging in Mexico and Chile. Renewables represented around 20% of regional power generation in 2014, slightly higher than in 2013. Meanwhile, the share of fossil fuel generation slightly decreased from 63% to 62%.
In the United States, renewables represented over 13% of power generation in 2014, up from less than 12% in 2013. Renewable capacity additions increased from 8 GW in 2013 to 11.7 GW in 2014 as new land-based wind (onshore wind) installations recovered from a very weak 2013 and solar PV growth was strong.
In mid-December 2014, the federal production tax credit (PTC) for new projects was extended only through the end of 2014. For new projects, this extension gave wind developers only two to three weeks to start construction in order to qualify. Accordingly, developers should commission their projects by 1 January 2017 in order to qualify for the PTC. Although the Obama Administration has proposed the permanent extension of the PTC and investment tax credit (ITC) as part of the 2016 budget, this is only an initial step towards the budget discussions in the congress, which will start in October 2015.
Despite uncertainty over last-minute renewal of the PTC, onshore wind additions picked up with close to 5 GW of wind capacity coming on line in 2014, significantly higher than 0.9 GW commissioned in 2013. Still, it is expected that more than 12 GW of wind projects are qualified for PTC as they started their construction in 2013-14. The largest additions came from Texas (1.75 GW) followed by Oklahoma, Iowa and Colorado. Overall, onshore wind generation increased by around 8.5% in 2014, reaching 184 TWh, accounting for over 4% of the power mix.
Backed by the ITC and state-level incentives for net metering, solar PV new additions increased to over 6 GW in 2014 versus 4.8 GW in 2013. Solar PV capacity reached over 18.7 GW by the end of 2014, generating over 22 TWh, 54% higher than in 2013. Still, solar PV represented less than 1% of power generation in the United States. California alone installed more than 55% of new capacity, followed by North Carolina, Nevada, Massachusetts and Arizona. Additions in the top
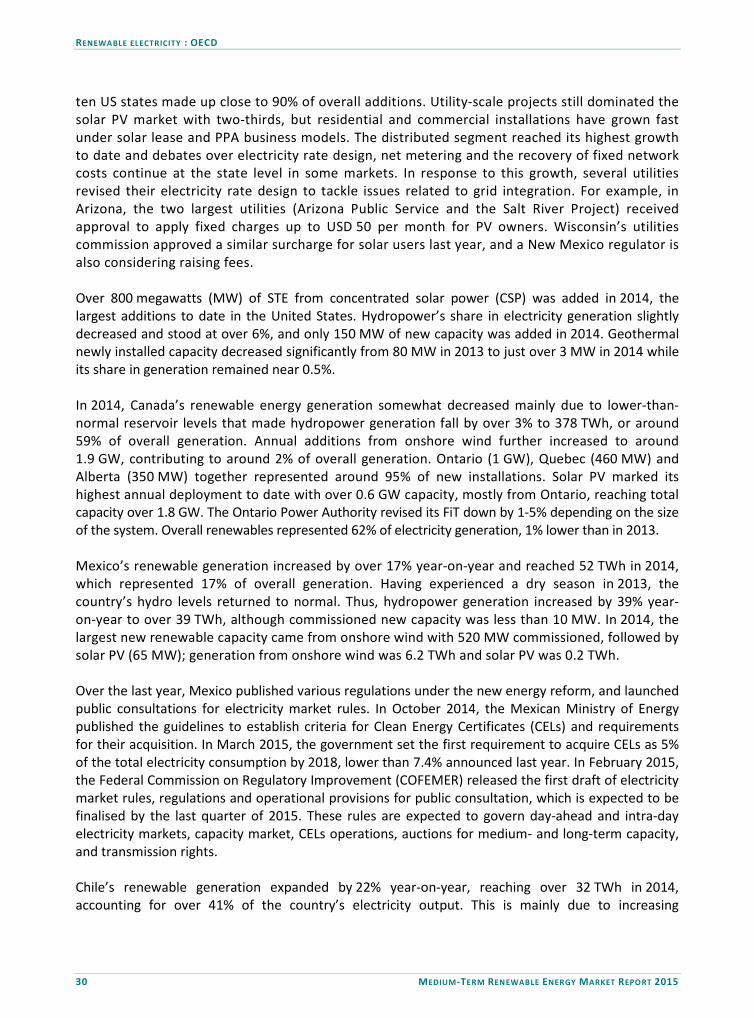
RENEWABLE ELECTRICITY : OECD
30 MEDIUM-TERM RENEWABLE ENERGY MARKET REPORT 2015
ten US states made up close to 90% of overall additions. Utility-scale projects still dominated the solar PV market with two-thirds, but residential and commercial installations have grown fast under solar lease and PPA business models. The distributed segment reached its highest growth to date and debates over electricity rate design, net metering and the recovery of fixed network costs continue at the state level in some markets. In response to this growth, several utilities revised their electricity rate design to tackle issues related to grid integration. For example, in Arizona, the two largest utilities (Arizona Public Service and the Salt River Project) received approval to apply fixed charges up to USD 50 per month for PV owners. Wisconsin’s utilities commission approved a similar surcharge for solar users last year, and a New Mexico regulator is also considering raising fees. Over 800 megawatts (MW) of STE from concentrated solar power (CSP) was added in 2014, the largest additions to date in the United States. Hydropower’s share in electricity generation slightly decreased and stood at over 6%, and only 150 MW of new capacity was added in 2014. Geothermal newly installed capacity decreased significantly from 80 MW in 2013 to just over 3 MW in 2014 while its share in generation remained near 0.5%. In 2014, Canada’s renewable energy generation somewhat decreased mainly due to lower-than-normal reservoir levels that made hydropower generation fall by over 3% to 378 TWh, or around 59% of overall generation. Annual additions from onshore wind further increased to around 1.9 GW, contributing to around 2% of overall generation. Ontario (1 GW), Quebec (460 MW) and Alberta (350 MW) together represented around 95% of new installations. Solar PV marked its highest annual deployment to date with over 0.6 GW capacity, mostly from Ontario, reaching total capacity over 1.8 GW. The Ontario Power Authority revised its FiT down by 1-5% depending on the size of the system. Overall renewables represented 62% of electricity generation, 1% lower than in 2013. Mexico’s renewable generation increased by over 17% year-on-year and reached 52 TWh in 2014, which represented 17% of overall generation. Having experienced a dry season in 2013, the country’s hydro levels returned to normal. Thus, hydropower generation increased by 39% year-on-year to over 39 TWh, although commissioned new capacity was less than 10 MW. In 2014, the largest new renewable capacity came from onshore wind with 520 MW commissioned, followed by solar PV (65 MW); generation from onshore wind was 6.2 TWh and solar PV was 0.2 TWh. Over the last year, Mexico published various regulations under the new energy reform, and launched public consultations for electricity market rules. In October 2014, the Mexican Ministry of Energy published the guidelines to establish criteria for Clean Energy Certificates (CELs) and requirements for their acquisition. In March 2015, the government set the first requirement to acquire CELs as 5% of the total electricity consumption by 2018, lower than 7.4% announced last year. In February 2015, the Federal Commission on Regulatory Improvement (COFEMER) released the first draft of electricity market rules, regulations and operational provisions for public consultation, which is expected to be finalised by the last quarter of 2015. These rules are expected to govern day-ahead and intra-day electricity markets, capacity market, CELs operations, auctions for medium- and long-term capacity, and transmission rights. Chile’s renewable generation expanded by 22% year-on-year, reaching over 32 TWh in 2014, accounting for over 41% of the country’s electricity output. This is mainly due to increasing

RENEWABLE ELECTRICITY: OECD
MEDIUM-TERM RENEWABLE ENERGY MARKET REPORT 2015 31
hydropower generation as reservoir levels recovered from the drought. Hydropower generation increased by 23% year-on-year and reached 24 TWh, which accounted for over 32% of generation. In addition, Chile added 370 MW of hydropower plants over the last year. In 2014, renewable capacity additions were led by onshore wind with over 500 MW commissioned, up from 100 MW added in 2013. Solar PV additions were strong with 365 MW with few large utility-scale projects backed by long-term PPAs coming on line in 2014. But in solar (PV and STE), a number of new developments have emerged in the project pipeline, portending stronger growth ahead. Medium-term outlook – regional main case summary Overall, OECD Americas renewable generation is seen rising by over 250 TWh, or 24%, from 2014-20. The region should add more than 93 GW of renewable capacity over 2014-20. Onshore wind is likely to lead capacity growth with over 43 GW of new additions, followed by solar PV with 40 GW. However, despite strong regional incremental capacity growth, annual additions are expected to dip in 2017, reflecting anticipated changes in federal tax incentives in the United States. They are then expected to recover through the second half of the forecast period due to expected technology cost reductions, which should improve the competitiveness of both onshore wind and solar PV.
Figure 6 OECD Americas historical and forecasted net additions to renewable capacity, generation and investment
0
200
400
600
800
1 000
1 200
1 400
2013 2014 2015 2016 2017 2018 2019 2020
Generat
ion (T
Wh)
0
10
20
30
40
50
0
5
10
15
20
25
2013 2014 2015 2016 2017 2018 2019 2020
USD
billio
n
Annu
al ad
dition
s (GW
)
Hydropower Bioenergy Onshore Wind Offshore Wind Solar PV Geothermal STE Ocean Investment
Note: Technology-specific investment costs are discussed in the technology and investment sections of the report.
Sources: Historical OECD capacity derived from IEA (2015a), “OECD - Net capacity of renewables”, IEA Renewables Information Statistics (database). Historical renewable electricity generation from IEA (2015b), “World energy statistics”, IEA World Energy Statistics and Balances (database). Underlying the forecast, overall power demand growth is expected to be slow in the United States and Canada as incremental electricity consumption is increasingly decoupled from economic growth. In Mexico and Chile, renewables should contribute to the growing need for new generation capacity as economic growth in both countries is expected to be fast. In the United States, renewable generation should increase by over 155 TWh over 2014-20. In terms of capacity, this should represent more than 62% of OECD Americas additional renewable deployment. Overall, the US renewable capacity should grow by 65 GW over the forecast period, reaching more than 269 GW in 2020. The forecast is slightly improved compared with MTRMR 2014

RENEWABLE ELECTRICITY : OECD
32 MEDIUM-TERM RENEWABLE ENERGY MARKET REPORT 2015
mainly due to a more positive outlook for solar PV. The details of the US forecast are discussed in the dashboard that follows this section.
Figure 7 OECD Americas power demand versus GDP growth
0.0%
0.5%
1.0%
1.5%
2.0%
2.5%
3.0%
3.5%
4.0%
4.5%
0
500
1 000
1 500
2 000
2 500
3 000
3 500
4 000
4 500
United States Canada Mexico Chile
CAAG
R 20
14-20
Dema
nd (T
Wh)
2014
2020
Demand (righthand axis)
GDP(right hand axis)
Notes: GDP = gross domestic product; CAAGR = compound average annual growth rate.
Sources: IEA (2015c), Medium-Term Gas Market Report 2015; IMF (2015), World Economic Outlook, April 2015. Canada’s renewable generation is expected to rise by over 53 TWh over 2014-20, but the forecast is somewhat less optimistic than in MTRMR 2014, largely due to reduced expectations for hydropower deployment. The commissioning of several projects was slower than expected in 2014, and the start of a few large projects has been pushed back to after 2020. Still, Canada should add 3.6 GW of hydropower capacity to reach over 80 GW in 2020. The onshore wind forecast in Canada is robust with over 7.5 GW additional capacity expected by 2020, which is mainly driven by procurement programmes in Quebec and Ontario. The forecast is slightly lower compared with MTRMR 2014 mainly due to time scale and capacity announced under Ontario’s Large Public Procurement (LRP) programme, which consists of capacity auctions awarded with long-term power purchase contracts. The LRP included up to 300 MW of onshore capacity, slightly lower than expected. Developers submitted over 100 projects with 2 GW capacity in September. The completion of the project evaluation and final results are expected in December 2015. Awarded projects will come on line over 2017-20 while the timing of new procurement capacity is currently unknown. The ceiling price is CAD 115 per megawatt hour (MWh) (USD 93/MWh), the same as the previous FiT level. Although it is difficult to assess the price outcome of Ontario’s LRP, the tenders are expected to drive more cost-effective renewable energy deployment due to competitive bidding. This forecast estimated levelised costs of electricity (LCOEs) in Ontario for onshore wind at CAD 75-110/MWh, taking into account improved energy yield with increasing turbine efficiency. In December 2014, Quebec awarded three onshore wind projects totalling 447 MW that are expected to come on line in 2016-18. The average contract price for these projects was CAD 76/MWh (CAD 63/MWh for energy and CAD 13/MWh for transmission costs) (USD 66/MWh). The price ceiling set for this tender was CAD 90/MWh, significantly lower than CAD (2009) 125/MWh set in 2009. Alberta, British Columbia and Nova Scotia should contribute with smaller additions. In Alberta, the

RENEWABLE ELECTRICITY: OECD
MEDIUM-TERM RENEWABLE ENERGY MARKET REPORT 2015 33
pool price in the electricity market was around CAD 50/MWh in 2014. In addition, the wind developers usually receive lower prices as wind regime is not correlated with peak hours when higher remuneration from the market is possible.
Table 3 OECD Americas countries main targets and support policies for renewable electricity
OECD Americas Regulatory support Economic support
Country
Ren
ewab
le
ener
gy la
w
Targ
ets
Quo
tas/
RPS
FiT/
Feed
-in
prem
ium
Cap
ital g
rant
s an
d su
bsid
ies
Soft
loan
s
Tax
relie
f
Net
met
erin
g
Trad
able
gre
en
cert
ifica
tes
Car
bon
pric
ing
Auc
tion
sche
mes
Canada ✓ ✓ ✓ ✓ ✔ ✔ ✓ Chile ✔ ✔ ✔ ✔ ✔ ✔ Mexico ✔ ✔ ✔ ✔ ✔ ✔ ✔ ✔ ⓪
United States ✓ ✓ ✓ ✓ ✔ ✔ ✔ ✓ ✓ ✓ ✓
Policy highlights • Mexico launched an energy sector reform in 2014 including the electricity industry. The rules and regulations
governing wholesale electricity market, tradable green certificate system and auctions were under discussion at the time of writing
• Chile changed rules of the energy auction held in December 2014 enabling developers to bid for three block hours instead of the single 24-hour block.
• United States EPA released proposals of the Clean Power Plan for each state.
Notes: ✔ = national-level policy; ✓ = state/provincial-level policy, ● = recently updated, X = to be phased out, ⓪ = recently introduced; ■ – under review. For further information, refer to IEA/IRENA Policies and Measures Database for Renewable Energy. In Canada, solar PV should expand by 1.7 GW, reaching over 3.5 GW thanks to generous FiTs for residential and commercial applications in Ontario (ranging from CAD 270/MWh to CAD 380/MWh, depending on the size of applications) and small utility-scale additions (100 MW) expected from the LRP. Bioenergy is expected to increase by 350 MW while some ocean demonstration projects are expected to come on line in Nova Scotia by 2020. In Mexico, renewable power generation is seen expanding by 18 TWh over 2014-20. The forecast is less optimistic versus MTRMR 2014 due to uncertainties over the design and implementation of the energy reform. Rules and regulations concerning the quota regime, electricity and CEL markets were still under public consultation at the time of writing. The current draft rules allocate equal numbers of certificates to all renewable energy technologies with the exception of co-generation1 plants. In addition to exchanges in the green certificate market, the regulation proposes the possibility of other transactions of certificates through long-term bilateral agreements. Another instrument proposed is the government issuance of auctions/tenders to procure renewable capacity. However, the details of bilateral contracts and tender mechanisms, which could create revenue certainty for renewable projects, remain unclear at the time of writing. In the absence of both electricity and green certificate price signals, it is difficult to assess the economic attractiveness of renewable energy technologies under the new regime, as proposed rules were not approved at the time of writing.
1 Co-generation refers to the combined production of heat and power.
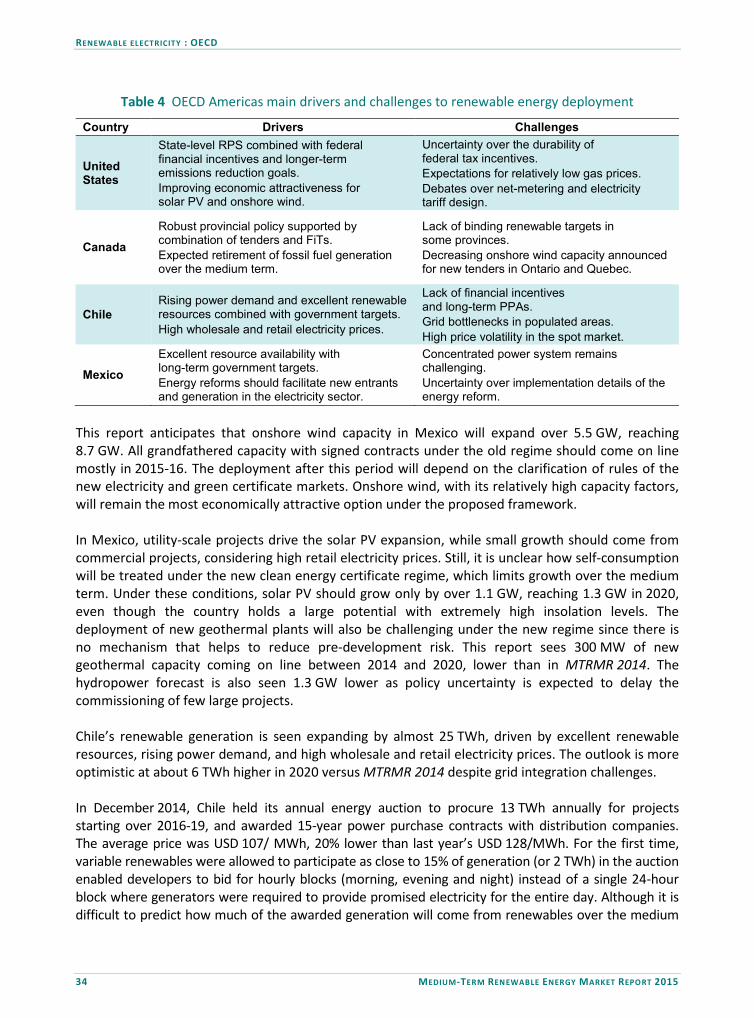
RENEWABLE ELECTRICITY : OECD
34 MEDIUM-TERM RENEWABLE ENERGY MARKET REPORT 2015
Table 4 OECD Americas main drivers and challenges to renewable energy deployment
Country Drivers Challenges
United States
State-level RPS combined with federal financial incentives and longer-term emissions reduction goals. Improving economic attractiveness for solar PV and onshore wind.
Uncertainty over the durability of federal tax incentives. Expectations for relatively low gas prices. Debates over net-metering and electricity tariff design.
Canada Robust provincial policy supported by combination of tenders and FiTs. Expected retirement of fossil fuel generation over the medium term.
Lack of binding renewable targets in some provinces. Decreasing onshore wind capacity announced for new tenders in Ontario and Quebec.
Chile Rising power demand and excellent renewable resources combined with government targets. High wholesale and retail electricity prices.
Lack of financial incentives and long-term PPAs. Grid bottlenecks in populated areas. High price volatility in the spot market.
Mexico Excellent resource availability with long-term government targets. Energy reforms should facilitate new entrants and generation in the electricity sector.
Concentrated power system remains challenging. Uncertainty over implementation details of the energy reform.
This report anticipates that onshore wind capacity in Mexico will expand over 5.5 GW, reaching 8.7 GW. All grandfathered capacity with signed contracts under the old regime should come on line mostly in 2015-16. The deployment after this period will depend on the clarification of rules of the new electricity and green certificate markets. Onshore wind, with its relatively high capacity factors, will remain the most economically attractive option under the proposed framework. In Mexico, utility-scale projects drive the solar PV expansion, while small growth should come from commercial projects, considering high retail electricity prices. Still, it is unclear how self-consumption will be treated under the new clean energy certificate regime, which limits growth over the medium term. Under these conditions, solar PV should grow only by over 1.1 GW, reaching 1.3 GW in 2020, even though the country holds a large potential with extremely high insolation levels. The deployment of new geothermal plants will also be challenging under the new regime since there is no mechanism that helps to reduce pre-development risk. This report sees 300 MW of new geothermal capacity coming on line between 2014 and 2020, lower than in MTRMR 2014. The hydropower forecast is also seen 1.3 GW lower as policy uncertainty is expected to delay the commissioning of few large projects. Chile’s renewable generation is seen expanding by almost 25 TWh, driven by excellent renewable resources, rising power demand, and high wholesale and retail electricity prices. The outlook is more optimistic at about 6 TWh higher in 2020 versus MTRMR 2014 despite grid integration challenges. In December 2014, Chile held its annual energy auction to procure 13 TWh annually for projects starting over 2016-19, and awarded 15-year power purchase contracts with distribution companies. The average price was USD 107/ MWh, 20% lower than last year’s USD 128/MWh. For the first time, variable renewables were allowed to participate as close to 15% of generation (or 2 TWh) in the auction enabled developers to bid for hourly blocks (morning, evening and night) instead of a single 24-hour block where generators were required to provide promised electricity for the entire day. Although it is difficult to predict how much of the awarded generation will come from renewables over the medium

RENEWABLE ELECTRICITY: OECD
MEDIUM-TERM RENEWABLE ENERGY MARKET REPORT 2015 35
term, large solar PV developers won several contracts with USD 80-85/MWh, 20-25% lower than the average price, 30-35% lower than some fossil fuel plants. Spot electricity prices fluctuated between USD 100/MWh and USD 180/MWh in 2014, with higher prices observed in some nodes depending on the peak demand and level transmission congestions. Over the last year, various developers have preferred to sell electricity into the spot market in the absence of long-term power purchase contracts with large consumers (or mining companies). However, spot prices have slightly decreased over the first half of 2015 mainly due to lower natural gas prices. Further price reductions could occur in regions with the timely completion of new transmission capacity over the medium term (if natural gas and oil prices remain low). Overall, merchant plants are directly exposed to volatile spot market prices that increase their project revenue risks. This situation might limit the availability of financing and potentially resulting in higher costs of capital, and decrease the bankability of new projects.
Table 5 OECD Americas cumulative renewable energy capacity in 2014 and 2020
Total capacity (GW)
2014 2020
Canada Chile Mexico United States Canada Chile Mexico United
States Hydropower 76.9 6.5 11.7 101.7 80.6 7.2 13.0 102.3 Bioenergy 2.0 1.3 0.8 13.1 2.4 1.4 0.9 14.2 Onshore wind 9.7 0.8 2.1 64.8 17.1 2.6 7.8 92.4 Offshore wind 0.0 0.0 0.0 0.0 0.2 0.0 0.0 0.3 Solar PV 1.8 0.4 0.2 18.7 3.5 3.0 1.3 53.7 STE/CSP 0.0 0.1 0.0 2.1 0.0 0.9 0.0 2.3 Geothermal 0.0 0.0 0.8 3.5 0.0 0.1 1.1 3.8 Ocean 0.0 0.0 0.0 0.0 0.0 0.0 0.0 0.0 Total 90.4 9.0 15.6 204.0 103.8 15.2 24.2 269.1
Note: For further country-level forecast data, please see the Excel workbook that accompanies this report.
Source: Historical OECD capacity derived from IEA (2015a) “OECD - Net capacity of renewables”, IEA Renewables Information Statistics (database). The price volatility in the spot market is expected to pose a moderate challenge to renewable developers that signed PPAs with distribution companies after the recent energy auction. Those PPAs require generators to deliver contracted electricity in promised block hours. If renewable plants are not able to deliver promised energy, they have to buy electricity from the spot market to fulfil their requirements where prices might be higher. Bilateral agreements between solar PV and wind developers and mining companies represent an emerging business model and increasing driver for deployment. Still variable renewables face challenges to find these bilateral contracts as mining companies prefer generators that can provide electricity 24 hours. In order to meet this challenge, renewable developers have the option of being part of a generation portfolio that includes conventional plants or non-variable renewables such as CSP. Large utilities already considered this strategy in the latest energy auction. In light of these recent trends, solar PV additions are seen growing by over 2.5 GW by 2020, with utility-scale projects dominating this growth. Similar drivers exist for other renewable energy technologies, especially for wind power. Thus, onshore wind should expand by over 1.8 GW, reaching

RENEWABLE ELECTRICITY : OECD
36 MEDIUM-TERM RENEWABLE ENERGY MARKET REPORT 2015
2.5 GW in 2020. With 835 MW of new capacity expected to come on line over the medium term. In addition, Chile should be one of the largest CSP markets globally. Smaller additions are expected from hydropower (750 MW) and geothermal (100 MW) over 2014-20. While economics might be favorable, the Chilean grid may serve as a barrier, especially in the Norte Grande Interconnected System (SING) and Sistema Interconectado Central (SIC). The majority of electricity-generating capacity is connected to the SIC grid, which is already highly congested in its north connection. Although the reinforcement of the Copiapó-Santiago transmission line is expected to come on line in 2018, the construction has faced financing and administrative challenges. The outlook assumes that the commissioning of the new transmission line will be delayed with some renewable projects expected to face connection delays. In addition to grid integration issues, the high cost of capital due to their spot market exposure and limited availability of long-term contracts also remain challenging in Chile. Medium-term outlook – regional accelerated case summary
Much enhancement is possible in the OECD Americas with improvements in the policy and regulatory environment. Overall, cumulative renewable capacity could be around 9% higher in 2020 with onshore wind and solar PV leading the accelerated case. In the United States, renewable capacity could be 15-23 GW higher, mainly depending on changes in federal and state-level policies, which are discussed in the US dashboard. In Canada, the baseline forecast assumes no major policy changes concerning renewable incentives. Some provincial-level policy and market enhancements could result in stronger renewable energy deployment, especially for onshore wind. Alberta’s wind potential remains untapped. However, Alberta’s new provincial government announced a new climate change strategy for the province that may include a broader and higher carbon tax. This change would make onshore wind more attractive versus new combined-cycle gasification turbine (CCGT) plants. In addition, some regulatory and policy changes in British Columbia, Nova Scotia and Saskatchewan might boost onshore wind deployment. Under these conditions, total cumulative onshore wind capacity could potentially be 1-1.5 GW higher in 2020 than under the main case. Hydropower capacity could be higher with faster than expected commissioning of plants under construction in some provinces. In Mexico, the outcome of new electricity and green certificate market reform would dictate the accelerated case. Over the medium term, onshore wind and solar PV capacity could be higher if tenders with long-term contracts are introduced in a timely manner under the new regime. This would increase investors’ confidence, given significant near-term uncertainty over the electricity and clean certificates prices. Onshore wind capacity could be 300 MW to 1 GW higher, while solar PV capacity could be 600 MW to 900 MW higher in 2020. Policy changes that also address pre-development risks might increase geothermal capacity up to 250 MW in 2020 versus the main case. Chile’s renewable energy deployment could be enhanced with greater certainty about long-term revenue streams of renewable projects. On this front, higher generation could be tendered to new block hours introduced in the latest auction for 15-year contracts, or the improvement of a market framework that better facilitates long-term power contract arrangements for renewables would spur more deployment. In addition, the timely completion of the Copiapó-Santiago transmission line by 2018 would facilitate grid connection of more renewables and alleviate congestion in some
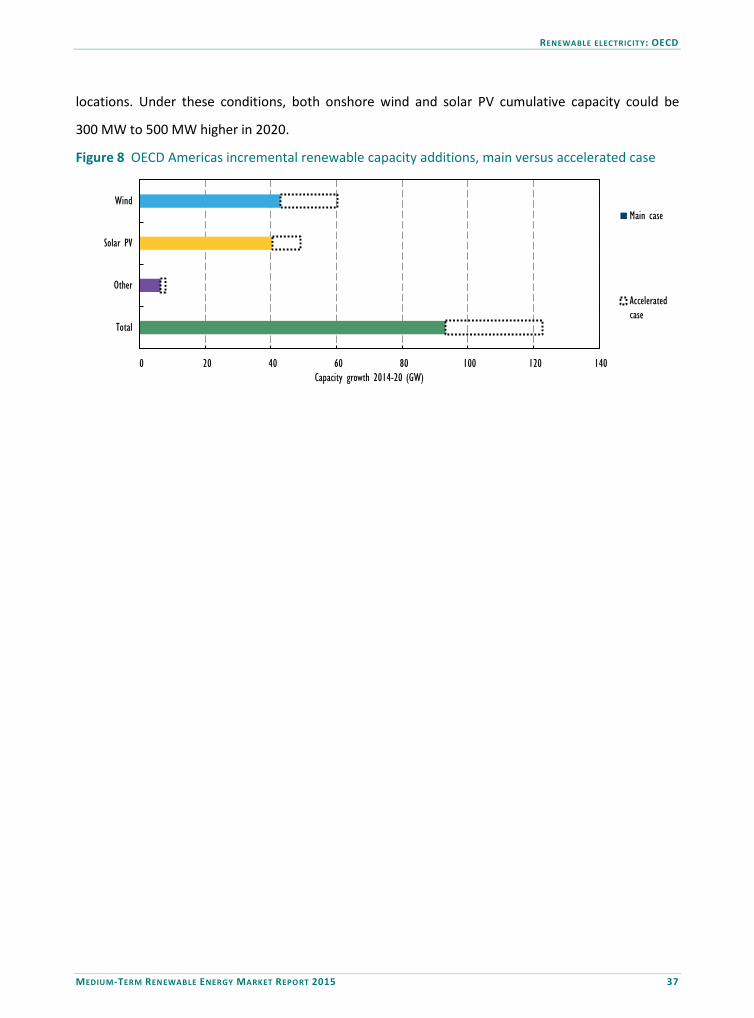
RENEWABLE ELECTRICITY: OECD
MEDIUM-TERM RENEWABLE ENERGY MARKET REPORT 2015 37
locations. Under these conditions, both onshore wind and solar PV cumulative capacity could be
300 MW to 500 MW higher in 2020.
Figure 8 OECD Americas incremental renewable capacity additions, main versus accelerated case
0 20 40 60 80 100 120 140
Total
Other
Solar PV
Wind
Capacity growth 2014-20 (GW)
Main case
Acceleratedcase

RENEWABLE ELECTRICITY : OECD
38 MEDIUM-TERM RENEWABLE ENERGY MARKET REPORT 2015
United States dashboard
Figure D.1 Annual net additions to renewable capacity (2013-20)
0
2
4
6
8
10
12
14
16
18
2013 2014 2015 2016 2017 2018 2019 2020
Annu
al ad
dition
s (GW
)
Ocean
STE
Geothermal
Solar PV
Offshore Wind
Onshore Wind
Bioenergy
Hydropower
Source: Historical OECD capacity derived from IEA (2015a), “OECD - Net capacity of renewables”, IEA Renewables Information Statistics (database).
Figure D.2 EPA’s CPP summary for selected states
0 10 20 30 40 50 60 70 80 90
California
Texas
Indiana
New York
Illinos
Oklahoma
Alabama
Florida
Generation (TWh)
Renewablegeneration in2012
EPA proposedrenewable energytarget in 2020
Coal to gasredispatch by2030
Source: EPA (2014), Clean Power Plan proposed rule.
Figure D.3 US wind versus gas, estimated LCOEs Figure D.4 PJM coal plant retirements
Note: For CCGT and OCGT, fuel cost assumption is USD 2.85/MMbtu (May 2015 Henry Hub Spot Price) in 2015 and USD 6.2/MMbtu in 2020 (IEA [2015c], Projecting Costs of Generating Electricity 2015 Edition), discount rate 7%, capacity factor 65% and 15% (OCGT). For wind, typical utilisation rate is 30-36%, 50% utilisation is observed in the interior region.
0
10
20
30
40
50
60
0
2
4
6
8
10
12
2010 2011 2012 2013 2014 2015
USD/
MWh
GW
PJM retired PJM Scheduled to retirePJM spot price (right axis)
Source: PJM (2015), “Future deactivations as of June 29, 2015”.
OCGT existing
0
20
40
60
80
100
120
2015 2020
USD
2014
/MWh
CCGT new CCGT existing
Wind (typical)
Wind (50% utilisation)

RENEWABLE ELECTRICITY: OECD
MEDIUM-TERM RENEWABLE ENERGY MARKET REPORT 2015 39
Medium-term forecast: United States main case
US renewable capacity should expand by 66 GW over 2014-20. The forecast is more optimistic than in MTRMR 2014, with the capacity in 2020 revised up by 5 GW as solar PV expansion is expected to be stronger, driven by improving economics and state-level policy changes. Although state-level RPSs remain important for renewable deployment, uncertainty over the annual renewal and continuation of federal tax incentives after 2016-17 affects the economics of renewable energy deployment, limiting the project pipeline over the medium term. In the United States, new investment needs in power generation are driven more by supply-side factors than demand. Power demand is expected to grow only 0.5% annually over 2014-20, or just over 125 TWh. Conceivably, this additional power demand could be met with around 23 GW of new coal capacity running at current capacity factors, all else equal. However, current and anticipated federal environmental regulations and low natural gas prices are pushing coal out of the system. In 2015, over 10 GW of old coal capacity is expected to go off line in order to meet the first date of compliance with the EPA Mercury and Air Toxics Standards, which is currently under legal challenge. Overall, 50 GW of coal capacity is expected to retire by the end of 2020, mostly in PJM and Southeast power regions. Although the majority of additional generation needs will be met by coal-to-gas fuel switching, renewables – mainly solar and wind – are expected to play an increasing role in replacing retirements. The EPA’s proposed goals under the CPP might help renewable deployment, especially in states without RPS policies. According to the latest draft of EPA’s proposed goals, 23 states will exceed the EPA 2030 renewable generation projections if they meet their state-level renewable portfolio standard (RPS) policies, while four states including Texas would need more aggressive renewable deployment. Although the states without RPS (19 in total) are expected to deploy more renewables, CPP proposes a significant switch from coal to gas generation. States are expected to propose their carbon reduction plans by mid-2016 with EPA approval by mid-2018. With this timeline, the impact of CPP is likely to be felt more over the long term. The economic attractiveness of large-scale wind and solar projects will be affected by the expiration or reduction of federal tax incentives. For onshore wind, PTCs have been the main driver of deployment with state-level incentives contributing to the bankability of projects. Over 80% of cumulative wind capacity has been deployed in states with RPS policies in place. The RPS demand without PTC is expected to be 1-3 GW per year (NREL, 2014). In some states with good resources (i.e. Texas), onshore wind excluding RPS has been economically attractive. Another aspect of wind competiveness has emerged from its hedge value against potential increase in natural gas prices. In the absence of the PTC, the attractiveness of wind projects will be highly dependent on their capacity factors and financing terms. The main case assumes that PTC will not be renewed but projects starting construction by 2015 will still qualify. In addition to states with strong RPS targets, new additions are expected where power prices are relatively high and new capacity is needed with coal retirements (PJM). The forecast is in line with MTRMR 2014. While onshore wind additions reach over 7.5-8.5 GW in 2015-16, they fall to 1.7 GW in 2017, due to the PTC, with annual additions gradually recovering thereafter based on economic attractiveness and new supply needs.

RENEWABLE ELECTRICITY : OECD
40 MEDIUM-TERM RENEWABLE ENERGY MARKET REPORT 2015
United States
Table D.1 Recent developments in solar PV policy design in selected US states
Net metering fee Incentive Rate design change
Arizona, several utilities proposed to increase fixed fees up to USD 50/month
Arizona Public Service started its own residential programme
Arizona, time-of-use rate for 25% of customers, more expected to come
California, the fixed charge increased from USD 0.94 to USD 10/month
New York, “MW block” rebate programme aims for 3 GW by 2023
New York, increasing time-of-use offered by utilities
Wisconsin, residential fixed charge doubled for all customers to USD 19/month
California, USD 500 rebate for PV arrays pointing west for 360 MW by 2017
California, proposed decreasing rate tiers from four to two
Nevada’s NV Energy proposed a fixed fee increase of an average of USD 2.8/month
Wisconsin, rebate programme for residential PV – USD 3.5 million in 2016
South Carolina, net metering regulation under discussion
Nevada, solar generation project offers USD 400/kilowatt (kW) up to 25 kW
Figure D.5 US New solar PV additions by segment
Figure D.6 US utility-scale solar PV estimated. LCOEs
0%
20%
40%
60%
80%
100%
2010 2011 2012 2013 2014 2015 2016 2017 2018 2019 2020
MW
Residential Commercial Utility Off grid
0
100
200
300
400
500
600
2010 2012 2014 2016 2018 2020
USD
2014
/MWh
Utility LCOE USA typical Note: LCOEs are indicative and ranges reflect differences in resource, investment costs and financing. Historical LCOEs are based on average of commissioned projects, which may reflect inclusion of legacy equipment price contracts.
Table D.2 US renewable energy capacity (2014-20)
2014 2016 2018 2020 2020*
Hydropower 101.7 102.1 102.2 102.3 102.7
Bioenergy 13.1 13.4 13.8 14.2 15.0
Onshore wind 64.8 81.0 84.7 92.4 107.3
Offshore wind 0.0 0.0 0.0 0.3 0.3
Solar PV 18.7 32.7 42.2 53.7 60.7
STE/CSP 2.1 2.2 2.2 2.3 2.6
Geothermal 3.5 3.6 3.7 3.8 4.0
Ocean 0.0 0.0 0.0 0.0 0.0
Total 204.0 235.1 248.8 269.1 292.7
* Accelerated case.
• Drivers - need for new capacity in some states due to coal retirements with emission requirements - state-level RPS with federal tax incentives - improving economics of onshore wind and solar with cheaper financing.
• Challenges - uncertainty over the durability of federal tax incentives. - gas prices expected to remain low. - debates over net-energy metering and electricity tariff design.
RENEWABLE ELECTRICITY: OECD
MEDIUM-TERM RENEWABLE ENERGY MARKET REPORT 2015 41
Utility-scale projects still drive the outlook for solar PV, but all segments will be affected by the ITC change. The ITC for utility- and commercial-scale projects will decrease from 30% to 10% at the end of 2016. For host-owned residential projects, the ITC will expire completely, though third-party ownership models will continue to benefit from the remaining 10%. Thus, this forecast sees a volatile annual pattern of solar PV additions, with the market dipping in 2017 to 3.5 GW and successive rises thereafter. State-level policies, especially RPS, will play an important role in deployment over the medium term. California will continue to dominate solar PV expansion with its ambitious RPS goal. But activity is occurring elsewhere and with some notable cost reductions. For example, in July, a 100 MW Nevada plant coming on line in 2017 signed a USD 37/MWh PPA, ostensibly a very low value. While this includes the ITC and 3% escalation, suggesting a higher LCOE without incentives (near USD 65/MWh), the development may portend some deployment at costs lower than the modelled LCOE assumptions in this report (around USD 100/MWh for typical projects in 2017). Expected changes to the ITC in 2017 should further increase the role of state-level incentive schemes, utility electricity rate design and net metering policies for residential and commercial solar PV systems. California Solar Initiative’s budget cap of USD 2.4 billion will be reached in 2016. In 2014, more than 70% of residential applications were deployed without capital subsidies thanks to new business models based on solar leases or PPAs. The evolution of net metering rules and electricity rate design in California and other states raises a number of uncertainties over the scale-up of distributed PV. For instance, the California Public Utilities Commission is considering the design of new net metering rules (utilities are only required to offer the current programme through summer 2017 or until programme caps are reached); the roll-out of time-of-use rates by 2019, which could change the system value of PV; and the imposition of minimum bills or fixed charges, which could affect the economics. New York State launched a new grant programme (MW Block) for all PV installations aiming for 3 GW by 2023. The block structure allocates incentives per region while subsidy per watt will decrease over time depending on installed capacity. Distributed projects should expand fast in light of high prevailing retail prices. While the outlook for hydropower is slightly higher, the forecast for offshore wind, geothermal and STE technologies is less optimistic. In 2015, two utilities cancelled PPAs with the CapeWind offshore wind farm while Block island offshore wind plant (30 MW) is expected to come online in 2016. For STE, the forecast is lower due to uncertainty over the project pipeline beyond 2015. The geothermal forecast is revised down as the deployment in 2014 was lower than expected.
Medium-term forecast: United States accelerated case
For onshore wind and solar PV, upside potential will mainly depend on the continuation of federal incentives and a better financing environment. The accelerated case for wind assumes either the same level of PTC renewed annually over 2020 or a well-signalled, gradual step-down of the incentive by 2020. Thus, onshore wind deployment could be 6-12 GW higher, reaching 119 GW in 2020. For solar PV, the accelerated case includes continuation of lower ITC and further state-level policy push along with cost improvements, which could bring the cumulative capacity between 53-60 GW, 3-10 GW higher than the main case. Further deployment of geothermal is possible should the draft bills be approved, including the 50% RPS bill in California.
RENEWABLE ELECTRICITY : OECD
42 MEDIUM-TERM RENEWABLE ENERGY MARKET REPORT 2015
OECD Asia Oceania Recent trends In OECD Asia Oceania, renewable power increased by almost 9% in 2014 to reach over 12% of total power generation. Renewable trends across the region continue to vary significantly by market, with stronger-than-expected activity in Japan, Korea and Israel,1 where new generation needs are stronger, and slower development in Australia, where policy uncertainty was greater and demand growth was weaker. The largest gains were in solar PV, followed by hydropower and onshore wind, and Japan accounted for 70% of the regional increase in total renewable generation. The power generation situation in Japan has remained tight since MTRMR 2014. At the time of writing, only 5 of Japan’s 48 nuclear reactors had received approval to restart, and only one had done so. A combination of reduced electricity demand and increased renewable generation facilitated a reduction in thermal generation in fiscal year 2014, with the consumption of oil for power generation falling by one-third versus the prior year while both coal and liquefied natural gas (LNG) consumption remained relatively steady (FEPC, 2015a). Renewables accounted for 15% of total power generation in 2014, up from near 14% in 2013, with hydropower at 8%. A need for new power generation, the continued provision of generous incentives and the development of a large project pipeline helped boost solar PV capacity additions to 9.7 GW in calendar year 2014.2 Still, concerns over grid congestion and the integration of the large project pipeline of solar PV prompted electric power companies (EPCOs) in five utility areas to temporarily stop reviewing grid access applications of approved new projects (10 kW and above) from October 2014. Each of these EPCOs subsequently assessed the amount of renewable capacity that could be integrated into its service area. Based on this detailed analysis, METI revised rules in January 2015 allowing EPCOs to curtail generation, without compensation, from renewable generators up to 360 hours per year; for those installations beyond the assessed capacity limit for the service area, EPCOs could curtail with no limit. EPCOs then began reviewing applications following the issuance of these regulations. Hydropower capacity in Japan rose by over 220 MW in 2014, boosted by the commissioning of the first 200 MW unit of the 600 MW Kyogoku dam. Other renewable technologies continued to grow relatively slowly. Onshore wind additions totalled 130 MW in 2014, higher than that achieved in 2013, but still lower than the 200 MW average annual build rate from 2008-12. No new offshore wind capacity was commissioned in 2014, and geothermal power additions were marginal. In 2014, Australia’s renewable generation rose by 18% and represented almost 15% of total power generation. Electricity demand in the National Energy Market continued to decline in 2014 as overcapacity in generation widened further (AER, 2014). The overcapacity situation, an ongoing review of the Renewable Energy Target (RET), record low RET certificate prices for 1 The statistical data for Israel are supplied by and under the responsibility of the relevant Israeli authorities. The use of such data by the OECD is without prejudice to the status of the Golan Heights, East Jerusalem and Israeli settlements in the West Bank under the terms of international law. 2 Installations reported by the Japan Ministry of Economy, Trade and Industry (METI) are expressed in alternating current (AC) capacity, the actual power supplied to the grid, while this report’s solar PV figures are expressed in direct current (DC), which expresses the maximum theoretical generation under standard conditions. Solar PV capacity in Japan is translated from DC to AC using a ratio of around 85%. For details, see IEA-PVPS, 2014.

RENEWABLE ELECTRICITY: OECD
MEDIUM-TERM RENEWABLE ENERGY MARKET REPORT 2015 43
large-scale projects and the repeal of carbon pricing in July 2014 all represented increasing challenges for new renewable development. The onshore wind capacity expansion, at 570 MW, remained robust compared with the prior year, and solar PV installations registered 830 MW, comparable to that in 2013, though the project pipeline for future development of large-scale projects weakened amid uncertainty over pending RET policy reviews. Solar PV capacity continued to be led by the deployment of distributed systems, stimulated mainly by attractive economics under socket parity. Korea’s renewable generation declined by 5% due to lower hydropower and represented just over 2% of total generation. The power market situation eased somewhat in 2014, with the restart of some nuclear capacity that was off line for maintenance in 2013, and a continued increase in reserve margins (Lee, 2015). Supported by an RPS with a solar carve-out that commenced in 2012, solar PV marked its highest annual deployment to date, at over 900 MW. Wind installations, mostly onshore, totalled only 50 MW. A much larger project pipeline exists; however, environmental regulations, limited site availability and social acceptance have all acted as challenges to deployment. Israel’s renewable generation stood at only 1.5% of total generation in 2014. Still, solar PV registered notable capacity gains, with 250 MW, mostly utility scale, of installations in 2014, the highest annual deployment to date. Finally, New Zealand’s relatively high level of renewable penetration stood at near 80% in 2014, versus a target of 90% by 2025. Medium-term outlook – regional main case summary OECD Asia Oceania renewable generation is seen rising by over 35%, from 2014-20. This growth is somewhat higher than that forecast in MTRMR 2014, with a more robust expansion in solar PV outweighing slower growth in onshore and offshore wind.
Figure 9 OECD Asia Oceania historical and forecasted capacity additions, generation and investment
0
50
100
150
200
250
300
350
2013 2014 2015 2016 2017 2018 2019 2020
Generat
ion (T
Wh)
0
10
20
30
40
50
0
2
4
6
8
10
12
14
2013 2014 2015 2016 2017 2018 2019 2020
USD
billio
n
Annu
al ad
dition
s (GW
)
Hydropower Bioenergy Onshore Wind Offshore Wind Solar PV Geothermal STE Ocean Investment
Sources: Historical OECD capacity derived from IEA (2015a), “OECD - Net capacity of renewables”, IEA Renewables Information Statistics (database). Historical renewable electricity generation from IEA (2015b), “World energy statistics”, IEA World Energy Statistics and Balances (database). Over the medium term, capacity growth in OECD Asia Oceania is expected to be led by solar PV, which is seen expanding by 45 GW from 2014-20. Despite strong expected annual growth in the near term, driven by new generation needs and supportive policy frameworks in Japan, Korea

RENEWABLE ELECTRICITY : OECD
44 MEDIUM-TERM RENEWABLE ENERGY MARKET REPORT 2015
and Israel, renewable additions are expected to slow over the medium term, with uncertainties over progress in integrating higher levels of variable renewables in Japan and reduced expectations in Australia, where electricity demand is expected to stagnate, due to the downward RET adjustment.
Figure 10 OECD Asia Oceania countries power demand versus GDP growth
0.0%
0.5%
1.0%
1.5%
2.0%
2.5%
3.0%
3.5%
4.0%
0
200
400
600
800
1 000
1 200
Australia Japan Korea New Zealand
CAAG
R 20
14-20
Dema
nd (T
Wh)
2014
2020
Demand (righthand axis)
GDP(right hand axis)
Sources: IEA (2015c), Medium-Term Gas Market Report 2015; IMF (International Monetary Fund) (2015), World Economic Outlook, April 2015. The majority of the regional growth comes from Japan, supported by a robust project pipeline that has emerged under the current FiT scheme. Still, a number of uncertainties characterise the outlook in Japan, including grid constraints, the progress of planned electricity market reforms and uncertainties over future incentives for new projects as support policies are transitioned away from the current FiT scheme. Despite their role in long-term renewable planning, the expansion of other renewable technologies, such as bioenergy, wind and geothermal, in Japan is expected to be gradual. The details of the Japan forecast are discussed in the country dashboard following this section.
Table 6 Asia Oceania countries main targets and support policies for renewable electricity
OECD Asia Oceania Regulatory support Economic support
Country
Ren
ewab
le
ener
gy la
w
Targ
ets
Quo
tas/
RPS
FiT/
Feed
-in
prem
ium
Cap
ital g
rant
s an
d su
bsid
ies
Soft
loan
s
Tax
relie
f
Net
met
erin
g
Trad
able
gre
en
cert
ifica
tes
Car
bon
pric
ing
Auc
tion
sche
mes
Australia ✔ ● ✓ ✔ ✔ ✔ Israel ✔ ✔ ✔ ✔ ✔ Japan ✔ ✔ ✔ ✔ ✔ Korea ✔ ● ✔ ✔ New Zealand ✔ ✔
Policy highlights • Australia, in 2015, revised down its Large-Scale Renewable Energy Target (LRET) from 45 000 GWh to
33 000 GWh to be reached by 2020 and the LRET will no longer be subject to periodic reviews. • Korea postpones achievement of its RPS goal of 10% electricity production from 2020 to 2022.
Note: ✔ = national-level policy; ✓ = state/provincial-level policy, ● = recently updated, X = to be phased out, ⓪ = recently introduced; ■ –under review. For further information, refer to IEA/IRENA Policies and Measures Database for Renewable Energy.
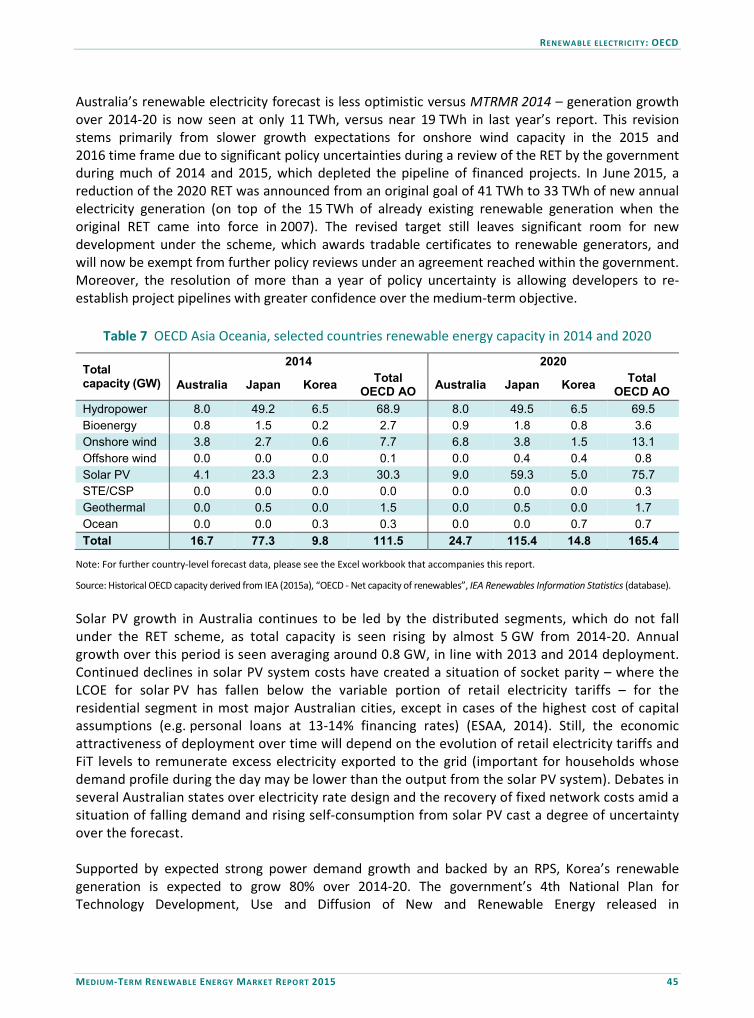
RENEWABLE ELECTRICITY: OECD
MEDIUM-TERM RENEWABLE ENERGY MARKET REPORT 2015 45
Australia’s renewable electricity forecast is less optimistic versus MTRMR 2014 – generation growth over 2014-20 is now seen at only 11 TWh, versus near 19 TWh in last year’s report. This revision stems primarily from slower growth expectations for onshore wind capacity in the 2015 and 2016 time frame due to significant policy uncertainties during a review of the RET by the government during much of 2014 and 2015, which depleted the pipeline of financed projects. In June 2015, a reduction of the 2020 RET was announced from an original goal of 41 TWh to 33 TWh of new annual electricity generation (on top of the 15 TWh of already existing renewable generation when the original RET came into force in 2007). The revised target still leaves significant room for new development under the scheme, which awards tradable certificates to renewable generators, and will now be exempt from further policy reviews under an agreement reached within the government. Moreover, the resolution of more than a year of policy uncertainty is allowing developers to re-establish project pipelines with greater confidence over the medium-term objective.
Table 7 OECD Asia Oceania, selected countries renewable energy capacity in 2014 and 2020
Total capacity (GW)
2014 2020
Australia Japan Korea Total OECD AO Australia Japan Korea Total
OECD AO Hydropower 8.0 49.2 6.5 68.9 8.0 49.5 6.5 69.5 Bioenergy 0.8 1.5 0.2 2.7 0.9 1.8 0.8 3.6 Onshore wind 3.8 2.7 0.6 7.7 6.8 3.8 1.5 13.1 Offshore wind 0.0 0.0 0.0 0.1 0.0 0.4 0.4 0.8 Solar PV 4.1 23.3 2.3 30.3 9.0 59.3 5.0 75.7 STE/CSP 0.0 0.0 0.0 0.0 0.0 0.0 0.0 0.3 Geothermal 0.0 0.5 0.0 1.5 0.0 0.5 0.0 1.7 Ocean 0.0 0.0 0.3 0.3 0.0 0.0 0.7 0.7 Total 16.7 77.3 9.8 111.5 24.7 115.4 14.8 165.4
Note: For further country-level forecast data, please see the Excel workbook that accompanies this report.
Source: Historical OECD capacity derived from IEA (2015a), “OECD - Net capacity of renewables”, IEA Renewables Information Statistics (database). Solar PV growth in Australia continues to be led by the distributed segments, which do not fall under the RET scheme, as total capacity is seen rising by almost 5 GW from 2014-20. Annual growth over this period is seen averaging around 0.8 GW, in line with 2013 and 2014 deployment. Continued declines in solar PV system costs have created a situation of socket parity – where the LCOE for solar PV has fallen below the variable portion of retail electricity tariffs – for the residential segment in most major Australian cities, except in cases of the highest cost of capital assumptions (e.g. personal loans at 13-14% financing rates) (ESAA, 2014). Still, the economic attractiveness of deployment over time will depend on the evolution of retail electricity tariffs and FiT levels to remunerate excess electricity exported to the grid (important for households whose demand profile during the day may be lower than the output from the solar PV system). Debates in several Australian states over electricity rate design and the recovery of fixed network costs amid a situation of falling demand and rising self-consumption from solar PV cast a degree of uncertainty over the forecast. Supported by expected strong power demand growth and backed by an RPS, Korea’s renewable generation is expected to grow 80% over 2014-20. The government’s 4th National Plan for Technology Development, Use and Diffusion of New and Renewable Energy released in

RENEWABLE ELECTRICITY : OECD
46 MEDIUM-TERM RENEWABLE ENERGY MARKET REPORT 2015
September 2014 has shifted Korea’s binding RPS goal of 10% electricity production from renewable sources from 2020 to 2022. Still, Korea is forecast to have an expansion of offshore technologies (wind and ocean) over the forecast period (see Box 2).
Table 8 OECD Asia Oceania main drivers and challenges to renewable energy deployment
Country Drivers Challenges
Japan Strong policy environment backed by generous FiTs and need for new generation. Potential for increased system flexibility in the electricity sector through planned reforms.
Variable renewable grid and system integration in certain areas. Maintaining a dynamic approach to FiT adjustments and uncertainties over the evolution of future support scheme. Implementation of planned electricity sector reforms and new strategic plan.
Korea Need for generation to meet fast-growing demand. Long-term policy orientation, backed by RPS.
Concentrated power system presents investment barriers to new entrants. Non-economic barriers; long lead times associated with permitting and grid connections.
Australia
Attractive economics for distributed solar PV deployment for self-consumption. Clarification of 2020 large-scale renewable target helps some stability return to market. Good economic attractiveness for renewable technologies versus new fossil fuel builds.
Despite clarification, reduction in the 2020 large-scale renewable target suggests overall lower development than previously. Slower demand growth and overcapacity in the power sector.
Medium-term outlook – regional accelerated case summary
Overall, renewable capacity growth in OECD Asia Oceania could be 30% higher over 2014-20 versus the main case with certain policy and market enhancements.
Figure 11 OECD Asia Oceania renewable capacity additions, main versus accelerated case
0 10 20 30 40 50 60 70 80
Total
Other
Solar PV
Wind
Capacity growth 2014-20 (GW)
Main case
Acceleratedcase
In Japan, the main enhancement pertains to the pace and implementation of measures to integrate solar PV and wind into the grid. Moreover, with relatively high renewable technology costs compared with international standards, Japanese deployment could greatly benefit from faster reductions in renewable technology costs with dynamic adjustments to incentive levels and reduction in non-
RENEWABLE ELECTRICITY: OECD
MEDIUM-TERM RENEWABLE ENERGY MARKET REPORT 2015 47
economic barriers. Both these enhancements would help unlock a portion of the very large pipeline of approved projects for solar PV that has emerged over the past 18 months as well as stimulate greater development in onshore and offshore wind. Notably, solar PV cumulative capacity could be up to 10 GW higher in 2020 than under the main case. In Australia, the upside to renewable deployment remains limited given the recent policy decision to substantially revise down the RET. Though now that the uncertainty with the RET review has been resolved, it is possible that a greater portion of the existing pipeline of announced onshore wind projects may secure financing and PPAs – in such a case, onshore wind capacity could be higher in 2020 versus the main case. Notable upside potential also exists for solar PV, particularly on the distributed side. More favourable economics and a greater uptake of distributed solar PV for self-consumption could result in cumulative solar PV capacity in 2020 that is 1 GW to 2 GW higher than the main case. In Korea, renewable deployment could be higher over the medium term. Most of the upside pertains to onshore and offshore wind. More streamlined grid connection and permitting procedures could help onshore wind, while faster-than-expected cost reductions could spur higher offshore wind.
Box 1 Advances in Japan’s power sector reforms to guide longer-term renewable scale-up
The year 2015 has marked the inauguration of significant reforms in the Japanese electricity market that aim to facilitate the deployment and integration of renewables over the next decade. The Organization for Cross-regional Coordination of Transmission Operators started its service operation in spring 2015. This results from the enforcement of the first step of electricity market reform. Several grid integration procedures in terms of the inter-regional grid usage that the new organisation will develop will help renewable electricity suppliers to introduce variable renewables systems. The introduction of “full electricity retail competition to the residential sector” is to be implemented in spring 2016. This is considered as the second step of the reform. The third step will include unbundling the transmission/distribution sectors of vertically integrated EPCOs, which have controlled the ten balancing areas in Japan. The third step was enacted in June 2015 and is to be enforced on 1 April 2020.
One of the big uncertainties of the reform is how electricity prices will evolve. It will depend on how well appropriate price competition will work in the new liberalised market. The “Electricity Market Surveillance Commission” started its operation to monitor the market competition in September 2015. The market transformation will likely greatly support renewable deployment in Japan, in particular, the introduction of variable renewables through greater optimisation of grid operations. Some EPCOs’ demonstration projects have installed large-scale storage batteries (60 MWh and 20 MWh) in electric power substations, and have assessed how to operate the batteries to better integrate variable renewable generation in the control areas.

RENEWABLE ELECTRICITY : OECD
48 MEDIUM-TERM RENEWABLE ENERGY MARKET REPORT 2015
Japan dashboard
Figure D.7 Japan annual net additions to renewable capacity (2013-20)
0
2
4
6
8
10
12
2013 2014 2015 2016 2017 2018 2019 2020
Annu
al ad
dition
s (GW
)
Ocean
STE
Geothermal
Solar PV
Offshore Wind
Onshore Wind
Bioenergy
Hydropower
Source: Historical OECD capacity derived from IEA (2015a), “OECD - Net capacity of renewables”, IEA Renewables Information Statistics (database).
Figure D.8 Japan electricity transmission system
Notes: kV = kilovolt; Hz = hertz.

RENEWABLE ELECTRICITY: OECD
MEDIUM-TERM RENEWABLE ENERGY MARKET REPORT 2015 49
Medium-term forecast: Japan main case
Japan’s renewable generation should expand by 60 TWh over 2014-20, with a strong push to diversify the power sector backed by robust incentives. The forecast is more optimistic versus MTRMR 2014 due to higher solar PV. Realising this outlook requires progress in grid integration, clarity over future support schemes and a dynamic approach to adjustments to reduce costs. The power market will remain tight, with diversification needs. While minimal demand growth is expected over 2014-20, uncertainty remains over the return of nuclear power. At the time of writing, only 5 of Japan’s 48 nuclear reactors had received approval to restart, and only one had done so. In line with the IEA Medium-Term Gas Market Report 2015, only 10 GW in total is assumed on line by 2020, but there are upside risks that could result in higher nuclear generation (IEA, 2015c). Natural gas (i.e. LNG) has replaced about two-thirds of the lost nuclear output, and oil-fired generation remains elevated. While a combination of increased renewables, particularly solar PV, and reduced demand have recently helped displace output from costly oil-fired generation, significant declines in LNG and oil prices over the past year have made the economics of thermal generation more attractive. Still, renewable deployment over the medium term will be determined more by the evolution of the FiT scheme and grid integration measures. The FiT scheme has stimulated a large project pipeline. As of January 2015, approved but not yet commissioned solar PV capacity under the scheme stood at 72 GWAC. Much of this (95%) is utility and commercial scale. Since an application rush in March 2014 (ahead of a FiT level change), new approvals have totalled 9 GWAC (mostly commercial), and 5 GWAC of previously approved utility applications were cancelled due to missed deadlines to secure grid connections, land or equipment. Stricter rules now require applications to have already secured grid-connection contracts and reduce the ability of approved projects to change equipment. Despite robust FiT levels, the project pipeline for wind, biomass, hydropower and geothermal remains underdeveloped, owing to persistent non-economic barriers, including stringent environmental permitting requirements for onshore wind and geothermal. Still, significant projects have emerged, with several large-scale onshore and offshore wind farms receiving financing in 2014. Grid integration of variable renewables remains challenging, though the power sector is prioritising their uptake. Significant approved solar PV is concentrated in a few balancing areas with limited interconnection. In sunny Kyushu, the approved project pipeline exceeds the island peak load. Congestion concerns prompted EPCOs in five utility areas to temporarily stop reviewing grid access applications of projects (10 kW and up) in autumn 2014. Seven EPCOs subsequently assessed the capacity that could be integrated into service areas (24 GW total), but no limits have been assessed for the three largest demand areas (Tokyo, Kansai, Chubu). Based on this, METI revised rules in January allowing EPCOs to curtail generation, without compensation, from renewable generators up to 360 hours per year for PV; for installations beyond assessed capacity limits, some EPCOs could curtail with no limit. These regulations introduce uncertainty over expected remuneration for new projects. Still, curtailment of variable renewables would occur only after the use of other balancing measures, e.g. reduction in flexible generation, use of pumped-hydro storage (Japan has the highest share of pumped-hydro storage in the world). Overall, the prioritisation of renewables in operations by EPCOs and overarching electricity market reforms will be key to realising significant new PV deployment.

RENEWABLE ELECTRICITY : OECD
50 MEDIUM-TERM RENEWABLE ENERGY MARKET REPORT 2015
Japan
Table D.3 Solar PV capacity vs assessed integration capacity and demand, by EPCO, Jan 2015
GWAC Hokkaido Tohoku Tokyo Hokuriku Chubu Kansai Chugoku Shikoku Kyushu Okinawa Total
Installed PV (FiT) 0.5 1.1 3.9 0.3 2.7 1.9 1.3 0.9 3.5 0.2 16.3
Approved PV 2.8 11.8 15.6 1.0 8.7 5.4 5.5 2.6 17.6 0.6 71.6
Residential 0.0 0.3 1.0 0.1 0.7 0.5 0.3 0.1 0.5 0.0 3.5
Commercial 0.9 2.2 8.2 0.5 4.4 2.7 2.3 1.5 8.5 0.5 31.6
Utility 1.9 9.3 6.4 0.5 3.6 2.2 2.9 1.0 8.5 0.1 36.5
Assessed grid capacity for PV (Dec 2014)
1.2 5.5 NA 0.7 NA NA 5.6 2.2 8.2 0.4 NA
Peak demand (2013) 5.4 14.0 50.9 5.3 26.2 28.2 11.1 5.5 16.3 1.5 164.4
Min. load (2013) 3.1 7.9 20.7 2.5 9.1 11.7 5.5 2.2 7.9 0.7 71.3
Sources: IEA analysis with data from METI (2014), Estimation Result of Grid Capacities by EPCOs in Working Group on Grid Connection of Renewable Energy; METI (2015), Renewable Energy Equipment Certification Status, January 2015; FEPC (2015b), Electricity Statistics Information.
Figure D.9 Japan estimated solar PV LCOE ranges versus FiT and end-user price levels
0
100
200
300
400
500
600
2012 2013 2014 2015
USD
2014
/MWh
Solar PV below 10 kW (residential scale)
Feed-in tariff Average household power price (ex tax)
0
100
200
300
400
500
600
2012 2013 2014 2015
Solar PV above 10 kW (commercial and utility scale)
Average industry power price (ex tax) Notes: LCOEs are beginning year; FiT as of mid-year; end-user prices are annual averages. End-user prices for 2015 are at 2014 levels. The ranges reflect low-cost, typical and high-cost projects, which vary primarily due to differences in system costs, resources and the cost of financing. In 2014, JPY/USD = 106.
Table D.4 Japan renewable power capacity
GW 2014 2016 2018 2020 2020*
Hydropower 49.2 49.5 49.5 49.5 49.5
Bioenergy 1.5 1.6 1.7 1.8 1.8
Onshore wind 2.7 3.0 3.4 3.8 4.6
Offshore wind 0.0 0.1 0.2 0.4 0.6
Solar PV 23.3 41.3 52.3 59.3 69.3
STE/CSP 0.0 0.0 0.0 0.0 0.0
Geothermal 0.5 0.5 0.5 0.5 0.5
Ocean 0.0 0.0 0.0 0.0 0.0
Total 77.3 96.1 107.7 115.4 126.4
* Accelerated case.
• Drivers - strong policy environment backed by generous FiTs and need for new generation - potential for increased system flexibility in the electricity sector through planned reforms.
• Challenges - integration of variable renewables in certain regions and maintaining a dynamic approach to support scheme adjustments - implementation of new electricity sector reforms and new strategic plan.

RENEWABLE ELECTRICITY: OECD
MEDIUM-TERM RENEWABLE ENERGY MARKET REPORT 2015 51
Renewable costs remain high compared with international standards, but economics are improving. Though solar PV system prices should continue falling, module prices remain relatively high, due to a complex distribution supply chain, preference for domestically produced equipment and generous incentives. Yet greater foreign supplier entry and increased module imports are helping to reduce margins, and financing costs are low by global standards. System costs also remain high due to tight labour demand associated with reconstruction from the Great East Japan Earthquake. Land constraints and grid constraints are a significant issue limiting the scale (and boosting the costs) of onshore wind. The land factor and a dedicated FiT from 2014 are stimulating more offshore wind (fixed-bottom foundation) development, but technical and regulatory challenges persist. Still, fossil fuel generation costs remain high, even with falling oil and LNG prices over the past year. As such, the LCOE for onshore wind, without incentives, compares favourably to new and existing mid-merit generation while that for utility-scale PV compares to new peaking plants and approaches that of existing peaking plants. Solar PV residential and commercial LCOEs are seen falling to near current household and industry retail prices, potentially creating incentives for deployment under self-consumption. Cost-effective policies remain key for economic attractiveness and deployment over time. While FiT levels, after revisions in April, remain attractive relative to the LCOE of new solar PV and onshore wind, Japanese policy makers face the challenge of dynamically adjusting incentives to bring renewables costs closer to other generation sources while managing the total programme outlays and reducing non-economic barriers. Moreover, policy uncertainty remains over the longer-term status of the FiT scheme for new projects (the original legal framework requires a review at least every three years). METI is considering a number of options to stimulate balanced deployment in a cost-effective manner, but few specifics have emerged. Over 2014-20, solar PV is expected to expand by over 36 GW to reach cumulative capacity near 60 GW in 2020, with deployment shifting more towards the distributed segment given land constraints and improving economics for self-consumption. But the deployment pattern may be volatile, with high levels in 2015-16 followed by a shrinking market, due to assumed grid constraints. Onshore wind deployment is likely to proceed slowly, growing by just 1 GW over 2014-20, while offshore wind growth of only 0.3 GW is expected given the slow progress, to date, of the sector. Some hydropower, bioenergy and geothermal developments are also expected.
Medium-term forecast: Japan accelerated case
Under an accelerated case, the government would need to make rapid progress in implementing overarching electricity reforms, introducing greater market access, reducing non-economic barriers and achieving stronger build-out of the grid and other forms of flexibility, such as storage. In such a case, solar PV capacity could be up to 10 GW higher in 2020 than under the main case, with a more stable deployment profile over time. Increased deployment for purposes of self-consumption and increased uptake by high-rise buildings could also spur faster-than-expected solar PV development. Onshore wind deployment could also benefit from faster reductions in renewable technology costs and less onerous permitting requirements. Offshore wind could reach higher levels with a faster-than-expected deployment stemming from greater cost reductions and the potential commercialisation of floating turbines.

RENEWABLE ELECTRICITY : OECD
52 MEDIUM-TERM RENEWABLE ENERGY MARKET REPORT 2015
Box 2 Asia Oceania offshore renewables: Long-term ambitions but challenges to near-term scale-up
OECD Asia Oceania might be one of the most promising regions for offshore energy. The advanced offshore energy technologies here include floating structures for offshore wind, wave, tidal current, tidal range, ocean thermal energy conversion (OTEC) and salinity gradient. The technologies are in the research, development and demonstration (RD&D) stage at this moment. But the RD&D projects on offshore energy in Japan and Korea are significant considering the scale and stage.
Offshore wind
In general, wind deployment in Japan remains challenged by location restrictions. The land with good wind resource has limited onshore wind from the mid- to long-term perspective, in particular located in north Japan where demand is relatively low. The shallow water appropriate to fixed-bottom foundation offshore wind is also relatively limited as Japan is surrounded by deep ocean. To combat this, Japan has demonstrated two projects on floating structures for offshore wind in the ocean. The 2 MW turbine floating structure for offshore wind project was installed in Nagasaki, southwest Japan, in June 2012. It was located about 1 kilometre (km) offshore, and water depth around the site is about 100 metres (m). The other floating structure for offshore wind project is in Fukushima, northeast Japan. This offshore wind project consists of 2 MW turbines and 7 MW turbines. The 7 MW turbines will be installed in fiscal year 2015, while 2 MW turbines were installed in 2013. The world’s largest floating structures for offshore wind projects are located 20 km from the coastline, and water depth is more than 100 m. Japan’s long-term planning sees cumulative offshore wind of 820 MW by 2030, out of about 10 GW of total onshore and offshore wind deployment. But, to date, high system costs, lack of port infrastructure and lack of industry experience have hindered offshore wind installation in Japan.
Korean offshore wind project has also faced significant obstacles. The ambitious fixed-bottom foundation offshore wind project was initiated in 2011. The initial plan of the project was a 2.5 GW deployment in the sea to the southwest of Korea by 2019, for about 10 years. The first stage of the project was 100 MW wind turbines at a water depth of about 10 m, followed by 400 MW at a depth of 10-13 m in 2016 as phase two, and 2 000 MW at a depth of about 30 m in 2019, as phase three. The offshore wind project, however, has been delayed, because local communities have raised concerns over the construction, and some domestic manufacturers have withdrawn from the market, due to changes in business strategies. The updated offshore wind farm project now foresees 60 MW by 2018, 400 MW by 2020 and 2 000 MW by 2023.
The challenges related to offshore wind in OECD Asia Oceania can be summarised as follows: improving wind system efficiency performance; industry experience, including establishment of profitable business models; and improving communication with the local community, including fisheries associations. These challenges would require long-term RD&D policy support and increased deployment at scale. The development of guidelines for consensus building with stakeholders is also necessary. In addition, wind resource maps in the ocean area and zoning maps showing places to install offshore wind would allow offshore wind developers to plan new projects. Furthermore, it would also be important that support policies that stimulate deployment of floating structures for offshore wind. The offshore wind FiT in Japan implemented in 2014 has included only fixed-bottom foundations to date.
Ocean energy
Both Japan and Korea have excellent ocean resource potential and are interested in fostering new manufacturing industries. The development of ocean energy means the creation of new industry developments, as ocean energy has been at the RD&D stage.
RENEWABLE ELECTRICITY: OECD
MEDIUM-TERM RENEWABLE ENERGY MARKET REPORT 2015 53
Box 2 Asia Oceania offshore renewables: Long-term ambitions but challenges to near-term scale-up (continued)
According to the 4th Basic Plan for Technology Development, Application, and Deployment of New and Renewable Energy (2014-35) in Korea, which was published in September 2014, the national goal of renewable energy is 11% of total primary energy supply in 2035. Out of this, the national target for ocean energy is 1.3% of the national renewable target in 2035, which means that ocean energy would account for 0.1% of total primary energy supply in 2035. The RPS in Korea, which requires renewable electricity generation to increase from 2% of total electricity generation in 2012 to up to 10% in 2022, has included tidal barrage in its scope.
The 250 MW tidal barrage plant commissioned in Korea in 2012 is one of the world’s largest plants in operation. The ocean energy demonstration projects funded by Korean government organisations completed their installations in 2014. The entire construction process of a wave energy oscillating water column (OWC) plant in Yongsoo, Jeju Island, was completed in November 2014. The demonstration plant was equipped with two 250 kW turbine generators. The 200 kW high-temperature-difference OTEC plant was installed in Goseong in December 2014, and is expected to start operation in a few years. The OTEC power plant is equipped with a wood chip gasification power plant to generate heat.
Japan selected test fields to demonstrate national offshore energy projects in July 2014 and April 2015. They are in Niigata for a floating structure for offshore wind, wave and tidal current; in Saga and Nagasaki for tidal current and a floating structure for offshore wind; in Okinawa for OTEC; and in Iwate for wave and a floating structure for offshore wind. The selection by the government is expected to enhance RD&D projects, taking into account that offshore technology needs local communities’ consensus. The 15 kW capacity wave energy systems (OWC) in the demonstration project were installed in April 2015. Moreover, Japan has promoted research and development projects for components development and for performance improvements in ocean energies.
Similar to floating structures for offshore wind, ocean energies require long lead times for projects. There is room to improve the efficiency performance of generation and reduce cost of capital, and operation and maintenance. Hence it is significant that stable and long-term RD&D projects supported by governments have continued, in order to facilitate the developments of ocean energy technologies. Regulatory frameworks or guidelines authorised by governments also help get the consent for development from local communities including fisheries associations.
OECD Europe Recent trends Renewable power in OECD Europe increased by around 2% in 2014 to reach 1 120 TWh, or 32% of total power generation, up from 31% in 2013. This rise occurred even as total power sector output was stable. In the European Union member states (EU-28), renewable generation grew by over 3%, reaching 916 TWh. OECD Europe represented over one-fifth of global electricity generation from renewables and almost 40% of non-hydro output. In 2014, new additions in OECD Europe decreased to 21 GW from over 24 GW in 2013, the lowest annual market since 2009. This is mainly due to new solar PV capacity additions falling by over 35% year-on-year and reduced additions in hydropower. Meanwhile, onshore wind additions reached a new historical peak with over 11 GW installed in 2014. Offshore wind additions were relatively steady, though generation increased over 20% to 24 TWh as the capacity installed in 2013 was fully operational over 2014.
Germany led the renewable expansion in Europe with generation rising by 5% to 166 TWh, or 27% of total generation. In 2014, Germany added 5.3 GW new net wind (onshore and offshore) capacity,

RENEWABLE ELECTRICITY : OECD
54 MEDIUM-TERM RENEWABLE ENERGY MARKET REPORT 2015
close to 50% of all new turbines erected in OECD Europe, as some developers rushed to finish projects before expected policy changes. Gross additions were even larger, as the repowering market in Germany reached over 1.1 GW driven by larger turbines with an average capacity of 2.8 MW while the country decommissioned around 365 MW (Deutche Windguard, 2015). Wind power’s share in overall generation increased to 9% and stood at just over 56 TWh. Offshore wind deployment was lower than expected (+530 MW) as a few projects could not get timely grid connections. Meanwhile, solar PV new additions slowed to 1.9 GW in 2014.
Italy’s renewable energy generation increased from 114 TWh in 2013 to 120 TWh in 2014, mainly due to higher hydropower and biomass generation. The country’s new renewable power additions fell in 2014 with the majority from solar PV (around 0.4 GW), driven mostly by net metering and self-consumption. Onshore wind (0.1 GW) and bioenergy (10 MW) each added moderate capacity under Italy’s tender scheme for feed-in premiums. In France, both onshore wind and solar PV additions were strong. The final approval of the French FiT as permissible under state aid guidelines by the European Commission and the easing of administrative issues boosted onshore wind additions to over 1 GW. Solar PV additions stood at over 930 MW. In 2014, France’s overall renewable generation is estimated to be 6% lower than in 2013, mainly due to lower hydropower generation.
In the United Kingdom, renewable generation rose over 18% year-on-year to 67 TWh. In 2014, the United Kingdom added around 3.8 GW of new renewable capacity. Solar PV additions rose to 2.3 GW, with a rush of installations before anticipated changes to the Renewable Obligation Certificate (ROC) scheme in April 2015. First quarter 2015 installations, at over 1.5 GW, were also strong. Wind capacity rose by 1.6 GW in 2014, and offshore wind represented near half of these additions. However, unfavourable weather conditions pushed back the commissioning of some large-scale projects. Total wind represented 9.5% of UK power generation in 2014, 1% higher than in 2013. In early 2015, the first auction took place under the Contract for Difference (CFD) scheme, contracting almost 1.2 GW of offshore wind at prices ranging from GBP 115/MWh to GBP 120/MWh (USD 175/MWh-USD 185/MWh) and smaller amounts of onshore wind and solar PV.
Among other OECD Europe countries, Sweden marked the largest onshore wind additions with the installation of over 1 GW capacity, followed by Turkey (+0.8 GW). After having installed over 800 MW in 2013, Poland’s additions decreased to 440 MW in 2014 mainly due to policy uncertainty over the new incentive regime, which was approved only in March 2015. Onshore wind additions in Austria continued to grow and stood at over 410 MW in 2014. Other important onshore wind markets were Belgium (153 MW), Finland (184 MW) and Ireland (222 MW).
Ten countries in Europe registered solar PV deployment of at least 0.1 GW, though significant expansions are occurring in fewer markets than in the past amid a general slowdown in annual European solar PV additions. Notable developments not covered above occurred in the Netherlands (+0.4 GW), where deployment is driven by a net metering scheme, and Switzerland (+0.3 GW), where small-scale installations are driven by self-consumption with a capital cost rebate and larger rooftop systems benefit from FiTs, which are due to be reduced in 2015. Overall, European solar PV deployment continues to shift towards smaller-scale solar PV installations; in 2014, residential- and commercial-scale projects accounted for an estimated 75% of total solar PV capacity growth. Medium-term outlook – regional main case summary Overall, renewable generation in OECD Europe is expected to grow by nearly 25%, over 2014-20. The number of OECD Europe countries and variety of deployment patterns, policy frameworks and economic
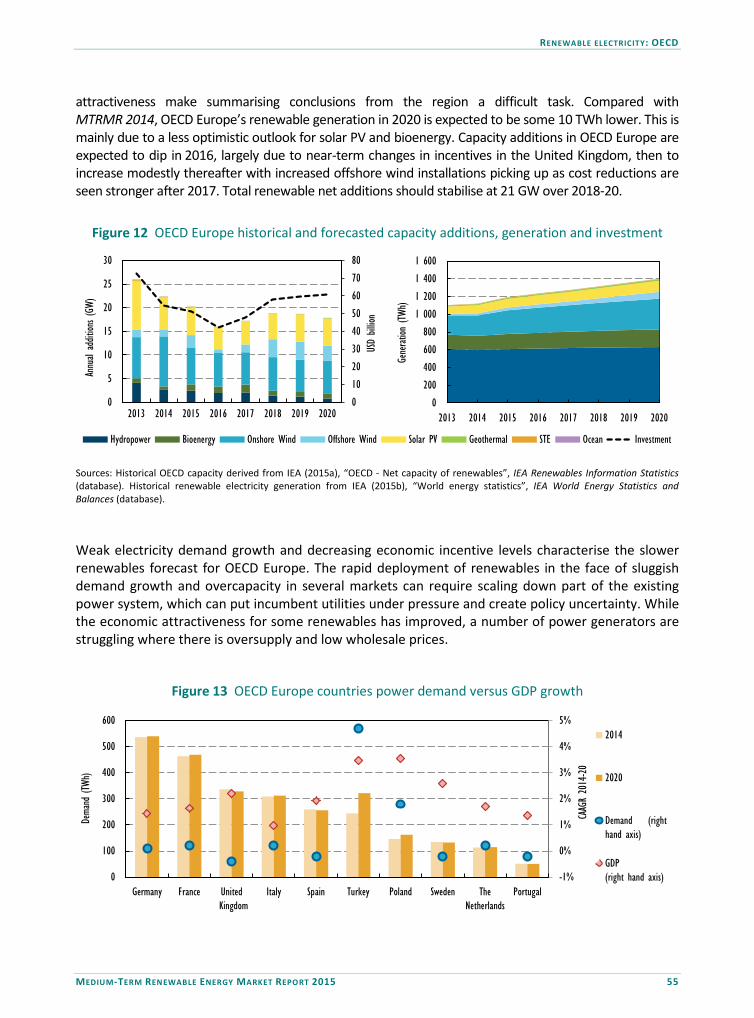
RENEWABLE ELECTRICITY: OECD
MEDIUM-TERM RENEWABLE ENERGY MARKET REPORT 2015 55
attractiveness make summarising conclusions from the region a difficult task. Compared with MTRMR 2014, OECD Europe’s renewable generation in 2020 is expected to be some 10 TWh lower. This is mainly due to a less optimistic outlook for solar PV and bioenergy. Capacity additions in OECD Europe are expected to dip in 2016, largely due to near-term changes in incentives in the United Kingdom, then to increase modestly thereafter with increased offshore wind installations picking up as cost reductions are seen stronger after 2017. Total renewable net additions should stabilise at 21 GW over 2018-20.
Figure 12 OECD Europe historical and forecasted capacity additions, generation and investment
0
200
400
600
800
1 000
1 200
1 400
1 600
2013 2014 2015 2016 2017 2018 2019 2020
Generat
ion (T
Wh)
0
10
20
30
40
50
60
70
80
0
5
10
15
20
25
30
2013 2014 2015 2016 2017 2018 2019 2020
USD
billio
n
Annu
al ad
dition
s (GW
)
Hydropower Bioenergy Onshore Wind Offshore Wind Solar PV Geothermal STE Ocean Investment
Sources: Historical OECD capacity derived from IEA (2015a), “OECD - Net capacity of renewables”, IEA Renewables Information Statistics (database). Historical renewable electricity generation from IEA (2015b), “World energy statistics”, IEA World Energy Statistics and Balances (database). Weak electricity demand growth and decreasing economic incentive levels characterise the slower renewables forecast for OECD Europe. The rapid deployment of renewables in the face of sluggish demand growth and overcapacity in several markets can require scaling down part of the existing power system, which can put incumbent utilities under pressure and create policy uncertainty. While the economic attractiveness for some renewables has improved, a number of power generators are struggling where there is oversupply and low wholesale prices.
Figure 13 OECD Europe countries power demand versus GDP growth
-1%
0%
1%
2%
3%
4%
5%
0
100
200
300
400
500
600
Germany France United Kingdom
Italy Spain Turkey Poland Sweden TheNetherlands
Portugal
CAAG
R 20
14-20
Dema
nd (T
Wh)
2014
2020
Demand (righthand axis)
GDP(right hand axis)

RENEWABLE ELECTRICITY : OECD
56 MEDIUM-TERM RENEWABLE ENERGY MARKET REPORT 2015
Turkey and Poland represent two exceptions to this general trend where electricity demand over the medium term is expected to grow fast. In these countries, renewables should contribute to meeting new generation needs. Meanwhile, the replacement of ageing plants (coal and nuclear) guides the UK power sector, with renewables playing an important role to meet new generation needs.
Table 9 OECD Europe main drivers and challenges to renewable energy deployment
Country Drivers Challenges
Germany Strong policy environment with ambitious decarbonisation aims. Growing attractiveness of solar PV for self-consumption.
A need to balance affordability and market design challenges in reforms. Continued build-out of grid.
United Kingdom
Ambitious renewable targets backed by support measures under CFD scheme. Decarbonisation agenda and need to replace ageing conventional generation fleet.
Some uncertainties remain over policy environment, including support for new onshore wind. Financing growing project portfolio and increasing project complexity.
Turkey Need for new capacity to meet demand. Good competitiveness of renewable sources.
Overall low financial supports and additional costs for grid connection and renewable licences. Cost and availability of financing.
Italy Strong diversification aims through national energy strategy. Good economic attractiveness of solar PV for self-consumption.
Overcapacity in the power sector. Incentive changes to new and existing solar PV installations larger than 200 kW. Capacity quotas under current auction/registry system and uncertainty over post-2015 details.
France Potential need for new capacity to meet plant retirements and rising peak demand. Tenders for offshore wind and solar PV.
Reducing non-economic barriers. Clarifying future policy framework under transition énergétique.
Note: Only the expected top five European generation growth markets are included here. Renewables account for the vast majority of new power generation additions, even as the policy environment continues to evolve. An EU-28 target agreed upon in 2014 of at least 27% of renewables in final energy consumption by 2030, up from 20% in 2020, is expected to guide longer-term momentum. The European Commission anticipates that the share of renewables in the electricity sector would increase to a level of at least 45% in 2030. But the 2030 target does not propose setting binding national renewables targets. This raises questions about the responsibility for the delivery of the EU-wide target. The governance framework to be developed is therefore crucial (IEA, 2014). A number of OECD Europe countries are transitioning from FiTs/feed-in premiums or green certificates to tender mechanisms and contracts for difference. In Germany, onshore wind auctions are planned in 2016-17. Poland’s new renewable energy law favoured tender schemes to replace its green certificate system by 2016. In April 2015, Spain’s industry ministry announced upcoming tenders for onshore wind (500 MW) and bioenergy (200 MW). However, the past introduction of retroactive policy changes for renewable electricity assets has had a negative effect on investor confidence (see MTRMR 2014 for background). To attract further investment in renewables under the current support scheme, policy transparency, predictability and certainty would be important.

RENEWABLE ELECTRICITY: OECD
MEDIUM-TERM RENEWABLE ENERGY MARKET REPORT 2015 57
Notes: ✔ = national-level policy; ✓ = state/provincial-level policy, ● = recently updated, ► = to be phased out, ⓪ = recently introduced; ■ = under review. For further information, refer to IEA/IRENA Policies and Measures Database for Renewable Energy: www.iea.org/policiesandmeasures/renewableenergy.
Table 10 OECD Europe countries main targets and support policies for renewable electricity
OECD Europe Regulatory support Economic support
Country
Ren
ewab
le
ener
gy la
w
Targ
ets
Quo
tas/
RPS
FiT/
Feed
-in
prem
ium
Cap
ital g
rant
s an
d su
bsid
ies
Soft
loan
s
Tax
relie
f
Net
met
erin
g
Trad
able
gr
een
cert
ifica
tes
Car
bon
pric
ing
Auc
tion
sche
mes
Austria ✔ ✔ ✔ ✔ ✔ Belgium ✔ ✔✓ ✔✓ ✓ ✔✓ Czech Republic ✔ ✔ ✔ ✔ Denmark ✔ ✔ ✔ ✔ ✔ ✔ ✔ ✔ ✔ Estonia ✔ ✔ ✔ ✔ Finland ✔ ● ✔ France ✔ ● ● ✔ ✔ ✔ ✔ Germany ✔ ✔ ✔ ✔ ✔ ✔ Greece ✔ ✔ ● ● ✔ ✔ Hungary ✔ ✔ ✔ Iceland ✔ ✔ Ireland ✔ ✔ ✔ Italy ✔ ✔ ● ✔ ✔ ✔ Luxembourg ✔ ✔ ✔ ✔ ✔ Netherlands ✔ ✔ ✔ ✔ ✔ Norway ✔ ✔ ✔ ✔ ✔ Poland ⓪ ✔ ► ⓪ ✔ ✔ ⓪ ► ⓪ Portugal ✔ Slovak Republic ✔ ✔ ✔ ✔ ✔ Slovenia ✔ ✔ ✔ ✔ Spain ✔ Sweden ✔ ✔ ✔ ● ✔ ✔ Switzerland ✔ ✔ ✔ Turkey ✔ ✔ ✔ United Kingdom ✔ ► ● ✔ ✔ ► ●
Policy highlights • Finland reviews its FiT scheme. • France secured its FiT for onshore wind and adopted a 32% renewable energy target in gross final energy
consumption to be reached by 2030, and a 40% target for renewable electricity by 2030. • Germany adopted EEG 2014 to better control expansion of renewables and limit the price increase in the
electricity tariff. EEG 2014 defined new expansion corridors for each renewable energy technology. Plans for a tender system to award support were introduced.
• Greece adjusted FiT levels for operating projects (solar PV, wind and co-generation) and capped new solar PV capacity at 20 MW per year until 2020.
• Italy introduced incentive changes to new and existing solar PV installations above 200 kW and 5% tax on self-consumed solar PV electricity.
• Poland adopted the Renewable Energy Bill introducing electricity auction scheme for large-scale projects, FiT for small projects and net metering.
• Spain Royal Decree 413/2014 was approved capping earnings of all renewable power plants retroactively. • Sweden introduced tax reduction for micro-production by individuals and companies. • United Kingdom launched CFD mechanism to transition from ROC scheme for new projects. FiT is under
review.
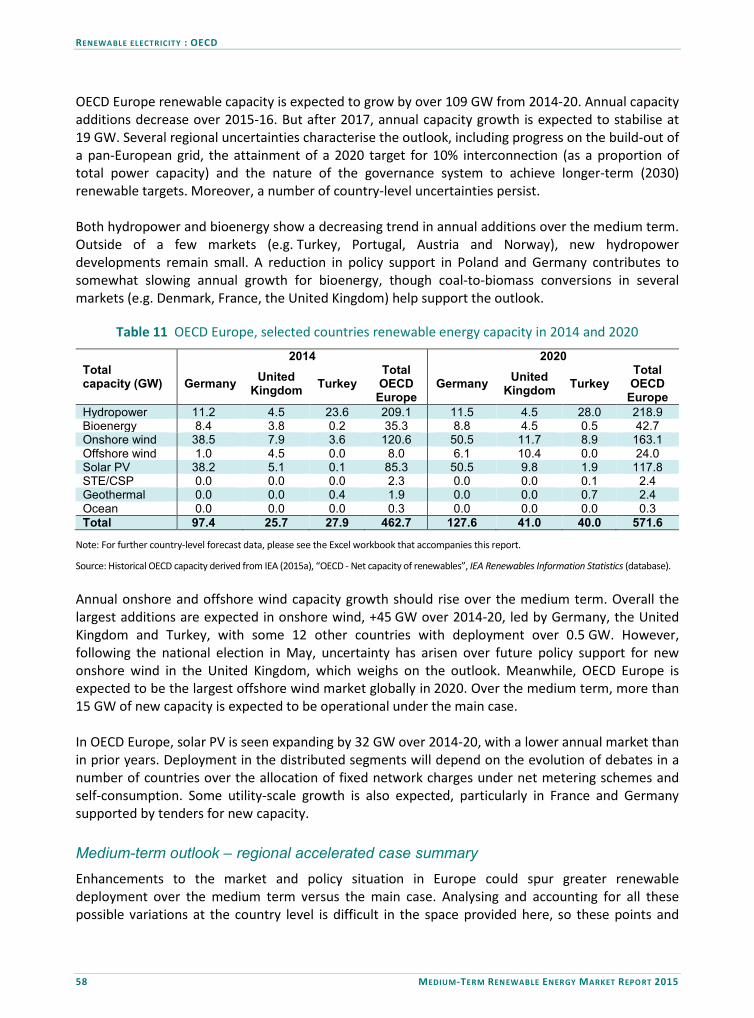
RENEWABLE ELECTRICITY : OECD
58 MEDIUM-TERM RENEWABLE ENERGY MARKET REPORT 2015
OECD Europe renewable capacity is expected to grow by over 109 GW from 2014-20. Annual capacity additions decrease over 2015-16. But after 2017, annual capacity growth is expected to stabilise at 19 GW. Several regional uncertainties characterise the outlook, including progress on the build-out of a pan-European grid, the attainment of a 2020 target for 10% interconnection (as a proportion of total power capacity) and the nature of the governance system to achieve longer-term (2030) renewable targets. Moreover, a number of country-level uncertainties persist. Both hydropower and bioenergy show a decreasing trend in annual additions over the medium term. Outside of a few markets (e.g. Turkey, Portugal, Austria and Norway), new hydropower developments remain small. A reduction in policy support in Poland and Germany contributes to somewhat slowing annual growth for bioenergy, though coal-to-biomass conversions in several markets (e.g. Denmark, France, the United Kingdom) help support the outlook.
Table 11 OECD Europe, selected countries renewable energy capacity in 2014 and 2020
Total capacity (GW)
2014 2020
Germany United Kingdom Turkey
Total OECD
Europe Germany United
Kingdom Turkey Total OECD
Europe Hydropower 11.2 4.5 23.6 209.1 11.5 4.5 28.0 218.9 Bioenergy 8.4 3.8 0.2 35.3 8.8 4.5 0.5 42.7 Onshore wind 38.5 7.9 3.6 120.6 50.5 11.7 8.9 163.1 Offshore wind 1.0 4.5 0.0 8.0 6.1 10.4 0.0 24.0 Solar PV 38.2 5.1 0.1 85.3 50.5 9.8 1.9 117.8 STE/CSP 0.0 0.0 0.0 2.3 0.0 0.0 0.1 2.4 Geothermal 0.0 0.0 0.4 1.9 0.0 0.0 0.7 2.4 Ocean 0.0 0.0 0.0 0.3 0.0 0.0 0.0 0.3 Total 97.4 25.7 27.9 462.7 127.6 41.0 40.0 571.6
Note: For further country-level forecast data, please see the Excel workbook that accompanies this report.
Source: Historical OECD capacity derived from IEA (2015a), “OECD - Net capacity of renewables”, IEA Renewables Information Statistics (database). Annual onshore and offshore wind capacity growth should rise over the medium term. Overall the largest additions are expected in onshore wind, +45 GW over 2014-20, led by Germany, the United Kingdom and Turkey, with some 12 other countries with deployment over 0.5 GW. However, following the national election in May, uncertainty has arisen over future policy support for new onshore wind in the United Kingdom, which weighs on the outlook. Meanwhile, OECD Europe is expected to be the largest offshore wind market globally in 2020. Over the medium term, more than 15 GW of new capacity is expected to be operational under the main case. In OECD Europe, solar PV is seen expanding by 32 GW over 2014-20, with a lower annual market than in prior years. Deployment in the distributed segments will depend on the evolution of debates in a number of countries over the allocation of fixed network charges under net metering schemes and self-consumption. Some utility-scale growth is also expected, particularly in France and Germany supported by tenders for new capacity. Medium-term outlook – regional accelerated case summary Enhancements to the market and policy situation in Europe could spur greater renewable deployment over the medium term versus the main case. Analysing and accounting for all these possible variations at the country level is difficult in the space provided here, so these points and

RENEWABLE ELECTRICITY: OECD
MEDIUM-TERM RENEWABLE ENERGY MARKET REPORT 2015 59
their potential impacts are mostly made in the broad sense. Under the accelerated case, renewable capacity growth over 2014-20 could be almost 30% higher versus the main case.
At the regional level, increasing the level of interconnection across Europe is probably the most significant step that could improve the value of renewable generation and facilitate development of a more effective pan-European renewable system, though this development would take place over the medium to long term (IEA, 2014). Financing such investment should be a priority within EU structural funding and in the activities of the European Investment Bank (EIB). Still, other challenges related to the permitting and local acceptance of new grid infrastructure would also need to be addressed in a number of markets, including Germany and the United Kingdom. Timely clarification of a credible mechanism to spur states to comply with a new EU-28 2030 renewable target could also help enhance investor certainty and spur new investment in both renewables and grid infrastructure. The development of indicative benchmarks that broke down the 27% renewables target at the member state level, accompanied by co-ordinated approaches to grid and renewable generation planning among groups of countries, could facilitate this transition (Held et al., 2014).
Figure 14 OECD Europe incremental renewable capacity additions, main versus accelerated case
0 20 40 60 80 100 120 140
Total
Other
Solar PV
Wind
Capacity growth 2014-20 (GW)
Main case
Acceleratedcase
In the dynamic power systems of the region, countries would need to further reduce non-economic barriers to development. Notably, in Turkey, solar PV deployment could be higher with streamlined permitting procedures, clear net metering rules and the acceleration of further capacity auctions for utility-scale capacity. In more stable power systems facing significant electricity sector transitions, some policy uncertainties persist. A clarification by governments of wide-ranging reforms ahead, potential future revisions to support schemes (e.g. the United Kingdom), the pace and transitional measures related to future auctions for new generation (e.g. Germany), and regulatory questions over distributed generation and the allocation of fixed network costs (e.g. Belgium, France, Spain) could enhance investor certainty. Power systems with clear overcapacity and reduced prospects for new renewable deployment need to avoid retroactive measures on existing generators.
Greater-than-expected development of grid connections, transmission capacity, interconnections, other forms of flexibility (such as storage) and improved grid codes and operations would be needed for the timely scale-up of wind power, with further cost reductions required for offshore wind in particular. The easing of some non-economic barriers to deployment in some countries should also support further deployment. Faster-than-expected cost reductions could also drive an acceleration of distributed solar PV for self-consumption under conditions of socket parity. Lastly, greater progress in the establishment of sustainable feedstock supply chains could raise the outlook for bioenergy.

RENEWABLE ELECTRICITY : OECD
60 MEDIUM-TERM RENEWABLE ENERGY MARKET REPORT 2015
Turkey dashboard
Figure D.10 Turkey annual net additions to renewable capacity (2013-20)
0.0
0.5
1.0
1.5
2.0
2.5
3.0
3.5
4.0
2013 2014 2015 2016 2017 2018 2019 2020
Annu
al ad
dition
s (GW
)
Ocean
STE
Geothermal
Solar PV
Offshore Wind
Onshore Wind
Bioenergy
Hydropower
Source: Historical OECD capacity derived from IEA (2015a), “OECD - Net capacity of renewables”, IEA Renewables Information Statistics (database).
Figure D.11 Turkey wind projects remuneration choice
Figure D.12 Turkey utility solar PV LCOE versus FiT
0%
20%
40%
60%
80%
100%
2012 2013 2014 2015Market-based FIT
Source: EMRA, 2012-14.
0
50
100
150
200
250
300
2014 2015 2016 2017 2018 2019 2020
USD/
MWh
Utility Solar PV LCOE LCOE with license fee FIT range
Table D.5 Turkey renewable power capacity
GW 2014 2016 2018 2020 2020*
Hydropower 23.6 25.6 27.1 28.0 28.0
Bioenergy 0.2 0.3 0.4 0.5 0.5
Onshore wind 3.6 5.3 7.1 8.9 10.1
Offshore wind 0.0 0.0 0.0 0.0 0.0
Solar PV 0.1 0.4 0.9 1.9 2.9
STE/CSP 0.0 0.0 0.0 0.1 0.7
Geothermal 0.4 0.5 0.6 0.7 0.1
Ocean 0.0 0.0 0.0 0.0 0.0
Total 27.9 32.0 36.1 40.0 42.3
* Accelerated case
• Drivers - strong need for new capacity to meet demand - great resource potential and competition.
• Challenges - high license and connection fees for renewable projects - regulation uncertainty over distributed projects - the cost and availability of financing with exchange rate risks.
RENEWABLE ELECTRICITY: OECD
MEDIUM-TERM RENEWABLE ENERGY MARKET REPORT 2015 61
Medium-term forecast: Turkey main case
Turkey’s renewable capacity should expand by 12 GW over 2014-20. Hydropower leads the outlook with over 4.5 GW currently under construction The forecast is more optimistic than in MTRMR 2014, with the capacity in 2020 revised up by 1 GW. Administrative and regulatory developments are the main reasons behind revisions. Onshore wind additions lead the forecast, but profits are squeezed with decreasing electricity prices due to exchange rate risk. Since 2008, the majority of wind developers have chosen to sell their electricity in the wholesale market since prices were higher than the FiT. However, with the depreciation of the Turkish lira (TRY) against the US dollar and decreasing wholesale electricity prices, over 85% of developers switched to the FiT last year. Overall, exchange rate risk remains an important challenge both at project development and operation stages as turbine prices are quoted in euros, and loans are usually in lira and FiT in US dollars. Some developers received the local content premium (LCP) as administrative issues were resolved last year, boosting their revenues by 7-12% for five years. In March 2015, the energy regulator opened pre-license applications for 3 GW of new capacity with the grid auction expected to be held in mid-2016. Despite these challenges, more developers expect to get LCP, increasing their revenues. Thus, Turkey’s highly competitive onshore wind market should expand by over 5.3 GW over 2014-20. Turkey’s promising solar PV market is currently driven by first-mover advantage strategies. In May 2015, the grid company held an auction for connections, which are required to get a utility-scale electricity production licence. Aggressive bidding resulted in high prices ranging from TRY 1 million to TRY 3 million (USD 0.3 million-USD 1.2 million) per megawatt. This additional cost is expected to decrease the bankability of some projects, particularly in light of the relatively short FiT duration (ten years). However, this report expects that some projects will be built over the medium term as developers want to have a first-mover advantage for future tenders. In addition, projects should be able to get local content premium as solar PV supply chain manufacturing expands with increasing demand over the medium term. The economics for unlicensed projects (below 1 MW) look better as they do not have to pay for grid capacity. However, net metering rules are unclear, and permitting remains challenging for developers. In addition, high retail electricity prices are expected to drive some large-scale commercial deployment. Overall, Turkey’s solar PV capacity is slightly revised down, and it should expand by 1.8 GW over 2014-20.
Medium-term forecast: Turkey accelerated case
Much enhancement is possible in Turkey with regulatory and administrative changes. For onshore wind and solar PV, a better auction design for grid connection with floor and ceiling prices would prevent developers from overbidding. This could improve project bankability and access to lower-cost financing. The cost of financing remained high for renewables, as the majority of renewable projects are still financed on balance sheets with uncertain revenue streams due to exchange rate risks. Financing costs could be lower with longer FiT contracts with durations of 10 to 15 years. For unlicensed projects, a more robust net metering and permitting structure would decrease regulatory risk. Should all these changes be realised, onshore wind capacity should be 0.6 GW to 1.2 GW and solar PV 1 GW higher than in the main case.
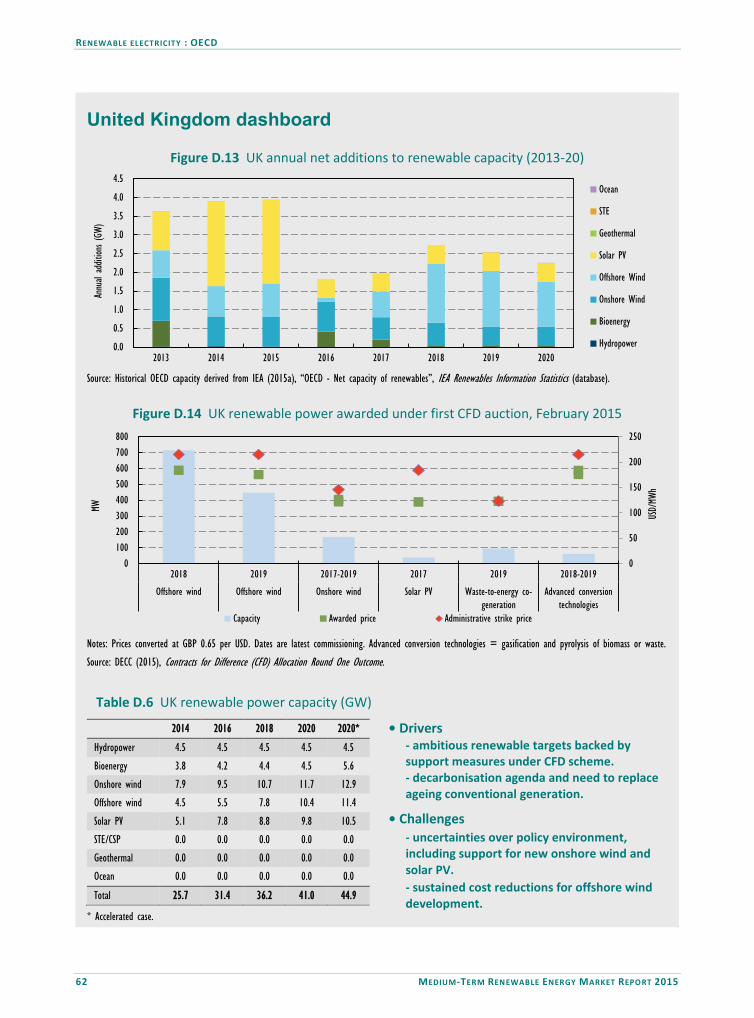
RENEWABLE ELECTRICITY : OECD
62 MEDIUM-TERM RENEWABLE ENERGY MARKET REPORT 2015
United Kingdom dashboard
Figure D.13 UK annual net additions to renewable capacity (2013-20)
0.0
0.5
1.0
1.5
2.0
2.5
3.0
3.5
4.0
4.5
2013 2014 2015 2016 2017 2018 2019 2020
Annu
al ad
dition
s (GW
)
Ocean
STE
Geothermal
Solar PV
Offshore Wind
Onshore Wind
Bioenergy
Hydropower
Source: Historical OECD capacity derived from IEA (2015a), “OECD - Net capacity of renewables”, IEA Renewables Information Statistics (database).
Figure D.14 UK renewable power awarded under first CFD auction, February 2015
0
50
100
150
200
250
0 100 200 300 400 500 600 700 800
2018 2019 2017-2019 2017 2019 2018-2019
Offshore wind Offshore wind Onshore wind Solar PV Waste-to-energy co-generation
Advanced conversiontechnologies
USD/
MWh
MW
Capacity Awarded price Administrative strike price
Notes: Prices converted at GBP 0.65 per USD. Dates are latest commissioning. Advanced conversion technologies = gasification and pyrolysis of biomass or waste.
Source: DECC (2015), Contracts for Difference (CFD) Allocation Round One Outcome.
Table D.6 UK renewable power capacity (GW)
2014 2016 2018 2020 2020*
Hydropower 4.5 4.5 4.5 4.5 4.5
Bioenergy 3.8 4.2 4.4 4.5 5.6
Onshore wind 7.9 9.5 10.7 11.7 12.9
Offshore wind 4.5 5.5 7.8 10.4 11.4
Solar PV 5.1 7.8 8.8 9.8 10.5
STE/CSP 0.0 0.0 0.0 0.0 0.0
Geothermal 0.0 0.0 0.0 0.0 0.0
Ocean 0.0 0.0 0.0 0.0 0.0
Total 25.7 31.4 36.2 41.0 44.9
* Accelerated case.
• Drivers - ambitious renewable targets backed by support measures under CFD scheme. - decarbonisation agenda and need to replace ageing conventional generation.
• Challenges - uncertainties over policy environment, including support for new onshore wind and solar PV. - sustained cost reductions for offshore wind development.
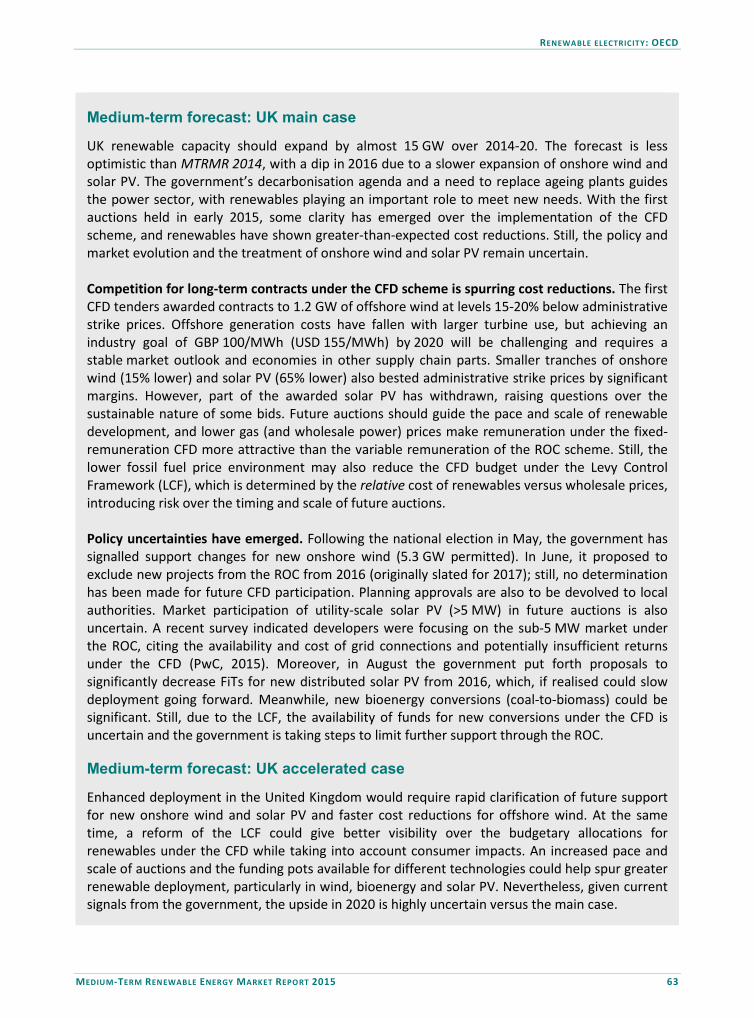
RENEWABLE ELECTRICITY: OECD
MEDIUM-TERM RENEWABLE ENERGY MARKET REPORT 2015 63
Medium-term forecast: UK main case
UK renewable capacity should expand by almost 15 GW over 2014-20. The forecast is less optimistic than MTRMR 2014, with a dip in 2016 due to a slower expansion of onshore wind and solar PV. The government’s decarbonisation agenda and a need to replace ageing plants guides the power sector, with renewables playing an important role to meet new needs. With the first auctions held in early 2015, some clarity has emerged over the implementation of the CFD scheme, and renewables have shown greater-than-expected cost reductions. Still, the policy and market evolution and the treatment of onshore wind and solar PV remain uncertain. Competition for long-term contracts under the CFD scheme is spurring cost reductions. The first CFD tenders awarded contracts to 1.2 GW of offshore wind at levels 15-20% below administrative strike prices. Offshore generation costs have fallen with larger turbine use, but achieving an industry goal of GBP 100/MWh (USD 155/MWh) by 2020 will be challenging and requires a stable market outlook and economies in other supply chain parts. Smaller tranches of onshore wind (15% lower) and solar PV (65% lower) also bested administrative strike prices by significant margins. However, part of the awarded solar PV has withdrawn, raising questions over the sustainable nature of some bids. Future auctions should guide the pace and scale of renewable development, and lower gas (and wholesale power) prices make remuneration under the fixed-remuneration CFD more attractive than the variable remuneration of the ROC scheme. Still, the lower fossil fuel price environment may also reduce the CFD budget under the Levy Control Framework (LCF), which is determined by the relative cost of renewables versus wholesale prices, introducing risk over the timing and scale of future auctions. Policy uncertainties have emerged. Following the national election in May, the government has signalled support changes for new onshore wind (5.3 GW permitted). In June, it proposed to exclude new projects from the ROC from 2016 (originally slated for 2017); still, no determination has been made for future CFD participation. Planning approvals are also to be devolved to local authorities. Market participation of utility-scale solar PV (>5 MW) in future auctions is also uncertain. A recent survey indicated developers were focusing on the sub-5 MW market under the ROC, citing the availability and cost of grid connections and potentially insufficient returns under the CFD (PwC, 2015). Moreover, in August the government put forth proposals to significantly decrease FiTs for new distributed solar PV from 2016, which, if realised could slow deployment going forward. Meanwhile, new bioenergy conversions (coal-to-biomass) could be significant. Still, due to the LCF, the availability of funds for new conversions under the CFD is uncertain and the government is taking steps to limit further support through the ROC.
Medium-term forecast: UK accelerated case
Enhanced deployment in the United Kingdom would require rapid clarification of future support for new onshore wind and solar PV and faster cost reductions for offshore wind. At the same time, a reform of the LCF could give better visibility over the budgetary allocations for renewables under the CFD while taking into account consumer impacts. An increased pace and scale of auctions and the funding pots available for different technologies could help spur greater renewable deployment, particularly in wind, bioenergy and solar PV. Nevertheless, given current signals from the government, the upside in 2020 is highly uncertain versus the main case.
RENEWABLE ELECTRICITY : OECD
64 MEDIUM-TERM RENEWABLE ENERGY MARKET REPORT 2015
References AER (Australian Energy Regulator) (2014), State of the Energy Market 2014, AER, Melbourne. BNEF (Bloomberg New Energy Finance) (2015), H1 2015 North America PV market outlook, BNEF, New York. DECC (Department of Energy and Climate Change) (2015), Contracts for Difference (CFD) Allocation Round One Outcome, DECC, London, www.gov.uk/government/statistics/contracts-for-difference-cfd-allocation-round-one-outcome. Deutche Windguard (2015), Status of Land-Based Wind Energy Development in Germany: Year 2014, Deutche Windguard GmbH, Varel. EMRA (Energy Market Regulatory Authority of Turkey) (2014), “2015 Yılı nihai YEK listesi” (Final FiT allocation 2015), EMRA Ankara. EMRA (2013), 2014 Yılı Nihai YEK Listesi, EMRA, Ankara. EMRA (2012), 2013 Yılı Nihai YEK Listesi, EMRA, Ankara. EMRA (2011), 2012 Yılı Nihai YEK Listesi, EMRA, Ankara. ESAA (Energy Supply Association of Australia) (2014), Solar PV Report December 2014, ESAA, Melbourne. FEPC (Federation of Electric Power Companies of Japan) (2015a), Electricity Generated and Purchased in Fiscal 2014 (Bulletin), FEPC, Tokyo. FEPC (2015b), Electricity Statistics Information, FEPC, Tokyo. Held, A., M. RaGWitz, G. Resch, L. Liebmann and F. Genoese (2014), “Implementing the EU 2030 Climate and Energy Framework – A closer look at renewables and opportunities for an Energy Union”, issue paper No. 2, Towards 2030, Brussels, http://towards2030.eu/news/issue-paper-no-2-implementing-eu-2030-climate-and-energy-framework-%E2%80%93-closer-look-renewables-and. IEA (2015a), “OECD - Net capacity of renewables”, IEA Renewables Information Statistics (database), DOI: http://dx.doi.org/10.1787/data-00467-en, (accessed [August 2015]). IEA (2015b), “World energy statistics”, IEA World Energy Statistics and Balances (database), DOI: http://dx.doi.org/10.1787/data-00510-en, (accessed [August 2015]). IEA (2015c), Medium-Term Gas Market Report 2015, OECD/IEA, Paris. IEA (2015d), Projecting Costs of Generating Electricity 2015 Edition, OECD/IEA, Paris. IEA (2014), Energy Policies of IEA Countries: European Union, OECD/IEA, Paris.
RENEWABLE ELECTRICITY: OECD
MEDIUM-TERM RENEWABLE ENERGY MARKET REPORT 2015 65
IEA-PVPS (Implementing Agreement for a Co-operative Programme on Photovoltaic Power Systems) (2014), National Survey Report of PV Power Applications in Japan 2013, IEA-PVPS, St. Ursen, Switzerland. Lee, C. (2015), “Dismal outlook for LNG in S Korea's power market as coal, nuclear gain favor: KPX”, LNG Daily, Platts, Seoul. METI (2015), Renewable Energy Equipment Certification Status, January 2015, METI, Tokyo. METI (Ministry of Economy, Trade and Industry) (2014), Estimation Result of Grid Capacities by EPCOs in Working Group on Grid Connection of Renewable Energy, METI, Tokyo. NREL (2014), “Implications of a PTC Extension on US Wind Deployment”, NREL, Golden, www.nrel.gov/docs/fy14osti/61663.pdf. PJM (2015), “Future deactivations as of June 29, 2015”, PJM, Valley Forge, www.pjm.com/~/media/planning/gen-retire/pending-deactivation-requests.ashx. PwC (PricewaterhouseCoopers) (2015), “Solar industry’s growing maturity a mixed blessing for UK developers and investors”, PWC/Solar Trade Association, London, http://pwc.blogs.com/press_room/2015/06/solar-industrys-growing-maturity-a-mixed-blessing-for-uk-developers-and-investors.html.
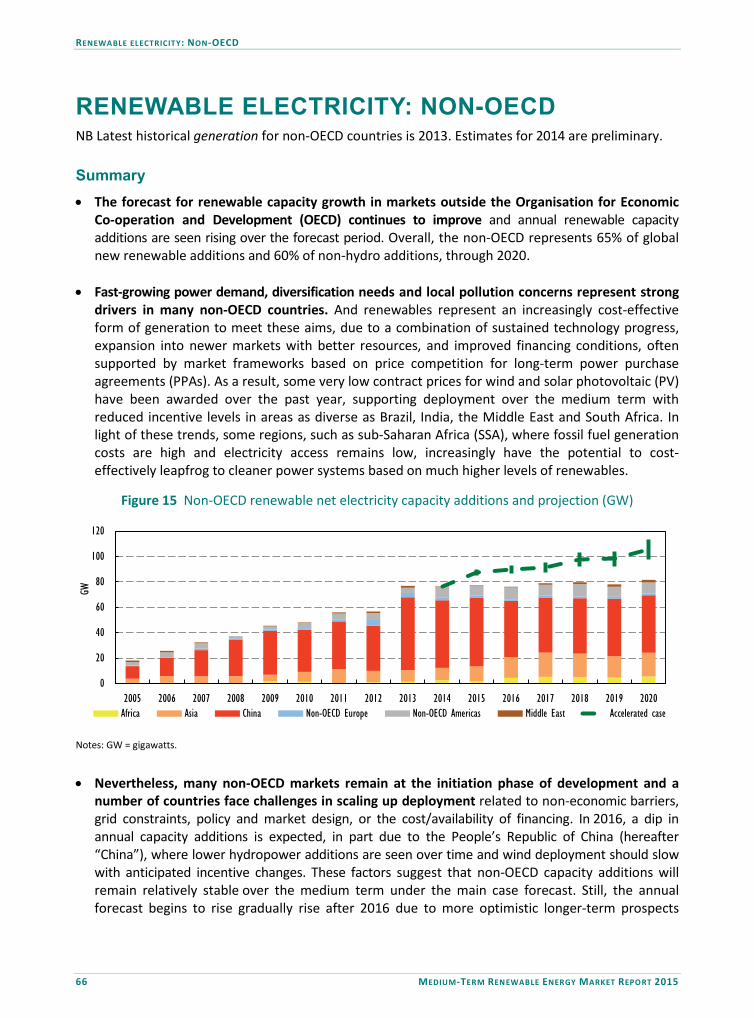
RENEWABLE ELECTRICITY: NON-OECD
66 MEDIUM-TERM RENEWABLE ENERGY MARKET REPORT 2015
RENEWABLE ELECTRICITY: NON-OECD NB Latest historical generation for non-OECD countries is 2013. Estimates for 2014 are preliminary. Summary • The forecast for renewable capacity growth in markets outside the Organisation for Economic
Co-operation and Development (OECD) continues to improve and annual renewable capacity additions are seen rising over the forecast period. Overall, the non-OECD represents 65% of global new renewable additions and 60% of non-hydro additions, through 2020.
• Fast-growing power demand, diversification needs and local pollution concerns represent strong drivers in many non-OECD countries. And renewables represent an increasingly cost-effective form of generation to meet these aims, due to a combination of sustained technology progress, expansion into newer markets with better resources, and improved financing conditions, often supported by market frameworks based on price competition for long-term power purchase agreements (PPAs). As a result, some very low contract prices for wind and solar photovoltaic (PV) have been awarded over the past year, supporting deployment over the medium term with reduced incentive levels in areas as diverse as Brazil, India, the Middle East and South Africa. In light of these trends, some regions, such as sub-Saharan Africa (SSA), where fossil fuel generation costs are high and electricity access remains low, increasingly have the potential to cost-effectively leapfrog to cleaner power systems based on much higher levels of renewables.
Figure 15 Non-OECD renewable net electricity capacity additions and projection (GW)
0
20
40
60
80
100
120
2005 2006 2007 2008 2009 2010 2011 2012 2013 2014 2015 2016 2017 2018 2019 2020
GW
Africa Asia China Non-OECD Europe Non-OECD Americas Middle East Accelerated case
Notes: GW = gigawatts.
• Nevertheless, many non-OECD markets remain at the initiation phase of development and a
number of countries face challenges in scaling up deployment related to non-economic barriers, grid constraints, policy and market design, or the cost/availability of financing. In 2016, a dip in annual capacity additions is expected, in part due to the People’s Republic of China (hereafter “China”), where lower hydropower additions are seen over time and wind deployment should slow with anticipated incentive changes. These factors suggest that non-OECD capacity additions will remain relatively stable over the medium term under the main case forecast. Still, the annual forecast begins to rise gradually rise after 2016 due to more optimistic longer-term prospects
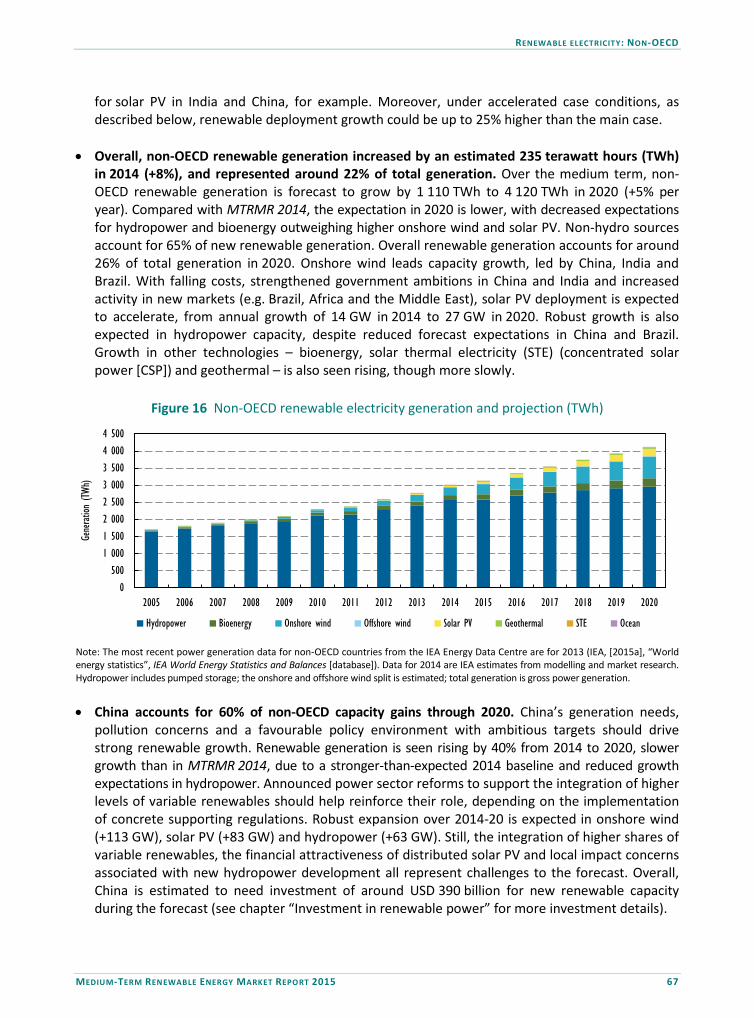
RENEWABLE ELECTRICITY: NON-OECD
MEDIUM-TERM RENEWABLE ENERGY MARKET REPORT 2015 67
for solar PV in India and China, for example. Moreover, under accelerated case conditions, as described below, renewable deployment growth could be up to 25% higher than the main case.
• Overall, non-OECD renewable generation increased by an estimated 235 terawatt hours (TWh) in 2014 (+8%), and represented around 22% of total generation. Over the medium term, non-OECD renewable generation is forecast to grow by 1 110 TWh to 4 120 TWh in 2020 (+5% per year). Compared with MTRMR 2014, the expectation in 2020 is lower, with decreased expectations for hydropower and bioenergy outweighing higher onshore wind and solar PV. Non-hydro sources account for 65% of new renewable generation. Overall renewable generation accounts for around 26% of total generation in 2020. Onshore wind leads capacity growth, led by China, India and Brazil. With falling costs, strengthened government ambitions in China and India and increased activity in new markets (e.g. Brazil, Africa and the Middle East), solar PV deployment is expected to accelerate, from annual growth of 14 GW in 2014 to 27 GW in 2020. Robust growth is also expected in hydropower capacity, despite reduced forecast expectations in China and Brazil. Growth in other technologies – bioenergy, solar thermal electricity (STE) (concentrated solar power [CSP]) and geothermal – is also seen rising, though more slowly.
Figure 16 Non-OECD renewable electricity generation and projection (TWh)
0 500
1 0001 5002 0002 5003 0003 5004 0004 500
2005 2006 2007 2008 2009 2010 2011 2012 2013 2014 2015 2016 2017 2018 2019 2020
Generat
ion (T
Wh)
Hydropower Bioenergy Onshore wind Offshore wind Solar PV Geothermal STE Ocean
Note: The most recent power generation data for non-OECD countries from the IEA Energy Data Centre are for 2013 (IEA, [2015a], “World energy statistics”, IEA World Energy Statistics and Balances [database]). Data for 2014 are IEA estimates from modelling and market research. Hydropower includes pumped storage; the onshore and offshore wind split is estimated; total generation is gross power generation. • China accounts for 60% of non-OECD capacity gains through 2020. China’s generation needs,
pollution concerns and a favourable policy environment with ambitious targets should drive strong renewable growth. Renewable generation is seen rising by 40% from 2014 to 2020, slower growth than in MTRMR 2014, due to a stronger-than-expected 2014 baseline and reduced growth expectations in hydropower. Announced power sector reforms to support the integration of higher levels of variable renewables should help reinforce their role, depending on the implementation of concrete supporting regulations. Robust expansion over 2014-20 is expected in onshore wind (+113 GW), solar PV (+83 GW) and hydropower (+63 GW). Still, the integration of higher shares of variable renewables, the financial attractiveness of distributed solar PV and local impact concerns associated with new hydropower development all represent challenges to the forecast. Overall, China is estimated to need investment of around USD 390 billion for new renewable capacity during the forecast (see chapter “Investment in renewable power” for more investment details).

RENEWABLE ELECTRICITY: NON-OECD
68 MEDIUM-TERM RENEWABLE ENERGY MARKET REPORT 2015
• In India, ambitious new government targets and an improved policy environment suggestrenewable growth could accelerate there. Total renewable capacity growth, at over 65 GW (+85%)from 2014-20, is some 35% higher than in MTRMR 2014, due to onshore wind and solar PV. Thereinstatement of key financial incentives from the central government are catalysing new winddevelopment, but the stability of these measures, which had been subject to stop-and-go policymaking, will be key for consistent development. Meanwhile, competitive state- and central-government-level auctions are driving more cost-effective utility-scale solar PV development, ascontracted prices have fallen over the past two years. Still, the upgrade and expansion of the grid;off take risks for generation, given the cash-strapped position of some state electricity boards; andthe cost and availability of financing represent challenges. In all, India is estimated to requireinvestment of more than USD 80 billion for new renewable capacity during the forecast period.
• Renewable development accelerates in other regions, though with significant differences. Thenon-OECD Americas and Asia, outside of China and India, are the largest contributors. In theAmericas, with a high penetration of hydropower, severe droughts and limited infrastructure forscaling gas generation suggest non-hydro renewables will play an important diversification role,supported by the award of long-term contracts to wind, solar PV, STE and bioenergy capacityunder competitive auctions in a number of markets. In Asia, strong demand growth anddiversification needs support a robust expansion of hydropower, complemented by a portfolio ofnon-hydro sources. In Africa, acute demand needs, excellent resources and supportive policyframeworks should support continued hydropower expansion and an acceleration of non-hydrodeployment in some countries (e.g. Morocco, Egypt, South Africa). Still, the pace of government-backed tender schemes and grid and financing constraints represent challenges. In the MiddleEast, despite excellent resources, persistent regulatory barriers and uneven implementation ofrenewable support policies have hampered development. Yet some renewables are beingdeveloped at very low costs in several countries, supported by market frameworks of competitionover long-term contracts. Meanwhile, renewable development remains relatively weak in non-OECD Europe and Eurasia, where abrupt policy changes have contributed to past boom-and-bustcycles in several markets, and policy implementation remains only nascent in others.
Figure 17 Non-OECD incremental renewable capacity additions, main versus accelerated case
0 100 200 300 400 500 600 700
Total
Other
Solar PV
Wind
Capacity growth 2014-20 (GW)
Main case
Acceleratedcase
• Under this report’s accelerated case – which is market-specific to each region – renewablegrowth could be 25% higher over 2014-20 than under the main case. In addition to faster-than-
RENEWABLE ELECTRICITY: NON-OECD
MEDIUM-TERM RENEWABLE ENERGY MARKET REPORT 2015 69
expected reductions in renewable technology costs, this result could come about through more certainty over the credible implementation of long-term policy frameworks in some markets (e.g. India); greater measures to reduce non-economic barriers and improve the system and grid integration of variable renewables (e.g. China, South Africa), particularly distributed solar PV; and improved financing conditions. Still, there is a high degree of uncertainty over enhancements occurring in concert within and between markets.
Africa Recent trends
In Africa, renewables represented around 17% of total generation in 2013. By 2014, renewable power reached an estimated 128 TWh, with hydropower remaining the largest source of renewable generation (92%), though non-hydropower renewable generation grew an impressive 43% from a low baseline. New capacity additions from solar PV, wind and geothermal were driven by support schemes ranging from competitive auctions to state-led projects aimed at unlocking excellent resource potential to achieve cost-effective power. The region added almost 3 GW of renewable capacity in 2014, led by South Africa (1.3 GW), yet growth remains constrained by persistent challenges described below. South Africa’s renewable generation reached almost 5 TWh in 2013, supplying 2% of total generation. By 2014, renewables generated an estimated 6.7 TWh, driven by the addition of 1.3 GW of new renewable capacity under the Renewable Energy Independent Power Producer Procurement Programme (REIPPPP). Approximately 750 megawatts (MW) of solar PV from bid windows (BWs) 1 and 2 and 570 MW of wind from BW 1 were commissioned in 2014. A further 150 MW of wind from BW 2 and the country’s first STE plant, the 100 MW KaXu, with three hours of storage from BW 1, have been commissioned thus far in 2015. Small hydropower also modestly expanded by 12 MW over 2014-15. Preferred bidders for 200 MW in STE-specific competitive tenders were announced in 2014, with some of the lowest bids reported for 100 MW plants with 12 hours of storage. In North Africa, Morocco’s renewable generation grew by 76% in 2013, reaching 4.5 TWh, approximately 16% of total generation. By 2014, renewables generated an estimated 3.8 TWh, though generation from non-hydropower technologies increased driven by recent developments. By the end of 2014, the last units of the 300 MW Tarfaya plant were installed, to date the largest wind farm in Africa, and a 2.4 MW STE project was piloted by a cement manufacturer. Meanwhile, Egypt’s renewable power declined slightly in 2013 to 14.5 TWh, from lower hydropower output, and made up 9% of total generation. In 2014, estimates for renewable generation were relatively stable, rebounding slightly to 15.6 TWh, as no significant capacity was added despite the country’s power shortage. Yet in early 2015, a 10 MW PV plant was commissioned, and a number of state-owned wind projects (120-220 MW) are being developed. In 2014, Tunisia added 34 MW of wind while Algeria commissioned 3 MW of solar PV and 10 MW of wind at Kabertene. In the rest of SSA (excluding South Africa) renewable generation reached an estimated 105 TWh in 2014, a 2% increase from 2013 driven mostly by capacity additions from hydropower but also from significant geothermal, solar PV and bioenergy additions. Kenya led the deployment in 2014, commissioning 360 MW, mostly from geothermal (four plants: 140 Olkaria I, 140 MW Olkaria III and two smaller units totalling 67 MW). Kenya also added 14 MW of wind capacity and connected
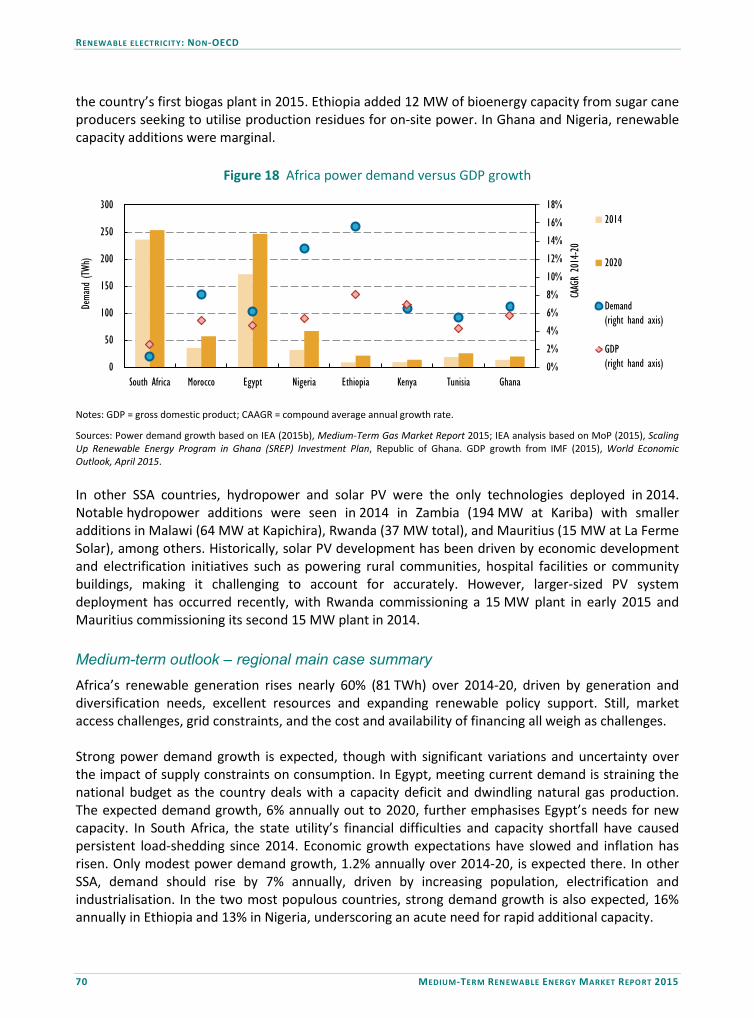
RENEWABLE ELECTRICITY: NON-OECD
70 MEDIUM-TERM RENEWABLE ENERGY MARKET REPORT 2015
the country’s first biogas plant in 2015. Ethiopia added 12 MW of bioenergy capacity from sugar cane producers seeking to utilise production residues for on-site power. In Ghana and Nigeria, renewable capacity additions were marginal.
Figure 18 Africa power demand versus GDP growth
0%
2%
4%
6%
8%
10%
12%
14%
16%
18%
0
50
100
150
200
250
300
South Africa Morocco Egypt Nigeria Ethiopia Kenya Tunisia Ghana
CAAG
R 20
14-20
Dema
nd (T
Wh)
2014
2020
Demand(right hand axis)
GDP(right hand axis)
Notes: GDP = gross domestic product; CAAGR = compound average annual growth rate.
Sources: Power demand growth based on IEA (2015b), Medium-Term Gas Market Report 2015; IEA analysis based on MoP (2015), Scaling Up Renewable Energy Program in Ghana (SREP) Investment Plan, Republic of Ghana. GDP growth from IMF (2015), World Economic Outlook, April 2015. In other SSA countries, hydropower and solar PV were the only technologies deployed in 2014. Notable hydropower additions were seen in 2014 in Zambia (194 MW at Kariba) with smaller additions in Malawi (64 MW at Kapichira), Rwanda (37 MW total), and Mauritius (15 MW at La Ferme Solar), among others. Historically, solar PV development has been driven by economic development and electrification initiatives such as powering rural communities, hospital facilities or community buildings, making it challenging to account for accurately. However, larger-sized PV system deployment has occurred recently, with Rwanda commissioning a 15 MW plant in early 2015 and Mauritius commissioning its second 15 MW plant in 2014. Medium-term outlook – regional main case summary Africa’s renewable generation rises nearly 60% (81 TWh) over 2014-20, driven by generation and diversification needs, excellent resources and expanding renewable policy support. Still, market access challenges, grid constraints, and the cost and availability of financing all weigh as challenges. Strong power demand growth is expected, though with significant variations and uncertainty over the impact of supply constraints on consumption. In Egypt, meeting current demand is straining the national budget as the country deals with a capacity deficit and dwindling natural gas production. The expected demand growth, 6% annually out to 2020, further emphasises Egypt’s needs for new capacity. In South Africa, the state utility’s financial difficulties and capacity shortfall have caused persistent load-shedding since 2014. Economic growth expectations have slowed and inflation has risen. Only modest power demand growth, 1.2% annually over 2014-20, is expected there. In other SSA, demand should rise by 7% annually, driven by increasing population, electrification and industrialisation. In the two most populous countries, strong demand growth is also expected, 16% annually in Ethiopia and 13% in Nigeria, underscoring an acute need for rapid additional capacity.
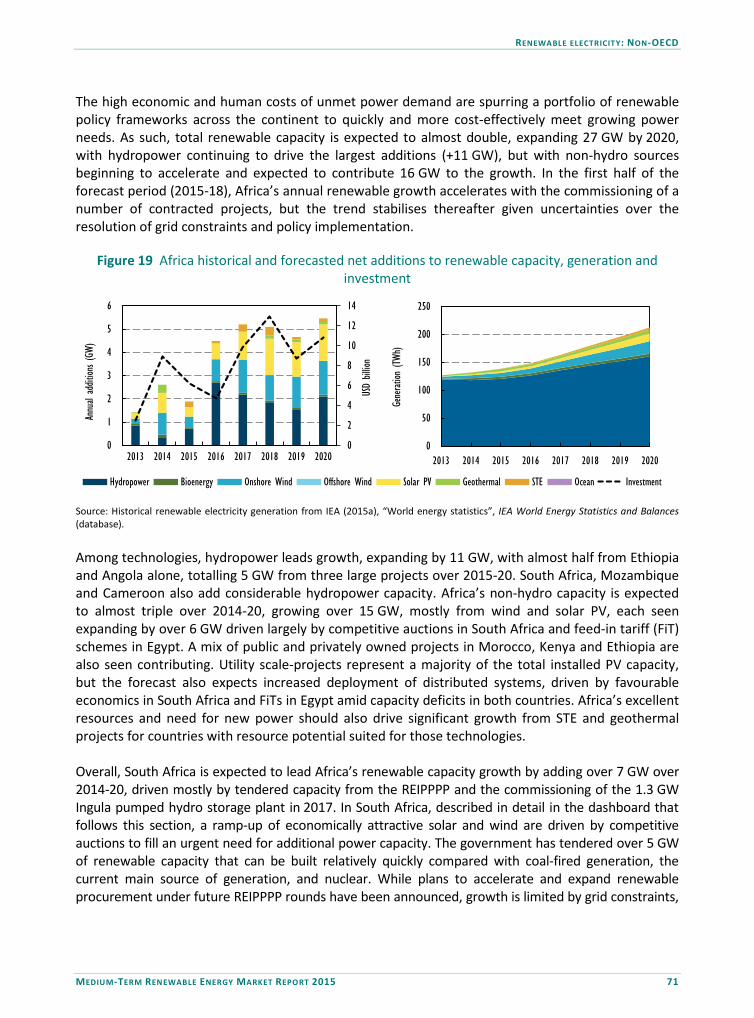
RENEWABLE ELECTRICITY: NON-OECD
MEDIUM-TERM RENEWABLE ENERGY MARKET REPORT 2015 71
The high economic and human costs of unmet power demand are spurring a portfolio of renewable policy frameworks across the continent to quickly and more cost-effectively meet growing power needs. As such, total renewable capacity is expected to almost double, expanding 27 GW by 2020, with hydropower continuing to drive the largest additions (+11 GW), but with non-hydro sources beginning to accelerate and expected to contribute 16 GW to the growth. In the first half of the forecast period (2015-18), Africa’s annual renewable growth accelerates with the commissioning of a number of contracted projects, but the trend stabilises thereafter given uncertainties over the resolution of grid constraints and policy implementation.
Figure 19 Africa historical and forecasted net additions to renewable capacity, generation and investment
0
50
100
150
200
250
2013 2014 2015 2016 2017 2018 2019 2020
Generat
ion (T
Wh)
0
2
4
6
8
10
12
14
0
1
2
3
4
5
6
2013 2014 2015 2016 2017 2018 2019 2020
USD
billio
n
Annu
al ad
dition
s (GW
)
Hydropower Bioenergy Onshore Wind Offshore Wind Solar PV Geothermal STE Ocean Investment
Source: Historical renewable electricity generation from IEA (2015a), “World energy statistics”, IEA World Energy Statistics and Balances (database). Among technologies, hydropower leads growth, expanding by 11 GW, with almost half from Ethiopia and Angola alone, totalling 5 GW from three large projects over 2015-20. South Africa, Mozambique and Cameroon also add considerable hydropower capacity. Africa’s non-hydro capacity is expected to almost triple over 2014-20, growing over 15 GW, mostly from wind and solar PV, each seen expanding by over 6 GW driven largely by competitive auctions in South Africa and feed-in tariff (FiT) schemes in Egypt. A mix of public and privately owned projects in Morocco, Kenya and Ethiopia are also seen contributing. Utility scale-projects represent a majority of the total installed PV capacity, but the forecast also expects increased deployment of distributed systems, driven by favourable economics in South Africa and FiTs in Egypt amid capacity deficits in both countries. Africa’s excellent resources and need for new power should also drive significant growth from STE and geothermal projects for countries with resource potential suited for those technologies. Overall, South Africa is expected to lead Africa’s renewable capacity growth by adding over 7 GW over 2014-20, driven mostly by tendered capacity from the REIPPPP and the commissioning of the 1.3 GW Ingula pumped hydro storage plant in 2017. In South Africa, described in detail in the dashboard that follows this section, a ramp-up of economically attractive solar and wind are driven by competitive auctions to fill an urgent need for additional power capacity. The government has tendered over 5 GW of renewable capacity that can be built relatively quickly compared with coal-fired generation, the current main source of generation, and nuclear. While plans to accelerate and expand renewable procurement under future REIPPPP rounds have been announced, growth is limited by grid constraints,

RENEWABLE ELECTRICITY: NON-OECD
72 MEDIUM-TERM RENEWABLE ENERGY MARKET REPORT 2015
emphasising the importance of a co-ordinated approach to policy and grid planning. As such, the forecast carries a degree of uncertainty over the technology mix and annual rates of deployment.
Table 12 Africa countries main targets and support policies for renewable electricity
Africa Regulatory support Economic support
Country
Ren
ewab
le
ener
gy la
w
Targ
ets
Quo
tas/
RPS
FiT/
Feed
-in
prem
ium
Cap
ital g
rant
s an
d su
bsid
ies
Soft
loan
s
Tax
relie
f
Net
met
erin
g
Trad
able
gr
een
cert
ifica
tes
Car
bon
pric
ing
Auc
tion
sche
mes
Algeria ✔ ✔ ● ✔ Botswana ✔ Burkina Faso ✔ ✔ Egypt ✔ ✔ ✔ ⓪ ✔ ✔ Ethiopia ✔ Gambia ✔ ✔ ✔ ✔ Ghana ✔ ✔ ✔ ✔ ✔ Kenya ✔ ✔ ● ✔ Mali ✔ Mauritius ✔ ✔ ✔ Morocco ✔ ✔ ✔ ✔ ✔ Namibia ✔ ✔ Niger ✔ ✔ Nigeria ✔ ✔ Rwanda ✔ ✔ Senegal ✔ ✔ ✔ Seychelles ✔ ✔ ✔ South Africa ✔ ✔ ✔ ✔ ✔ Tunisia ✔ ✔ ⓪ ✔ ✔ ✔ ✔ Uganda ✔ ✔ ✔ ✔ United Republic of Tanzania ✔ ● ✔
Policy highlights • Algeria updated its renewable energy target, aiming to build 13.5 GW of solar PV by 2030. FiT for solar PV
was adjusted. • Egypt introduced FiT scheme in 2014 for solar PV and wind projects. • Kenya revised its VAT Act, removing tax on certain solar batteries. • Nigeria is in the process of an extensive power sector reform. • Seychelles introduced net-metering programme in January 2014. • South Africa is working on updating national energy policies. Regulator is drafting national regulation for
small-scale embedded generation. • Tanzania updated its FiT scheme, expanding for small projects.
Notes: ✔ = national-level policy; ✓ = state/provincial-level policy, ● = recently updated, ► = to be phased out, ⓪ = recently introduced; ■ = under review. For further information, refer to IEA/IRENA Policies and Measures Database for Renewable Energy. In Egypt, renewable capacity is expected to reach over 7 GW by 2020, a significant upward revision versus MTRMR 2014 in light of the recently launched FiTs for wind and solar PV. Facing a power shortage and rising demand, the government has set a 2020 target of 20% renewable power generation. In 2014, the government introduced a FiT scheme to procure 2 GW of wind and 2.3 GW
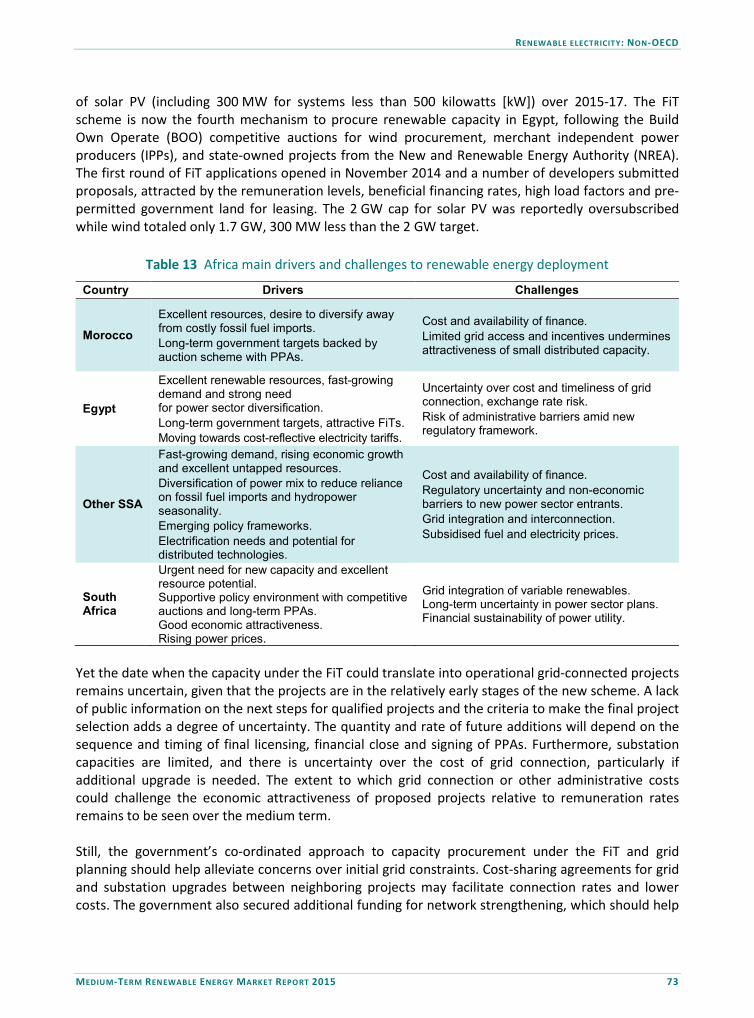
RENEWABLE ELECTRICITY: NON-OECD
MEDIUM-TERM RENEWABLE ENERGY MARKET REPORT 2015 73
of solar PV (including 300 MW for systems less than 500 kilowatts [kW]) over 2015-17. The FiT scheme is now the fourth mechanism to procure renewable capacity in Egypt, following the Build Own Operate (BOO) competitive auctions for wind procurement, merchant independent power producers (IPPs), and state-owned projects from the New and Renewable Energy Authority (NREA). The first round of FiT applications opened in November 2014 and a number of developers submitted proposals, attracted by the remuneration levels, beneficial financing rates, high load factors and pre-permitted government land for leasing. The 2 GW cap for solar PV was reportedly oversubscribed while wind totaled only 1.7 GW, 300 MW less than the 2 GW target.
Table 13 Africa main drivers and challenges to renewable energy deployment
Country Drivers Challenges
Morocco Excellent resources, desire to diversify away from costly fossil fuel imports. Long-term government targets backed by auction scheme with PPAs.
Cost and availability of finance. Limited grid access and incentives undermines attractiveness of small distributed capacity.
Egypt
Excellent renewable resources, fast-growing demand and strong need for power sector diversification. Long-term government targets, attractive FiTs. Moving towards cost-reflective electricity tariffs.
Uncertainty over cost and timeliness of grid connection, exchange rate risk. Risk of administrative barriers amid new regulatory framework.
Other SSA
Fast-growing demand, rising economic growth and excellent untapped resources. Diversification of power mix to reduce reliance on fossil fuel imports and hydropower seasonality. Emerging policy frameworks. Electrification needs and potential for distributed technologies.
Cost and availability of finance. Regulatory uncertainty and non-economic barriers to new power sector entrants. Grid integration and interconnection. Subsidised fuel and electricity prices.
South Africa
Urgent need for new capacity and excellent resource potential. Supportive policy environment with competitive auctions and long-term PPAs. Good economic attractiveness. Rising power prices.
Grid integration of variable renewables. Long-term uncertainty in power sector plans. Financial sustainability of power utility.
Yet the date when the capacity under the FiT could translate into operational grid-connected projects remains uncertain, given that the projects are in the relatively early stages of the new scheme. A lack of public information on the next steps for qualified projects and the criteria to make the final project selection adds a degree of uncertainty. The quantity and rate of future additions will depend on the sequence and timing of final licensing, financial close and signing of PPAs. Furthermore, substation capacities are limited, and there is uncertainty over the cost of grid connection, particularly if additional upgrade is needed. The extent to which grid connection or other administrative costs could challenge the economic attractiveness of proposed projects relative to remuneration rates remains to be seen over the medium term. Still, the government’s co-ordinated approach to capacity procurement under the FiT and grid planning should help alleviate concerns over initial grid constraints. Cost-sharing agreements for grid and substation upgrades between neighboring projects may facilitate connection rates and lower costs. The government also secured additional funding for network strengthening, which should help
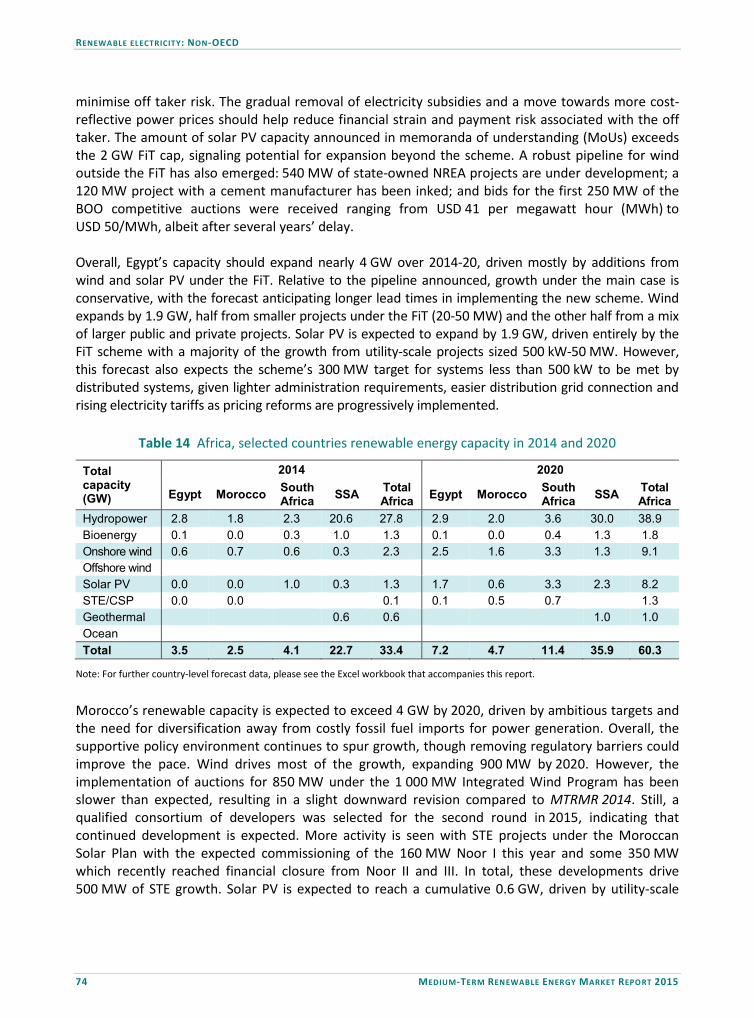
RENEWABLE ELECTRICITY: NON-OECD
74 MEDIUM-TERM RENEWABLE ENERGY MARKET REPORT 2015
minimise off taker risk. The gradual removal of electricity subsidies and a move towards more cost-reflective power prices should help reduce financial strain and payment risk associated with the off taker. The amount of solar PV capacity announced in memoranda of understanding (MoUs) exceeds the 2 GW FiT cap, signaling potential for expansion beyond the scheme. A robust pipeline for wind outside the FiT has also emerged: 540 MW of state-owned NREA projects are under development; a 120 MW project with a cement manufacturer has been inked; and bids for the first 250 MW of the BOO competitive auctions were received ranging from USD 41 per megawatt hour (MWh) to USD 50/MWh, albeit after several years’ delay. Overall, Egypt’s capacity should expand nearly 4 GW over 2014-20, driven mostly by additions from wind and solar PV under the FiT. Relative to the pipeline announced, growth under the main case is conservative, with the forecast anticipating longer lead times in implementing the new scheme. Wind expands by 1.9 GW, half from smaller projects under the FiT (20-50 MW) and the other half from a mix of larger public and private projects. Solar PV is expected to expand by 1.9 GW, driven entirely by the FiT scheme with a majority of the growth from utility-scale projects sized 500 kW-50 MW. However, this forecast also expects the scheme’s 300 MW target for systems less than 500 kW to be met by distributed systems, given lighter administration requirements, easier distribution grid connection and rising electricity tariffs as pricing reforms are progressively implemented.
Table 14 Africa, selected countries renewable energy capacity in 2014 and 2020
Total capacity (GW)
2014 2020
Egypt Morocco South Africa SSA Total
Africa Egypt Morocco South Africa SSA Total
Africa Hydropower 2.8 1.8 2.3 20.6 27.8 2.9 2.0 3.6 30.0 38.9 Bioenergy 0.1 0.0 0.3 1.0 1.3 0.1 0.0 0.4 1.3 1.8 Onshore wind 0.6 0.7 0.6 0.3 2.3 2.5 1.6 3.3 1.3 9.1 Offshore wind Solar PV 0.0 0.0 1.0 0.3 1.3 1.7 0.6 3.3 2.3 8.2 STE/CSP 0.0 0.0 0.1 0.1 0.5 0.7 1.3 Geothermal 0.6 0.6 1.0 1.0 Ocean Total 3.5 2.5 4.1 22.7 33.4 7.2 4.7 11.4 35.9 60.3
Note: For further country-level forecast data, please see the Excel workbook that accompanies this report.
Morocco’s renewable capacity is expected to exceed 4 GW by 2020, driven by ambitious targets and the need for diversification away from costly fossil fuel imports for power generation. Overall, the supportive policy environment continues to spur growth, though removing regulatory barriers could improve the pace. Wind drives most of the growth, expanding 900 MW by 2020. However, the implementation of auctions for 850 MW under the 1 000 MW Integrated Wind Program has been slower than expected, resulting in a slight downward revision compared to MTRMR 2014. Still, a qualified consortium of developers was selected for the second round in 2015, indicating that continued development is expected. More activity is seen with STE projects under the Moroccan Solar Plan with the expected commissioning of the 160 MW Noor I this year and some 350 MW which recently reached financial closure from Noor II and III. In total, these developments drive 500 MW of STE growth. Solar PV is expected to reach a cumulative 0.6 GW, driven by utility-scale
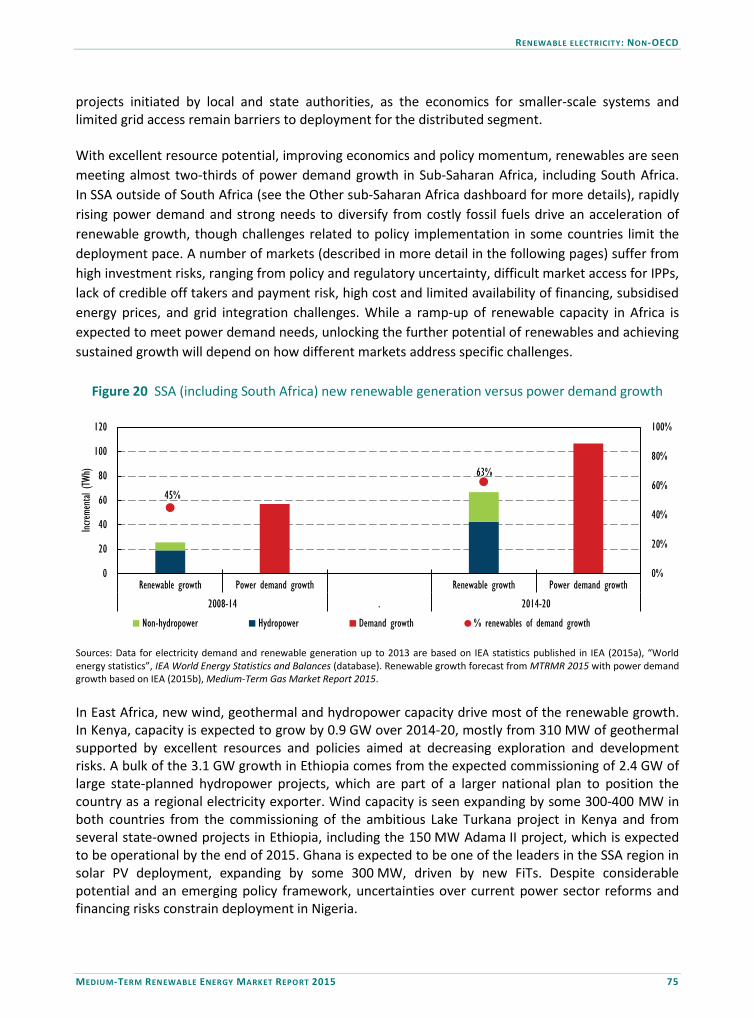
RENEWABLE ELECTRICITY: NON-OECD
MEDIUM-TERM RENEWABLE ENERGY MARKET REPORT 2015 75
projects initiated by local and state authorities, as the economics for smaller-scale systems and limited grid access remain barriers to deployment for the distributed segment. With excellent resource potential, improving economics and policy momentum, renewables are seen meeting almost two-thirds of power demand growth in Sub-Saharan Africa, including South Africa. In SSA outside of South Africa (see the Other sub-Saharan Africa dashboard for more details), rapidly rising power demand and strong needs to diversify from costly fossil fuels drive an acceleration of renewable growth, though challenges related to policy implementation in some countries limit the deployment pace. A number of markets (described in more detail in the following pages) suffer from high investment risks, ranging from policy and regulatory uncertainty, difficult market access for IPPs, lack of credible off takers and payment risk, high cost and limited availability of financing, subsidised energy prices, and grid integration challenges. While a ramp-up of renewable capacity in Africa is expected to meet power demand needs, unlocking the further potential of renewables and achieving sustained growth will depend on how different markets address specific challenges.
Figure 20 SSA (including South Africa) new renewable generation versus power demand growth
45%
63%
0%
20%
40%
60%
80%
100%
0
20
40
60
80
100
120
Renewable growth Power demand growth Renewable growth Power demand growth
2008-14 . 2014-20
Increm
ental
(TWh)
Non-hydropower Hydropower Demand growth % renewables of demand growth
Sources: Data for electricity demand and renewable generation up to 2013 are based on IEA statistics published in IEA (2015a), “World energy statistics”, IEA World Energy Statistics and Balances (database). Renewable growth forecast from MTRMR 2015 with power demand growth based on IEA (2015b), Medium-Term Gas Market Report 2015. In East Africa, new wind, geothermal and hydropower capacity drive most of the renewable growth. In Kenya, capacity is expected to grow by 0.9 GW over 2014-20, mostly from 310 MW of geothermal supported by excellent resources and policies aimed at decreasing exploration and development risks. A bulk of the 3.1 GW growth in Ethiopia comes from the expected commissioning of 2.4 GW of large state-planned hydropower projects, which are part of a larger national plan to position the country as a regional electricity exporter. Wind capacity is seen expanding by some 300-400 MW in both countries from the commissioning of the ambitious Lake Turkana project in Kenya and from several state-owned projects in Ethiopia, including the 150 MW Adama II project, which is expected to be operational by the end of 2015. Ghana is expected to be one of the leaders in the SSA region in solar PV deployment, expanding by some 300 MW, driven by new FiTs. Despite considerable potential and an emerging policy framework, uncertainties over current power sector reforms and financing risks constrain deployment in Nigeria.
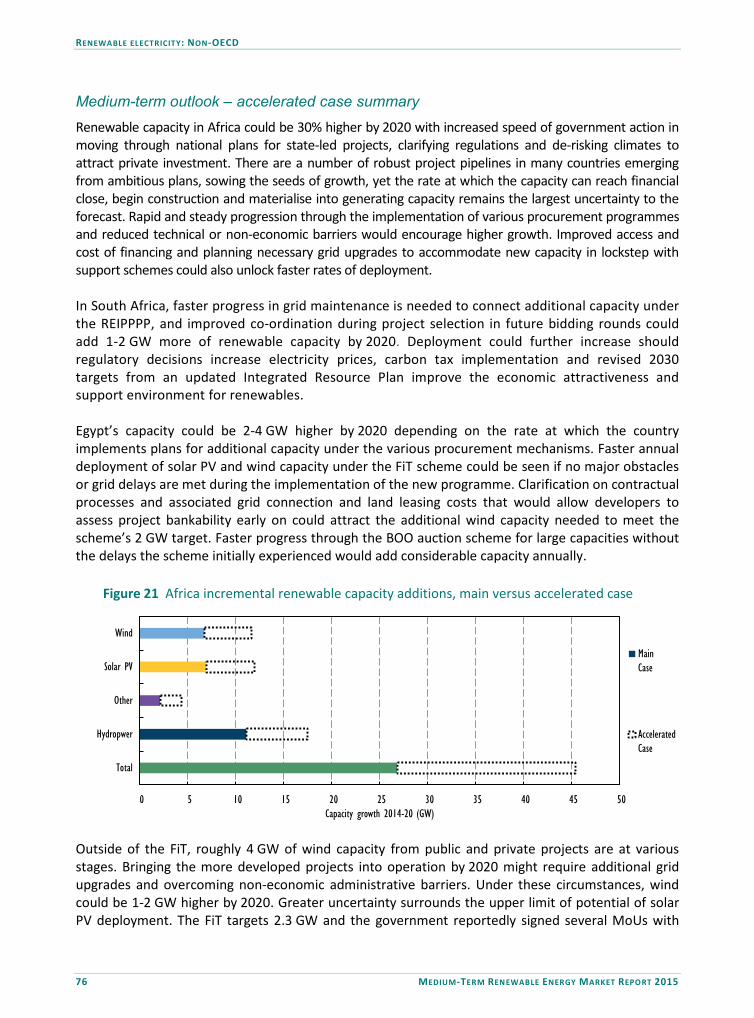
RENEWABLE ELECTRICITY: NON-OECD
76 MEDIUM-TERM RENEWABLE ENERGY MARKET REPORT 2015
Medium-term outlook – accelerated case summary Renewable capacity in Africa could be 30% higher by 2020 with increased speed of government action in moving through national plans for state-led projects, clarifying regulations and de-risking climates to attract private investment. There are a number of robust project pipelines in many countries emerging from ambitious plans, sowing the seeds of growth, yet the rate at which the capacity can reach financial close, begin construction and materialise into generating capacity remains the largest uncertainty to the forecast. Rapid and steady progression through the implementation of various procurement programmes and reduced technical or non-economic barriers would encourage higher growth. Improved access and cost of financing and planning necessary grid upgrades to accommodate new capacity in lockstep with support schemes could also unlock faster rates of deployment.
In South Africa, faster progress in grid maintenance is needed to connect additional capacity under the REIPPPP, and improved co-ordination during project selection in future bidding rounds could add 1-2 GW more of renewable capacity by 2020. Deployment could further increase should regulatory decisions increase electricity prices, carbon tax implementation and revised 2030 targets from an updated Integrated Resource Plan improve the economic attractiveness and support environment for renewables.
Egypt’s capacity could be 2-4 GW higher by 2020 depending on the rate at which the country implements plans for additional capacity under the various procurement mechanisms. Faster annual deployment of solar PV and wind capacity under the FiT scheme could be seen if no major obstacles or grid delays are met during the implementation of the new programme. Clarification on contractual processes and associated grid connection and land leasing costs that would allow developers to assess project bankability early on could attract the additional wind capacity needed to meet the scheme’s 2 GW target. Faster progress through the BOO auction scheme for large capacities without the delays the scheme initially experienced would add considerable capacity annually.
Figure 21 Africa incremental renewable capacity additions, main versus accelerated case
0 5 10 15 20 25 30 35 40 45 50
Total
Hydropwer
Other
Solar PV
Wind
Capacity growth 2014-20 (GW)
MainCase
AcceleratedCase
Outside of the FiT, roughly 4 GW of wind capacity from public and private projects are at various stages. Bringing the more developed projects into operation by 2020 might require additional grid upgrades and overcoming non-economic administrative barriers. Under these circumstances, wind could be 1-2 GW higher by 2020. Greater uncertainty surrounds the upper limit of potential of solar PV deployment. The FiT targets 2.3 GW and the government reportedly signed several MoUs with
RENEWABLE ELECTRICITY: NON-OECD
MEDIUM-TERM RENEWABLE ENERGY MARKET REPORT 2015 77
developers totalling 8 GW over the longer term. Assuming the grid can accommodate higher penetration levels, 1-1.5 GW more solar PV capacity could be commissioned by 2020 if the larger plans materialise and smaller projects under the FiT progress at faster rates. In Morocco, almost 1 GW more of wind and STE could be commissioned by 2020 should the government move through auctions at a quicker pace. With falling system prices and good solar resources, self-consumption PV projects for large consumers could become increasingly economically attractive. If barriers to grid access were removed and net-metering schemes emerged, solar PV could exceed 1 GW by 2020. In Tunisia, deployment could accelerate if the most recent regulations open up the generation to private-sector participation. In April 2015, the Renewable Energy Law was adopted, targeting 30% of renewable electricity by 2030. Should resulting frameworks address barriers to private-sector participation, good resources and supportive environment for private-sector participation could drive higher deployment levels of solar PV and wind (~600 MW). In SSA, faster renewable growth could be achieved depending on the rate at which governments can address challenges limiting deployment. Pipelines from state-led projects are full yet depend on the pace of administrative implementation as well as securing financing for projects and any associated grid infrastructure upgrades to integrate new capacity. Increased capacity could be seen if both economic and non-economic barriers to attracting new commercial entrants were overcome. Greater policy support and redesign of existing incentives to ensure project bankability in a given market would increase the economic attractiveness of certain technologies. Efforts aimed at lowering investment risk such as strengthening the financial standing of the off taker and providing longer-term certainty over revenues would also attract more private developers to certain markets. The removal of fossil fuel subsides and implementing more cost-reflective electricity tariffs would not only increase the economic attractiveness of renewable projects but also lighten the financial strain on cash-strapped utilities. In markets with existing IPP interest, clearer regulatory frameworks guiding the process of purchasing power would facilitate the pace of development.
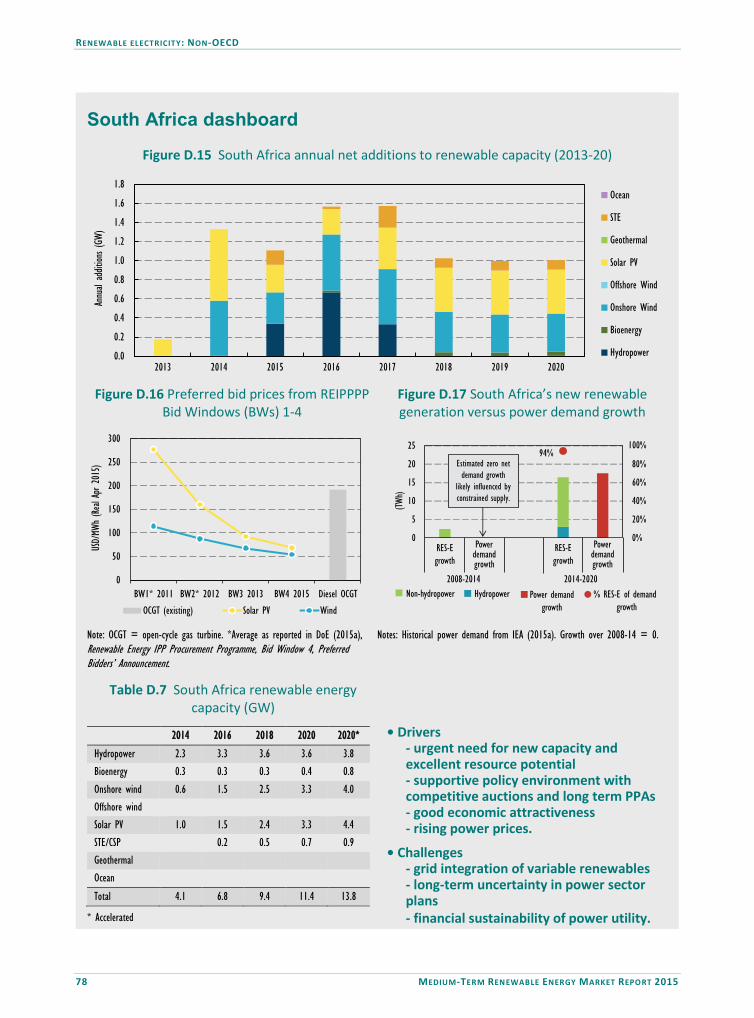
RENEWABLE ELECTRICITY: NON-OECD
78 MEDIUM-TERM RENEWABLE ENERGY MARKET REPORT 2015
South Africa dashboard
Figure D.15 South Africa annual net additions to renewable capacity (2013-20)
0.0
0.2
0.4
0.6
0.8
1.0
1.2
1.4
1.6
1.8
2013 2014 2015 2016 2017 2018 2019 2020
Annu
al ad
dition
s (GW
)
Ocean
STE
Geothermal
Solar PV
Offshore Wind
Onshore Wind
Bioenergy
Hydropower
Figure D.16 Preferred bid prices from REIPPPP Bid Windows (BWs) 1-4
Figure D.17 South Africa’s new renewable generation versus power demand growth
0
50
100
150
200
250
300
BW1* 2011 BW2* 2012 BW3 2013 BW4 2015 Diesel OCGT
USD/
MWh
(Real
Apr 2
015)
OCGT (existing) Solar PV Wind
Note: OCGT = open-cycle gas turbine. *Average as reported in DoE (2015a), Renewable Energy IPP Procurement Programme, Bid Window 4, Preferred Bidders’ Announcement.
Notes: Historical power demand from IEA (2015a). Growth over 2008-14 = 0.
Table D.7 South Africa renewable energy capacity (GW)
2014 2016 2018 2020 2020*
Hydropower 2.3 3.3 3.6 3.6 3.8 Bioenergy 0.3 0.3 0.3 0.4 0.8
Onshore wind 0.6 1.5 2.5 3.3 4.0 Offshore wind Solar PV 1.0 1.5 2.4 3.3 4.4 STE/CSP 0.2 0.5 0.7 0.9 Geothermal Ocean
Total 4.1 6.8 9.4 11.4 13.8
* Accelerated
• Drivers- urgent need for new capacity andexcellent resource potential- supportive policy environment withcompetitive auctions and long term PPAs- good economic attractiveness- rising power prices.
• Challenges- grid integration of variable renewables- long-term uncertainty in power sectorplans- financial sustainability of power utility.
94%
0%
20%
40%
60%
80%
100%
0
5
10
15
20
25
RES-Egrowth
Powerdemandgrowth
RES-Egrowth
Powerdemandgrowth
2008-2014 2014-2020
(TWh)
Non-hydropower Hydropower Power demand growth
% RES-E of demandgrowth
Estimated zero net demand growth
likely influenced by constrained supply.
RENEWABLE ELECTRICITY: NON-OECD
MEDIUM-TERM RENEWABLE ENERGY MARKET REPORT 2015 79
Medium-term forecast: South Africa main case
South Africa’s renewable generation should expand by 17 TWh over 2014-20, driven by an urgent need for additional capacity and competitive auctions stimulating a robust pipeline. Yet grid integration is emerging as a bottleneck, emphasising the importance of co-ordinated planning. Urgent need for additional capacity to meet demand amid state utility’s financial challenges. Eskom is struggling to meet short-term demand as it grapples with unavailable generating capacity. The disruptions stem from inadequate maintenance of ageing plants and delays in new-build capacity. As a result, load-shedding began in 2014 and has continued regularly through the first half of 2015, raising concerns over the knock-on effect on the economy. Costly short-term solutions to meet demand have put Eskom in a liquidity crunch, as the utility was forced to run peaking plants (i.e. OCGTs) using diesel at utilisation rates significantly higher than originally budgeted and sought to recover those costs by raising electricity prices (Eskom, 2015). To alleviate supply constraints, the government is pressing forward with capacity procurement for renewables, coal, co-generation, gas and nuclear (DOE, 2015b). Yet the only programme under way is the ongoing REIPPPP, the main driver of renewable deployment over the medium term. Renewables represent an increasingly cost-effective large-scale power option as competitive auctions continue to drive down bid prices. Preferred projects amounting to 1.1 GW from BW4 were announced in April 2015 and achieved the lowest average bids to date, USD 68/MWh (821 rand [ZAR]/MWh) for PV and USD 54/MWh (ZAR 646/MWh) for wind. Greater economies of scale are being achieved as the median project size for PV reached 75 MW in BW4 compared to 28 MW in BW1, and climbed to 140 MW up from 75 MW for wind, but the process is squeezing out smaller developers facing higher financing costs. Nonetheless, when compared with the utility’s cost estimates of USD 192/MWh (ZAR 2 307/MWh) for the diesel OGCTs required to meet demand, the recent bids suggest PV and wind are cost-effective options to quickly add capacity to South Africa’s tight system, as evidenced by the government’s unexpected extension of BW4 to allocate extra capacity (Eskom, 2015; DOE, 2015c). The uncertainty over future coal costs may also increase the attractiveness of renewables over the medium term as Eskom’s beneficially priced coal supply contracts near expiration and a possible carbon tax looms. However, the extent to which further declines in bid prices are possible will likely depend on the cost and availability of grid connections, which have become an uncertainty for future projects. Grid integration is emerging as a significant challenge to renewable deployment. Some approved projects are located in the resource-rich Northern and Western Cape and require grid upgrades to transmit the power to load centres; these investments pose a challenge to the financially constrained utility. Uncertainty over Eskom’s ability to connect selected projects to the grid delayed the financial closure of 1.5 GW from BW3 and stalled the announcement of 1 GW of winning bids from BW4, raising questions over the quantity and timeliness of future grid connections. In light of financial constraints, Eskom revised its transmission development plan (TPD) for 2015-24 and targets a 2017 connection date for all 3.9 GW from BW1-3 and from 2018 onward budgets for 400 MW of wind and 100 MW of STE to be connected annually (Eskom, 2014). Still, the TPD warns that any capacity beyond these amounts requiring additional deep strengthening are at risk, raising questions over grid connection costs for such projects.
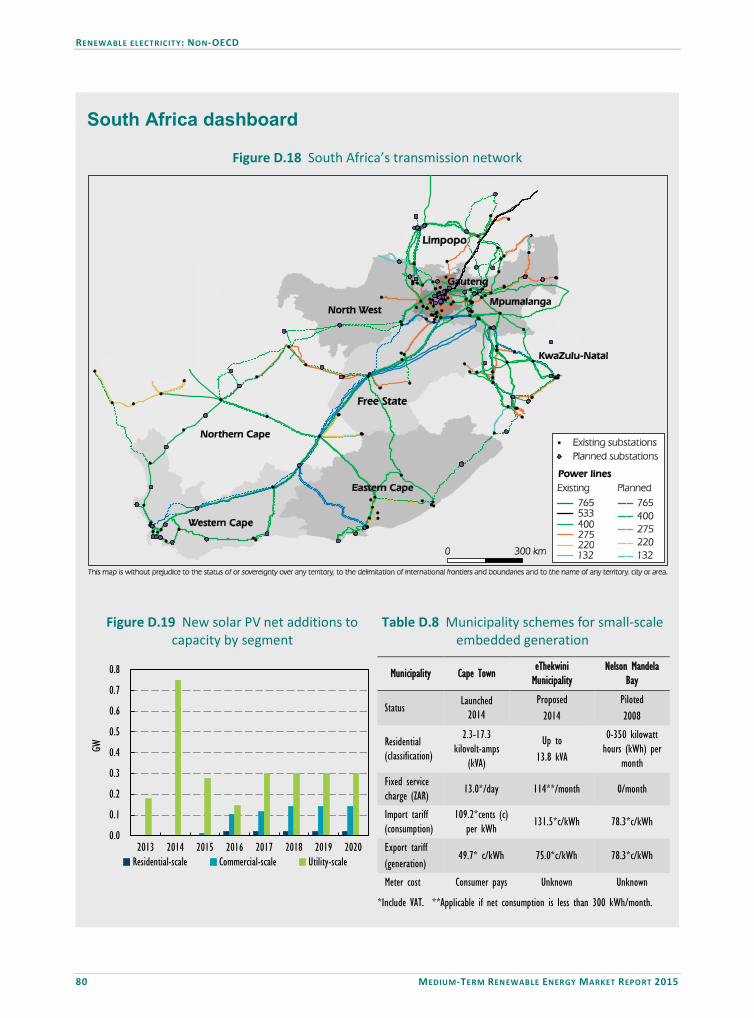
RENEWABLE ELECTRICITY: NON-OECD
80 MEDIUM-TERM RENEWABLE ENERGY MARKET REPORT 2015
South Africa dashboard
Figure D.18 South Africa’s transmission network
Figure D.19 New solar PV net additions to capacity by segment
Table D.8 Municipality schemes for small-scale embedded generation
0.0
0.1
0.2
0.3
0.4
0.5
0.6
0.7
0.8
2013 2014 2015 2016 2017 2018 2019 2020
GW
Residential-scale Commercial-scale Utility-scale
Municipality Cape Town eThekwini Municipality
Nelson Mandela Bay
Status Launched 2014
Proposed 2014
Piloted 2008
Residential (classification)
2.3-17.3 kilovolt-amps
(kVA)
Up to 13.8 kVA
0-350 kilowatt hours (kWh) per
month
Fixed service charge (ZAR) 13.0*/day 114**/month 0/month
Import tariff (consumption)
109.2*cents (c) per kWh
131.5*c/kWh 78.3*c/kWh
Export tariff (generation)
49.7* c/kWh 75.0*c/kWh 78.3*c/kWh
Meter cost Consumer pays Unknown Unknown
*Include VAT. **Applicable if net consumption is less than 300 kWh/month.
RENEWABLE ELECTRICITY: NON-OECD
MEDIUM-TERM RENEWABLE ENERGY MARKET REPORT 2015 81
Thus, deployment over the medium term should be guided by this pace, unless alternative financing solutions are found for projects requiring deep strengthening. Deployment rates will also depend on the location of future REIPPPP projects relative to these grid constraints. The REIPPPP continues to generate a robust project pipeline, but integrated power sector planning remains essential to harness this development. To date, at least 5.2 GW of capacity has been procured through four BWs, and the supply shortage has prompted the government to unexpectedly procure an additional 1.8 GW in an expedited round prior to BW5, and request a 6.3 GW determination from the energy regulator to expand the REIPPPP over the longer term (DOE, 2015c). While this creates a promising pipeline, uncertainty exists over what technologies are targeted, and the longer term remains unclear as an official update of the 2030 targets in the Integrated Resource Plan (IRP) is overdue. The delays caused by grid connection issues highlight the risk of an uncoordinated approach to capacity procurement and infrastructure planning. Over the medium term, deployment rates will likely depend on the extent to which a more synchronised approach to grid planning and project selection are factored into future REIPPPP rounds. The government announced that BW5 will be redesigned to take into account the grid issues when opened in 2016, which should help address some risk. The economic attractiveness of distributed PV will likely depend on how incentive programmes and electricity tariffs evolve over the medium term. National regulations for remuneration of distributed generation are being drafted with plans to finalise by the end of 2015, yet the impact on already-existing schemes at the municipal level is unknown. While various programmes to credit electricity bills are emerging in several municipalities, current incentive levels are expected to be favourable only for large consumers. However should Eskom’s requests to further raise tariffs be approved, residential consumers may find rooftop PV more economically attractive. In all, renewable capacity is expected to grow 7.3 GW over 2014-20, driven almost entirely by procured capacity from the REIPPPP, yet likely limited by the rate at which grid connections can be achieved, particularly after 2017. Deployment will likely be driven by technologies that can connect to the grid with minimal upgrade, at lowest cost, and help meet peak demand. This forecast expects wind to reach 3.3 GW and STE to reach 0.7 GW, with annual growth post-2017 guided by the timeline established by Eskom’s TPD. Solar PV should reach 3.3 GW, mostly from utility-scale projects growing at rates outlined in the original IRP2010 in lieu of an updated plan. Distributed PV is expected to expand by 0.8 GW, based on existing schemes for net metering and rising electricity prices for large consumers who need reliable power to sustain economic activity.
Medium-term forecast: South Africa accelerated case
Additional deployment over the medium term will depend on the rate at which new capacity can connect to the grid, and ultimately, how the cost of such connections is factored into future REIPPPP rounds. Financing solutions such as “self-build” connections and designated bidding zones to better co-ordinate and fund grid upgrades could increase annual growth for utility-scale PV to 350-430 MW and wind to 500-600 MW after 2017. Distributed PV could be 250-450 MW higher by 2020 should electricity rates rise or load-shedding persists.

RENEWABLE ELECTRICITY: NON-OECD
82 MEDIUM-TERM RENEWABLE ENERGY MARKET REPORT 2015
Other SSA dashboard
Figure D.20 SSA annual net additions to renewable capacity (2013-20)
0.0
0.5
1.0
1.5
2.0
2.5
3.0
2013 2014 2015 2016 2017 2018 2019 2020
Annu
al ad
dition
s (GW
)
Ocean
STE
Geothermal
Solar PV
Offshore Wind
Onshore Wind
Bioenergy
Hydropower
Figure D.21 Hydropower capacity by region (2014-20)
Figure D.23 Non-hydropower capacity additions by technology (2014-20)
Other SSAEthiopiaAngola
0
5
10
15
20
25
30
35
40
2014 2020 2020
Main casecumulative
Additions Main casecumulative
Acceleratedcumulative
GW
0.0
0.2
0.4
0.6
0.8
1.0
2013 2014 2015 2016 2017 2018 2019 2020
Annu
al ad
dition
s (GW
)
Solar PV Geothermal Onshore wind Bioenergy
Table D.9 Sub-Saharan Africa renewable energy capacity (2014-20)
2014 2016 2018 2020 2020*
Hydropower 20.6 23.0 26.6 30.0 35.8
Bioenergy 1.0 1.1 1.2 1.3 2.0
Onshore wind 0.3 0.4 0.7 1.3 2.5
Offshore wind
Solar PV 0.3 0.8 1.5 2.3 3.7
STE/CSP
Geothermal 0.6 0.6 0.8 1.0 1.5
Ocean
Total 22.7 25.8 30.8 35.9 45.5
* Accelerated
• Drivers- rapid rising power demand, diversification needs and excellent resources - emerging portfolio of policy frameworks - cost-effective power in certain conditions - electrification by distributed technologies.
• Challenges- high upfront costs and financing, subsidised prices - grid integration and interconnection - policy uncertianties, regulatory barriers - financial credibity of off takers, currency risk.

RENEWABLE ELECTRICITY: NON-OECD
MEDIUM-TERM RENEWABLE ENERGY MARKET REPORT 2015 83
Medium-term forecast: other SSA main case
For SSA (outside of South Africa), rapidly rising power demand, strong diversification needs and excellent resources should drive a doubling of renewable capacity over 2014 to 2020. A portfolio of renewable policy frameworks have emerged in the region to support deployment, and renewable sources can potentially offer cost-effective solutions to quickly meet new generation needs in the face of generally high costs associated with existing fossil fuel generation, with significant oil use in some countries. But a number of markets suffer from significant risks to development, including difficult market access for IPPs, lack of credible off takers, policy and regulatory uncertainties, high cost and limited availability of financing, and grid integration challenges. As such, growth could be much higher, as described below. While these themes apply to a number of SSA countries, this dashboard focuses on the four most dynamic markets for expected renewable activity over the medium term – Ethiopia, Kenya, Nigeria and Ghana – as a proxy for larger regional development. SSA countries face huge challenges in meeting fast-growing power demand and improving electricity access, with renewables seen as being a key enabler. Over the medium term, SSA power demand is expected to grow 7% annually, driven by increasing population, urbanisation, electrification needs and industrialisation. Ethiopia, Kenya, Nigeria and Ghana make up more than 30% of total SSA demand, and high annual growth is expected in each market over the medium term. Although shares vary by country, over 70% of the SSA population does not have access to electricity, while grid-connected populations struggle with frequent power outages. In general, insufficient power sector planning and investment have resulted in supply-demand gaps and costly load-shedding, with significant economic impacts. Unreliable grid power hurts industrial productivity and forces the usage of costly backup power solutions, such as diesel generators. In Ghana, for example, the estimated loss of GDP growth from continued lack of power is expected to reach almost 6% by 2017 (MoP, 2015). To this end, renewables are seen as important in energy system planning to meet new demand needs and support economic development. For example, Kenya’s Vision 2030 strategy is prioritising geothermal power to achieve lower electricity prices while improving access, and Ethiopia’s planning sees hydropower exports as a pillar of long-term economic growth. Meanwhile, ambitious electricity access targets across a number of SSA countries open opportunities for increased penetration of modular and off-grid renewable solutions. In Ethiopia, a need for cost-effective power to meet increasing demand and potential electricity trade benefits drive renewable deployment, though insufficient policy frameworks, persistent regulatory barriers and financing challenges limit the pace. The government has factored renewables into larger national energy and economic strategies, but lacks a dedicated policy framework, including clear targets and support incentives, and to date the majority of renewable development has been state led, given the barriers to IPP participation in the power sector. The acceleration and completion of ongoing hydropower projects stand as major objectives, in part for Ethiopia to position itself as a regional power exporter, with two projects (6 GW) under construction and 9 GW planned. While taxes and bonds helped fund ongoing projects, securing additional financing may be a challenge. The government estimates that future costs of hydropower generation below USD 0.05/kWh, would make imports economically attractive to other countries facing existing generation prices of USD 0.15/kWh-USD 0.24/kWh.
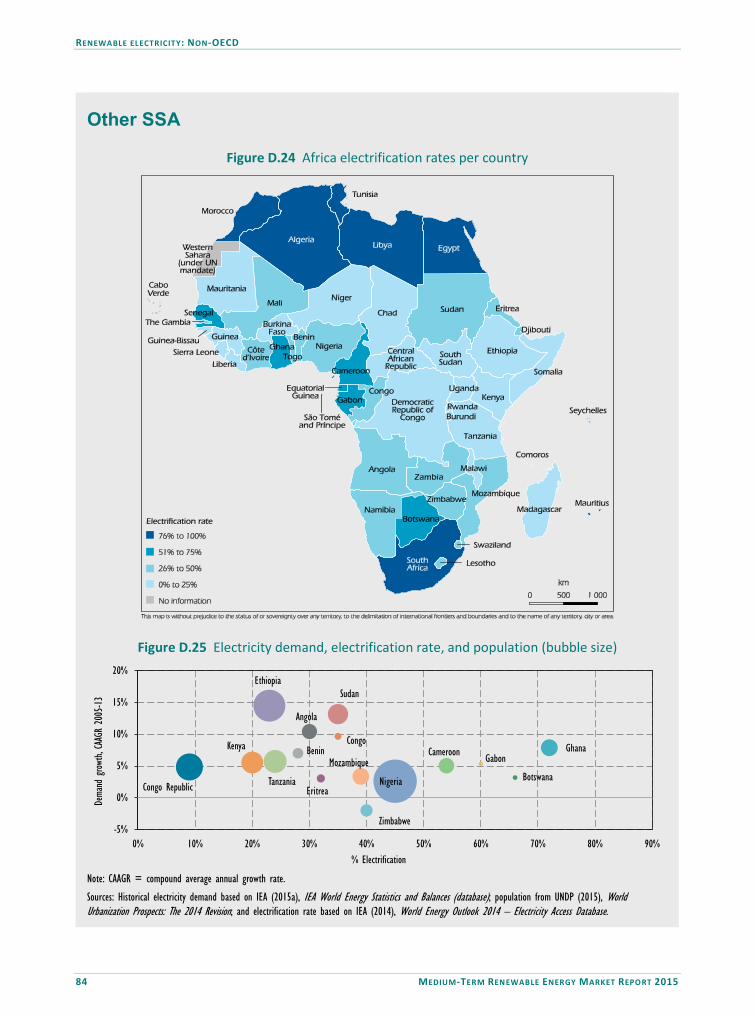
RENEWABLE ELECTRICITY: NON-OECD
84 MEDIUM-TERM RENEWABLE ENERGY MARKET REPORT 2015
Other SSA
Figure D.24 Africa electrification rates per country
Figure D.25 Electricity demand, electrification rate, and population (bubble size)
Angola
Benin
Botswana
CameroonCongo
Congo Republic Eritrea
Ethiopia
GabonGhanaKenya
Nigeria
Sudan
Tanzania
Zimbabwe
Mozambique
-5%
0%
5%
10%
15%
20%
0% 10% 20% 30% 40% 50% 60% 70% 80% 90%
Dema
nd g
rowth, C
AAGR
200
5-13
% Electrification Note: CAAGR = compound average annual growth rate.
Sources: Historical electricity demand based on IEA (2015a), IEA World Energy Statistics and Balances (database); population from UNDP (2015), World Urbanization Prospects: The 2014 Revision; and electrification rate based on IEA (2014), World Energy Outlook 2014 – Electricity Access Database.
RENEWABLE ELECTRICITY: NON-OECD
MEDIUM-TERM RENEWABLE ENERGY MARKET REPORT 2015 85
This is important for bankability (FDRE, 2011; FDRE, 2012). Yet monetising these revenue streams would depend on a realised build-out of regional interconnection, such as the 1 000 MW cross-border Ethio-Kenya transmission line project, which would facilitate access to the East African Power Pool. Increased private investment could help finance and accelerate non-hydro renewable deployment, yet persistent regulatory barriers have deterred IPPs. Moreover, project risks, including high upfront costs associated with geothermal exploration and development, and off taker risk stemming from a lack of cost-reflective end-user prices, also function as deterrents. Yet there are signs of progress as the country’s first IPP project (1 GW of geothermal) signed a PPA in July 2015. Further notable developments include the country’s largest wind farm (150 MW) under construction and plans for some 300 MW of solar PV. Still, in the absence of further de-risking measures and more attractive incentives, the pace of future renewable deployment remains mostly guided by the government’s current hydropower procurement aims. In Kenya, the need to cost-effectively meet growing demand while diversifying the power sector drives renewable deployment, though grid constraints and regulatory barriers act as challenges. Renewables are integrated into power sector development planning, and supported by the establishment of targets and FiTs. In general, Kenya’s power market is open to IPP participation in generation, and a pipeline of some 0.5 GW of onshore wind projects has emerged. Still, needed grid infrastructure upgrades and grid connections can represent a challenge to development. The financial close of the 300 MW Lake Turkana Wind Project (LTWP) was partly delayed over lack of transmission capacity to evacuate power to demand areas. While the financing (supported by state guarantees) of a dedicated transmission line will support LTWP’s development, delays in its completion could pose risks to future projects also seeking to tap into this transmission capacity. Uncertainty over permitting processes and unclear licensing procedures are also barriers for developers. Geothermal electricity is seen as a strategic pillar for development, based on good resource potential and attractive economics, with generation costs estimated between USD 0.06/kWh and USD 0.07/kWh, versus USD 0.12/kWh for the existing power system (Simiyu, 2013; GoK, 2011). High upfront costs related to exploration and development remain a challenge, but the government, through the creation of the Geothermal Development Corporation (GDC), is assuming some of the drilling risk. Despite excellent resources, utility-scale solar PV development remains nascent, raising questions over the attractiveness of FiT levels. Still, more rapid PV expansion should come about through further cost reductions and increased attractiveness of deployment for self-consumption, hybrid mini-grids, and captive systems to replace costly diesel generators and support rural electrification programmes. Small-scale bioenergy applications could also serve these aims. In Ghana, diversification needs, growing demand and a supportive policy environment act as strong deployment drivers, yet persistent regulatory barriers, financing risks and grid constraints limit growth. Ghana’s policy framework consists of a dedicated renewable law accompanied by a portfolio of support policies, including financial incentives (e.g. FiTs), renewable purchase obligations and a dedicated grid code, to realise a target of 10% renewable power by 2020. These measures, combined with a regulatory framework that allows IPPs, have supported the establishment of a robust project pipeline of over 1.8 GW of solar PV and wind projects from IPPs (MoP, 2015). Yet despite relatively high remuneration levels offered by financial incentives, few projects have advanced beyond initial licensing stages.
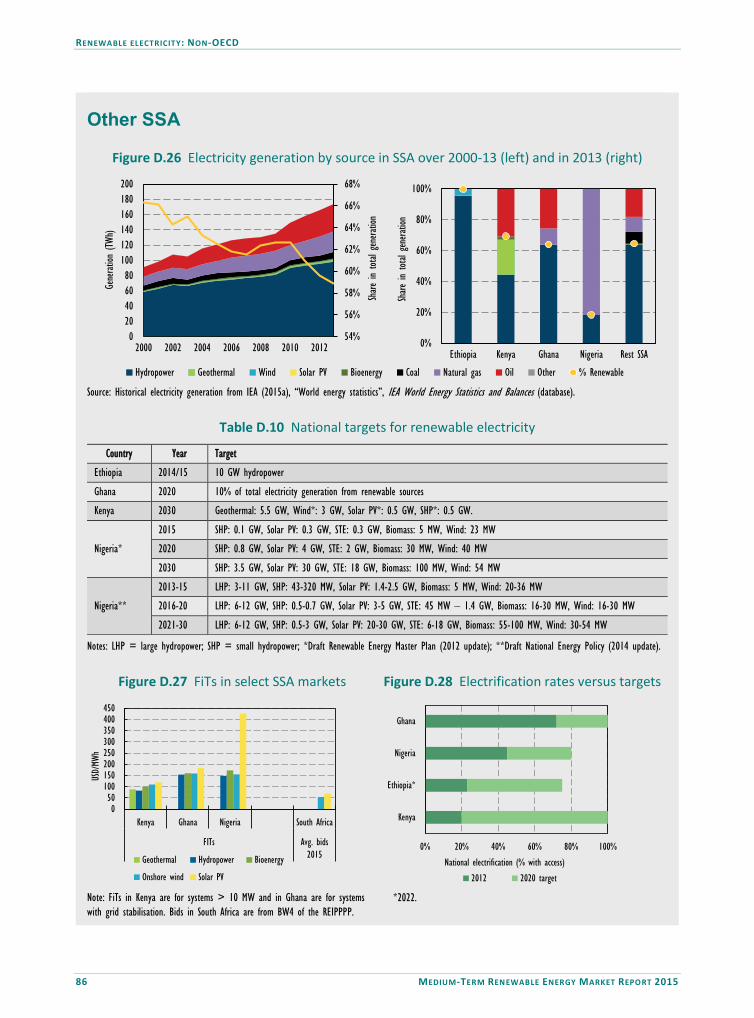
RENEWABLE ELECTRICITY: NON-OECD
86 MEDIUM-TERM RENEWABLE ENERGY MARKET REPORT 2015
Other SSA
Figure D.26 Electricity generation by source in SSA over 2000-13 (left) and in 2013 (right)
0%
20%
40%
60%
80%
100%
Ethiopia Kenya Ghana Nigeria Rest SSA
Share
in to
tal genera
tion
Hydropower Geothermal Wind Solar PV Bioenergy Coal Natural gas Oil Other % Renewable
54%
56%
58%
60%
62%
64%
66%
68%
020406080
100120140160180200
2000 2002 2004 2006 2008 2010 2012
Share
in to
tal genera
tion
Generat
ion (T
Wh)
Source: Historical electricity generation from IEA (2015a), “World energy statistics”, IEA World Energy Statistics and Balances (database).
Table D.10 National targets for renewable electricity
Country Year Target
Ethiopia 2014/15 10 GW hydropower
Ghana 2020 10% of total electricity generation from renewable sources
Kenya 2030 Geothermal: 5.5 GW, Wind*: 3 GW, Solar PV*: 0.5 GW, SHP*: 0.5 GW.
Nigeria*
2015 SHP: 0.1 GW, Solar PV: 0.3 GW, STE: 0.3 GW, Biomass: 5 MW, Wind: 23 MW
2020 SHP: 0.8 GW, Solar PV: 4 GW, STE: 2 GW, Biomass: 30 MW, Wind: 40 MW
2030 SHP: 3.5 GW, Solar PV: 30 GW, STE: 18 GW, Biomass: 100 MW, Wind: 54 MW
Nigeria**
2013-15 LHP: 3-11 GW, SHP: 43-320 MW, Solar PV: 1.4-2.5 GW, Biomass: 5 MW, Wind: 20-36 MW
2016-20 LHP: 6-12 GW, SHP: 0.5-0.7 GW, Solar PV: 3-5 GW, STE: 45 MW – 1.4 GW, Biomass: 16-30 MW, Wind: 16-30 MW
2021-30 LHP: 6-12 GW, SHP: 0.5-3 GW, Solar PV: 20-30 GW, STE: 6-18 GW, Biomass: 55-100 MW, Wind: 30-54 MW
Notes: LHP = large hydropower; SHP = small hydropower; *Draft Renewable Energy Master Plan (2012 update); **Draft National Energy Policy (2014 update).
Figure D.27 FiTs in select SSA markets Figure D.28 Electrification rates versus targets
050
100150200250300350400450
Kenya Ghana Nigeria South Africa
FITs Avg. bids2015
USD/
MWh
Geothermal Hydropower Bioenergy
Onshore wind Solar PV Note: FiTs in Kenya are for systems > 10 MW and in Ghana are for systems with grid stabilisation. Bids in South Africa are from BW4 of the REIPPPP.
0% 20% 40% 60% 80% 100%
Kenya
Ethiopia*
Nigeria
Ghana
National electrification (% with access)
2012 2020 target *2022.

RENEWABLE ELECTRICITY: NON-OECD
MEDIUM-TERM RENEWABLE ENERGY MARKET REPORT 2015 87
One reason stems from policy design details for the FiTs, whose relatively short duration (ten years) does not match well with longer available loan tenors. Lack of available resource assessments have been cited as an additional cost for developers. Off taker and project payment risks are also a concern as the purchasing utilities face financial difficulties. Moreover, grid constraints have forced the government to apply a temporary cap (150 MW) to new developments under the FiTs pending ongoing grid upgrades. Still, the government is making efforts to reduce these challenges, through, for example, reinforcing the financial position of the utilities and investigating the adoption of FiT payment guarantees for developers. Finally, Nigeria’s fast-growing demand and emerging policy support for renewables make it another significant market for activity, though policy uncertainty, an underdeveloped institutional framework, and financing challenges limit the pace of deployment. The government sees renewables playing a prominent role in meeting future demand with a range of ambitious goals (e.g. 20-30 GW of solar PV by 2030) proposed in various drafts of energy policies. However, uncertainty remains over the ultimate adoption of a renewable energy law and codification of one set of targets. The presence, since 2012, of FiTs at very generous levels for solar PV (USD 450/MWh) has helped spur plans for over 5 GW of projects, but the development of many of these remains uncertain. The regulatory framework for power purchase is currently under development and the progress of ongoing power reforms, which could improve the situation, is difficult to assess. Moreover, projects are further hampered by the high cost and reduced availability of finance, in part due to the policy design of the FiT, which is available for a relatively short duration, political risks from conflict in the northern part of the country, and regulatory risks over potential FiT changes ahead. Risk reduction efforts from development institutions are helping to foster a more supportive investment environment, such as the provision of partial risk guarantees from the World Bank, aimed at minimising off taker risks. Off-grid solar PV is likely to see acceleration over the medium term from development aid programmes targeting installations in hospitals and schools as well as solar lamps for residential use. Across all markets, an acute need to expand electrification and provide grid-connected consumers with backup power suggests significant potential for small-scale solar PV. To date, most PV pilot projects have been subsidised or based on development aid while private-sector initiatives face barriers, including lack of supportive regulatory frameworks and viable business models relative to revenues of the populations served. Still, a number of government and development programmes see solar PV in stand-alone systems or mini-grids as the most cost-effective way to bring new power to areas where the cost of expanding the grid is high compared with the population density. PV systems and light-emitting diode (LED) lamps of just a few watts can provide minimum light, mobile charging and radio; a savings of a couple dollars a week in kerosene expenditures. Poverty, however, exacerbates the recurrent issue of high upfront expenditures, even with cost-competitive renewables. Emerging private-sector “pay-as-you-go” business models based on mobile texting and paying for the service are driving deployment in East African countries. Hybridisation of existing mini-grids running on diesel generation that integrates solar PV from 1-10 MW are being explored, based on significant cost difference between PV power and electricity from diesel engines. However, the hardware required to facilitate the integration of both energy sources at present increases the cost of smaller grids.
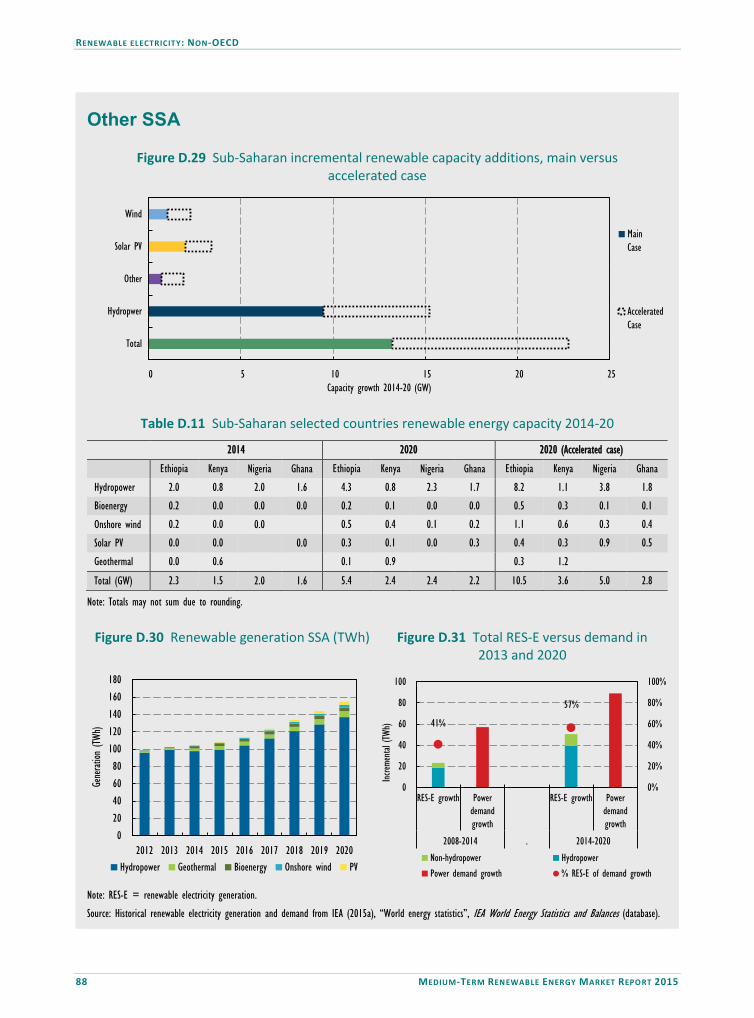
RENEWABLE ELECTRICITY: NON-OECD
88 MEDIUM-TERM RENEWABLE ENERGY MARKET REPORT 2015
Other SSA
Figure D.29 Sub-Saharan incremental renewable capacity additions, main versus accelerated case
0 5 10 15 20 25
Total
Hydropwer
Other
Solar PV
Wind
Capacity growth 2014-20 (GW)
MainCase
AcceleratedCase
Table D.11 Sub-Saharan selected countries renewable energy capacity 2014-20
2014 2020 2020 (Accelerated case)
Ethiopia Kenya Nigeria Ghana Ethiopia Kenya Nigeria Ghana Ethiopia Kenya Nigeria Ghana
Hydropower 2.0 0.8 2.0 1.6 4.3 0.8 2.3 1.7 8.2 1.1 3.8 1.8
Bioenergy 0.2 0.0 0.0 0.0 0.2 0.1 0.0 0.0 0.5 0.3 0.1 0.1
Onshore wind 0.2 0.0 0.0 0.5 0.4 0.1 0.2 1.1 0.6 0.3 0.4
Solar PV 0.0 0.0 0.0 0.3 0.1 0.0 0.3 0.4 0.3 0.9 0.5
Geothermal 0.0 0.6 0.1 0.9 0.3 1.2
Total (GW) 2.3 1.5 2.0 1.6 5.4 2.4 2.4 2.2 10.5 3.6 5.0 2.8
Note: Totals may not sum due to rounding.
Figure D.30 Renewable generation SSA (TWh) Figure D.31 Total RES-E versus demand in 2013 and 2020
020406080
100120140160180
2012 2013 2014 2015 2016 2017 2018 2019 2020
Generat
ion (T
Wh)
Hydropower Geothermal Bioenergy Onshore wind PV
41%
57%
0%
20%
40%
60%
80%
100%
0
20
40
60
80
100
RES-E growth Powerdemandgrowth
RES-E growth Powerdemandgrowth
2008-2014 . 2014-2020
Increm
ental
(TWh)
Non-hydropower HydropowerPower demand growth % RES-E of demand growth
Note: RES-E = renewable electricity generation.
Source: Historical renewable electricity generation and demand from IEA (2015a), “World energy statistics”, IEA World Energy Statistics and Balances (database).

RENEWABLE ELECTRICITY: NON-OECD
MEDIUM-TERM RENEWABLE ENERGY MARKET REPORT 2015 89
For larger stand-alone systems, falling system prices and the high cost of diesel generators are making solar PV economically attractive for large electricity consumers (i.e. the mining industry). Overall, SSA renewable capacity is expected to increase almost 60% over 2014-20, as the region adds 13 GW, with over 70% (10 GW) from hydropower alone. Ethiopia and Angola lead hydropower deployment with over 5 GW combined from several large projects. Non-hydropower renewable capacity is seen more than doubling over the medium term, led by solar PV, expanding by 2 GW driven by utility-scale projects in Ghana, Ethiopia and Cameroon and smaller-scale deployment in other countries. The modular nature of PV and a need for off-grid power solutions to provide greater backup to on-grid customers should drive development for industrial self-consumption and mini-grids for both urban and rural electrification. Kenya and Ethiopia are expected to deploy most of the 1.3 GW of new wind capacity, though small projects in Ghana and Nigeria are also expected on the assumption that financing will be secured. The development of small-scale (e.g. 15 MW or less) plants to serve local communities located in rural areas should drive most of the 0.3 GW of expected bioenergy additions, especially where there are agricultural residues, as in Kenya, Ethiopia and Rwanda.
Medium-term forecast: Other SSA accelerated case
In Kenya, renewable capacity could be some 700 MW to 1.3 GW higher by 2020, if planned projects secure financing and attract developers faster. The government plans over 500 MW of geothermal projects particularly targeting private investors. If economically attractive sites from the GDC became available more quickly, some 100-300 MW more of geothermal could be installed in Kenya by 2020. This may imply a growing use of mobile wellheads technology and an increased use of the GDC business models selling pre-drilled steam to IPPs, removing exploration risks for investors and allowing smaller projects to generate power sooner. Solar PV capacity could be 200 MW higher by 2020 should project economics under the FiT improve. Wind could be 200 MW higher if financing is secured and the grid poses no constraints. In Ethiopia, the upside to deployment over the medium term should mostly be guided by the pace of the government implementing planned projects, yet should more rapid IPP participation occur, non-hydropower technologies could see more expansion. The ability to secure financing for any hydropower projects with outstanding construction requirements as well as for any necessary transmission line upgrades and interconnections will be particularly decisive for new-build hydropower deployment. Particularly for larger projects, progress may also depend on overcoming any barriers to social acceptance. Should these barriers be overcome, an additional 3.5-3.8 GW of hydropower may be deployed. IPP expansion in geothermal, wind and solar PV has potential and depends on clarifying regulations for power contracts with new market entrants. To this end, capacity in Ethiopia could be 4-5 GW more by 2020. In Ghana and Nigeria, adjusting policy design and reducing financial barriers would likely attract more developers to untapped solar and wind resources. Realigning FiTs and contract durations with project economics may increase bankable projects. Strengthening of the financial status of the power sector with guarantees would reduce overall project risks and costs as well. Overall, renewable capacity could be 3 GW higher for both markets combined.

RENEWABLE ELECTRICITY: NON-OECD
90 MEDIUM-TERM RENEWABLE ENERGY MARKET REPORT 2015
Asia Recent trends Renewable power in Asia (excluding China) increased by 11% in 2013 to reach over 17% of total power generation. In general, power in non-OECD Asia countries remains dependent on coal, which accounted for 50% of regional generation in 2013. The region has strong diversification and new generation needs that are increasingly met by renewables, and increasingly ambitious renewable deployment targets have recently emerged in some markets, reinforced by a portfolio of support policies. Still, some areas suffer from high levels of non-economic barriers, stop-and-go policy making and challenging investment environments, hampering deployment to date. In 2013, India’s renewable sources represented 17% of power generation. In fiscal year (FY) 2014, renewables constituted about 20% of overall capacity additions (25 GW) in a power system still dominated by coal. Hydropower generation declined by 4% year-on-year with lower reservoir levels. At the time of writing, the government had raised concerns of weaker rains during the 2015 monsoon season, which could impact output this year. Hydropower capacity expanded by 1.5 GW in 2014 with several large projects commissioned – the 520 MW Parbati III, 410 MW Rampur and 330 MW Srinagar plants – amid the continued development of a larger project pipeline to meet ambitious goals to add over 10 GW in total of large hydropower over 2012-17 under the 12th Five-Year Plan (FYP). Still, recent strong growth masks persistent challenges to expanding hydro capacity. Local acceptance and environmental impact concerns have slowed some large hydro development in northeast states – in May, the Indian government reportedly halted development of the 3.1 GW Etalin plant pending further environmental reviews. In the meantime, the government released in early 2015 a National Mission on Small Hydro (NMSH), to stimulate 5 GW over five years of plants up to 25 MW that could address some of the local impact concerns from much larger dams. Other renewables in India continued to advance. Onshore wind rose by 2.3 GW in 2014, versus 2.1 GW in 2013, benefiting from a full year of the reinstated generation-based incentive (GBI) and the reintroduction of accelerated depreciation from July 2014. Both these measures, which are mutually exclusive for projects, had been subject to stop-and-go renewals, creating uncertainty and volatility for new wind investments. A large pipeline of currently financed wind projects (5 GW) suggests increased deployment ahead, but this will depend on the stability of the policy environment. Solar PV expanded by only 0.7 GW in 2014, lower than the 1 GW of additions in 2013. Still, sector activity has recently ramped up with the tendering of over 2.5 GW of utility-scale solar PV capacity combined by state governments and under the federal government’s Jawaharlal Nehru National Solar Mission (JNNSM) over 2014 and early 2015. In the first quarter of 2015 alone, 0.7 GW was commissioned, and the central government is planning 10 GW of new allocations this year. Meanwhile, 175 MW of previously auctioned STE capacity came on line in 2014, including India’s largest plant (125 MW). In Thailand, renewable generation accounted for over 8% of power generation in 2013. Hydropower was the largest renewable source, followed by bioenergy. In 2014, bioenergy rose by 250 MW, in line with growth of the previous three years. The strongest 2014 capacity growth came from solar PV, which expanded 475 MW, its highest increase to date. But the expansion was much less than the prevailing project pipeline given challenges related to permitting, land acquisition and grid connections (Kuang et al., 2015). Over 1 GW of utility-scale solar and over 1.5 GW each of onshore

RENEWABLE ELECTRICITY: NON-OECD
MEDIUM-TERM RENEWABLE ENERGY MARKET REPORT 2015 91
wind and bioenergy projects are registered with the government’s FiT (for solar) and “adder”, or feed-in premium (for wind and bioenergy), programmes, though only a fraction have secured PPAs. In Indonesia, renewable power accounted for over 12% of power generation in 2013. Hydropower and geothermal are the main renewable sources. Hydropower capacity has expanded slowly in recent years, and grew by only 20 MW in 2014. Geothermal capacity has steadily grown over the past decade, and in 2014 is estimated to have reached near 1.5 GW. In 2014, the government enacted a new geothermal law to exclude projects from being classified as mining activities, which had hindered geothermal development in protected forests. Bioenergy is also a significant renewable source. Thus far, solar and wind have played only a marginal role in Indonesia’s renewable mix. In 2014, Indonesia’s first wind farm (62 MW) was financed with backing from International Finance Corporation. In 2015, the government is reportedly planning to auction PPAs for over 85 new, off-grid solar PV projects, though the total planned capacity remained uncertain at the time of writing. In Chinese Taipei, renewables accounted for 5% of power generation in 2013. Solar PV installations, at 400 MW, rose to their highest level to date. Citing declining electricity reserve margins in the face of rapidly growing demand, the government announced in May higher long-term targets for renewable deployment of 17.25 GW by 2030, up from 13.75 previously, supported by streamlined bidding processes for solar PV incentives and great site evaluations and risk assessment for offshore wind farms. The Bureau of Energy announced it was planning to raise the 2015 target deployment target for solar PV from 270 MW to 500 MW. The signing of turbine contracts for the country’s first offshore wind plant (130 MW to come on line by 2018, supported by a FiT) has also commenced, signalling increased development ahead.
Figure 22 Non-OECD Asia countries power demand versus GDP growth
0%
1%
2%
3%
4%
5%
6%
7%
8%
9%
0 200 400 600 800
1 0001 2001 4001 6001 8002 000
India Thailand Indonesia Malaysia
CAAG
R 20
14-20
Dema
nd (T
Wh)
2014
2020
Demand (righthand axis)
GDP(right hand axis)
Sources: IEA (2015b), Medium-Term Gas Market Report 2015; IMF (2015), World Economic Outlook, April 2015. In Malaysia, solar PV capacity increased by almost 90 MW in 2014, supported by the country’s FiT scheme, but cumulative capacity remains below 200 MW. As of June, the government had announced a quota of 75 MW of new solar PV for 2015. Significant hydropower expansion occurred in 2014 with the commissioning of 700 MW of the Bakun Borneo project; the 950 MW Murum dam is also expected on line in 2015. In the Philippines, solar PV grew by around 25 MW and geothermal capacity increased by 130 MW. In Viet Nam, hydropower expanded with the commissioning of the 125 MW Dak Drinh plant, 155 MW at Song Bung and a number of smaller additions.

RENEWABLE ELECTRICITY: NON-OECD
92 MEDIUM-TERM RENEWABLE ENERGY MARKET REPORT 2015
Medium-term outlook – regional main case summary Renewable generation in Asia is seen rising by over 50% from 2014-20. Robust expected demand growth over a number of countries creates a strong need for new generation. Total annual capacity growth rises through 2017, but stabilises at a lower level thereafter, with reduced hydropower additions offsetting increased solar PV and wind. Underscoring its good resource availability and ability to provide cost-effective base-load power, hydropower leads the regional capacity expansion, growing by 30 GW over 2014-20, led by India and Viet Nam, with sizeable contributions from Laos and Bhutan, but additions slow after 2017 due to the timing of some large plant completions. By contrast, non-hydro capacity additions continue to rise through the forecast period, led by solar PV and onshore wind, followed by smaller contributions from bioenergy and geothermal.
Figure 23 Non-OECD Asia historical and forecasted capacity additions, generation and investment
0
100
200
300
400
500
600
700
800
2013 2014 2015 2016 2017 2018 2019 2020
Generat
ion (T
Wh)
0
5
10
15
20
25
30
0
5
10
15
20
25
2013 2014 2015 2016 2017 2018 2019 2020
USD
billio
n
Annu
al ad
dition
s (GW
)
Hydropower Bioenergy Onshore Wind Offshore Wind Solar PV Geothermal STE Ocean Investment
Source: Historical renewable electricity generation from IEA (2015a), “World energy statistics”, IEA World Energy Statistics and Balances (database). India leads regional development with renewable generation expanding by 145 TWh over 2014-20, supported by strong generation needs, attractive economics and an improved policy environment. This outlook will strongly depend on the stability and credible implementation of policies to reduce risks and meet ambitious deployment aims. India’s renewable deployment over 2014-20 should be led by solar PV, which is seen expanding by 25 GW. But this is much less than government aims, given risks related to grid and system integration, land acquisition and the pace of government auctions and adoption of supporting policies for rooftop development. With improved attractiveness, onshore wind should grow over 25 GW. With more than 12 GW under construction, hydropower should expand strongly, though growth remains challenged by local acceptance issues. India’s biomass for power potential is large, but deployment will depend on the development of sustainable supply chains. STE development should proceed incrementally over the medium term, though as the sector scales and if costs reduce, the value of STE with thermal storage to meet demand during periods with reduced solar resource availability can make it very attractive in the long run. Thailand’s renewable generation is expected to rise by over 10 TWh from 2014-20, with average growth of 10% per year. The expansion is seen led by bioenergy and solar PV. Further developments in biogas, in particular, are expected with increased use of napier grass feedstock for gasification. Still, bioenergy projects in general are likely to face constraints related to local feedstock availability and there are policy uncertainties related to the pending incentive change for new projects from

RENEWABLE ELECTRICITY: NON-OECD
MEDIUM-TERM RENEWABLE ENERGY MARKET REPORT 2015 93
the feed-in premium to the FiT regime. Overall deployment is seen less than 2020 targets (8.8 GW in total under the Alternative Energy Development Plan) would suggest. Solar PV capacity should grow by 2.8 GW over 2014-20, supported by the FiT for distributed generation and the switching of utility-scale PV in the pipeline from the previous adder system to FiTs. Authorities have imposed deadlines for the commissioning of some 2 GW of capacity over late 2015 to mid-2016. However, it is unclear if projects can meet this timing, given grid connection and land acquisition challenges on the utility-scale side. Meanwhile, onshore wind is expected to rise by only 0.7 GW over 2014-20, lower than the targeted capacity given a need for continued grid upgrades.
Table 15 Non-OECD Asia countries main targets and support policies for renewable electricity
Non-OECD Asia Regulatory support Economic support
Country
Ren
ewab
le
ener
gy la
w
Targ
ets
Quo
tas/
RPS
FiT/
Feed
-in
prem
ium
Cap
ital g
rant
s an
d su
bsid
ies
Soft
loan
s
Tax
relie
f
Net
met
erin
g
Trad
able
gre
en
cert
ifica
tes
Car
bon
pric
ing
Auc
tion
sche
mes
Bangladesh ✔ ✔ ✔ ✔ ✔ Chinese Taipei ✔ ✔ ✔ Fiji ✔ ✔ India ✓ ✓ ✓ ✔ ✔ ✓ ✓ ✔ ✔✓ ✔ Indonesia ✔ ✔ ✔ Laos ✔ ✔ Malaysia ✔ ✔ ✔ ✔ ✔ ✔ Maldives ✔ ✔ ✔ Mongolia ✔ ✔ ✔ Nepal ✔ ✔ Pakistan ✔ ✔ ✔ ✔ ✔ Philippines ✔ ✔ ✔ ✔ ✔ Samoa ✔
Singapore ⓪ ✔ ✔
Solomon Islands ✔ Sri Lanka ✔ ✔ ✔ ✔ ✔ ✔ Thailand ✔ ✔ ✔ ✔ Vanuatu ✔ Viet Nam ✔ ✔ ✔ ✔
Policy highlights • India released NMSH in 2015 to guide hydro deployment until 2020. Comprehensive renewable energy law is
still missing. • Singapore established its first renewable energy target, seeking to deploy 350 MW of solar PV by 2020.
Notes: ✔ = national-level policy; ✓ = state/provincial-level policy, ● = recently updated, ► = to be phased out, ⓪ = recently introduced; ■ = under review. For further information, refer to IEA/IRENA Policies and Measures Database for Renewable Energy. Indonesia’s renewable generation is seen expanding by almost 15 TWh over 2014-20 with average growth of 7% per year. Despite Indonesia’s excellent resources, need for new power capacity to meet fast-growing demand, long-term renewable targets and attractive financial incentives, significant challenges remain to project development, including an underdeveloped grid, barriers to entry in the electricity market, onerous permitting requirements, and the cost and availability of financing to

RENEWABLE ELECTRICITY: NON-OECD
94 MEDIUM-TERM RENEWABLE ENERGY MARKET REPORT 2015
private actors. New development is expected in hydropower and geothermal, though progress will depend on the pace, transparency and governance of tendering processes to support development.
Table 16 Non-OECD Asia, selected countries renewable energy capacity in 2014 and 2020
Total capacity (GW)
2014 2020
India Indonesia Thailand Total Non-
OECD Asia
India Indonesia Thailand Total Non-
OECD Asia
Hydropower 44.5 5.3 4.3 106.6 57.2 6.9 4.6 135.7 Bioenergy 5.2 0.8 2.7 10.5 7.0 1.0 5.5 16.8 Onshore wind 23.5 0.0 0.2 25.1 49.5 0.2 0.9 54.2 Offshore wind 0.0 0.0 0.0 0.0 0.0 0.0 0.0 0.0 Solar PV 3.5 0.1 1.3 6.2 28.5 1.2 4.1 40.8 STE/CSP 0.2 0.0 0.0 0.2 0.5 0.0 0.0 0.5 Geothermal 0.0 1.3 0.0 3.3 0.0 2.4 0.0 4.9 Ocean 0.0 0.0 0.0 0.0 0.0 0.0 0.0 0.0 Total 76.8 7.6 8.5 152.0 142.7 11.8 15.1 252.9
Note: For further country-level forecast data, please see the Excel workbook that accompanies this report.
Table 17 Non-OECD Asia main drivers and challenges to renewable energy deployment
Country Drivers Challenges
India
Supportive policy environment with ambitious targets, JNNSM and financial incentives. Fast-growing electricity demand; captive and rural electrification needs support distributed solar PV deployment.
Stability and credible implementation of policies to reduce risks; financing costs remain high. Grid strengthening and expansion and better grid management needed to reinforce power system in general. Off take risks from financially troubled State Electricity Boards (SEBs). State-level policy implementation and compliance with renewable portfolio obligation.
Thailand
Strong deployment targets; new FiT for distributed solar PV. Strong demand growth; desire to diversify power system away from costly fossil fuel imports.
Uncertainty over timing, levels and adjustments of transition from remaining feed-in premiums to FiTs. Grid upgrades to accommodate new generation, particularly wind.
Indonesia Excellent resources; need for new power capacity to meet fast-growing demand. Ambitious long-term renewable targets backed by a FiT scheme.
Non-economic barriers and concentrated power system presents investment barriers to new commercial entrants. Underdeveloped grid, widespread location of resources across a large archipelago and poor interconnection.
Medium-term outlook – regional accelerated case summary Overall, the upside for renewable deployment in Asia is large and renewable capacity growth could be up to 40% higher over 2014-20 versus the main case with certain policy and market enhancements. India could greatly benefit from a comprehensive renewable energy law that gives more credibility to stated goals and a lower risk environment to bring down costs (NB a draft renewable law was released in July 2015, though it would need to be enacted by the government).
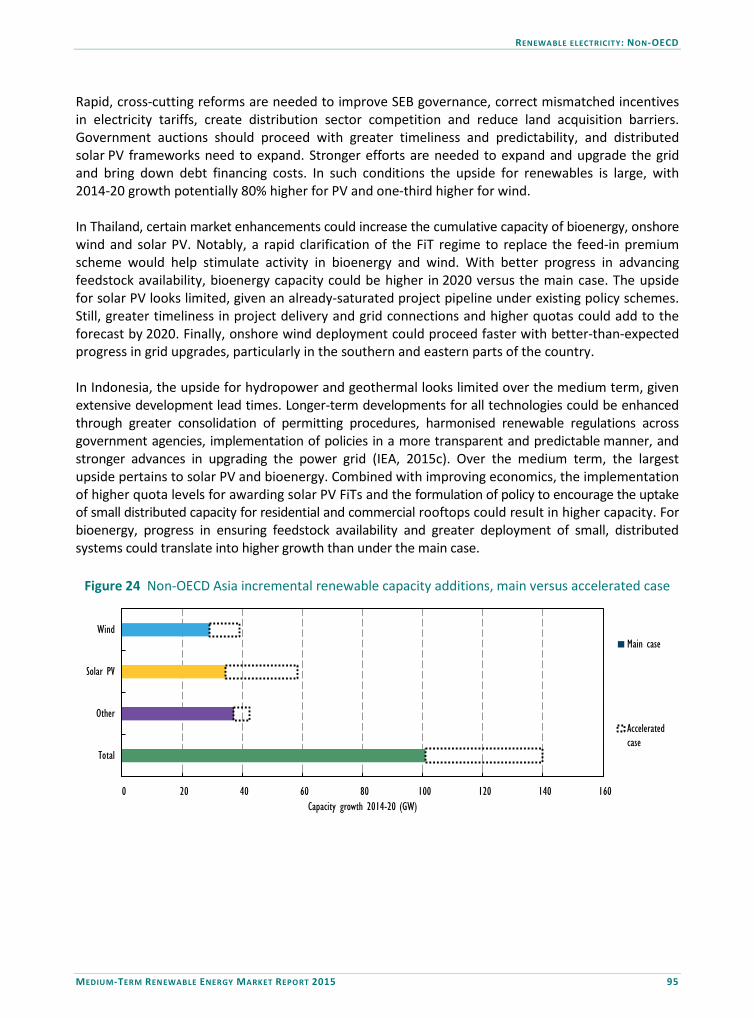
RENEWABLE ELECTRICITY: NON-OECD
MEDIUM-TERM RENEWABLE ENERGY MARKET REPORT 2015 95
Rapid, cross-cutting reforms are needed to improve SEB governance, correct mismatched incentives in electricity tariffs, create distribution sector competition and reduce land acquisition barriers. Government auctions should proceed with greater timeliness and predictability, and distributed solar PV frameworks need to expand. Stronger efforts are needed to expand and upgrade the grid and bring down debt financing costs. In such conditions the upside for renewables is large, with 2014-20 growth potentially 80% higher for PV and one-third higher for wind. In Thailand, certain market enhancements could increase the cumulative capacity of bioenergy, onshore wind and solar PV. Notably, a rapid clarification of the FiT regime to replace the feed-in premium scheme would help stimulate activity in bioenergy and wind. With better progress in advancing feedstock availability, bioenergy capacity could be higher in 2020 versus the main case. The upside for solar PV looks limited, given an already-saturated project pipeline under existing policy schemes. Still, greater timeliness in project delivery and grid connections and higher quotas could add to the forecast by 2020. Finally, onshore wind deployment could proceed faster with better-than-expected progress in grid upgrades, particularly in the southern and eastern parts of the country. In Indonesia, the upside for hydropower and geothermal looks limited over the medium term, given extensive development lead times. Longer-term developments for all technologies could be enhanced through greater consolidation of permitting procedures, harmonised renewable regulations across government agencies, implementation of policies in a more transparent and predictable manner, and stronger advances in upgrading the power grid (IEA, 2015c). Over the medium term, the largest upside pertains to solar PV and bioenergy. Combined with improving economics, the implementation of higher quota levels for awarding solar PV FiTs and the formulation of policy to encourage the uptake of small distributed capacity for residential and commercial rooftops could result in higher capacity. For bioenergy, progress in ensuring feedstock availability and greater deployment of small, distributed systems could translate into higher growth than under the main case.
Figure 24 Non-OECD Asia incremental renewable capacity additions, main versus accelerated case
0 20 40 60 80 100 120 140 160
Total
Other
Solar PV
Wind
Capacity growth 2014-20 (GW)
Main case
Acceleratedcase

RENEWABLE ELECTRICITY: NON-OECD
96 MEDIUM-TERM RENEWABLE ENERGY MARKET REPORT 2015
India dashboard Figure D.32 India annual net additions to renewable capacity (2013-20)
0
2
4
6
8
10
12
14
2013 2014 2015 2016 2017 2018 2019 2020
Annu
al ad
dition
s (GW
)
Ocean
STE
Geothermal
Solar PV
Offshore Wind
Onshore Wind
Bioenergy
Hydropower
Table D.12 India national renewable targets Figure D.33 Ten-year government bond interest rates
GW 2012-17 additions (12th FYP)
2014 cumulative capacity (MTRMR)
Implied targeted additions, 2014-22
2022 cumulative (2015/16 budget)
Biomass 2.9 5.2 4.8 10 Wind 15 23.5 36.5 60 Solar (PV+STE)
10 3.7 96.3 100
Large-scale n/a 3.3* 56.7 60 Rooftop n/a 0.4* 39.6 40 Large hydro 10.8 n/a n/a n/a Small hydro 2.1 n/a n/a 5
0
2
4
6
8
10
Jan 07 Jan 09 Jan 11 Jan 13 Jan 15
%
China Germany United States India *Estimate Source: Bloomberg LP (2015), (accessed June 2015).
Figure D.34 India LCOE of wind and PV vs power market price, new imported coal LCOE and RECs
0
50
100
150
200
250
300
2012 2013 2014 2015
USD
2014
/MWh
Estimated LCOE of new onshore wind and utility-scale solar PV
Onshore wind Utility-scale solar PV Average power market clearing price
0
50
100
150
200
250
300
Jan-2011 Jan-2012 Jan-2013 Jan-2014 Jan-2015
USD/
MWh
Renewable energy certificates (RECs), monthly price
Non-solar Solar
Note: LCOE = levelised cost of electricity. Prices are nominal converted at average annual exchange rates; average market clearing price is national and may not reflect strong regional differences.
Source: Power price data from IEX (2015), www.iexindia.com (accessed June 2015).

RENEWABLE ELECTRICITY: NON-OECD
MEDIUM-TERM RENEWABLE ENERGY MARKET REPORT 2015 97
Medium-term forecast: India main case
India’s renewable generation should expand by 145 TWh over 2014-20, supported by strong generation needs, attractive economics and an improved policy environment. Despite lower hydropower expectations, the forecast for onshore wind and solar PV is stronger versus MTRMR 2014. This outlook strongly depends on policy stability and credible implementation, at both central and state levels, to reduce risks and meet ambitious deployment aims. The power sector needs to expand and diversify to meet fast-growing demand. In FY 2014, the average shortfall in meeting peak demand was 4.7%, similar to 4.5% the prior year, and despite record annual capacity additions (21 GW), average load factors for coal plants stood at 15-year lows (CEA, 2015). The government that took power in 2014 announced the aim of providing “24x7” electricity access for all and eliminating diesel generators by 2019. To this extent, it is fast-tracking investment in new generation, announcing ambitious national targets for cumulative solar capacity of 100 GW by 2022 (of which 60 GW is utility scale), wind of 60 GW by 2022 and USD 100 billion of new renewable generation investment over five years. These goals suggest accelerated development beyond the 12th FYP and the JNNSM targets, but achievability depends on concrete measures to improve grid and system integration and reduce financing challenges. Upgrade and expansion of grid and off take risks for generation are continued challenges. An overall transmission expansion continues apace (22 GW added in FY 2014) under the government’s Green Energy Corridors Strategy, supported by a USD 1 billion loan announced by the German development bank in December 2014. Still, interconnection among regions remains underdeveloped, with nearly 20 GW of additions needed by 2017 to meet FYP targets, from 46 GW existing in 2015, and transmission infrastructure to evacuate renewable power to demand centres remains a persistent project challenge. For generators, the cash-strapped position of some SEBs, from high system losses and regulated end-user prices that do not sufficiently recover purchased power costs, is a continued source of off take and payment risk The government is reportedly planning to exempt renewable generation on the national grid from wheeling charges, which would benefit project development for captive or third-party consumption (Agrawal et al., 2015). Still, more comprehensive reforms to introduce retail market pricing, to help improve the financial situation of the SEBs, and open the distribution sector to private competition, to attract more credit-worthy off takers, have yet to emerge. The financing environment is improving, but the cost of capital remains high. The Reserve Bank of India (RBI) reduced interest rates by 75 basis points so far in 2015, to 7.25% in June; this is reflected in base rates of the State Bank of India (SBI), the largest lender, at 9.7%. These cuts reduce debt financing costs, which at around 11-13% traditionally for solar and wind projects are high by international standards (Nelson et al., 2012). The SBI has pledged to lend USD 12 billion over five years to support 15 GW of new renewables. With eased loan tenor requirements by the RBI, it is also looking to issue loans with 20-25 year terms (versus a maximum of 15 years before), better matching revenue streams from long-term PPAs. Domestic lenders are increasing exposure to renewables while access to foreign debt is improving (Gombar, 2015). Still, financial factors and persistent risks related to the stability of policy incentives, off take, land acquisition and grid connection all work to keep the cost of capital elevated, even as renewable technology costs fall.

RENEWABLE ELECTRICITY: NON-OECD
98 MEDIUM-TERM RENEWABLE ENERGY MARKET REPORT 2015
India Figure D.35 Weighted average PPA bid prices in solar PV auctions, state and JNNSM, 2010-15
0.00
0.05
0.10
0.15
0.20
0.25
0.30
0.35
07-2010 03-2011 11-2011 07-2012 03-2013 12-2013 08-2014 04-2015 12-2015
USD/
kWh
Telangana
Punjab
Karnatka
Madhya Pradesh
Uttar Pradesh
Andhra Pradesh
Rajasthan
Tamil Nadu
JNNSM
JNNSM
500 MW
Note: Prices are in nominal terms converted at average annual exchange rates; dates correspond to auction completion dates; bubbles are centred on weighted average PPA bid price. Sources: IEA analysis with data from Government of Telangana (2015), Exceeding the expectations of tenders for solar energy; MP Power Management Co. (2015), 300 MW solar power in the state open price and financial tender today for availability; Agrawal, B. (2013), India Solar PV Auctions: Prices, Successes and Failures; Agrawal, B. (2015), India’s Latest Solar PV Auction Price Trends.
Figure D.36 Commercial power tariffs versus PV LCOEs and FiTs, selected states, 2014
0
50
100
150
200
0
50
100
150
200
USD/
MWh
Estimated LCOE commercial-scale PV (2015) Small comm. consumer Large comm. consumer Solar PV tariff after accelerated depreciation Note: Prices are converted at average 2014 exchange rate of 61 rupees (INR) per USD; power tariffs include only energy charges and not fixed charges or demand charges. Source: IEA analysis with data from CEA (2014), Tariff & Duty of Electricity Supply in India.
Table D.13 India renewable power forecast • Drivers
GW 2014 2016 2018 2020 2020* Hydropower 44.5 50.0 56.5 57.2 60.4 Bioenergy 5.2 5.8 6.4 7.0 8.0 Onshore wind 23.5 30.0 38.5 49.5 58.2 Offshore wind 0.0 0.0 0.0 0.0 0.0 Solar PV 3.5 8.5 17.5 28.5 48.5 STE/CSP 0.2 0.4 0.5 0.5 0.5 Geothermal 0.0 0.0 0.0 0.0 0.0 Ocean 0.0 0.0 0.0 0.0 0.0 Total 76.8 94.5 119.3 142.7 175.6
* Accelerated case.
- supportive policy environment with ambitious targets, JNNSM and financial incentives - fast-growing power demand; captive and rural needs support distributed PV.
• Challenges - stability and credible implementation of policies to reduce risks; financing costs remain high - grid strengthening, expansion, and management
- off-take risks and state-level policy enforcement.
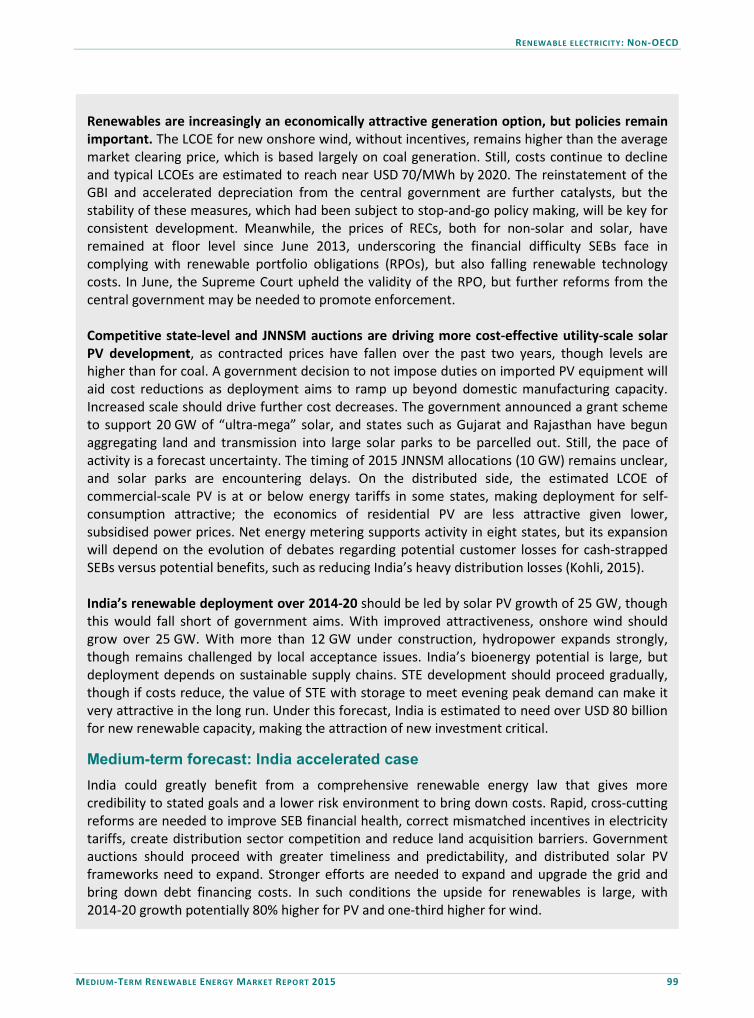
RENEWABLE ELECTRICITY: NON-OECD
MEDIUM-TERM RENEWABLE ENERGY MARKET REPORT 2015 99
Renewables are increasingly an economically attractive generation option, but policies remain important. The LCOE for new onshore wind, without incentives, remains higher than the average market clearing price, which is based largely on coal generation. Still, costs continue to decline and typical LCOEs are estimated to reach near USD 70/MWh by 2020. The reinstatement of the GBI and accelerated depreciation from the central government are further catalysts, but the stability of these measures, which had been subject to stop-and-go policy making, will be key for consistent development. Meanwhile, the prices of RECs, both for non-solar and solar, have remained at floor level since June 2013, underscoring the financial difficulty SEBs face in complying with renewable portfolio obligations (RPOs), but also falling renewable technology costs. In June, the Supreme Court upheld the validity of the RPO, but further reforms from the central government may be needed to promote enforcement. Competitive state-level and JNNSM auctions are driving more cost-effective utility-scale solar PV development, as contracted prices have fallen over the past two years, though levels are higher than for coal. A government decision to not impose duties on imported PV equipment will aid cost reductions as deployment aims to ramp up beyond domestic manufacturing capacity. Increased scale should drive further cost decreases. The government announced a grant scheme to support 20 GW of “ultra-mega” solar, and states such as Gujarat and Rajasthan have begun aggregating land and transmission into large solar parks to be parcelled out. Still, the pace of activity is a forecast uncertainty. The timing of 2015 JNNSM allocations (10 GW) remains unclear, and solar parks are encountering delays. On the distributed side, the estimated LCOE of commercial-scale PV is at or below energy tariffs in some states, making deployment for self-consumption attractive; the economics of residential PV are less attractive given lower, subsidised power prices. Net energy metering supports activity in eight states, but its expansion will depend on the evolution of debates regarding potential customer losses for cash-strapped SEBs versus potential benefits, such as reducing India’s heavy distribution losses (Kohli, 2015). India’s renewable deployment over 2014-20 should be led by solar PV growth of 25 GW, though this would fall short of government aims. With improved attractiveness, onshore wind should grow over 25 GW. With more than 12 GW under construction, hydropower expands strongly, though remains challenged by local acceptance issues. India’s bioenergy potential is large, but deployment depends on sustainable supply chains. STE development should proceed gradually, though if costs reduce, the value of STE with storage to meet evening peak demand can make it very attractive in the long run. Under this forecast, India is estimated to need over USD 80 billion for new renewable capacity, making the attraction of new investment critical.
Medium-term forecast: India accelerated case India could greatly benefit from a comprehensive renewable energy law that gives more credibility to stated goals and a lower risk environment to bring down costs. Rapid, cross-cutting reforms are needed to improve SEB financial health, correct mismatched incentives in electricity tariffs, create distribution sector competition and reduce land acquisition barriers. Government auctions should proceed with greater timeliness and predictability, and distributed solar PV frameworks need to expand. Stronger efforts are needed to expand and upgrade the grid and bring down debt financing costs. In such conditions the upside for renewables is large, with 2014-20 growth potentially 80% higher for PV and one-third higher for wind.
RENEWABLE ELECTRICITY: NON-OECD
100 MEDIUM-TERM RENEWABLE ENERGY MARKET REPORT 2015
China Recent trends China’s renewable power generation increased by 18% in 2014, reaching over 23% of total power generation, up from over 20% in 2013. The country represented almost 25% of global renewable electricity output in 2014. Much of China’s renewable output increase stemmed from hydropower, whose output rose by nearly 20% due to higher available water resources, a full year of production from 2013’s very large capacity expansion (+30 GW) and strong 2014 capacity additions (+22 GW). While a 2020 target of 350 GW for conventional hydropower remains in place, future developments may grow more challenging due to increased concerns over local environment impacts and reduced availability of economic sites. For example, in April, the Ministry of Environmental Protection issued a document suspending development of a 1 GW dam on the Yangtze River, though a final decision rests with the State Council. Still, prospects for pumped-hydro storage (included in MTRMR capacity and generation) improved with the issuance in summer 2014 of a dedicated two-part tariff that remunerates projects on a capacity and energy basis, with electricity used for pumping priced at a 25% discount to the coal benchmark price. The government has also increased its approvals of new pumped hydro projects even as those for new conventional hydropower have slowed. China’s grid-connected onshore wind capacity increased by over 19 GW in 2014; industry estimates put total additions (including non-connected and capacity not yet registered) at 23 GW, the highest annual installations to date. Country-wide full load hours decreased in 2014 by 8%, to 1 905, due to slower wind speeds, even as developers deploy larger turbines at higher hub heights to maximise production (NEA, 2015). Wind power curtailment by the grid operator has been reduced significantly in the past two years, with additional transmission to evacuate power from the north and northwest to demand areas near the coast and long-distance transmission lines to carry power from provinces situated farther west, but still remains a challenge. In early 2015, the government announced a downward revision to the onshore wind FiT for new projects; the new tariffs range from 490 Yuan renminbi (CNY) per MWh to CNY 610/MWh (USD 80/MWh-USD 100/MWh), depending on wind resource. Those approved under the old tariffs would need to commission by the end of this year, implying a potential rush in 2015 to connect projects. Meanwhile, offshore wind capacity rose by 45% in 2014 to bring the cumulative total to 650 MW. Still, the National Energy Administration (NEA) announced that it expects only 10 GW of offshore capacity in 2020 versus a target of 30 GW; to date, relatively high costs and complicated administrative procedures have challenged development. China installed 10.6 GW of solar PV in 2014, slightly less than the downwardly revised growth of 10.95 GW in 2013. More than 80% of new additions occurred in the utility-scale segment. Development of distributed PV (which includes projects up to 20 MW) was less than the government quota of 8 GW. In 2014, the government issued several supporting policies, including giving developers the choice between the premium subsidy and the local FiT for utility-scale PV. The NEA instructed local (province) level energy regulators to make annual plans for distributed PV development in their jurisdiction and invest accordingly in the distribution grid. For 2015, the government has announced an overall approval quota (i.e. the amount of projects that can qualify for incentives) for solar PV of 17.8 GW, with allocations by province and no division between utility and distributed development. In the first quarter of 2015, China deployed 5 GW, according to NEA.

RENEWABLE ELECTRICITY: NON-OECD
MEDIUM-TERM RENEWABLE ENERGY MARKET REPORT 2015 101
China dashboard
Figure D.37 China annual net additions to renewable capacity and new investment
0
10
20
30
40
50
60
70
2013 2014 2015 2016 2017 2018 2019 2020
Annu
al ad
dition
s (GW
)
Ocean
STE
Geothermal
Solar PV
Offshore Wind
Onshore Wind
Bioenergy
Hydropower
Table D.14 China main targets and support policies for renewable electricity
Targets and quotas Support scheme Other support 12th FYP for renewable energy development: 11.4% of non-fossil resources in primary energy consumption by 2015 (13% by 2017 and 15% by 2020). Indicative binding cumulative capacity targets by 2015: 290 GW hydro (incl. pumped storage) 100 GW wind (of which 5 GW offshore) 35 GW solar (of which 1 GW solar thermal) 13 GW biomass 100 MW geothermal 50 MW ocean. China Strategic Plan for Energy Development 2014-2020*: Indicative binding cumulative capacity targets by 2020: 350 GW conventional hydropower 200 GW wind 100 GW solar 30 GW biomass.
FiTs: Apply to onshore wind, solar PV and biomass. Effectively they are feed-in premiums over province-specific prices of coal-based power. Incentives for small-scale generation: Grid connection fees waived and net metering provided for distributed systems <6 MW. For solar PV <6 MW, government is drafting a policy to provide a feed-in premium on top of net metering for self-consumption and a feed-in premium to the local coal-benchmarked price for electricity fed into the grid. Premium for distribution-grid-connected PV projects receive CNY 0.42/kWh. Additionally, scheme allows for excess electricity to be sold to the grid at the price of coal power. Import duty & value-added taxes removal: Applies to key technological equipment, including hydro and wind equipment. Carbon-trading scheme pilots were launched in seven provinces as a first phase in introducing countrywide emissions trading scheme programme.
Strategic planning: • Offshore Wind
Development Plan • 12th FYP for national
strategic industries • Solar Industry
Development Plan. Framework policy: • Renewable Energy Law • 12th FYP for climate
change. Grid access and priority dispatch: Projects approved by government are granted access to grid in the Renewable Energy Law. Priority dispatch guaranteed by law, but often not applied in practice.
* Issued by State Council in November 2014.
Note: For further information, refer to IEA/IRENA Policies and Measures Database, www.iea.org/policiesandmeasures/renewableenergy.

RENEWABLE ELECTRICITY: NON-OECD
102 MEDIUM-TERM RENEWABLE ENERGY MARKET REPORT 2015
Medium-term forecast: China main case
China’s generation needs, pollution concerns and a favourable policy environment with ambitious targets should drive strong renewable growth, even amid slowing economic growth. Renewable generation is seen rising by 40% from 2014-20, but with growth slower than in MTRMR 2014, due to a lower hydropower and bioenergy expansion, which more than offsets a higher forecast for solar PV and onshore wind. Greater power sector competition could support role of renewables. A State Council policy statement in March set out aims to improve power sector efficiency and clean energy integration. The decree focuses on liberalised power pricing, retail competition, transparent transmission and distribution (T&D) pricing, and third-party direct marketing of power, with the expansion of a pilot programme in Shenzhen to other provinces. A move towards market-based pricing would better reflect fuel input costs, and could squeeze less-efficient coal plants and expose fixed power tariffs to fossil fuel price volatility, potentially enhancing the attractiveness of fixed-cost renewables. The T&D reform seeks to put China’s grid companies on a revenue cap regime where T&D fees would be determined on a cost-plus basis and separated from retail prices. This would facilitate large power users to contract power directly from generators, spurring greater competition and the potential to negotiate PPAs lower than retail tariffs. Consequently, renewables would have a new marketing outlet, potentially raising the off take of curtailed wind output or distributed solar PV for self-consumption. Still, much of the reform effort described above will depend on the implementation of concrete supporting regulations. Progress continues in grid and system integration of renewables. The government also seeks to enhance flexibility measures to better integrate renewables. To promote demand-side management (DSM), China’s DSM pilot cities are to share data, best practices and promote new demand response programmes. Cross-sector integration efforts are also under way, with seven pilot projects in Jilin and Inner Mongolia for using excess wind generation to produce heat. Still, the results of this effort have been mixed, with subsidised tariffs for commercial heat undermining the economics of boiler investment and difficulty in prioritising dispatch of wind farms associated with the heat output. Overall, wind capacity factors should continue to rise and curtailment continue to fall with the build-out of local transmission in the north and northwest. On top of seven long-distance ultra-high voltage lines operating today, the construction of seven additional lines, expected by end 2017, by State Grid continues (IEA/SGCC, 2015). And the distribution of new project approvals away from the north and west and towards the southern part of the country, where demand is stronger, should also alleviate congestion. Still, some integration challenges remain. Insufficient transmission is raising curtailment risks for small and medium-sized hydropower plants, particularly in the southwest where demand is weaker (Stanway, 2015). The timely availability of grid connections for onshore wind and utility-scale solar PV developments also remains a persistent project risk. Moreover, the cost sustainability of a State Grid policy to waive charges for distributed solar PV connections is uncertain as deployment ramps up to high levels in line with government aims. Meanwhile, despite the reforms enumerated above to promote greater uptake of renewables, China still lacks a clear regulation providing a purchase obligation or portfolio standard for grid companies.

RENEWABLE ELECTRICITY: NON-OECD
MEDIUM-TERM RENEWABLE ENERGY MARKET REPORT 2015 103
China
Figure D.38 China solar PV forecast capacity and deployment by market segment
0
20
40
60
80
100
120
2010 2011 2012 2013 2014 2015 2016 2017 2018 2019 2020
GW
Cumulative capacity
Residential-scale Commercial-scale Utility-scale Off-grid
0
2
4
6
8
10
12
2010 2011 2012 2013 2014 2015 2016 2017 2018 2019 2020
GW
Annual additions
Figure D.39 China incremental renewable capacity additions, main versus accelerated case
0 50 100 150 200 250 300 350
Total
Other
Solar PV
Wind
Capacity growth 2014-20 (GW)
Main case
Acceleratedcase
Table D.15 China renewable power capacity forecast
GW 2014 2016 2018 2020 2020*
Hydropower 301.8 332.0 350.0 365.0 375.0
Bioenergy 9.5 12.0 17.0 23.0 30.0
Onshore wind 95.7 133.7 169.7 208.7 220.7
Offshore wind 0.7 1.4 2.3 3.5 4.3
Solar PV 28.1 55.1 82.1 111.1 135.1
STE/CSP 0.0 0.2 0.3 0.6 0.9
Geothermal 0.0 0.1 0.1 0.1 0.1
Ocean 0.0 0.0 0.0 0.0 0.0
Total 435.8 534.3 621.3 711.9 766.0
*Accelerated case.
• Drivers - strong government policy backing and expected implementation of power sector reforms - high deployment quotas and measures to facilitate deployment of solar PV - ample availability of low-cost financing.
• Challenges - implementation of supporting regulations for electricity market reforms - uncertain economic attractiveness and non-economic barriers for distributed solar PV - grid integration and upgrades on both the transmission and distribution sides.

RENEWABLE ELECTRICITY: NON-OECD
104 MEDIUM-TERM RENEWABLE ENERGY MARKET REPORT 2015
Solar PV should scale up rapidly, though uncertainties persist. Over time, authorities have taken actions to stimulate solar PV deployment, reducing approval procedures and devolving planning to provincial authorities while increasing the national quota. Solar PV costs continue to fall, and investment costs are among global lows. The LCOE of typical utility-scale projects is estimated at USD 90-100/MWh (<USD 80/MWh with best resources), making them attractive versus national FiTs of USD 145-160/MWh. And local authorities are encouraged to select developers who can contract for FiTs lower than statutory rates (Chase, Wu and Duan, 2015). On the utility-scale side, grid connection availability is the main constraint. Distributed PV projects can choose between the FiTs or a premium on both self-consumed electricity and excess fed into the grid; the latter is attractive for large commercial and industrial electricity users. Still, the financing of commercial-scale PV projects remains a significant barrier with banks concerned over the creditworthiness of some project owners (or the off taker in the case of third-party ownership) and potential asset recovery issues. As such, an acceleration of the distributed sector may depend on the introduction of new financing models or policies to mitigate some of the perceived financial risks. Investment needs to rise, though new financing sources emerging. China is estimated to need more than USD 390 billion for new renewable capacity over the medium term. In addition to commercial and development banks, other sources of financing may be needed in the short and medium term, especially for fast-growing solar PV deployment. Some manufacturers are investing in downstream projects, and the opening of direct electricity marketing by third parties should attract increased investment. Plus, some developers are starting to aggregate projects into yieldcos that can then raise capital on equity markets, allowing funds to be recycled back into project development for the parent company (Shaw, 2015). Still, the evolution of project-level challenges, for example delays in incentive payments, will impact the pace of these trends. China’s renewable deployment over 2014-20 should be led by onshore wind (+113 GW), but annual additions dip after 2015 with a run-up in commissioning to take advantage of the older FiTs. Hydropower grows by 65 GW and annual additions slow with challenges to conventional plant expansion. Solar PV expands by 83 GW, but with uncertainty over the pace of distributed PV. Bioenergy faces challenges to scaling feedstock supply chains; most future development should occur in municipal solid waste for power and co-firing, with uncertainty over a 2020 target of 30 GW. Though there is strong interest in the flexibility of STE, deployment faces barriers related to relatively high upfront costs and lack of incentives that value its storage capabilities.
Medium-term forecast: China accelerated case Quantifying the upside for China remains challenging, but overall renewable capacity growth from 2014-20 could be 20% higher versus the main case. Clearer implementation of power sector reforms and integration measures to alleviate grid congestion and regulations to prioritise the uptake of renewables by grid companies would be supportive, particularly for onshore wind. Better financing solutions would need to emerge for distributed solar PV. Economic attractiveness of offshore wind and STE would need to improve, in part through streamlined regulatory burden (for offshore wind) and a remuneration framework based on time of delivery (for STE). Hydropower would require an acceleration of environmental approvals and the rapid establishment of a more robust project pipeline. Finally, more encouragement of decentralised generation could help bioenergy, mainly through more small-scale biogas and waste-to-energy.
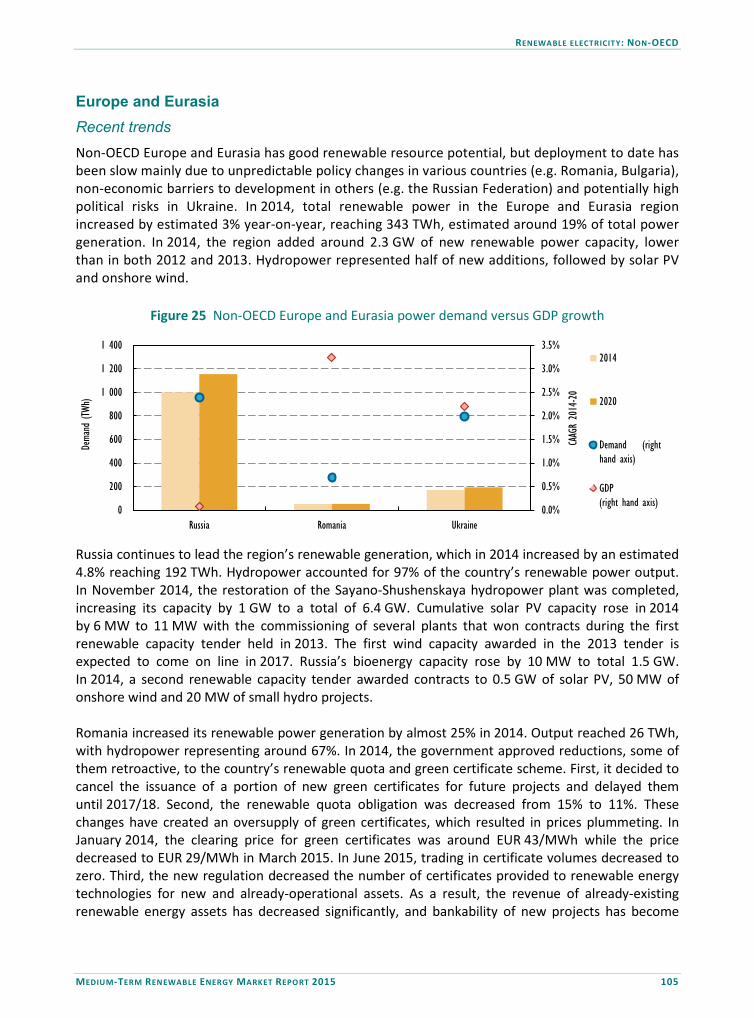
RENEWABLE ELECTRICITY: NON-OECD
MEDIUM-TERM RENEWABLE ENERGY MARKET REPORT 2015 105
Europe and Eurasia Recent trends Non-OECD Europe and Eurasia has good renewable resource potential, but deployment to date has been slow mainly due to unpredictable policy changes in various countries (e.g. Romania, Bulgaria), non-economic barriers to development in others (e.g. the Russian Federation) and potentially high political risks in Ukraine. In 2014, total renewable power in the Europe and Eurasia region increased by estimated 3% year-on-year, reaching 343 TWh, estimated around 19% of total power generation. In 2014, the region added around 2.3 GW of new renewable power capacity, lower than in both 2012 and 2013. Hydropower represented half of new additions, followed by solar PV and onshore wind.
Figure 25 Non-OECD Europe and Eurasia power demand versus GDP growth
0.0%
0.5%
1.0%
1.5%
2.0%
2.5%
3.0%
3.5%
0
200
400
600
800
1 000
1 200
1 400
Russia Romania Ukraine
CAAG
R 20
14-20
Dema
nd (T
Wh)
2014
2020
Demand (righthand axis)
GDP(right hand axis)
Russia continues to lead the region’s renewable generation, which in 2014 increased by an estimated 4.8% reaching 192 TWh. Hydropower accounted for 97% of the country’s renewable power output. In November 2014, the restoration of the Sayano-Shushenskaya hydropower plant was completed, increasing its capacity by 1 GW to a total of 6.4 GW. Cumulative solar PV capacity rose in 2014 by 6 MW to 11 MW with the commissioning of several plants that won contracts during the first renewable capacity tender held in 2013. The first wind capacity awarded in the 2013 tender is expected to come on line in 2017. Russia’s bioenergy capacity rose by 10 MW to total 1.5 GW. In 2014, a second renewable capacity tender awarded contracts to 0.5 GW of solar PV, 50 MW of onshore wind and 20 MW of small hydro projects. Romania increased its renewable power generation by almost 25% in 2014. Output reached 26 TWh, with hydropower representing around 67%. In 2014, the government approved reductions, some of them retroactive, to the country’s renewable quota and green certificate scheme. First, it decided to cancel the issuance of a portion of new green certificates for future projects and delayed them until 2017/18. Second, the renewable quota obligation was decreased from 15% to 11%. These changes have created an oversupply of green certificates, which resulted in prices plummeting. In January 2014, the clearing price for green certificates was around EUR 43/MWh while the price decreased to EUR 29/MWh in March 2015. In June 2015, trading in certificate volumes decreased to zero. Third, the new regulation decreased the number of certificates provided to renewable energy technologies for new and already-operational assets. As a result, the revenue of already-existing renewable energy assets has decreased significantly, and bankability of new projects has become

RENEWABLE ELECTRICITY: NON-OECD
106 MEDIUM-TERM RENEWABLE ENERGY MARKET REPORT 2015
challenging. In addition, Romania’s request to decrease the renewable surcharge paid by large industrial consumers was approved by the European Union under the state aid guidelines for energy in April 2014. Despite this instability, Romania’s renewable capacity expanded in 2014 as projects that were financed or started their construction in previous years came on line. Overall, wind capacity rose by 350 MW, reaching almost 3 GW, while solar PV gained an additional 69 MW, reaching 1.2 GW in total. In 2014, Ukraine added only 140 MW of new renewable power capacity, 120 MW from onshore wind and 25 MW from solar PV. Overall, renewable capacity reached 6.6 GW. However, the deployment rate (supported by FiTs) slowed down significantly versus previous years due to increasing political risk. In addition, the impact of political instability is not limited only to new projects. In 2014, renewable projects located along the Black Sea coast stopped receiving FiT payments due to land ownership issues between Ukraine and Russia. Meanwhile, the Ukrainian government announced new renewable energy targets to help improve its energy security, with the intent to source 11% of electricity consumption from renewables by 2020. However, the implementation of this new target will be dependent on the regional and national political situation over the medium term. There were few changes in the renewable energy sector in other non-OECD Europe and Eurasia. Armenia published its Scaling Up Renewable Energy Program in April 2014 updating its renewable energy production targets. The country aims to source 21% of total power generation from renewables by 2020 and 25% by 2025. The establishment of specific capacity and generation targets were included as measurable guidelines to achieve the programme goals. In Moldova, by the end of 2014 the Moldovan Sustainable Energy Financing Facility had approved loan applications for 62 renewable projects, out of which 37 received funding. In October 2014, Uzbekistan’s state-owned energy company opened a tender for the construction of a 100 MW solar PV park near Samarkand, backed by the Asian Development Bank. The project is scheduled to be commissioned by the end of 2019. Uzbekistan has been drafting a new renewable energy legislation and support programme for rural solar PV projects in co-operation with INOGATE, an international energy co-operation programme between the European Union and the littoral states of the Black and Caspian seas. Medium-term outlook – regional main case summary Renewable development is expected to remain relatively weak in the non-OECD Europe and Eurasia region over the medium term. Renewable generation in Eurasia is anticipated to increase by a modest 7%, or 25 TWh, over 2014-20, marking the slowest growth rate among all MTRMR regions. Total renewable power capacity should reach 115 GW by 2020. However, the outlook is seen more pessimistic versus MTRMR 2014, with renewable capacity revised down by 6 GW in 2020 and annual additions falling over the forecast period. This trend stems from increased investment risks due to abrupt policy changes, which have contributed to boom-and-bust installation cycles in several markets, mainly in Romania and Bulgaria, and political instability in Ukraine. The growth in the region is led by onshore wind and solar PV, with smaller contributions from bioenergy and hydropower. At the same time, renewable policy implementation remains nascent in a number of countries, and non-economic barriers persist in some markets, such as Russia, suggesting only slow renewable contributions ahead.
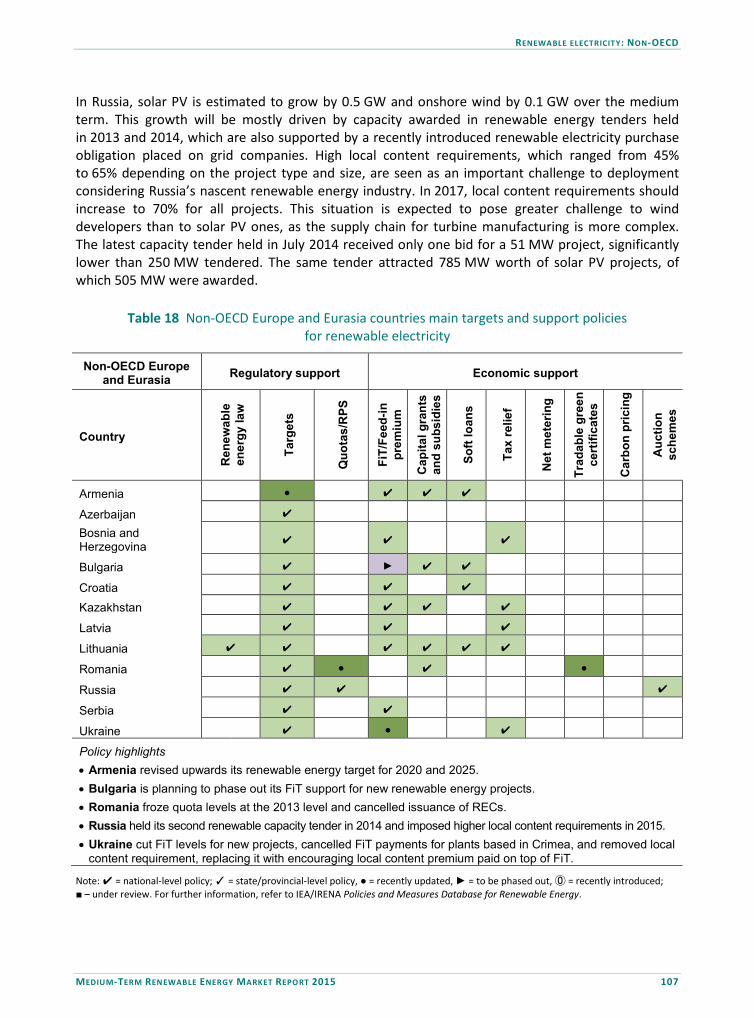
RENEWABLE ELECTRICITY: NON-OECD
MEDIUM-TERM RENEWABLE ENERGY MARKET REPORT 2015 107
In Russia, solar PV is estimated to grow by 0.5 GW and onshore wind by 0.1 GW over the medium term. This growth will be mostly driven by capacity awarded in renewable energy tenders held in 2013 and 2014, which are also supported by a recently introduced renewable electricity purchase obligation placed on grid companies. High local content requirements, which ranged from 45% to 65% depending on the project type and size, are seen as an important challenge to deployment considering Russia’s nascent renewable energy industry. In 2017, local content requirements should increase to 70% for all projects. This situation is expected to pose greater challenge to wind developers than to solar PV ones, as the supply chain for turbine manufacturing is more complex. The latest capacity tender held in July 2014 received only one bid for a 51 MW project, significantly lower than 250 MW tendered. The same tender attracted 785 MW worth of solar PV projects, of which 505 MW were awarded.
Table 18 Non-OECD Europe and Eurasia countries main targets and support policies for renewable electricity
Non-OECD Europe and Eurasia Regulatory support Economic support
Country
Ren
ewab
le
ener
gy la
w
Targ
ets
Quo
tas/
RPS
FiT/
Feed
-in
prem
ium
Cap
ital g
rant
s an
d su
bsid
ies
Soft
loan
s
Tax
relie
f
Net
met
erin
g
Trad
able
gre
en
cert
ifica
tes
Car
bon
pric
ing
Auc
tion
sche
mes
Armenia ● ✔ ✔ ✔
Azerbaijan ✔
Bosnia and Herzegovina ✔ ✔ ✔
Bulgaria ✔ ► ✔ ✔
Croatia ✔ ✔ ✔
Kazakhstan ✔ ✔ ✔ ✔
Latvia ✔ ✔ ✔
Lithuania ✔ ✔ ✔ ✔ ✔ ✔
Romania ✔ ● ✔ ●
Russia ✔ ✔ ✔
Serbia ✔ ✔
Ukraine ✔ ● ✔
Policy highlights • Armenia revised upwards its renewable energy target for 2020 and 2025. • Bulgaria is planning to phase out its FiT support for new renewable energy projects. • Romania froze quota levels at the 2013 level and cancelled issuance of RECs. • Russia held its second renewable capacity tender in 2014 and imposed higher local content requirements in 2015. • Ukraine cut FiT levels for new projects, cancelled FiT payments for plants based in Crimea, and removed local
content requirement, replacing it with encouraging local content premium paid on top of FiT.
Note: ✔ = national-level policy; ✓ = state/provincial-level policy, ● = recently updated, ► = to be phased out, ⓪ = recently introduced; ■ – under review. For further information, refer to IEA/IRENA Policies and Measures Database for Renewable Energy.

RENEWABLE ELECTRICITY: NON-OECD
108 MEDIUM-TERM RENEWABLE ENERGY MARKET REPORT 2015
Figure 26 Non-OECD Europe and Eurasia historical and forecasted capacity additions, generation and investment
290 300 310 320 330 340 350 360 370 380
2013 2014 2015 2016 2017 2018 2019 2020
Generat
ion (T
Wh)
0
2
4
6
8
10
0.0
0.5
1.0
1.5
2.0
2.5
3.0
3.5
4.0
2013 2014 2015 2016 2017 2018 2019 2020
USD
billio
n
Annu
al ad
dition
s (GW
)
Hydropower Bioenergy Onshore Wind Offshore Wind Solar PV Geothermal STE Ocean Investment
Source: Historical renewable electricity generation from IEA (2015a), “World energy statistics”, IEA World Energy Statistics and Balances (database). Romania’s renewable energy capacity should expand by around 0.9 GW over the medium term, reaching 12 GW by 2020. This expansion should be led by onshore wind (0.4 GW) and solar PV (0.3 GW). Romania’s outlook is more pessimistic versus MTRMR 2014 mainly due to recent policy changes, including the halving of certificate banding levels, the delay of issuance of certificates for new projects until 2017/18 and the decrease in renewable quota levels. The uncertainty regarding the support system for new projects from 2017 keeps the forecast moderate.
Table 19 Non-OECD Europe and Eurasia main drivers and challenges to renewable energy deployment
Country Drivers Challenges
Romania Good resources availability for onshore wind and solar PV.
Retroactive changes to policy supports. Delays between policy announcements and approvals.
Russia Long-term PPAs awarded through competitive renewable energy auctions.
General investment barriers and high local content requirements for renewable energy projects.
Ukraine Diversification needs. Policy support through a renewable energy target backed by FiTs.
Political instability affecting the investment environment. Grid infrastructure requires upgrades.
The renewable energy outlook in Ukraine is difficult to assess due to ongoing political instability and land ownership issues along the Black Sea coast, which contribute to high investment risks. The government’s commitment to energy diversification, generous FiTs and recently modified local content requirement are strong drivers for the deployment of renewables, but the forecast growth under the main case is modest due to the political situation. Ukraine’s underinvested grid infrastructure is also expected to pose a moderate challenge to renewable energy projects. Growth should be mostly stimulated by the FiTs, which remain at generous levels despite recent cuts. In June 2015, Ukraine removed the local content requirement rule and replaced it with a premium (5-10% depending on local content levels). Residential and commercial solar PV projects below 30 kW also benefit from FiTs. Solar PV coming on line in 2015 should receive EUR 170/MWh
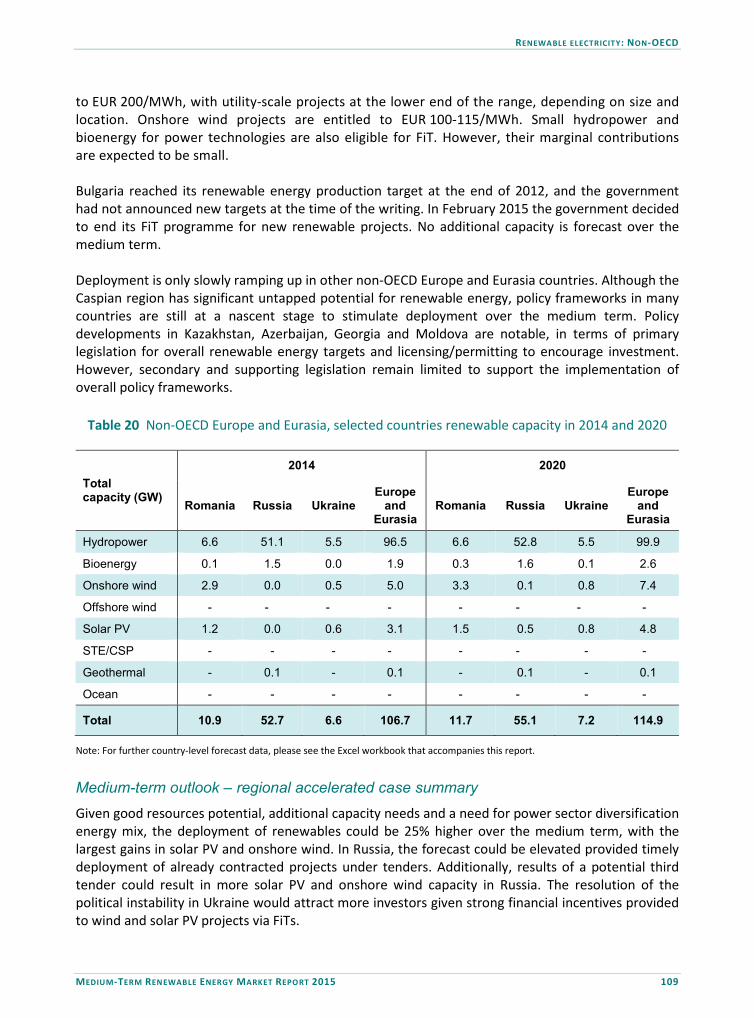
RENEWABLE ELECTRICITY: NON-OECD
MEDIUM-TERM RENEWABLE ENERGY MARKET REPORT 2015 109
to EUR 200/MWh, with utility-scale projects at the lower end of the range, depending on size and location. Onshore wind projects are entitled to EUR 100-115/MWh. Small hydropower and bioenergy for power technologies are also eligible for FiT. However, their marginal contributions are expected to be small. Bulgaria reached its renewable energy production target at the end of 2012, and the government had not announced new targets at the time of the writing. In February 2015 the government decided to end its FiT programme for new renewable projects. No additional capacity is forecast over the medium term. Deployment is only slowly ramping up in other non-OECD Europe and Eurasia countries. Although the Caspian region has significant untapped potential for renewable energy, policy frameworks in many countries are still at a nascent stage to stimulate deployment over the medium term. Policy developments in Kazakhstan, Azerbaijan, Georgia and Moldova are notable, in terms of primary legislation for overall renewable energy targets and licensing/permitting to encourage investment. However, secondary and supporting legislation remain limited to support the implementation of overall policy frameworks.
Table 20 Non-OECD Europe and Eurasia, selected countries renewable capacity in 2014 and 2020
Total capacity (GW)
2014 2020
Romania Russia Ukraine Europe
and Eurasia
Romania Russia Ukraine Europe
and Eurasia
Hydropower 6.6 51.1 5.5 96.5 6.6 52.8 5.5 99.9
Bioenergy 0.1 1.5 0.0 1.9 0.3 1.6 0.1 2.6
Onshore wind 2.9 0.0 0.5 5.0 3.3 0.1 0.8 7.4
Offshore wind - - - - - - - -
Solar PV 1.2 0.0 0.6 3.1 1.5 0.5 0.8 4.8
STE/CSP - - - - - - - -
Geothermal - 0.1 - 0.1 - 0.1 - 0.1
Ocean - - - - - - - -
Total 10.9 52.7 6.6 106.7 11.7 55.1 7.2 114.9
Note: For further country-level forecast data, please see the Excel workbook that accompanies this report. Medium-term outlook – regional accelerated case summary Given good resources potential, additional capacity needs and a need for power sector diversification energy mix, the deployment of renewables could be 25% higher over the medium term, with the largest gains in solar PV and onshore wind. In Russia, the forecast could be elevated provided timely deployment of already contracted projects under tenders. Additionally, results of a potential third tender could result in more solar PV and onshore wind capacity in Russia. The resolution of the political instability in Ukraine would attract more investors given strong financial incentives provided to wind and solar PV projects via FiTs.

RENEWABLE ELECTRICITY: NON-OECD
110 MEDIUM-TERM RENEWABLE ENERGY MARKET REPORT 2015
Figure 27 Non-OECD Europe and Eurasia incremental renewable capacity additions, main versus accelerated case
0 2 4 6 8 10 12
Total
Other
Solar PV
Wind
Capacity growth 2014-20 (GW)
Main case
Acceleratedcase
Middle East Recent trends
Renewables are currently a small source of generation in the Middle East. Despite excellent resources for some technologies, persistent regulatory barriers in the power sector and uneven implementation of renewable support policies have hampered development. In 2013, total renewable power in the Middle East was 25 TWh, less than 3% of total power generation. Overall, renewable capacity additions were small in 2014, with the commissioning of the 320 MW Seymareh dam in Iran and some distributed solar PV in Jordan as the most notable developments. Still, significant renewable investment and project pipelines have emerged in several countries, supported by the advent of policy frameworks offering long-term contracts for large-scale renewables, some progress in opening markets to distributed generation, and increasingly attractive project economics versus other sources of new generation.
In Jordan, cumulative solar PV capacity rose to near 14 MW, with residential and commercial-scale projects being added under the country’s net energy metering scheme, which was introduced in 2012. Though no new large-scale capacity came on line, 200 MW of utility-scale solar PV projects and the 117 MW Talifa wind farm signed PPAs under the country’s direct proposal submission scheme, which, in the first round, offered attractive FiTs (USD 150-170/MWh for solar PV; USD 120/MWh for wind) (RCREEE, 2015). A second round was launched to tender 200 MW solar PV under a competitive bidding mechanism, with the four chosen bids reportedly ranging from much lower values: USD 61-77/MWh (Tsagas, 2015). No announcement to date has been made for further wind auctions, with grid integration concerns reportedly slowing development (Collins, 2015).
In the United Arab Emirates, renewable capacity remained steady in 2014, though generation rose with a full year of output from the 100 MW Shams 1 STE parabolic trough plant and the first phase (13 MW) of Dubai’s Mohammed Bin Rashid Al Maktoum Solar Park. In early 2015, the second phase (200 MW) was tendered for commissioning in 2017. The preferred bidder signed a 25-year PPA at USD 58.4/MWh – to date, the lowest contracted solar PV price observed globally. Aside from the long-term certainty provided by the PPA and the price competition from the auction, the bid benefited from excellent resources; reportedly attractive debt financing terms; a sizeable
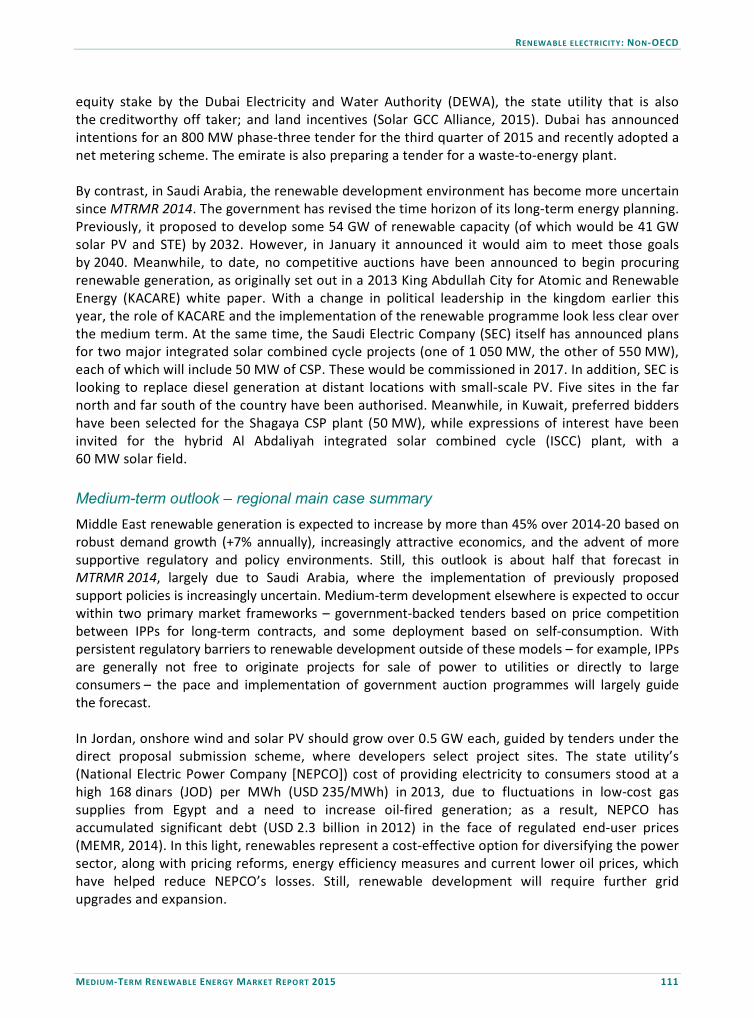
RENEWABLE ELECTRICITY: NON-OECD
MEDIUM-TERM RENEWABLE ENERGY MARKET REPORT 2015 111
equity stake by the Dubai Electricity and Water Authority (DEWA), the state utility that is also the creditworthy off taker; and land incentives (Solar GCC Alliance, 2015). Dubai has announced intentions for an 800 MW phase-three tender for the third quarter of 2015 and recently adopted a net metering scheme. The emirate is also preparing a tender for a waste-to-energy plant. By contrast, in Saudi Arabia, the renewable development environment has become more uncertain since MTRMR 2014. The government has revised the time horizon of its long-term energy planning. Previously, it proposed to develop some 54 GW of renewable capacity (of which would be 41 GW solar PV and STE) by 2032. However, in January it announced it would aim to meet those goals by 2040. Meanwhile, to date, no competitive auctions have been announced to begin procuring renewable generation, as originally set out in a 2013 King Abdullah City for Atomic and Renewable Energy (KACARE) white paper. With a change in political leadership in the kingdom earlier this year, the role of KACARE and the implementation of the renewable programme look less clear over the medium term. At the same time, the Saudi Electric Company (SEC) itself has announced plans for two major integrated solar combined cycle projects (one of 1 050 MW, the other of 550 MW), each of which will include 50 MW of CSP. These would be commissioned in 2017. In addition, SEC is looking to replace diesel generation at distant locations with small-scale PV. Five sites in the far north and far south of the country have been authorised. Meanwhile, in Kuwait, preferred bidders have been selected for the Shagaya CSP plant (50 MW), while expressions of interest have been invited for the hybrid Al Abdaliyah integrated solar combined cycle (ISCC) plant, with a 60 MW solar field. Medium-term outlook – regional main case summary Middle East renewable generation is expected to increase by more than 45% over 2014-20 based on robust demand growth (+7% annually), increasingly attractive economics, and the advent of more supportive regulatory and policy environments. Still, this outlook is about half that forecast in MTRMR 2014, largely due to Saudi Arabia, where the implementation of previously proposed support policies is increasingly uncertain. Medium-term development elsewhere is expected to occur within two primary market frameworks – government-backed tenders based on price competition between IPPs for long-term contracts, and some deployment based on self-consumption. With persistent regulatory barriers to renewable development outside of these models – for example, IPPs are generally not free to originate projects for sale of power to utilities or directly to large consumers – the pace and implementation of government auction programmes will largely guide the forecast. In Jordan, onshore wind and solar PV should grow over 0.5 GW each, guided by tenders under the direct proposal submission scheme, where developers select project sites. The state utility’s (National Electric Power Company [NEPCO]) cost of providing electricity to consumers stood at a high 168 dinars (JOD) per MWh (USD 235/MWh) in 2013, due to fluctuations in low-cost gas supplies from Egypt and a need to increase oil-fired generation; as a result, NEPCO has accumulated significant debt (USD 2.3 billion in 2012) in the face of regulated end-user prices (MEMR, 2014). In this light, renewables represent a cost-effective option for diversifying the power sector, along with pricing reforms, energy efficiency measures and current lower oil prices, which have helped reduce NEPCO’s losses. Still, renewable development will require further grid upgrades and expansion.
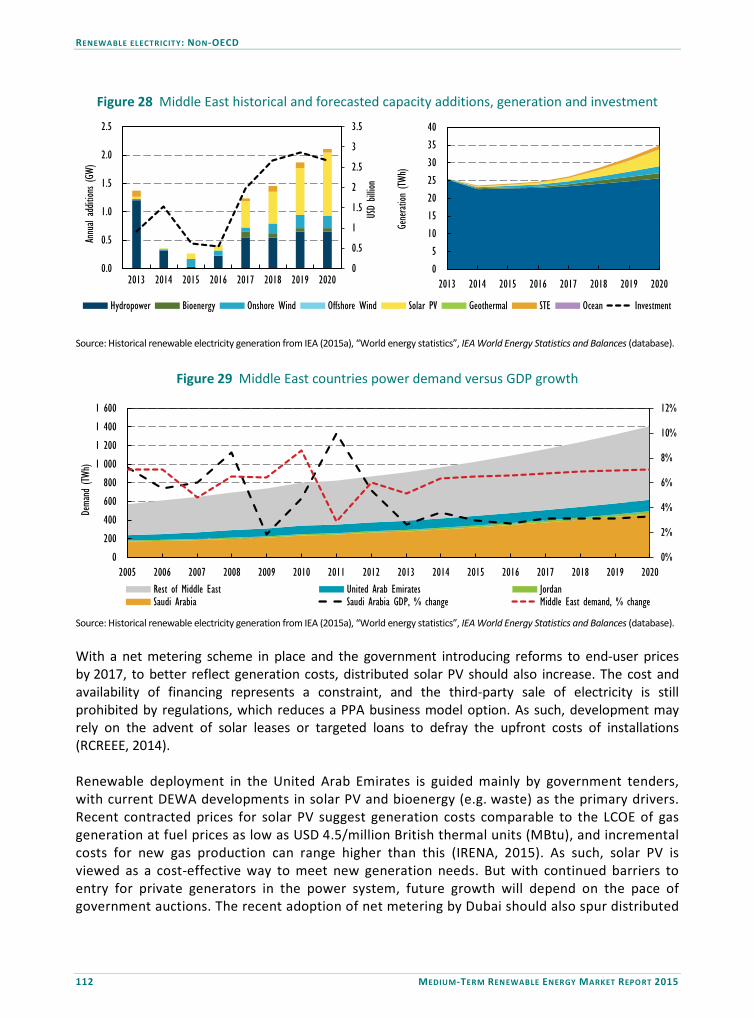
RENEWABLE ELECTRICITY: NON-OECD
112 MEDIUM-TERM RENEWABLE ENERGY MARKET REPORT 2015
Figure 28 Middle East historical and forecasted capacity additions, generation and investment
0
5
10
15
20
25
30
35
40
2013 2014 2015 2016 2017 2018 2019 2020
Generat
ion (T
Wh)
0
0.5
1
1.5
2
2.5
3
3.5
0.0
0.5
1.0
1.5
2.0
2.5
2013 2014 2015 2016 2017 2018 2019 2020
USD
billio
n
Annu
al ad
dition
s (GW
)
Hydropower Bioenergy Onshore Wind Offshore Wind Solar PV Geothermal STE Ocean Investment
Source: Historical renewable electricity generation from IEA (2015a), “World energy statistics”, IEA World Energy Statistics and Balances (database).
Figure 29 Middle East countries power demand versus GDP growth
0%
2%
4%
6%
8%
10%
12%
0
200
400
600
800
1 000
1 200
1 400
1 600
2005 2006 2007 2008 2009 2010 2011 2012 2013 2014 2015 2016 2017 2018 2019 2020
Dema
nd (T
Wh)
Rest of Middle East United Arab Emirates JordanSaudi Arabia Saudi Arabia GDP, % change Middle East demand, % change
Source: Historical renewable electricity generation from IEA (2015a), “World energy statistics”, IEA World Energy Statistics and Balances (database). With a net metering scheme in place and the government introducing reforms to end-user prices by 2017, to better reflect generation costs, distributed solar PV should also increase. The cost and availability of financing represents a constraint, and the third-party sale of electricity is still prohibited by regulations, which reduces a PPA business model option. As such, development may rely on the advent of solar leases or targeted loans to defray the upfront costs of installations (RCREEE, 2014). Renewable deployment in the United Arab Emirates is guided mainly by government tenders, with current DEWA developments in solar PV and bioenergy (e.g. waste) as the primary drivers. Recent contracted prices for solar PV suggest generation costs comparable to the LCOE of gas generation at fuel prices as low as USD 4.5/million British thermal units (MBtu), and incremental costs for new gas production can range higher than this (IRENA, 2015). As such, solar PV is viewed as a cost-effective way to meet new generation needs. But with continued barriers to entry for private generators in the power system, future growth will depend on the pace of government auctions. The recent adoption of net metering by Dubai should also spur distributed

RENEWABLE ELECTRICITY: NON-OECD
MEDIUM-TERM RENEWABLE ENERGY MARKET REPORT 2015 113
solar PV development, but subsidised end-user electricity pricing suggests uncertainty over its near-term effectiveness as a driver.
Table 21 Middle East countries main targets and support policies for renewable electricity
Country Targets Support policies
Jordan
7% renewables in primary energy by 2015 (60 MW wind, 300 MW solar PV) 10% renewables in primary energy by 2020 (1.2 GW wind, 600 MW solar, 30-50 MW waste-to-energy)
FiTs net metering tax incentives competitive tenders
Kuwait 5% renewable generation by 2020 10% renewable generation by 2030 (3.5 GW solar PV, 1.1 GW STE, 3.1 GW wind)
None
Iran 5 GW of wind and solar power FiTs, capital subsidies, soft loans Qatar 640 MW (solar) by 2020 Competitive tenders
Saudi Arabia
Proposed deployment roadmap: 24 GW renewable capacity by 2020 54 GW renewable capacity by 2040 (16 GW solar PV, 25 GW STE, 9 GW wind, 3 GW waste-to-energy, 1 GW geothermal)
Competitive tenders
United Arab Emirates
7% renewable capacity by 2020 (Abu Dhabi) 7% renewable generation by 2020 (Dubai) 15% renewable generation by 2030 (Dubai)
Public investments, loans, grants competitive tenders
Yemen 15% renewable generation by 2025 None
Table 22 Middle East main drivers and challenges to renewable energy deployment
Country Drivers Challenges
Jordan
Few domestic fossil fuel resources and strong need for power sector diversification Tendering framework based on long-term contracts; net metering for distributed capacity Low solar PV contracted prices make it cost-effective versus new conventional generation
Needed upgrade of the domestic grid and low interconnection with other countries in the region Cost and availability of financing
Saudi Arabia
Excellent renewable resources, fast-growing demand and strong need for power sector diversification
Uncertainty over timing and implementation of policy framework Non-economic barriers to power sector participation and high local content provisions
United Arab Emirates
Fast-growing demand and strong need for power sector diversification Tendering framework and net metering for small distributed capacity Low solar PV contracted prices make it cost-effective versus new conventional generation
Non-economic barriers to power sector participation can present investment challenges to new entrants outside of the tendering framework Subsidised end-user electricity prices
In Saudi Arabia, some renewable growth across solar PV, STE and onshore wind is still forecast, despite uncertainties over the policy environment. Moreover, Iran has a significant hydropower pipeline, with capacity forecast to grow by 3 GW over 2014-20.
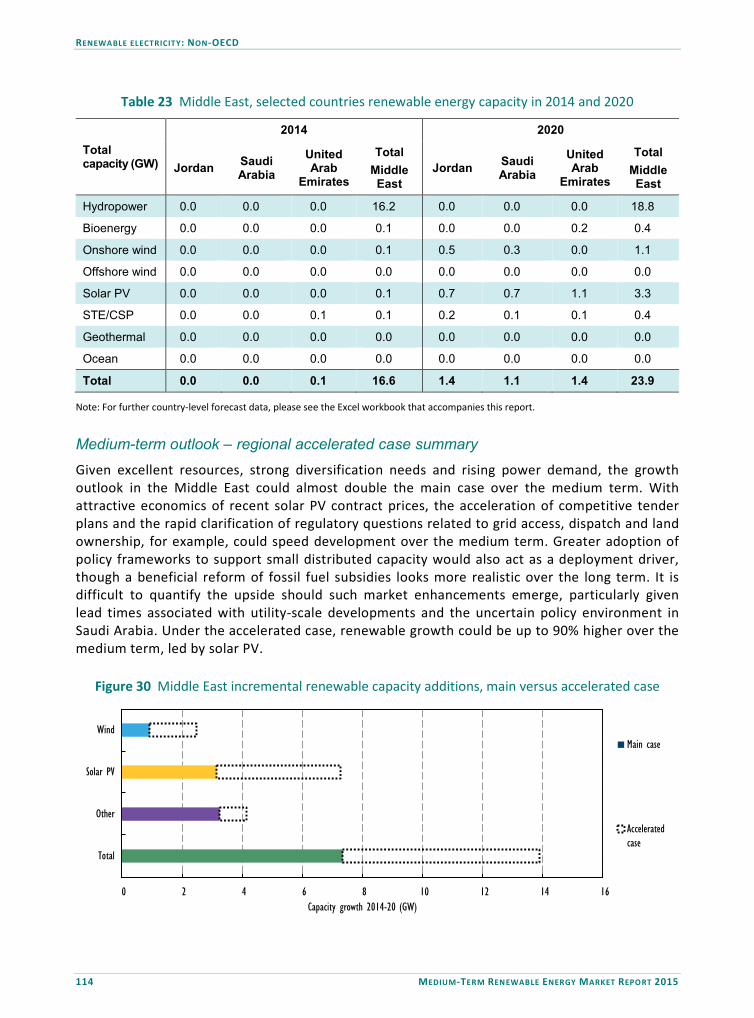
RENEWABLE ELECTRICITY: NON-OECD
114 MEDIUM-TERM RENEWABLE ENERGY MARKET REPORT 2015
Table 23 Middle East, selected countries renewable energy capacity in 2014 and 2020
Total capacity (GW)
2014 2020
Jordan Saudi Arabia
United Arab
Emirates
Total Middle East
Jordan Saudi Arabia
United Arab
Emirates
Total Middle East
Hydropower 0.0 0.0 0.0 16.2 0.0 0.0 0.0 18.8
Bioenergy 0.0 0.0 0.0 0.1 0.0 0.0 0.2 0.4
Onshore wind 0.0 0.0 0.0 0.1 0.5 0.3 0.0 1.1
Offshore wind 0.0 0.0 0.0 0.0 0.0 0.0 0.0 0.0
Solar PV 0.0 0.0 0.0 0.1 0.7 0.7 1.1 3.3
STE/CSP 0.0 0.0 0.1 0.1 0.2 0.1 0.1 0.4
Geothermal 0.0 0.0 0.0 0.0 0.0 0.0 0.0 0.0
Ocean 0.0 0.0 0.0 0.0 0.0 0.0 0.0 0.0
Total 0.0 0.0 0.1 16.6 1.4 1.1 1.4 23.9
Note: For further country-level forecast data, please see the Excel workbook that accompanies this report. Medium-term outlook – regional accelerated case summary Given excellent resources, strong diversification needs and rising power demand, the growth outlook in the Middle East could almost double the main case over the medium term. With attractive economics of recent solar PV contract prices, the acceleration of competitive tender plans and the rapid clarification of regulatory questions related to grid access, dispatch and land ownership, for example, could speed development over the medium term. Greater adoption of policy frameworks to support small distributed capacity would also act as a deployment driver, though a beneficial reform of fossil fuel subsidies looks more realistic over the long term. It is difficult to quantify the upside should such market enhancements emerge, particularly given lead times associated with utility-scale developments and the uncertain policy environment in Saudi Arabia. Under the accelerated case, renewable growth could be up to 90% higher over the medium term, led by solar PV.
Figure 30 Middle East incremental renewable capacity additions, main versus accelerated case
0 2 4 6 8 10 12 14 16
Total
Other
Solar PV
Wind
Capacity growth 2014-20 (GW)
Main case
Acceleratedcase

RENEWABLE ELECTRICITY: NON-OECD
MEDIUM-TERM RENEWABLE ENERGY MARKET REPORT 2015 115
Non-OECD Americas Recent trends Renewable power generation in the OECD non-members in the Americas was stable in 2014 with a doubling of onshore wind generation offset by lower hydropower output due to the continuation of a severe regional drought in the region, particularly in Brazil. The share of renewables in the region, which stood at an estimated 63% of total generation in 2013, remains the highest among all MTRMR regions mainly due to the high penetration of hydropower. However, relatively low hydropower output due to parched reservoirs in recent years has raised concerns over energy security and the diversification of the power sector. Non-hydro renewables are seen playing an increasing role, particularly given limited regional pipeline capacity for natural gas transit, limited liquefied natural gas import terminals and needs to diversify from a still-significant level of oil-fired generation. In Brazil, the renewable share in total generation stood at 77% in 2013, down from 82% in 2012. The country’s renewable generation decreased further in 2014 because hydropower generation decreased by 4.5% year-on-year and stood near 370 TWh, the lowest output since 2007, mainly due to a severe drought that the country has been experiencing since early 2013. A few large cities including São Paolo and Rio de Janeiro have experienced water and electricity cuts over the last year as some reservoir levels could not adequately replenish themselves during the rainy season. Hydropower represented more than 66% of overall generation in 2014, down from around 70% in 2013 and significantly lower than 80% on average over 2004-12. Nevertheless, Brazil added 3 GW of new hydropower capacity in 2014 as some large plants awarded in 2008-11 auctions came on line.
Figure 31 Non-OECD Americas power demand versus GDP growth
0.0%
1.0%
2.0%
3.0%
4.0%
5.0%
6.0%
7.0%
8.0%
0
100
200
300
400
500
600
700
Argentina Brazil Peru
CAAG
R 20
14-20
Dema
nd (T
Wh)
2014
2020
Demand (righthand axis)
GDP (righthand axis)
Auctions awarding long-term PPAs remain the strongest driver for the renewable capacity expansion in Brazil. In 2014, some 1.9 GW of previously tendered onshore wind came on line in 2014, the highest additions to date. Many of these projects were contracted in the 2011 auctions and had already been built, and their commissioning was marked by the finalisation of grid connections. Onshore wind’s share in power generation increased from 1% in 2012 to 1.5% in 2013. Though a large producer of bioenergy for power, Brazil added only 100 MW of new capacity in 2014, significantly lower than 850 MW added in 2013. In Argentina, renewable generation increased by more than 5%, reaching over 34 TWh as hydro levels somewhat recovered versus 2013. In 2013, the share of renewables stood at 25%, slightly

RENEWABLE ELECTRICITY: NON-OECD
116 MEDIUM-TERM RENEWABLE ENERGY MARKET REPORT 2015
higher than in 2012. Hydropower provided by an estimated 23% of the overall generation, and the share of wind generation was stable at 1%. The country added only 50 MW of new onshore wind capacity reaching a cumulative 270 MW in 2014. Despite good solar PV potential, new additions stood at only 20 MW, lower than in 2013. Peru’s renewable power accounted for an estimated 53% of overall generation in 2013. Renewable output stood at around 23 TWh in 2013 with hydropower providing more than 51% of the overall generation. Natural gas provided the majority of the rest. In 2014, three onshore wind projects (150 MW in total) auctioned in 2010 started to produce electricity after having experienced connection delays in 2013. With these additions, the share of onshore wind generation stood at just over 1%. The country also added 40 MW of solar PV capacity, reaching 110 MW in total. A few large renewable energy projects were commissioned in other countries in the region. Uruguay commissioned 300 MW of onshore wind, driven by the projects contracted in previous auctions held in 2011 and 2012, while a 50 MW project became operational in Honduras. In Costa Rica, the Chiripa wind farm (50 MW) started to generate electricity in June 2014. Medium-term outlook – regional main case summary Overall, renewable generation in the non-OECD Americas is seen rising by over 200 TWh, or nearly 27%, from 2014-20. The region should add around 53 GW of new renewable capacity over the medium term. Hydropower is likely to lead the growth, with over 25 GW of new additions over 2014-20 as the pipeline for large-scale projects remains large. However, the forecast has been revised down by over 4.5 GW compared with MTRMR 2014 mainly due to a lower project pipeline and a reduced incremental role for the technology in energy planning to meet new generation needs, particularly in Brazil (on the role of hydropower in energy planning in Brazil, see MME, 2014). This change largely explains the expectations for lower renewable capacity additions in 2019-20 versus the first half of the forecast period.
Figure 32 Non-OECD Americas historical and forecasted capacity additions, generation and investment
0 100 200 300 400 500 600 700 800 900
1 000
2013 2014 2015 2016 2017 2018 2019 2020
Generat
ion (T
Wh)
0
5
10
15
20
25
0
2
4
6
8
10
12
2013 2014 2015 2016 2017 2018 2019 2020
USD
billio
n
Annu
al ad
dition
s (GW
)
Hydropower Bioenergy Onshore Wind Offshore Wind Solar PV Geothermal STE Ocean Investment
Source: Historical renewable electricity generation from IEA (2015a), “World energy statistics”, IEA World Energy Statistics and Balances (database).
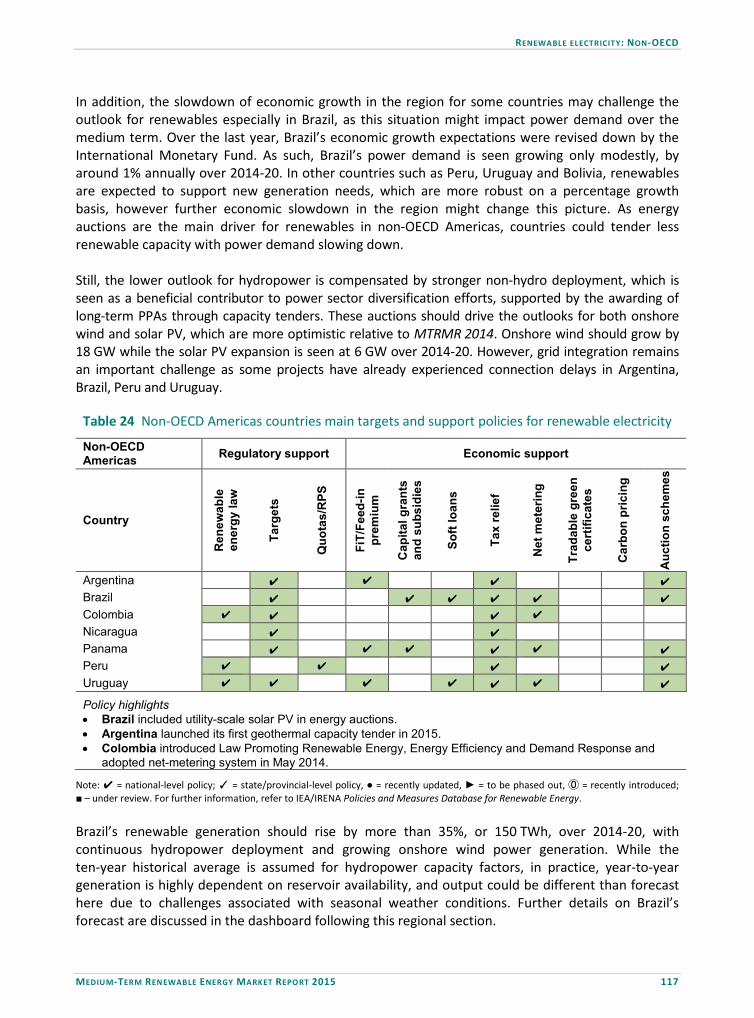
RENEWABLE ELECTRICITY: NON-OECD
MEDIUM-TERM RENEWABLE ENERGY MARKET REPORT 2015 117
In addition, the slowdown of economic growth in the region for some countries may challenge the outlook for renewables especially in Brazil, as this situation might impact power demand over the medium term. Over the last year, Brazil’s economic growth expectations were revised down by the International Monetary Fund. As such, Brazil’s power demand is seen growing only modestly, by around 1% annually over 2014-20. In other countries such as Peru, Uruguay and Bolivia, renewables are expected to support new generation needs, which are more robust on a percentage growth basis, however further economic slowdown in the region might change this picture. As energy auctions are the main driver for renewables in non-OECD Americas, countries could tender less renewable capacity with power demand slowing down. Still, the lower outlook for hydropower is compensated by stronger non-hydro deployment, which is seen as a beneficial contributor to power sector diversification efforts, supported by the awarding of long-term PPAs through capacity tenders. These auctions should drive the outlooks for both onshore wind and solar PV, which are more optimistic relative to MTRMR 2014. Onshore wind should grow by 18 GW while the solar PV expansion is seen at 6 GW over 2014-20. However, grid integration remains an important challenge as some projects have already experienced connection delays in Argentina, Brazil, Peru and Uruguay.
Table 24 Non-OECD Americas countries main targets and support policies for renewable electricity
Non-OECD Americas Regulatory support Economic support
Country
Ren
ewab
le
ener
gy la
w
Targ
ets
Quo
tas/
RPS
FiT/
Feed
-in
prem
ium
Cap
ital g
rant
s an
d su
bsid
ies
Soft
loan
s
Tax
relie
f
Net
met
erin
g
Trad
able
gre
en
cert
ifica
tes
Car
bon
pric
ing
Auc
tion
sche
mes
Argentina ✔ ✔ ✔ ✔ Brazil ✔ ✔ ✔ ✔ ✔ ✔ Colombia ✔ ✔ ✔ ✔ Nicaragua ✔ ✔ Panama ✔ ✔ ✔ ✔ ✔ ✔ Peru ✔ ✔ ✔ ✔ Uruguay ✔ ✔ ✔ ✔ ✔ ✔ ✔
Policy highlights • Brazil included utility-scale solar PV in energy auctions. • Argentina launched its first geothermal capacity tender in 2015. • Colombia introduced Law Promoting Renewable Energy, Energy Efficiency and Demand Response and
adopted net-metering system in May 2014.
Note: ✔ = national-level policy; ✓ = state/provincial-level policy, ● = recently updated, ► = to be phased out, ⓪ = recently introduced; ■ – under review. For further information, refer to IEA/IRENA Policies and Measures Database for Renewable Energy. Brazil’s renewable generation should rise by more than 35%, or 150 TWh, over 2014-20, with continuous hydropower deployment and growing onshore wind power generation. While the ten-year historical average is assumed for hydropower capacity factors, in practice, year-to-year generation is highly dependent on reservoir availability, and output could be different than forecast here due to challenges associated with seasonal weather conditions. Further details on Brazil’s forecast are discussed in the dashboard following this regional section.

RENEWABLE ELECTRICITY: NON-OECD
118 MEDIUM-TERM RENEWABLE ENERGY MARKET REPORT 2015
Table 25 Non-OECD Americas main drivers and challenges to renewable energy deployment
Country Drivers Challenges
Brazil
Growing power demand and government-sponsored power auctions with long-term PPAs. Availability of low-cost financing from the Brazilian development bank (BNDES).
Increasing local content requirements may challenge economic attractiveness of developments. Acceleration of distributed solar PV deployment.
Argentina Renewable auctions supported by long-term PPAs.
Weak macroeconomic environment also affecting renewable financing.
Peru Strong power demand growth with excellent wind and solar resources.
Under-invested grid creating constraints over the connection of renewables.
Uruguay High wholesale electricity prices. Auctions supported by long-term PPAs. Tax incentives to renewables.
Grid connection delays for already-contracted projects.
Renewable energy in Peru is expected to grow by 9 TWh over 2014-20. In 2014, the government granted approval to develop two additional hydropower plants in Junín and Pasco regions. The majority of new generation should come from hydropower, and around half of country’s 1.8 GW pipeline is expected to come on line over the medium term. The forecast for onshore wind and solar PV was revised down due to government’s focus on the expansion of natural gas production and its domestic use to support the country’s growing economy. Peru’s weak electricity grid in the south and north of the country, where renewable potential is high, represents a moderate challenge to deployment. Onshore wind should expand by 400 MW, driven by previous renewable energy generation auctions held in 2010 and 2012. This report assumes that an additional auction will be held over the medium term. Tenders should also drive solar PV expansions with 350 MW expected to come on line over 2014-20. In addition, the government’s plan to install small-scale PV systems for 500 000 households within the rural electrification programme should also contribute. Uruguay's renewable generation is expected to grow by 3.5 TWh over 2014-20. Over 80% of this incremental generation should come from onshore wind. This report expects all wind projects that were awarded in the auction held in 2011 to come on line over the forecast period. In addition, tax incentives provided to wind developers should support the deployment over the medium-term. Import taxes are not applied to wind turbines, while project developers could take advantage of a tax deduction of up to 90% for the first four years of operation. Onshore wind capacity should expand by 0.9 GW, reaching 1.4 GW in 2020. In 2014, Uruguay’s state utility (UTE) signed PPAs for over 190 MW of solar PV capacity at around USD 90/MWh for 25 years. The contracted projects should all become operational by 2017. This report expects solar PV to expand by 0.3 GW, and additional auctions are expected to be introduced over 2014-20. Panama held its first solar PV auction in November 2014 to procure around 660 000 MWh of electricity. Panama’s electricity transmission company (ETESA) selected four projects with a weighted average price of USD 87/MWh. Projects are expected to sign PPAs with ETESA by the end of 2015 for 20 years, to come on line in January 2017. With good insolation levels and high wholesale electricity prices (average USD 214/MWh in 2014 and USD 209/MWh in 2013), solar PV plants are seen as a cost-effective option to offset expensive fossil fuel generation.
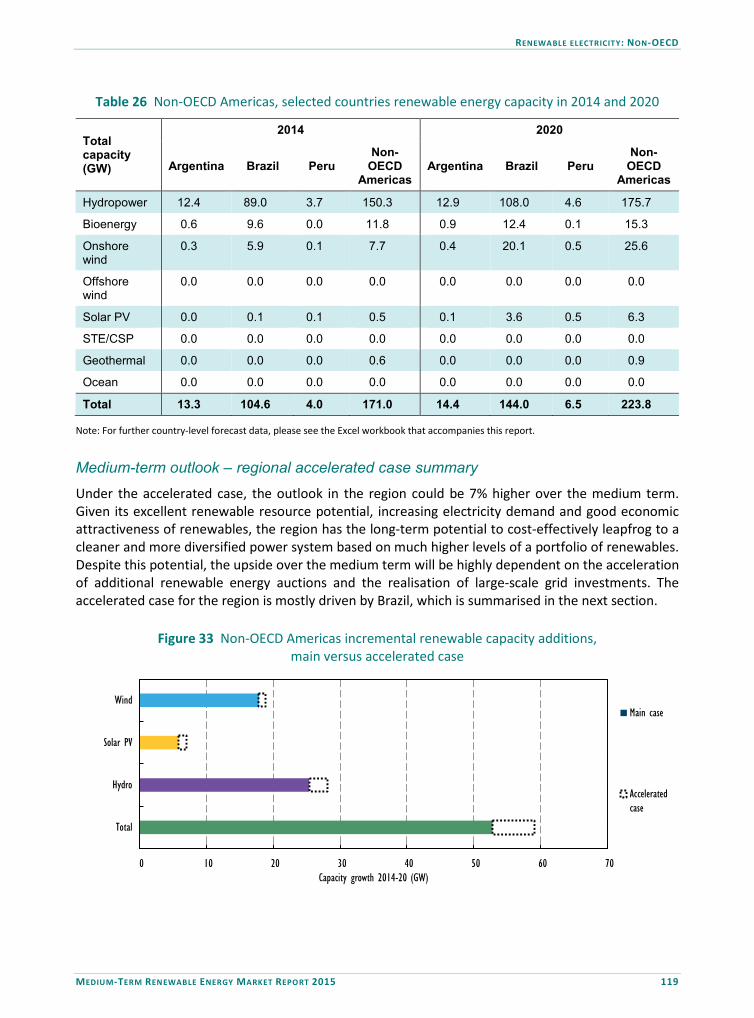
RENEWABLE ELECTRICITY: NON-OECD
MEDIUM-TERM RENEWABLE ENERGY MARKET REPORT 2015 119
Table 26 Non-OECD Americas, selected countries renewable energy capacity in 2014 and 2020
Total capacity (GW)
2014 2020
Argentina Brazil Peru Non-
OECD Americas
Argentina Brazil Peru Non-
OECD Americas
Hydropower 12.4 89.0 3.7 150.3 12.9 108.0 4.6 175.7
Bioenergy 0.6 9.6 0.0 11.8 0.9 12.4 0.1 15.3
Onshore wind
0.3 5.9 0.1 7.7 0.4 20.1 0.5 25.6
Offshore wind
0.0 0.0 0.0 0.0 0.0 0.0 0.0 0.0
Solar PV 0.0 0.1 0.1 0.5 0.1 3.6 0.5 6.3
STE/CSP 0.0 0.0 0.0 0.0 0.0 0.0 0.0 0.0
Geothermal 0.0 0.0 0.0 0.6 0.0 0.0 0.0 0.9
Ocean 0.0 0.0 0.0 0.0 0.0 0.0 0.0 0.0
Total 13.3 104.6 4.0 171.0 14.4 144.0 6.5 223.8
Note: For further country-level forecast data, please see the Excel workbook that accompanies this report. Medium-term outlook – regional accelerated case summary
Under the accelerated case, the outlook in the region could be 7% higher over the medium term. Given its excellent renewable resource potential, increasing electricity demand and good economic attractiveness of renewables, the region has the long-term potential to cost-effectively leapfrog to a cleaner and more diversified power system based on much higher levels of a portfolio of renewables. Despite this potential, the upside over the medium term will be highly dependent on the acceleration of additional renewable energy auctions and the realisation of large-scale grid investments. The accelerated case for the region is mostly driven by Brazil, which is summarised in the next section.
Figure 33 Non-OECD Americas incremental renewable capacity additions, main versus accelerated case
0 10 20 30 40 50 60 70
Total
Hydro
Solar PV
Wind
Capacity growth 2014-20 (GW)
Main case
Acceleratedcase

RENEWABLE ELECTRICITY: NON-OECD
120 MEDIUM-TERM RENEWABLE ENERGY MARKET REPORT 2015
Brazil dashboard
Figure D.40 Brazil annual net additions to renewable capacity (2013-20)
0
1
2
3
4
5
6
7
8
2013 2014 2015 2016 2017 2018 2019 2020
Annu
al ad
dition
s (GW
)
Ocean
STE
Geothermal
Solar PV
Offshore Wind
Onshore Wind
Bioenergy
Hydropower
Figure D.41 Brazil power capacity auction results and prices
0
50
100
150
200
250
0
500
1 000
1 500
2 000
2 500
3 000
3 500
4 000
A-3 2014 A-5 A-3 A-5 A-3 A-5 A-3
August 2013 August 2013 November 2013 December 2013 August 2014 November 2014 April 2015
BRL/MW
h
MW
Onshore wind Biomass Large hydro Small hydro Solar PV Natural Gas Average price
Table D.16 Brazil renewable power capacity forecast (2014-20)
2014 2016 2018 2020 2020*
Hydropower 88.9 96.9 103.9 107.9 113
Bioenergy 9.6 10.1 10.9 12.4 13.7
Onshore wind 5.9 10.2 15.7 20.7 21.7
Offshore wind - - - - 0.0
Solar PV 0.1 0.6 1.6 3.6 4.9
STE/CSP - - - - 0.0
Geothermal - - - - 0.0
Ocean - - - - 0.0
Total 104.6 117.8 132.2 144.6 153.1
* Accelerated case.
• Drivers - growing power demand and benefits of a diversified portfolio of sources to meet generation needs - regular energy auctions with long-term PPAs - availability of low-cost financing from BNDES.
• Challenges - increasing local content requirement may challenge economic attractiveness - high import tariff for some solar equipment - financing challenges for distributed solar PV projects.
RENEWABLE ELECTRICITY: NON-OECD
MEDIUM-TERM RENEWABLE ENERGY MARKET REPORT 2015 121
Medium-term forecast: Brazil main case
Brazil’s renewable capacity should expand by 40 GW over 2014-20. The forecast is more optimistic due to upward revisions in onshore wind, solar PV and bioenergy even as the hydropower outlook is lower. However, latest macroeconomic developments might affect financing environment negatively. Hydropower additions still drive the forecast, but energy diversification needs have come to the fore as severe drought has continued over the last year and the role for hydropower in energy planning to meet new generation needs has been reduced. In 2014, the government’s decennial energy planning document decreased hydropower’s contribution to electricity generation in 2020 from 64% to around 61% (MME, 2014). This situation has also spurred the auctioning of more biomass and natural gas capacity since 2013 with contract durations increased from 20 to 25 years. Despite a downward revision, hydropower additions should still lead Brazil’s new renewable capacity with 19 GW coming on line over 2014-20. The outlook for bioenergy for power is also more optimistic, with around 3 GW expected to be commissioned. Utility-scale solar PV projects are expected to pick up in 2016/17 driven by auctions. In 2014, 890 MW of utility-scale projects won contracts with an average price of 215 reals (BRL) per MWh (USD 87/MWh). There are several drivers for this record-low average price. First, around half of contracted projects are in the Bahia province, where high capacity factors (23%) are expected. Second, developers anticipate manageable connection costs, as grid infrastructure is strong in the province. Third, BNDES opened preferential credit lines for solar projects with low interest rates. Still, financing remains challenging as BNDES loans cover only 45-55% of investment costs depending on the local content. Solar PV should expand by 3.5 GW over 2014-20 mostly with utility-scale projects. Despite high retail electricity prices and net metering in place, distributed projects contribution should be small as financing remains challenging. The onshore wind outlook is stronger, but prices have continued to increase. In 2014, 1.7 GW of wind projects signed contracts and average auction prices increased between 10-12%. In April 2015, only 90 MW of wind capacity was contracted for BRL 177/MWh, 30-35% higher than last year. Although it is difficult to understand the precise drivers behind this upward pressure on price levels, a combination of rising grid costs for developers, currency devaluation and an expected increase in turbine prices due to more stringent local content requirements likely to contribute. Nevertheless, more than 6 GW of wind projects were awarded since 2013 and further capacity should be tendered between 2015 and 2017. Overall, onshore wind is expected to grow by 14 GW over 2014-20 with attractive BNDES financing and government auctions.
Medium-term forecast: Brazil accelerated case
Brazil’s renewable capacity could be 6 GW higher by 2020 under enhanced conditions. Hydropower could be 2 GW higher with faster commissioning of contracted projects. Onshore wind capacity could be 1 GW higher if additional auctions are held. The upside for solar PV depends on new financing sources for utility-scale projects and a clearer market framework for distributed systems. In that case, solar PV capacity could be 0.5-1 GW higher by 2020. In addition, biomass capacity could be 1 GW higher with more favourable auction rules.

RENEWABLE ELECTRICITY: NON-OECD
122 MEDIUM-TERM RENEWABLE ENERGY MARKET REPORT 2015
References Agrawal, B. (2015), India’s Latest Solar PV Auction Price Trends, Bloomberg New Energy Finance, London. Agrawal, B. (2013), India Solar PV Auctions: Prices, Successes and Failures, Bloomberg New Energy Finance, London. Agrawal, B., S. Jaiswal, P. Sreenivasan, A. Sethia and J. Wu (2015), H1 2015 India Market Outlook, Bloomberg New Energy Finance, London. Bloomberg LP (2015), (accessed June 2015). Bridge to India (2014), India Solar Rooftop Map 2015, Bridge to India, Gurgaon. CEA (Central Electricity Authority) (2015), Executive Summary: Power Sector March 2015, CEA/Ministry of Power, New Delhi. CEA (2014), Tariff & Duty of Electricity Supply in India, CEA, New Delhi. Chase, J., J. Wu and N. Duan (2015), China to Approve over 17.8 GW of PV in 2015, BNEF, London. Collins, L. (2015), “Jordan’s wind push crimped by grid issues”, RECHARGE, RechargeNews, London. DOE (Department of Energy of South Africa) (2015a), Renewable Energy IPP Procurement Programme, Bid Window 4, Preferred Bidders’ Announcement, DOE, Pretoria. DOE (2015b), Expansion and Acceleration of the Independent Power Producer Procurement Programme, Media Statement April 16, 2015, DOE, Pretoria. DOE (2015c), Policy and Budget Speech May 19th, 2015, DOE, Cape Town. Eskom (2015), MYPD 3 Re-opener for selective Items (2015/2016 ~2017/2018) OCGTs and STPPP, National Energy Regulator of South Africa, Pretoria. Eskom (2014), Transmission Development Plan 2015-2024, Eskom, Johannesburg. Eurostat (2015), “Share of renewables in energy consumption up to 15% in the EU in 2013: Three Member States already achieved their 2020 targets”, Eurostat News Release, No. 43/2015, Brussels. FDRE (Federal Democratic Republic of Ethiopia) (2011,) Ethiopia’s Climate-Resilient Green Economy, Green economy strategy, FDRE, Addis Ababa. FDRE (2012), Scaling-Up Renewable Energy Program, Ethiopia Investment Plan, FDRE, Washington, D.C. Gombar, V. (2015), India Renewables Financing: Busting the Four Myths, BNEF, London.
RENEWABLE ELECTRICITY: NON-OECD
MEDIUM-TERM RENEWABLE ENERGY MARKET REPORT 2015 123
GoK (2011), Updated Least Cost Power Development Plan: Study Period 2011-2031, Energy Regulatory Commission, Nairobi, Kenya. Government of Telangana (2015), Exceeding the expectations of tenders for solar energy, Telengana State Portal, Hyderabad, http://www.telangana.gov.in/ (accessed August 2015). IEA (2015a), “World energy statistics”, IEA World Energy Statistics and Balances (database), DOI: http://dx.doi.org/10.1787/data-00510-en, (accessed [August 2015]). IEA (2015b), Medium-Term Gas Market Report 2015, OECD/IEA, Paris. IEA (2015c), Energy Policies beyond IEA Countries: Indonesia 2015, OECD/IEA, Paris. IEA (2015d), Enabling Renewable Energy and Energy Efficiency Technologies: Opportunities in Eastern Europe, Caucasus, Central Asia, Southern and Eastern Mediterranean, OECD/IEA, Paris. IEA (2014), World Energy Outlook 2014 – Electricity Access Database, OECD/IEA, Paris. IEA/International Renewable Energy Agency (IRENA) (2015a), “Scaling Up Renewable Energy Program for Armenia (SREP Armenia)”, Policies and Measures Database for Renewable Energy, IEA, Paris, www.iea.org/policiesandmeasures/pams/armenia/name-132515-en.php (accessed in June 2015). IEA/IRENA (2015b), “National Renewable Energy Action Plan (NREAP)”, Policies and Measures Database for Renewable Energy, IEA, Paris, www.iea.org/policiesandmeasures/pams/ukraine/name-131666-en.php (accessed in June 2015). IEA/IRENA (2015c), “Law on establishing the promotion system of energy production from renewable energy”, Policies and Measures Database for Renewable Energy, IEA, Paris, www.iea.org/policiesandmeasures/pams/romania/name-33751-en.php (accessed in July 2015). IEA/SGCC (State Grid Corporation of China) (2015), "Global Energy Interconnection - Smart Grids and Beyond", IEA-SGCC Dialogue on Global Energy Interconnection Workshop, Beijing. IEX (Indian Energy Exchange) (2015), www.iexindia.com (accessed June 2015). IRENA (2015), Renewable Energy Prospects: United Arab Emirates, IRENA/Masdar Institute, Abu Dhabi. Kohli, G. (2015), Why Net-Metering is Failing – Part 2 – The DISCOM’s Side of the Story, Bridge to India, Gurgaon, www.bridgetoindia.com/blog/why-net-metering-is-failing-part-2-the-discoms-side-of-the-story/. Kuang, M., A. Sethia, J. Wu and S. Allport (2015), H1 2015 Southeast Asia Market Outlook, Bloomberg New Energy Finance, London.

RENEWABLE ELECTRICITY: NON-OECD
124 MEDIUM-TERM RENEWABLE ENERGY MARKET REPORT 2015
MEMR (Ministry of Energy and Mineral Resources) (2014), National Strategic Plan for Dealing with NEPCO’s Losses, MEMR, Amman, www.memr.gov.jo/LinkClick.aspx?fileticket=PHxs463H8U0%3D&tabid=255. MME (Ministry of Energy and Mines) (2014), Plana Decenal de Expansao de Energia 2023 (10-year Energy Expansion Plan), Government of Brazil, Brasília. MoP (Ministry of Power of Ghana) (2015), Scaling Up Renewable Energy Program in Ghana (SREP) Investment Plan, Republic of Ghana, Washington, D.C. MP Power Management Co. (2015), 300 MW solar power in the state open price and financial tender today for availability, Jabalpur, www.mppmcl.com (accessed August 2015). NEA (National Energy Agency) (2015), National Energy Board Released the Total Electricity Consumption in 2014, NEA, Beijing, www.nea.gov.cn/2015-01/16/c_133923477.htm. Nelson, D., G. Shrimali, S. Goel, C. Konda and R. Kumar (2012), Meeting India’s Renewable Energy Targets: The Financing Challenge, Climate Policy Initiative, San Francisco. RCREEE (Regional Center for Renewable Energy and Energy Efficiency) (2015), Arab Future Energy Index, RCREEE, Cairo. RCREEE (2014), On the Horizon: Up-scaling Solar PV for Self-Consumption in the Jordanian Market, RCREEE, Cairo. Shaw, V. (2015), “China dispatch: Momentum building behind yieldcos”, pv-magazine, Solarpraxis AG, Berlin. Shrimali, G., S. Srinivasan, S. Goel, S. Trivedi and D. Nelson (2015), Reaching India’s Renewable Energy Targets Cost-Effectively, Climate Policy Initiative/Bharti Institute of Public Policy, New Delhi. Simiyu, S. (2013), Public-Private Partnership Promoting Renewable Energy in Kenya: Case Study of Geothermal Development, Geothermal Development Company (GDC), Nairobi. Solar GCC Alliance (2015), DEWA’s Rock-Bottom Solar Bids: The Real Story, Solar GCC Alliance, United Arab Emirates, www.solargcc.com/dewas-rock-bottom-solar-bids-the-real-story/. Stanway, D. (2015), “Dam waste: planning chaos drains China’s hydro ambitions”, Reuters, http://uk.reuters.com/article/2015/06/07/china-renewables-hydropower-idUKL3N0YB3UB20150607 Tsagas, I. (2015), “Jordan’s second PV tender leads to record tariffs”, pv-magazine, Solarpraxis AG, Berlin. UNPD (United Nations Population Division) (2015), World Urbanization Prospects: The 2014 Revision, United Nations, New York.
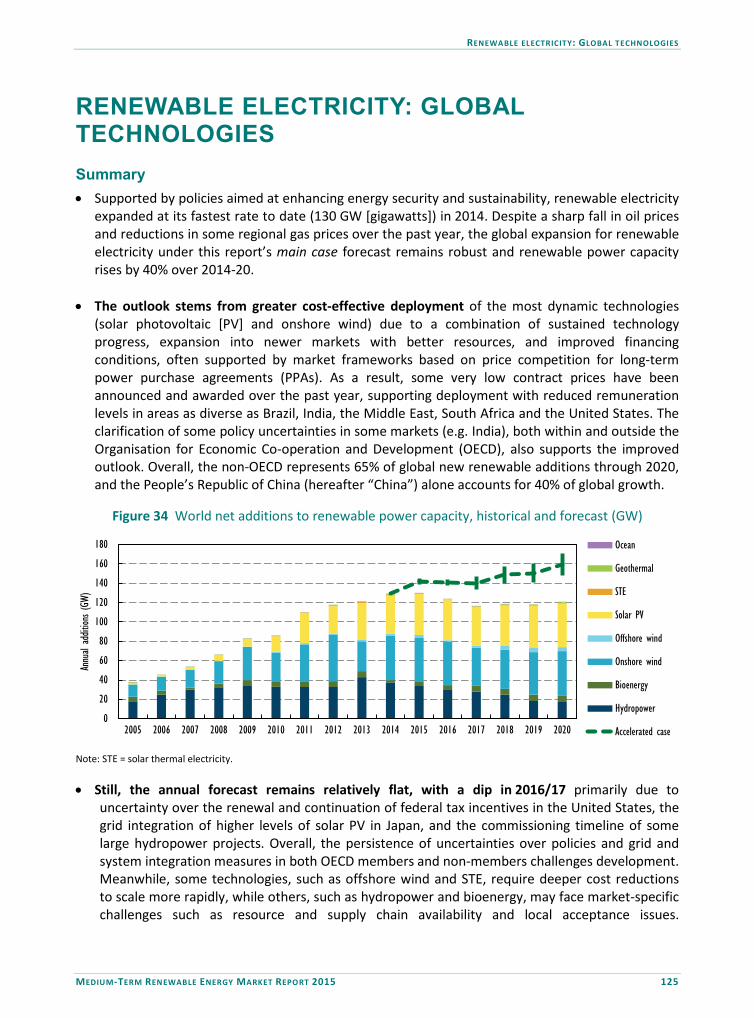
RENEWABLE ELECTRICITY: GLOBAL TECHNOLOGIES
MEDIUM-TERM RENEWABLE ENERGY MARKET REPORT 2015 125
RENEWABLE ELECTRICITY: GLOBAL TECHNOLOGIES Summary • Supported by policies aimed at enhancing energy security and sustainability, renewable electricity
expanded at its fastest rate to date (130 GW [gigawatts]) in 2014. Despite a sharp fall in oil prices and reductions in some regional gas prices over the past year, the global expansion for renewable electricity under this report’s main case forecast remains robust and renewable power capacity rises by 40% over 2014-20.
• The outlook stems from greater cost-effective deployment of the most dynamic technologies (solar photovoltaic [PV] and onshore wind) due to a combination of sustained technology progress, expansion into newer markets with better resources, and improved financing conditions, often supported by market frameworks based on price competition for long-term power purchase agreements (PPAs). As a result, some very low contract prices have been announced and awarded over the past year, supporting deployment with reduced remuneration levels in areas as diverse as Brazil, India, the Middle East, South Africa and the United States. The clarification of some policy uncertainties in some markets (e.g. India), both within and outside the Organisation for Economic Co-operation and Development (OECD), also supports the improved outlook. Overall, the non-OECD represents 65% of global new renewable additions through 2020, and the People’s Republic of China (hereafter “China”) alone accounts for 40% of global growth.
Figure 34 World net additions to renewable power capacity, historical and forecast (GW)
0
20
40
60
80
100
120
140
160
180
2005 2006 2007 2008 2009 2010 2011 2012 2013 2014 2015 2016 2017 2018 2019 2020
Annu
al ad
dition
s (GW
)
Ocean
Geothermal
STE
Solar PV
Offshore wind
Onshore wind
Bioenergy
Hydropower
Accelerated case
Note: STE = solar thermal electricity. • Still, the annual forecast remains relatively flat, with a dip in 2016/17 primarily due to
uncertainty over the renewal and continuation of federal tax incentives in the United States, the grid integration of higher levels of solar PV in Japan, and the commissioning timeline of some large hydropower projects. Overall, the persistence of uncertainties over policies and grid and system integration measures in both OECD members and non-members challenges development. Meanwhile, some technologies, such as offshore wind and STE, require deeper cost reductions to scale more rapidly, while others, such as hydropower and bioenergy, may face market-specific challenges such as resource and supply chain availability and local acceptance issues.
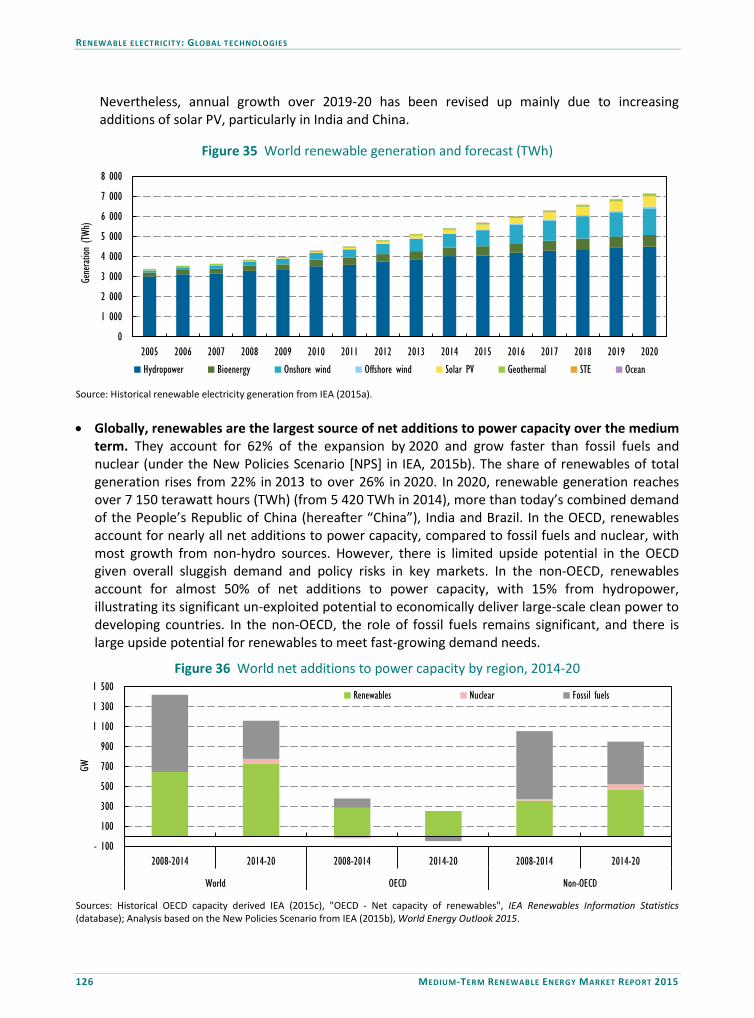
RENEWABLE ELECTRICITY: GLOBAL TECHNOLOGIES
126 MEDIUM-TERM RENEWABLE ENERGY MARKET REPORT 2015
Nevertheless, annual growth over 2019-20 has been revised up mainly due to increasing additions of solar PV, particularly in India and China.
Figure 35 World renewable generation and forecast (TWh)
0
1 000
2 000
3 000
4 000
5 000
6 000
7 000
8 000
2005 2006 2007 2008 2009 2010 2011 2012 2013 2014 2015 2016 2017 2018 2019 2020
Generat
ion (T
Wh)
Hydropower Bioenergy Onshore wind Offshore wind Solar PV Geothermal STE Ocean Source: Historical renewable electricity generation from IEA (2015a). • Globally, renewables are the largest source of net additions to power capacity over the medium
term. They account for 62% of the expansion by 2020 and grow faster than fossil fuels and nuclear (under the New Policies Scenario [NPS] in IEA, 2015b). The share of renewables of total generation rises from 22% in 2013 to over 26% in 2020. In 2020, renewable generation reaches over 7 150 terawatt hours (TWh) (from 5 420 TWh in 2014), more than today’s combined demand of the People’s Republic of China (hereafter “China”), India and Brazil. In the OECD, renewables account for nearly all net additions to power capacity, compared to fossil fuels and nuclear, with most growth from non-hydro sources. However, there is limited upside potential in the OECD given overall sluggish demand and policy risks in key markets. In the non-OECD, renewables account for almost 50% of net additions to power capacity, with 15% from hydropower, illustrating its significant un-exploited potential to economically deliver large-scale clean power to developing countries. In the non-OECD, the role of fossil fuels remains significant, and there is large upside potential for renewables to meet fast-growing demand needs.
Figure 36 World net additions to power capacity by region, 2014-20
- 100
100
300
500
700
900
1 100
1 300
1 500
2008-2014 2014-20 2008-2014 2014-20 2008-2014 2014-20
World OECD Non-OECD
GW
Renewables Nuclear Fossil fuels
Sources: Historical OECD capacity derived IEA (2015c), "OECD - Net capacity of renewables", IEA Renewables Information Statistics (database); Analysis based on the New Policies Scenario from IEA (2015b), World Energy Outlook 2015.

RENEWABLE ELECTRICITY: GLOBAL TECHNOLOGIES
MEDIUM-TERM RENEWABLE ENERGY MARKET REPORT 2015 127
• Over the medium term, onshore wind should lead global renewable capacity additions and generation, with a higher growth forecast versus MTRMR 2014. The forecast for onshore wind is more optimistic mostly due to China, where the technology is seen playing a larger role to meet 2020 decarbonisation aims and improved integration measures and reforms, and the OECD non-members in the Americas, where growth is driven by excellent resources and low costs spurred by competitive auctions over long-term contracts in Brazil and other markets. Solar PV is the second-largest source of capacity growth, with a raised forecast reflecting more optimistic growth prospects across a number of markets (e.g. China, Japan, India, the Middle East and the Americas) amid improving economics. Though hydropower remains a robust source of new renewable additions (and generation), the forecast has been reduced due to lower expectations in China, where new project approvals for conventional projects have slowed, and Brazil, where a recent severe drought has raised diversification concerns and the project pipeline has weakened.
Figure 37 World net additions to renewable capacity, absolute and percentage growth, 2014-20
16%
43%
70%
241%
129%
136% 34%
13%
39%
76%
229%
144%
80% 29% 0
50
100
150
200
250
300
Hydropower Bioenergy Onshore wind Offshore wind Solar PV STE/CSP Geothermal
Net a
dditio
ns (G
W)
MTRMR 2014MTRMR 2015
Figure 38 OECD and non-OECD incremental renewable capacity additions, accelerated versus main case
0 100 200 300 400 500 600 700
non-OECD
OECD
non-OECD
OECD
non-OECD
OECD
non-OECD
OECD
Total
Other
Solar
PV
Wind
Capacity growth 2014-20 (GW)
Main case
Accleratedcase
• Other technologies grow slower on an absolute basis, but still scale up significantly. Bioenergy is
supported by coal-to-biomass conversions in Europe and a scale-up in OECD non-members in Asia using domestic resources. Still, the outlook is lower due to feedstock supply chain challenges and local acceptance concerns from expanding waste-to-energy in China. Offshore wind should more
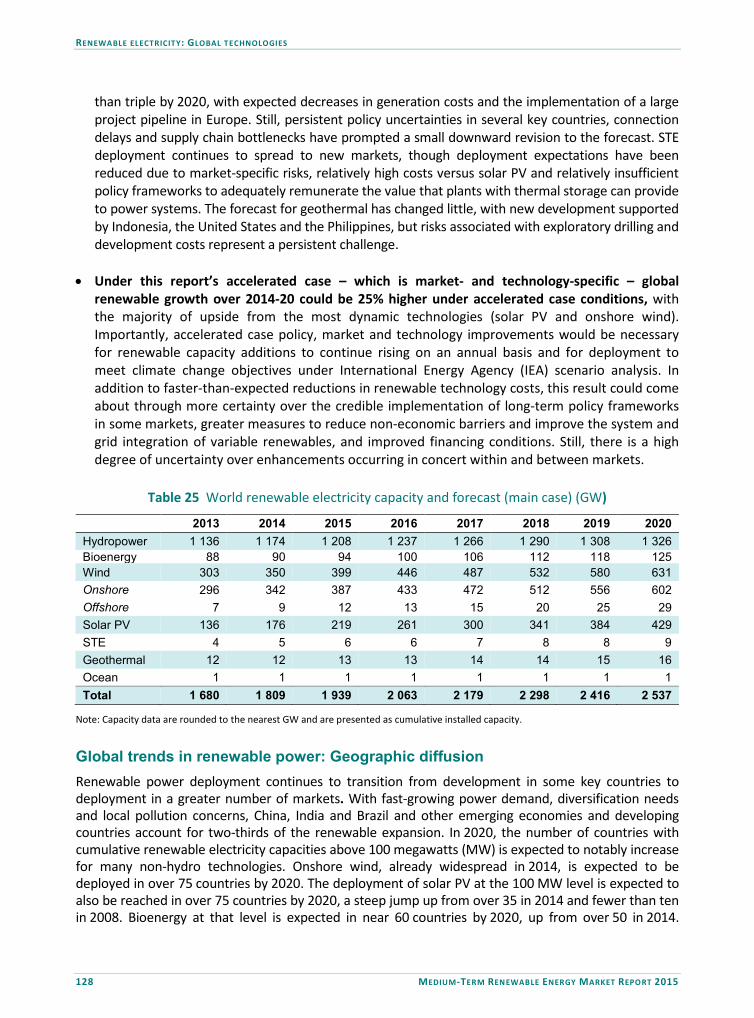
RENEWABLE ELECTRICITY: GLOBAL TECHNOLOGIES
128 MEDIUM-TERM RENEWABLE ENERGY MARKET REPORT 2015
than triple by 2020, with expected decreases in generation costs and the implementation of a large project pipeline in Europe. Still, persistent policy uncertainties in several key countries, connection delays and supply chain bottlenecks have prompted a small downward revision to the forecast. STE deployment continues to spread to new markets, though deployment expectations have been reduced due to market-specific risks, relatively high costs versus solar PV and relatively insufficient policy frameworks to adequately remunerate the value that plants with thermal storage can provide to power systems. The forecast for geothermal has changed little, with new development supported by Indonesia, the United States and the Philippines, but risks associated with exploratory drilling and development costs represent a persistent challenge.
• Under this report’s accelerated case – which is market- and technology-specific – global
renewable growth over 2014-20 could be 25% higher under accelerated case conditions, with the majority of upside from the most dynamic technologies (solar PV and onshore wind). Importantly, accelerated case policy, market and technology improvements would be necessary for renewable capacity additions to continue rising on an annual basis and for deployment to meet climate change objectives under International Energy Agency (IEA) scenario analysis. In addition to faster-than-expected reductions in renewable technology costs, this result could come about through more certainty over the credible implementation of long-term policy frameworks in some markets, greater measures to reduce non-economic barriers and improve the system and grid integration of variable renewables, and improved financing conditions. Still, there is a high degree of uncertainty over enhancements occurring in concert within and between markets.
Table 25 World renewable electricity capacity and forecast (main case) (GW)
2013 2014 2015 2016 2017 2018 2019 2020 Hydropower 1 136 1 174 1 208 1 237 1 266 1 290 1 308 1 326 Bioenergy 88 90 94 100 106 112 118 125 Wind 303 350 399 446 487 532 580 631 Onshore 296 342 387 433 472 512 556 602 Offshore 7 9 12 13 15 20 25 29 Solar PV 136 176 219 261 300 341 384 429 STE 4 5 6 6 7 8 8 9 Geothermal 12 12 13 13 14 14 15 16 Ocean 1 1 1 1 1 1 1 1 Total 1 680 1 809 1 939 2 063 2 179 2 298 2 416 2 537
Note: Capacity data are rounded to the nearest GW and are presented as cumulative installed capacity. Global trends in renewable power: Geographic diffusion Renewable power deployment continues to transition from development in some key countries to deployment in a greater number of markets. With fast-growing power demand, diversification needs and local pollution concerns, China, India and Brazil and other emerging economies and developing countries account for two-thirds of the renewable expansion. In 2020, the number of countries with cumulative renewable electricity capacities above 100 megawatts (MW) is expected to notably increase for many non-hydro technologies. Onshore wind, already widespread in 2014, is expected to be deployed in over 75 countries by 2020. The deployment of solar PV at the 100 MW level is expected to also be reached in over 75 countries by 2020, a steep jump up from over 35 in 2014 and fewer than ten in 2008. Bioenergy at that level is expected in near 60 countries by 2020, up from over 50 in 2014.
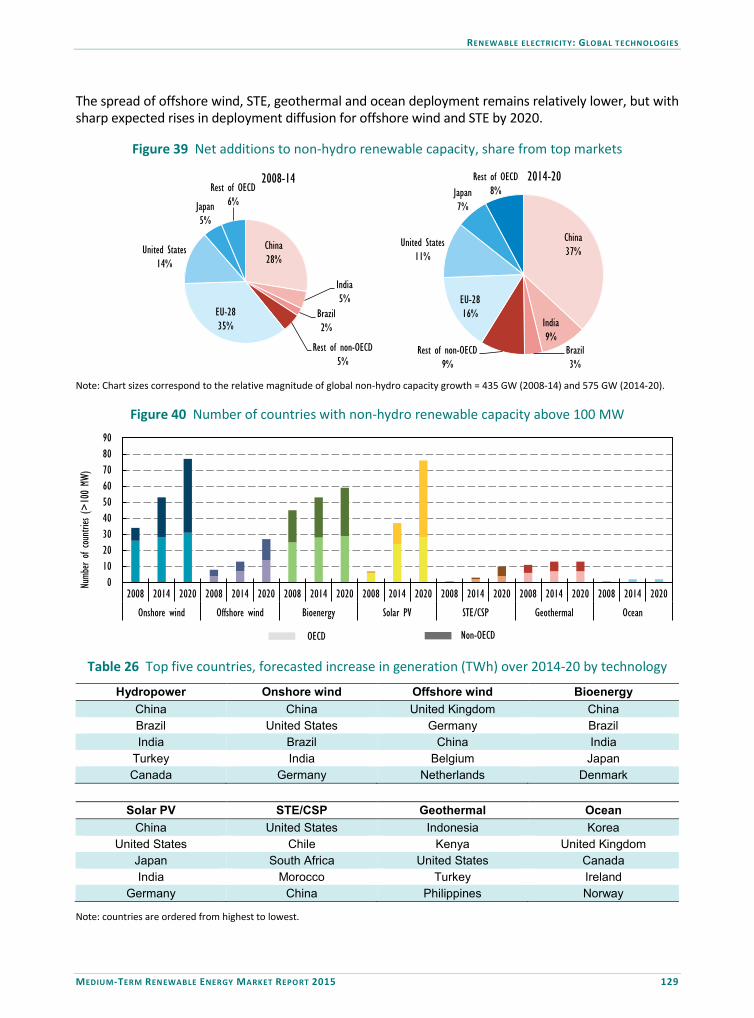
RENEWABLE ELECTRICITY: GLOBAL TECHNOLOGIES
MEDIUM-TERM RENEWABLE ENERGY MARKET REPORT 2015 129
The spread of offshore wind, STE, geothermal and ocean deployment remains relatively lower, but with sharp expected rises in deployment diffusion for offshore wind and STE by 2020.
Figure 39 Net additions to non-hydro renewable capacity, share from top markets
China37%
India9%
Brazil3%
Rest of non-OECD9%
EU-2816%
United States11%
Japan7%
Rest of OECD8%
2014-20
China28%
India5%
Brazil2%
Rest of non-OECD5%
EU-2835%
United States14%
Japan5%
Rest of OECD6%
2008-14
Note: Chart sizes correspond to the relative magnitude of global non-hydro capacity growth = 435 GW (2008-14) and 575 GW (2014-20).
Figure 40 Number of countries with non-hydro renewable capacity above 100 MW
0 10 20 30 40 50 60 70 80 90
2008 2014 2020 2008 2014 2020 2008 2014 2020 2008 2014 2020 2008 2014 2020 2008 2014 2020 2008 2014 2020
Onshore wind Offshore wind Bioenergy Solar PV STE/CSP Geothermal Ocean
Numb
er of
coun
tries
(>10
0 MW
)
OECD Non-OECD
Table 26 Top five countries, forecasted increase in generation (TWh) over 2014-20 by technology
Hydropower Onshore wind Offshore wind Bioenergy China China United Kingdom China Brazil United States Germany Brazil India Brazil China India
Turkey India Belgium Japan Canada Germany Netherlands Denmark
Solar PV STE/CSP Geothermal Ocean
China United States Indonesia Korea United States Chile Kenya United Kingdom
Japan South Africa United States Canada India Morocco Turkey Ireland
Germany China Philippines Norway
Note: countries are ordered from highest to lowest.
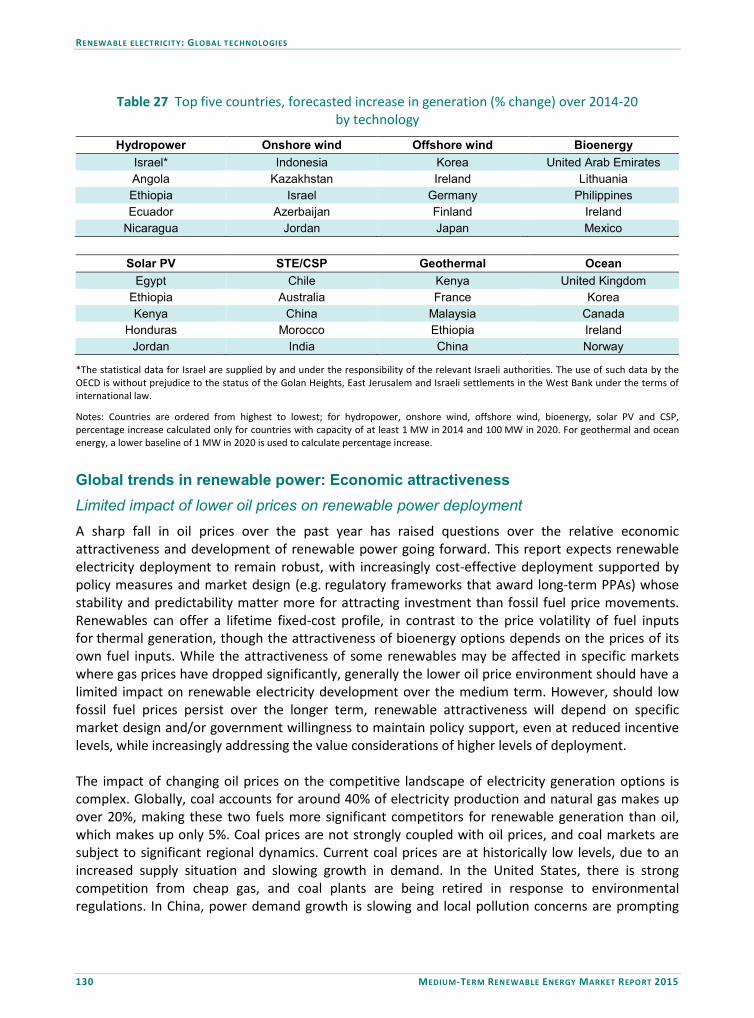
RENEWABLE ELECTRICITY: GLOBAL TECHNOLOGIES
130 MEDIUM-TERM RENEWABLE ENERGY MARKET REPORT 2015
Table 27 Top five countries, forecasted increase in generation (% change) over 2014-20 by technology
Hydropower Onshore wind Offshore wind Bioenergy Israel* Indonesia Korea United Arab Emirates Angola Kazakhstan Ireland Lithuania Ethiopia Israel Germany Philippines Ecuador Azerbaijan Finland Ireland
Nicaragua Jordan Japan Mexico
Solar PV STE/CSP Geothermal Ocean Egypt Chile Kenya United Kingdom
Ethiopia Australia France Korea Kenya China Malaysia Canada
Honduras Morocco Ethiopia Ireland Jordan India China Norway
*The statistical data for Israel are supplied by and under the responsibility of the relevant Israeli authorities. The use of such data by the OECD is without prejudice to the status of the Golan Heights, East Jerusalem and Israeli settlements in the West Bank under the terms of international law.
Notes: Countries are ordered from highest to lowest; for hydropower, onshore wind, offshore wind, bioenergy, solar PV and CSP, percentage increase calculated only for countries with capacity of at least 1 MW in 2014 and 100 MW in 2020. For geothermal and ocean energy, a lower baseline of 1 MW in 2020 is used to calculate percentage increase. Global trends in renewable power: Economic attractiveness Limited impact of lower oil prices on renewable power deployment A sharp fall in oil prices over the past year has raised questions over the relative economic attractiveness and development of renewable power going forward. This report expects renewable electricity deployment to remain robust, with increasingly cost-effective deployment supported by policy measures and market design (e.g. regulatory frameworks that award long-term PPAs) whose stability and predictability matter more for attracting investment than fossil fuel price movements. Renewables can offer a lifetime fixed-cost profile, in contrast to the price volatility of fuel inputs for thermal generation, though the attractiveness of bioenergy options depends on the prices of its own fuel inputs. While the attractiveness of some renewables may be affected in specific markets where gas prices have dropped significantly, generally the lower oil price environment should have a limited impact on renewable electricity development over the medium term. However, should low fossil fuel prices persist over the longer term, renewable attractiveness will depend on specific market design and/or government willingness to maintain policy support, even at reduced incentive levels, while increasingly addressing the value considerations of higher levels of deployment. The impact of changing oil prices on the competitive landscape of electricity generation options is complex. Globally, coal accounts for around 40% of electricity production and natural gas makes up over 20%, making these two fuels more significant competitors for renewable generation than oil, which makes up only 5%. Coal prices are not strongly coupled with oil prices, and coal markets are subject to significant regional dynamics. Current coal prices are at historically low levels, due to an increased supply situation and slowing growth in demand. In the United States, there is strong competition from cheap gas, and coal plants are being retired in response to environmental regulations. In China, power demand growth is slowing and local pollution concerns are prompting

RENEWABLE ELECTRICITY: GLOBAL TECHNOLOGIES
MEDIUM-TERM RENEWABLE ENERGY MARKET REPORT 2015 131
a strategic shift of the power sector towards cleaner energy sources. Falling oil prices can indeed improve the economic attractiveness of oil-fired peaking plants and of gas generation in areas where gas prices may be indexed to oil, such as in continental Europe and in Asian liquefied natural gas markets. To the extent that renewables compete with these forms of generation, falling oil and gas fuel prices may have some effect on the attractiveness of renewables. Indeed, international gas prices have fallen significantly over the past year. However, a number of other factors, including regional supply-and-demand trends, determine these prices, which may only be partly affected by the oil price fall (see IEA, 2015d for a fuller discussion).
Figure 41 Historical and forecast global weighted average LCOEs for new projects, beginning year
0
50
100
150
200
250
300
350
400
2010 2015 2020
USD
2014
/MWh
LCOE
Onshore wind Offshore wind Solar PV - utility scale
0
20
40
60
80
100
120
140
160
2010 2011 2012 2013 2014 2015 2016 2017 2018 2019 2020
2010
= 1
00
Indexed change of LCOE
Notes: MWh = megawatt hour. The values are indicative estimates of the global weighted average LCOE based on the MTRMR deployment forecast and may not represent specific developments in a given market. All the while, renewable costs, especially solar PV and wind, have fallen dramatically in recent years. The cost-effectiveness of renewable options has improved due to a combination of sustained technology progress, expansion into newer markets with better resources, and better financing conditions, often supported by market frameworks based on price competition for long-term PPAs. As a result, the estimated global weighted average levelised cost of electricity (LCOE), without incentives, for some renewable sources has shown strong reductions over time, with further decreases forecast based on this report’s deployment forecast over the medium term.1 While this picture provides only a simplistic view of renewable costs, which can vary significantly by market, it does give a broad indication of their fast-changing nature over time. Recent announcements of long-term remuneration contract prices – from PPAs awarded through competitive bidding or feed-in tariffs (FiTs), for example – suggest that much lower costs can be achieved for projects commissioned in the next few years in countries with better resources and appropriate regulatory frameworks. While this picture provides only a snapshot, the award of some very low contract prices for wind and solar PV is expected to support deployment over the medium term with reduced incentive levels in areas as diverse as Brazil, India, the Middle East and South Africa. Some caution should be used in comparing tendered PPAs (which can include different
1 LCOE provides only a partial indication of economic attractiveness, and investment decisions are usually based on additional financial information. In practice, real-world investors consider the net present value of a project, among other financial ratios, to assess whether its expected cash flows satisfy their risk-adjusted return expectations. For further discussion, see IEA (2015b), World Energy Outlook 2015.

RENEWABLE ELECTRICITY: GLOBAL TECHNOLOGIES
132 MEDIUM-TERM RENEWABLE ENERGY MARKET REPORT 2015
escalation, financing and capacity factors, for example) to modelled LCOEs and the design of specific auction mechanisms (e.g. number of technologies competing) can have an important impact on the result. Moreover, delivered project costs may ultimately be different than those reported at the time of the auction or the signature of the PPA. Still, these data points signal a step change in some renewable generation costs where deployment is starting to ramp up quickly. Auction results and deployment plans suggest that new onshore wind projects can be built today in a number of countries at USD 60-80/MWh. For utility-scale solar PV, auction results and deployment plans suggests new PV projects can be contracted at USD 80-100/MWh with the best cases at USD 60/MWh.
Map 1 Recent announced long-term remuneration contract prices for renewable power (e.g. preferred bidders, PPAs or FiTs) to be commissioned over 2015-19
Notes: Values reported in nominal USD; PPAs = power purchase agreements. US values are implied excluding tax credits; US wind value corresponds to Interior Region for commissioned projects in 2014. Other values reported correspond to projects that are expected to be commissioned over 2015-19. Delivered project costs may ultimately be different than those reported at the time of the auction or the signature of the PPA. For full sourcing explanation, see “Renewable Technologies: Global Technologies” chapter.
Sources: IEA analysis based on: EPE (2014), 6º Leilão de Energia de Reserva tem deságio de 9,94%, EPE, São Paulo; REIPPPP (2015), BW4 Preferred Bidder Announcement, Cape Town; ACT GOV (Australian Capital Territory) (2015), Wind auction result delivers renewable energy and economic benefits to the ACT, Media Release, Canberra; ETESA (2015), Resolution No GD-01-2015, ETESA, El Dorado; Tsagas, I. (2015), Jordan’s second PV tender leads to record low tariffs, PV Magazine, Berlin; Bundesnetzagentur (2015), Zuschlagswert der zweiten Ausschreibungsrunde für Freiflächenanlagen, Press Release Bundesnetzagentur, Berlin; DOE (2015), 2014 Wind Technologies Market Report, US DOE, Washington D.C.; NDRC (National Development and Reform Commission) (2015), Notice No 3008 on onshore wind fixed tariff adjustment, NDRC, Beijing; Roscoe, A. and Wilkinson, P. (2015), GDF Suez submits lowest bid for Egypt wind farm, Middle East Business Intelligence, Abu Dhabi; HydroQuebec (2014), “Hydro-Québec Distribution accepts 3 bids totaling 446.4 MW”, HydroQuevec, Montreal; Agrawal, B. (2015), India’s Latest Solar PV Auction Prices Trends. While the attractiveness of renewables versus fossil fuel generation sources can depend on local market circumstances, and more robust competitiveness assessments would take into account larger value considerations, as described below, such benchmark cost ranges for onshore wind and solar PV

RENEWABLE ELECTRICITY: GLOBAL TECHNOLOGIES
MEDIUM-TERM RENEWABLE ENERGY MARKET REPORT 2015 133
are increasingly comparable with generation costs from gas on a levelised basis, even in the current regime of lower oil and gas prices. Still, achieving comparability with gas generation costs in low-price markets such as the United States would require the LCOE of new onshore wind projects below USD 50/MWh, a price presently observed in only a few markets with the best resources.
Figure 42 LCOE of gas-fired generation at March 2015 gas prices versus onshore wind benchmark costs
0
20
40
60
80
100
120
140
CCGT new generation cost CCGT existing generation cost OCGT existing generation cost
USD/
MWh
Benchmark new onshorewind in dynamic markets
USA: USD 2.9/MBtu
Europe (spot): USD7.2/MBtu
Asian LNG (contract): USD11.9/MBtu
Asian LNG (spot): USD7.3/MBtu
Notes: MBtu = million British thermal units; OCGT = open cycle gas turbine. LCOE assumes CCGT load factor of 65%, efficiency of 60%; OCGT load factor of 15%, efficiency of 40%; 7% discount rate; no carbon price is assumed; capital cost and operations, and maintenance assumptions based on IEA (2015e), Projected Costs of Generating Electricity 2015. It is important to note that the cost profile of gas generation can vary significantly over time, with fossil fuel price volatility. Over the past five years, gas prices in regions outside the United States have generally remained high compared to the range at which a new combined-cycle gasification turbine (CCGT) today would have an LCOE comparable to the USD 60-80/MWh wind benchmark above. And gas prices have exhibited significant historical volatility, in contrast to the relatively stable variable costs possible over the lifetime of a wind project. The implication is that even with current low oil and gas prices, renewable generation can be economically attractive versus fossil fuel options, in particular when recognising their potential hedge value against fuel price changes, which is not quantified here. In the presence of carbon pricing (also not accounted for here) uncertainty associated with future gas generation costs would be higher. These comparisons do not fully take into account the value of electricity generated by different sources, the market design under which different technologies compete or the recovery of fixed network costs. Fuller competitiveness assessments would need to quantify the value of electricity to the system, according to the load profile of demand and the time and location of generation, which can vary with the penetration of low marginal cost renewable sources in the power system. The system flexibility needs from higher shares of variable renewable generation as well as the potential hedge value of renewables against fuel price volatility, and the negative environmental externalities associated with fossil fuel generation would also need to be accounted for. Moreover, the market conditions in which renewables operate can have a significant impact on their bankability and value. For example, in markets with good resources, good financing conditions and rising demand, some renewables are able to compete under market design of wholesale pricing

RENEWABLE ELECTRICITY: GLOBAL TECHNOLOGIES
134 MEDIUM-TERM RENEWABLE ENERGY MARKET REPORT 2015
(e.g. Chile, Turkey). For other markets, renewables may find it difficult to recoup their costs with wholesale prices, even as their generation costs decline. In such areas, renewables would be remunerated at marginal prices according to the prevailing, short-term demand-and-supply balance, and the presence of an increasing share of low-marginal-cost renewables in the power mix can put downward pressure on wholesale prices. This is particularly present in European markets with power sector overcapacity. This competitiveness picture differs from market to market, with underlying demand patterns, the nature of the existing generation mix, and the presence of interconnections and storage playing a role in determining the value that renewables bring to the power system.
Figure 43 Historical gas prices by region versus price range for LCOE of new CCGT at USD 60-80/MWh
02468
101214161820
Jan-05
May-0
5
Sep-05
Jan-06
May-0
6
Sep-06
Jan-07
May-0
7
Sep-07
Jan-08
May-0
8
Sep-08
Jan-09
May-0
9
Sep-09
Jan-10
May-1
0
Sep-10
Jan-11
May-1
1
Sep-11
Jan-12
May-1
2
Sep-12
Jan-13
May-1
3
Sep-13
Jan-14
May-1
4
Sep-14
Jan-15
USD/
MBtu
US Henry Hub Europe - UK NBP Asian LNG price (average contracted import price) Asian LNG (spot)
Gas prices atwhich new CCGT today has LCOE at USD 60-80/MWh
Note: LCOE assumes CCGT load factor of 65%, efficiency of 60%; 7% discount rate; no carbon price is assumed; capital cost and operations and maintenance assumptions based on IEA (2015e), Projected Costs of Generating Electricity 2015.
Particular considerations are necessary when evaluating distributed and off-grid options. Falling residential and commercial-scale solar PV costs are supporting the emergence of competitive market segments linked to the concept of grid or “socket” parity – when the LCOE of solar PV systems is lower than the variable portion of retail electricity prices that system owners would otherwise pay. Still, increasingly strong growth raises debates over the system integration of distributed generation, especially in the United States and Europe. As more rate-payers generate their own electricity from solar PV, they reduce demand for grid electricity, contributing less to the remuneration of overall grid costs where these are charged per unit of energy consumed. This situation has raised several issues concerning fair rules and appropriate electricity rate design for allocating the costs (e.g. recovery of fixed grid costs) and benefits from distributed PV. Off-grid PV installations are often competitive in locations where they compete with diesel generators, especially in Africa and India. However, the cost and availability of financing remain a major challenge in such remote areas, even as innovative financing methods, such as “pay as you go” business models, are emerging to facilitate investment.
Overall, policy remains vital to the attractiveness of renewables, particularly given the still-wide cost ranges that exist between markets in some technologies. Even in situations of good economic attractiveness versus fossil fuel options, policy, market and technology risks can undermine renewable project viability. Policy uncertainty remains a key challenge to renewable deployment. Unanticipated
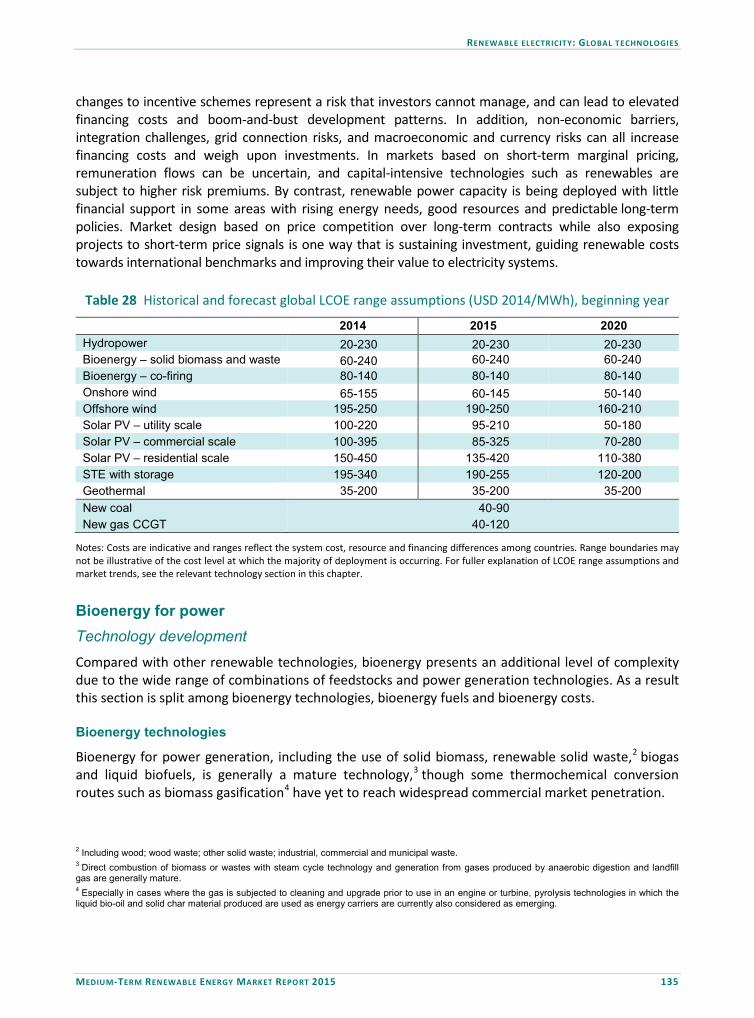
RENEWABLE ELECTRICITY: GLOBAL TECHNOLOGIES
MEDIUM-TERM RENEWABLE ENERGY MARKET REPORT 2015 135
changes to incentive schemes represent a risk that investors cannot manage, and can lead to elevated financing costs and boom-and-bust development patterns. In addition, non-economic barriers, integration challenges, grid connection risks, and macroeconomic and currency risks can all increase financing costs and weigh upon investments. In markets based on short-term marginal pricing, remuneration flows can be uncertain, and capital-intensive technologies such as renewables are subject to higher risk premiums. By contrast, renewable power capacity is being deployed with little financial support in some areas with rising energy needs, good resources and predictable long-term policies. Market design based on price competition over long-term contracts while also exposing projects to short-term price signals is one way that is sustaining investment, guiding renewable costs towards international benchmarks and improving their value to electricity systems.
Table 28 Historical and forecast global LCOE range assumptions (USD 2014/MWh), beginning year
2014 2015 2020 Hydropower 20-230 20-230 20-230 Bioenergy – solid biomass and waste 60-240 60-240 60-240 Bioenergy – co-firing 80-140 80-140 80-140 Onshore wind 65-155 60-145 50-140 Offshore wind 195-250 190-250 160-210 Solar PV – utility scale 100-220 95-210 50-180 Solar PV – commercial scale 100-395 85-325 70-280 Solar PV – residential scale 150-450 135-420 110-380 STE with storage 195-340 190-255 120-200 Geothermal 35-200 35-200 35-200 New coal 40-90 New gas CCGT 40-120
Notes: Costs are indicative and ranges reflect the system cost, resource and financing differences among countries. Range boundaries may not be illustrative of the cost level at which the majority of deployment is occurring. For fuller explanation of LCOE range assumptions and market trends, see the relevant technology section in this chapter. Bioenergy for power Technology development
Compared with other renewable technologies, bioenergy presents an additional level of complexity due to the wide range of combinations of feedstocks and power generation technologies. As a result this section is split among bioenergy technologies, bioenergy fuels and bioenergy costs. Bioenergy technologies
Bioenergy for power generation, including the use of solid biomass, renewable solid waste,2 biogas and liquid biofuels, is generally a mature technology,3 though some thermochemical conversion routes such as biomass gasification4 have yet to reach widespread commercial market penetration.
2 Including wood; wood waste; other solid waste; industrial, commercial and municipal waste. 3 Direct combustion of biomass or wastes with steam cycle technology and generation from gases produced by anaerobic digestion and landfill gas are generally mature. 4 Especially in cases where the gas is subjected to cleaning and upgrade prior to use in an engine or turbine, pyrolysis technologies in which the liquid bio-oil and solid char material produced are used as energy carriers are currently also considered as emerging.

RENEWABLE ELECTRICITY: GLOBAL TECHNOLOGIES
136 MEDIUM-TERM RENEWABLE ENERGY MARKET REPORT 2015
Solid biomass plants will typically be operated as mid-merit or base load. The latter is particularly relevant for co-generation5 where operation of the plant is often determined by heat demand. This may lead to seasonal operation patterns for plants linked to district heating schemes that serve only residential demand. Due to the dispatchable nature of bioenergy generation, capacity factors of 60-90% can be achieved depending on the loads served and technology type employed. The capacity of most forestry or agricultural waste and residue fuelled dedicated bioenergy projects is limited by the availability of biomass in relative proximity to the power plant and as such they are small to medium size, e.g. 10 MW to 50 MW. The optimal capacity for these plants is often determined by balancing economies of scale with fuel availability within a harvestable radius, in order to avoid high fuel costs caused by large road transport distances. Many plants are operated in co-generation mode to provide heat to district heating networks and therefore raising overall generation efficiency and increasing economic viability. Biomass co-generation plants are also common in industries such as sugar or pulp and paper, where biomass process residues are produced on-site and available free of charge. Heat from the co-generation plant is then used to serve production process loads. Plants fuelled by solid wastes, such as municipal solid waste (MSW), can have larger capacities in excess of 100 MW; conversely, anaerobic digestion (AD) plants using high moisture content feedstocks with capacities under 1 MW are also common. In recent years a number of energy companies have invested in large-scale biomass power generation, both in the form of co-firing, where a varying share of biomass is combusted alongside coal in the power station, and where individual units of or whole coal-fired power stations have been converted to use only biomass fuels. In the latter case the biomass fuels used are often imported, allowing for higher attainable rated capacities and levels of generation to be achieved. Co-firing offers a transition towards bioenergy-only generation, particularly in markets moving away from coal-fired electricity supply. At low co-firing levels (e.g. less than 10% of the total energy content of the fuels used), a wide range of biomass feedstocks can be mixed with coal on the conveyor to the existing coal mills. This approach can be undertaken with low levels of capital investment and be implemented relatively quickly. To combust a higher percentage of biomass, higher levels of capital investment are required to undertake technical alternations to the power station, such as installing dedicated biomass mills to provide milled biomass fuel directly into the pulverised coal pipework. Other alterations for co-firing at higher levels may include installing more flexible boilers designed to accommodate biomass use, such as circulating fluidised bed technologies that allow for operational switching among varying coal and biomass fuelling regimes. When co-firing at higher volumes, or undertaking a partial or full conversion of coal power stations to biomass, investment is also required in biomass fuel storage and handling infrastructure. In addition, the selection of biomass fuels is also of greater importance in order to limit issues associated with ash deposition on boiler surfaces and corrosion, e.g. due to chlorine within the fuel, which can impact plant operation. For further information on key recent developments and future prospects for coal to biomass conversion projects, refer to Box 3.
5 Co-generation refers to the combined production of heat and power.

RENEWABLE ELECTRICITY: GLOBAL TECHNOLOGIES
MEDIUM-TERM RENEWABLE ENERGY MARKET REPORT 2015 137
A further technology application is biorefinery approaches focused on the sustainable processing of biomass feedstocks into a range of biomass-based products (e.g. chemicals and materials) alongside heat, power or biofuel production (or a combination of these). Such biorefinery plants can be energy driven, where the plant principally produces biofuels, power or heat, with the residues from this process utilised to produce products. Alternatively, biorefinery plants can be developed with the principal aim of producing biomass-based products, with the process residues used for bioenergy and/or biofuels to serve plant loads, export or both. In either approach the integrated use of the process residues produced maximises the economic performance of the plant (IEA Bioenergy, 2015). Bioenergy fuels
Examples of biomass fuels include wastes and residues from agriculture (e.g. sugar cane bagasse, corn stover,6 straw) and forestry (materials not suitable for sawn timber) as well as a variety of energy crops specifically grown for fuel production (e.g. miscanthus, willow). The feedstocks above can also be pelletised in order to increase homogeneity and energy density. This aids the operation of bioenergy technologies and reduces fuel transportation costs. Pellets can be produced in line with recognised standards such as ENplus to ensure fuel quality. Higher moisture content wastes from agricultural and municipal sources can be utilised within AD technologies to produce methane-rich biogas, which can subsequently be utilised for the production of bioenergy, either directly or via upgrading7 to biomethane before being injected into natural gas distribution networks. The biomass fraction of solid wastes from commercial, industrial and municipal sources can also be used in a variety of different technologies for the production of bioenergy. Such fuels are normally pre-processed, e.g. into refuse-derived fuel or solid recovered fuel, which ensures a higher energy content and more homogeneous composition suitable for bioenergy generation. Waste feedstocks are often available at no cost or, where gate fees8 are charged, can provide a source of revenue. However, this needs to be balanced by higher investment costs associated with fuel preparation and emissions control requirements (IRENA, 2015a). Since fuel transportation is a key element of overall biomass fuel procurement costs, small-scale power plants are typically supplied by biomass fuels available either on-site, locally or sourced within relative proximity (up to 100 kilometres [km]) to the plant. With annual biomass demand in the order of millions of tonnes, large-scale plants rely on wood pellets or woodchips that are often sourced internationally and delivered to the plant via sea freight and/or train. This is especially the case for coal-to-biomass conversions or power stations co-firing biomass at high percentages. Wood pellet supplies are usually secured through long-term supply contracts. Further information relating to developments in the international trade of biomass fuels is provided later in this section. Bioenergy costs
The investment costs of bioenergy power generation depend on the technology type, its capacity, and the cost of biomass feedstocks and fuels used. Investment costs also vary according to the country or region where the plant is located, e.g. due to the compliance costs of regulatory regimes
6 Corn stover is the leaves, stalks and plants left in the field and residues such as leaf, husk and cob post-harvest of corn/maize. Bagasse is the remaining matter from sugar cane post-crushing. 7 To remove impurities and increase energy content in line with the specifications of the gas distribution network to which it is being supplied. 8 Charges for the receipt of a quantity of waste for processing.

RENEWABLE ELECTRICITY: GLOBAL TECHNOLOGIES
138 MEDIUM-TERM RENEWABLE ENERGY MARKET REPORT 2015
or presence of financial support for bioenergy. For co-generation plants, the pattern of heat demand is also a consideration. As a result of the various combinations of these factors there is a wide range of potential investment and LCOE values that can be attributed to bioenergy power generation. Many bioenergy technologies are generally considered as mature and offer reduced scope in terms of investment cost reductions and efficiency increases when compared with other renewable technologies. Technology costs also vary by region, where different levels of technological maturity and sophistication are also a factor. This has been evident with higher bioenergy technology costs for more sophisticated systems in OECD compared to non-OECD countries (IRENA, 2015a). However, higher investment costs for more sophisticated technologies are often offset by improved availability and generation efficiency, in addition to reduced operations and maintenance (O&M) costs. Combustion technology costs can also be reduced through economies of scale. A general range for the investment costs for biomass plants with capacity above 50 MW is between USD 2 400 per kilowatt (kW) and USD 4 500/kW. In Asian and South American countries the capital costs for biomass combustion technologies, typically steam cycle boilers, can be in the region of USD 2 000/kW or below; this is especially the case in China, where many projects are deliverable in the region of USD 1 000/kW (IRENA, 2015). The capital costs of co-firing are much lower at USD 300/kW to USD 700/kW, depending on configuration. Emerging advanced technologies such as gasification and pyrolysis require higher levels of investment per kilowatt of installed capacity. Co-generation also has higher investment costs, though significantly higher efficiencies attainable can lead to a more attractive overall economic case for these plants. This is especially the case in markets with lower and more volatile electricity prices, where the heat produced can represent the most significant income stream for the plant. The investment costs for coal-to-biomass conversion projects are highly bespoke, with plant location and the existing infrastructure and plant in place key determining factors. Information provided by industry for two recent conversion projects indicated conversion costs in the region of USD 350/kW, indicating considerably lower relative investment compared with new-build dedicated biomass plants.
Table 29 Reference LCOE value for bioenergy technologies
Bioenergy technology Reference LCOE (USD/MWh) Comment
Dedicated biomass electricity 110-240 Variation principally due to capacity and feedstock costs.
Co-firing of woodchips or pellets 80-140 Generally comparable with coal-fired
generation. Waste and residue electricity 60-90 Low/no/negative cost fuel availability. Landfill gas 45-95 No associated fuel costs. Emerging technologies, e.g. gasification 90-220 Costs span over a wide range depending
on location and sophistication of plant.
Anaerobic digestion 160-240 Costs indicative for OECD Europe, lower LCOE values achievable in other regions.
Sources: IEA (2012a), Technology Roadmap: Bioenergy for Heat and Power, World Energy Council and BNEF (2013), World Energy Perspective – Cost of Energy Technologies; IRENA (2015a), Renewable Power Generation Costs in 2014. The economics of biomass power generation are more similar to those of fossil fuel generation than other renewable technologies due to the requirement for a fuel input, with feedstock costs accounting for 20-50% of the final cost of biomass electricity production (IRENA, 2015). LCOE values for large-scale

RENEWABLE ELECTRICITY: GLOBAL TECHNOLOGIES
MEDIUM-TERM RENEWABLE ENERGY MARKET REPORT 2015 139
dedicated biomass plants utilising competitively priced fuels can be comparable with coal- and natural gas-fuelled electricity generation with high carbon prices.
Figure 44 Recent announced PPAs (Brazil) and CFDs (the United Kingdom) by project delivery year
0
50
100
150
200
250
2018 2019
USD
2014
/MWh
Commissioning year
Brazil PPA (bagasse) UK PPA (waste co-generation) UK PPA (gasification) UK PPA (biomass co-generation) Note: Delivered project costs may be different than those reported at the time of the auction or the signature of the PPA.
Sources: Data from EPE (2013), Contratados 1.265 MW No Primeiro Leilao de Energia Eléctrica para o Ano 2018; EPE (2014), 20º Leilão de Energia Nova A-5 Resumo Vendedor; Low Carbon Contracts Company (2015), CFD Register. Significant regional differences in bioenergy generation LCOE estimates exist. In China and India, for example, lower investment and O&M costs for bioenergy technologies, aligned with the use of waste and residue fuels, can result in competitive LCOE values. Specific examples include the use of waste feedstocks for biogas generation in China and sugar cane bagasse incineration in India. Higher LCOE values are observed in Europe and North America, attributable to a combination of more sophisticated technologies, the cost of ensuring regulatory compliance (e.g. to more stringent emissions standards) and also higher fuel costs. Amsterdam, Rotterdam and Antwerp (ARA) spot prices observed in 2014 for industrial wood pellets of USD 180/tonne equate to approximately USD 120/MWh with a plant generation efficiency of 31%. In recent renewable energy auctions held in August 2013 and November 2014, Brazil awarded PPAs for bagasse-fuelled bioenergy projects at USD 57/MWh (2013) and USD 79/MWh (2014). The range of generation costs attributable to different technology types was demonstrated at the first United Kingdom Contract for Difference (CFD) auction held in February 2015, where contracts awarded to bioenergy projects ranged from USD 129/MWh to USD 202/MWh. Market status and outlook – main case In 2014, global biomass power generation was estimated at 427.5 TWh, an almost 6% year-on-year increase from 2013. By 2020, bioenergy generation is forecast to reach 588.5 TWh. This is a slight downward revision from the MTRMR 2014 figure of 615 TWh, principally due to slower anticipated growth than previously forecast for China. The United States continues to be the largest generator of electricity from biomass (69 TWh in 2014), followed by Germany (49 TWh) and China, the fastest growing biomass electricity market, with just under 42 TWh. Total OECD bioenergy generation in 2014 is estimated at 283 TWh, with growth to 340 TWh by 2020.

RENEWABLE ELECTRICITY: GLOBAL TECHNOLOGIES
140 MEDIUM-TERM RENEWABLE ENERGY MARKET REPORT 2015
Growth in biomass electricity generation in the United States is anticipated to be relatively slow over the medium term with estimated year-on-year increases under 2%. However, several large 50-150 megawatt electrical (MWe) co-generation projects using waste-derived fuels or agricultural/forestry residues are anticipated to commission during 2015 and 2016. Concrete medium-term projects to convert existing coal power stations to use biomass as a fuel are absent due to the lack of clear policy drivers to support these, such as those present in OECD Europe or Ontario, Canada.
Figure 45 Bioenergy power generation forecast by region
0
100
200
300
400
500
600
700
2006 2007 2008 2009 2010 2011 2012 2013 2014 2015 2016 2017 2018 2019 2020
TWh
OECD Americas OECD Asia Oceania OECD Europe Africa Asia China Non-OECD Europe Non-OECD Americas Middle East MTRMR2014
Note: Includes generation from renewable MSW.
Source: Historical renewable electricity generation from IEA (2015a), “World energy statistics”, IEA World Energy Statistics and Balances (database). In 2014, the US Environmental Protection Agency (EPA) proposed legislation for existing and new power plants with the aim of reducing carbon dioxide emissions from these (from 2005 levels) by 2030. While these may stimulate demand for bioenergy over the longer term, the proposed timescale of approval of state-level carbon reduction plans by mid-2018 means the legislation is likely to provide only limited impetus to the biomass industry in the medium term. Over half of total OECD bioenergy generation is attributable to OECD Europe, where almost 162 TWh was generated in 2014. This represented year-on-year growth of 2%, a lower rate to that from 2012 to 2013. The use of biomass to meet national renewable energy targets established under the European Union (EU) Renewable Energy Directive 2020 target for final energy consumption from renewable sources will continue to underpin growth in the region. It is forecasted that this will facilitate an increase in bioenergy generation to 199 TWh in 2020. In Germany, where biogas systems account for the majority of installed bioenergy capacity, growth has slowed from the peak levels observed during the 2009-11 period. While more than 600 MW of new biogas capacity was installed in 2011, this dropped to less than 50 MW in 2014 (Thrän et al, 2015). This reduction largely stemmed from downward FiT adjustments, including the removal of some project-specific bonus tariffs and the restriction of new capacity eligible for support to 100 MW per year until 2017, with support then phased out entirely for new plants above 100 kW. As such, Germany’s annual bioenergy generation should increase slowly at around 1% per year over 2014-20, compared to 10%-plus annual increases over 2008-13, reaching around 52 TWh by 2020.
RENEWABLE ELECTRICITY: GLOBAL TECHNOLOGIES
MEDIUM-TERM RENEWABLE ENERGY MARKET REPORT 2015 141
The revisions to the FiT support scheme shift emphasis away from using crop-based feedstocks for biogas plants. Since 2012, animal wastes, municipal bio-waste from separated collection, and green waste from gardens and parks have been more prominent feedstocks for new biogas plants in Germany. From 2015 onwards, separate collection of bio-waste imposed under the Waste Framework Directive should increase suitable feedstock availability and may consequently stimulate new biogas capacity in Germany over that forecast in the MTRMR 2015. Reform of the support mechanisms for renewable energy source installations in Poland has altered the prospects for biomass co-firing since the MTRMR 2014. Under the existing green certificate scheme, support for biomass will reduce from 1 to 0.5 certificates per megawatt hour until the end of 2020, while restrictions have been introduced on the annual volume of electricity on which green certificates for co-firing can be awarded. Under the new auction-based feed-in premium scheme due for introduction in 2016, biomass co-firing installations will not be eligible, and there is a 50 MW capacity limit on biomass-fuelled electricity, increasing to 150 MW where high-efficiency co-generation is utilised. It should be noted that the legislation for the Polish green certificate and feed-in premium schemes differentiate between co-firing and dedicated biomass co-firing installations. The proposed changes above for co-firing do not relate to installations classified as dedicated biomass co-firing installations (International Law Office, 2015). In other OECD regions, bioenergy generation in Korea is expected to continue to grow as a result of renewable portfolio standards (RPS) for utilities, and should also increase in Japan because of technology-specific biomass FiT support. In Korea, the RPS does not stipulate prescribed levels for the different eligible technologies that must be used by utilities to meet the obligations. Uptake of biomass co-firing has increased based on the combination of significant coal-fired generation capacity in the country, coupled with growing international trade of biomass fuels. This has proved a cost-effective solution, allowing utilities to quickly respond to their RPS obligations, compared with new-build investment in other renewable technologies. In 2014, higher growth was observed for non-OECD countries with overall generation from biomass increasing by over 17.5 TWh from 2013 levels (almost 14% year-on-year) to 144.5 TWh. By 2020 it is forecast that biomass electricity generation will reach 248 TWh in Non-OECD countries. In 2014, year-on-year growth in China reduced from 2013 levels but still represented an increase of just below 9%, with an estimated 42 TWh of bioenergy electricity generation. The medium-term growth estimate in the MTRMR 2014 has been revised down on the basis of challenges faced by China in meeting the high and sustained year-on-year growth required to meet the 12th Five-Year Plan target of 30 GW of installed biomass power capacity by 2020. While generation from agricultural and forestry wastes and residues are supported by a FiT of 0.75 Yuan renminbi (CNY) per kilowatt hour (kWh) (USD 0.12/kWh), the distributed nature of such resources poses logistical challenges for the development of large-scale projects using these. In addition, opposition from local populations to MSW projects has been encountered and may require greater levels of information provision in order to increase acceptance of the use of waste-fuelled bioenergy generation. However, biogas projects using available sewage, agricultural and industrial wet wastes may feature prominently. Current levels of co-firing in China are also low, with a national means of accurately accounting for the biomass fraction of co-firing plants’ fuel consumption under development. This could facilitate the introduction of a co-firing support scheme. The availability of agricultural and forestry waste and residues in China, aligned with domestic straw and wood pellet production capacity, could provide considerable available resource for co-firing within existing coal-fired generation capacity should a supportive policy arise.

RENEWABLE ELECTRICITY: GLOBAL TECHNOLOGIES
142 MEDIUM-TERM RENEWABLE ENERGY MARKET REPORT 2015
Despite these challenges, continued bioenergy market growth in China is still expected, with project characteristics varied in line with local resource availability. Growth will be underpinned by fast-growing urbanisation and the significant resource potential for solid waste-to-energy projects benefiting from a unified national FiT of CNY 0.65/kWh (USD 0.11/kWh). With almost 28 TWh of generation, India also made a significant contribution to the Non-OECD total for bioenergy generation in 2014. Additional generation capacity added during the 2014/15 financial year was dominated by bagasse-fuelled co-generation plants. India surpassed its national grid-connected 300 MW target for the year in this area (Indian Ministry of New and Renewable Energy, 2015). In 2014, the state of Rajasthan introduced a FiT for biomass and biogas power generation that may stimulate additional growth in this region. Enhanced growth could be realised in the medium term if this is applied more widely across the country and efforts are made to encourage more efficient and higher use of sugar cane bagasse fuel resources for co-generation within the sugar industry. In addition, the promotion of technology options to recover energy from urban wastes may also stimulate additional generation from biomass. In 2014, Brazil’s bioenergy generation stayed relatively steady versus 2013 levels at around 40 TWh. A contributing factor to this was a sustained period of drought from late 2013 to early 2014, which reduced sugar cane yields and associated bagasse fuel availability. Previous government PPA renewable energy auction criteria set bid ceilings for biomass and waste equally to wind and hydro technologies and consequently only awarded contracts for low levels of bioenergy capacity. However, three recent renewable energy auctions held over the 2013-14 period offered higher bid ceilings for biomass and waste projects relative to other renewable technologies, and also extended the length of the PPA offered from 20 to 25 years. These more favourable criteria led to approximately 1.4 GW of biomass and waste capacity being contracted for delivery in Brazil over 2018 and 2019. It is anticipated that future bioenergy growth in Brazil will be underpinned by large scale co-generation plants developed in partnership with industrial sites in order to serve their heat and power loads. The advantage of these projects is the on-site availability of low or no-cost process co-products as a fuel and provision of a guaranteed energy purchaser. In addition to agricultural residues, for several projects dedicated eucalyptus plantations are the anticipated fuel source. These allow for a higher degree of control over the fuel supply chain than purchasing externally. Despite significant potential biomass fuel resources, modern bioenergy generation in Africa is forecasted to undergo only low-level steady growth in the medium term. Generation is forecast to rise modestly from almost 3.5 TWh in 2014 to just under 5 TWh in 2020, reflecting the addition of over almost 600 MW of bioenergy capacity over the same period. Many African countries have undertaken biomass resource assessments that have indicated abundant potential national resources for bioenergy. However, as yet this has not translated into significant modern bioenergy capacity additions. A potential exception to this is the proposed joint project between Norwegian and Ghanaian companies to construct a 600 MW biomass plant in central Ghana announced in late 2014 (Ends Waste & Bioenergy, 2014). Should this project come to fruition it would more than double MTRMR 2015 forecast bioenergy capacity growth in Africa and, depending on the energy content of fuel utilised, could consume approximately 2 million tonnes (Mt) of biomass annually.
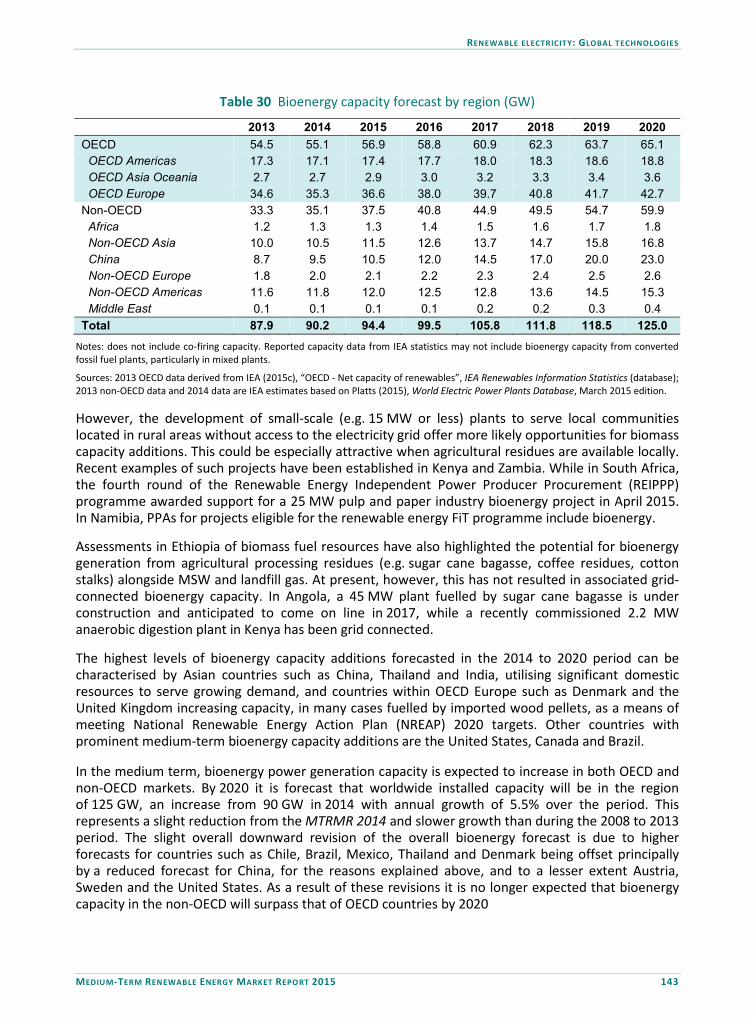
RENEWABLE ELECTRICITY: GLOBAL TECHNOLOGIES
MEDIUM-TERM RENEWABLE ENERGY MARKET REPORT 2015 143
Table 30 Bioenergy capacity forecast by region (GW)
2013 2014 2015 2016 2017 2018 2019 2020 OECD 54.5 55.1 56.9 58.8 60.9 62.3 63.7 65.1 OECD Americas 17.3 17.1 17.4 17.7 18.0 18.3 18.6 18.8 OECD Asia Oceania 2.7 2.7 2.9 3.0 3.2 3.3 3.4 3.6 OECD Europe 34.6 35.3 36.6 38.0 39.7 40.8 41.7 42.7 Non-OECD 33.3 35.1 37.5 40.8 44.9 49.5 54.7 59.9 Africa 1.2 1.3 1.3 1.4 1.5 1.6 1.7 1.8 Non-OECD Asia 10.0 10.5 11.5 12.6 13.7 14.7 15.8 16.8 China 8.7 9.5 10.5 12.0 14.5 17.0 20.0 23.0 Non-OECD Europe 1.8 2.0 2.1 2.2 2.3 2.4 2.5 2.6 Non-OECD Americas 11.6 11.8 12.0 12.5 12.8 13.6 14.5 15.3 Middle East 0.1 0.1 0.1 0.1 0.2 0.2 0.3 0.4 Total 87.9 90.2 94.4 99.5 105.8 111.8 118.5 125.0
Notes: does not include co-firing capacity. Reported capacity data from IEA statistics may not include bioenergy capacity from converted fossil fuel plants, particularly in mixed plants.
Sources: 2013 OECD data derived from IEA (2015c), “OECD - Net capacity of renewables”, IEA Renewables Information Statistics (database); 2013 non-OECD data and 2014 data are IEA estimates based on Platts (2015), World Electric Power Plants Database, March 2015 edition. However, the development of small-scale (e.g. 15 MW or less) plants to serve local communities located in rural areas without access to the electricity grid offer more likely opportunities for biomass capacity additions. This could be especially attractive when agricultural residues are available locally. Recent examples of such projects have been established in Kenya and Zambia. While in South Africa, the fourth round of the Renewable Energy Independent Power Producer Procurement (REIPPP) programme awarded support for a 25 MW pulp and paper industry bioenergy project in April 2015. In Namibia, PPAs for projects eligible for the renewable energy FiT programme include bioenergy. Assessments in Ethiopia of biomass fuel resources have also highlighted the potential for bioenergy generation from agricultural processing residues (e.g. sugar cane bagasse, coffee residues, cotton stalks) alongside MSW and landfill gas. At present, however, this has not resulted in associated grid-connected bioenergy capacity. In Angola, a 45 MW plant fuelled by sugar cane bagasse is under construction and anticipated to come on line in 2017, while a recently commissioned 2.2 MW anaerobic digestion plant in Kenya has been grid connected. The highest levels of bioenergy capacity additions forecasted in the 2014 to 2020 period can be characterised by Asian countries such as China, Thailand and India, utilising significant domestic resources to serve growing demand, and countries within OECD Europe such as Denmark and the United Kingdom increasing capacity, in many cases fuelled by imported wood pellets, as a means of meeting National Renewable Energy Action Plan (NREAP) 2020 targets. Other countries with prominent medium-term bioenergy capacity additions are the United States, Canada and Brazil. In the medium term, bioenergy power generation capacity is expected to increase in both OECD and non-OECD markets. By 2020 it is forecast that worldwide installed capacity will be in the region of 125 GW, an increase from 90 GW in 2014 with annual growth of 5.5% over the period. This represents a slight reduction from the MTRMR 2014 and slower growth than during the 2008 to 2013 period. The slight overall downward revision of the overall bioenergy forecast is due to higher forecasts for countries such as Chile, Brazil, Mexico, Thailand and Denmark being offset principally by a reduced forecast for China, for the reasons explained above, and to a lesser extent Austria, Sweden and the United States. As a result of these revisions it is no longer expected that bioenergy capacity in the non-OECD will surpass that of OECD countries by 2020
RENEWABLE ELECTRICITY: GLOBAL TECHNOLOGIES
144 MEDIUM-TERM RENEWABLE ENERGY MARKET REPORT 2015
Market status and outlook – accelerated case Under enhanced conditions, bioenergy capacity could be 10-15 GW higher in 2020 versus the main case, an increase of 8-12%. Achieving the upside potential will require stable long-term policy frameworks in key markets such as OECD Europe, India, Brazil and China. A predictable and reliable return on investment is especially relevant to bioenergy where, aside from capital investment, large-scale projects also need to commit to long-term fuel supply contracts. In China, greater encouragement of decentralised generation through biogas and waste-to-energy technologies on a small to medium scale could see an additional 6-7 GW of deployment by 2020. Policies that facilitate the use of free and low-cost waste and residue feedstocks, particularly in industry, could increase bioenergy deployment. In India it is considered that an additional 0.5-1 GW of capacity could be achieved by 2020 through maximising the potential of the national sugar industry’s bagasse resource through new or refurbished generation plants. Recognition by policy makers of the value of bioenergy as a renewable and dispatchable component of generation portfolios that facilitates electricity network balancing and the integration of higher levels of variable renewable technologies would also help to deliver enhanced levels of uptake. This could be relevant to Brazil, where more favourable renewable energy PPA auction rules could deliver an additional 0.6-1.3 GW of capacity. This is also particularly relevant in OECD Europe countries with rapidly increasing levels of variable renewables and conventional plant retirements. Such markets present opportunities for flexible mid-merit bioenergy plants. Estimated bioenergy capacity and generation both fall short of the figures proposed for biomass and waste within the IEA Energy Technology Perspectives 2015 (ETP 2015) 2°C Scenario (2DS), which requires 186 GW of capacity and 783 TWh of global biomass and waste generation in 2020. Comparative MTRMR 2015 bioenergy forecast figures for 2020 are 125 GW of capacity and 588 TWh of associated generation. An ongoing challenge to higher levels of bioenergy uptake more in line with the 2DS will be the comparative costs of bioenergy technologies in the context of reduced investment and LCOE values for variable renewables, and also competitiveness when compared with conventional technologies that, like bioenergy, can offer dispatchable power generation. Biomass fuel market status and outlook Developments in internationally traded biomass
In many cases, bioenergy uptake at a national level is based on the use of country-specific and regional resources. However, increasingly where this is not sufficient, many countries are using internationally traded biomass as a means to support higher levels of bioenergy generation that contribute to national renewable energy targets. Figures from Argus Media (2015) indicate approximately 14 Mt of pellet imports globally during 2014; this would account for around 16% (by energy content) of the MTRMR 2015 bioenergy generation figure.9 This is the case in several countries in OECD Europe (e.g. Denmark and the United Kingdom) and OECD Asia (e.g. Japan and Korea) that have significantly increased bioenergy deployment through higher levels of biomass co-firing or the partial or full conversion of coal-fired plants to biomass. Geography and freight transport infrastructure determine pellet trade relationships. For example, Nordic countries such as Sweden and Denmark have been importing wood pellets principally from 9 Figure based on 2014 imported pellet data from Argus Media (2015) with an assumed pellet energy content of 17.5 megajoules per kilogramme. It should be taken into consideration that the majority of internationally traded pellets are consumed in OECD Europe (>80%).

RENEWABLE ELECTRICITY: GLOBAL TECHNOLOGIES
MEDIUM-TERM RENEWABLE ENERGY MARKET REPORT 2015 145
the Russian Federation and the Baltic States due to their proximity. The United Kingdom and Belgium, however, source a higher volume of wood pellets imported from North America. Large-scale bioenergy electricity generation continued to stimulate investment in new production capacity and transport infrastructure for the international trade of wood pellets over 2014. Wood pellet trade between the European Union and North America continued to be strong in 2014. This trend has resulted in additional pelletisation plants opening in both Canada and the southeast United States. While there is consensus that production capacity in the United States increased further in 2014, estimates as to its level in million tonnes vary. Pellet production in the United States in 2014 grew by about 21% on 2013 levels (UNECE/FAO, 2015). The European Union is both the largest producer and the largest consumer of wood pellets. Demand for wood pellets from North America to serve demand in OECD Europe has resulted in European energy companies investing in upstream pelletisation plants and port facilities. European port facilities, such as the Port of Amsterdam, have also invested in upgraded biomass handling and storage in order to accommodate higher levels of internationally traded biomass (REN 21, 2014). Demand for Canadian wood pellets, principally from British Columbia, was also boosted by higher levels of co-firing in Korea associated with RPS requirements. Wood pellet imports in Korea increased 235% in 2014 (Argus Media, 2015), with growing quantities from emerging Asian suppliers such as Viet Nam and Indonesia. Demand for wood pellets is also emerging in Japan as a result of higher levels of co-firing and support for biomass from a FiT support scheme. In China, however, it is anticipated that the majority of future wood pellet demand will be sourced from domestic production.
In May 2014, the International Organization for Standardization (ISO) issued specification standards for solid biofuels, and producer and trader certifications to the ENplus pellet scheme also continue to grow. The uniform characteristics of wood pellets and establishment of product specifications allow for pellet fuels to be traded as a commodity. As such, trading platforms have emerged, adding additional price transparency to the market and providing opportunities for both biomass pellet suppliers and consumers to manage price volatility risks.
Figure 46 Wood pellet imports to Korea from Canada and selected Asian countries 2014-15
0
200
400
600
800
1000
1200
1400
1600
Jan 14 Feb 14 Mar 14 Apr 14 May 14 Jun 14 Jul 14 Aug 14 Sep 14 Oct 14 Nov 14 Dec 14 Jan 15 Feb 15 Mar 15 Apr 15 May 15
Impo
rted
pellets
(thou
sand
tonnes)
Imports from Canada Cumulative imports CanadaImports from selected Asian countries Cumulative imports selected Asian countries
Note: Selected Asian countries are Indonesia, Malaysia, Thailand and Viet Nam.
Source: Argus Media (2015), “South Korea has 'no plans' for biomass cap”, 11 February.

RENEWABLE ELECTRICITY: GLOBAL TECHNOLOGIES
146 MEDIUM-TERM RENEWABLE ENERGY MARKET REPORT 2015
Higher energy density torrefied wood pellets have the potential to significantly reduce pellet transport costs. However, production of these is still not operational at a commercial scale, despite demonstration plants in operation with capacities up to 60 000 tonnes per year (Henderson, 2015). The principal developments required for increased torrefied pellet production from a technical standpoint relate to process optimisation and ensuring product consistency, while market considerations are related to developing recognised product specifications, standards and acceptance within the subsidy schemes and relevant environmental legislation of key markets. An alternative to torrefaction is steam treatment of pellets to improve their properties for use as a fuel. Such pellets are hydrophobic, allowing for outside storage, and have a higher energy density. These characteristics allow for reduced coal-to-biomass conversion investment costs associated with boiler modifications and fuel storage and handling. This has been evident at the Thunder Bay biomass conversion plant in Ontario, where one of the two plant units is fuelled by steam-treated pellets. A further benefit of steam pre-treatment is reduced dust production and therefore a lower associated fire and explosion risk. Solid biofuels sustainability a key consideration for both government and industry
A key challenge to ensuring continued growth in bioenergy markets is the ongoing debate regarding the level of emissions savings delivered from and the potential for environmental and social impacts of solid biomass fuels. This is especially the case where fuels are imported in large quantities. This has led to the introduction of both government- and industry-led sustainability requirements. Without the development of robust means to demonstrate the sustainability of solid biomass fuels used for bioenergy generation, the increasing focus on fuel sustainability characteristics could cause national policy makers to shift emphasis for renewable energy policy support away from bioenergy to other technologies, and represents a downside risk to the MTRMR 2015 forecast. In March 2015, the Netherlands introduced sustainability requirements for solid biomass fuels as an eligibility requirement for certain categories of bioenergy to receive subsidy support under the SDE+ scheme. These criteria cover issues such as carbon debt, greenhouse gas balances and indirect land use change. However, the criteria that apply depend on the type of biomass used (Flach, 2015). In the United Kingdom, compliance with sustainability requirements for fuels produced from virgin wood10 is obligatory for bioenergy projects to receive support under the CFD scheme, and proposed to become mandatory in 2015 for the receipt of subsidies from the Renewable Heat Incentive (RHI) and the Renewables Obligation (RO) 11 scheme for electricity. The United Kingdom has also introduced a timber standard to outline how the land use elements of sustainability criteria should be met (DECC, 2015). In order to ease compliance with sustainability requirements, a list of certified biomass fuel suppliers was launched in 2014; unless fuel is self-supplied, purchasing from these suppliers is mandatory under the domestic RHI scheme. In March 2015, the Sustainable Biomass Partnership (SBP), whose membership comprises several major European energy companies, launched a certification framework designed to provide 10 Biomass materials that have had no previous exposure to chemical treatment or finishes prior to fuel production. 11 Pending parliamentary approval at the time of writing.
RENEWABLE ELECTRICITY: GLOBAL TECHNOLOGIES
MEDIUM-TERM RENEWABLE ENERGY MARKET REPORT 2015 147
assurance that woody biomass fuels are sourced both legally and sustainably, allowing consumers in the bioenergy sector to demonstrate compliance with national regulatory requirements and corporate social responsibility. The scheme works on the basis of third-party certification of feedstock and chain-of-custody information. The developments in biomass sustainability legislation and certification mentioned provide additional clarity to fuel suppliers regarding consumer requirements in key export markets. However, a significant cost of compliance may also be introduced for fuel suppliers if numerous different national sustainability requirements are introduced. The ability of biomass fuel suppliers in key supply regions to comply with national solid biomass sustainability criteria, especially in high-volume OECD Europe import markets, places a future downside risk on the MTRMR 2015 bioenergy forecast.
Box 3 Key recent developments and future prospects for coal-to-biomass conversions
Several large-scale coal-to-biomass conversion projects have added significant bioenergy capacity within OECD Europe over recent years, and further projects are planned that will underpin additional bioenergy capacity over the medium term in the region. Furthermore, this approach has the potential to increase the MTRMR 2015 forecast for bioenergy in countries such as Korea and China.
Coal-to-biomass conversion projects require significant capital investment to install the equipment and infrastructure necessary to convert entire existing thermal generation plants, or associated units of these, previously fuelled by coal to using biomass (principally in the form of wood pellets). Such projects require the construction of dedicated biomass storage and handling facilities and, depending on the characteristics of the existing plant, may also need modification or replacement of power station boilers, burners and mills. Conversion to biomass-only operation can also result in a slight reduction of the original coal-fired capacity, but the capacity of such plants is still significantly higher than obtainable from new-build dedicated biomass projects. In addition, plant conversion can be completed in a shorter timescale and, although cost data are limited, indications are for lower investment per kilowatt capacity. As such, conversion projects are able to bring significant additional bioenergy capacity on line and facilitate quicker progress towards national renewable energy targets.
Key developments Early coal-to-biomass conversion projects include the 180 MW Rodenhuize conversion project in Belgium, which started generating from 100% biomass in 2011, and Tilbury Power Station in the United Kingdom, which was re-commissioned to run only on biomass in 2012.
Growth in this area continued in the United Kingdom in 2013 as Drax Power Station converted one of its six principal units (with a capacity in excess of 600 MW) to biomass, and E.ON converted the whole of its Ironbridge Power Station as well, although one unit subsequently came off line due to a fire in 2014. This trend has continued further with key developments in 2014 including conversion of a second unit at Drax Power Station and a unit of Dong Energy’s Averøreværket plant in Denmark also commencing operation on 100% biomass. Outside of OECD Europe, the 200 MW (approximate) Atikokan plant in Ontario was commissioned in 2014 to become North America's largest power plant fuelled solely by biomass (Ontario Ministry of Energy, 2015). This was followed by completion of the Thunder Bay conversion project, also in Ontario, in February 2015.
The developments above have been made possible due to a combination of technical, market and policy factors. From a technical perspective, most conversion projects have built on previous operational experience of co-firing biomass alongside coal. In relation to fuel supply, the growing market for
RENEWABLE ELECTRICITY: GLOBAL TECHNOLOGIES
148 MEDIUM-TERM RENEWABLE ENERGY MARKET REPORT 2015
Box 3 Key recent developments and future prospects for coal-to-biomass conversions (continued)
internationally traded wood pellets has provided economic and secure fuel supplies. The United Kingdom and Denmark were the two highest pellet importing countries in 2013 (AEBIOM, 2015).
Government subsidies designed to facilitate progress towards NREAPs for meeting the EU 2020 renewable energy target were also a key factor. In the United Kingdom, support for these conversions was provided under the RO scheme when in 2013 changes were introduced to provide increased support for co-firing at higher levels and for the conversion of whole units or stations to biomass. The introduction of the carbon floor price for fossil fuels used to generate electricity in the United Kingdom in April 2013 also encouraged fuel switching away from coal towards biomass and other less carbon-intensive fuels.
In Denmark, power generation from biomass is supported via a feed-in premium. In addition, there is also a national goal of 35% renewable energy overall by 2020, a level higher than the mandatory NREAP target. Other national targets include phasing out coal consumption at power plants by 2030. The energy company Dong Energy has established a 50% biomass share in domestic co-generation target by 2020. In Canada the phasing out of coal-fired generation in Ontario province was a key factor in the development of the Atikokan and Thunder Bay biomass conversion projects.
Future prospects Coal-to-biomass conversion projects account for a significant share of the additional medium-term bioenergy capacity within the MTRMR 2015 forecast for both the United Kingdom and Denmark.
A pipeline for further projects proposed to take place in the United Kingdom exists with the potential for an additional two units to be converted at Drax Power Station and the proposed 395 MW conversion of RWE’s Lynemouth power station. The Lynemouth project and one of the units proposed for conversion at Drax Power Station have been awarded contracts under the national CFD scheme. However, there is doubt surrounding ongoing support for biomass conversion in the United Kingdom beyond these projects, as no budget was allocated for conversions within the initial CFD auction round and changes have come into force that alter support for biomass unit conversions under the RO scheme. The carbon floor price doubled in April 2015, however, making coal generation relatively more expensive.
In Denmark, Dong Energy has two further proposed unit conversion projects planned at the Studstrupværket and Skærbæk power stations. Both of these co-generation plants are currently operating on a mix of biomass and fossil fuels and intend to convert to 100% biomass over the 2016-17 period (Hojgaard-Nielsen, 2014). The Swedish energy company Vattenfall is also developing biomass projects in Denmark in line with its climate vision of carbon-neutral operations in the Nordic region, and a 50% reduction in emissions by 2030. In France, E.ON’s approximately 150 MW new-build Gardanne biomass project is proposed to start generation in early 2016 (Mugnier, 2015). While with several plants already having a history of co-firing in both the Netherlands and Belgium, the potential exists to develop coal-to-biomass conversion projects in these countries if a supportive policy framework is established.
The potential or future capacity additions outside of OECD Europe could occur in Japan and Korea, both of which are currently co-firing biomass alongside coal at increased levels. This could act as a potential stepping stone to conversion projects as a means of adding significant bioenergy capacity in support of national renewable energy objectives. Furthermore, conditions in China may also be favourable with domestic wood pellet production and coal-fired generation plants available on a significant scale, and therefore providing an option to accelerate progress towards the 30 GW bioenergy capacity target for 2020 and growth more in line with the MTRMR 2015 accelerated case.
The development of commercial-scale torrefied or steam-treated pellet supply chains would also assist the uptake of biomass conversion projects on the basis that such fuel has characteristics similar to coal and could be utilised with reduced plant modifications. The higher energy density of these fuels also reduces fuel transport costs. The activities of the SBP in devising a recognised sustainability certification
RENEWABLE ELECTRICITY: GLOBAL TECHNOLOGIES
MEDIUM-TERM RENEWABLE ENERGY MARKET REPORT 2015 149
Box 3 Key recent developments and future prospects for coal-to-biomass conversions (continued)
framework to assist energy companies in demonstrating compliance with national regulatory schemes and company-specific corporate social responsibility requirements could also prove important.
It should be noted that although a coal-to-biomass conversion can lead to reduction in nitrogen dioxide and sulphur dioxide emissions, it does not provide exemption for plants from the EU Large Combustion Plants Directive (LCPD). Tilbury Power Station closed in 2013 as it opted out of compliance with the LCPD, and Ironbridge Power Station’s remaining operational unit is due to close later this year on the expiry of allowable generation hours under the legislation for the same reason.
Geothermal power Technology development With a large estimated resource potential, geothermal technology can provide both base-load and flexible power from energy stored in rock, trapped vapour and liquids. Geothermal projects have in general long lead times of five to seven years from exploration, drilling and construction to power production. As the early-stage development represents around half of the overall costs, investment risks associated with exploratory drilling and development costs represent the main challenge to the deployment of geothermal power. In both member and non-member economies of the OECD, some governments invest in the early-development stage of geothermal projects to minimise drilling risks to facilitate private-sector investment. This involvement has helped to reduce project risks in geothermal deployment in Kenya and Indonesia. In September 2014, 23 countries launched the Global Geothermal Alliance (GGA). The alliance is expected to serve as a platform for dialogue and knowledge-sharing among partners including international financing institutions and the private sector as well as a coalition for action to increase the share of installed geothermal electricity and heat generation worldwide. GGA will work to reduce the investment risks associated with exploratory drilling along with the associated costs (GGA, 2014). However, at the time of the writing, an action plan had not been released. In existing geothermal plants, the main challenge is to maintain a high level of reservoir temperature over the lifetime of a project in order to maximise its output. While enhanced geothermal systems have added little additional capacity to existing plants in the United States and Germany, some developers have combined different renewable technologies to maximise their geothermal generation. In the United States, the Stillwater project in Nevada combined geothermal power with solar PV to achieve a continuous generation capacity of the medium enthalpy geothermal binary cycle with the peak capacity of solar power. In Italy, Enel Green Power started the construction of a biomass plant next to its existing Cornia 2 geothermal field in order to heat geothermal steam to increase the energy efficiency and electricity output of the already-existing geothermal cycle. The heat from the 5 MW biomass plant is expected to increase initial geothermal steam from 150°-160°C to 370°-380°C. Costs of geothermal plants are site- and project-specific. Typical O&M costs vary significantly depending on the plant. Typical capital costs of a high-temperature geothermal electricity plant range from USD 2 000/kW to USD 5 000/kW. The capital costs of binary plants range from USD 2 400/kW to USD 5 600/kW. Still, generation costs from high-temperature geothermal resources
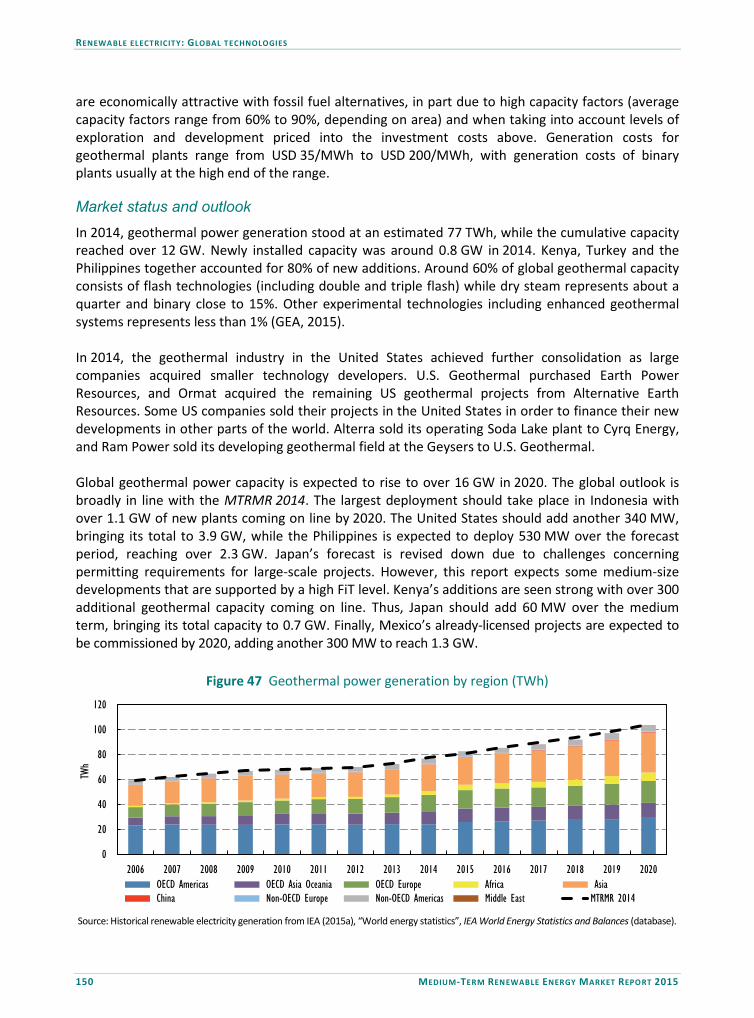
RENEWABLE ELECTRICITY: GLOBAL TECHNOLOGIES
150 MEDIUM-TERM RENEWABLE ENERGY MARKET REPORT 2015
are economically attractive with fossil fuel alternatives, in part due to high capacity factors (average capacity factors range from 60% to 90%, depending on area) and when taking into account levels of exploration and development priced into the investment costs above. Generation costs for geothermal plants range from USD 35/MWh to USD 200/MWh, with generation costs of binary plants usually at the high end of the range.
Market status and outlook
In 2014, geothermal power generation stood at an estimated 77 TWh, while the cumulative capacity reached over 12 GW. Newly installed capacity was around 0.8 GW in 2014. Kenya, Turkey and the Philippines together accounted for 80% of new additions. Around 60% of global geothermal capacity consists of flash technologies (including double and triple flash) while dry steam represents about a quarter and binary close to 15%. Other experimental technologies including enhanced geothermal systems represents less than 1% (GEA, 2015). In 2014, the geothermal industry in the United States achieved further consolidation as large companies acquired smaller technology developers. U.S. Geothermal purchased Earth Power Resources, and Ormat acquired the remaining US geothermal projects from Alternative Earth Resources. Some US companies sold their projects in the United States in order to finance their new developments in other parts of the world. Alterra sold its operating Soda Lake plant to Cyrq Energy, and Ram Power sold its developing geothermal field at the Geysers to U.S. Geothermal. Global geothermal power capacity is expected to rise to over 16 GW in 2020. The global outlook is broadly in line with the MTRMR 2014. The largest deployment should take place in Indonesia with over 1.1 GW of new plants coming on line by 2020. The United States should add another 340 MW, bringing its total to 3.9 GW, while the Philippines is expected to deploy 530 MW over the forecast period, reaching over 2.3 GW. Japan’s forecast is revised down due to challenges concerning permitting requirements for large-scale projects. However, this report expects some medium-size developments that are supported by a high FiT level. Kenya’s additions are seen strong with over 300 additional geothermal capacity coming on line. Thus, Japan should add 60 MW over the medium term, bringing its total capacity to 0.7 GW. Finally, Mexico’s already-licensed projects are expected to be commissioned by 2020, adding another 300 MW to reach 1.3 GW.
Figure 47 Geothermal power generation by region (TWh)
0
20
40
60
80
100
120
2006 2007 2008 2009 2010 2011 2012 2013 2014 2015 2016 2017 2018 2019 2020
TWh
OECD Americas OECD Asia Oceania OECD Europe Africa Asia China Non-OECD Europe Non-OECD Americas Middle East MTRMR 2014
Source: Historical renewable electricity generation from IEA (2015a), “World energy statistics”, IEA World Energy Statistics and Balances (database).

RENEWABLE ELECTRICITY: GLOBAL TECHNOLOGIES
MEDIUM-TERM RENEWABLE ENERGY MARKET REPORT 2015 151
On the generation side, geothermal resources should provide around 104 TWh globally in 2020. Over the medium term, the OECD’s share in overall generation slightly decreases while the generation in OECD non-member markets should expand, reaching 45 TWh in 2020. Non-OECD Asia, excluding China, should represent more than 30% of overall generation by 2020, led by Indonesia and the Philippines.
Table 31 Geothermal power capacity and forecast by region (GW)
2013 2014 2015 2016 2017 2018 2019 2020 OECD 7.6 7.7 8.0 8.1 8.2 8.5 8.7 9.1
OECD Americas 4.3 4.3 4.4 4.5 4.6 4.7 4.8 5.0 OECD Asia Oceania 1.5 1.5 1.5 1.5 1.5 1.6 1.6 1.7 OECD Europe 1.8 1.9 2.0 2.1 2.1 2.2 2.3 2.4
Non-OECD 4.2 4.7 4.8 5.1 5.4 5.8 6.4 7.0 Africa 0.3 0.6 0.6 0.6 0.6 0.8 0.9 1.0 Non-OECD Asia 3.1 3.3 3.4 3.7 3.9 4.1 4.5 4.9 China 0.0 0.0 0.0 0.1 0.1 0.1 0.1 0.1 Non-OECD Europe 0.1 0.1 0.1 0.1 0.1 0.1 0.1 0.1 Non-OECD Americas 0.6 0.6 0.6 0.7 0.7 0.8 0.8 0.9 Middle East – 0.0 0.0 0.0 0.0 0.0 0.0 0.0
Total 11.7 12.4 12.8 13.2 13.6 14.2 15.1 16.1
Sources: 2013 OECD data derived from IEA (2015c), "OECD - Net capacity of renewables", IEA Renewables Information Statistics (database); 2013 non-OECD data and 2014 data are IEA estimates based on BP (2014), BP Statistical Review of World Energy 2014; and Platts (2015), World Electric Power Plants Database, March 2015 edition.
Hydropower Technology developments Hydropower is a mature technology and the largest current source of renewable power in the world. As source of base-load power, large hydropower developments going forward are likely to be driven by markets that need to meet fast-growing demand. However, power systems requiring technologies that add system flexibility, firm capacity and storage ability while helping to meet peak demand should drive developments in hydropower technologies with reservoirs. Smaller hydropower projects may also see increased activity with the potential to meet local demand. Yet economic attractiveness may be a challenge if optimising the market frameworks to allow for different hydropower technologies receives insufficient attention. Hydropower plants are designed for the specific topography of the operation site and thus exist in many different configurations and sizes. Generally though, they are often classified by three parameters: function, size and hydraulic head. Classification by function falls broadly into three categories: run-of-river, reservoir and pumped storage plants (PSPs). Run-of-river plants tend to have little to no storage capacity, while the defining characteristic of reservoir plants is their storage capacity. PSPs pump water up to a reservoir for release at a later time, but may also contain natural inflows. The boundaries between these categories can be blurry, as plant configurations are numerous and have characteristics that fall under multiple categories, thus making a complete classification challenging. In size, the names “large”, “medium” and “small” are used to demarcate magnitudes of

RENEWABLE ELECTRICITY: GLOBAL TECHNOLOGIES
152 MEDIUM-TERM RENEWABLE ENERGY MARKET REPORT 2015
the capacity, which can range from a few kilowatts up to gigawatts. However, the naming conventions are subjective because a harmonised international classification system by size does not exist. Furthermore, classifying by size is relative and can be subject to regional perspectives, as what may be considered “large” by statistical offices in OECD countries may be small compared with the gigawatt-sized plants recently commissioned in China and Brazil. Finally, classification can also be made by hydraulic head, a parameter related to the potential energy of the falling water. Hydraulic heads can range from 1 800 metres (m) to less than 20 m, and often dictate the type of turbine employed. These characteristics enable hydropower plants to play a wide role in the power system, ranging from a source of base-load power to meeting peak demand from storage, through multiple configurations. Hydropower costs are extremely site-specific since the topology, hydrology of different locations, and power market requirements dictate project parameters such as hydraulic head and flow rate, which in turn dictate the technology, size and required civil works for installation. The two largest portions of the investment costs are the electro-mechanical equipment costs and civil engineering for construction, which constitute different proportions of the total cost depending on size (IEA, 2012b; IRENA, 2015). Civil works tend to make up a larger portion of the total investment costs for larger projects, while for smaller projects, equipment costs can reach over 50% of the total cost (IRENA, 2015). Additional costs arising from required feasibility and environmental impact assessments and licensing can also vary with each site and contribute differently to the overall project costs. As a result, the costs of hydropower plants span a wide range. Investment costs for larger hydropower can range from USD 900/kW to USD 3 500/kW depending on the magnitude of the plant and new infrastructure required to accommodate project construction. Smaller schemes are likely to have higher costs, ranging from USD 1 000/MW to USD 6 000/MW as more site-specific technology may be required to utilise modest resources. Yet the boundaries for such ranges are not fixed, given the numerous possible plant configurations and that higher and lower values can be observed for both ranges. Costs can also be higher in regions where most of the lower cost potential has been already developed such as in North America, Europe and Asia Oceania, which have the lowest percentages of undeveloped economical potential remaining. Annual operation and maintenance costs for hydropower tend to be small relative to the investment costs, depending on the size (IRENA, 2015a). Financing costs, on the other hand, can have a larger impact especially with the high upfront costs, long lead times for construction, and risk of cost and/or schedule overruns from geological uncertainties, which can prolong revenue and delay loan repayment. Estimated generation costs for hydropower projects can range from USD 20/MWh to USD 230/MWh depending on, among other things, size, cost of capital and capacity factors. Yet boundary ranges provide only a partial picture of the generation costs. Despite the wide range found in one study of projects, USD 20/MWh to USD 350/MWh, 90% of the projects had an LCOE below USD 90/MWh (IEA, 2012b; IRENA, 2015a; IRENA, 2015b). Still, generation costs are only one metric to evaluate the project economics and can overshadow the true value of the flexibility, firm capacity and storage ability that some hydropower technologies bring to the power system. An increasing penetration of variable renewables requires a system to accommodate fluctuations in supply and demand on a short timescale. Technologies such as reservoir hydropower and pumped storage that can regulate output and ramp up and down quickly will be needed to provide ancillary services such as frequency regulation and load following. Furthermore, PSPs that have long provided demand shifting and peak reduction, as well as other
RENEWABLE ELECTRICITY: GLOBAL TECHNOLOGIES
MEDIUM-TERM RENEWABLE ENERGY MARKET REPORT 2015 153
services, can help store renewable generation when demand is low and provide supply during peak times, which helps minimise inefficient idling of other plants and can save fuel costs from peaking plants. However, market designs that adequately remunerate such services, particularly in the case of PSP, are important for making project economics more attractive. In the absence of other revenue streams, PSPs rely on the electricity price differential between low and high demand to be profitable. Such spreads are decreasing in some European markets, causing most PSP projects to be suspended over uncertainty of future bankability. Yet in China, a new two-part tariff was introduced in 2014 that fixes the spread and should assist in attracting PSP projects there. Valuation of hydropower development on the basis of electricity production alone may also be misrepresentative relative to benefits of the other water-related services that it can provide, such as flood control, irrigation and drought mitigation. While these objectives can conflict at times, they are often complementary. Over the medium term, limited cost reductions in conventional equipment costs are expected given that hydropower is a relatively mature technology, though the potential exists to develop less expensive technologies for small hydropower to exploit more low-head potentials (IRENA, 2015a). For large hydropower projects, the expanding role from base-load power to balancing the system could provide opportunities to improve project economics, though only in markets where such services are well monetised. Refurbishment of older plants with new technologies can provide an opportunity to improve margins by increasing overall efficiency and extending the life of the plant. There is an increasing effort to reduce the costs of small-scale hydropower by developing equipment that is standardised and modular, thus reducing design and development costs. This can also be applied to the civil structures to some extent, barring site-specific design and safety requirements are still met. In the case of PSPs, the use of variable speed pump-turbines instead of synchronous single speed allows for higher operational flexibility and increased efficiency in pump and turbine modes and is being used for some new-build PSP plants such as the 1 GW Linthal plant and 1 GW Nant de Drance in Switzerland, which are currently under construction. Grid interconnection projects may also increase economic attractiveness, connecting projects with new demand outlets through trade and facilitating the expansion of physical balancing areas. In 2015, the United Kingdom and Norway signed an ownership agreement to build a 1.4 GW interconnector between the two countries, linking them for the first time and opening up a new market for Norway’s vast reservoir hydropower plants, while providing a balancing source to the United Kingdom’s wind generation. The opportunity to export electricity to neighbouring countries through regional co-operation also serves as a driver for new projects. In 2015, China Three Gorges and RusHydro signed an agreement to build a joint hydropower project in Russia to export electricity to China. Large and multipurpose hydropower projects may find easier access to concessional financing if the project benefits two or more countries and promotes regional development, such as the 80 MW Rusumo Falls project between Burundi, Rwanda and Tanzania, which received financing from the World Bank. However, their economic attractiveness, particularly if located far from load centres, can depend on the cost of additional infrastructure needed for grid connection. Still, concerns over large hydropower’s environmental and social impacts, if not well addressed, may pose a risk to some future developments and may increase costs from delays or additional project assessments. In 2015, developers of the 11.2 GW Belo Monte project in Brazil filed for a deadline extension to be exempted from paying liabilities for delayed operations, citing frequent opposition and difficulty obtaining licences. The costs of resettlement of local populations also risk raising
RENEWABLE ELECTRICITY: GLOBAL TECHNOLOGIES
154 MEDIUM-TERM RENEWABLE ENERGY MARKET REPORT 2015
overall project costs, an increasing concern in China resulting in the suspension of the 1 GW Xiaonanhai project. Large projects with significant adverse impacts on local resources and populations may also have difficulty attracting financing. Other risks to the cost are the increasing need for environmental impact studies that need to occur in tandem with national objectives on water resources and sustainability. Less-than-expected water supply levels can result in reduced generation and revenues. The potential impact of climate change on the length and quality of flow and precipitation may further increase hydrological risks for future developments. Smaller hydropower schemes are receiving increasing policy attention and support to continue their deployment. India’s National Mission for Small Hydropower, to start in 2015, provides financial assistance to encourage private-sector development of small hydropower to reach a target of 4.5 GW. Brazil approved higher ceiling rates in auctions for small hydropower in order to maintain developer interest after the announcement from the national development bank BNDES to offer reduced financing terms for smaller plants.
Market status and outlook
Global hydropower capacity, including PSP, reached 1 174 GW in 2014, expanding by 37.5 GW, the second highest year-on-year increase after the 43 GW peak seen in 2013. It should be noted that the commissioning of large hydropower projects in a single year can create temporary peaks in the annual growth, making it sometimes difficult to characterise a longer-term trend. China alone accounted for 60% of the global growth, adding 22 GW in 2014. A bulk of China’s additions came from commissioning the last units of several large plants, including 4.6 GW of 13.9 GW at Xiluodu, which brought the total installed capacity in the country to over 300 GW by the end of 2014. Outside of China, non-OECD countries continued to lead the growth in 2014, adding 10.6 GW in total, more than double the 4.9 GW commissioned in OECD countries. Deployment picked up in Brazil, which added 3 GW, and India, which added 1.5 GW, the highest levels seen in the last five years. The residual growth came mostly from the remaining countries of Asia and Non-OECD Americas, seen adding over 4 GW of capacity. OECD additions were led by Canada and Turkey, which added over 1 GW each and made up over half of the OECD additions. A handful of countries added a combined 1 GW of pumped storage capacity in 2014, bringing the total to an estimated of 134 GW, or 11% of total hydropower capacity. The figure may be higher given the difficulty in classifying PSP plant configurations, particularly for mixed plants. Estimates of current global installed capacity range from 129 GW to 140 GW. Over the medium term, total hydropower capacity is expected to expand by 152 GW during 2014-20, reaching 1 326 GW by 2020. Over 40% of the growth should come from China, which is seen adding 63 GW. However, relative to the high additions seen in 2013 and 2014, China’s annual growth is expected to slow by 2020, amid challenges to the future development in the region. The overall decline masks two divergent trends based on attractiveness of different types of hydropower technologies. Concerns over the environmental impacts of some large conventional projects have led to a delay in new project approvals and created a lull in the construction pipeline that underpins much of the slowdown. Moreover, reduced availability of economic sites and the potential costs of resettlement compensation have raised uncertainties over the attractiveness of larger reservoir projects. Pumped storage projects, by contrast, may become increasing economically attractive with the issuance in summer 2014 of a dedicated two-part tariff that remunerates projects on a capacity

RENEWABLE ELECTRICITY: GLOBAL TECHNOLOGIES
MEDIUM-TERM RENEWABLE ENERGY MARKET REPORT 2015 155
and energy basis, with electricity used for pumping priced at a 25% discount to the coal benchmark price. Development of pumped storage projects is also now permitted outside of the state grid companies. Thus, contrary to conventional hydropower, this forecast expects an increasing trend in PSP additions, driven by the new incentive and the government target of 70 GW of PSP by 2020, though cumulative installed capacity may be less, given new project lead times relative to the current pipeline under construction. In total, China’s capacity should reach 365 GW by 2020, against a target of 420 GW, due to expected challenges in conventional hydropower projects.
Table 32 Hydropower capacity and forecast by region (GW)
2014 2015 2016 2017 2018 2019 2020 OECD 475 479 482 485 488 490 492
OECD Americas 197 198 199 201 202 203 203 OECD Asia Oceania 69 69 69 69 69 69 70 OECD Europe 209 212 213 215 217 218 219
Non-OECD 699 729 756 780 802 818 834 Africa 28 29 31 33 35 37 39 Asia 107 111 117 125 130 133 136 China 302 321 332 341 350 358 365 Non-OECD Europe 97 97 98 98 99 100 100 Non-OECD Americas 150 155 161 165 170 173 176 Middle East 16 16 16 17 17 18 19
Total 1 174 1 207 1 237 1 266 1 290 1 308 1 326
Sources: 2013 OECD data derived from IEA (2015c), “OECD - Net capacity of renewables”, IEA Renewables Information Statistics (database); 2013 non-OECD data and 2014 data are IEA estimates based on Platts (2015), World Electric Power Plants Database March 2015 edition and International Journal on Hydropower and Dams (2014), 2014 World Atlas and Industry Guide.
Outside of China, the largest growth over the medium term is expected to come from Asia, which has one of the most untapped economic potential (IIJD, 2014) and is seen adding almost 30 GW, with India alone accounting for 13 GW. Yet India’s annual growth is expected to decline by 2020 amid uncertainties engendered by local concerns over the social and environmental impacts of some large hydropower projects. The remainder of Asia’s growth should be relatively stable, where deployment outside of India is seen expanding by 16 GW, particularly driven by projects in Indonesia, Malaysia, Pakistan, Thailand and Laos to meet local and regional demand. Strong growth is also expected from Non-OECD Americas, adding 25 GW by 2020, mostly from Brazil, seen expanding by 19 GW. However, like India and China, a slowdown in Brazil’s annual additions is expected by 2020. Diversification away from dependence on hydropower, where recent droughts have diminished output, and environmental concerns have prompted a downward revision to the 2020 hydropower capacity target in the Brazilian Energy Plan (PDE) 2014-24. Africa has the largest percentage of untapped hydropower potential, 90%, and the fastest regional growth rate over the medium term. Deployment is seen rising 11 GW by 2020, driven by rising electricity demands, regional integration and electrification of rural populations. Ethiopia and Angola drive most of the continent’s growth (+5 GW combined). With significant hydropower potential remaining, Angola alone is seen adding some 2.8 GW by 2020. In Ethiopia, the government’s longer-term vision to position the country as a regional exporter of electricity in one of the drivers for hydropower expansion. Yet the

RENEWABLE ELECTRICITY: GLOBAL TECHNOLOGIES
156 MEDIUM-TERM RENEWABLE ENERGY MARKET REPORT 2015
high capital cost and environmental and social issues of larger planned projects may be a challenge for Ethiopia, and the economic attractiveness hinges upon securing a revenue stream from off takers.
Figure 48 Hydropower annual additions and potential by region
0%
20%
40%
60%
80%
100%
0
3 000
6 000
9 000
12 000
15 000
Asia SouthAmerica
NorthAmerica
China Africa Europe AsiaOceania
TWh/yr
Theoretical Technical Economical Actual* % of Economical undeveloped(right axis)
0 5
10 15 20 25 30 35 40 45 50
2010 2011 2012 2013 2014 2015 2016 2017 2018 2019 2020
GW
China Non-OECD Americas Asia Africa OECD Americas OECD Europe Non-OECD Europe Middle East OECD Asia Oceania
Notes: GWh = gigawatt hours. Actual* generation data and potential from International Journal of Hydropower & Dams Atlas and may differ from IEA Energy Statistics. Regional classifications do not correspond to those used in this report.
Source: Historical OECD capacity derived from IEA (2015c), “OECD - Net capacity of renewables”, IEA Renewables Information Statistics (database).
The government anticipates a steady stream of revenue from the exports to neighbouring countries, though this largely depends upon the future demand of the region and ability of grid infrastructure to keep pace with planned projects. A similar challenge exists for the Democratic Republic of Congo, which also has plans to utilise its significant untapped hydropower potential. Still, regional collaboration to utilise these resources should continue to drive developments these markets. Elsewhere in sub-Saharan Africa, Mozambique and South Africa together are also seen adding 2 GW by 2020. Energy-intensive industries such as mining should also drive hydropower development in Africa. Hydropower generation is expected to reach 4 496 TWh by 2020, although these figures are largely contingent upon future capacity factors, which can vary widely depending on rainfall and reservoir levels. Severe droughts in Brazil have continued to reduce the water availability in major systems that supply hydropower stations. The resulting water shortages have caused hydropower generation in Brazil to drop from 415 TW in 2012 down to 373 TWh in 2014, a 10% decline despite an increase of 4.6 GW in hydropower capacity. Thus, utilisation rates going forward are largely dependent upon future rainfall levels and introduce a degree of uncertainty in the hydropower generation forecasts for regions susceptible to fluctuating water resources. China, for example, experienced record rainfall levels in the south, which helped to contribute to the increase in hydropower generation in 2014. China is also expected to lead hydropower generation by 2020 with 1 207 TWh, almost 30% of the global total. Yet in addition to sensitivity to rainfall levels, hydropower generation forecasts for China largely depend on how supply and demand are matched and managed over the medium term.

RENEWABLE ELECTRICITY: GLOBAL TECHNOLOGIES
MEDIUM-TERM RENEWABLE ENERGY MARKET REPORT 2015 157
Figure 49 Hydropower generation and forecast by region
0 500
1 0001 5002 0002 5003 0003 5004 0004 5005 000
2006 2007 2008 2009 2010 2011 2012 2013 2014 2015 2016 2017 2018 2019 2020
TWh
OECD Americas OECD Asia Oceania OECD Europe Africa Asia China Non-OECD Europe Non-OECD Americas Middle East MTRMR 2014
Source: Historical renewable electricity generation from IEA (2015a), “World energy statistics”, IEA World Energy Statistics and Balances (database). Limited interconnectivity between hydropower projects in remote areas and demand centres has emerged as a challenge to fully utilising the hydropower capacity installed. Transmission upgrades have focused on incorporating larger projects in remote areas and have left smaller projects experiencing local surpluses without sufficient transmission capacity to evacuate their power to load centres. The result can be forgone power in the form of abandoned water, which was the case in the Sichuan province in 2014 when dams were forced to release water that could have generated 9.7 TWh of power had the grid been able to absorb the supply (NEA, 2015). Supply-and-demand management will also dictate how China plans to utilise its pumped storage, another factor that would affect the total hydropower generation forecasts over the medium therm. While China’s PSP capacity is expected to grow over the medium term, an increase in capacity does not guarantee an equivalent increase in generation, as utilisation rates for PSP depend on a number of factors such as the need to quickly meet fluctuating demand and provide other ancillary grid services. Furthermore, as a net electricity consumer, it may be difficult to monitor all generation from PSPs. The remainder of hydropower generation should be led by Brazil, Canada and the United States, which should make up more than half of the global generation by 2020. Ocean power Technology developments
Overall, ocean energy’s contribution to global renewable power generation remains small. However, with a large resource potential and deployment of larger demonstration projects, ocean energy is expected to scale up over medium term, though commercial-scale developments remain nascent. The ocean energy resource potential is abundant and widespread globally. Ocean energy refers to any technology harnessing power from natural ocean phenomena: tidal range (rise and fall), tidal and ocean currents, waves, ocean thermal energy conversion (OTEC), and salinity gradients. Projects exploiting tidal rise and fall are the most mature ocean technology. In 2014, total ocean capacity stood at an estimated 0.53 GW, including two large-scale tidal projects in France and Korea.

RENEWABLE ELECTRICITY: GLOBAL TECHNOLOGIES
158 MEDIUM-TERM RENEWABLE ENERGY MARKET REPORT 2015
However, the nascent industry is experiencing some volatility and encountering some challenges to bring commercial projects to the market, raising some uncertainties for technology development over the medium term. For example, Pelamis Wave Power, a wave energy company, failed to secure financing for its project development funding in November 2014. Meanwhile, Siemens decided to halt its investment in tidal technology development and to divest from its subsidiary, Marine Current Turbines, in late 2014. The company was bought by Atlantis Resources in April 2015. In their demonstration stage, most ocean technologies remain relatively expensive, but with significant cost reduction potential. According to the recent study published by the Implementing Agreement for a Co-operative Programme on Ocean Energy Systems (IEA-OES), achieving economies of scale as projects move from the demonstration to commercial stage will be important for cost declines (IEA-OES, 2015b). The study estimated total investment costs for a 3 MW wave energy plant around USD 18 100/kW; however, costs could decrease by half to around USD 9 100/kW for a 75 MW plant. Investment costs for tidal projects of 10 MW are around USD 14 600/kW, but could decrease to USD 5 600/kW for larger projects of 90 MW. For (OTEC), plant costs are higher and could reach to USD 45 000/kW. However, the study indicates that costs could be significantly lower, around USD 13 000/kW, for 100 MW plants. Market status and outlook In 2014, ocean power generation stood at an estimated 1.07 TWh, while the cumulative capacity reached 0.53 GW. Newly installed capacity was around 0.2 MW in 2014, coming mostly from the completion of a test wave project in the United Kingdom called Wave Hub. South Korea, France, the United Kingdom and Canada together accounted for 90% of world ocean power. Around 0.5 GW of ocean capacity consists of tidal barrage projects. Other test and demonstration projects represent a small part of total ocean capacity.
Figure 50 Ocean power capacity and forecast by region (GW)
2013 2014 2015 2016 2017 2018 2019 2020 OECD 0.5 0.5 0.5 0.5 0.7 0.9 1.0 1.0
OECD Americas 0.0 0.0 0.0 0.0 0.0 0.0 0.0 0.0 OECD Asia Oceania 0.3 0.3 0.3 0.3 0.4 0.6 0.7 0.7 OECD Europe 0.3 0.3 0.3 0.3 0.3 0.3 0.3 0.3
Non-OECD 0.0 0.0 0.0 0.0 0.0 0.0 0.0 0.0 Africa – – – – – – – – Non-OECD Asia – – – – – – – – China 0.0 0.0 0.0 0.0 0.0 0.0 0.0 0.0 Non-OECD Europe – – – – – – – – Non-OECD Americas – – – – – – – – Middle East – – – – – – – –
Total 0.5 0.5 0.5 0.5 0.7 0.9 1.0 1.0
Sources: 2013 OECD capacity derived from IEA (2015c), “OECD - Net capacity of renewables”, IEA Renewables Information Statistics (database). Over the medium term, ocean energy should expand by around 0.51 GW, with a cumulative capacity reaching around 1.04 GW in 2020. Thus, global ocean capacity should double by 2020. The global outlook is in line with the MTRMR 2014, with OECD countries such as Canada, France, Korea and the
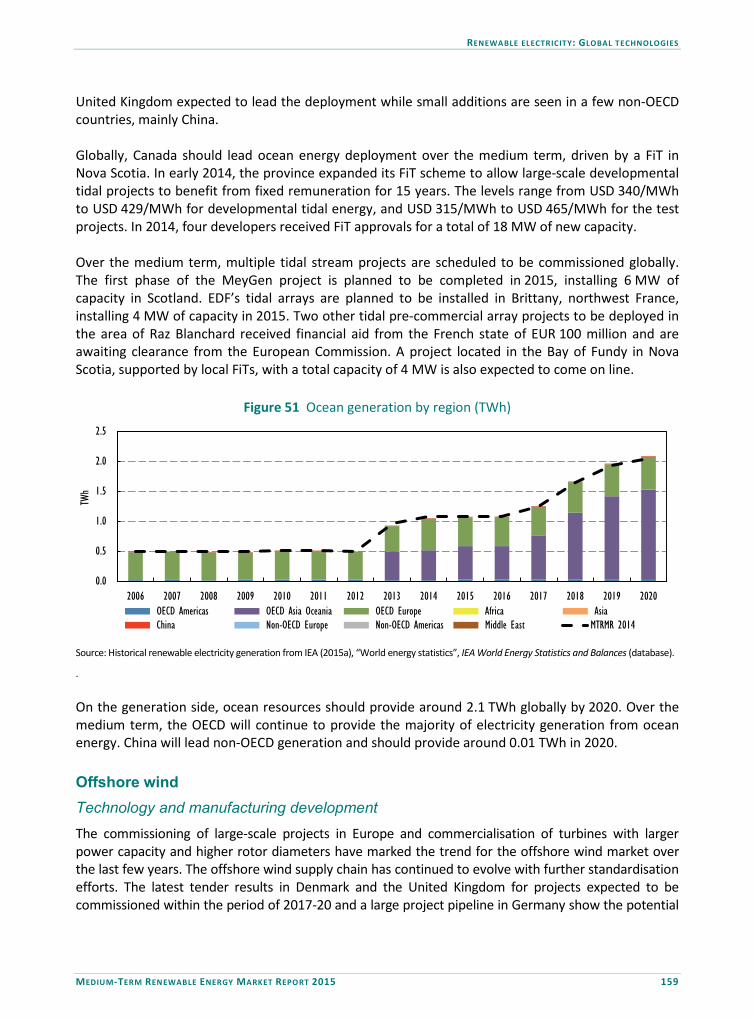
RENEWABLE ELECTRICITY: GLOBAL TECHNOLOGIES
MEDIUM-TERM RENEWABLE ENERGY MARKET REPORT 2015 159
United Kingdom expected to lead the deployment while small additions are seen in a few non-OECD countries, mainly China. Globally, Canada should lead ocean energy deployment over the medium term, driven by a FiT in Nova Scotia. In early 2014, the province expanded its FiT scheme to allow large-scale developmental tidal projects to benefit from fixed remuneration for 15 years. The levels range from USD 340/MWh to USD 429/MWh for developmental tidal energy, and USD 315/MWh to USD 465/MWh for the test projects. In 2014, four developers received FiT approvals for a total of 18 MW of new capacity. Over the medium term, multiple tidal stream projects are scheduled to be commissioned globally. The first phase of the MeyGen project is planned to be completed in 2015, installing 6 MW of capacity in Scotland. EDF’s tidal arrays are planned to be installed in Brittany, northwest France, installing 4 MW of capacity in 2015. Two other tidal pre-commercial array projects to be deployed in the area of Raz Blanchard received financial aid from the French state of EUR 100 million and are awaiting clearance from the European Commission. A project located in the Bay of Fundy in Nova Scotia, supported by local FiTs, with a total capacity of 4 MW is also expected to come on line.
Figure 51 Ocean generation by region (TWh)
0.0
0.5
1.0
1.5
2.0
2.5
2006 2007 2008 2009 2010 2011 2012 2013 2014 2015 2016 2017 2018 2019 2020
TWh
OECD Americas OECD Asia Oceania OECD Europe Africa Asia China Non-OECD Europe Non-OECD Americas Middle East MTRMR 2014
Source: Historical renewable electricity generation from IEA (2015a), “World energy statistics”, IEA World Energy Statistics and Balances (database).
. On the generation side, ocean resources should provide around 2.1 TWh globally by 2020. Over the medium term, the OECD will continue to provide the majority of electricity generation from ocean energy. China will lead non-OECD generation and should provide around 0.01 TWh in 2020. Offshore wind Technology and manufacturing development
The commissioning of large-scale projects in Europe and commercialisation of turbines with larger power capacity and higher rotor diameters have marked the trend for the offshore wind market over the last few years. The offshore wind supply chain has continued to evolve with further standardisation efforts. The latest tender results in Denmark and the United Kingdom for projects expected to be commissioned within the period of 2017-20 and a large project pipeline in Germany show the potential

RENEWABLE ELECTRICITY: GLOBAL TECHNOLOGIES
160 MEDIUM-TERM RENEWABLE ENERGY MARKET REPORT 2015
for a significant cost decrease over the medium term. Still, grid connection delays and the need for a long-term stable market and regulatory environment remain current challenges to deployment. In 2014, several European manufacturers decided to start serial production of large-scale turbines. Over the last year, Siemens announced the production of its 6 MW turbine, which is already installed for the Westermost Rough project (210 MW in the United Kingdom will be delivered to more projects over 2016-18). In addition, the company announced an uprated version of the turbine with a capacity of 7 MW that is already the preferred option for some projects in the United Kingdom, including Walney Extension 2. MHI Vestas (an offshore joint venture between Vestas and Mitsubishi Heavy Industries) signed its first contract to deliver its 8 MW turbine to an onshore project for the final testing. The company already signed a firm contract to deliver 8 MW turbines to the Burbo Bank Extension offshore project by 2018. In January 2015, Alstom received a final test certification of its 6 MW Haliade turbine to start its serial production, which will be delivered to the first French offshore project in 2018-20. In July 2014, Areva and Gamesa finalised their offshore wind joint venture called Adwen. The company’s 8 MW turbine is the preferred option for the Le Tréport and Noirmoutier projects off the French coast with its serial production planned to start in 2017/18. For Asian manufacturers, mixed developments were observed over the last year. Ming Yang obtained an approval to test its 6 MW two-blade prototype turbine in the east of China. The company also signed an agreement with Norway’s Marine Energy Test Centre to install the same turbine for testing purposes. Sinovel completed its first offshore project installing 6 MW turbines in 2014. However, many of company’s projects are on hold waiting for approval from local governments. In Korea, Samsung Heavy Industries cancelled its participation in the Korean 1.9 GW offshore tender. Hyundai and Hyosung also decided to pull out from the same project. In addition, Daewoo Shipbuilding and Marine Engineering (DSME) made an announcement that it froze the testing of the 7 MW turbine without any prospects. With the decreasing activity in the offshore oil industry due to lower oil prices, some vessels serving the oil and gas industries will likely be available for upcoming construction of offshore wind projects. However, the demand for more specific installation vessels has increased as new generation of turbines have larger generators, longer blades and higher towers. These turbines require more sophisticated installation vessels. In this respect, the competition between the oil and offshore wind industries is seen to be limited over the medium term as the majority of vessels might not be a good fit for large-scale offshore installations. Few new specialised vessels are expected to come on line over the medium term. In the short term, Seajacks’ largest offshore wind turbine installation vessel, being built by Samsung Heavy Industries in Korea, is expected to be delivered by the end of 2015. Over the medium term, specialised vessel availability could pose a minor challenge to deployment depending on the pace of construction of new projects. Offshore wind investment costs vary significantly depending on the project’s distance to shore, its water depth, the topography of the seabed and grid connection time. At the end of 2014, the average water depth of operational wind farms was 22.4 m and the average distance to shore 32.9 km in Europe (EWEA, 2015). However, the majority of planned projects are expected to be installed farther from the coast in deeper waters. Projects installed in the Atlantic Ocean usually face more challenging seabed conditions compared with those deployed in the North and Baltic Seas. Current system costs range from USD 4 000/kW to USD 5 250/kW. This cost range includes both onshore and offshore electrical infrastructure required to commission a project. Total investment costs are highly variable and project-specific. However, it is important to highlight the dynamics behind these
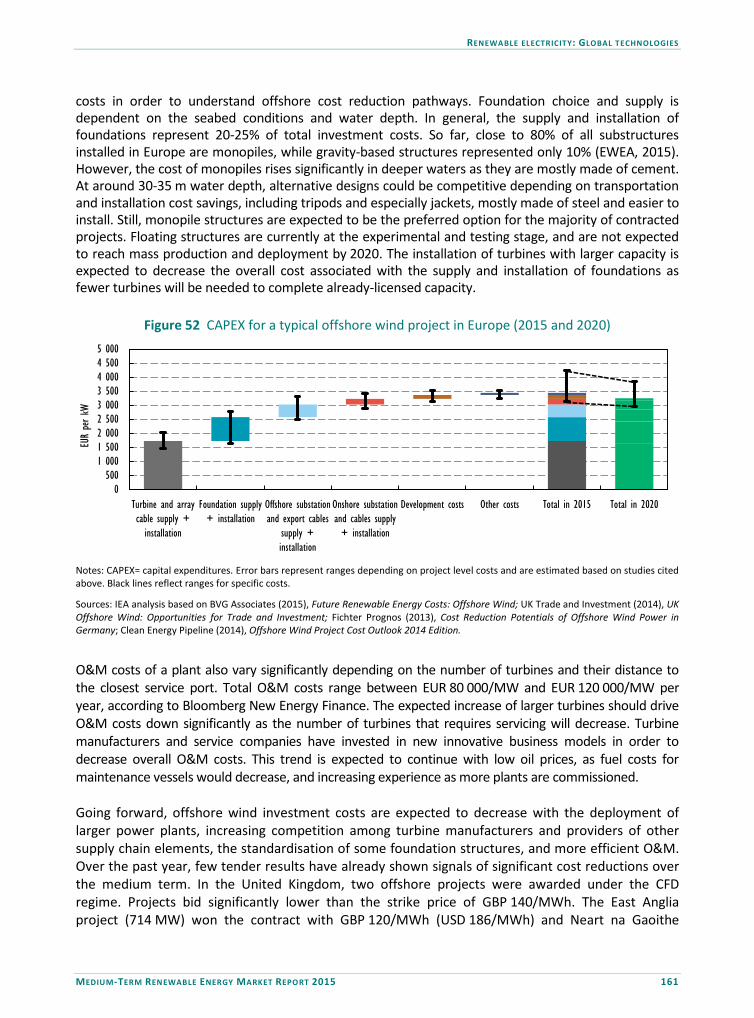
RENEWABLE ELECTRICITY: GLOBAL TECHNOLOGIES
MEDIUM-TERM RENEWABLE ENERGY MARKET REPORT 2015 161
costs in order to understand offshore cost reduction pathways. Foundation choice and supply is dependent on the seabed conditions and water depth. In general, the supply and installation of foundations represent 20-25% of total investment costs. So far, close to 80% of all substructures installed in Europe are monopiles, while gravity-based structures represented only 10% (EWEA, 2015). However, the cost of monopiles rises significantly in deeper waters as they are mostly made of cement. At around 30-35 m water depth, alternative designs could be competitive depending on transportation and installation cost savings, including tripods and especially jackets, mostly made of steel and easier to install. Still, monopile structures are expected to be the preferred option for the majority of contracted projects. Floating structures are currently at the experimental and testing stage, and are not expected to reach mass production and deployment by 2020. The installation of turbines with larger capacity is expected to decrease the overall cost associated with the supply and installation of foundations as fewer turbines will be needed to complete already-licensed capacity.
Figure 52 CAPEX for a typical offshore wind project in Europe (2015 and 2020)
0 500
1 0001 5002 0002 5003 0003 5004 0004 5005 000
Turbine and arraycable supply +
installation
Foundation supply+ installation
Offshore substationand export cables
supply +installation
Onshore substationand cables supply+ installation
Development costs Other costs Total in 2015 Total in 2020
EUR
per k
W
Notes: CAPEX= capital expenditures. Error bars represent ranges depending on project level costs and are estimated based on studies cited above. Black lines reflect ranges for specific costs.
Sources: IEA analysis based on BVG Associates (2015), Future Renewable Energy Costs: Offshore Wind; UK Trade and Investment (2014), UK Offshore Wind: Opportunities for Trade and Investment; Fichter Prognos (2013), Cost Reduction Potentials of Offshore Wind Power in Germany; Clean Energy Pipeline (2014), Offshore Wind Project Cost Outlook 2014 Edition.
O&M costs of a plant also vary significantly depending on the number of turbines and their distance to the closest service port. Total O&M costs range between EUR 80 000/MW and EUR 120 000/MW per year, according to Bloomberg New Energy Finance. The expected increase of larger turbines should drive O&M costs down significantly as the number of turbines that requires servicing will decrease. Turbine manufacturers and service companies have invested in new innovative business models in order to decrease overall O&M costs. This trend is expected to continue with low oil prices, as fuel costs for maintenance vessels would decrease, and increasing experience as more plants are commissioned. Going forward, offshore wind investment costs are expected to decrease with the deployment of larger power plants, increasing competition among turbine manufacturers and providers of other supply chain elements, the standardisation of some foundation structures, and more efficient O&M. Over the past year, few tender results have already shown signals of significant cost reductions over the medium term. In the United Kingdom, two offshore projects were awarded under the CFD regime. Projects bid significantly lower than the strike price of GBP 140/MWh. The East Anglia project (714 MW) won the contract with GBP 120/MWh (USD 186/MWh) and Neart na Gaoithe

RENEWABLE ELECTRICITY: GLOBAL TECHNOLOGIES
162 MEDIUM-TERM RENEWABLE ENERGY MARKET REPORT 2015
(448 MW) with GBP 114/MWh (USD 180/MWh), both expected to be commissioned before 2020. These results show that prices in the United Kingdom decreased by 15-20% compared with previous remuneration levels under the RO certificates.
Box 4 Offshore wind transmission cost drivers: An example from the United Kingdom
Electrical and grid infrastructure represent 15-25% of overall investment costs. This report includes all electrical connection costs whether they are paid by developer, utility, rate payer or third party. The ownership and cost structure of grid costs will be discussed later with country examples. In general, electrical infrastructure of an offshore wind project includes offshore substation, export cables, onshore substation and onshore cables. In addition, array cables are necessary to connect turbines to offshore substations. Usually the size of the plant and the number of turbines dictate the number of offshore substations required. In general, plants with more than 350-400 MW turbines may require two substations, depending on overall output and areal distribution of turbines. An offshore plant’s distance to the closest shore is only one variable for the overall connection cost calculation. In many cases, the location of onshore substations is different from the plant’s distance to the closest shore or servicing port. This case would require a longer export cable and higher costs.
Another factor is the location of the onshore substation. In several cases, the onshore substation is far from the coast, requiring longer onshore connection cables that result in additional costs. The total cost of array cables depends on the number of turbines and their in-between distance. In the United Kingdom, transmission asset transfer tenders, which include onshore substations, export cables and offshore substations, show significant price variations per megawatt installed, depending on variables mentioned above, ranging from GBP 0.38 million (USD 0.62 million) to GBP 1.2 million (USD 2 million).
Figure 53 UK offshore transmission asset transfer value (GBP) for 15 projects, project distance to shore (bubble size) and total cabling (km)
0
100
200
300
400
500
600
0 50 100 150 200 250 300 350 400 450
Total
tran
sfer v
alue (GBP
)
Total (on+offshore) cables (km)
bubble size = distance to shore
Source: OFGEM (2013, 2014, 2015), Offshore Transmission: Cost Assessment for Robin Rigg, Sheringham Shoal, Barrow, Greater Gabbard, Gunfleet Sands 1 and 2, Ormonde, Thnaet, Walney 1, Walney 2, Lincs, London Array, West of Duddon Sands, GWynt y Mor, Westermost Rough, Humber Gateway, OFGEM, London. In February 2015, Denmark concluded the tender of the Horns Rev 3 wind plant (400 MW). Vattenfall won the tender with EUR 103/MWh (USD 117/MWh) for 20 TWh (50 000 full-load hours for 400 MW capacity) to be fully commissioned no later than January 2020. In addition, the winning bid will not be adjusted or indexed to inflation. With 47% capacity factor assumed, the plant will receive FiT for only 11-12 years while for the rest of its 25-year lifetime, Horns Rev 3 will sell electricity to DK1 pricing point of the Nord Pool electricity exchange. Over the last year, DK1 monthly average day-
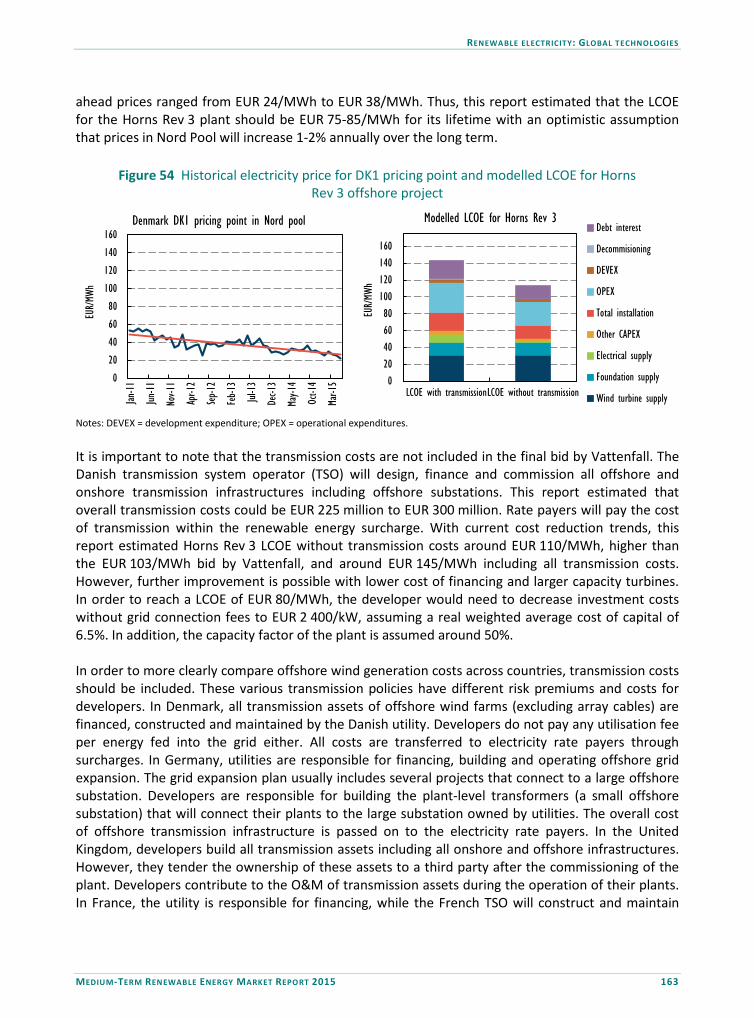
RENEWABLE ELECTRICITY: GLOBAL TECHNOLOGIES
MEDIUM-TERM RENEWABLE ENERGY MARKET REPORT 2015 163
ahead prices ranged from EUR 24/MWh to EUR 38/MWh. Thus, this report estimated that the LCOE for the Horns Rev 3 plant should be EUR 75-85/MWh for its lifetime with an optimistic assumption that prices in Nord Pool will increase 1-2% annually over the long term.
Figure 54 Historical electricity price for DK1 pricing point and modelled LCOE for Horns Rev 3 offshore project
0
20
40
60
80
100
120
140
160
Jan-11
Jun-11
Nov-1
1
Apr-1
2
Sep-12
Feb-1
3
Jul-13
Dec-1
3
May-1
4
Oct-1
4
Mar-1
5
EUR/MW
h
Denmark DK1 pricing point in Nord pool
0 20 40 60 80
100 120 140 160
LCOE with transmissionLCOE without transmission
EUR/MW
h
Modelled LCOE for Horns Rev 3Debt interest
Decommisioning
DEVEX
OPEX
Total installation
Other CAPEX
Electrical supply
Foundation supply
Wind turbine supply Notes: DEVEX = development expenditure; OPEX = operational expenditures. It is important to note that the transmission costs are not included in the final bid by Vattenfall. The Danish transmission system operator (TSO) will design, finance and commission all offshore and onshore transmission infrastructures including offshore substations. This report estimated that overall transmission costs could be EUR 225 million to EUR 300 million. Rate payers will pay the cost of transmission within the renewable energy surcharge. With current cost reduction trends, this report estimated Horns Rev 3 LCOE without transmission costs around EUR 110/MWh, higher than the EUR 103/MWh bid by Vattenfall, and around EUR 145/MWh including all transmission costs. However, further improvement is possible with lower cost of financing and larger capacity turbines. In order to reach a LCOE of EUR 80/MWh, the developer would need to decrease investment costs without grid connection fees to EUR 2 400/kW, assuming a real weighted average cost of capital of 6.5%. In addition, the capacity factor of the plant is assumed around 50%. In order to more clearly compare offshore wind generation costs across countries, transmission costs should be included. These various transmission policies have different risk premiums and costs for developers. In Denmark, all transmission assets of offshore wind farms (excluding array cables) are financed, constructed and maintained by the Danish utility. Developers do not pay any utilisation fee per energy fed into the grid either. All costs are transferred to electricity rate payers through surcharges. In Germany, utilities are responsible for financing, building and operating offshore grid expansion. The grid expansion plan usually includes several projects that connect to a large offshore substation. Developers are responsible for building the plant-level transformers (a small offshore substation) that will connect their plants to the large substation owned by utilities. The overall cost of offshore transmission infrastructure is passed on to the electricity rate payers. In the United Kingdom, developers build all transmission assets including all onshore and offshore infrastructures. However, they tender the ownership of these assets to a third party after the commissioning of the plant. Developers contribute to the O&M of transmission assets during the operation of their plants. In France, the utility is responsible for financing, while the French TSO will construct and maintain

RENEWABLE ELECTRICITY: GLOBAL TECHNOLOGIES
164 MEDIUM-TERM RENEWABLE ENERGY MARKET REPORT 2015
offshore transmission expansion. The CAPEX of the transmission investment plus 7% cost of financing is added as part of the FiT. The overall cost of the FiT is passed on to the electricity rate payers.
Table 33 Offshore transmission asset cost allocation, ownership and connection risks
Germany United Kingdom Denmark France
Onshore infrastructure
Financed, constructed by the TSO
Financed, constructed by the developer
Financed, constructed by the TSO
Financed, constructed by the TSO
Offshore infrastructure
Financed, constructed by the TSO
Financed, constructed by the developer
Financed, constructed by the TSO
Cables financed by the developer but constructed and operated by the TSO. Substation is financed, constructed by the developer
Ownership after project completion
TSO owns onshore and offshore transmission assets until plant-level transformer substation
Assets sold to a third party, owns all onshore and offshore transmission assets including offshore substation
TSO owns onshore and offshore transmission assets including offshore substation
TSO owns onshore and offshore transmission assets excluding offshore substation
Usage of transmission assets
No usage fees Developer pays usage per kilowatt hour
No usage fees No usage fees
Final costs passed on to
Electricity rate payers via surcharge
Electricity rate payers via surcharge
Electricity rate payers via surcharge
Electricity rate payers via surcharge
Risk of grid connection delays
High – grid expansion delays can cause delays for several projects
Low – grid infrastructure and plant construction are built at the same time
Mid-high – grid connection delays may cause plant-level commissioning delays
Medium – grid and plant are constructed at the same time but grid connection delay still possible
This report expects significant offshore wind generation cost reductions over the medium term with increasing competition and standardisation from more large projects coming on line. Current generation costs in Europe are estimated at USD 200/MWh to USD 265/MWh including all transmission costs. In 2020, generation cost of offshore wind power should reach USD 165/MWh. Turbines have the largest cost reduction potential as they still consist of the majority of investment costs, and increasing competition among offshore turbine manufacturers should reduce prices over the medium term. In addition, increasing generator capacity of turbine is expected to decrease significantly construction costs as fewer foundations and array cables will be required. Floating offshore wind may offer innovative solutions in the years to come, including with vertical-axis turbines, a design that has been outpaced on shore but may have some advantages on floating platforms. Market status and outlook In 2014, global offshore wind generated an estimated 25 TWh, 20% higher than in 2013. In 2014, global installed capacity of offshore wind reached over 8.8 GW, with 1.7 GW of new additions versus 2012, around 350 MW higher than the MTRMR 2014 forecast. This is mainly due to the early
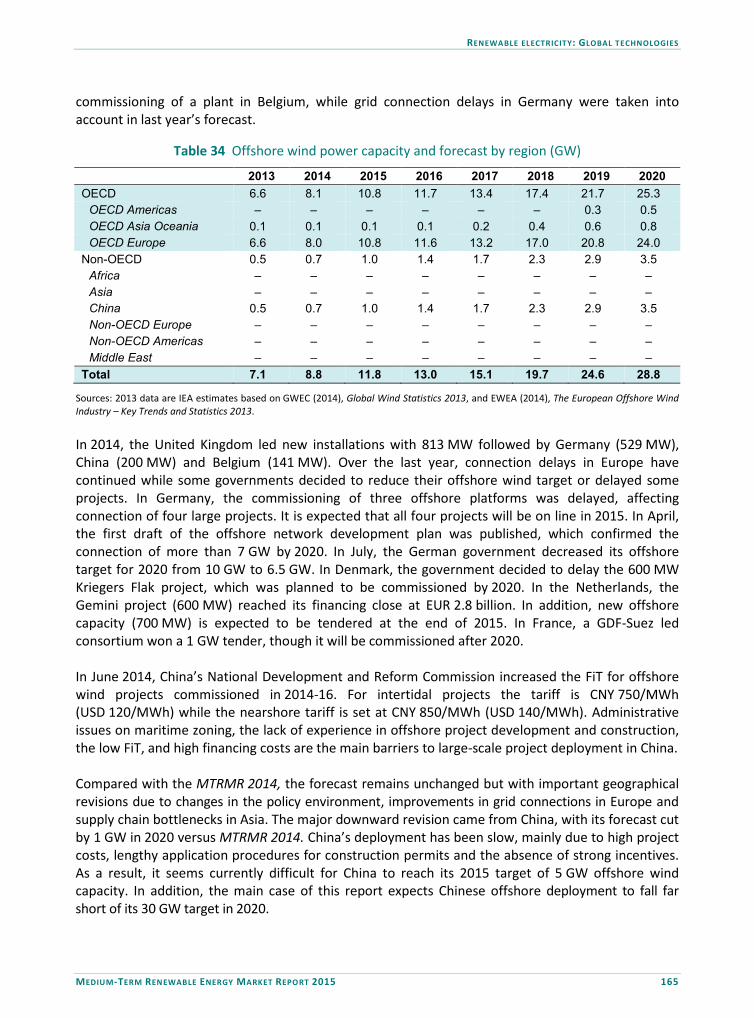
RENEWABLE ELECTRICITY: GLOBAL TECHNOLOGIES
MEDIUM-TERM RENEWABLE ENERGY MARKET REPORT 2015 165
commissioning of a plant in Belgium, while grid connection delays in Germany were taken into account in last year’s forecast.
Table 34 Offshore wind power capacity and forecast by region (GW)
2013 2014 2015 2016 2017 2018 2019 2020 OECD 6.6 8.1 10.8 11.7 13.4 17.4 21.7 25.3
OECD Americas – – – – – – 0.3 0.5 OECD Asia Oceania 0.1 0.1 0.1 0.1 0.2 0.4 0.6 0.8 OECD Europe 6.6 8.0 10.8 11.6 13.2 17.0 20.8 24.0
Non-OECD 0.5 0.7 1.0 1.4 1.7 2.3 2.9 3.5 Africa – – – – – – – – Asia – – – – – – – – China 0.5 0.7 1.0 1.4 1.7 2.3 2.9 3.5 Non-OECD Europe – – – – – – – – Non-OECD Americas – – – – – – – – Middle East – – – – – – – –
Total 7.1 8.8 11.8 13.0 15.1 19.7 24.6 28.8
Sources: 2013 data are IEA estimates based on GWEC (2014), Global Wind Statistics 2013, and EWEA (2014), The European Offshore Wind Industry – Key Trends and Statistics 2013. In 2014, the United Kingdom led new installations with 813 MW followed by Germany (529 MW), China (200 MW) and Belgium (141 MW). Over the last year, connection delays in Europe have continued while some governments decided to reduce their offshore wind target or delayed some projects. In Germany, the commissioning of three offshore platforms was delayed, affecting connection of four large projects. It is expected that all four projects will be on line in 2015. In April, the first draft of the offshore network development plan was published, which confirmed the connection of more than 7 GW by 2020. In July, the German government decreased its offshore target for 2020 from 10 GW to 6.5 GW. In Denmark, the government decided to delay the 600 MW Kriegers Flak project, which was planned to be commissioned by 2020. In the Netherlands, the Gemini project (600 MW) reached its financing close at EUR 2.8 billion. In addition, new offshore capacity (700 MW) is expected to be tendered at the end of 2015. In France, a GDF-Suez led consortium won a 1 GW tender, though it will be commissioned after 2020. In June 2014, China’s National Development and Reform Commission increased the FiT for offshore wind projects commissioned in 2014-16. For intertidal projects the tariff is CNY 750/MWh (USD 120/MWh) while the nearshore tariff is set at CNY 850/MWh (USD 140/MWh). Administrative issues on maritime zoning, the lack of experience in offshore project development and construction, the low FiT, and high financing costs are the main barriers to large-scale project deployment in China. Compared with the MTRMR 2014, the forecast remains unchanged but with important geographical revisions due to changes in the policy environment, improvements in grid connections in Europe and supply chain bottlenecks in Asia. The major downward revision came from China, with its forecast cut by 1 GW in 2020 versus MTRMR 2014. China’s deployment has been slow, mainly due to high project costs, lengthy application procedures for construction permits and the absence of strong incentives. As a result, it seems currently difficult for China to reach its 2015 target of 5 GW offshore wind capacity. In addition, the main case of this report expects Chinese offshore deployment to fall far short of its 30 GW target in 2020.

RENEWABLE ELECTRICITY: GLOBAL TECHNOLOGIES
166 MEDIUM-TERM RENEWABLE ENERGY MARKET REPORT 2015
Figure 55 Offshore wind generation forecast by region (TWh)
0 10 20 30 40 50 60 70 80 90
100
2006 2007 2008 2009 2010 2011 2012 2013 2014 2015 2016 2017 2018 2019 2020
TWh
OECD Americas OECD Asia Oceania OECD Europe Africa Asia China Non-OECD Europe Non-OECD Americas Middle East MTRMR 2014
Korea’s forecast was also revised down by 400 MW in 2020 versus MTRMR 2014. The lack of activity and supply chain developments related to Korean turbine manufacturers are the main reasons behind this revision. Other downward revisions stem from the United States with the cancellation of the Cape Wind PPA, and slower-than-expected activity in Sweden, Norway and the Netherlands due to project delays. Although the German offshore market has been affected by uncertainties over the new incentive regime, this report expects further connection improvements after the draft grid expansion plan published in 2014. With a large project pipeline and activity over the last year, German offshore capacity was revised up by 2 GW in 2020. Also, projects granted grid connection capacity before 2016 can still secure remuneration under its renewable energy sources act (EEG 2014) if completed before 2020. In addition, the low cost of financing and decreasing costs should support the deployment over the medium term. Another upward revision stems from France, with faster developments concerning environmental impact assessments, permitting and supply chain for projects awarded in the first tender. France’s forecast is revised up by 300 MW in 2020 as larger capacity from the first tender is expected to be operational. Overall, global offshore wind power capacity is expected to expand from 9 GW in 2014 to 29 GW in 2020. Market status and outlook – accelerated case Under the accelerated case conditions described earlier in the regional chapters, global cumulative offshore wind capacity could reach 32 GW to 34 GW in 2020. Achieving enhanced deployment would mostly require timely grid connection of offshore projects in OECD Europe and faster-than-expected cost reductions in Asia. In addition, faster commercialisation of floating structures should support the accelerated case in Japan and Korea. China’s accelerated case for offshore wind would require smoother administrative procedures for offshore licences in addition to cost decreases. Onshore wind Technology and manufacturing development Onshore wind is a proven, mature technology with an extensive global supply chain. In some countries, onshore wind is also referred to as land-based wind, mainly installations that are located
RENEWABLE ELECTRICITY: GLOBAL TECHNOLOGIES
MEDIUM-TERM RENEWABLE ENERGY MARKET REPORT 2015 167
inland, far from the shore. The onshore technology has evolved over the last five years to maximise electricity produced per megawatt capacity installed. Machines have become bigger with taller hub heights, larger rotor diameters and in some cases bigger generators depending on the wind and site-specific conditions. Currently manufacturers offer utility-scale turbines with rotor diameters ranging from 50 m to 125 m, generators from 1.5 MW to 3.5 MW and hub heights from 90 m to 150 m. In addition, some manufacturers have started to offer 4-5 MW platforms over the last year. Meanwhile, the largest generator capacity of a single installed onshore wind turbine reached 7.5 MW. The wind manufacturing industry has focused on larger turbines following three main trends. First, the number of high-wind sites has been decreasing in some countries, such as Germany and Denmark, where wind energy deployment started in the late 1980s and 1990s. Second, profit margins of wind developers have been squeezed with decreasing incentives in some countries. Third, the introduction of tender schemes in new markets increased competition pressure. New turbines with greater swept area per megawatt have unlocked low- and medium-wind sites where capacity factors can reach up to 35%. In Germany, the average rotor diameter of new turbines installed in the south of Germany (mostly low-speed sites) was over 135 m, while in the north it was just below 100 m. In the United States, turbines with rotor diameters larger than 100 m have dominated the market since 2013. In 2014, around half of the turbines installed had rotor diameters larger than 100 m (Deutsche WindGuard, 2015). Over 90% of turbines installed in the Great Lakes Region over 2012-14 were low- and medium-wind turbines (DOE, 2015). The ongoing cost reduction and consolidation in the wind turbine manufacturing industry has resulted in increasing profit margins and sales. Over the last year, equity prices of publicly traded turbine manufacturers have shown significant gains. In 2014, new order intakes for most large European and American manufacturers were higher than in 2013. For instance, Gamesa’s orders were increased by over 120% (Gamesa, 2015), Nordex by 40% (Nordex, 2015), GE by 26% and Vestas by 12% in 2014 (Vestas, 2015). For Asian manufacturers, results were mixed, but the outlook is more optimistic. Having defaulted on foreign currency convertible bonds worth of USD 200 million in October 2012, Suzlon has restructured its debt and finally completed the sale of Senvion (the former German turbine manufacturer that was fully acquired by Suzlon in 2011) to Centerbridge Partners for USD 1 billion. Suzlon’s sales are expected to pick up with the expected wind energy growth in the Indian market over the medium term, improving the company’s position. With Chinese developers rushing to finish their projects before the FiT cut, demand for turbines in China increased in 2014. As a result, large Chinese manufacturers’ turbine sales and deliveries soared. Goldwin, increased its sales by 78% while Ming Yang’s annual revenue more than doubled with close to 1.9 GW sold, 110% higher than in 2013. Having reported negative net profits in 2012 and 2013, Sinovel posted profits for 2014, according to unaudited results. Still, China’s turbine manufacturing capacity is estimated close to 35-40 GW with only 23-26 GW domestic capacity expected annually over 2014-20 (BNEF, 2015). Thus, some market consolidation is expected over the medium term. In addition, the National Energy Administration (NEA) introduced new quality standards that aim at improving the reliability of turbines installed in China. All new turbines are expected to comply with the rules that came into force in July 2015. Wind turbine prices
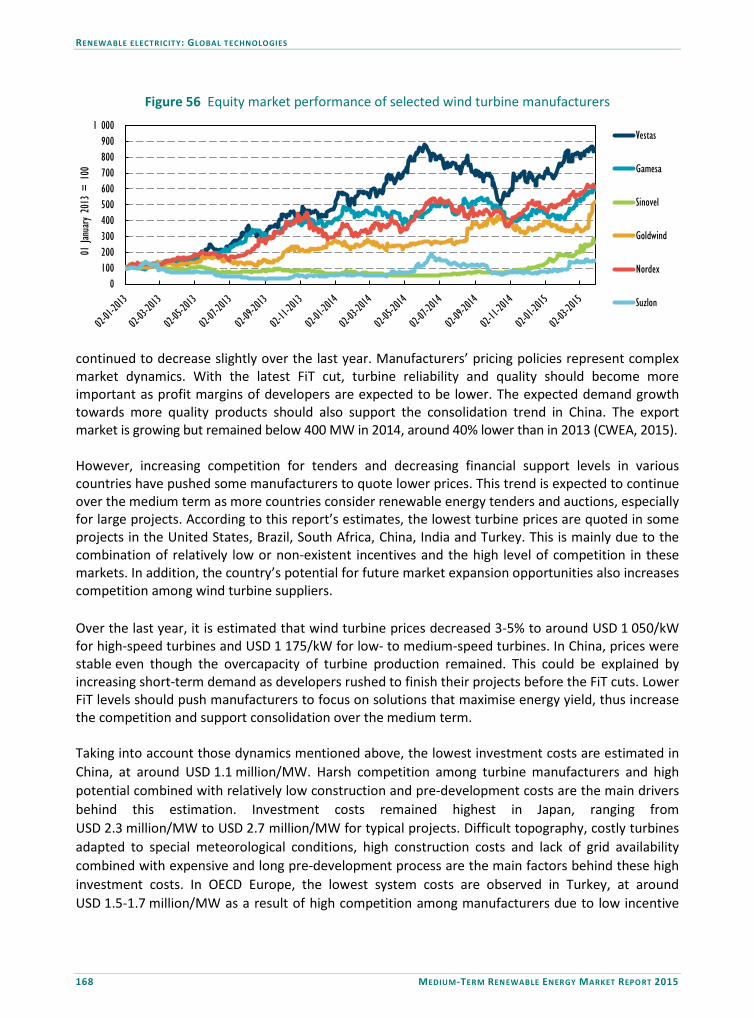
RENEWABLE ELECTRICITY: GLOBAL TECHNOLOGIES
168 MEDIUM-TERM RENEWABLE ENERGY MARKET REPORT 2015
Figure 56 Equity market performance of selected wind turbine manufacturers
0 100 200 300 400 500 600 700 800 900
1 000
01 Ja
nuary 20
13 =
100
Vestas
Gamesa
Sinovel
Goldwind
Nordex
Suzlon
continued to decrease slightly over the last year. Manufacturers’ pricing policies represent complex market dynamics. With the latest FiT cut, turbine reliability and quality should become more important as profit margins of developers are expected to be lower. The expected demand growth towards more quality products should also support the consolidation trend in China. The export market is growing but remained below 400 MW in 2014, around 40% lower than in 2013 (CWEA, 2015). However, increasing competition for tenders and decreasing financial support levels in various countries have pushed some manufacturers to quote lower prices. This trend is expected to continue over the medium term as more countries consider renewable energy tenders and auctions, especially for large projects. According to this report’s estimates, the lowest turbine prices are quoted in some projects in the United States, Brazil, South Africa, China, India and Turkey. This is mainly due to the combination of relatively low or non-existent incentives and the high level of competition in these markets. In addition, the country’s potential for future market expansion opportunities also increases competition among wind turbine suppliers. Over the last year, it is estimated that wind turbine prices decreased 3-5% to around USD 1 050/kW for high-speed turbines and USD 1 175/kW for low- to medium-speed turbines. In China, prices were stable even though the overcapacity of turbine production remained. This could be explained by increasing short-term demand as developers rushed to finish their projects before the FiT cuts. Lower FiT levels should push manufacturers to focus on solutions that maximise energy yield, thus increase the competition and support consolidation over the medium term. Taking into account those dynamics mentioned above, the lowest investment costs are estimated in China, at around USD 1.1 million/MW. Harsh competition among turbine manufacturers and high potential combined with relatively low construction and pre-development costs are the main drivers behind this estimation. Investment costs remained highest in Japan, ranging from USD 2.3 million/MW to USD 2.7 million/MW for typical projects. Difficult topography, costly turbines adapted to special meteorological conditions, high construction costs and lack of grid availability combined with expensive and long pre-development process are the main factors behind these high investment costs. In OECD Europe, the lowest system costs are observed in Turkey, at around USD 1.5-1.7 million/MW as a result of high competition among manufacturers due to low incentive

RENEWABLE ELECTRICITY: GLOBAL TECHNOLOGIES
MEDIUM-TERM RENEWABLE ENERGY MARKET REPORT 2015 169
levels. In the European Union, system costs can range between USD 1.7 million/MW and USD 2.2 million/MW. In the United States, costs can be as low as USD 1.5 million/MW for projects larger than 150 MW, while higher costs are observed for small-scale projects.
Box 5 Drivers of balance-of-system costs for onshore wind projects
Onshore wind investment costs can vary significantly among countries and regions. Although in general, turbine costs represent the majority of the overall investment costs (65-80% depending on the country and location), costs associated with construction, grid connection and pre-development also contribute. While competition, local production and market potential are major indicators of country-level turbine pricing, the drivers for other system costs are more complex.
Country-specific policies play an important role in balance-of-system (BOS) costs in a wind project. For grid connection, costs to developers can vary significantly. In some countries, all grid costs are paid by the developer, while in others grid expansion costs are shared between utilities and project developers. Rarely, utilities are responsible for the majority of grid connection costs. The availability of grid could also represent an important challenge to wind project development. In some countries such as Brazil, Chile and Uruguay, connection delays up to 1.5 years could be observed. In other cases (e.g. Turkey), utilities can auction off available grid capacity because the demand in certain locations is higher than the availability. Thus grid operators expect developers to bid for connection capacity, which increases overall grid costs.
Construction costs mostly depend on country-specific labour and material costs. However, the topography of a project site might change the construction costs significantly. Isolated sites far away from demand centres and/or projects in mountainous areas may require extensive civil works, which usually result in higher construction and transportation costs. The majority of pre-development costs are not dependent on the project size. Thus, projects that are subject to relatively strict siting and zoning policies that do not allow large-scale wind projects (+40 MW) might result in higher costs per installed capacity. The number and costs of required permits can represent an important challenge to wind project development. In addition, some countries require specific licences for renewable electricity production, which usually either have a fixed price per installed capacity or are auctioned off.
Globally, in the beginning of 2015, typical LCOEs ranged from USD 60/MWh to USD 140/MWh. In the majority of countries having some deployment experience, LCOEs for onshore wind projects are USD 70-80/MWh. The lowest LCOEs are estimated in some large sites in Brazil and the United States where capacity factors can be close to 50% and developers were able to obtain low interest rates. Without the PTC, PPAs in the United States ranged around USD 46-48/MWh with the majority signed in the interior region (DOE, 2015). In Brazil, wind projects that signed PPAs as low as USD 45/MWh came on line in 2014. Although China has one of the lowest system costs in the world, developers face grid connection and curtailment challenges, which overall result in lower capacity factors and higher cost of capital. In 2014, LCOEs in China were USD 64-84/MWh. In India, wind projects have, in general, high financing costs and low capacity factors ranging from 17-23%, which result in relatively higher LCOEs even though systems costs are slightly higher than in China. In Germany, projects have LCOEs as low as USD 65/MWh in good sites while typical costs range from USD 75-100/MWh.

RENEWABLE ELECTRICITY: GLOBAL TECHNOLOGIES
170 MEDIUM-TERM RENEWABLE ENERGY MARKET REPORT 2015
Figure 57 Typical onshore wind total investment costs per kW in selected countries (2010-20)
0
500
1 000
1 500
2 000
2 500
3 000
3 500
2010 2015 2020 2010 2015 2020 2010 2015 2020 2010 2015 2020 2010 2015 2020 2010 2015 2020 2010 2015 2020 2010 2015 2020
China India United States Turkey Brazil South Africa Germany Japan
USD
2014
/kW
Figure 58 Historical and forecasted LCOEs for typical onshore systems, beginning year
0
50
100
150
200
250
2006 2008 2010 2012 2014 2016 2018 2020
USD
2014
/MWh
Brazil PPA Egypt PPA US PPA South Africa Round 4 Market status and outlook In 2014, onshore wind generation increased by 65 TWh to reach over 677 TWh (10% year-on-year). Global cumulative grid-connected capacity stood at 342 GW, around 16% higher than in 2013. New installations were led by China, where around 20 GW was connected to the grid (installed but not -grid-connected capacity was over 23 GW). Additions in the United States picked up with 4.8 GW in new installations after the late extension of the production tax credit in December 2014. OECD Europe added 27 GW of new capacity, 7 GW higher than in 2013 mainly due to record-high installations in Germany (4.75 GW). France and Sweden added around 1 GW each, while installations were strong in Turkey with 800 MW. In OECD non-members, capacity additions grew more than twofold in Brazil with 2.5 GW connected to the grid in 2014. In India, annual capacity additions reached 2.8 GW in 2014, around 15% higher versus 2013. Over the medium term, global onshore wind capacity is expected to grow from 341 GW in 2014 to 603 GW in 2020. Versus MTRMR 2014, the forecast is revised up by 2 GW, mainly due to an upward revision in China and Latin America. However, a significant upside is possible under the accelerated
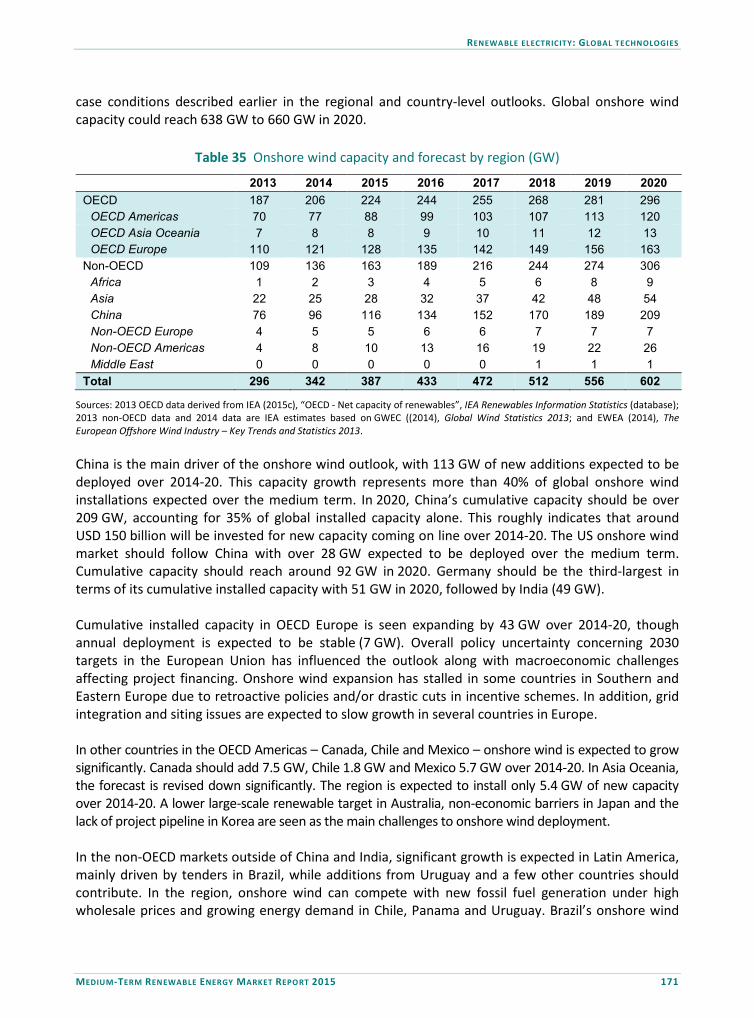
RENEWABLE ELECTRICITY: GLOBAL TECHNOLOGIES
MEDIUM-TERM RENEWABLE ENERGY MARKET REPORT 2015 171
case conditions described earlier in the regional and country-level outlooks. Global onshore wind capacity could reach 638 GW to 660 GW in 2020.
Table 35 Onshore wind capacity and forecast by region (GW)
2013 2014 2015 2016 2017 2018 2019 2020 OECD 187 206 224 244 255 268 281 296
OECD Americas 70 77 88 99 103 107 113 120 OECD Asia Oceania 7 8 8 9 10 11 12 13 OECD Europe 110 121 128 135 142 149 156 163
Non-OECD 109 136 163 189 216 244 274 306 Africa 1 2 3 4 5 6 8 9 Asia 22 25 28 32 37 42 48 54 China 76 96 116 134 152 170 189 209 Non-OECD Europe 4 5 5 6 6 7 7 7 Non-OECD Americas 4 8 10 13 16 19 22 26 Middle East 0 0 0 0 0 1 1 1
Total 296 342 387 433 472 512 556 602
Sources: 2013 OECD data derived from IEA (2015c), “OECD - Net capacity of renewables”, IEA Renewables Information Statistics (database); 2013 non-OECD data and 2014 data are IEA estimates based on GWEC ((2014), Global Wind Statistics 2013; and EWEA (2014), The European Offshore Wind Industry – Key Trends and Statistics 2013. China is the main driver of the onshore wind outlook, with 113 GW of new additions expected to be deployed over 2014-20. This capacity growth represents more than 40% of global onshore wind installations expected over the medium term. In 2020, China’s cumulative capacity should be over 209 GW, accounting for 35% of global installed capacity alone. This roughly indicates that around USD 150 billion will be invested for new capacity coming on line over 2014-20. The US onshore wind market should follow China with over 28 GW expected to be deployed over the medium term. Cumulative capacity should reach around 92 GW in 2020. Germany should be the third-largest in terms of its cumulative installed capacity with 51 GW in 2020, followed by India (49 GW). Cumulative installed capacity in OECD Europe is seen expanding by 43 GW over 2014-20, though annual deployment is expected to be stable (7 GW). Overall policy uncertainty concerning 2030 targets in the European Union has influenced the outlook along with macroeconomic challenges affecting project financing. Onshore wind expansion has stalled in some countries in Southern and Eastern Europe due to retroactive policies and/or drastic cuts in incentive schemes. In addition, grid integration and siting issues are expected to slow growth in several countries in Europe. In other countries in the OECD Americas – Canada, Chile and Mexico – onshore wind is expected to grow significantly. Canada should add 7.5 GW, Chile 1.8 GW and Mexico 5.7 GW over 2014-20. In Asia Oceania, the forecast is revised down significantly. The region is expected to install only 5.4 GW of new capacity over 2014-20. A lower large-scale renewable target in Australia, non-economic barriers in Japan and the lack of project pipeline in Korea are seen as the main challenges to onshore wind deployment. In the non-OECD markets outside of China and India, significant growth is expected in Latin America, mainly driven by tenders in Brazil, while additions from Uruguay and a few other countries should contribute. In the region, onshore wind can compete with new fossil fuel generation under high wholesale prices and growing energy demand in Chile, Panama and Uruguay. Brazil’s onshore wind
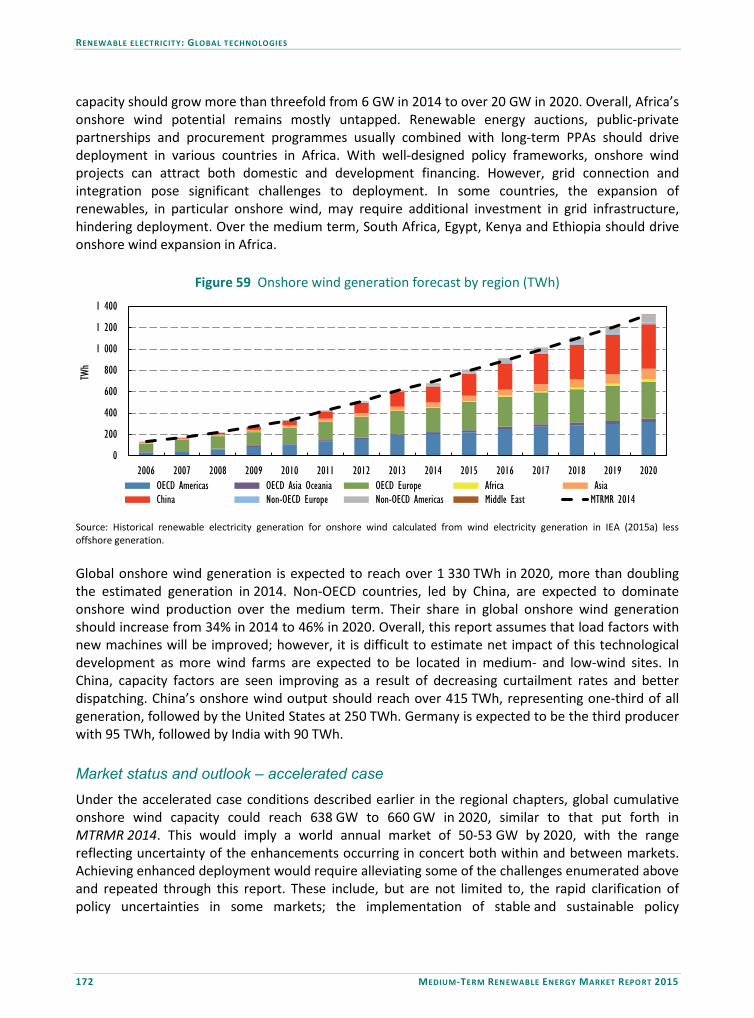
RENEWABLE ELECTRICITY: GLOBAL TECHNOLOGIES
172 MEDIUM-TERM RENEWABLE ENERGY MARKET REPORT 2015
capacity should grow more than threefold from 6 GW in 2014 to over 20 GW in 2020. Overall, Africa’s onshore wind potential remains mostly untapped. Renewable energy auctions, public-private partnerships and procurement programmes usually combined with long-term PPAs should drive deployment in various countries in Africa. With well-designed policy frameworks, onshore wind projects can attract both domestic and development financing. However, grid connection and integration pose significant challenges to deployment. In some countries, the expansion of renewables, in particular onshore wind, may require additional investment in grid infrastructure, hindering deployment. Over the medium term, South Africa, Egypt, Kenya and Ethiopia should drive onshore wind expansion in Africa.
Figure 59 Onshore wind generation forecast by region (TWh)
0
200
400
600
800
1 000
1 200
1 400
2006 2007 2008 2009 2010 2011 2012 2013 2014 2015 2016 2017 2018 2019 2020
TWh
OECD Americas OECD Asia Oceania OECD Europe Africa Asia China Non-OECD Europe Non-OECD Americas Middle East MTRMR 2014
Source: Historical renewable electricity generation for onshore wind calculated from wind electricity generation in IEA (2015a) less offshore generation. Global onshore wind generation is expected to reach over 1 330 TWh in 2020, more than doubling the estimated generation in 2014. Non-OECD countries, led by China, are expected to dominate onshore wind production over the medium term. Their share in global onshore wind generation should increase from 34% in 2014 to 46% in 2020. Overall, this report assumes that load factors with new machines will be improved; however, it is difficult to estimate net impact of this technological development as more wind farms are expected to be located in medium- and low-wind sites. In China, capacity factors are seen improving as a result of decreasing curtailment rates and better dispatching. China’s onshore wind output should reach over 415 TWh, representing one-third of all generation, followed by the United States at 250 TWh. Germany is expected to be the third producer with 95 TWh, followed by India with 90 TWh. Market status and outlook – accelerated case Under the accelerated case conditions described earlier in the regional chapters, global cumulative onshore wind capacity could reach 638 GW to 660 GW in 2020, similar to that put forth in MTRMR 2014. This would imply a world annual market of 50-53 GW by 2020, with the range reflecting uncertainty of the enhancements occurring in concert both within and between markets. Achieving enhanced deployment would require alleviating some of the challenges enumerated above and repeated through this report. These include, but are not limited to, the rapid clarification of policy uncertainties in some markets; the implementation of stable and sustainable policy

RENEWABLE ELECTRICITY: GLOBAL TECHNOLOGIES
MEDIUM-TERM RENEWABLE ENERGY MARKET REPORT 2015 173
frameworks that give greater certainty about the long-term revenue streams of renewable projects; greater measures to ensure the grid and system integration of variable renewables; improved reductions in non-economic barriers; and faster-than-expected decreases in onshore wind technology and generation costs.
Figure 60 Onshore wind annual additions by region (main case) versus accelerated case annual additions
0
10
20
30
40
50
60
70
2006 2007 2008 2009 2010 2011 2012 2013 2014 2015 2016 2017 2018 2019 2020
GW
OECD Americas OECD Asia Oceania OECD Europe Africa Asia China Non-OECD Europe Non-OECD Americas Middle East Accelerated case
Source: Historical OECD capacity derived from IEA (2015c), “OECD - Net capacity of renewables”, IEA Renewables Information Statistics (database). Solar PV Technology and manufacturing development
Solar PV12 development continues to be driven by a combination of technology development and increased deployment in newer markets. With attractive financing and good resources, low contracted remuneration prices have been achieved in an increasing number of markets, supporting deployment with lower levels of financial support. Though module price decreases have flattened somewhat, cost reductions in other parts of the supply chain are stimulating more competitive applications. A good deal of the overcapacity characterising the manufacturing sector in recent years has receded, and investment in module manufacturing capacity is again expanding. Acceleration of deployment in several markets, notably China, has helped to reduce industry pressures, though some uncertainties lie ahead. From 2008 to 2012, solar PV module prices were divided by five, and solar PV system prices divided by three in mature markets such as Italy due to sustained technology improvement and great economies of scale. In 2013 and 2014, module prices declined by 15-18% annually in markets such as Japan and Germany; however, they remained largely stable in China, with some months of higher prices (pvXchange, 2015). In early 2015, average module prices stood at USD 0.60-0.70 per watt (W), and differentials between markets have narrowed, though China still occupies the lower end of the price range. Increased domestic demand has been an important driver for stabilising module prices in China, the source of almost half of global module shipments in 2014. As a result, manufacturing profit margins have improved and CAPEX across a number of manufacturers picked up in 2014 to its highest level since 2011 (Feldman, Margolis and Boff, 2015). Still, some manufacturers continue to 12 For further analysis on the solar PV sector, including more detailed technology analysis, please see the IEA Technology Roadmap: Solar Photovoltaic Energy, 2014 edition.

RENEWABLE ELECTRICITY: GLOBAL TECHNOLOGIES
174 MEDIUM-TERM RENEWABLE ENERGY MARKET REPORT 2015
make losses, and consolidation in the industry continues, even as some suppliers continue to diversify their businesses into project development and the industry remains in overcapacity for module assembly capacity.
Figure 61 Solar PV manufacturing capacity by region (2015) versus global module shipments (2014)
0
10 000
20 000
30 000
40 000
50 000
60 000
70 000
Module assembly capacity Full cell/thin film capacity 2014 shipments
MW
Rest of world
India
Malaysia
Chinese Taipei
China
Japan
Europe
United States
Source: SPV Market Research (2015), Global Analysis of the Markets for Solar Products & Five Year Forecast 2014/2015. In recent years, the industry has made a large geographical shift from Europe, particularly Germany, to Asia, mostly China and Chinese Taipei. A combination of increased demand in China, stimulated by ambitious near-term deployment goals, and trade actions by several countries against Chinese-made equipment is prompting Chinese manufacturers to increasingly turn towards the domestic market.
Figure 62 Typical solar PV system prices, by segment, beginning year
1 000
2 000
3 000
4 000
5 000
6 000
Australia 2014
Australia 2015
China2014
China2015
France2014
France2015
Germany2014
Germany2015
Italy2014
Italy2015
Japan2014
Japan2015
UnitedStates2014
UnitedStates2015
USD
2014
/kW
Residential rooftop Commercial rooftop Utility ground-mounted
Notes: data are indicative of typical system prices and may not represent all transactions. Prices include value-added tax or sales tax where relevant. National currencies converted to USD at average 2014 exchange rates. France residential prices are building-integrated, which are generally more expensive than standard rooftop installations. US utility ground-mounted prices are estimates based on average of historically commissioned projects, which may reflect inclusion of legacy equipment price contracts.
Sources: IEA analysis based on Barbose et al. (2014), Tracking the Sun VII, Lawrence Berkeley National Laboratory/US Department of Energy, Berkeley; IEA-PVPS (2015a), PV Cost Data for the IEA, dataset provided to IEA; SEIA/GTM Research (2015), US Solar Market Insight. The growth of markets in Japan, India, Latin America, Africa and the Middle East is also facilitating capacity investment by these companies in areas outside of China. This trend is providing a cushion that has allowed some solar PV companies, which were selling at zero margins or at a loss, to regain
RENEWABLE ELECTRICITY: GLOBAL TECHNOLOGIES
MEDIUM-TERM RENEWABLE ENERGY MARKET REPORT 2015 175
their footing in the market. Still, it is worth highlighting that solar PV cells and module manufacturing now constitute a minority part of the value chain. Upstream activities, from research and development to building production lines, and downstream activities linked to installation and services account for the largest portion (IEA, 2014c). Technology improvement has been and will continue to act as an important driver for sustained investment cost reductions in solar PV systems. Technology evolution will likely be marked by three broad trends: incremental progress towards higher conversion efficiency, which would allow for smaller module sizes; lower materials usage; and streamlined and more innovative manufacturing processes (MIT, 2015). Still, given uncertainty in trying to predict technology trends as well as separating the effects from industrial competition, some debate has emerged over the trajectory of the PV module learning curve going forward (Box 6). All the while, the prices of solar PV systems have continued to decline across a number of markets. Decreasing BOS costs have spurred solar PV system price reductions even as module price decreases have slowed. In early 2015, typical utility-scale solar PV prices were estimated as low as USD 1 300/kW in China and Germany. Commercial-scale solar PV prices were at USD 1 150/kW in China and USD 1 300 in Australia. Meanwhile, the lowest residential-scale systems still remained at levels USD 2 000/kW and higher. Still, prices below and above these levels have also been observed in these markets, and significant differences remain among markets and segments.
Box 6 What is the actual learning rate of solar PV?
Over the past few decades, solar PV module prices have declined in a manner broadly consistent with technology learning relationships. Still, uncertainty over the precise rate of learning implies a range of future movements, with the implication that PV module prices in the long term could move to potentially lower levels than typically assessed.
Experience curves provide a simple, quantitative relationship between price and the cumulative production or use of a technology. There is ample empirical support for such a price-experience relationship from all fields of industrial activities, including the production of equipment that transforms or uses energy (IEA, 2000). Prices usually decrease through cumulative sales, at a rate – the “learning”rate” – that is often constant over several orders of magnitude. This relationship is best illustrated with double-logarithmic diagrams, where the relationship is usually represented by a straight line, whose slope illustrates the learning rate, i.e. the percentage of price reduction for each doubling of cumulative production. Learning here should be understood in its broadest possible sense, including increased labour productivity, technology improvements in products and processes, and economies of scale.
Still, data points do not necessarily align as precisely as this theory would suggest, and relationships are constructed with regression analyses, which can lead to conflicting interpretations. In the case of solar PV, most published learning curves provide a learning rate of 20% for crystalline silicon (c-Si) PV modules, based on a regression analysis of all yearly average selling prices estimated from 1976 to 2014. Future costs shown in Figure 63 are consistent with the PV deployment level in the 2DS of ETP 2014.

RENEWABLE ELECTRICITY: GLOBAL TECHNOLOGIES
176 MEDIUM-TERM RENEWABLE ENERGY MARKET REPORT 2015
Box 6 What is the actual learning rate of solar PV? (continued)
Figure 63 c-Si PV learning curve based on 1976-2014 average selling prices
0.1
1
10
100
0.0001 0.001 0.01 0.1 1 10 100 1000 10000
USD/
W
GW1976-2014 regression 2DS targets Observations
2025
1976
1980
19902000
2014
2020
2035
2030
Two sets of points clearly depart from the trend line derived from the regression analysis: prices from 2004 to 2008 are significantly above trend, and prices from 2012 to 2014 are significantly below. The first anomaly resulted from a shortage of purified silicon, which in the early days of the PV industry came as a by-product of the semiconductor industry. Growing demand for PV modules led to severe competition with the semiconductor sector, and the price of silicon feedstock increased 20 times from 2003 to 2008. The shortage ended when production of purified silicon specific to the PV industry was established.
One possible interpretation of the second anomaly is that prices in the recent years moved to unsustainably low levels, possibly at or below actual manufacturing costs, as a result of overcapacity, intense competition and some predatory pricing. This interpretation prevailed in 2012, when overcapacities and intense competition were significant features of the market, and aggressive pricing widely suspected in the context of thin profit margins, bankruptcies and industry consolidation. As a result, most analysts expected PV module prices to stabilise at USD 0.9/W for at least a few years, as the market would return to equilibrium.
Other analysts, however, argued that the learning rate was higher than 20% and should be calculated without the “anomalous” 2004-08 data (Chase, 2014). The continuing decrease in prices since 2012, contrary to most expectations, while a restructured PV industry came back to positive balance sheets and engaged in new manufacturing lines, gives more strength to this suggestion. Indeed, a regression analysis based solely on 1976-2003 data shows a learning rate of 23% (Figure 63). Moreover, the prolongation of the resulting straight line meets the 2012, 2013 and 2014 data points with precision.
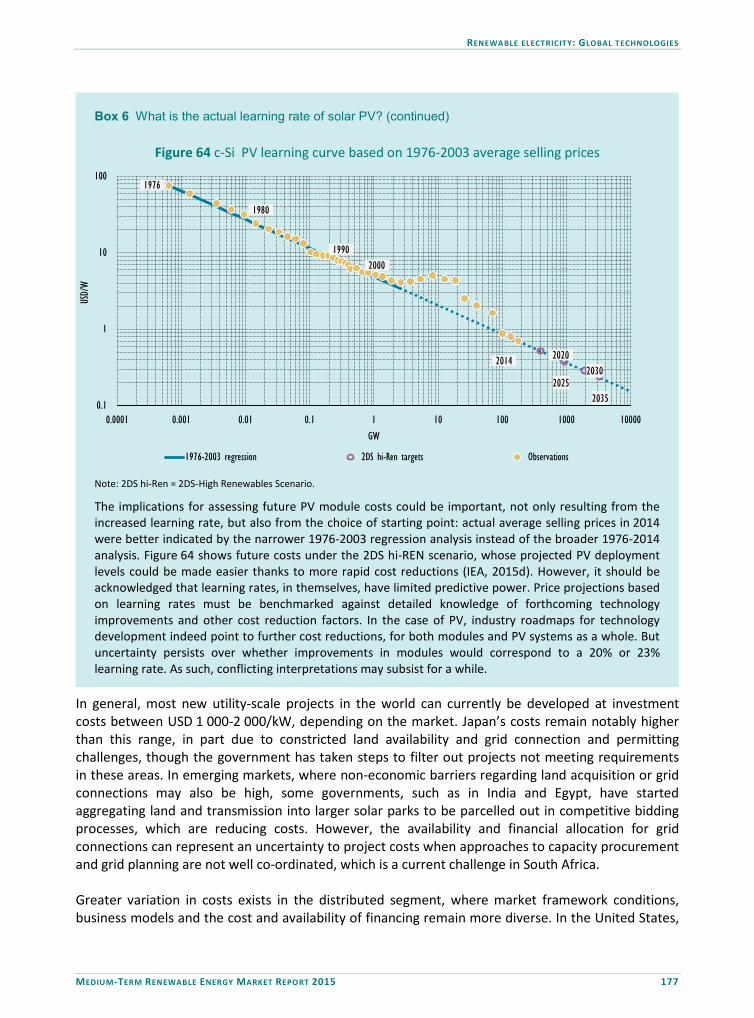
RENEWABLE ELECTRICITY: GLOBAL TECHNOLOGIES
MEDIUM-TERM RENEWABLE ENERGY MARKET REPORT 2015 177
Box 6 What is the actual learning rate of solar PV? (continued)
Figure 64 c-Si PV learning curve based on 1976-2003 average selling prices
0.1
1
10
100
0.0001 0.001 0.01 0.1 1 10 100 1000 10000
USD/
W
GW
1976-2003 regression 2DS hi-Ren targets Observations
2025
1976
1980
19902000
2014 2020
2035
2030
Note: 2DS hi-Ren = 2DS-High Renewables Scenario.
The implications for assessing future PV module costs could be important, not only resulting from the increased learning rate, but also from the choice of starting point: actual average selling prices in 2014 were better indicated by the narrower 1976-2003 regression analysis instead of the broader 1976-2014 analysis. Figure 64 shows future costs under the 2DS hi-REN scenario, whose projected PV deployment levels could be made easier thanks to more rapid cost reductions (IEA, 2015d). However, it should be acknowledged that learning rates, in themselves, have limited predictive power. Price projections based on learning rates must be benchmarked against detailed knowledge of forthcoming technology improvements and other cost reduction factors. In the case of PV, industry roadmaps for technology development indeed point to further cost reductions, for both modules and PV systems as a whole. But uncertainty persists over whether improvements in modules would correspond to a 20% or 23% learning rate. As such, conflicting interpretations may subsist for a while.
In general, most new utility-scale projects in the world can currently be developed at investment costs between USD 1 000-2 000/kW, depending on the market. Japan’s costs remain notably higher than this range, in part due to constricted land availability and grid connection and permitting challenges, though the government has taken steps to filter out projects not meeting requirements in these areas. In emerging markets, where non-economic barriers regarding land acquisition or grid connections may also be high, some governments, such as in India and Egypt, have started aggregating land and transmission into larger solar parks to be parcelled out in competitive bidding processes, which are reducing costs. However, the availability and financial allocation for grid connections can represent an uncertainty to project costs when approaches to capacity procurement and grid planning are not well co-ordinated, which is a current challenge in South Africa. Greater variation in costs exists in the distributed segment, where market framework conditions, business models and the cost and availability of financing remain more diverse. In the United States,
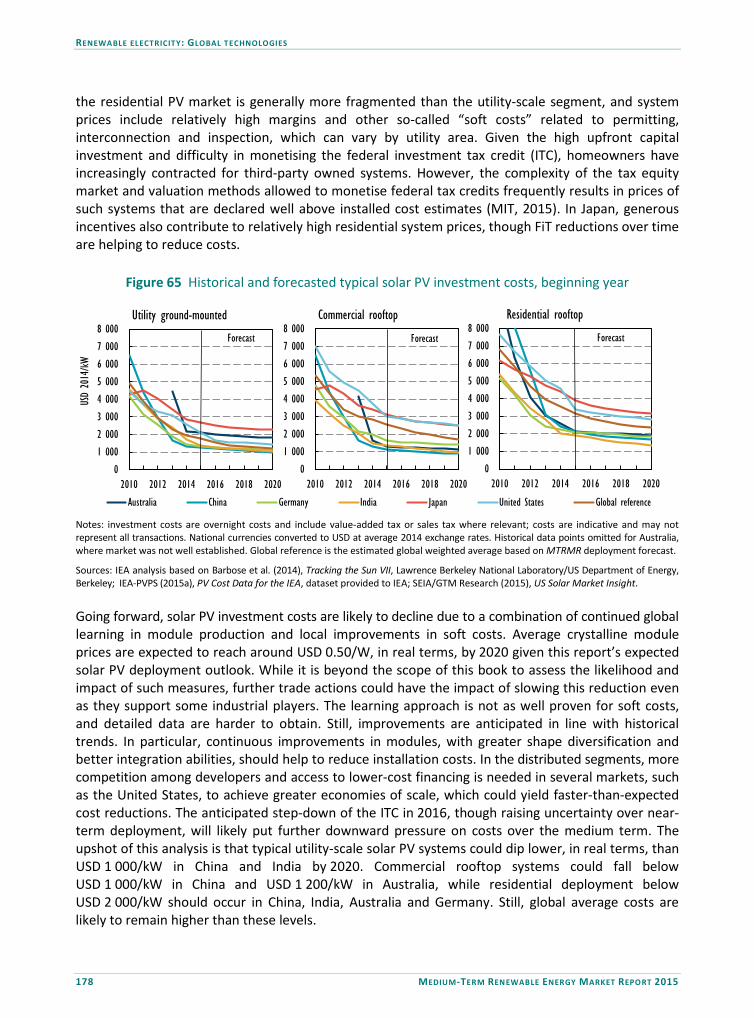
RENEWABLE ELECTRICITY: GLOBAL TECHNOLOGIES
178 MEDIUM-TERM RENEWABLE ENERGY MARKET REPORT 2015
the residential PV market is generally more fragmented than the utility-scale segment, and system prices include relatively high margins and other so-called “soft costs” related to permitting, interconnection and inspection, which can vary by utility area. Given the high upfront capital investment and difficulty in monetising the federal investment tax credit (ITC), homeowners have increasingly contracted for third-party owned systems. However, the complexity of the tax equity market and valuation methods allowed to monetise federal tax credits frequently results in prices of such systems that are declared well above installed cost estimates (MIT, 2015). In Japan, generous incentives also contribute to relatively high residential system prices, though FiT reductions over time are helping to reduce costs.
Figure 65 Historical and forecasted typical solar PV investment costs, beginning year
0
1 000
2 000
3 000
4 000
5 000
6 000
7 000
8 000
2010 2012 2014 2016 2018 2020
USD
2014
/kW
Utility ground-mounted
Australia China Germany India Japan United States Global reference
0
1 000
2 000
3 000
4 000
5 000
6 000
7 000
8 000
2010 2012 2014 2016 2018 2020
Commercial rooftop
0
1 000
2 000
3 000
4 000
5 000
6 000
7 000
8 000
2010 2012 2014 2016 2018 2020
Residential rooftop
Forecast Forecast Forecast
Notes: investment costs are overnight costs and include value-added tax or sales tax where relevant; costs are indicative and may not represent all transactions. National currencies converted to USD at average 2014 exchange rates. Historical data points omitted for Australia, where market was not well established. Global reference is the estimated global weighted average based on MTRMR deployment forecast.
Sources: IEA analysis based on Barbose et al. (2014), Tracking the Sun VII, Lawrence Berkeley National Laboratory/US Department of Energy, Berkeley; IEA-PVPS (2015a), PV Cost Data for the IEA, dataset provided to IEA; SEIA/GTM Research (2015), US Solar Market Insight. Going forward, solar PV investment costs are likely to decline due to a combination of continued global learning in module production and local improvements in soft costs. Average crystalline module prices are expected to reach around USD 0.50/W, in real terms, by 2020 given this report’s expected solar PV deployment outlook. While it is beyond the scope of this book to assess the likelihood and impact of such measures, further trade actions could have the impact of slowing this reduction even as they support some industrial players. The learning approach is not as well proven for soft costs, and detailed data are harder to obtain. Still, improvements are anticipated in line with historical trends. In particular, continuous improvements in modules, with greater shape diversification and better integration abilities, should help to reduce installation costs. In the distributed segments, more competition among developers and access to lower-cost financing is needed in several markets, such as the United States, to achieve greater economies of scale, which could yield faster-than-expected cost reductions. The anticipated step-down of the ITC in 2016, though raising uncertainty over near-term deployment, will likely put further downward pressure on costs over the medium term. The upshot of this analysis is that typical utility-scale solar PV systems could dip lower, in real terms, than USD 1 000/kW in China and India by 2020. Commercial rooftop systems could fall below USD 1 000/kW in China and USD 1 200/kW in Australia, while residential deployment below USD 2 000/kW should occur in China, India, Australia and Germany. Still, global average costs are likely to remain higher than these levels.

RENEWABLE ELECTRICITY: GLOBAL TECHNOLOGIES
MEDIUM-TERM RENEWABLE ENERGY MARKET REPORT 2015 179
Figure 66 Historical and forecasted LCOE range for typical utility-scale solar PV plants, beginning year
0
100
200
300
400
500
2010 2011 2012 2013 2014 2015 2016 2017 2018 2019 2020
USD
2014
/MWh
Global reference UAE Brazil South Africa Germany
Forecast
Tendered prices:
Notes: Costs are indicative and ranges reflect differences in resources and local conditions. Global reference is the estimated global weighted average based on MTRMR generation forecast. Tendered prices are nominal values based on auction announcements and correspond to dates when commissioning of auctioned capacity is expected. For more data assumptions behind the calculations, see table in “Analytical Framework” chapter. Globally, LCOEs for typical utility-scale projects constructed in early 2015, without incentives, are estimated from under USD 100/MWh to over USD 200/MWh. Within this range, China and India are at the low end and Japan is at the high end. However, the estimated global reference suggests that weighted average deployment can take place around USD 125/MWh. Recent PPA announcements from newer markets indicate that potentially much lower costs will be achieved for projects commissioned in the next few years. In the United Arab Emirates, a 25-year PPA was signed at USD 58/MWh for 200 MW in 2017 – to date, the lowest contracted solar PV price observed globally. In South Africa, average bid prices for 415 MW expected in 2017-19 were at USD 65/MWh under Bid Window (BW) 4 of the REIPPPP – a reduction of 76% from BW1 at the end of 2011. In Brazil, PPAs for 890 MW of solar PV for 2016/17 have been auctioned at an average of USD 87/MWh. In India, recent state-level auctions have awarded prices for PPAs around USD 90/MWh. Some caution should be used in comparing tendered PPAs (which can include different escalation, financing and capacity factors, for example) to modelled LCOEs and the design of specific auction mechanisms (e.g. number of technologies competing) can have an important impact on the result. Moreover, delivered project costs may ultimately be different than those reported at the time of the auction or the signature of the PPA. Still, these data points signal a step change in generation costs where deployment is starting to ramp up quickly. A combination of excellent solar resources, low system prices and attractive financing costs, facilitated by competitive bidding mechanisms, is supporting a leapfrog effect for utility-scale solar PV generation costs in some emerging markets. The scale of planned auctions and deployment ambitions elsewhere, such as in India and China, suggests that a global benchmark of USD 80-100/MWh for utility-scale development will be achievable in a number of markets in the next few years. Close values are already seen in some OECD markets – in April, Germany’s first PV tender awarded PPAs for 150 MW by 2017 at an average USD 100/MWh. Overall, the generation cost outlook suggests a growing economic attractiveness of solar PV, with fewer incentives, versus other bulk power sources. Still, a fuller competitiveness assessment versus other power sources would need to take into account the system value of solar PV, where it reaches a high level of penetration in power generation, and where and

RENEWABLE ELECTRICITY: GLOBAL TECHNOLOGIES
180 MEDIUM-TERM RENEWABLE ENERGY MARKET REPORT 2015
when its electricity is produced. In general, the system value of solar PV would be greater in sunny countries with daytime peak demand. However, the value can quickly decrease with when solar PV reduces this peak, displaces mid-merit and base load generation and decreases wholesale prices through the merit order effect.
Figure 67 Historical and forecasted LCOEs for typical commercial- and residential-scale solar PV plants, beginning year
0
100
200
300
400
500
600
2010 2012 2014 2016 2018 2020
USD
2014
/MWh
Commercial rooftop
Global reference
0
100
200
300
400
500
600
2010 2012 2014 2016 2018 2020
Residential rooftop
Forecast Forecast
Notes: Costs are indicative and ranges reflect differences in resources and local conditions. Global reference is the estimated global weighted average based on MTRMR generation forecast. For more data assumptions behind the calculations, see table in “Analytical Framework” chapter. Generation costs for distributed solar PV are also seen improving. The global reference, in real terms, for new commercial-scale projects is seen moving from USD 220/MWh in early 2015 to under USD 160/MWh in 2020. Costs at or below this average are seen in markets such as Italy and Germany. In China and Australia, generation costs for typical systems are seen below USD 100/MWh in 2020. For new residential-scale projects, the global reference is seen moving from USD 280/MWh in early 2015 to USD 220/MWh in 2020, with much lower values expected in China, Australia and Germany, where financing costs are low. Falling costs are supporting the development linked to the concept of grid or “socket” parity – when the LCOE of distributed solar PV systems becomes lower than the variable portion of retail electricity prices that system owners would otherwise pay. As described below (see Box 8 “The challenging forecast of distributed PV”), reaching socket parity in itself may or may not be sufficient to trigger deployment, which will depend on the match between PV generation and power demand and the remuneration available for injected surpluses. Moreover, socket parity is a driver for private actors, and the rapid deployment of distributed PV for self-consumption could raise concerns over the recovery and allocation of fixed networks costs, among other system impacts. In particular, analysis of socket parity in the commercial segment raises particular challenges, given the diversity of available electricity rate structures. Market status In 2014, global solar PV cumulative capacity grew by an estimated 39.7 GW, slightly higher than 2013 growth and MTRMR 2014 expectations for deployment. As in the prior year, solar PV capacity installations continued to transition from historical growth markets in Europe to expanding markets in Asia and the Americas, though OECD countries as a whole still accounted for about two-thirds of development.

RENEWABLE ELECTRICITY: GLOBAL TECHNOLOGIES
MEDIUM-TERM RENEWABLE ENERGY MARKET REPORT 2015 181
Table 36 Solar PV capacity and forecast by region (GW)
2013 2014 2015 2016 2017 2018 2019 2020 OECD 111.1 136.8 161.6 184.2 202.0 219.8 237.6 255.0
OECD Americas 13.9 21.1 28.5 36.9 42.2 48.1 54.6 61.6 OECD Asia Oceania 18.7 30.3 41.9 51.4 59.0 65.5 71.1 75.7
OECD Europe 78.6 85.3 91.2 95.9 100.9 106.2 112.0 117.8 Non-OECD 25.4 39.4 56.9 76.4 98.2 121.6 146.8 174.5
Africa 0.5 1.3 1.7 2.4 3.6 5.2 6.6 8.2 Asia 4.4 6.2 9.3 13.6 19.0 25.6 32.6 40.8 China 17.5 28.1 41.6 55.1 68.6 82.1 96.1 111.1 Non-OECD Europe 2.6 3.1 3.3 3.5 3.8 4.1 4.5 4.8
Non-OECD Americas 0.4 0.5 0.8 1.6 2.5 3.3 4.8 6.3
Middle East 0.1 0.1 0.2 0.3 0.8 1.3 2.1 3.3 Total 136.5 176.2 218.5 260.6 300.2 341.4 384.4 429.5
Sources: 2013 OECD data derived from IEA (2015c), “OECD - Net capacity of renewables”, IEA Renewables Information Statistics (database); 2013 non-OECD data and 2014 data are IEA estimates based on IEA-PVPS (2015), A Snapshot of Global PV Markets. In the OECD, Japan led capacity additions, adding 9.7 GW, prompted by a need for new power generation, the continued provision of generous incentives and the development of a large project pipeline.13 Still, concerns over grid congestion and the integration of the large project pipeline of solar PV prompted electric power companies (EPCOs) in five utility areas to temporarily stop reviewing grid access applications of approved new projects (10 kW and above) from October 2014. Each of these EPCOs subsequently assessed the amount of renewable capacity that could be integrated into their service areas. Based on this detailed analysis, METI revised rules in January 2015 allowing EPCOs to curtail generation, without compensation, from renewable generators up to 360 hours per year; for those installations beyond the assessed capacity limit for the service area, EPCOs could curtail with no limit. EPCOs then began reviewing applications following the issuance of these regulations. The United States continued as the second-largest OECD market in 2014, deploying over 6 GW, with growing economic attractiveness and support from the ITC and state-level incentives for net metering. California alone installed more than 55% of total solar PV capacity, followed by North Carolina, Nevada, Massachusetts and Arizona. Still, deployment remains relatively concentrated – additions in the top ten US states made up near 90% of nationwide growth. Utility-scale projects accounted for two-thirds of development. The distributed segment reached its highest growth to date, and debates over electricity rate design, net metering and the recovery of fixed network costs continue at the state level. Framework regulations to promoting distributed PV continued to expand, with South Carolina becoming the 44th state to adopt net metering rules and several states in the southeast proposing legislation to legalise third-party ownership. New York State launched a new upfront grant programme for all PV installations and aims for 3 GW by 2023. Meanwhile, a number of state actions
13 Installations reported by the Japan Ministry of Economy, Trade and Industry (METI) are expressed in alternating current (AC) capacity, the actual power supplied to the grid, while this report’s solar PV figures are expressed in direct current (DC), which expresses the maximum theoretical generation under standard conditions. Solar PV AC capacity in Japan is translated to DC using a ratio of around 85%. For details, see IEA-PVPS, 2014.
RENEWABLE ELECTRICITY: GLOBAL TECHNOLOGIES
182 MEDIUM-TERM RENEWABLE ENERGY MARKET REPORT 2015
have been proposed or adopted revising credit for net excess generation from PV systems and increasing the fixed charges that PV and non-PV owners would pay (NC Clean Energy Technology Center and Meister Consultants, 2015). Other markets in the OECD continued to expand, though with varied pace versus the prior year. The United Kingdom added a record 2.3 GW, with a rush of installations before anticipated changes to the RO certificate scheme in April 2015. First-quarter 2015 installations, at over 1.5 GW, were also strong. Germany’s solar PV additions slowed to 1.9 GW in 2014. For small-scale solar PV, where deployment is largely driven by self-consumption, the government put into force rules that producers over 10 kW would be required to pay an initial 30% of the EEG surcharge (EUR 0.0624/kWh in 2014), rising to 40% by 2017, on self-consumed power. In early 2015, the government held its first tender for utility-scale PV, with further auctions planned over the next two years. Meanwhile, Italy’s solar PV additions slowed notably to 0.4 GW, driven mostly by net metering and self-consumption. Australia installed 0.8 GW, comparable to 2013, though the pipeline for large-scale projects weakened amid uncertainty over pending 2020 renewable target policy reviews. Solar PV capacity continued to be led by the deployment of distributed systems, stimulated mainly by attractive economics under socket parity, with about one out of six households now equipped with PV panels. Several other markets had notable deployment in 2014, including Canada, Chile, Israel, Korea, the Netherlands and Switzerland. The non-OECD was led by China, which installed 10.6 GW in 2014, slightly less than downwardly revised growth of 10.95 GW in 2013. More than 80% of new additions occurred in the utility-scale segment. Distributed PV (which includes projects up to 20 MW) development was less than the government quota of 8 GW. In 2014, the government issued several supporting policies, including giving developers the choice between the premium subsidy and the local FiT for utility-scale PV. The NEA instructed local (province) level energy regulators to make annual plans for distributed PV development in their jurisdiction and invest accordingly in the distribution grid. For 2015, the government has announced an overall approval quota (i.e. the number of projects that can qualify for incentives) for solar PV of 17.8 GW, with allocations by province and no division between utility and distributed development. In the first quarter of 2015, China deployed 5 GW, according to NEA. In India, solar PV expanded by only 0.7 GW in 2014, lower than the 1 GW of additions in 2013. Still, sector activity has recently ramped up with the tendering of over 2.5 GW of utility-scale solar PV capacity combined by state governments and under the federal government’s Jawaharlal Nehru National Solar Mission (JNNSM) over 2014 and early 2015. In the first quarter of 2015 alone, 0.7 GW was commissioned, and the central government is planning 10 GW of new allocations this year. Thailand’s solar PV capacity grew by 475 MW, its highest increase to date. But the expansion was much less than the prevailing project pipeline given challenges related to permitting, land acquisition and grid connections (Kuang et al., 2015). Over 1 GW of utility-scale solar is registered with the government’s FiT programme, though only a fraction has secured PPAs. In Chinese Taipei, solar PV installations, at 400 MW, rose to their highest level to date. Citing declining electricity reserve margins in the face of rapidly growing demand, the government announced in May higher long-term targets for renewable deployment of 17.25 GW by 2030, up from 13.75 GW previously, supported by streamlined bidding processes for solar PV incentives. The Bureau of Energy announced it was planning to raise the 2015 target deployment target for solar PV from 270 MW to 500 MW.
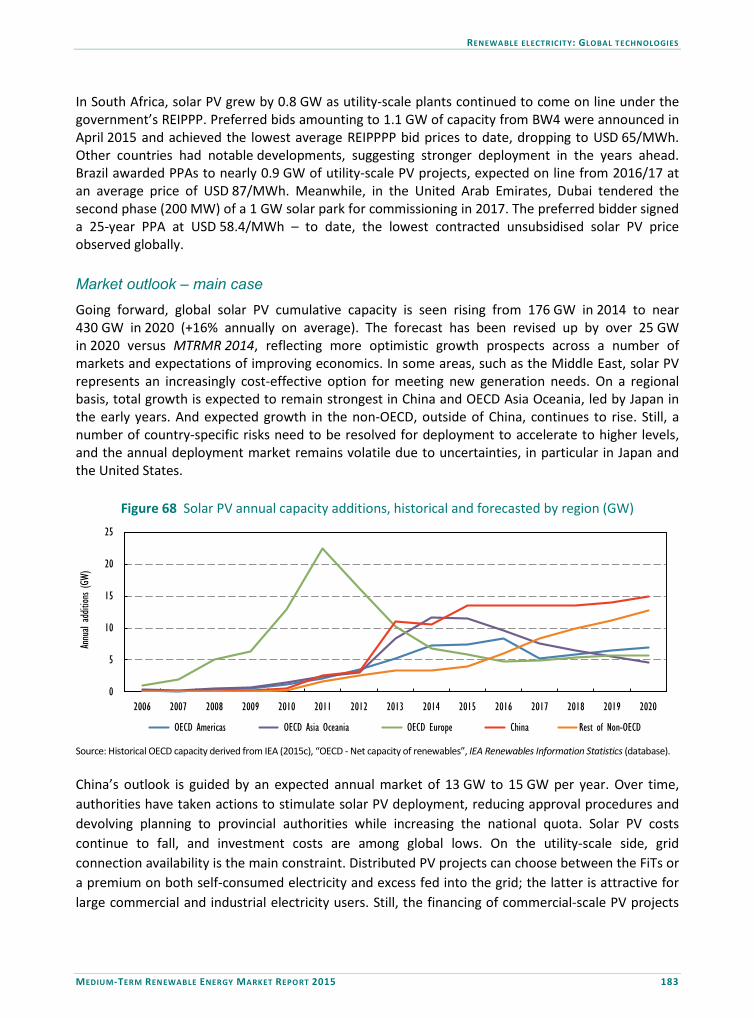
RENEWABLE ELECTRICITY: GLOBAL TECHNOLOGIES
MEDIUM-TERM RENEWABLE ENERGY MARKET REPORT 2015 183
In South Africa, solar PV grew by 0.8 GW as utility-scale plants continued to come on line under the government’s REIPPP. Preferred bids amounting to 1.1 GW of capacity from BW4 were announced in April 2015 and achieved the lowest average REIPPPP bid prices to date, dropping to USD 65/MWh. Other countries had notable developments, suggesting stronger deployment in the years ahead. Brazil awarded PPAs to nearly 0.9 GW of utility-scale PV projects, expected on line from 2016/17 at an average price of USD 87/MWh. Meanwhile, in the United Arab Emirates, Dubai tendered the second phase (200 MW) of a 1 GW solar park for commissioning in 2017. The preferred bidder signed a 25-year PPA at USD 58.4/MWh – to date, the lowest contracted unsubsidised solar PV price observed globally. Market outlook – main case Going forward, global solar PV cumulative capacity is seen rising from 176 GW in 2014 to near 430 GW in 2020 (+16% annually on average). The forecast has been revised up by over 25 GW in 2020 versus MTRMR 2014, reflecting more optimistic growth prospects across a number of markets and expectations of improving economics. In some areas, such as the Middle East, solar PV represents an increasingly cost-effective option for meeting new generation needs. On a regional basis, total growth is expected to remain strongest in China and OECD Asia Oceania, led by Japan in the early years. And expected growth in the non-OECD, outside of China, continues to rise. Still, a number of country-specific risks need to be resolved for deployment to accelerate to higher levels, and the annual deployment market remains volatile due to uncertainties, in particular in Japan and the United States.
Figure 68 Solar PV annual capacity additions, historical and forecasted by region (GW)
0
5
10
15
20
25
2006 2007 2008 2009 2010 2011 2012 2013 2014 2015 2016 2017 2018 2019 2020
Annu
al ad
dition
s (GW
)
OECD Americas OECD Asia Oceania OECD Europe China Rest of Non-OECD Source: Historical OECD capacity derived from IEA (2015c), “OECD - Net capacity of renewables”, IEA Renewables Information Statistics (database). China’s outlook is guided by an expected annual market of 13 GW to 15 GW per year. Over time, authorities have taken actions to stimulate solar PV deployment, reducing approval procedures and devolving planning to provincial authorities while increasing the national quota. Solar PV costs continue to fall, and investment costs are among global lows. On the utility-scale side, grid connection availability is the main constraint. Distributed PV projects can choose between the FiTs or a premium on both self-consumed electricity and excess fed into the grid; the latter is attractive for large commercial and industrial electricity users. Still, the financing of commercial-scale PV projects
RENEWABLE ELECTRICITY: GLOBAL TECHNOLOGIES
184 MEDIUM-TERM RENEWABLE ENERGY MARKET REPORT 2015
remains a significant barrier with banks concerned over the creditworthiness of some project owners (or the off taker in the case of third-party ownership) and potential asset recovery issues. As such, an acceleration of the distributed sector may depend on the introduction of new financing models or policies to mitigate some of the perceived financial risks. In Japan, solar PV is expected to expand by 36 GW over 2014-20 to reach almost 60 GW, with deployment shifting more towards the distributed segment given land constraints and improving economics for self-consumption. But the deployment pattern may be volatile, with high levels in 2015-16 followed by a shrinking market, due to assumed grid constraints. Much of the approved solar PV under the FiT scheme (72 gigawatts of alternating current) is concentrated in a few balancing areas with limited interconnection. Overall, the prioritisation of renewables in operations by EPCOs and overarching electricity market reforms will be key to realising significant new PV deployment. Elsewhere in the region, Australia, based on competitiveness of rooftop solar PV with current retail prices, Korea and Israel are all anticipated to grow significantly. In the OECD Americas, the United States should grow by 35 GW over 2014-20. Utility-scale projects still drive the outlook, though all segments will be affected by the looming reduction in the ITC from 30% to 10% at the end of 2016. For host-owned residential projects, the ITC will expire completely though third-party ownership models will continue to benefit from the remaining 10%. As a result, this forecast sees a volatile annual pattern of additions, with the market dipping in 2017 after rising in the years prior. State-level policies, especially net metering and RPS, will play an important role in deployment. California will continue to dominate with its ambitious RPS goal. As of May 2015, the California Solar Initiative (CSI) had spent close to USD 1.8 billion in capital grants for financing 1.6 GW. It is expected that CSI’s budget cap of USD 2.4 billion will be reached in 2016 with 350-450 MW more on line. But in 2014, more than 70% of residential applications are deployed without capital subsidies due in part to new business models with attractive long-term loan programmes. The evolution of net metering rules and electricity rate design in California and other states raises a number of uncertainties over the scale-up of distributed PV. For example, the California Public Utilities Commission is considering the design of new net metering rules (utilities are only required to offer the current programme through summer 2017 or until programme caps are reached); the roll-out of time-of-use rates by 2019, which could enhance the system value of PV; and the imposition of minimum bills or fixed charges, which could also affect the economics of distributed PV. Canada, Chile and Mexico are all expected to grow strongly as well. Chile’s development is marked by attractive economics from high daytime wholesale prices, and a rapidly growing project pipeline for utility-scale plants. In Mexico, utility-scale projects should drive the expansion while small growth should come from commercial projects under high retail electricity prices. However, it is still unclear how self-consumption will be treated under the new clean energy certificate regime. In OECD Europe, solar PV is seen expanding by 32 GW over 2014-20, with a lower annual market than in prior years. Deployment in the distributed segments will depend on the evolution of debates in a number of countries over the allocation of fixed network charges under net metering schemes and
RENEWABLE ELECTRICITY: GLOBAL TECHNOLOGIES
MEDIUM-TERM RENEWABLE ENERGY MARKET REPORT 2015 185
self-consumption. Some utility-scale growth is also expected, particularly in France and Germany supported by tenders for new capacity. Turkey’s solar PV capacity should expand by 2.5 GW over 2014-20. Still, the evolution of utility-scale developments will depend on the pace of grid connection auctions going forward. For commercial and residential projects, the economics look better as they do not have to pay for grid capacity; still, net metering rules are unclear, and permitting remains challenging for developers. In the non-OECD outside of China, deployment is seen rising rapidly over the medium term. In India, solar PV growth of 25 GW is expected over 2014-20, though it could be much higher under new ambitious targets. Competitive state-level and JNNSM auctions are driving more cost-effective utility-scale solar PV development, as contracted prices have fallen over the past two years, though levels are higher than for coal. A government decision to not impose duties on imported PV equipment will aid cost reductions as deployment aims to ramp up beyond domestic manufacturing capacity, and increased scale should drive further cost decreases. The government announced a grant scheme to support 20 GW of “ultra-mega” solar, and states such as Gujarat and Rajasthan have begun aggregating land and transmission into large solar parks to be parcelled out. Still, the pace of activity is a forecast uncertainty. The timing of 2015 JNNSM allocations (10 GW) remains unclear, and solar parks are encountering delays. On the distributed side, the LCOE of commercial-scale PV is below retail tariffs in a number of states, making deployment for self-consumption attractive; the economics of residential PV are less attractive given lower, subsidised power tariffs (Bridge to India, 2014). Still, net metering supports activity in only eight states. Its expansion will depend on the evolution of debates regarding potential customer losses for cash-strapped state electricity boards versus potential benefits, such as reducing India’s heavy distribution losses (Kohli, 2015). In Brazil, capacity is seen rising over 3.5 GW supported by future auctions and some ramp-up in the distributed segment. South Africa is expected to increase by almost 2.5 GW, primarily due to large-scale projects under the REIPPPP, but also with the potential for distributed capacity to start rising. In Middle East and African countries, solar PV has become an increasingly cost-effective way to meet new generation needs, though the pace and implementation of government auction programmes will largely guide growth there. Notable additions are expected in Algeria, Cameroon, Egypt, Ethiopia, Jordan, Morocco and the United Arab Emirates. Egypt has introduced a FiT scheme to contract 2.3 GW of solar PV over 2015-17. Meanwhile, Dubai in the United Arab Emirates has expanded its capacity auction scheme to 1 GW. Electricity production from solar PV is directly dependent on solar irradiance levels within each country. In general, with solar PV expanding into sunnier countries, global average full-load hours should increase. Solar PV should deliver over 500 TWh globally in 2020. China is seen as the largest solar PV power producer in 2020, followed by Japan and the United States. The forecast for China stays on the conservative side, taking into account that small-scale installations will not always be located in ideal solar resource spots while utility-scale installations may be slightly curtailed due to the variability of power produced, which is not always easily handled by Chinese grid operators. In 2020, 16% of solar PV electricity should be generated in countries other than China and OECD countries, up from less than 5% in 2012.

RENEWABLE ELECTRICITY: GLOBAL TECHNOLOGIES
186 MEDIUM-TERM RENEWABLE ENERGY MARKET REPORT 2015
Figure 69 Solar PV electricity generation and forecast by region
0
100
200
300
400
500
600
2006 2007 2008 2009 2010 2011 2012 2013 2014 2015 2016 2017 2018 2019 2020
TWh
OECD Americas OECD Asia Oceania OECD Europe Africa Asia China Non-OECD Europe Non-OECD Americas Middle East MTRMR 2014
Source: Historical renewable electricity generation from IEA (2015a), “World energy statistics”, IEA World Energy Statistics and Balances (database).
Box 7 Solar PV deployment segments vary by market
The market segmentation of solar PV deployment can vary significantly by geography. Market segmentation of solar PV can be described a number of ways – by system size, by installation type (e.g. rooftop versus ground-mounted), by building segment (e.g. residential, commercial, utility) or by the way that solar PV systems interact with the electricity system (e.g. distributed, centralised, off-grid).
As in last year’s edition, MTRMR 2015 tries to estimate PV development over these four categories, which represent a simplification of how systems may actually be deployed in a given market and segment. In many cases there is significant overlap. For example, centralised systems are often ground-mounted utility plants of a size of at least 1 MW. Yet exceptions can exist, and reporting standards vary by country, making the characterisation of segment trends difficult across markets. In many cases, insufficient data and resources exist to assign these categories at the country level. This report has determined breakdowns for key reference markets and has applied them to larger regional dynamics. As such, these category assumptions should be taken as a proxy for actual trends.
Figure 70 Solar PV capacity and deployment by market segment
0
100
200
300
400
500
2010 2011 2012 2013 2014 2015 2016 2017 2018 2019 2020
GW
Cumulative capacity
Residential scale Commercial scale Utility scale Off-grid
0
5
10
15
20
25
2010 2011 2012 2013 2014 2015 2016 2017 2018 2019 2020
GW
Annual additions
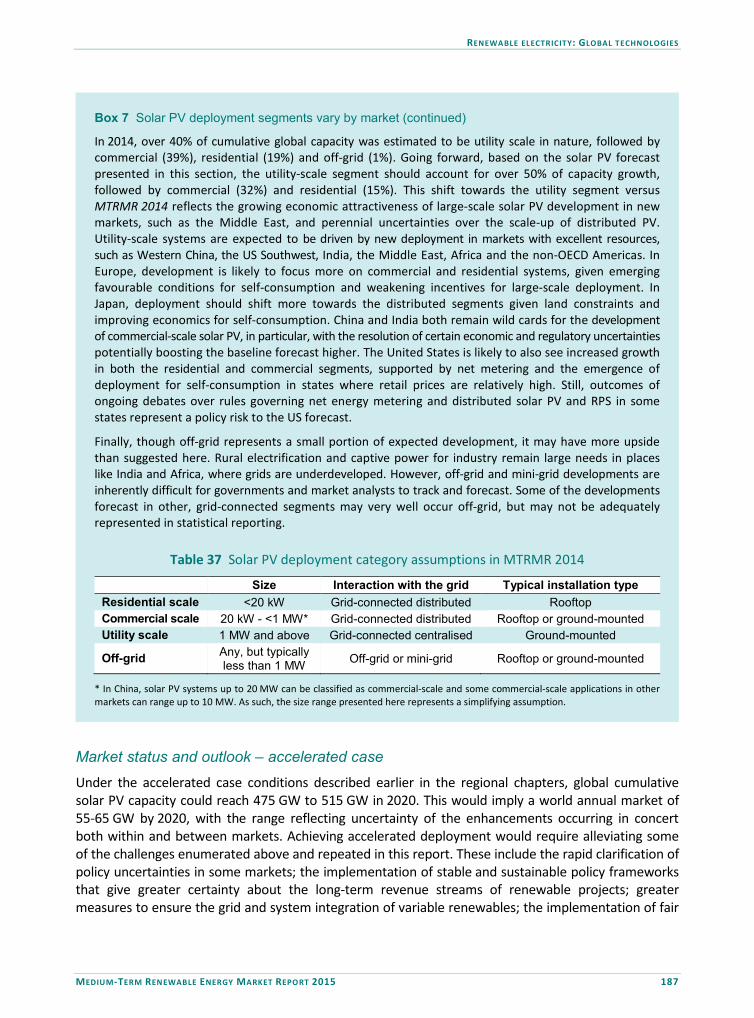
RENEWABLE ELECTRICITY: GLOBAL TECHNOLOGIES
MEDIUM-TERM RENEWABLE ENERGY MARKET REPORT 2015 187
Box 7 Solar PV deployment segments vary by market (continued)
In 2014, over 40% of cumulative global capacity was estimated to be utility scale in nature, followed by commercial (39%), residential (19%) and off-grid (1%). Going forward, based on the solar PV forecast presented in this section, the utility-scale segment should account for over 50% of capacity growth, followed by commercial (32%) and residential (15%). This shift towards the utility segment versus MTRMR 2014 reflects the growing economic attractiveness of large-scale solar PV development in new markets, such as the Middle East, and perennial uncertainties over the scale-up of distributed PV. Utility-scale systems are expected to be driven by new deployment in markets with excellent resources, such as Western China, the US Southwest, India, the Middle East, Africa and the non-OECD Americas. In Europe, development is likely to focus more on commercial and residential systems, given emerging favourable conditions for self-consumption and weakening incentives for large-scale deployment. In Japan, deployment should shift more towards the distributed segments given land constraints and improving economics for self-consumption. China and India both remain wild cards for the development of commercial-scale solar PV, in particular, with the resolution of certain economic and regulatory uncertainties potentially boosting the baseline forecast higher. The United States is likely to also see increased growth in both the residential and commercial segments, supported by net metering and the emergence of deployment for self-consumption in states where retail prices are relatively high. Still, outcomes of ongoing debates over rules governing net energy metering and distributed solar PV and RPS in some states represent a policy risk to the US forecast.
Finally, though off-grid represents a small portion of expected development, it may have more upside than suggested here. Rural electrification and captive power for industry remain large needs in places like India and Africa, where grids are underdeveloped. However, off-grid and mini-grid developments are inherently difficult for governments and market analysts to track and forecast. Some of the developments forecast in other, grid-connected segments may very well occur off-grid, but may not be adequately represented in statistical reporting.
Table 37 Solar PV deployment category assumptions in MTRMR 2014
Size Interaction with the grid Typical installation type Residential scale <20 kW Grid-connected distributed Rooftop Commercial scale 20 kW - <1 MW* Grid-connected distributed Rooftop or ground-mounted Utility scale 1 MW and above Grid-connected centralised Ground-mounted
Off-grid Any, but typically less than 1 MW Off-grid or mini-grid Rooftop or ground-mounted
* In China, solar PV systems up to 20 MW can be classified as commercial-scale and some commercial-scale applications in other markets can range up to 10 MW. As such, the size range presented here represents a simplifying assumption.
Market status and outlook – accelerated case Under the accelerated case conditions described earlier in the regional chapters, global cumulative solar PV capacity could reach 475 GW to 515 GW in 2020. This would imply a world annual market of 55-65 GW by 2020, with the range reflecting uncertainty of the enhancements occurring in concert both within and between markets. Achieving accelerated deployment would require alleviating some of the challenges enumerated above and repeated in this report. These include the rapid clarification of policy uncertainties in some markets; the implementation of stable and sustainable policy frameworks that give greater certainty about the long-term revenue streams of renewable projects; greater measures to ensure the grid and system integration of variable renewables; the implementation of fair
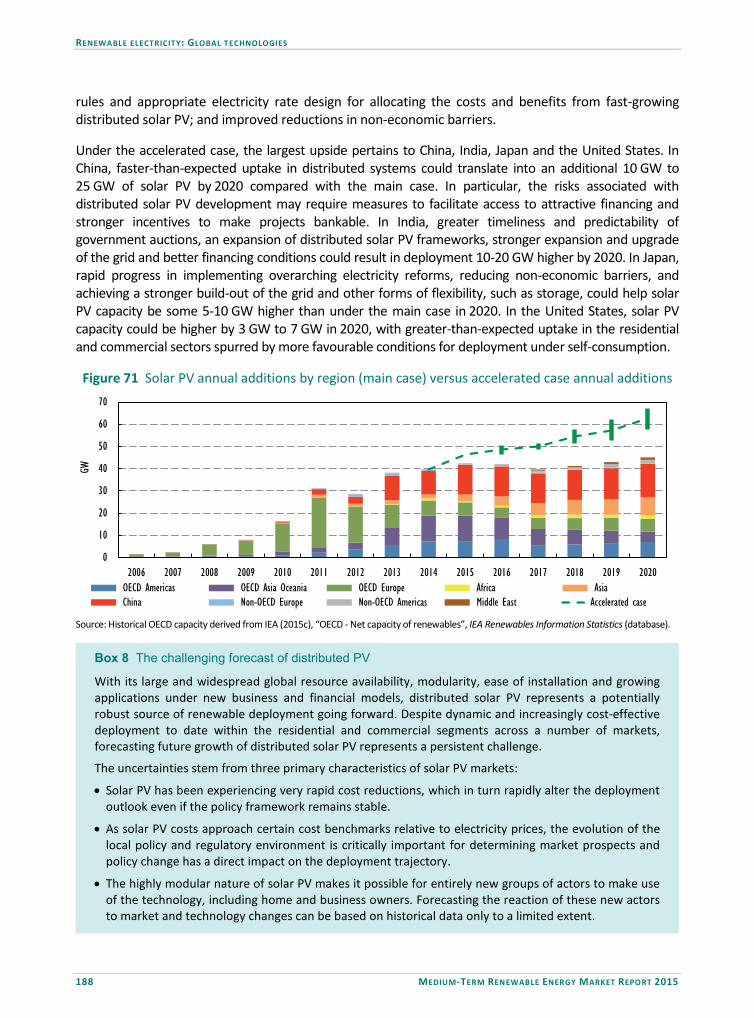
RENEWABLE ELECTRICITY: GLOBAL TECHNOLOGIES
188 MEDIUM-TERM RENEWABLE ENERGY MARKET REPORT 2015
rules and appropriate electricity rate design for allocating the costs and benefits from fast-growing distributed solar PV; and improved reductions in non-economic barriers. Under the accelerated case, the largest upside pertains to China, India, Japan and the United States. In China, faster-than-expected uptake in distributed systems could translate into an additional 10 GW to 25 GW of solar PV by 2020 compared with the main case. In particular, the risks associated with distributed solar PV development may require measures to facilitate access to attractive financing and stronger incentives to make projects bankable. In India, greater timeliness and predictability of government auctions, an expansion of distributed solar PV frameworks, stronger expansion and upgrade of the grid and better financing conditions could result in deployment 10-20 GW higher by 2020. In Japan, rapid progress in implementing overarching electricity reforms, reducing non-economic barriers, and achieving a stronger build-out of the grid and other forms of flexibility, such as storage, could help solar PV capacity be some 5-10 GW higher than under the main case in 2020. In the United States, solar PV capacity could be higher by 3 GW to 7 GW in 2020, with greater-than-expected uptake in the residential and commercial sectors spurred by more favourable conditions for deployment under self-consumption.
Figure 71 Solar PV annual additions by region (main case) versus accelerated case annual additions
0
10
20
30
40
50
60
70
2006 2007 2008 2009 2010 2011 2012 2013 2014 2015 2016 2017 2018 2019 2020
GW
OECD Americas OECD Asia Oceania OECD Europe Africa Asia China Non-OECD Europe Non-OECD Americas Middle East Accelerated case
Source: Historical OECD capacity derived from IEA (2015c), “OECD - Net capacity of renewables”, IEA Renewables Information Statistics (database).
Box 8 The challenging forecast of distributed PV
With its large and widespread global resource availability, modularity, ease of installation and growing applications under new business and financial models, distributed solar PV represents a potentially robust source of renewable deployment going forward. Despite dynamic and increasingly cost-effective deployment to date within the residential and commercial segments across a number of markets, forecasting future growth of distributed solar PV represents a persistent challenge.
The uncertainties stem from three primary characteristics of solar PV markets:
• Solar PV has been experiencing very rapid cost reductions, which in turn rapidly alter the deployment outlook even if the policy framework remains stable.
• As solar PV costs approach certain cost benchmarks relative to electricity prices, the evolution of the local policy and regulatory environment is critically important for determining market prospects and policy change has a direct impact on the deployment trajectory.
• The highly modular nature of solar PV makes it possible for entirely new groups of actors to make use of the technology, including home and business owners. Forecasting the reaction of these new actors to market and technology changes can be based on historical data only to a limited extent.

RENEWABLE ELECTRICITY: GLOBAL TECHNOLOGIES
MEDIUM-TERM RENEWABLE ENERGY MARKET REPORT 2015 189
Box 8 The challenging forecast of distributed PV (continued)
This brief analysis highlights how investors in the residential and commercial market have shown different response patterns in the past and what factors are likely to determine market dynamics in these sectors going forward.
Lessons from historic developments
Two well-known examples of unexpectedly rapid solar PV deployment are Italy (2010-13) and Germany (2010-12). In both cases, FiT schemes served as the main remuneration mechanism for produced electricity from solar PV systems, and annual installation rates exceeded government targets and analyst expectations. However, a closer look at the data reveals quite different developments of the market depending on installation size (Figure 71).
Figure 72 Cost, remuneration and cumulative capacity for residential and commercial solar PV in Germany and Italy, 2005-14
Italy, residential solar PV Italy, commercial PV
0
20
40
60
80
100
2005
2006
2007
2008
2009
2010
2011
2012
2013
2014
USD
2014
/MWh
LCOE Revenues
0
1
2
3
4
5
6
GW
Capacity
0
20
40
60
80
100
2005
2006
2007
2008
2009
2010
2011
2012
2013
2014
USD
2014
/MWh
LCOE Revenues
0
1
2
3
4
5
6
GW
Capacity
Germany, residential solar PV Germany, commercial solar PV
0
20
40
60
80
100
2005
2006
2007
2008
2009
2010
2011
2012
2013
2014
USD
2014
/MWh
LCOE Revenues
0
1
2
3
4
5
6
GW
Capacity
0
20
40
60
80
100
2005
2006
2007
2008
2009
2010
2011
2012
2013
2014
USD
2014
/MWh
LCOE Revenues
0
1
2
3
4
5
6
GW
Capacity

RENEWABLE ELECTRICITY: GLOBAL TECHNOLOGIES
190 MEDIUM-TERM RENEWABLE ENERGY MARKET REPORT 2015
Box 8 The challenging forecast of distributed PV (continued)
In both cases the commercial segment showed a much higher sensitivity and more rapid reaction to periods of excessively high remuneration. This may reflect the higher relevance of transaction costs for very small residential systems that hinder a more rapid scale up of deployment. Such costs may take a variety of forms, such as access to financing or finding a qualified installer that is available. Consequently, a sudden spike in deployment seems less likely in the residential PV sector. The opposite may be true for commercial scale systems: if framework conditions are commercially attractive, deployment may surge very rapidly. Recent experiences in Japan confirm this general trend.
Impact of reaching socket parity
In a growing number of countries, the levelised cost of solar PV has fallen below the cost of obtaining an additional unit of energy from the grid. As such, the possible savings per unit of solar PV generated and self-consumed electricity are higher than the average cost of producing it (see IEA, 2014 for a more detailed conceptual discussion of socket parity). Ostensibly, this situation suggests the possibility of future deployment based on lower levels of direct incentives. This is reflected in the German and Italian case: German feed-in tariff levels have fallen significantly and self-consumption of electricity is economically more attractive than feeding into the grid. In Italy, the feed-in system for solar PV has been discontinued altogether and replaced by a tax break combined with net-energy metering.
But, reaching socket parity adds an additional layer of complexity to the forecast of solar PV deployment. The economic attractiveness for a consumer to invest in a solar PV project is no longer driven only by generation costs and direct or indirect (e.g. through net energy metering) remuneration for feeding electricity into the grid. In addition, profitability at socket parity also depends on the possible savings on the electricity bill, which in turn depend on the rate structure and the amount of electricity consumed that can be covered directly with self-generated power. Furthermore, the amount of self-consumed electricity could be increased with demand side integration or some storage capacities. Accounting for these factors further increases the analytical complexity, though the impact differs for the two sub-segments.
Residential market
Households frequently have low levels of minimum daytime consumption and there are times during the day during which a single household would tend to consume rather low level of electricity. During such instances, solar PV production needs to be fed into the power grid in order to avoid curtailment, and therefore the economic attractiveness of installing a solar PV system depends on the ability to feed surplus production into the grid and on the availability of remuneration at attractive rates.
This situation raises a number of challenges to forecasting residential solar PV development. The magnitude of deployment will vary between consumer groups, depending how well their load matches generation as well as on the policy and regulatory risks associated with remuneration of surpluses. While household-level figures on consumption and solar PV generation are increasingly available, their use for efficiently forecasting market potential across a large set of markets is hindered by the large volumes and the often proprietary nature of the data. .
A second factor is the structure of electricity rates, in particular the way network costs are allocated to consumers. As a rule, self-consumption is more attractive where the retail price of electricity is high and where grid costs are allocated per unit of energy consumed (rather than charged as a fixed connection cost). Residential tariffs are usually publically available, which in principle allows for an assessment of the economic attractiveness of self-consumption. However, data aggregation challenges and possible changes of tariff structure in response to solar PV uptake complicate forecast development.

RENEWABLE ELECTRICITY: GLOBAL TECHNOLOGIES
MEDIUM-TERM RENEWABLE ENERGY MARKET REPORT 2015 191
Box 8 The challenging forecast of distributed PV (continued)
Finally, project profitability represents only one driver among a set of factors that decide if and when a solar PV system will be installed. Transaction costs, including lack of knowledge of the commercial opportunity, permitting ownership structure, maturity of local supply chain, including availability of installers, financing costs, will tend to slow market uptake. By contrast, non-monetary considerations such as environmental awareness or positive response by social peers may accelerate deployment. These factors require further metrics and deeper analysis to evaluate on a cross-market basis.
Commercial market
The minimum daytime load consumption of buildings such as supermarkets, office buildings, and hospitals is often significant and the temporal structure of electricity demand is often well correlated with daylight hours, for example in the case of schools. In some cases, options for demand side integration may offer large possibilities – such as generation of cold for 24/24 refrigeration from daytime ice-making. .As a result, the remuneration of excess production may be of less importance than for the residential segment, because the output of fairly large systems could be (nearly) fully self-consumed. Thus, load and generation data can afford to have a somewhat lower temporal resolution without jeopardising analytical accuracy.
However, the structure of electricity rates is considerably more complex in the commercial segment, and tariffs often separate capacity-related and energy-related charges. For instance, the US government recognizes 4 600 utilities and over 13 000 different commercial rate structures (RETD, forthcoming). Moreover, rates are often not publically available in markets that have introduced full retail competition. Taken together, this means that economics will vary on a project by project basis and hence a comprehensive, bottom-up analysis is needed to gain a full picture of possible market evolutions.
In addition to direct project economics, transaction costs may also play a role in driving market dynamics. Where commercial space is rented, challenges related to establishing long-term supply agreements and the ownership structure of the building and solar PV system can slow deployment significantly.
Conclusions
The specific nature of distributed solar PV poses a number of challenges for the establishment of robust forecasts, in particular in the residential and commercial market segments. Historic deployment patterns provide valuable insights into the different dynamics observed in each sub category, with residential systems showing a smoother deployment increase over time and commercial systems exhibiting very rapid deployment increases where economic conditions are favourable. Socket parity is adding an additional driver for solar PV deployment, although the interplay of several, diverse factors shape ultimate deployment outcomes.
In summary, the forecast for these market segments carries a high degree of uncertainty. As more markets undergo the onset of solar PV on the basis of socket parity, the empirical basis for market dynamics is bound to grow, thus giving analyst a richer historical basis on which to base the mid-term forecast. A more widespread availability of typical load and generation data, combined with comprehensive, standardised databases for electricity rates would be instrumental in improving forecast robustness could aid policy makers and other stakeholders in anticipating mid-term market reaction.
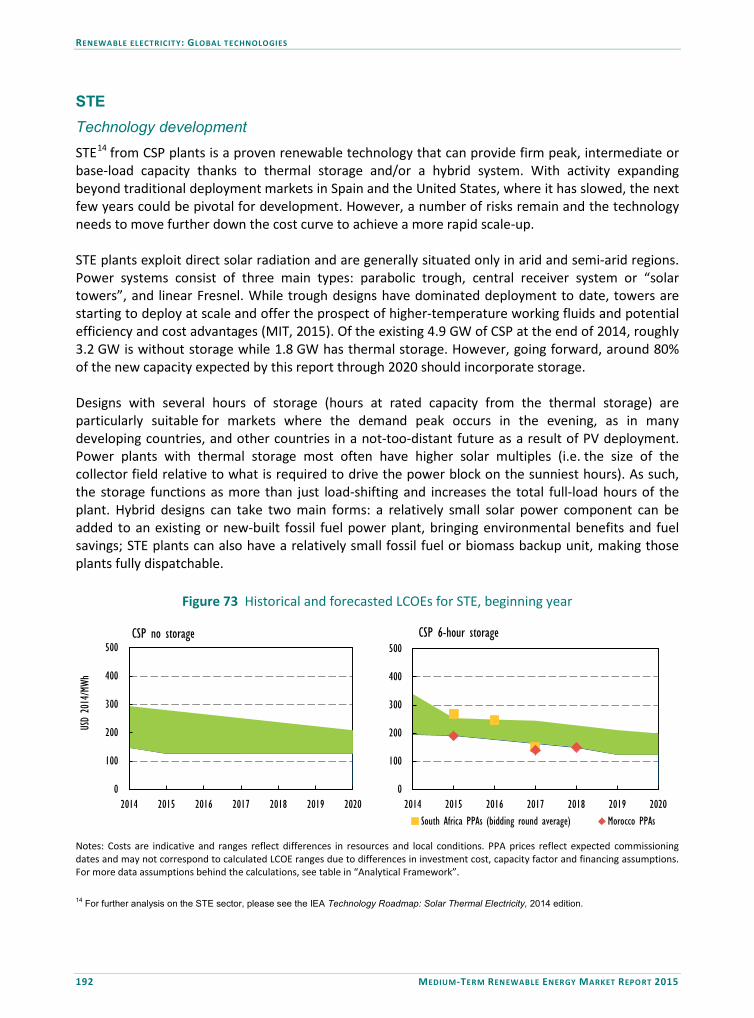
RENEWABLE ELECTRICITY: GLOBAL TECHNOLOGIES
192 MEDIUM-TERM RENEWABLE ENERGY MARKET REPORT 2015
STE Technology development STE14 from CSP plants is a proven renewable technology that can provide firm peak, intermediate or base-load capacity thanks to thermal storage and/or a hybrid system. With activity expanding beyond traditional deployment markets in Spain and the United States, where it has slowed, the next few years could be pivotal for development. However, a number of risks remain and the technology needs to move further down the cost curve to achieve a more rapid scale-up. STE plants exploit direct solar radiation and are generally situated only in arid and semi-arid regions. Power systems consist of three main types: parabolic trough, central receiver system or “solar towers”, and linear Fresnel. While trough designs have dominated deployment to date, towers are starting to deploy at scale and offer the prospect of higher-temperature working fluids and potential efficiency and cost advantages (MIT, 2015). Of the existing 4.9 GW of CSP at the end of 2014, roughly 3.2 GW is without storage while 1.8 GW has thermal storage. However, going forward, around 80% of the new capacity expected by this report through 2020 should incorporate storage. Designs with several hours of storage (hours at rated capacity from the thermal storage) are particularly suitable for markets where the demand peak occurs in the evening, as in many developing countries, and other countries in a not-too-distant future as a result of PV deployment. Power plants with thermal storage most often have higher solar multiples (i.e. the size of the collector field relative to what is required to drive the power block on the sunniest hours). As such, the storage functions as more than just load-shifting and increases the total full-load hours of the plant. Hybrid designs can take two main forms: a relatively small solar power component can be added to an existing or new-built fossil fuel power plant, bringing environmental benefits and fuel savings; STE plants can also have a relatively small fossil fuel or biomass backup unit, making those plants fully dispatchable.
Figure 73 Historical and forecasted LCOEs for STE, beginning year
0
100
200
300
400
500
2014 2015 2016 2017 2018 2019 2020
USD
2014
/MWh
CSP no storage
0
100
200
300
400
500
2014 2015 2016 2017 2018 2019 2020
CSP 6-hour storage
South Africa PPAs (bidding round average) Morocco PPAs Notes: Costs are indicative and ranges reflect differences in resources and local conditions. PPA prices reflect expected commissioning dates and may not correspond to calculated LCOE ranges due to differences in investment cost, capacity factor and financing assumptions. For more data assumptions behind the calculations, see table in “Analytical Framework”.
14 For further analysis on the STE sector, please see the IEA Technology Roadmap: Solar Thermal Electricity, 2014 edition.
RENEWABLE ELECTRICITY: GLOBAL TECHNOLOGIES
MEDIUM-TERM RENEWABLE ENERGY MARKET REPORT 2015 193
Storage and hybridisation features enable STE to provide significant value in meeting evening peak demand and offering a variety of additional ancillary services to power systems that could not currently be covered by solar PV, for example. The relatively high upfront investment costs of STE can make project bankability difficult. For large plants (at least 50 MW) investment costs are USD 4 000/kW to USD 9 000/kW, depending on the solar field size, the storage size, and labour and land costs. The lumpy nature and technological variety of STE additions make costs difficult to track and harmonise; recent plant start-ups and financings provide an indicator of the trend. For example, in the United States, the 280 MW (250 MW net) Solana plant, with six hours of storage, was completed in 2013 at an approximate cost of USD 7 600/kW. The 250 MW Genesis plant, without storage, was fully commissioned in 2014 at an approximate cost of USD 5 000/kW. Over the medium term, the investment costs of STE plants are expected to decline with further deployment. For example, the solar field, whose size is linked to the amount of electric output, represents about half of the investment cost. Some developers are seeking to increase electric conversion efficiency, mainly through higher temperatures and pressures, in order to downsize the solar field. Achieving this would require the replacement of current heat transfer fluid (synthetic oil) with direct steam generation or molten salts (IEA, 2014d). An increased scale-up of thermal storage using molten salts – with STE or other generation types – could help to further decrease costs. Storage mandates, such as in California where utilities are required to procure 1.3 GW of energy storage by 2020, could stimulate further learning in this area. In all, by 2020, STE investment costs in the United States could decline to around USD 3 000-4 000/kW, with 6 hours of storage, and USD 4 500-5 500/kW for 12 hours of storage. Still, as enumerated above, cost reductions face a number of uncertainties, and significant investment cost differences remain between and within markets. For example, investment costs for a plant expected in 2018, with 9-12 hours of storage, have been reported around USD 8 000-9 000/kW in South Africa (IEA, 2015c). However, this data point may not fully represent the cost dynamics of other plants tendered under the REIPPPP. The LCOE of STE varies widely with the location, technology, design and intended use of the plant. The LCOE, while providing a useful indicator, does not capture the entire economic balance of an STE plant, which depends on the value of the generated electricity. Public data points relative to FiT levels and PPAs provide indirect information relative to LCOEs, although they might significantly differ. Spanish plants had benefited from FiTs near EUR 300/MWh (USD 400/MWh), and 40% of them have seven-hour storage. Recent PPAs in sunnier countries are at half that level or below. In January, Phase II of the Noor CSP plant at Ouarzazate in Morocco, a 200 MW trough plant with seven hours of storage, secured a PPA at 1.36 dirhams (MAD) per kilowatt hour (USD 0.14/kWh), and Phase III, a 150 MW tower plant with seven to eight hours of storage, was awarded for MAD 1.42/kWh (USD 0.15/kWh). Preferred bidder prices in South Africa’s REIPPPP have decreased over time, with third-round tariffs signed around 1 675 rand (ZAR) per megawatt hour (USD 150/MWh); these include a 270% multiplier at peak times to remunerate the value of storage. Over the medium term, STE LCOEs are expected to decline in line with assumed capital cost reductions and the commissioning of contracted projects. Market status and outlook – main case STE deployment continues to spread out to newer markets, though the bulk of commercially operating capacity to date remains concentrated in the United States and Spain. In 2014, global STE cumulative capacity grew by around 1 GW to 4.9 GW, with growth somewhat lower than in 2013 due to the timing of large additions in the United States.

RENEWABLE ELECTRICITY: GLOBAL TECHNOLOGIES
194 MEDIUM-TERM RENEWABLE ENERGY MARKET REPORT 2015
The United States accounted for 80% of global additions, with the commissioning of the 280 MW Mojave plant, all three phases of Ivanpah (392 MW) and the second phase (125 MW) of the 250 MW Genesis plant.15 The Ivanpah plant, the world’s largest tower development, experienced a difficult start but ramped up generation over the course of 2014 and 2015, generating three times more electricity in February 2015 than it did in February 2014. However, it had not yet met its full-rated performance, which may take several years. In 2015, the 110 MW Crescent Dunes development, with 10 hours of thermal storage, was slated for commissioning. These projects had benefited from the US Department of Energy’s former loan guarantee programme, which helped investors to access more attractive financing terms than in its absence. Spain’s cumulative capacity remained at 2.3 GW in 2014. No new projects are in the development pipeline there, and existing STE generators in Spain have come under increased economic stress. In an effort to reduce the country’s tariff deficit, the government has, over time, instituted a series of retroactive changes to incentives. It has also adopted measures to revise the remuneration given to existing renewable generators, imposing a “reasonable profitability” return that replaces FiTs. Still, earlier this year the government announced intentions to raise STE capacity to over 2.5 GW by 2020. Significant STE capacity was also added in India in 2014, with the commissioning of two plants (175 MW total) under the JNNSM. The first plants allocated under the JNNSM have faced setbacks, including the downgrading of the solar resource for STE plants in many areas. An additional 0.3 GW is under development, but some are experiencing delays due to some economic, technical and supply chain challenges, and there is uncertainty over their ultimate completion. No indications had emerged of further commissioning in 2015 as part of the remaining allocated capacity.
Table 38 STE capacity and forecast by region (GW)
2013 2014 2015 2016 2017 2018 2019 2020 OECD 3.6 4.5 4.7 4.7 5.1 5.4 5.6 6.0
OECD Americas 1.4 2.2 2.3 2.3 2.5 2.8 2.9 3.3 OECD Asia Oceania 0.0 0.0 0.1 0.1 0.3 0.3 0.3 0.3 OECD Europe 2.3 2.3 2.3 2.3 2.3 2.3 2.4 2.4
Non-OECD 0.3 0.4 1.0 1.2 1.7 2.2 2.5 2.9 Africa 0.1 0.1 0.3 0.4 0.7 1.1 1.2 1.3 Asia 0.1 0.2 0.4 0.4 0.5 0.5 0.5 0.5 China 0.0 0.0 0.2 0.2 0.3 0.3 0.5 0.6 Non-OECD Europe – – – – – – – – Non-OECD Americas – – – – – – – – Middle East 0.1 0.1 0.1 0.1 0.2 0.3 0.4 0.4
Total 3.9 4.9 5.7 5.8 6.7 7.5 8.2 8.9
Sources: 2013 OECD data derived from IEA (2015c), “OECD - Net capacity of renewables”, IEA Renewables Information Statistics (database); 2013 non-OECD data and 2014 data are IEA estimates based on NREL (2015), Concentrating Solar Power Projects; and SEIA/GTM Research (2015), US Solar Market Insight.
15 In MTRMR 2014, Ivanpah was reported as commencing in 2013; final declaration of operational start under the PPAs occurred in January 2014, prompting the revision in this year’s edition.
RENEWABLE ELECTRICITY: GLOBAL TECHNOLOGIES
MEDIUM-TERM RENEWABLE ENERGY MARKET REPORT 2015 195
Over the medium term, STE should scale up to around 9 GW in 2020. But this outlook is less optimistic than that in MTRMR 2014, when capacity was expected to be 2 GW more. This is largely due to less-optimistic expectations for the Middle East, the United States and India. Meanwhile, the outlook for Africa (largely Morocco and South Africa) remains stable, and that for Chile is higher. The project pipeline in the United States is potentially significant, but there is less visibility over committed new capacity additions beyond 2015. The planned reduction of the ITC at the end of 2016, combined with permitting challenges, high upfront financing needs and competition from solar PV, which has experienced more rapid cost declines, all make the development situation challenging. This report’s main case estimates cumulative capacity at 2.3 GW in 2020, from 2.1 GW in 2014, but with uncertainty, depending on the status of several large projects. The ultimate passage of legislation to raise California’s RPS to 50% in 2030 (from 33% in 2020) could provide a long-term boost to the sector, however, together with the increasing need to address rapid power ramp-up of net-of-PV load when the sun sets. Elsewhere in the OECD, notable deployment is expected in Chile and Israel, with smaller additions in France, Mexico and Turkey, with Australia and Italy as wild cards. The forecast for Chile has been raised to 0.9 GW cumulative capacity in 2020, versus 0.6 GW in MTRMR 2014. A combination of excellent resources, high electricity prices, stable 24-hour demand needs from the mining industry, and the availability of grants and concessional financing from the government have stimulated a robust pipeline of CSP with storage, including several STE/PV combined plants. In Israel, the 230 MW (over two phases) Ashalim plant has started construction with partial financing from the European Investment Bank and remuneration expected from a 25-year PPA awarded through the government’s auction scheme. In Australia, the 44 MW Kogan Creek Solar Boost project integrating solar thermal generation with a coal-fired plant is expected on line in 2015. Still, the outlook for further development in Australia for STE remains tepid, given a recent downward revision to the country’s large-scale renewable target for 2020. In Italy, a FiT has been instituted to support deployment of 600 MW of STE plants, and 390 MW are in deployment stage, notably in Sardinia and Sicily, but it is yet unclear how much could effectively come on line by 2020. One specific difficulty for STE in Italy is that the Italian understanding on the Seveso directive does not allow using oil as heat transfer fluid, obliging the developers to choose either direct steam generation concepts that do not easily lend towards storage, or molten salts as both storage medium and heat transfer fluid, which in linear system lacks large-scale demonstration. In the non-OECD non-members, the outlook for China, at 0.6 GW in 2020 is relatively steady versus MTRMR 2014. Despite a deployment target of 3.0 GW by 2020, few commercial-scale capacity additions have been made, partly due to insufficiently attractive economics. STE plants benefit from a FiT roughly equal to that of solar PV, which has not stimulated significant deployment. Still, STE’s flexibility and hybridisation capability could provide value in terms of power market integration, particularly with coal-fired generation. The Delingha plant currently under construction in Qinghai province – a joint venture between US BrightSource and Shanghai Electric– will eventually gather six solar towers of 135 MW each, with 3 hours storage. Its first production is expected to be delivered by 2017. India’s outlook is reduced somewhat, to 0.5 GW in 2020, with uncertainties over project delivery and the timing of future tenders under the JNNSM. The government has set a solar power target of 100 GW by 2022 (versus 22 GW previously), but has not elaborated on the foreseen role of STE under these new ambitions.
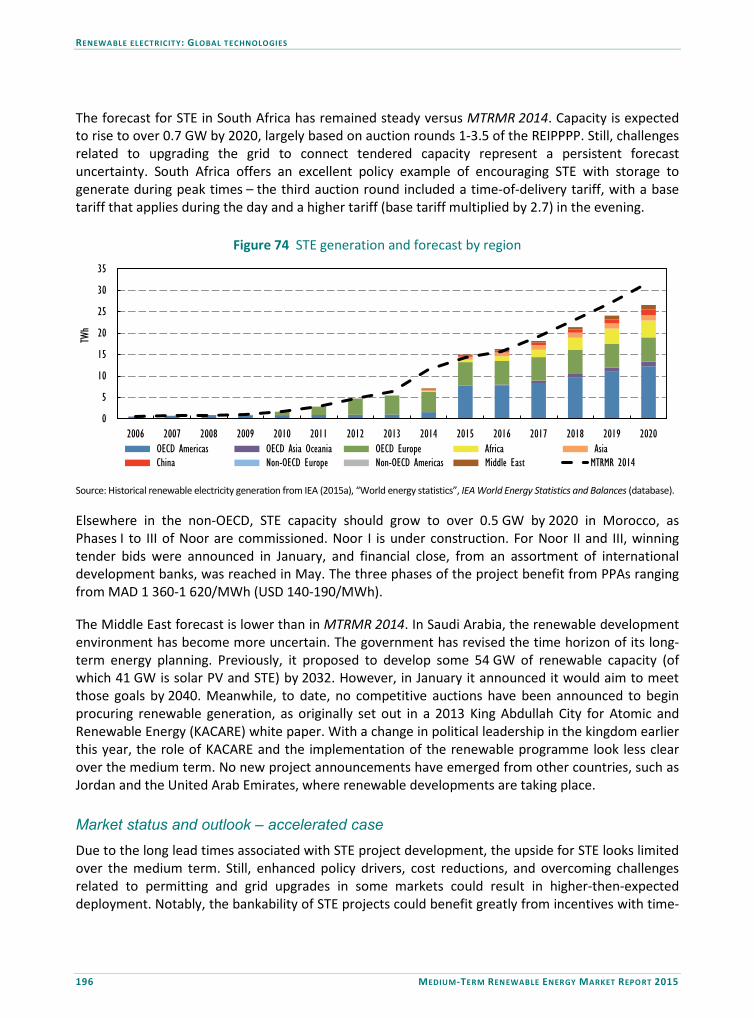
RENEWABLE ELECTRICITY: GLOBAL TECHNOLOGIES
196 MEDIUM-TERM RENEWABLE ENERGY MARKET REPORT 2015
The forecast for STE in South Africa has remained steady versus MTRMR 2014. Capacity is expected to rise to over 0.7 GW by 2020, largely based on auction rounds 1-3.5 of the REIPPPP. Still, challenges related to upgrading the grid to connect tendered capacity represent a persistent forecast uncertainty. South Africa offers an excellent policy example of encouraging STE with storage to generate during peak times – the third auction round included a time-of-delivery tariff, with a base tariff that applies during the day and a higher tariff (base tariff multiplied by 2.7) in the evening.
Figure 74 STE generation and forecast by region
0
5
10
15
20
25
30
35
2006 2007 2008 2009 2010 2011 2012 2013 2014 2015 2016 2017 2018 2019 2020
TWh
OECD Americas OECD Asia Oceania OECD Europe Africa Asia China Non-OECD Europe Non-OECD Americas Middle East MTRMR 2014
Source: Historical renewable electricity generation from IEA (2015a), “World energy statistics”, IEA World Energy Statistics and Balances (database). Elsewhere in the non-OECD, STE capacity should grow to over 0.5 GW by 2020 in Morocco, as Phases I to III of Noor are commissioned. Noor I is under construction. For Noor II and III, winning tender bids were announced in January, and financial close, from an assortment of international development banks, was reached in May. The three phases of the project benefit from PPAs ranging from MAD 1 360-1 620/MWh (USD 140-190/MWh). The Middle East forecast is lower than in MTRMR 2014. In Saudi Arabia, the renewable development environment has become more uncertain. The government has revised the time horizon of its long-term energy planning. Previously, it proposed to develop some 54 GW of renewable capacity (of which 41 GW is solar PV and STE) by 2032. However, in January it announced it would aim to meet those goals by 2040. Meanwhile, to date, no competitive auctions have been announced to begin procuring renewable generation, as originally set out in a 2013 King Abdullah City for Atomic and Renewable Energy (KACARE) white paper. With a change in political leadership in the kingdom earlier this year, the role of KACARE and the implementation of the renewable programme look less clear over the medium term. No new project announcements have emerged from other countries, such as Jordan and the United Arab Emirates, where renewable developments are taking place. Market status and outlook – accelerated case Due to the long lead times associated with STE project development, the upside for STE looks limited over the medium term. Still, enhanced policy drivers, cost reductions, and overcoming challenges related to permitting and grid upgrades in some markets could result in higher-then-expected deployment. Notably, the bankability of STE projects could benefit greatly from incentives with time-
RENEWABLE ELECTRICITY: GLOBAL TECHNOLOGIES
MEDIUM-TERM RENEWABLE ENERGY MARKET REPORT 2015 197
of-delivery provisions, so as to remunerate the value that associated storage could bring to meeting evening peak demand. In all, global STE capacity could be up to 4 GW higher than under the main case with accelerated deployment. References AEBIOM (2015), European Bioenergy Outlook 2014, European Biomass Association, Brussels. Agrawal, B. (2013), India Solar PV Auctions: Prices, Successes and Failures, Agrawal, B. (2015), India’s Latest Solar PV Auction Prices Trends. Atlantis (2015), Atlantis Announcements: Acquisition of Marine Current Turbines Limited from Siemens, (accessed in June 2015). Argus Media (2015), “South Korea has 'no plans' for biomass cap”, 11 February, www.argusmedia.com/mkting/bioenergy/asian-biomass-news-updates. Barbose G., S. Weaver and N. Darghouth (2014), Tracking the Sun VII, Lawrence Berkeley National Laboratory/US Department of Energy, Berkeley. BP (2014), BP Statistical Review of World Energy 2014, BP, London. Bridge to India (2014), India Solar Rooftop Map 2015, Bridge to India, Gurgaon. Bundesnetzagentur (2015), Zuschlagswert der zweiten Ausschreibungsrunde für Freiflächenanlagen, Press Release Bundesnetzagentur, Berlin. BVG Associates (2015), Future Renewable Energy Costs: Offshore Wind, KIC InnoEnergy, London. Clean Energy Pipeline (2014), Offshore Wind Project Cost Outlook 2014 Edition, Clean Energy Pipeline, London. CT GOV (Australian Capital Territory) (2015), Wind auction result delivers renewable energy and economic benefits to the ACT, Media Release, Canberra. Cummins Power Generation (2014), “Cummins Power Generation project in Kenya paves the way for African biogas expansion”, 27 August, www.cumminspowerblog.com/en/2014/08/27/cummins-power-generation-project-kenya-paves-way-african-biogas-expansion/. CWEA (Chinese Wind Energy Association) (2015), Annual Report 2014, CWEA, Beijing. DECC (Department for Energy and Climate Change) (2015), Woodfuel Guidance, DECC, London, www.gov.uk/government/publications/woodfuel-guidance. Deutsche WindGuard (2015), “Status of land-based wind energy development in Germany”, Deutsche WindGuard, Varel,
RENEWABLE ELECTRICITY: GLOBAL TECHNOLOGIES
198 MEDIUM-TERM RENEWABLE ENERGY MARKET REPORT 2015
www.windguard.com/_Resources/Persistent/f3d1f50839eb7c674f6261c1ef4b3f61c27ee0aa/Factsheet-Status-of-Land-based-Wind-Energy-Development-in-Germany-Year-2014.pdf. DOE (Department of Energy) (2015), 2014 Wind Technologies Market Report, US DOE, Washington D.C. Ends Waste & Bioenergy (2014), “Norwegians to build 600MW biomass plant in Ghana”, 21 November, www.endswasteandbioenergy.com/article/1323029/norwegians-build-600mw-biomass-plant-ghana. EPE (Empresa de Pesquisa Energética)(2014a), 20º Leilão de Energia Nova A-5 Resumo Vendedor, [20th New Energy Auction A-5 Seller Summary], EPE, Rio de Janiero, www.epe.gov.br/leiloes/Documents/Leil%C3%B5es%202014/Resumo_Vendedor_20len_a5.pdf. EPE (2014b), 6º Leilão de Energia de Reserva tem deságio de 9,94%, EPE, São Paulo. EPE (2013), Contratados 1.265 MW No Primeiro Leilao de Energia Eléctrica para o Ano 2018 [1.265 MW Contracted in the First Auction of Electric Energy for the Year 2018], EPE, Rio de Janiero, www.epe.gov.br/imprensa/PressReleases/20130829_1.pdf. ETESA (Empresa de Transmisión Eléctrica, S.A) (2015), Resolution No GD-01-2015, ETESA, El Dorado. EWEA (European Wind Energy Association) (2015), The European Offshore Wind Industry: Key Trends and Statistics 2014, EWEA, Brussels. EWEA (2014), The European Offshore Wind Industry: Key Trends and Statistics 2013, EWEA, Brussels Feldman, D., R. Margolis and D. Boff (2015), Q4’14/Q1’15 Solar Industry Update, US Department of Energy, Washington, D.C. Fichter Prognos (2013), Cost Reduction Potentials of Offshore Wind Power in Germany, Prognos AG, Berlin. Flach, B. (2015), Netherlands – Legislation on Biomass Sustainability Criteria, USDA Foreign Agricultural Service, Washington, DC, http://gain.fas.usda.gov/Recent%20GAIN%20Publications/Legislation%20on%20Biomass%20Sustainability%20Criteria_The%20Hague_Netherlands_4-20-2015.pdf. Gamesa (2015), “Activity report January-December 2014”, Gamesa Corporation, Madrid, http://www.gamesacorp.com/recursos/doc/accionistas-inversores/informacion-financiera/resultados-trimestrales/2014/activity-report-fy-2014.pdf. GEA (Geothermal Energy Association) (2015), 2015 Annual U.S. & Global Power Production Report, GEA, Washington, D.C. GGA (Global Geothermal Alliance) (2014), Global Geothermal Alliance Action Statement and Action Plan, GGA, New York.

RENEWABLE ELECTRICITY: GLOBAL TECHNOLOGIES
MEDIUM-TERM RENEWABLE ENERGY MARKET REPORT 2015 199
GWEC (Global Wind Energy Council) (2014), Global Wind Statistics 2013, GWEC, Brussels. Henderson, C. (2015), “Co-firing of biomass in coal-fired power plants – European experience”, presentation at Foreign and Commonwealth Office (FCO)/IEA Clean Coal Centre (CCC) workshops on policy and investment frameworks to introduce clean coal technology (CCT) in Hebei and Shandong provinces, China, 8-9 and 13-14 January 2015, www.iea-coal.org.uk/documents/83524/9188/Henderson---Cofiring-of-biomass-in-coal-fired-power-plants-%E2%80%93-European-experience. Hojgaard-Nielsen, G. (2014), “Dong Energy thermal power”, presentation at Avedøre Power Station, 31 October 2014, http://report.nat.gov.tw/ReportFront/report_download.jspx?sysId=C10304201&fileNo=002. HydroQuebec (2014), “Hydro-Québec Distribution accepts 3 bids totalling 446.4 MW”, HydroQuevec, Montreal. IEA (International Energy Agency) (2015a), “World energy statistics”, IEA World Energy Statistics and Balances (database), DOI: http://dx.doi.org/10.1787/data-00510-en, (accessed [August 2015]). IEA (2015b), World Energy Outlook 2015, OECD/IEA, Paris. IEA (2015c), “OECD - Net capacity of renewables”, IEA Renewables Information Statistics (database), DOI: http://dx.doi.org/10.1787/data-00467-en, (accessed [August 2015]). IEA (2015d), Medium-Term Gas Market Report 2015, OECD/IEA, Paris. IEA (2015e), Projected Costs of Generating Electricity 2015, OECD/IEA, Paris. IEA (2015f), Energy Technology Perspectives 2015, OECD/IEA, Paris. IEA (2014c), Technology Roadmap: Solar Photovoltaic Energy, OECD/IEA, Paris. IEA (2014d), Technology Roadmap: Solar Thermal Electricity, OECD/IEA, Paris. IEA (2012a), Technology Roadmap: Bioenergy for Heat and Power, OECD/IEA, Paris. IEA (2012b), Technology Roadmap: Hydropower, OECD/IEA, Paris. IEA (2000), Experience Curves for Energy Technology Policy, OECD/IEA, Paris. IEA Bioenergy (2015), Factsheets Biorefineries, www.iea-bioenergy.task42-biorefineries.com/en/ieabiorefinery/Factsheets.htm.

RENEWABLE ELECTRICITY: GLOBAL TECHNOLOGIES
200 MEDIUM-TERM RENEWABLE ENERGY MARKET REPORT 2015
IEA-OES (Implementing Agreement for a Co-operative Programme on Ocean Energy Systems) (2015a), Annual Report 2014, IEA-OES, Lisbon. IEA-OES (2015b), International LCOE for Ocean Energy Technologies, IEA-OES, Lisbon. IEA-PVPS (Implementing Agreement for a Co-operative Programme on Photovoltaic Power Systems) (2014), National Survey Report of PV Power Applications in Japan 2013, IEA-PVPS, St. Ursen, Switzerland. IEA-PVPS (2015a), PV Cost Data for the IEA, dataset provided to IEA. IEA-PVPS (2015b), A Snapshot of Global PV Markets, IEA-PVPS, St. Ursen, Switzerland. Indian Ministry of New and Renewable Energy (2015), Physical Progress (Achievements), http://mnre.gov.in/mission-and-vision-2/achievements/. IIJD (International Journal on Hydropower & Dams) (2014), 2014 World Atlas and Industry Guide, Aqua Media International Ltd., Surry, UK. International Law Office (2015), Energy & Natural Resources – Poland, New Renewables Legislation, International Law Office, London, www.internationallawoffice.com/newsletters/detail.aspx?g=85e98ee4-e0bc-48c6-a793-3b246f2fe456 (accessed April 2015). IRENA (International Renewable Energy Agency) (2015a), Renewable Power Generation Costs in 2014, IRENA, Bonn. IRENA (2015b), “Hydropower technology brief”, IEA-ETSAP and IRENA Technology Brief, E06 – February 2015, IRENA, Bonn. IRENA (2015c), Renewable Energy and Jobs – Annual Review 2015, IRENA, Bonn. Kohli, G. (2015), “Why net-metering is failing – Part 2 – The DISCOM’s side of the story”, 13 May, Bridge to India, Gurgaon, www.bridgetoindia.com/blog/why-net-metering-is-failing-part-2-the-discoms-side-of-the-story/. Kuang, M., A. Sethia, J. Wu and S. Allport (2015), H1 2015 Southeast Asia Market Outlook, Bloomberg New Energy Finance, London. Low Carbon Contracts Company (2015), CFD Register, Low Carbon Contracts Company, London https://lowcarboncontracts.uk/cfds (accessed June 2015). MIT (Massachusetts Institute of Technology) (2015), The Future of Solar Energy, MIT, Cambridge. Mugnier, A. (2015), “A successful example of energy generation from forest biomass: E.ON Gardanne”, presentation at Mediterranean Forest Week, Barcelona, 17 March 2015,

RENEWABLE ELECTRICITY: GLOBAL TECHNOLOGIES
MEDIUM-TERM RENEWABLE ENERGY MARKET REPORT 2015 201
http://med.forestweek.org/sites/default/files/press/a._mugnier_a_successful_example_of_energy_generation_from_forest_biomass_e.on_gardanne.pdf. NC Clean Energy Technology Center and Meister Consultants (2015), The 50 States of Solar Q1 2015, NC Clean Energy Technology Center, Raleigh. NDRC (National Development and Reform Commission) (2015), Notice No 3008 on onshore wind fixed tariff adjustment, NDRC, Beijing. NEA (National Energy Administration) (2015), “Regulatory announcement 2015 on 10 numbers”, http://zfxxgk.nea.gov.cn/auto92/201505/t20150515_1921.htm?keywordsWEC 2015. Nordex (2015), “2014 annual report Nordex SE, Nordex SE, Hamburg, www.nordex-online.com/fileadmin/MEDIA/Geschaeftsberichte/Nordex_SE_GB2014_en.pdf Nova Scotia Department of Energy (2015), Developmental Tidal Feed-in Tariff Program, http://energy.novascotia.ca/renewables/programs-and-projects/tidal-fit. NREL (National Renewable Energy Laboratory) (2015), Concentrating Solar Power Projects, NREL, Golden, Colorado. Ontario Ministry of Energy (2015), “Creating cleaner air in Ontario”, 15 April, http://news.ontario.ca/mei/en/2014/04/creating-cleaner-air-in-ontario-1.html. Platts (2015), World Electric Power Plants Database March 2015 edition, McGraw-Hill Companies, New York. PvXchange (2015), pvXchange Price Index (database), www.pvxchange.com/priceindex/ (accessed May 2015). REEEP (Renewable Energy and Energy Efficiency Partnership) (2014), Ethiopia, www.reeep.org/ethiopia-2014, REIPPPP (Renewable Energy Independent Power Producer Procurement Programme) (2015), BW4 Preferred Bidder Announcement, Cape Town. REN 21 (Renewable Energy Policy Network for the 21st Century) (2014), Renewables 2014 Global Status Report, REN21 Secretariat, Paris. RETD (Renewable Energy Technology Deployment) (forthcoming), COMMERCIAL PROSUMERS – DEVELOPMENT AND POLICY OPTIONS, International Energy Agency Renewable Energy Technology Deployment Implementing Agreement, once published available online at http:// http://iea-retd.org/. Roscoe, A. and Wilkinson, P. (2015), GDF Suez submits lowest bid for Egypt wind farm, Middle East Business Intelligence, Abu Dhabi.
RENEWABLE ELECTRICITY: GLOBAL TECHNOLOGIES
202 MEDIUM-TERM RENEWABLE ENERGY MARKET REPORT 2015
SEIA (Solar Energy Industries Association)/GTM Research (Greentech Media) (2015), US Solar Market Insight, GTM and SEIA, Washington, D.C. SPV (Solar PV) Market Research (2015), Global Analysis of the Markets for Solar Products & Five Year Forecast 2014/2015, SPV Market Research, San Jose. Thrän, D., Hennig, C., Rensberg, N., Denysenko, V., Fritsche, U.R., Eppler, U. (2015), IEA Bioenergy Task 40: Country Report Germany 2014, DBZF/IINAS, Leipzig/Darmstadt. Tsagas, I. (2015), Jordan’s second PV tender leads to record low tariffs, PV Magazine, Berlin. UK Trade & Investment (2014), UK Offshore Wind: Opportunities for Trade and Investment, Green Investment Bank, London. UNECE (United Nations Economic Commission for Europe)/FAO (Food and Agriculture Organization) (2015), Forest Products Annual Market Review 2014-2015, UNECE/FAO, Geneva. World Energy Council & BNEF (2013), World Energy Perspective – Cost of Energy Technologies, World Energy Council, London. Vestas (2015), “Annual report 2014”, Vestas Wind Systems, Copenhagen, www.vestas.com/en/media/~/media/db46617ac81648bf98b9ab73146acb55.ashx.
INVESTMENT IN RENEWABLE POWER
MEDIUM-TERM RENEWABLE ENERGY MARKET REPORT 2015 203
INVESTMENT IN RENEWABLE POWER Summary • Global new investment in renewable power capacity was estimated around USD 270 billion
in 2014, down slightly versus that in 2013. In 2014, global renewable net capacity additions reached their highest level to date, at near 130 gigawatts (GW), and represented almost half of global new capacity additions. The lower investment in the face of higher capacity additions stems from continuous cost reductions mainly in solar photovoltaics (PV) and onshore wind and the evolving regional distribution of installed capacity.
• In 2014, member countries of the Organisation for Economic Co-operation and Development
(OECD) still led investment in new renewable energy capacity with USD 140 billion, 3% lower than in 2013. Annual investment increased in OECD Asia Oceania led by large solar PV deployment in Japan, and in OECD Americas as onshore wind deployment picked up in the United States. However, it decreased by over 24% in OECD Europe with solar PV additions plummeting in 2014. The OECD share in new investment peaked in 2012 with record-high onshore wind additions in the United States, and has been decreasing since.
• China represented over 30% of global annual renewable capacity investment in 2014 at over
USD 80 billion. However, this was a decrease of 15% from 2013, due to lower year-on-year hydropower additions and unit cost reductions of solar PV. In non-OECD Americas, annual investment reached a new peak in 2014 and marked a more than 65% year-on-year increase due to wind additions in Brazil.
• Over the medium term, renewable investment needs are expected to remain high by historical
standards and the trend is dynamic but volatile. Annual investment is seen decreasing over 2016/17 with the expiration of federal incentives in the United States; then it should rebound thereafter. Required cumulative investment in new renewable power capacity under this report’s main case forecast is over USD 1 690 billion, or on average above USD 240 billion annually, in real terms, through 2020.
• The investment forecast stems from two factors: first, slowing capacity growth, overcapacity
in some power markets and policy uncertainties are likely to limit investment gains in the OECD, even with a need to replace retiring conventional capacity in some markets. This more sluggish outlook for the OECD is compensated by generally expanding investment in non-OECD countries. Yet many non-OECD countries, such as those in the Middle East and Africa, remain at the inception or early take-off phase of renewable development. They generally face still higher costs of capital, domestic financing constraints and non-economic barriers to deployment.
• Second, increasingly cost-effective deployment for the most dynamic renewable technologies,
such as solar PV and onshore wind, are likely to put downward pressure on investment expenditures versus historically, even as annual deployment in some technologies continues to grow. Wind (onshore and offshore) plus solar PV make up two-thirds, or USD 900 billion, of new cumulative investment needs to 2020. Due to persistent declines in investment costs, capacity increases for these technologies can be made at a lower total outlay than in the past. The unit

INVESTMENT IN RENEWABLE POWER
204 MEDIUM-TERM RENEWABLE ENERGY MARKET REPORT 2015
costs of more mature technologies such as hydropower and bioenergy are seen to remain relatively stable. Increased deployment of higher-cost technologies such as offshore wind and solar thermal electricity (STE) would support greater investment needs towards the end of the forecast period.
• Cost of capital reductions could help capital-intensive renewable technologies in somemarkets to close the gap with other generating technologies. While a number of actions couldhelp to reduce risks, long-term policy frameworks that offer a degree of revenue certainty, oftenawarded through price competition for long-term power purchase agreements (PPAs), havebeen important in improving financing conditions for capital-intensive renewable technologies.As a result, some very low contract prices for wind and solar PV have been awarded over thepast year, supporting deployment over the medium term with reduced remuneration levels inareas as diverse as Latin America, India, the Middle East and South Africa. The evolution of therenewable financing environment both in debt and equity markets, with increasing numbers ofactors and products, is also playing an increasingly important role to unlock additional capital.
• Although cumulative investment in renewable power has increased significantly since 2000, itneeds to accelerate in order to meet long-term IEA deployment scenarios. To realise the highlevels of renewables required to meet long-term climate change objectives, as set out in theIEA’s Bridge Scenario, annual investment of almost USD 400 billion would be needed by 2030(IEA, 2015). Thus, renewable investment needs would likely strengthen, even as unit costs fall.Rising levels of deployment in OECD non-members and increased development of relativelyhigher-cost technologies, such as offshore wind and STE, are likely to boost investment overtime.
Figure 75 Investment in new renewable power capacity, historical and forecasts, by technology
0 200 400 600 800
1 0001 2001 4001 600
Cumulative capacitygrowth (GW)
Cumulative capacitygrowth (GW)
Cumulative capacitygrowth (GW)
Cumulative investment(USD 2014)
Cumulative investment(USD 2014)
Cumulative investment(USD 2014)
2002-2008 2008-14 2014-20 2002-2008 2008-14 2014-20
USD
2014
billi
on
Hydropower Bioenergy Onshore wind Offshore wind Solar PV STE Geothermal Ocean
Note: STE = solar thermal electricity; capacity and investment totals are calculated from the year-end of the start year through the year-end of the end year.
Trends in renewable capacity investment In 2014, investment in renewable power was estimated around USD 270 billion, slightly lower than in 2013. Renewables accounted for around 45% of new power capacity additions in 2014. Global renewable net additions to capacity additions rose to around 130 GW, 8 GW higher than in 2013.
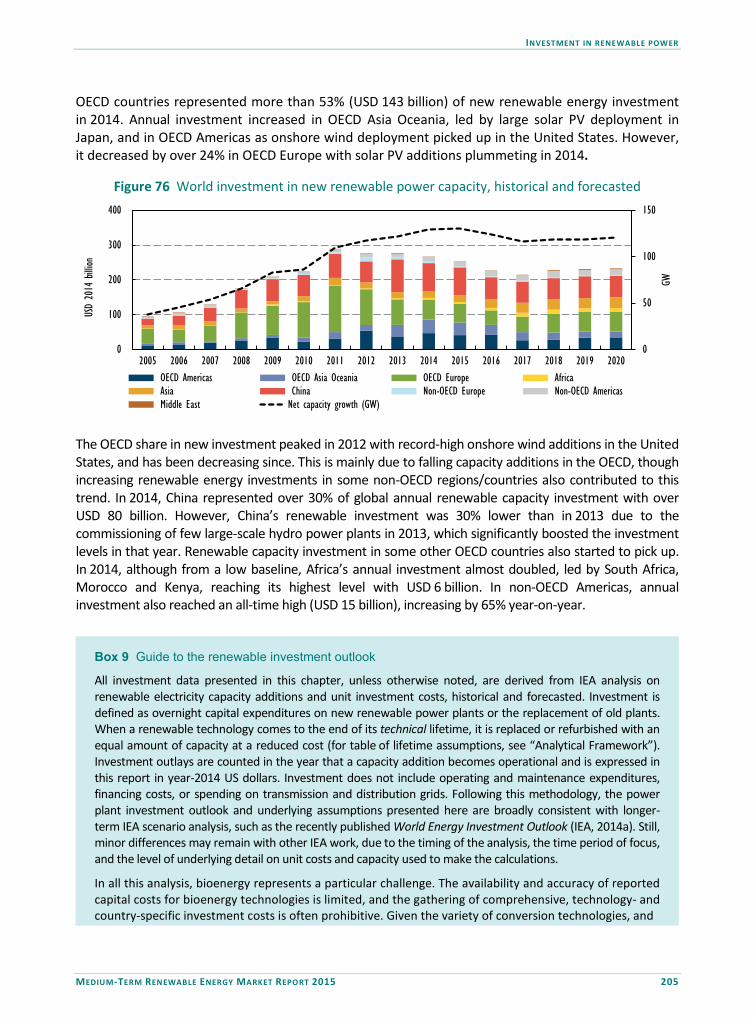
INVESTMENT IN RENEWABLE POWER
MEDIUM-TERM RENEWABLE ENERGY MARKET REPORT 2015 205
OECD countries represented more than 53% (USD 143 billion) of new renewable energy investment in 2014. Annual investment increased in OECD Asia Oceania, led by large solar PV deployment in Japan, and in OECD Americas as onshore wind deployment picked up in the United States. However, it decreased by over 24% in OECD Europe with solar PV additions plummeting in 2014.
Figure 76 World investment in new renewable power capacity, historical and forecasted
0
50
100
150
0
100
200
300
400
2005 2006 2007 2008 2009 2010 2011 2012 2013 2014 2015 2016 2017 2018 2019 2020
GW
.US
D 20
14 billi
on
OECD Americas OECD Asia Oceania OECD Europe Africa Asia China Non-OECD Europe Non-OECD Americas Middle East Net capacity growth (GW)
The OECD share in new investment peaked in 2012 with record-high onshore wind additions in the United States, and has been decreasing since. This is mainly due to falling capacity additions in the OECD, though increasing renewable energy investments in some non-OECD regions/countries also contributed to this trend. In 2014, China represented over 30% of global annual renewable capacity investment with over USD 80 billion. However, China’s renewable investment was 30% lower than in 2013 due to the commissioning of few large-scale hydro power plants in 2013, which significantly boosted the investment levels in that year. Renewable capacity investment in some other OECD countries also started to pick up. In 2014, although from a low baseline, Africa’s annual investment almost doubled, led by South Africa, Morocco and Kenya, reaching its highest level with USD 6 billion. In non-OECD Americas, annual investment also reached an all-time high (USD 15 billion), increasing by 65% year-on-year.
Box 9 Guide to the renewable investment outlook
All investment data presented in this chapter, unless otherwise noted, are derived from IEA analysis on renewable electricity capacity additions and unit investment costs, historical and forecasted. Investment is defined as overnight capital expenditures on new renewable power plants or the replacement of old plants. When a renewable technology comes to the end of its technical lifetime, it is replaced or refurbished with an equal amount of capacity at a reduced cost (for table of lifetime assumptions, see “Analytical Framework”). Investment outlays are counted in the year that a capacity addition becomes operational and is expressed in this report in year-2014 US dollars. Investment does not include operating and maintenance expenditures, financing costs, or spending on transmission and distribution grids. Following this methodology, the power plant investment outlook and underlying assumptions presented here are broadly consistent with longer-term IEA scenario analysis, such as the recently published World Energy Investment Outlook (IEA, 2014a). Still, minor differences may remain with other IEA work, due to the timing of the analysis, the time period of focus, and the level of underlying detail on unit costs and capacity used to make the calculations.
In all this analysis, bioenergy represents a particular challenge. The availability and accuracy of reported capital costs for bioenergy technologies is limited, and the gathering of comprehensive, technology- and country-specific investment costs is often prohibitive. Given the variety of conversion technologies, and
INVESTMENT IN RENEWABLE POWER
206 MEDIUM-TERM RENEWABLE ENERGY MARKET REPORT 2015
Box 9 Guide to the renewable investment outlook (continued)
the resulting capital costs, combined with the differences in scale and configuration (electricity only versus co-generation1), broad regional ranges for capital costs are used as a basis for investment forecasts. The situation is further complicated by the fact that availability of bioenergy capacity data, in particular in OECD non-member economies, is sometimes limited. In addition, certain types of plants, such as conversions from coal-fired to biomass-fired generation, are potentially not included in official IEA statistics if only one of several units is being converted. Furthermore, co-firing capacity is reported by the dominant fuel, e.g. coal, and thus typically does not appear in bioenergy statistics. While these phenomena vary from country to country, baseline capacity data for bioenergy are subject to some error margin that subsequently impacts the accuracy of the investment analysis.
The investment analysis, for now, excludes investment in biofuels for transport and renewables in energy use for heat. Overall, this calculation of investment represents only an approximation of real-world investment practice. In reality, investment in new plants will be spread over the years preceding the installation of capacity. For this reason MTRMR investment estimates are not comparable with other market sources, which collect detailed data on financial deals and estimate investment at the time that new projects are financed. Moreover, the assumption of replacements and refurbishments being made according to the end of their technical lifetime could sometimes lead to an undercounting of repowering expenditures that may be occurring sooner for some technologies, as in onshore wind. Despite these drawbacks, the outlook presented here represents an important first step in trying to better quantify and characterise the renewable investment environment over the medium term.
Continued spread of investment to newer markets amid technology costs declines
Investment in renewables is mainly driven by both changes in the unit costs of renewable technologies and specific market trends over the medium term. In the OECD region, investment in renewables dips in 2016/17 despite expected cost reductions, then picks up thereafter. All OECD regions contribute to this trend with incentive changes to solar PV and onshore wind in the United Kingdom within OECD Europe, expiration of federal tax incentives in the United States within OECD Americas, and expected reduction in solar PV incentives in Japan within OECD Asia Oceania. However, investment should pick up during the second half of the outlook with increasing offshore wind deployment in OECD Europe due to expected cost reduction and improvements in the competitiveness of solar PV and onshore wind in OECD Americas. Fast-growing power demand, diversification needs and local pollution concerns represent strong investment drivers in many OECD countries, especially in China. In other OECD regions, renewables represent an increasingly cost-effective form of generation to meet these aims, due to a combination of sustained technology progress, expansion into newer markets with better resources and improved financing conditions, often supported by market frameworks based on price competition for long-term PPAs. These trends mostly support renewable investment in non-OECD Americas, Africa and Asia. On the technology side, cost reductions continued in solar PV and onshore wind, lowering further required investment per unit of capacity in these technologies. These reductions are apparent in both OECD and non-OECD markets, though a wide variation in unit investment costs exists at the country level due to country-specific market dynamics and differences in balance of system costs 1 Co-generation refers to the combined production of heat and power.

INVESTMENT IN RENEWABLE POWER
MEDIUM-TERM RENEWABLE ENERGY MARKET REPORT 2015 207
Figure 77 Weighted average annual renewable investment costs, historical and forecasted
0
1 000
2 000
3 000
4 000
5 000
6 000
2014 2016 2018 2020
Other non-OECD
0
1 000
2 000
3 000
4 000
5 000
6 000
2014 2016 2018 2020
China
0
1 000
2 000
3 000
4 000
5 000
6 000
2014 2016 2018 2020
USD
2014
/kW
OECD
Hydropower Bioenergy Onshore wind Offshore wind Solar PV residential/commercial Solar PV utility
(e.g. land, labour, permitting and licensing). Policy incentives also have an impact on the pricing of renewable energy equipment. In countries with high levels of incentives, investment costs can remain inflated as equipment is priced accordingly, taking into account developers’ return expectations. Going forward, investment costs are expected to decrease both in renewable energy equipment and the balance of system. With expected global deployment levels, solar PV and onshore wind technologies should benefit most from cost improvements. However, compared with the historical cost decrease, somewhat slower rates are expected, based on learning calculated from the MTRMR 2015 capacity forecast. For offshore wind, cost reductions are expected over the second half of the forecast as the majority of projects that are expected to come on line are already contracted.
Figure 78 Indexed annual renewable investment costs, historical and forecasted
0
20
40
60
80
100
120
140
2014 2016 2018 2020
Other non-OECD
0
20
40
60
80
100
120
140
2014 2016 2018 2020
China
0
20
40
60
80
100
120
140
2014 2016 2018 2020
2014
=10
0
OECD
Onshore wind Offshore wind Solar PV residential/commercial Solar PV utility
Trends in renewable financing The cost of financing can remain high for capital-intensive renewables, due to a combination of policy-, market-, project- and technology-level risks. However, new financial products for green investments, mostly in developed countries, are expected to change the perceived risk profile.
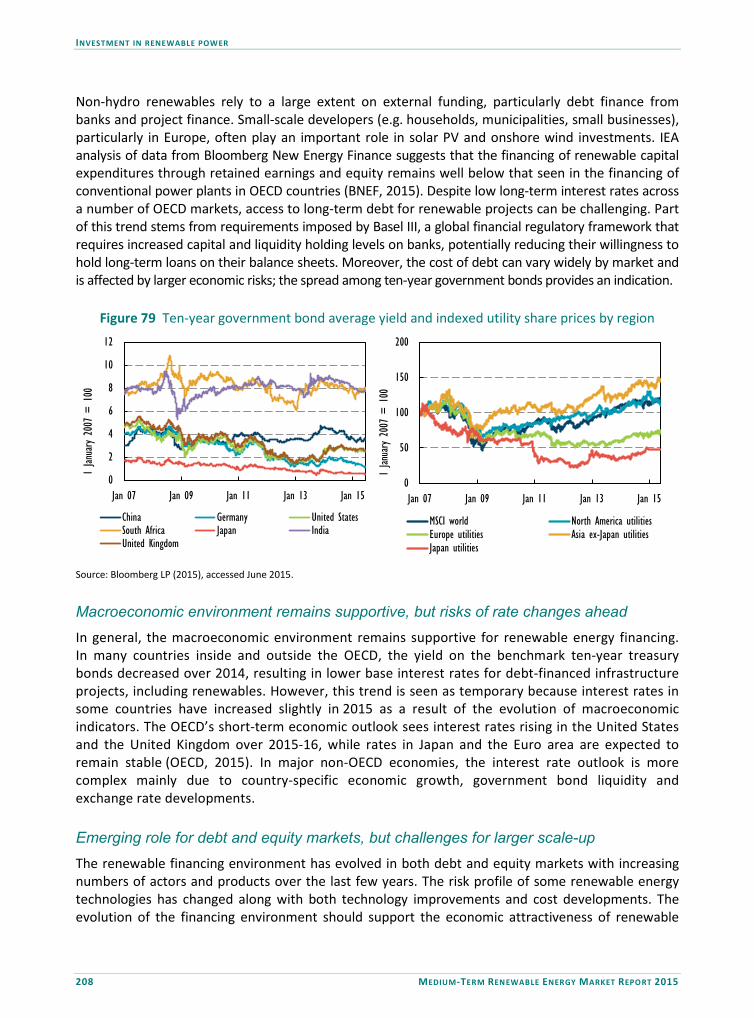
INVESTMENT IN RENEWABLE POWER
208 MEDIUM-TERM RENEWABLE ENERGY MARKET REPORT 2015
Non-hydro renewables rely to a large extent on external funding, particularly debt finance from banks and project finance. Small-scale developers (e.g. households, municipalities, small businesses), particularly in Europe, often play an important role in solar PV and onshore wind investments. IEA analysis of data from Bloomberg New Energy Finance suggests that the financing of renewable capital expenditures through retained earnings and equity remains well below that seen in the financing of conventional power plants in OECD countries (BNEF, 2015). Despite low long-term interest rates across a number of OECD markets, access to long-term debt for renewable projects can be challenging. Part of this trend stems from requirements imposed by Basel III, a global financial regulatory framework that requires increased capital and liquidity holding levels on banks, potentially reducing their willingness to hold long-term loans on their balance sheets. Moreover, the cost of debt can vary widely by market and is affected by larger economic risks; the spread among ten-year government bonds provides an indication.
Figure 79 Ten-year government bond average yield and indexed utility share prices by region
0
2
4
6
8
10
12
Jan 07 Jan 09 Jan 11 Jan 13 Jan 15
1 Jan
uary
2007
= 1
00
China Germany United StatesSouth Africa Japan IndiaUnited Kingdom
0
50
100
150
200
Jan 07 Jan 09 Jan 11 Jan 13 Jan 15
1 Jan
uary
2007
= 1
00
MSCI world North America utilitiesEurope utilities Asia ex-Japan utilitiesJapan utilities
Source: Bloomberg LP (2015), accessed June 2015. Macroeconomic environment remains supportive, but risks of rate changes ahead In general, the macroeconomic environment remains supportive for renewable energy financing. In many countries inside and outside the OECD, the yield on the benchmark ten-year treasury bonds decreased over 2014, resulting in lower base interest rates for debt-financed infrastructure projects, including renewables. However, this trend is seen as temporary because interest rates in some countries have increased slightly in 2015 as a result of the evolution of macroeconomic indicators. The OECD’s short-term economic outlook sees interest rates rising in the United States and the United Kingdom over 2015-16, while rates in Japan and the Euro area are expected to remain stable (OECD, 2015). In major non-OECD economies, the interest rate outlook is more complex mainly due to country-specific economic growth, government bond liquidity and exchange rate developments. Emerging role for debt and equity markets, but challenges for larger scale-up The renewable financing environment has evolved in both debt and equity markets with increasing numbers of actors and products over the last few years. The risk profile of some renewable energy technologies has changed along with both technology improvements and cost developments. The evolution of the financing environment should support the economic attractiveness of renewable

INVESTMENT IN RENEWABLE POWER
MEDIUM-TERM RENEWABLE ENERGY MARKET REPORT 2015 209
energy technologies and vice versa. Still, the capital-intensive nature of renewable projects requires a different securitisation approach to achieve lower costs of capital. Debt capital markets
In the debt market, the annual issuance of green bonds, a fixed-income financial instrument for raising capital through the debt capital market, increased from USD 10.8 billion in 2013 to USD 36.3 billion in 2014 (BNEF, 2015). Although the majority of this growth was driven by multilateral finance institutions such as the World Bank and the European Investment Bank (EIB), corporate bonds also contributed to this trend. Development banks and supranational institutions issued 49% of annual green bonds in 2014, while the corporate share was 37%. The entrance of private companies to the green bond market is expected to increase liquidity and bring consolidation. Since 2013, large utilities have started to raise capital for their renewable energy projects by issuing green bonds. In May 2014, Engie issued the largest green bond of EUR 2.5 billion (USD 3.4 billion), second to EDF’s EUR 1.4 billion in 2013, to fund its renewable energy and energy efficiency projects globally. Green bonds have proven to attract variety of investors including those who are considered risk-averse. For the six-year tranche of Engie’s bond, 69% was bought by asset managers while 12% was bought by pension funds and insurance companies. For the 12-year tranche, pension funds’ and insurance companies’ share increased to 43%. In addition to corporate-labelled bonds, the number of asset-backed securities to securitise renewable projects has increased over the last year. In October 2014, SolarCity, a US residential and commercial solar PV developer, issued USD 200 million of asset-linked retail bonds that aim at diversifying the company’s investor base. The growing demand and supply of green bonds, especially by corporate players, have raised issues related to their standardisation, regulation and whether raised funds are actually spent on “green” projects. There is currently no global definition of “green” projects that can be financed by green bonds. Although several multilateral banks and finance institutions have their own standards or voluntary principles, a global regulation, governance or reporting does not currently exist. Still, uniform processes to evaluate and report on green projects being funded are being developed. In January 2014, a group of banks and investment advisers issued the “Green Bond Principles” under CERES, a non-profit organisation advocating for sustainability leadership. The principles specify sectors in which green bond proceeds can be invested, including in renewable energy, energy efficiency, sustainable waste management, sustainable land use, biodiversity conservation, clean transportation and clean water. These standards are developed in line with green bond standards of the World Bank and the International Finance Corporation. In December 2014, the Climate Bonds Initiative, an investor-focused not-for-profit organisation, released its “Climate Bond Standard”, which aims at certifying green bonds. These certifications and standards aim at preventing companies from greenwashing funds raised. Equity capital markets
In equity markets, the increasing number of yield companies (yieldco) is helping to realise lower costs of capital to finance renewable energy projects. A yieldco is a publically traded company of a renewable energy developer. Yieldcos bundle several renewable energy projects awarded with long-term revenue stream, such as PPAs. With long-term sustainability of project revenues, yieldcos distribute project profits in the form of dividends to their shareholders annually. The main aim of
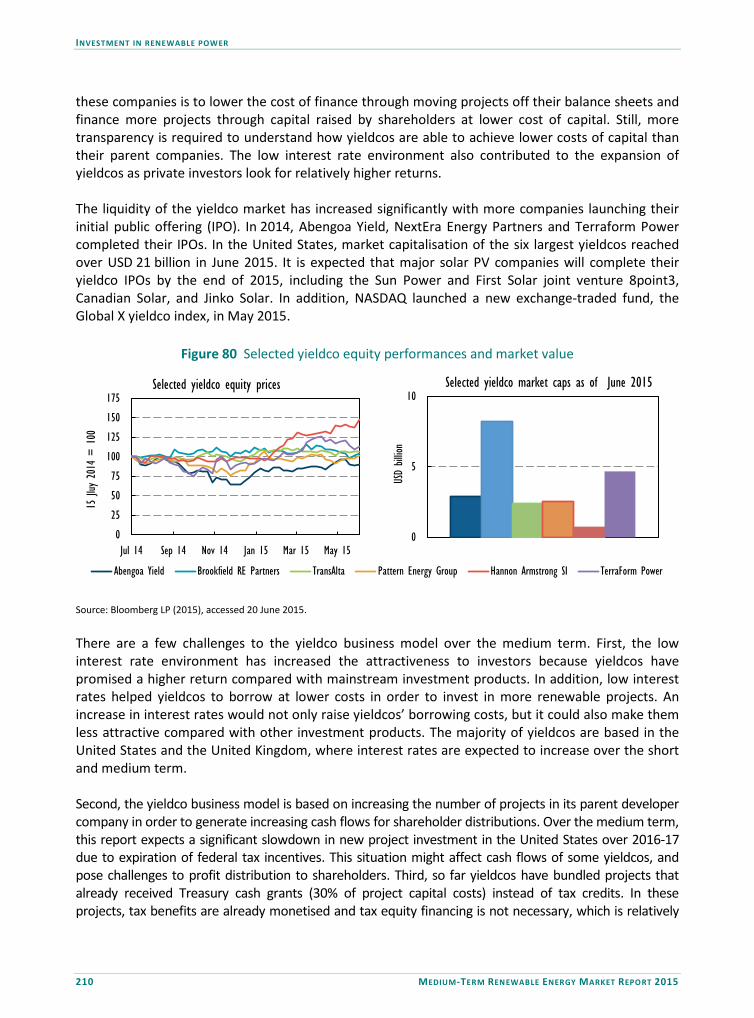
INVESTMENT IN RENEWABLE POWER
210 MEDIUM-TERM RENEWABLE ENERGY MARKET REPORT 2015
these companies is to lower the cost of finance through moving projects off their balance sheets and finance more projects through capital raised by shareholders at lower cost of capital. Still, more transparency is required to understand how yieldcos are able to achieve lower costs of capital than their parent companies. The low interest rate environment also contributed to the expansion of yieldcos as private investors look for relatively higher returns. The liquidity of the yieldco market has increased significantly with more companies launching their initial public offering (IPO). In 2014, Abengoa Yield, NextEra Energy Partners and Terraform Power completed their IPOs. In the United States, market capitalisation of the six largest yieldcos reached over USD 21 billion in June 2015. It is expected that major solar PV companies will complete their yieldco IPOs by the end of 2015, including the Sun Power and First Solar joint venture 8point3, Canadian Solar, and Jinko Solar. In addition, NASDAQ launched a new exchange-traded fund, the Global X yieldco index, in May 2015.
Figure 80 Selected yieldco equity performances and market value
0
25
50
75
100
125
150
175
Jul 14 Sep 14 Nov 14 Jan 15 Mar 15 May 15
15 Jl
uy 2
014
= 1
00
Selected yieldco equity prices
Abengoa Yield Brookfield RE Partners TransAlta Pattern Energy Group Hannon Armstrong SI TerraForm Power
0
5
10US
D bil
lion
Selected yieldco market caps as of June 2015
Source: Bloomberg LP (2015), accessed 20 June 2015. There are a few challenges to the yieldco business model over the medium term. First, the low interest rate environment has increased the attractiveness to investors because yieldcos have promised a higher return compared with mainstream investment products. In addition, low interest rates helped yieldcos to borrow at lower costs in order to invest in more renewable projects. An increase in interest rates would not only raise yieldcos’ borrowing costs, but it could also make them less attractive compared with other investment products. The majority of yieldcos are based in the United States and the United Kingdom, where interest rates are expected to increase over the short and medium term. Second, the yieldco business model is based on increasing the number of projects in its parent developer company in order to generate increasing cash flows for shareholder distributions. Over the medium term, this report expects a significant slowdown in new project investment in the United States over 2016-17 due to expiration of federal tax incentives. This situation might affect cash flows of some yieldcos, and pose challenges to profit distribution to shareholders. Third, so far yieldcos have bundled projects that already received Treasury cash grants (30% of project capital costs) instead of tax credits. In these projects, tax benefits are already monetised and tax equity financing is not necessary, which is relatively

INVESTMENT IN RENEWABLE POWER
MEDIUM-TERM RENEWABLE ENERGY MARKET REPORT 2015 211
expensive. As Treasury cash grant is already expired in 2012, yieldcos have to tap into tax equity for new project developments. However, this situation requires a balance between tax equity return to new investors and retaining enough tax benefits to shelter their income from corporation tax. Third, most yieldcos started in OECD countries, where equity markets are deeper and more liquid. Some developers in China are starting to aggregate projects into yieldcos, but such activity remains relatively rare in non-OECD countries where equity markets are less developed. Traditional forms of renewable finance The extent to which utilities can provide investment also faces constraints. In addition to new project development, utilities have often played an important role in acquiring operating renewable assets, allowing developers to recycle their capital for new projects. In Europe, utility cash flows are squeezed by reduced operating hours for conventional plants, stemming from a perfect storm of low demand, high natural gas prices, low carbon and coal prices, and increased shares of low-marginal-cost renewables. In Europe, utility restructuring should benefit renewable deployment as large companies decide to focus on renewable energy, distributed generation and grid services. In Germany, E.ON marked a loss of USD 3.2 billion and RWE of USD 2.8 billion, their largest losses, as they decided to write off the value of their fossil fuel plants. E.ON decided to split into two companies, with one focused on renewables and the new one on conventional energy, which is expected to be completed in 2016. This trend is expected to extend to other European utilities over the medium term. Vattenfall in Sweden and Verbund in Austria already announced that they are shifting investment focus to renewables and other energy services. In the United States, proposed government emissions rules are likely to put cost pressures on coal generators. Still-low natural gas prices and substitution needs for retiring coal plants are stimulating investments in gas-fired generation and related infrastructure, which can have the effect of crowding out renewable investments. Moreover, utilities in both regions increasingly confront disruptions to the traditional business model of centralised electricity provision with the fast growth of distributed solar PV. Other sources of capital are increasingly helping to supplement the role of utilities. In some segments where they have played a particular role in development, such as offshore wind, utilities are increasingly turning to project finance structures. Nevertheless, utilities are likely to remain key investors in renewable assets, and their creditworthiness will play an important role in attracting external funding and providing off take contract security. For many, the long-term price stability of renewable generation can provide an attractive hedging option to the short-term volatility of gas generation, for example, as with some US onshore wind development. Development banks continued to play a major role in financing renewable energy projects. In 2014, the Brazilian Development Bank’s (BNDES) total credit to clean energy investments reached USD 2.7 billion, 80% higher than in 2013. The Asian Development Bank’s (ADB) investments in renewable energy projects increased slightly and reached USD 1.35 billion in 2014 (ADB, 2015). ADB’s loans supported the installation of around 2 GW of new renewable energy generating capacity. The EIB’s lending to renewable energy projects reached close to EUR 5.9 billion (USD 6.4 billion) in 2014 (EIB, 2015). The European Bank for Reconstruction and Development (EBRD) invested in 170 sustainable projects under its Sustainable Energy Initiative with a total of EUR 8.9 billion (EBRD, 2015).

INVESTMENT IN RENEWABLE POWER
212 MEDIUM-TERM RENEWABLE ENERGY MARKET REPORT 2015
Medium-term outlook for investment in new renewable power capacity Over the medium term, cumulative investment in renewable power capacity is expected to reach over USD 1 690 billion. Investment flows are seen shifting from the OECD to non-OECD as a destination. Historically, the majority of investment in renewable power was directed to OECD countries. They represented more than 60% of global cumulative investment over 2007-13. However, this trend is seen shifting over the medium term with increasing capacity to be deployed in China and other OECD non-members, especially in the Americas, the Middle East and Africa. Over 2014-20, OECD non-members should attract over 52% of renewable investment. New capacity in China alone should represent around 30% of global cumulative investment in renewable power with over USD 500 billion required to finance the country’s growth.
Renewable investment is seen somewhat stabilising at USD 225-245 billion annually, in real terms, through 2020. In 2014, annual investment was around USD 250 billion as total capacity additions reached around 130 GW. However, annual investment is expected to decline for several years after. The expiration of production and investment tax credit schemes are seen as the main reason behind this decrease, especially for solar PV and onshore wind. Wind power, both onshore and offshore, represents the largest cumulative investment globally with around USD 560 billion needed to finance forecast additional capacity over 2014-20. Solar PV (USD 530 billion), hydropower (USD 400 billion) and bioenergy (USD 145 billion) technologies are expected to follow wind. Investment needs for concentrated solar power and offshore technologies are expected to rise towards the end of the forecast period as more cost reductions are seen over the medium term, which should drive more investment.
Figure 81 World new investment in renewable power capacity, historical and forecasts
0
20
40
60
80
100
120
140
0
50
100
150
200
250
300
2005 2006 2007 2008 2009 2010 2011 2012 2013 2014 2015 2016 2017 2018 2019 2020
GW
.US
D 20
14 billi
on
Hydropower Bioenergy Onshore wind Offshore wind Solar PV STE Ocean Annual additions (GW)
Although cumulative investment in renewable power has increased significantly since 2000, it needs to accelerate further in order to meet long-term deployment scenarios from the IEA WEO. To realise the high levels of renewables required to meet long-term climate change objectives, as set out in the Bridge Scenario, annual investment of almost USD 400 billion would be needed by 2030 (IEA, 2015). Thus, renewable investment needs would likely strengthen, even as unit costs fall. Rising levels of deployment in OECD non-members and increased development of relatively higher-cost technologies, such as offshore wind and STE, are likely to boost investment over time. Repowering and replacements of existing renewable capacity are also expected to play a larger role in supporting investment needs, particularly in the OECD.

INVESTMENT IN RENEWABLE POWER
MEDIUM-TERM RENEWABLE ENERGY MARKET REPORT 2015 213
Box 10 The role of G20 countries in renewable power capacity investment over the medium term
The Group of 20 (G20) represents around 80% of the total global primary energy supply. With close to 1 360 GW already installed, 75% of total renewable electricity capacity is currently located in G20 countries. Since the G20’s establishment in 1999, renewable electricity generation has more than doubled while output from non-hydro renewables has increased by more than sevenfold. However, renewables still represent a small share of the G20’s total electricity generation. In 2014, the group installed over 85% of new renewable power capacity with the annual investment level reaching USD 223 billion. At the country level, China led the annual investment followed by the United States, Japan, Germany, United Kingdom and India.
Over the medium term, G20 renewable capacity is expected to grow from 1 360 GW in 2014 to over 1 980 GW in 2020. This additional growth represents over USD 1.3 trillion of cumulative investment need, or around USD 200 billion annually. This report expects that 80% of annual investment to finance additional renewable capacity should take place in G20 countries over 2014-20. However, the G20’s role is not limited as a destination of renewable investment. Its member countries also provide both public and private finance to the rest of the world. Notably, investment flows from G20 countries represented over 40% of renewable energy investments in non-G20 countries in 2012, not including financing provided by international finance corporations (Haščič, 2015).
Box 11 Changing utility business models: Opportunities and challenges for renewable investment
Since the early 2000s, deployment of renewable energy technologies has increased dramatically as a result of targeted policy support. This has brought about change in the electric power industry at a pace and scale that was not anticipated by most stakeholders. In particular the rapid deployment of wind power and solar PV in markets such as Denmark, Spain, Germany, Italy and to some extent the United States is challenging established players and historical business models. At the same time, the structural shift in the industry is creating new opportunities and is leading to adjustments in the corporate strategy of large players. As a result, the role of utilities in renewable asset investment, and power sector investment in general, is changing. Capital expenditures are increasingly directed away from a traditional focus on investment in large-scale generation to a portfolio approach of flexibility services to facilitate renewable integration, particularly distributed generation, and consumer-level demand-side management services.
Change is occurring along two main lines. The first line relates to shifts in wholesale market prices triggered by renewables deployment and other factors. In Europe, equity returns on investment of utilities decreased by 4.8% over 2006-13, due to a combination of sluggish demand growth, overcapacity, and low coal and carbon emissions prices, which significantly reduced operating hours for newer investments in gas-fired generation assets (Bain and Company, 2015). In the United States, the impact on utilities’ investment returns were visible but lower mainly due to low gas prices, among other factors. This has put the traditional business model of many companies owning large-scale generation assets under pressure. In many countries, plants are operating fewer hours than originally planned, and market prices are not always sufficient to cover fixed costs of keeping them in the market.
The second line arises from the modular nature of solar PV, in particular, implying a shift in location of generation in the power system (distribution rather than transmission grid) and possible ownership structure. For example, solar PV systems can be deployed as rooftop solutions, allowing individual residential and commercial consumers to become electricity producers. As such, the cost of solar PV electricity in relation to household and commercial electricity prices has become a relevant part of the equation. This trend is giving rise to so-called prosumers, i.e. customers that also produce some of their
INVESTMENT IN RENEWABLE POWER
214 MEDIUM-TERM RENEWABLE ENERGY MARKET REPORT 2015
Box 11 Changing utility business models: Opportunities and challenges for renewable investment (continued)
electricity. Finding energy service solutions that cater for this new group of customers is among the new opportunities in the sector.
The increased focus on a more active end consumer is also driven by the need to facilitate the grid integration of variable renewables. Demand-side flexibility is posed to play a crucial role in balancing supply and demand at growing shares of fluctuating output. This requires a more dynamic and technically elaborate interaction with customers.
The increasing participation of electricity customers has created new services that support the evolution of the traditional utility business, creating additional sources of revenue. The main focus of these services is in essence to reduce the monthly bill of both residential and commercial customers. With smart meters, thermostats and digital energy-saving platforms, customers have access to more information on changing electricity prices, enabling them to control their consumption and reduce their bills. Some utilities are already co-operating with these service providers to implement their demand-response programmes, diversifying their flexibility options by offering more dynamic-pricing solutions to customers depending on their consumption behaviours. In addition, with their large customer base, some utilities are involved in providing services such as designing, financing, installing and maintaining smart energy efficiency and other energy-related solutions. In France, subsidiaries of EDF (Dalkia) and Engie (Cofely) are two utilities largely involved in these services.
References ADB (Asian Development Bank) (2015), “Using clean energy to power Asia”, 11 June 2015, ADB, Manila. Bain and Company (2015), Business and Investment Opportunities in a Changing Electricity Sector, Bain and Company, London. Bloomberg LP (2015), (accessed June 2015). BNEF (Bloomberg New Energy Finance) (2015), Green Bonds Market Outlook 2014, BNEF, London. Climate Bonds (2015), Year 2014 Green Bonds Final Report, Green Bonds Initiative, London. EBRD (European Bank for Reconstruction and Development) (2015), “Annual report 2014“, EBRD, London, http://2014.ar-ebrd.com/. EIB (European Investment Bank) (2015), “Global energy efficiency and renewable energy fund“, EIB Group, Luxembourg, http://geeref.com/about/the-eib-group.html. Haščič, I., M. Cárdenas Rodríguez, R. Jachnik, J. Silva and N. Johnstone (2015), "Public interventions and private climate finance flows: Empirical evidence from renewable energy financing", OECD Environment Working Papers, No. 80, OECD Publishing, Paris. IEA (2015), Energy and Climate Change WEO Special Report, OECD/IEA, Paris. OECD (2015), OECD Economic Outlook, Volume 2015 Issue 1, OECD Publishing, Paris. Shaw, V. (2015), “China dispatch: Momentum building behind yieldcos”, pv-magazine, Solarpraxis AG, Berlin.

RENEWABLE TRANSPORT
MEDIUM-TERM RENEWABLE ENERGY MARKET REPORT 2015 215
RENEWABLE TRANSPORT Summary • Global growth in biofuels production was achieved in 2014 despite a challenging environment.
Modest global expansion was underpinned by favourable feedstock crops in key markets such asthe United States (US) and the European Union (EU), new and increased biofuel mandates inseveral countries, and emerging Southeast Asian biofuel production markets establishing newexport relationships. The total production forecast for 2020 of 144 billion litres (L) is a slightupward revision from the Medium-Term Renewable Energy Market Report 2014 (MTRMR 2014).
• Mixed fortunes in the market-leading US and Brazilian biofuels industries. In the United States,ethanol production increased in 2014, aided by a bumper corn crop improving ethanol productioneconomics. The biodiesel industry contracted slightly, however, partly as a result of uncertaintyregarding the availability of blending subsidies. Brazil registered low-level growth in ethanolproduction despite squeezed profit margins from higher production costs and competition fromlow, regulated gasoline prices. Prospects for 2015 are improved by an increase in the taxation ofgasoline and also the anhydrous ethanol blending mandate rising to 27%. Brazil’s biodieselindustry also received a boost from an increase in the blending mandate to 7%.
• Biofuels policy uncertainty has reduced, but announcements provide mixed messages to keybiofuels markets. In the United States, with the exception of biodiesel, the Renewable Fuel Standard(RFS2) volumes announced by the US Environmental Protection Agency (EPA) propose reductions onprevious statutory targets for transport biofuels. However, if achieved, the volumes proposed wouldstill represent growth in renewable transport fuel consumption. Markets in member countries of theOrganisation for Economic Co-operation and Development’s (OECD) Europe region will be impactedby the decision to introduce a 7 percentage point (pp) cap on the contribution of conventional biofuelstowards the EU 10% renewable energy in transport target for 2020. While this has provided much-needed clarity to the European biofuels industry on the prospects for medium-term production, thedecision may dampen future investment prospects for conventional biofuels production capacity.
• Significant impacts from the reduction in crude oil prices on biofuel production at a global levelwere not observed during 2014. This was principally due to blending mandates protectingdemand. However, the consequential impacts of a sustained period of low oil prices on blendingeconomics, opportunities for discretionary blending above mandates and, in the case of Brazil, theprice of ethanol compared with gasoline at the pump could undermine markets for conventionalbiofuels and cause a downward shift from the MTRMR 2015 medium-term forecast.
• A significant increase in advanced biofuels production capacity was achieved in 2014, with fivenew commercial-scale plants commissioned, and a further two opening in 2015. The advancedbiofuels industry is now at a crucial stage, with prospects for future expansion linked to thetechnical and financial performance of these pioneering plants. The US EPA’s RFS2 volumes forcellulosic ethanol propose a decrease from statutory levels but still allow headroom for significantproduction increases. In the European Union, the cap on the contribution of conventional biofuelstowards the 2020 target for renewable energy in transport has created an opportunity foradvanced biofuel production to make an increased contribution to meeting this.
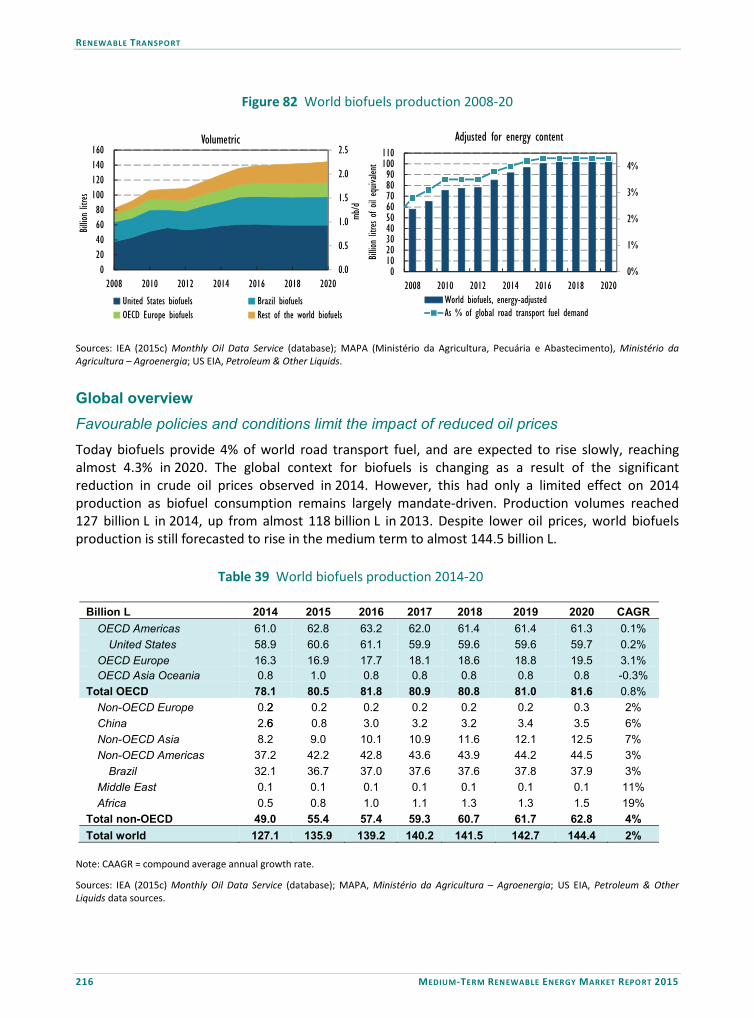
RENEWABLE TRANSPORT
216 MEDIUM-TERM RENEWABLE ENERGY MARKET REPORT 2015
Figure 82 World biofuels production 2008-20
Sources: IEA (2015c) Monthly Oil Data Service (database); MAPA (Ministério da Agricultura, Pecuária e Abastecimento), Ministério da Agricultura – Agroenergia; US EIA, Petroleum & Other Liquids.
Global overview Favourable policies and conditions limit the impact of reduced oil prices Today biofuels provide 4% of world road transport fuel, and are expected to rise slowly, reaching almost 4.3% in 2020. The global context for biofuels is changing as a result of the significant reduction in crude oil prices observed in 2014. However, this had only a limited effect on 2014 production as biofuel consumption remains largely mandate-driven. Production volumes reached 127 billion L in 2014, up from almost 118 billion L in 2013. Despite lower oil prices, world biofuels production is still forecasted to rise in the medium term to almost 144.5 billion L.
Table 39 World biofuels production 2014-20
Note: CAAGR = compound average annual growth rate.
Sources: IEA (2015c) Monthly Oil Data Service (database); MAPA, Ministério da Agricultura – Agroenergia; US EIA, Petroleum & Other Liquids data sources.
Billion L 2014 2015 2016 2017 2018 2019 2020 CAGR
OECD Americas 61.0 62.8 63.2 62.0 61.4 61.4 61.3 0.1%
United States 58.9 60.6 61.1 59.9 59.6 59.6 59.7 0.2%
OECD Europe 16.3 16.9 17.7 18.1 18.6 18.8 19.5 3.1% 0.8 1.0 0.8 0.8 0.8 0.8 0.8 -0.3%OECD Asia Oceania
Total OECD 78.1 80.5 81.8 80.9 80.8 81.0 81.6 0.8%
0.22 0.2 0.2 0.2 0.2 0.2 0.3 2%
2.66 0.8 3.0 3.2 3.2 3.4 3.5 6%
8.2 9.0 10.1 10.9 11.6 12.1 12.5 7%
Non-OECD Europe China Non-OECD Asia Non-OECD Americas 37.2 42.2 42.8 43.6 43.9 44.2 44.5 3%
Brazil 32.1 36.7 37.0 37.6 37.6 37.8 37.9 3%
Middle East 0.1 0.1 0.1 0.1 0.1 0.1 0.1 11%
0.5 0.8 1.0 1.1 1.3 1.3 1.5 19%Africa Total non-OECD 49.0 55.4 57.4 59.3 60.7 61.7 62.8 4%
Total world 127.1 135.9 139.2 140.2 141.5 142.7 144.4 2%
0.0
0.5
1.0
1.5
2.0
2.5
020406080
100120140160
2008 2010 2012 2014 2016 2018 2020
Billio
n litr
es
Volumetric
United States biofuelsOECD Europe biofuels
Brazil biofuelsRest of the world biofuels
0%
1%
2%
3%
4%
0102030405060708090
100110
2008 2010 2012 2014 2016 2018 2020
mb/d
Billio
n litr
es of
oil equ
ivalen
t
Adjusted for energy content
World biofuels, energy-adjustedAs % of global road transport fuel demand
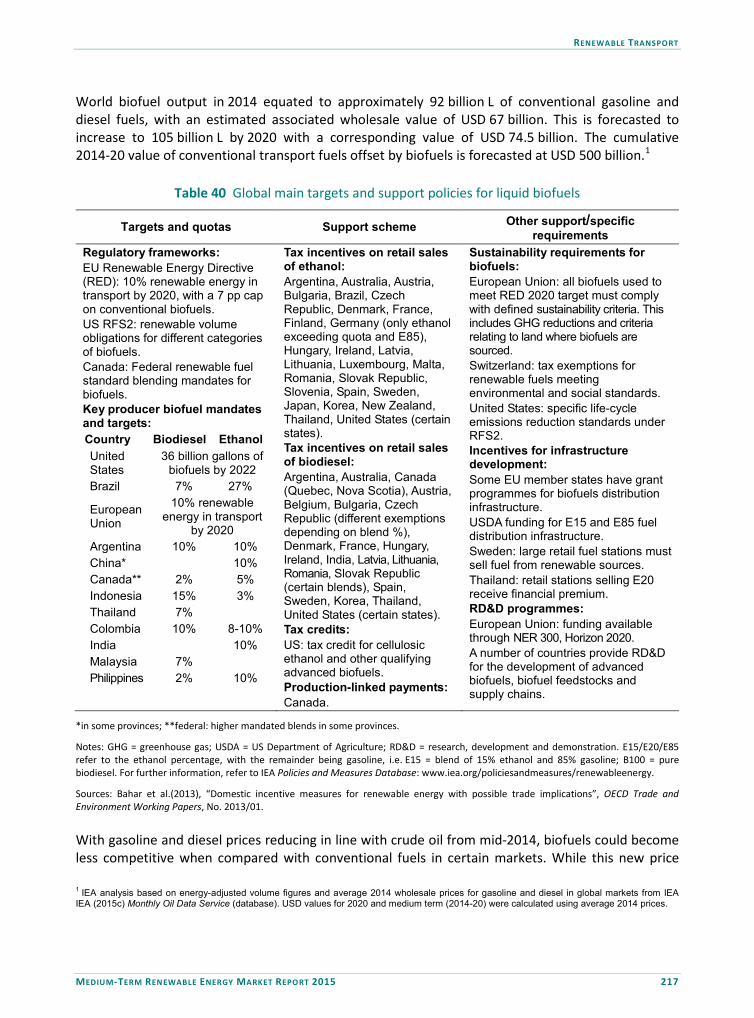
RENEWABLE TRANSPORT
MEDIUM-TERM RENEWABLE ENERGY MARKET REPORT 2015 217
World biofuel output in 2014 equated to approximately 92 billion L of conventional gasoline and diesel fuels, with an estimated associated wholesale value of USD 67 billion. This is forecasted to increase to 105 billion L by 2020 with a corresponding value of USD 74.5 billion. The cumulative 2014-20 value of conventional transport fuels offset by biofuels is forecasted at USD 500 billion.1
Table 40 Global main targets and support policies for liquid biofuels
Targets and quotas Support scheme Other support/specific requirements
Regulatory frameworks: EU Renewable Energy Directive (RED): 10% renewable energy in transport by 2020, with a 7 pp cap on conventional biofuels. US RFS2: renewable volume obligations for different categories of biofuels. Canada: Federal renewable fuel standard blending mandates for biofuels. Key producer biofuel mandates and targets: Country Biodiesel Ethanol United States
36 billion gallons of biofuels by 2022
Brazil 7% 27%
European Union
10% renewable energy in transport
by 2020 Argentina 10% 10% China* 10% Canada** 2% 5% Indonesia 15% 3% Thailand 7% Colombia 10% 8-10%India 10%Malaysia 7% Philippines 2% 10%
Tax incentives on retail sales of ethanol: Argentina, Australia, Austria, Bulgaria, Brazil, Czech Republic, Denmark, France, Finland, Germany (only ethanol exceeding quota and E85), Hungary, Ireland, Latvia, Lithuania, Luxembourg, Malta, Romania, Slovak Republic, Slovenia, Spain, Sweden, Japan, Korea, New Zealand, Thailand, United States (certain states). Tax incentives on retail sales of biodiesel: Argentina, Australia, Canada (Quebec, Nova Scotia), Austria, Belgium, Bulgaria, Czech Republic (different exemptions depending on blend %), Denmark, France, Hungary, Ireland, India, Latvia, Lithuania, Romania, Slovak Republic (certain blends), Spain, Sweden, Korea, Thailand, United States (certain states). Tax credits: US: tax credit for cellulosic ethanol and other qualifying advanced biofuels. Production-linked payments: Canada.
Sustainability requirements for biofuels: European Union: all biofuels used to meet RED 2020 target must comply with defined sustainability criteria. This includes GHG reductions and criteria relating to land where biofuels are sourced. Switzerland: tax exemptions for renewable fuels meeting environmental and social standards. United States: specific life-cycle emissions reduction standards under RFS2. Incentives for infrastructure development: Some EU member states have grant programmes for biofuels distribution infrastructure. USDA funding for E15 and E85 fuel distribution infrastructure. Sweden: large retail fuel stations must sell fuel from renewable sources. Thailand: retail stations selling E20 receive financial premium. RD&D programmes: European Union: funding available through NER 300, Horizon 2020. A number of countries provide RD&D for the development of advanced biofuels, biofuel feedstocks and supply chains.
*in some provinces; **federal: higher mandated blends in some provinces.
Notes: GHG = greenhouse gas; USDA = US Department of Agriculture; RD&D = research, development and demonstration. E15/E20/E85 refer to the ethanol percentage, with the remainder being gasoline, i.e. E15 = blend of 15% ethanol and 85% gasoline; B100 = pure biodiesel. For further information, refer to IEA Policies and Measures Database: www.iea.org/policiesandmeasures/renewableenergy.
Sources: Bahar et al.(2013), “Domestic incentive measures for renewable energy with possible trade implications”, OECD Trade and Environment Working Papers, No. 2013/01.
With gasoline and diesel prices reducing in line with crude oil from mid-2014, biofuels could become less competitive when compared with conventional fuels in certain markets. While this new price
1 IEA analysis based on energy-adjusted volume figures and average 2014 wholesale prices for gasoline and diesel in global markets from IEA IEA (2015c) Monthly Oil Data Service (database). USD values for 2020 and medium term (2014-20) were calculated using average 2014 prices.

RENEWABLE TRANSPORT
218 MEDIUM-TERM RENEWABLE ENERGY MARKET REPORT 2015
environment is a challenge for the biofuels industry, several factors are expected to reduce the impact of this on global biofuels markets. First, biofuel demand is still driven primarily by support policies in the form of mandates, rather than by price considerations.2 During 2014, the biofuels industry was boosted by several countries raising their biofuel blending requirements. In addition, biofuel production costs have generally declined over the last year. Many key producing regions, such as the United States and the European Union, enjoyed very good harvests of biofuel feedstocks, which reduced the price of these crops and biofuel production costs in turn. Lower crude oil prices also reduce biofuel production overheads. Should the current low oil price regime persist for an extended period of time, the impact on the biofuels sector could become more pronounced, with the potential for the abandonment of new biofuel projects and scrutiny of support policies for biofuels.
Figure 83 Comparison of global biofuels production and oil prices 2007-20 (indexed)
0
50
100
150
200
250
2007 2008 2009 2010 2011 2012 2013 2014 2015 2016 2017 2018 2019 2020
2007
= 1
00
MTRMR 2015 global biofuelsproduction
IEA crude oil import averageprice
Forecast
Forward assumption
Historical
Note: Forward assumption for IEA crude oil average import price based on 65 day average of forward contract prices for Brent crude oil
Sources: Biofuels production data from IEA (2015c) Monthly Oil Data Service (database); MAPA, Ministério da Agricultura – Agroenergia; US EIA, Petroleum and Other Liquids data sources. IEA crude oil average import price based on IEA Energy Prices and Taxes (EPT) database.
. Regional forecasts Modest growth observed despite upheaval in established markets The United States, the world’s leading producer of fuel ethanol, saw an almost 4 billion L year-on-year increase in 2014, with total volumes reaching 54 billion L. Over the medium-term ethanol production is forecast to maintain steady at this level until 2020, with the exception of an increase to 55 billion L over 2015-16. Production volumes were 1.7 billion L higher than forecast in MTRMR 2014, due to a bumper corn crop improving ethanol production economics. This was achieved despite uncertainty over the RFS2 volumetric target for 2014, which was only clarified in more detail by the US EPA in May 2015. Helped by this decrease in production costs, ethanol exports increased by 30% compared with 2013, to more than 3.5 billion L. Canada was a key export market for US ethanol with a significant proportion of its blending mandate met from US ethanol. 2 The exception to this being Brazil, where the high penetration of flexible fuel (flex-fuel) vehicles allows for many consumers to choose between hydrous ethanol and gasoline at the pump.

RENEWABLE TRANSPORT
MEDIUM-TERM RENEWABLE ENERGY MARKET REPORT 2015 219
Domestic distribution of US ethanol received a boost in 2015 with the announcement of funding of USD 100 million from the USDA to expand ethanol blender pump infrastructure for E15 and E85 (15% and 85% ethanol by volume) fuel blends. However, significant growth in the market penetration of flex-fuel vehicles to address the “blend wall”, which limits the supply of ethanol blends higher than E10 (10% ethanol by volume) to suitable vehicles, may well be undermined by a prolonged period of low crude oil prices. Industry forecasts must be considered in the context of how the biofuels industry reacts to the US EPA announcement of proposed RFS2 volumes for the years 2014 to 2016 (Box 12). Biodiesel production in the United States dropped 0.3 billion L to 4.8 billion L in 2014 as a result of the expiration of the USD 1.01/gallon blender’s tax credit at the end of 2013. This was reintroduced retroactively for the year only at the end of 2014 and its status for 2015 remains unclear, replicating the investment uncertainty experienced last year. Production volumes are forecast to initially rise and then stabilise at around 5.5 billion L from 2017 until the end of the medium-term, an upward revision from the MTRMR 2014 forecast due to the favourable RFS2 volumes for biomass based diesel announced by the US EPA. Biodiesel imports in the United States dropped sharply at the start of 2014 and did not reach the higher levels seen in late 2013 throughout the year. Imports from Argentina and the European Union declined, partly offset by higher volumes sourced from neighbouring Canada. This trend was also mirrored for ethanol imports, which contracted fivefold in 2014 with the majority of supply coming from Brazil.
Figure 84 United States biodiesel production and imports (2013-15)
0
20
40
60
80
100
120
0
100
200
300
400
500
600
Jan-13
Feb-13
Mar-13
Apr-13
May-13
Jun-13
Jul-13
Aug-13
Sep-13
Oct-13
Nov-13
Dec-13
Jan-14
Feb-14
Mar-14
Apr-14
May-14
Jun-14
Jul-14
Aug-14
Sep-14
Oct-14
Nov-14
Dec-14
Jan-15
Feb-15
Mar-15
kb/d
Millio
n litr
es
Biodiesel production Argentina Indonesia European Union Other origins Canada Note: kb/d = thousand barrels per day.
Sources: Biodiesel data from US EIA (2015), Petroleum and Other Liquids (database). The attractiveness of conventional biofuels investment is determined on the demand side by blending requirements and on the supply side by agricultural feedstock fundamentals. In the United States, good corn crop harvests reduced feedstock costs from 2013 levels. This reduced wholesale ethanol prices in turn but to a lesser extent, resulting in higher biofuel production profit margins. However, ethanol blending economics were impacted due to reductions in the wholesale price of gasoline as a consequence of the global reduction in crude oil price observed in the latter half
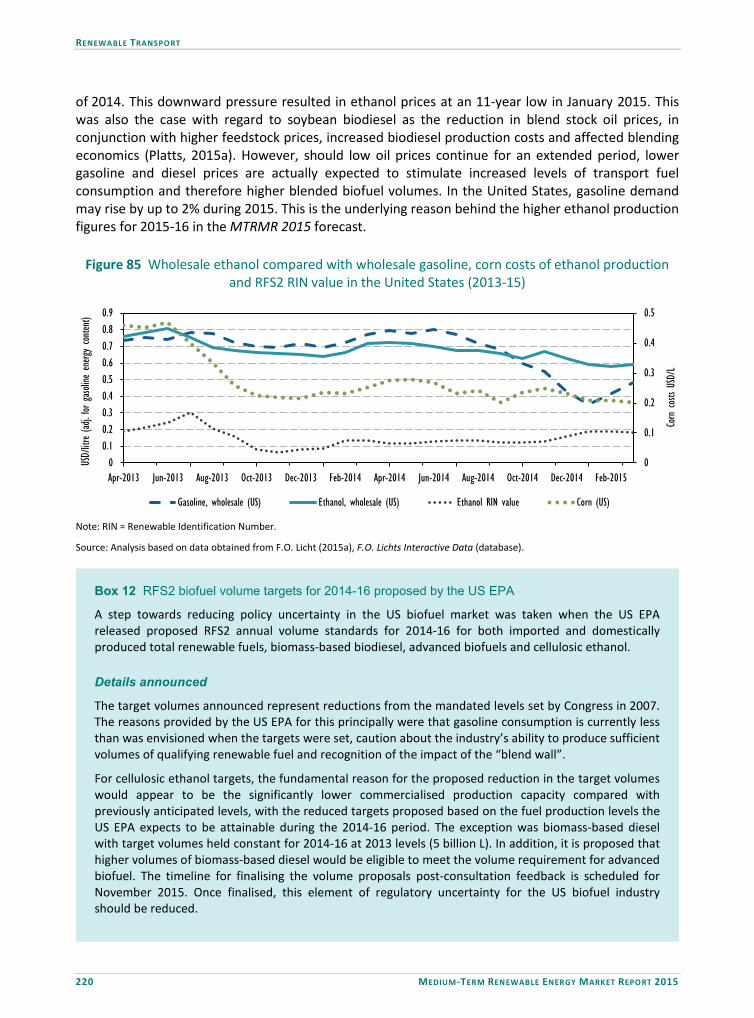
RENEWABLE TRANSPORT
220 MEDIUM-TERM RENEWABLE ENERGY MARKET REPORT 2015
of 2014. This downward pressure resulted in ethanol prices at an 11-year low in January 2015. This was also the case with regard to soybean biodiesel as the reduction in blend stock oil prices, in conjunction with higher feedstock prices, increased biodiesel production costs and affected blending economics (Platts, 2015a). However, should low oil prices continue for an extended period, lower gasoline and diesel prices are actually expected to stimulate increased levels of transport fuel consumption and therefore higher blended biofuel volumes. In the United States, gasoline demand may rise by up to 2% during 2015. This is the underlying reason behind the higher ethanol production figures for 2015-16 in the MTRMR 2015 forecast.
Figure 85 Wholesale ethanol compared with wholesale gasoline, corn costs of ethanol production and RFS2 RIN value in the United States (2013-15)
0
0.1
0.2
0.3
0.4
0.5
00.10.20.30.40.50.60.70.80.9
Apr-2013 Jun-2013 Aug-2013 Oct-2013 Dec-2013 Feb-2014 Apr-2014 Jun-2014 Aug-2014 Oct-2014 Dec-2014 Feb-2015
Corn cost
s USD
/L
USD/
litre (ad
j. for
gasol
ine energy
con
tent)
Gasoline, wholesale (US) Ethanol, wholesale (US) Ethanol RIN value Corn (US) Note: RIN = Renewable Identification Number.
Source: Analysis based on data obtained from F.O. Licht (2015a), F.O. Lichts Interactive Data (database).
Box 12 RFS2 biofuel volume targets for 2014-16 proposed by the US EPA
A step towards reducing policy uncertainty in the US biofuel market was taken when the US EPA released proposed RFS2 annual volume standards for 2014-16 for both imported and domestically produced total renewable fuels, biomass-based biodiesel, advanced biofuels and cellulosic ethanol.
Details announced
The target volumes announced represent reductions from the mandated levels set by Congress in 2007. The reasons provided by the US EPA for this principally were that gasoline consumption is currently less than was envisioned when the targets were set, caution about the industry’s ability to produce sufficient volumes of qualifying renewable fuel and recognition of the impact of the “blend wall”.
For cellulosic ethanol targets, the fundamental reason for the proposed reduction in the target volumes would appear to be the significantly lower commercialised production capacity compared with previously anticipated levels, with the reduced targets proposed based on the fuel production levels the US EPA expects to be attainable during the 2014-16 period. The exception was biomass-based diesel with target volumes held constant for 2014-16 at 2013 levels (5 billion L). In addition, it is proposed that higher volumes of biomass-based diesel would be eligible to meet the volume requirement for advanced biofuel. The timeline for finalising the volume proposals post-consultation feedback is scheduled for November 2015. Once finalised, this element of regulatory uncertainty for the US biofuel industry should be reduced.
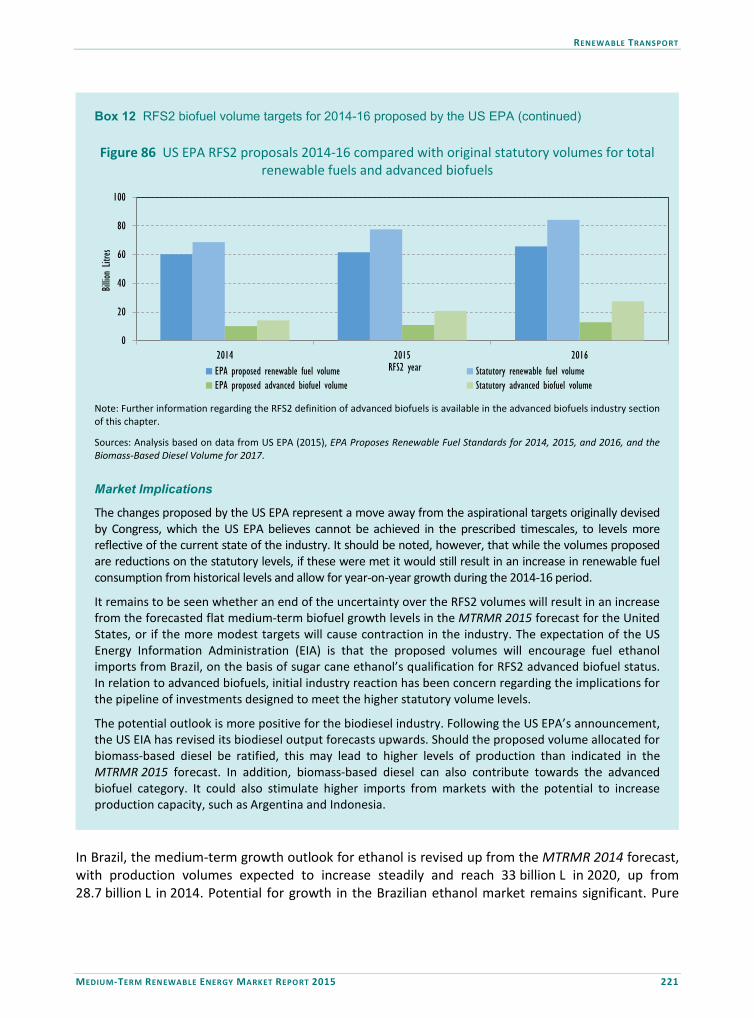
RENEWABLE TRANSPORT
MEDIUM-TERM RENEWABLE ENERGY MARKET REPORT 2015 221
Box 12 RFS2 biofuel volume targets for 2014-16 proposed by the US EPA (continued)
Figure 86 US EPA RFS2 proposals 2014-16 compared with original statutory volumes for total renewable fuels and advanced biofuels
0
20
40
60
80
100
2014 2015 2016
Billio
n Lit
res
RFS2 yearEPA proposed renewable fuel volume Statutory renewable fuel volumeEPA proposed advanced biofuel volume Statutory advanced biofuel volume
Note: Further information regarding the RFS2 definition of advanced biofuels is available in the advanced biofuels industry section of this chapter.
Sources: Analysis based on data from US EPA (2015), EPA Proposes Renewable Fuel Standards for 2014, 2015, and 2016, and the Biomass-Based Diesel Volume for 2017.
Market Implications
The changes proposed by the US EPA represent a move away from the aspirational targets originally devised by Congress, which the US EPA believes cannot be achieved in the prescribed timescales, to levels more reflective of the current state of the industry. It should be noted, however, that while the volumes proposed are reductions on the statutory levels, if these were met it would still result in an increase in renewable fuel consumption from historical levels and allow for year-on-year growth during the 2014-16 period.
It remains to be seen whether an end of the uncertainty over the RFS2 volumes will result in an increase from the forecasted flat medium-term biofuel growth levels in the MTRMR 2015 forecast for the United States, or if the more modest targets will cause contraction in the industry. The expectation of the US Energy Information Administration (EIA) is that the proposed volumes will encourage fuel ethanol imports from Brazil, on the basis of sugar cane ethanol’s qualification for RFS2 advanced biofuel status. In relation to advanced biofuels, initial industry reaction has been concern regarding the implications for the pipeline of investments designed to meet the higher statutory volume levels.
The potential outlook is more positive for the biodiesel industry. Following the US EPA’s announcement, the US EIA has revised its biodiesel output forecasts upwards. Should the proposed volume allocated for biomass-based diesel be ratified, this may lead to higher levels of production than indicated in the MTRMR 2015 forecast. In addition, biomass-based diesel can also contribute towards the advanced biofuel category. It could also stimulate higher imports from markets with the potential to increase production capacity, such as Argentina and Indonesia.
In Brazil, the medium-term growth outlook for ethanol is revised up from the MTRMR 2014 forecast, with production volumes expected to increase steadily and reach 33 billion L in 2020, up from 28.7 billion L in 2014. Potential for growth in the Brazilian ethanol market remains significant. Pure
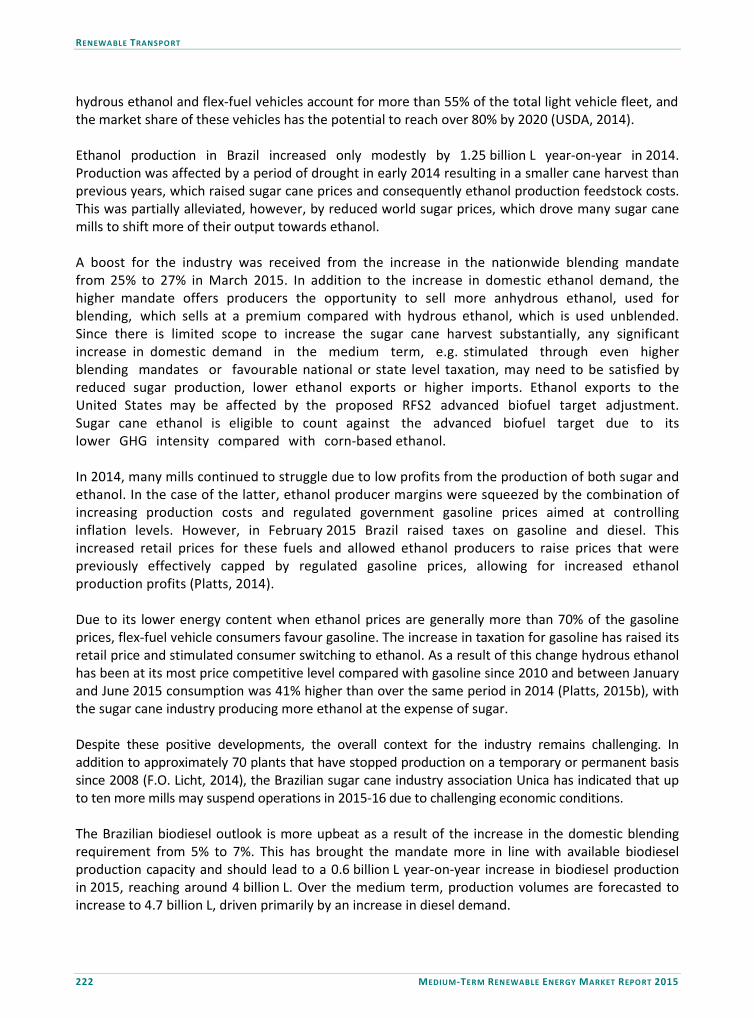
RENEWABLE TRANSPORT
222 MEDIUM-TERM RENEWABLE ENERGY MARKET REPORT 2015
hydrous ethanol and flex-fuel vehicles account for more than 55% of the total light vehicle fleet, and the market share of these vehicles has the potential to reach over 80% by 2020 (USDA, 2014).
Ethanol production in Brazil increased only modestly by 1.25 billion L year-on-year in 2014. Production was affected by a period of drought in early 2014 resulting in a smaller cane harvest than previous years, which raised sugar cane prices and consequently ethanol production feedstock costs. This was partially alleviated, however, by reduced world sugar prices, which drove many sugar cane mills to shift more of their output towards ethanol.
A boost for the industry was received from the increase in the nationwide blending mandate from 25% to 27% in March 2015. In addition to the increase in domestic ethanol demand, the higher mandate offers producers the opportunity to sell more anhydrous ethanol, used for blending, which sells at a premium compared with hydrous ethanol, which is used unblended. Since there is limited scope to increase the sugar cane harvest substantially, any significant increase in domestic demand in the medium term, e.g. stimulated through even higher blending mandates or favourable national or state level taxation, may need to be satisfied by reduced sugar production, lower ethanol exports or higher imports. Ethanol exports to the United States may be affected by the proposed RFS2 advanced biofuel target adjustment. Sugar cane ethanol is eligible to count against the advanced biofuel target due to its lower GHG intensity compared with corn-based ethanol.
In 2014, many mills continued to struggle due to low profits from the production of both sugar and ethanol. In the case of the latter, ethanol producer margins were squeezed by the combination of increasing production costs and regulated government gasoline prices aimed at controlling inflation levels. However, in February 2015 Brazil raised taxes on gasoline and diesel. This increased retail prices for these fuels and allowed ethanol producers to raise prices that were previously effectively capped by regulated gasoline prices, allowing for increased ethanol production profits (Platts, 2014).
Due to its lower energy content when ethanol prices are generally more than 70% of the gasoline prices, flex-fuel vehicle consumers favour gasoline. The increase in taxation for gasoline has raised its retail price and stimulated consumer switching to ethanol. As a result of this change hydrous ethanol has been at its most price competitive level compared with gasoline since 2010 and between January and June 2015 consumption was 41% higher than over the same period in 2014 (Platts, 2015b), with the sugar cane industry producing more ethanol at the expense of sugar.
Despite these positive developments, the overall context for the industry remains challenging. In addition to approximately 70 plants that have stopped production on a temporary or permanent basis since 2008 (F.O. Licht, 2014), the Brazilian sugar cane industry association Unica has indicated that up to ten more mills may suspend operations in 2015-16 due to challenging economic conditions.
The Brazilian biodiesel outlook is more upbeat as a result of the increase in the domestic blending requirement from 5% to 7%. This has brought the mandate more in line with available biodiesel production capacity and should lead to a 0.6 billion L year-on-year increase in biodiesel production in 2015, reaching around 4 billion L. Over the medium term, production volumes are forecasted to increase to 4.7 billion L, driven primarily by an increase in diesel demand.
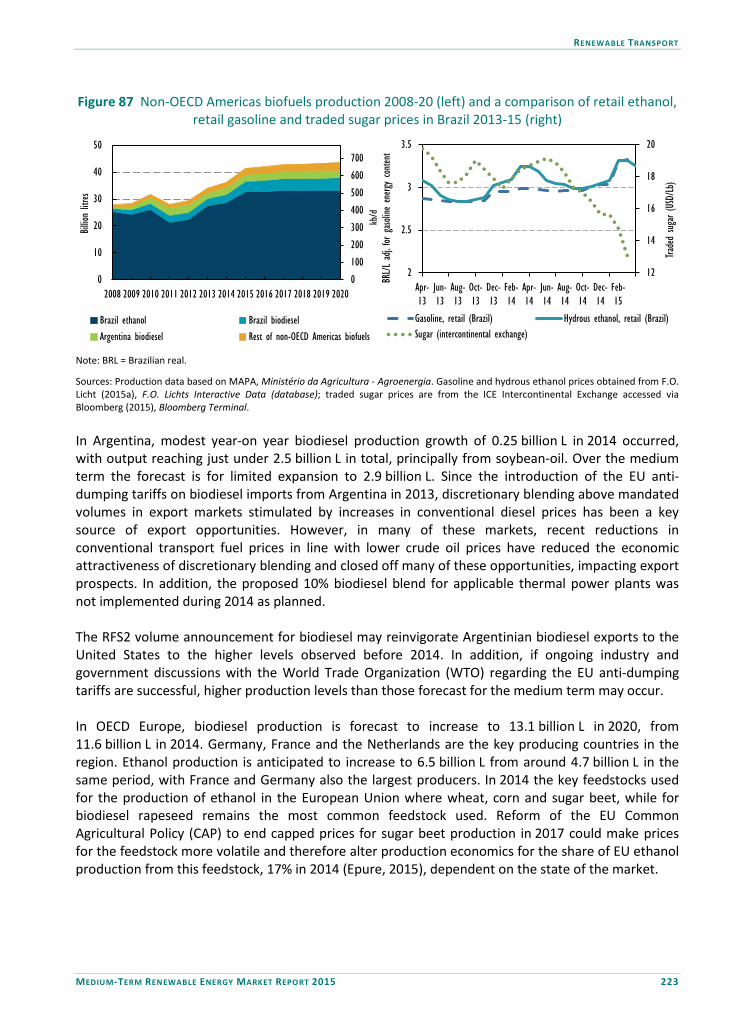
RENEWABLE TRANSPORT
MEDIUM-TERM RENEWABLE ENERGY MARKET REPORT 2015 223
Figure 87 Non-OECD Americas biofuels production 2008-20 (left) and a comparison of retail ethanol, retail gasoline and traded sugar prices in Brazil 2013-15 (right)
0
100
200
300
400
500
600
700
0
10
20
30
40
50
2008 2009 2010 2011 2012 2013 2014 2015 2016 2017 2018 2019 2020
kb/d
Billio
n litr
es
Brazil ethanol Brazil biodieselArgentina biodiesel Rest of non-OECD Americas biofuels
12
14
16
18
20
2
2.5
3
3.5
Apr-13
Jun-13
Aug-13
Oct-13
Dec-13
Feb-14
Apr-14
Jun-14
Aug-14
Oct-14
Dec-14
Feb-15
Traded
sugar (
USD/
Lb)
BRL/L
adj. fo
r gaso
line energ
y conte
nt
Gasoline, retail (Brazil) Hydrous ethanol, retail (Brazil)Sugar (intercontinental exchange)
Note: BRL = Brazilian real.
Sources: Production data based on MAPA, Ministério da Agricultura - Agroenergia. Gasoline and hydrous ethanol prices obtained from F.O. Licht (2015a), F.O. Lichts Interactive Data (database); traded sugar prices are from the ICE Intercontinental Exchange accessed via Bloomberg (2015), Bloomberg Terminal. In Argentina, modest year-on year biodiesel production growth of 0.25 billion L in 2014 occurred, with output reaching just under 2.5 billion L in total, principally from soybean-oil. Over the medium term the forecast is for limited expansion to 2.9 billion L. Since the introduction of the EU anti-dumping tariffs on biodiesel imports from Argentina in 2013, discretionary blending above mandated volumes in export markets stimulated by increases in conventional diesel prices has been a key source of export opportunities. However, in many of these markets, recent reductions in conventional transport fuel prices in line with lower crude oil prices have reduced the economic attractiveness of discretionary blending and closed off many of these opportunities, impacting export prospects. In addition, the proposed 10% biodiesel blend for applicable thermal power plants was not implemented during 2014 as planned. The RFS2 volume announcement for biodiesel may reinvigorate Argentinian biodiesel exports to the United States to the higher levels observed before 2014. In addition, if ongoing industry and government discussions with the World Trade Organization (WTO) regarding the EU anti-dumping tariffs are successful, higher production levels than those forecast for the medium term may occur. In OECD Europe, biodiesel production is forecast to increase to 13.1 billion L in 2020, from 11.6 billion L in 2014. Germany, France and the Netherlands are the key producing countries in the region. Ethanol production is anticipated to increase to 6.5 billion L from around 4.7 billion L in the same period, with France and Germany also the largest producers. In 2014 the key feedstocks used for the production of ethanol in the European Union where wheat, corn and sugar beet, while for biodiesel rapeseed remains the most common feedstock used. Reform of the EU Common Agricultural Policy (CAP) to end capped prices for sugar beet production in 2017 could make prices for the feedstock more volatile and therefore alter production economics for the share of EU ethanol production from this feedstock, 17% in 2014 (Epure, 2015), dependent on the state of the market.
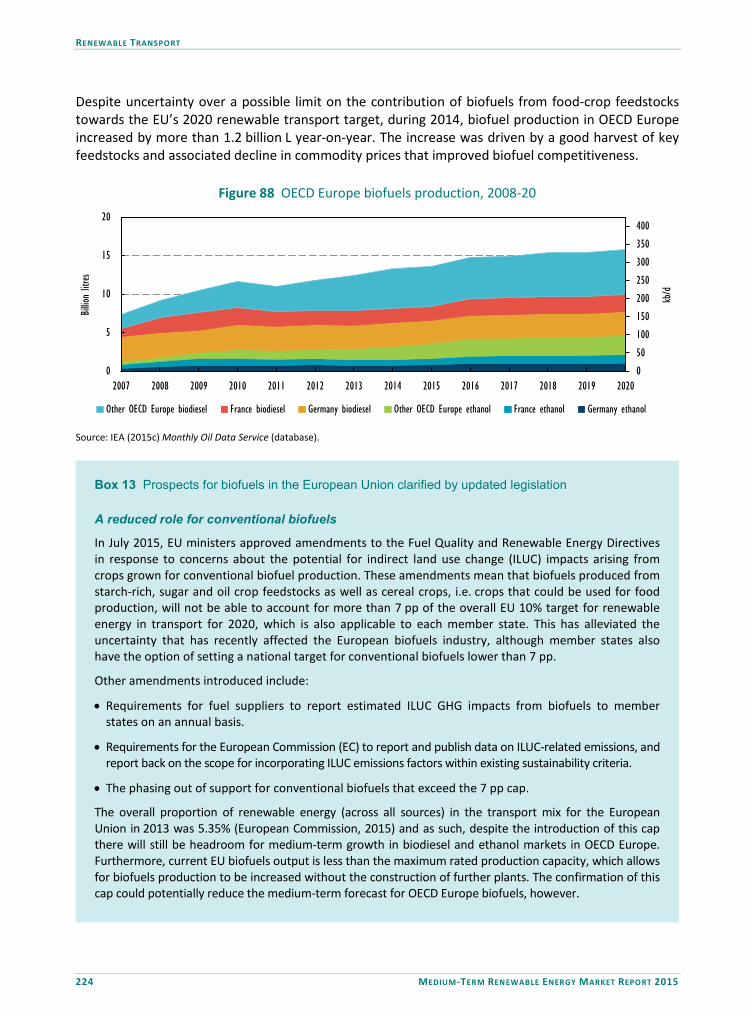
RENEWABLE TRANSPORT
224 MEDIUM-TERM RENEWABLE ENERGY MARKET REPORT 2015
Despite uncertainty over a possible limit on the contribution of biofuels from food-crop feedstocks towards the EU’s 2020 renewable transport target, during 2014, biofuel production in OECD Europe increased by more than 1.2 billion L year-on-year. The increase was driven by a good harvest of key feedstocks and associated decline in commodity prices that improved biofuel competitiveness.
Figure 88 OECD Europe biofuels production, 2008-20
0
50
100
150
200
250
300
350
400
0
5
10
15
20
2007 2008 2009 2010 2011 2012 2013 2014 2015 2016 2017 2018 2019 2020
kb/d
Billio
n litr
es
Other OECD Europe biodiesel France biodiesel Germany biodiesel Other OECD Europe ethanol France ethanol Germany ethanol
Source: IEA (2015c) Monthly Oil Data Service (database).
Box 13 Prospects for biofuels in the European Union clarified by updated legislation
A reduced role for conventional biofuels
In July 2015, EU ministers approved amendments to the Fuel Quality and Renewable Energy Directives in response to concerns about the potential for indirect land use change (ILUC) impacts arising from crops grown for conventional biofuel production. These amendments mean that biofuels produced from starch-rich, sugar and oil crop feedstocks as well as cereal crops, i.e. crops that could be used for food production, will not be able to account for more than 7 pp of the overall EU 10% target for renewable energy in transport for 2020, which is also applicable to each member state. This has alleviated the uncertainty that has recently affected the European biofuels industry, although member states also have the option of setting a national target for conventional biofuels lower than 7 pp.
Other amendments introduced include:
• Requirements for fuel suppliers to report estimated ILUC GHG impacts from biofuels to member states on an annual basis.
• Requirements for the European Commission (EC) to report and publish data on ILUC-related emissions, and report back on the scope for incorporating ILUC emissions factors within existing sustainability criteria.
• The phasing out of support for conventional biofuels that exceed the 7 pp cap.
The overall proportion of renewable energy (across all sources) in the transport mix for the European Union in 2013 was 5.35% (European Commission, 2015) and as such, despite the introduction of this cap there will still be headroom for medium-term growth in biodiesel and ethanol markets in OECD Europe. Furthermore, current EU biofuels output is less than the maximum rated production capacity, which allows for biofuels production to be increased without the construction of further plants. The confirmation of this cap could potentially reduce the medium-term forecast for OECD Europe biofuels, however.

RENEWABLE TRANSPORT
MEDIUM-TERM RENEWABLE ENERGY MARKET REPORT 2015 225
Box 13 Prospects for biofuels in the European Union clarified by updated legislation (continued)
Potential opportunity for advanced biofuels
The limit placed on the contribution of conventional biofuels to the 2020 EU 10% transport target leaves a 3 pp gap that will need to be met by other sources, principally a combination of advanced biofuels and electrified transport. Renewable electrified transport in the European Union accounted for 0.5% of total final energy consumption in transport in 2013.3 Given these current low market penetration levels, it is likely that advanced biofuels will have to play a key role in bridging the gap should the target be met.
Advanced biofuel status is defined within the legislation by production of the biofuel from a list of specific feedstocks. These include algae, the biomass fraction of municipal and other wastes, and agricultural residues. The energy contribution of biofuels produced from these is double-counted.
In an attempt to stimulate a significant increase in production from current levels and promote the consumption of advanced biofuels, another change to the directives was the introduction of a requirement for member states to set a (non-legally binding) target for a minimum proportion of advanced biofuels within renewable energy consumption in transport by 2020 to be introduced within 18 months of the legislation coming into force. A reference value of 0.5 pp of the 10% renewable transport target was provided. Member states are also encouraged to invest in research and development (R&D) in the production of biofuels not in competition with food crops.
Long-term role for biofuels in the European Union remains unclear
While the position of biofuels, both conventional and advanced, has been clarified with regard to the EU 2020 targets, post-2020 the landscape for biofuels remains unclear. Renewable transport will contribute to the 2030 targets announced in 2014 of a 40% reduction in GHG emissions (from 1990 levels) and a minimum 27% share of renewable energy consumption in the European Union. However, at present there has been no indication that a specific EU target for renewable energy in the transport sector will be included within the EC policy framework for climate and energy over the 2020 to 2030 period (E4tech, 2015).
After 2020, the Fuel Quality Directive requirement for a 6% reduction in the GHG emissions intensity of transport fuels (compared with a 2010 baseline) will also cease. The removal of this is particularly disadvantageous for advanced biofuels given their low GHG emissions profile.
Without an established 2030 goal, uncertainty for member countries and the automotive and biofuel industries may lead to varied actions to decarbonise transport and therefore fragmented further developments in renewable transport across the European Union. As a consequence, the potential exists for this to impact the tail end of the MTRMR 2015 medium-term forecast as the absence of a clear long-term policy outlook for renewable transport fuel and technology markets may affect further investment in new production capacity in the years preceding 2020.
Continued growth in emerging biofuels markets
In Indonesia, the largest biodiesel producer in non-OECD Asia, output reached 2.9 billion L in 2014, and is forecasted to increase to 4.3 billion L over the medium term. This represents an upward revision compared with the MTRMR 2014 due to a less pronounced reduction in biodiesel output from the EU anti-dumping tariffs on exports than expected. Exports have shifted from the European Union towards new markets in the People’s Republic of China (hereafter “China”) and the United 3 Analysis based on data from the EC Eurostat platform, no multiplication factors from the RED applied.
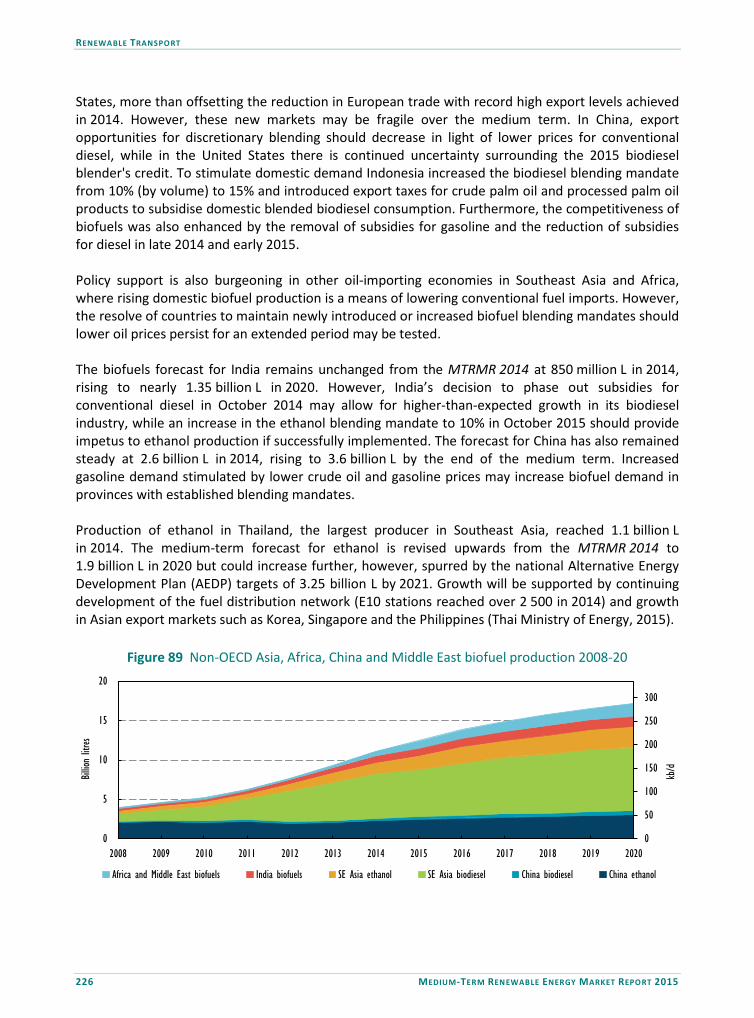
RENEWABLE TRANSPORT
226 MEDIUM-TERM RENEWABLE ENERGY MARKET REPORT 2015
States, more than offsetting the reduction in European trade with record high export levels achieved in 2014. However, these new markets may be fragile over the medium term. In China, export opportunities for discretionary blending should decrease in light of lower prices for conventional diesel, while in the United States there is continued uncertainty surrounding the 2015 biodiesel blender's credit. To stimulate domestic demand Indonesia increased the biodiesel blending mandate from 10% (by volume) to 15% and introduced export taxes for crude palm oil and processed palm oil products to subsidise domestic blended biodiesel consumption. Furthermore, the competitiveness of biofuels was also enhanced by the removal of subsidies for gasoline and the reduction of subsidies for diesel in late 2014 and early 2015. Policy support is also burgeoning in other oil-importing economies in Southeast Asia and Africa, where rising domestic biofuel production is a means of lowering conventional fuel imports. However, the resolve of countries to maintain newly introduced or increased biofuel blending mandates should lower oil prices persist for an extended period may be tested. The biofuels forecast for India remains unchanged from the MTRMR 2014 at 850 million L in 2014, rising to nearly 1.35 billion L in 2020. However, India’s decision to phase out subsidies for conventional diesel in October 2014 may allow for higher-than-expected growth in its biodiesel industry, while an increase in the ethanol blending mandate to 10% in October 2015 should provide impetus to ethanol production if successfully implemented. The forecast for China has also remained steady at 2.6 billion L in 2014, rising to 3.6 billion L by the end of the medium term. Increased gasoline demand stimulated by lower crude oil and gasoline prices may increase biofuel demand in provinces with established blending mandates. Production of ethanol in Thailand, the largest producer in Southeast Asia, reached 1.1 billion L in 2014. The medium-term forecast for ethanol is revised upwards from the MTRMR 2014 to 1.9 billion L in 2020 but could increase further, however, spurred by the national Alternative Energy Development Plan (AEDP) targets of 3.25 billion L by 2021. Growth will be supported by continuing development of the fuel distribution network (E10 stations reached over 2 500 in 2014) and growth in Asian export markets such as Korea, Singapore and the Philippines (Thai Ministry of Energy, 2015).
Figure 89 Non-OECD Asia, Africa, China and Middle East biofuel production 2008-20
0
50
100
150
200
250
300
0
5
10
15
20
2008 2009 2010 2011 2012 2013 2014 2015 2016 2017 2018 2019 2020
kb/d
Billio
n litr
es
Africa and Middle East biofuels India biofuels SE Asia ethanol SE Asia biodiesel China biodiesel China ethanol
RENEWABLE TRANSPORT
MEDIUM-TERM RENEWABLE ENERGY MARKET REPORT 2015 227
In Malaysia, the blending mandate for biodiesel was increased from 5% to 7% ahead of schedule in some regions in late 2014. Biodiesel production, principally from palm oil, increased in 2014 to 500 million L and is predicted to grow further to 900 million L over the medium term. In the Philippines the forecast remains steady from the MTRMR 2014. However, it remains to be seen if policy ambition can be matched by the ability of the biofuel industry to scale up accordingly. Ethanol production, supported by a 10% mandate that is planned to increase to 20% by 2020, was 200 million L in 2014 and forecasted to double over the medium term. However, at the current time, the majority of the mandate is being met through imports due to the current limited domestic capacity of ethanol production and low levels of output from existing infrastructure. The latter is associated with high production costs. Biodiesel production capacity is also lower than required to meet blending mandate levels. In recognition of current national production capacity the 5% blending mandate announced has been delayed, with blending at 2% levels instead. This increase is subject to ongoing assessment and may come into force later in 2015. The proposed E2 (2% ethanol) and B5 (5% biodiesel) mandates in South Africa are scheduled to come into force in the fourth quarter of 2015. Corn, one of the nation’s staple foods, will not be eligible for the production of ethanol to meet the mandate (South African Government, 2015). A key driver for the introduction of the mandates is the potential for job creation from development of the biofuels industry, particularly in the agriculture sector. As a result of lower crude oil prices a revision of the award mechanism for biofuel producer subsidies has been initiated with the award of support proposed to be undertaken on the basis of a competitive bidding process (Sapp, M., 2015). Mandates for ethanol blending are also in place in Zimbabwe (15%) and Ethiopia (5%). However, both countries have experienced difficulties in scaling up domestic production to reach demand, with a limited number of plants producing fuel grades in both countries. In December 2014, Zimbabwe temporarily reduced its ethanol mandate to 5% in response to low sugar cane availability (F.O. Licht, 2015b). In Ethiopia, delays in new sugar plants coming on line, compounded by competing demand from other industries for feedstock resources, have compromised ethanol production (F.O. Licht, 2015c). Less firm policy support is provided in Nigeria through a non-mandatory 10% target for blended ethanol, and in Kenya where a 10% target is in place for the city of Kisumu. Advanced biofuels industry The development and production of advanced biofuels, which has the potential in the longer term to more sustainably reduce the overall carbon footprint of the transport sector, has undergone a step change in capacity growth since the MTRMR 2014, with the first batch of commercial-scale plants commissioned. However, policy support is still important to ensure further growth in this sector, and as with conventional biofuels, the future policy landscape for the industry remains uncertain, which could potentially impact medium-term growth prospects. There is no globally recognised definition of advanced biofuels. Within relevant EU directives, a list of specific biofuel production feedstocks eligible to be double-counted towards the 2020 renewable transport target is included. These include a range of agricultural and forestry residues and biomass-based waste feedstocks, all of which are not suitable for food production and are applicable to the suggested 0.5 pp advanced biofuel target. Under the RFS2 scheme in the United States the definition differs, as advanced feedstocks includes food production feedstocks such as sugar cane and sugar beet-based ethanol, and renewable diesel from

RENEWABLE TRANSPORT
228 MEDIUM-TERM RENEWABLE ENERGY MARKET REPORT 2015
vegetable oil feedstocks. The RFS2 also has specific subcategories of advanced biofuels for cellulosic ethanol and biomass-based diesel, linked to requirements for life-cycle GHG emissions reductions of 60% for cellulosic ethanol and 50% for biomass-based diesel. Common characteristics of feedstocks that would be generally accepted as advanced across different national schemes are biomass-based wastes and residues not suitable for food production, lingo-cellulosic feedstocks, and algae. Early signs of commercialisation in advanced biofuels markets Overall, 2014 was a bright year for the advanced biofuels industry due to the opening of five commercial-scale production plants. With an additional two becoming operational in 2015, this represents combined additional rated production capacity in excess of 500 million L per year. Three of the plants are located in the United States and two in Brazil, all of which produce cellulosic ethanol. Another large-scale plant for the production of advanced renewable diesel opened in Finland. Output at rated capacity from these plants would represent around 0.5% of total conventional biofuel production in 2014. Feedstocks for these plants are principally agricultural residues unsuitable for food production such as corn stover, varieties of straw, sugar cane bagasse and tall oil. As these have relatively low value and low energy content, they are generally sourced within a specified radius of the plant in order to minimise logistics costs and transport emissions. As a result of this, future advanced biofuel plant locations are forecasted to be located alongside available feedstock resources. Plants based on thermochemical gasification technologies have greater flexibility of potential feedstocks with the potential to accept waste wood and the biomass fraction of municipal wastes.
Map 2 Global examples of commercial-scale advanced biofuel plants

RENEWABLE TRANSPORT
MEDIUM-TERM RENEWABLE ENERGY MARKET REPORT 2015 229
With regard to cellulosic ethanol, almost half of global commercial-scale production capacity is located in the United States. Data from the RFS2 scheme show that cellulosic ethanol production has increased with the commissioning of the aforementioned plants. RIN4 data from the US EPA indicate that in April 2015, cellulosic ethanol production reached a record high level. However, this still only accounted for less than 10% of the total rated capacity of the three commissioned commercial-scale plants in the United States. This suggests these were operating significantly below full output capacity. This is understood to be the case with other advanced biofuel plants recently commissioned elsewhere, indicating that at the current time, the ability to scale up to full rated production capacity at a commercial scale is still to be widely demonstrated. Specific challenges associated with increasing advanced biofuel production to output levels in line with the rated capacities of these commercial-scale plants include issues with the composition of by-products produced, destruction of catalysts and extraction of the biofuel produced. A further key technical consideration to achieving reliable commercial-scale operation is suitable pre-treatment and cleaning of the higher quantities of feedstocks used to ensure they are free from contaminants, e.g. sand, which compromise the production processes and quality of the biofuel produced. These newly commissioned plants are faced with a steep learning curve to achieve asset utilisation targets. Due to the complexity and variety of different technologies and processes used across these facilities, at this stage it is not possible to pinpoint the exact issues causing longer commissioning periods and estimate a timescale to resolve these and reach rated capacity production. This uncertainty places a limit on the ability to accurately forecast medium-term advanced biofuel production at the current time. These recently constructed plants have a vital role to play in shaping future market development through demonstrating the economic and technical feasibility of producing commercial-scale volumes of advanced biofuels. From a technical standpoint, these plants should provide opportunities for further technology and process modifications to ensure sustained higher levels of output and improving economic viability. In addition, if these projects prove successful, this should provide opportunities for these pioneering companies to license their technologies, standardising plant and process design and facilitating expansion of the sector. By contrast, commercial production of advanced biofuels derived from algae does not look likely over the medium term. Approximate investment costs for the commercial-scale advanced biofuel plants identified using hydrolysis- and fermentation-based technology approaches are USD 2 million per million litres rated capacity, with costs in excess of twice this amount for plants utilising gasification technologies due to lower rated capacities. As these are the first advanced biofuel projects at this scale, it can be expected that investment costs for replica plants will decrease due to technological learning, design improvements and accessing economies of scale, e.g. for equipment and enzymes. It can also be anticipated that more favourable financing conditions would be available for plants not considered first of a kind and therefore lower-risk investments. The output from these is not thought to be financially competitive with either petroleum transport fuels, especially given the recent decline in global crude oil prices, or conventional biofuels as yet. 4 A RIN is awarded for each gallon of cellulosic ethanol blended.

RENEWABLE TRANSPORT
230 MEDIUM-TERM RENEWABLE ENERGY MARKET REPORT 2015
Therefore, a key challenge faced by the nascent advanced biofuels industry to ensure long-term competitiveness is reducing production costs towards the untaxed price of conventional alternatives. From a commercial perspective, a clear demonstration of attractive and stable financial returns will also be important in encouraging further investment to expand the sector. The equivalent crude oil price at which current advanced biofuel production would be competitive (break-even oil price) is not currently clear and due to the bespoke nature of current commercial-scale plants is variable. This is due to the variety of different processes and technologies utilised and bespoke costs attributable to each plant, e.g. differing overheads and costs for enzyme and feedstocks. There is disparity between production cost assessments from the advanced biofuels industry, with suggestions of competiveness at crude oil prices at around or less than USD 100 per barrel (bbl), and analysis conducted that indicates break-even costs for certain advanced biofuel production pathways in the region of USD 130/bbl or higher depending on the oil price assumptions used (Lopes Junqueira, 2015; Davis et al., 2013). Reducing production costs is a key challenge for the advanced biofuels industry in the medium term and beyond. It is anticipated that break-even oil prices for advanced biofuels are not competitive with conventional biofuels or petroleum-based transport fuels at currently observed 2015 crude oil prices, i.e. between USD 45/bbl to USD 70/bbl in the first half of 2015. However, it is considered that advanced biofuel production costs have the potential to reduce considerably, especially as a result of: • Technological learning allowing for improvements in design and operation, consequentially
reducing operational costs and increasing biofuel yield. • Reductions in enzyme costs. Achieving reductions in feedstocks derived from the agricultural sector may be more challenging due to competition from other markets for these. However, where plants have access to these free of charge production costs will be further reduced. Examples of these include the use of residues from conventional biofuel plants from the same parent company, or gasification technologies utilising zero or negative cost (through gate/tipping fee income) waste feedstocks. Sugar cane bagasse feedstock costs in Brazil are currently more competitively priced than agricultural residue feedstock costs in the United States and Europe. Achieving significant cost reductions in the industry may be realised towards the end of the medium term or later. The attractiveness of investment in the advanced biofuels industry is likely to be dependent on a combined reduction in both the initial investment costs per rated capacity and operational costs per volume of fuel produced, coupled with demonstration that high utilisation rates can be achieved. However, due to current limitations on cost data availability it is not possible to assess the combined investment and operational cost reductions required in order to deliver the pipeline of future projects as detailed within the advanced biofuels forecast. A shifting policy framework for advanced biofuels
Despite clear signs of development in 2014, the lack of a stable policy environment for advanced biofuels remains a major challenge for the industry and its investment climate. Growth in the advanced biofuel sector will depend heavily on a stable and supportive long-term policy framework that will facilitate the next generation of commercial-scale plants to be built and operated. Aside
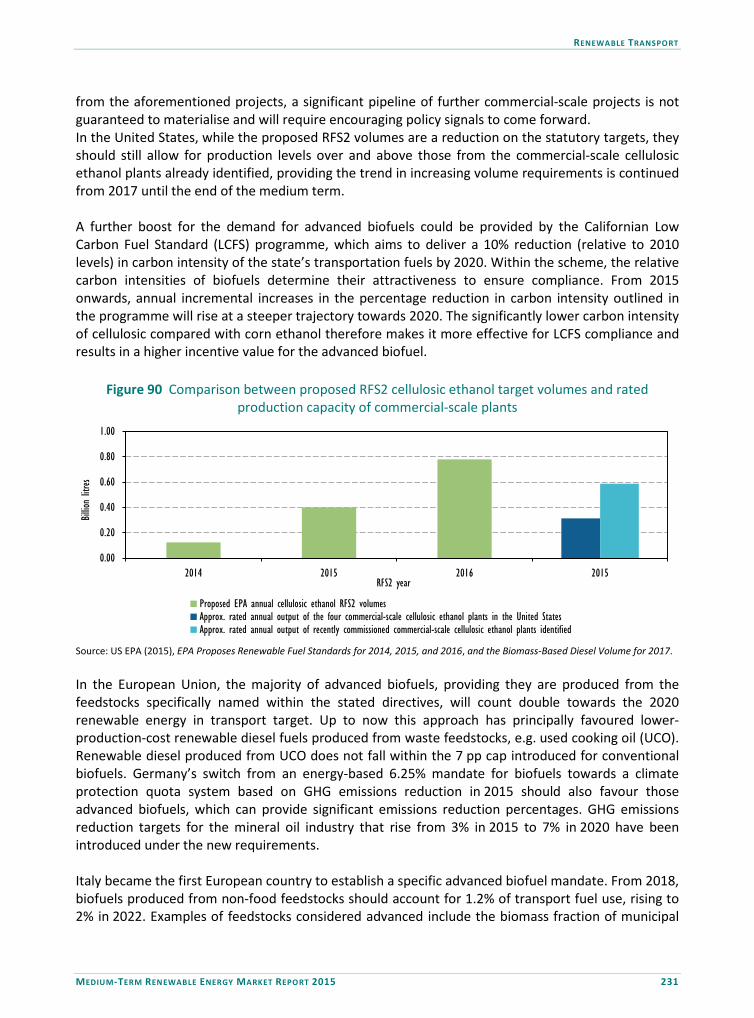
RENEWABLE TRANSPORT
MEDIUM-TERM RENEWABLE ENERGY MARKET REPORT 2015 231
from the aforementioned projects, a significant pipeline of further commercial-scale projects is not guaranteed to materialise and will require encouraging policy signals to come forward. In the United States, while the proposed RFS2 volumes are a reduction on the statutory targets, they should still allow for production levels over and above those from the commercial-scale cellulosic ethanol plants already identified, providing the trend in increasing volume requirements is continued from 2017 until the end of the medium term. A further boost for the demand for advanced biofuels could be provided by the Californian Low Carbon Fuel Standard (LCFS) programme, which aims to deliver a 10% reduction (relative to 2010 levels) in carbon intensity of the state’s transportation fuels by 2020. Within the scheme, the relative carbon intensities of biofuels determine their attractiveness to ensure compliance. From 2015 onwards, annual incremental increases in the percentage reduction in carbon intensity outlined in the programme will rise at a steeper trajectory towards 2020. The significantly lower carbon intensity of cellulosic compared with corn ethanol therefore makes it more effective for LCFS compliance and results in a higher incentive value for the advanced biofuel.
Figure 90 Comparison between proposed RFS2 cellulosic ethanol target volumes and rated production capacity of commercial-scale plants
0.00
0.20
0.40
0.60
0.80
1.00
2014 2015 2016 2015
Billio
n litr
es
RFS2 year
Proposed EPA annual cellulosic ethanol RFS2 volumesApprox. rated annual output of the four commercial-scale cellulosic ethanol plants in the United StatesApprox. rated annual output of recently commissioned commercial-scale cellulosic ethanol plants identified
Source: US EPA (2015), EPA Proposes Renewable Fuel Standards for 2014, 2015, and 2016, and the Biomass-Based Diesel Volume for 2017. In the European Union, the majority of advanced biofuels, providing they are produced from the feedstocks specifically named within the stated directives, will count double towards the 2020 renewable energy in transport target. Up to now this approach has principally favoured lower-production-cost renewable diesel fuels produced from waste feedstocks, e.g. used cooking oil (UCO). Renewable diesel produced from UCO does not fall within the 7 pp cap introduced for conventional biofuels. Germany’s switch from an energy-based 6.25% mandate for biofuels towards a climate protection quota system based on GHG emissions reduction in 2015 should also favour those advanced biofuels, which can provide significant emissions reduction percentages. GHG emissions reduction targets for the mineral oil industry that rise from 3% in 2015 to 7% in 2020 have been introduced under the new requirements. Italy became the first European country to establish a specific advanced biofuel mandate. From 2018, biofuels produced from non-food feedstocks should account for 1.2% of transport fuel use, rising to 2% in 2022. Examples of feedstocks considered advanced include the biomass fraction of municipal
RENEWABLE TRANSPORT
232 MEDIUM-TERM RENEWABLE ENERGY MARKET REPORT 2015
solid wastes, straw and bagasse. Renewable diesel based on animal fat or UCO is not included. A specific advanced biofuel quota for gasoline is also being considered by Denmark for introduction in 2016. Finland also has a supportive policy framework for advanced biofuel investments based on its national target of a 20% share of biofuels in transport by 2020, and proposals for a higher share still in 2030. It remains to be seen if specific mandates will be introduced in other European countries following the European Union’s non-mandatory proposal for member states to establish a 0.5 pp advanced biofuel target. Outside of Europe, Thailand has established an ambitious advanced biofuel target of approximately 1 billion L annual production by 2021 under the AEDP. However, the definition of advanced biofuels in terms of the target is not clear at the present time. In Brazil, cellulosic ethanol is treated equally to conventional ethanol under the national blending mandate. As such, key drivers for cellulosic ethanol investment will be the potential to maximise the value of abundant low-cost sugar cane bagasse feedstock availability, and the additional value of the fuel compared with conventional biofuels in European Union and United States export markets. Initial exports of cellulosic ethanol from Brazil to EU countries received a higher price than its sugar cane equivalent. Investment cost support
High initial investment costs represent a particular challenge to development. In the United States certain advanced biofuel plants have been supported through loan guarantees and grants to cover project investment and supply chain development costs. It should be noted, however, that in Finland the construction of an advanced renewable diesel plant without external support was possible. While EU state aid guidelines prohibit investment aid for the construction of conventional biofuels facilities, support is allowed for the conversion of conventional plants to produce advanced biofuels or the construction of new advanced biofuel facilities. In late 2014, the United Kingdom launched a demonstration competition providing GBP 25 million of grant funding for innovative projects to support development in the production of advanced biofuels. The relative technical immaturity of advanced biofuels production technologies still means there is a role to play for government- and industry-focused R&D funding to further build on existing technologies and innovative further. Due to the high availability of forestry and waste products in certain countries, innovation in advanced biofuel production processes from these feedstocks may be a key area of focus. To what extent a prolonged period of low global oil prices would reduce the required policy motivation to support further technology development remains to be seen. Policy uncertainty and a lack of suitable support measures could lead to a levelling off of growth and the abandoning of proposed advanced biofuel projects. Smaller-scale integrated advanced biofuel plants
Apart from the construction of large-scale advanced biofuel production facilities, an alternative smaller-scale, but lower-investment-cost, approach to production also exists. This is based on situating the advanced biofuel production process within the industrial plants where the biofuel feedstock is sourced. A small number of plants have been commissioned in the Nordic countries based on this approach. While these plants have smaller production volumes, e.g. less than 10 million L per year, feedstock logistics and investment costs are minimised. In addition, the biofuel production processes can be engineered in line with the specific waste or residue feedstock
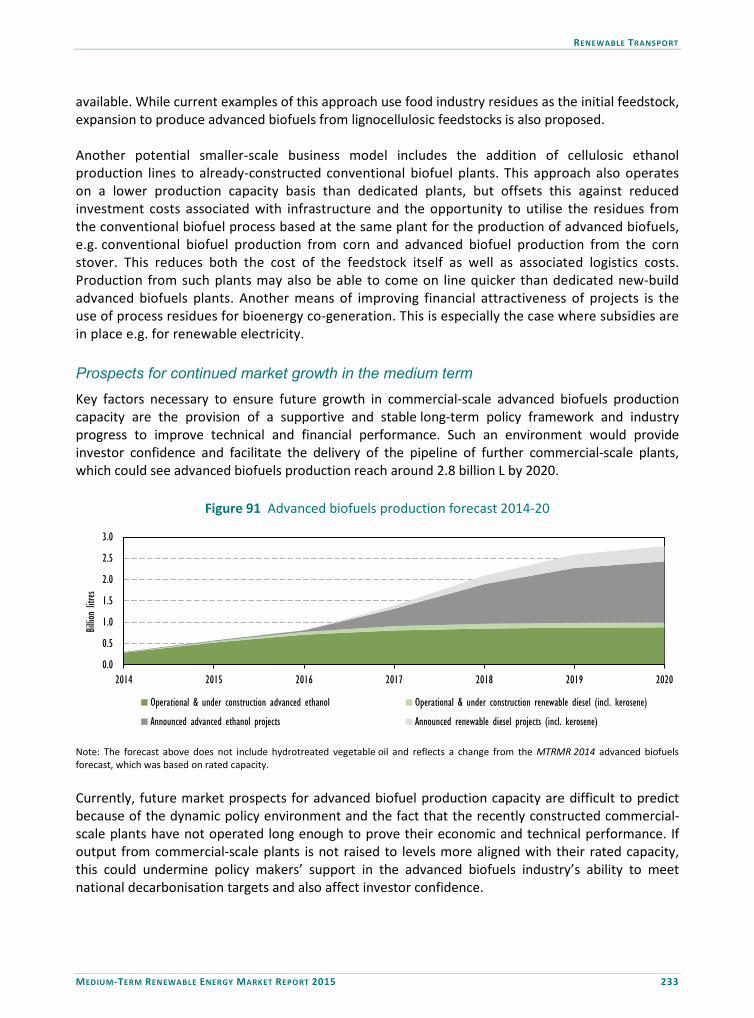
RENEWABLE TRANSPORT
MEDIUM-TERM RENEWABLE ENERGY MARKET REPORT 2015 233
available. While current examples of this approach use food industry residues as the initial feedstock, expansion to produce advanced biofuels from lignocellulosic feedstocks is also proposed. Another potential smaller-scale business model includes the addition of cellulosic ethanol production lines to already-constructed conventional biofuel plants. This approach also operates on a lower production capacity basis than dedicated plants, but offsets this against reduced investment costs associated with infrastructure and the opportunity to utilise the residues from the conventional biofuel process based at the same plant for the production of advanced biofuels, e.g. conventional biofuel production from corn and advanced biofuel production from the corn stover. This reduces both the cost of the feedstock itself as well as associated logistics costs. Production from such plants may also be able to come on line quicker than dedicated new-build advanced biofuels plants. Another means of improving financial attractiveness of projects is the use of process residues for bioenergy co-generation. This is especially the case where subsidies are in place e.g. for renewable electricity. Prospects for continued market growth in the medium term Key factors necessary to ensure future growth in commercial-scale advanced biofuels production capacity are the provision of a supportive and stable long-term policy framework and industry progress to improve technical and financial performance. Such an environment would provide investor confidence and facilitate the delivery of the pipeline of further commercial-scale plants, which could see advanced biofuels production reach around 2.8 billion L by 2020.
Figure 91 Advanced biofuels production forecast 2014-20
0.0
0.5
1.0
1.5
2.0
2.5
3.0
2014 2015 2016 2017 2018 2019 2020
Billio
n litr
es
Operational & under construction advanced ethanol Operational & under construction renewable diesel (incl. kerosene)
Announced advanced ethanol projects Announced renewable diesel projects (incl. kerosene)
Note: The forecast above does not include hydrotreated vegetable oil and reflects a change from the MTRMR 2014 advanced biofuels forecast, which was based on rated capacity. Currently, future market prospects for advanced biofuel production capacity are difficult to predict because of the dynamic policy environment and the fact that the recently constructed commercial-scale plants have not operated long enough to prove their economic and technical performance. If output from commercial-scale plants is not raised to levels more aligned with their rated capacity, this could undermine policy makers’ support in the advanced biofuels industry’s ability to meet national decarbonisation targets and also affect investor confidence.
RENEWABLE TRANSPORT
234 MEDIUM-TERM RENEWABLE ENERGY MARKET REPORT 2015
During 2014, several companies announced investment in further commercial-scale advanced biofuel production plants over the medium term. Several of these were the companies behind the construction of the first commercial plants highlighted, and these proposals include replication of the technology used and production processes in place. Should announced projects to build new plants materialise, production capacity could increase substantially. Whether the industry’s expansion plans will be realised remains to be seen, however, as some announced projects have been cancelled or mothballed, or failed to attract the investment to develop on stated timescales. Reductions to established targets and uncertainty over future support frameworks may have been a key factor in this. In the key US market, the recent reduction of statutory volumes and uncertainty regarding RFS2 volume targets post-2016 for advanced biofuels are also unlikely to stimulate investor confidence. While in the European Union, the absence of a specific post-2020 target for transport is not conducive to encouraging large-scale investments in advanced biofuel production capacity over the remainder of the medium term and beyond. In China, a key driver to future development of advanced biofuels may be high demand associated with economic growth, coupled with the fact that the construction of grain-based conventional biofuel plants is not permitted due to competition for land resources with food production. As such it can be anticipated that future increased biofuel production in China may focus on feedstocks such as waste vegetable oils, sweet sorghum and cassava (termed 1.5 generation biofuels) or advanced biofuels from cellulosic feedstocks. Based on these factors, forecast growth in advanced biofuels production over the medium term includes considerable uncertainty. When assessing potential installed capacity over this timescale, the time to develop further commercial-scale plants also needs to be taken into consideration. Construction timescales for commercial-scale plants of less than two years are unlikely. Therefore, should the first generation of large-scale advanced biofuel plants demonstrate successful operation, a wider roll-out of these may not come on line before the end of the medium term.
Box 14 An update on market, technology and policy developments for electric vehicles
This content has been adapted from Box 14 of the MTRMR 2014, “Electric vehicles and renewable energy: Opportunities for synergy”.
While biofuels are the only sizeable renewable fuel source used in transport today, opportunities exist for the enhanced use of renewable electricity in both road and rail transport. Electric vehicles (EVs) in particular could play a key role in increasing the use of renewable electricity in transport, with associated benefits for grid interaction and the integration of variable renewable sources.
Even with today’s carbon intensity, the IEA Energy Technology Perspectives 2014 (ETP 2014) has determined that more than 27% of countries worldwide could obtain savings in carbon dioxide (CO2) emissions from EVs (IEA, 2014b). Current abatement costs per tonne of CO2 are generally higher for EVs than for alternative measures, such as greater energy efficiency or the use of biofuels. This is due to the relatively high investment costs for EVs and the varying range of GHG intensities of power generation. In the longer run, with electricity supplies projected to become less carbon-intensive and as the costs of EV components decline, EVs may become an increasingly attractive option to abate CO2 emissions in the transport sector. This is particularly the case for light-duty vehicles (IEA, 2014b).
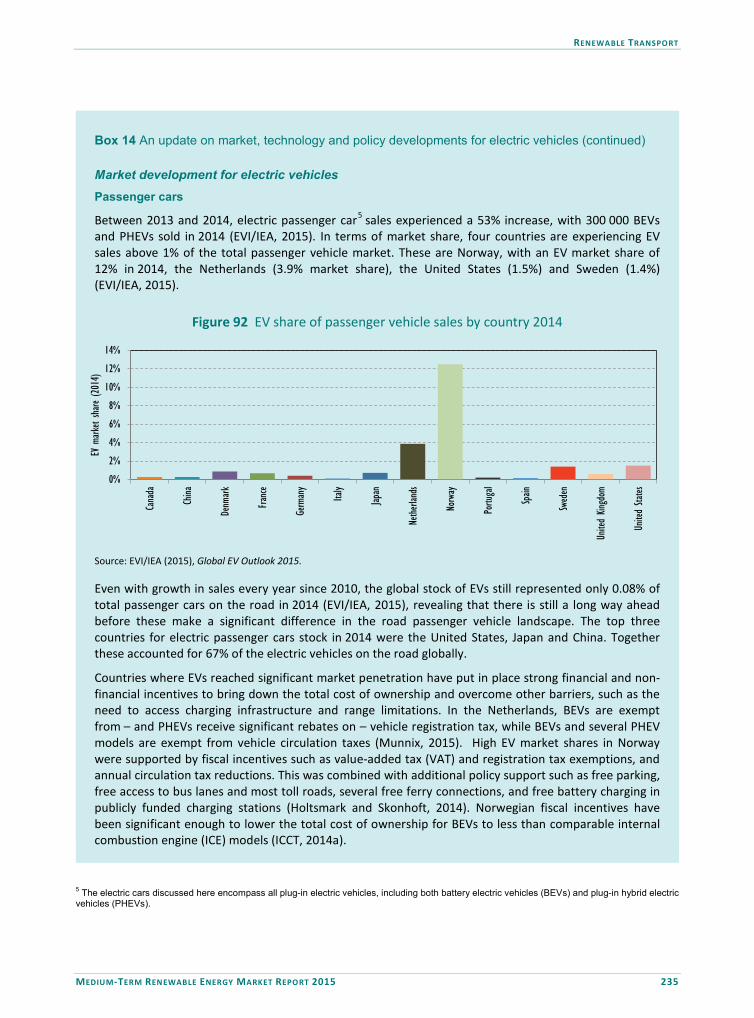
RENEWABLE TRANSPORT
MEDIUM-TERM RENEWABLE ENERGY MARKET REPORT 2015 235
*
Box 14 An update on market, technology and policy developments for electric vehicles (continued)
Market development for electric vehicles Passenger cars
Between 2013 and 2014, electric passenger car5 sales experienced a 53% increase, with 300 000 BEVs and PHEVs sold in 2014 (EVI/IEA, 2015). In terms of market share, four countries are experiencing EV sales above 1% of the total passenger vehicle market. These are Norway, with an EV market share of 12% in 2014, the Netherlands (3.9% market share), the United States (1.5%) and Sweden (1.4%) (EVI/IEA, 2015).
Figure 92 EV share of passenger vehicle sales by country 2014
0%
2%
4%
6%
8%
10%
12%
14%
Cana
da
China
Denm
ark
France
Germ
any
Italy
Japan
Nethe
rland
s
Norw
ay
Portu
gal
Spain
Swed
en
Unite
d Kin
gdom
Unite
d Sta
tes
EV m
arket
share
(201
4)
Source: EVI/IEA (2015), Global EV Outlook 2015.
Even with growth in sales every year since 2010, the global stock of EVs still represented only 0.08% of total passenger cars on the road in 2014 (EVI/IEA, 2015), revealing that there is still a long way ahead before these make a significant difference in the road passenger vehicle landscape. The top three countries for electric passenger cars stock in 2014 were the United States, Japan and China. Together these accounted for 67% of the electric vehicles on the road globally.
Countries where EVs reached significant market penetration have put in place strong financial and non-financial incentives to bring down the total cost of ownership and overcome other barriers, such as the need to access charging infrastructure and range limitations. In the Netherlands, BEVs are exempt from – and PHEVs receive significant rebates on – vehicle registration tax, while BEVs and several PHEV models are exempt from vehicle circulation taxes (Munnix, 2015). High EV market shares in Norway were supported by fiscal incentives such as value-added tax (VAT) and registration tax exemptions, and annual circulation tax reductions. This was combined with additional policy support such as free parking, free access to bus lanes and most toll roads, several free ferry connections, and free battery charging in publicly funded charging stations (Holtsmark and Skonhoft, 2014). Norwegian fiscal incentives have been significant enough to lower the total cost of ownership for BEVs to less than comparable internal combustion engine (ICE) models (ICCT, 2014a).
5 The electric cars discussed here encompass all plug-in electric vehicles, including both battery electric vehicles (BEVs) and plug-in hybrid electric vehicles (PHEVs).

RENEWABLE TRANSPORT
236 MEDIUM-TERM RENEWABLE ENERGY MARKET REPORT 2015
Box 14 An update on market, technology and policy developments for electric vehicles (continued)
Other transport modes
Sustained uptake in electrification has also been achieved in rail transport, buses and 2-wheelers.
Rail is the most electrified means of transport with over 30% of global railway tracks electrified (IEA/UIC, 2014), and 63% of rail-sector activity (in terms of train kilometres) being electric in 2012 (IEA/UIC, 2014), 6 without accounting for urban rail networks (metros and tramways). Intercity rail track electrification has been primarily justified by its cost-effectiveness. Above a certain usage threshold, the initial cost of electrifying lines and equipment is compensated by lower operating costs due to the higher energy efficiency of electric trains compared with diesel-powered equivalents.
Like urban rail, buses have been electrified using catenary overhead lines (trolleybuses) for decades, most notably in Eastern Europe (Trolley:motion, 2015). However, technological improvements are still being sought. Recent bus electrification technology developments currently at demonstration stage use batteries and supercapacitors in combination with inductive charging and contact-based systems such as articulated arms (Tozzi, 2015). Supercapacitors are potentially lightweight and cost-effective, and allow for quicker charging at the bus station. However, current drawbacks are additional costs for associated recharging infrastructure and high recharging frequency.
Battery-swapping concepts for buses are also emerging in pilot applications (Begins, 2015). These are based on the concept of recharging at bus terminals. While this adds additional battery costs, these must be weighed against the advantage of the increased flexibility of larger ranges between charges and future potential for integration with variable renewable energy in the electricity grid.
The electric 2-wheeler market is very dynamic in China, with a stock of 230 million e-bikes. This represents over 300 times the current electric passenger car stock worldwide (EVI/IEA, 2015). This success has been largely due to the ban of gasoline-fuelled 2-wheelers from major city centres in an attempt to reduce air pollution (Weinert, 2007).
Infrastructure
The use of EVs also requires access to charging infrastructure. This is especially relevant for passenger cars, which are less likely to rely on dedicated infrastructure than public transport vehicles. In addition, with the exception of some two-wheeled applications, they are unable to utilise existing power supply outlets for charging. Statistics show that the number of electric vehicle supply equipment (EVSE) units had risen to nearly 110 000 by the end of 2014, with an eightfold increase in fast chargers between 2012 and 2014 (EVI/IEA, 2015), therefore helping to reduce charging time and range anxiety.7
Challenges and opportunities
In spite of the rapid and encouraging growth of EV penetration in some passenger car markets, a number of challenges relating to costs and infrastructure still have to be addressed to meet the ambitious target outlined in the IEA ETP 2°C Scenario8 and the Electric Vehicles Initiative for 2020 of 6 million EVs sold and 20 million overall in the global car stock (IEA, 2015a; CEM, 2015).
6 IEA calculation based on UIC data. 7 The fear felt by EV drivers that the vehicle will run out of power mid-journey. 8 Action required to limit climate change to a global temperature rise of 2°C.

RENEWABLE TRANSPORT
MEDIUM-TERM RENEWABLE ENERGY MARKET REPORT 2015 237
Box 14 An update on market, technology and policy developments for electric vehicles (continued)
Land transport modes hold varying potentials for future electrification. Opportunities are most extensive in urban areas, where driving ranges are shorter and stops are more frequent. Technological developments in this area include fast battery charging, battery-swapping concepts, supercapacitors and catenary overhead lines. Different modes of transport that could be electrified include passenger 2-wheelers, cars, buses, local delivery vans, and medium-size delivery vehicles or service vehicles. Prospects for long-distance road transport (especially freight) are less diverse and depend on the success of the deployment of pilot concepts on electrified highways.
The weight of electricity storage in batteries for long-range requirements currently limits the role of electrification in aviation to electric-powered solutions for operations on the ground (airport taxi). Electric applications for long-distance maritime transport are restricted by the travel distances and journey timeframes in this sector. As such, applications are limited to the integration of solar electricity to the power, primarily derived from fossil fuel generators, used for ship propulsion and auxiliary supply.
Technology developments
Key challenges in EV development related to batteries are high costs, significant charging times, and energy density and expected lifetime characteristics, as well as the need to develop adequate infrastructure for the supply of electricity.
Figure 93 Global EV sales and PHEV battery progress
51%46%
43%
81%
49.%54%
57%
0
50
100
150
200
250
300
350
2010 2011 2012 2013 2014
Annu
al sal
es in
thousan
ds
PHEV sales BEV sales
0
100
200
300
400
500
0
200
400
600
800
2011 2012 2013 2022 target
Energ
y density
Batte
ry cost
Battery cost (USD/kWh) Energy density (Wh/L)
Notes: kWh = kilowatt hours; Wh/L = watt hours per litre. The cost results are based on prototype cells and modules and assuming 100 000 batteries are manufactured annually.
Sources: EVI/IEA (2015), Global EV Outlook 2015. Battery cost and energy density figures based on data from the US Department of Energy (DOE) and US Advanced Battery Consortium.
Current energy densities of batteries, even though they doubled in the past five years, remain below 200 Wh/L (Howell, 2014) and less than half the US DOE energy density target. Current battery costs have been estimated in the range of USD 300-350/kWh (Howell, 2014; Nykvist and Nilsson, 2015), which remains more than twice the US DOE 2022 target of USD 125/kWh (US DOE, 2015). Battery costs fell by 70% between 2008 and 2013 (Howell, 2014), a rate corresponding to roughly 20% per year. Battery cost reductions have occurred quicker than was initially expected by researchers and analysts (Nykvist and Nilsson, 2015), providing positive signs for future market development. Ambitious manufacturing plans have emerged from vehicle-maker Tesla that aim to double the global current production of lithium ion batteries. If realised this could result in significant battery cost reductions.

RENEWABLE TRANSPORT
238 MEDIUM-TERM RENEWABLE ENERGY MARKET REPORT 2015
Box 14 An update on market, technology and policy developments for electric vehicles (continued)
System integration
The parallel development of EV technologies and the use of low-carbon power supply options, including renewables, has the capacity to bring multiple societal and environmental benefits, such as local air pollution reduction, global CO2 emissions reduction, lower noise and increased energy security. As the uptake of EVs becomes significant, for example a tenfold increase on today’s stock, the interaction between EVs and the grid could also produce synergistic benefits.
The electricity storage capabilities of EVs in particular could assist countries where the electricity supply portfolio consists of higher levels of variable renewable energy sources. EVs can have the capacity to lower the cost of integrating solar and wind power into the grid, for example where EV owners are incentivised or directed to charge their cars during periods of high solar and wind generation.
Vehicle-to-building configurations, where an EV draws from the building’s power supply during off-peak hours (when electricity is cheaper) and supplies electricity from its battery during peak hours, build on similar concepts and could provide additional flexibility to the grid. Neither of these options is strictly necessary for EV deployment, but they do increase the potential applications and carry the benefits of enhancing power system flexibility.
Policy aspects A number of countries adopted both market pull instruments (e.g. differentiated taxation and exemptions from several fees) and technology push measures (e.g. direct RD&D support and funding to reduce battery costs, and financial instruments aiming to reduce risks) to make EVs more attractive to customers and increase cost-competitiveness with comparable non-electric alternatives.
To provide a further incentive to stimulate the use of electricity from renewable sources in the EU transport sector, a recent change to the Fuel Quality and Renewable Energy Directives increased the multiplication factors for the share of renewable electricity in transport that shall be used for the evaluation of the EU 2020 renewable energy consumption in transport target (from 1 to 2.5 for electrified rail transport, and from 2.5 to 5 for electric road vehicles).
Continued policy support is important to build on initial developments, specifically to ensure further EV cost savings arising from technological developments. However, EV policy support would need to consider effects on overall car travel, congestion, impacts on the quality of public transport services, and the potential impact of a reduction in national revenue raised from fossil fuel taxation. Relevant considerations include an adaptation of tax rates on fossil fuels used in road transport or a switch to road usage charging, which takes into account wider social and environmental costs of transport (e.g. road damage, congestion and fossil fuel dependence).
Policy instruments should be conceived in a way that allows their progressive phase-out once the consumer cost differential between EVs and ICE alternatives moves towards zero. Finally, in order to maximise benefits in terms of GHG emissions reduction, EV and EVSE policy support needs to be developed in parallel with low-carbon technologies (including renewable energy) in the power generation sector.
References Bahar, H., J. Egeland and R. Steenblik (2013), “Domestic incentive measures for renewable energy with possible trade implications”, OECD Trade and Environment Working Papers, No. 2013/01, OECD Publishing, Paris.

RENEWABLE TRANSPORT
MEDIUM-TERM RENEWABLE ENERGY MARKET REPORT 2015 239
Begins (2015), “EV battery leasing business in Jeju”, presentation at Towards a Global EV Market workshop, Goyang, Korea, 4 May 2015, www.iea.org/workshop/towards-a-global-ev-market.html. Bloomberg (2015), Bloomberg Terminal (subscription service), www.bloomberg.com/professional/hardware/. CEM (Clean Energy Ministerial) (2015), Electric Vehicles Initiative (EVI), CEM, Washington DC, www.cleanenergyministerial.org/Our-Work/Initiatives/Electric-Vehicles. Davis, R., Tao, L., Tan, E.C.D., Biddy, M.J., Beckham, G.T., Scarlata, C., Jacobson, J., Cafferty, K., Ross. J., Lukas, J., Knorr, D., Schoen, P. (2013), Process Design and Economics for the Conversion of Lignocellulosic Biomass to Hydrocarbons: Dilute-Acid and Enzymatic Deconstruction of Biomass to Sugars and Biological Conversion of Sugars to Hydrocarbons, National Renewable Energy Laboratory (NREL), Golden, Colorado. E4tech (2015), EU 2030 Road Transport Decarbonisation Scenario Analysis, E4tech, London, www.e4tech.com/PDF/Report_EU_Road_Transport_Decarbonisation_Final.pdf. Epure (2015), European Renewable Ethanol – Key Figures 2014, Epure, Brussels. European Commission (2015), Eurostat (database), http://ec.europa.eu/eurostat/fr (accessed 31 July 2015). EVI (Electric Vehicles Initiative)/IEA (International Energy Agency) (2015), Global EV Outlook 2015, OECD/IEA, Paris, www.iea.org/evi/Global-EV-Outlook-2015-Update_1page.pdf. F.O. Licht (2014), “Brazil – Debt load exceeds annual revenue of sugar mills”, 5 November, F.O. Licht, London, www.agra-net.net/agra/world-ethanol-and-biofuels-report/analysis/company/brazil---debt-load-exceeds-annual-revenue-of-sugar-mills--1.htm. F.O. Licht (2015a), F.O. Lichts Interactive Data (database), http://statistics.fo-licht.com/ (accessed July 2015), F.O. Licht, London F.O. Licht (2015b), “Zimbabwe – Government raises fuel ethanol mandate”, 7 July, F.O. Licht, London, www.agra-net.net/agra/world-ethanol-and-biofuels-report/biofuel-news/ethanol/zimbabwe---government-raises-fuel-ethanol-mandate--1.htm. F.O. Licht (2015c), “Ethiopia – Fuel ethanol supplies below target”, 23 January, F.O. Licht, London, www.agra-net.net/agra/world-ethanol-and-biofuels-report/biofuel-news/ethanol/ethiopia---fuel-ethanol-supplies-below-target--1.htm. Holtsmark, B. and A. Skonhoft (2014), The Norwegian Support and Subsidy Policy of Electric Cars. Should It Be Adopted by Other Countries? Environmental Science & Policy, Vol 42, Elsevier, www.svt.ntnu.no/iso/anders.skonhoft/Environmental%20Science%20and%20Policy%20814.pdf.
RENEWABLE TRANSPORT
240 MEDIUM-TERM RENEWABLE ENERGY MARKET REPORT 2015
Howell, D. (2014), Overview of the DOE Advanced Battery R&D Program, United States Department of Energy, Washington DC, http://energy.gov/sites/prod/files/2014/09/f18/battery_rd_amr_plenary_june_2014_final.pdf ICCT (International Council for Clean Transportation) (2014a), Driving Electrification: A Global Comparison of Fiscal Incentive Policy for EVs, ICCT, Washington DC, www.theicct.org/driving-electrification-global-comparison-fiscal-policy-electric-vehicles. IEA (International Energy Agency) (2015a), Energy Technology Perspectives 2015, OECD/IEA, Paris. IEA (2015b), World Energy Outlook Special Report: Energy and Climate Change, OECD/IEA, Paris. IEA (2015c), Monthly Oil Data Service (database), [OECD/IEA, Paris, (accessed August 2015). IEA (2014a), Energy Policies of IEA Countries European Union – 2014 Review, OECD/IEA, Paris. IEA (2014b), Energy Technology Perspectives 2014, OECD/IEA, Paris. IEA/UIC (International Railway Union), (2014), IEA/UIC Railway Handbook 2014, OECD/IEA, Paris. Lane, J. (2015a), “EPA slashes biofuels targets for 2014, 2015, 2016 under Renewable Fuel Standard”, Biofuels Digest, 29 May, www.biofuelsdigest.com/bdigest/2015/05/29/epa-slashes-biofuels-targets-for-2014-2015-2016-under-renewable-fuel-standard/. Lane, J. (2015b), “Cellulosic ethanol: Where are the gallons? Answers for your questions”, Biofuels Digest, 1 July, www.biofuelsdigest.com/bdigest/2015/07/01/cellulosic-ethanol-where-are-the-gallons-answers-for-your-questions/ Lopes Junqueira, T. (2015), Techno-economic assessment of the competitive potential of E2G in Brazil, Brazilian Bioethanol Science and Technology Laboratory – CTBE/CNPEM, Campinas. MAPA (Ministério da Agricultura, Pecuária e Abastecimento) (2015), Ministério da Agricultura – Agroenergia (database), www.agricultura.gov.br/portal/page/portal/Internet-MAPA/pagina-inicial/desenvolvimento-sustentavel/agroenergia, MAPA, Brasilia Munnix, S. (2015), “E-mobility in the Netherlands”, presentation at EVI meeting, Goyang, 4 May 2015 www.iea.org/media/workshops/2015/towardsaglobalevmarket/A.2Netherlands.pdf. Nykvist, B. and M. Nilsson (2015), “Rapidly falling costs of battery packs for electric vehicles”, Nature Climate Change, Vol. 5, Nature Publishing Group, pp. 329-332, www.nature.com/nclimate/journal/v5/n4/full/nclimate2564.html. Platts (2014), “Ending Brazil's gasoline price cap could up ethanol demand by 8 billion litres: Copersucar”, 18 July, Platts, London, www.platts.com/latest-news/agriculture/london/ending-brazils-gasoline-price-cap-could-up-ethanol-26836960.

RENEWABLE TRANSPORT
MEDIUM-TERM RENEWABLE ENERGY MARKET REPORT 2015 241
Platts (2015a), “US 'boho' stymies biodiesel market: trade”, 3 June, Platts, Houston, www.platts.com/latest-news/agriculture/houston/us-boho-stymies-biodiesel-market-trade-21550044. Platts (2015b), “Sao Paulo Ethanol Parity against Gasoline at Lowest in Almost 5 years: ANP”, www.platts.com/latest-news/agriculture/santos-brazil/sao-paulo-ethanol-parity-against-gasoline-at-21908317. Sapp, M. (2015), South Africa Revamps Biofuels Policy in Wake of Low Oil Prices, www.biofuelsdigest.com/ bdigest/2015/08/13/south-africa-revamps-biofuels-policy-in-wake-of-low-oil-prices/. South African Government (2015), “Energy”, www.gov.za/about-sa/energy#Energy resources. Thai Ministry of Energy (2015), “Thailand – Biofuel status and policies”, presentation at IRENA Expert Consultation on Best Practices in Bioenergy Data Collection and Estimation, Abu Dhabi, 28-30 April 2015, www.irena.org/DocumentDownloads/events/2015/Bioenergy%20Statistics%20Presentations/Enterprise%20surveys/Thailand_biofuel%20overview.pdf. TØI (Transportøkonomisk institutt) (2014), “Electric vehicles - environmental, economic and practical aspects - As seen by current and potential users”, TØI report, 1329/2014, www.toi.no/publications/electric-vehicles-environmental-economic-and-practical-aspects-as-seen-by-current-and-potential-users-article32644-29.html. Tozzi, M. (2015), “Electric mobility in urban public transport”, International Union of Public Transport Solutions (UITP) and Urban Electric Mobility Initiative (UEMI) workshop on electric mobility, Brussels, 27 February 2015 www.urban-mobility-solutions.eu/fileadmin/editor-content/Event_Presentations/UEMI_Feb_2015/Tozzi_UITP.pdf. Trolley:motion (2015), Cities with Active Trolleybus System (database), www.trolleymotion.eu/www/idex.php?L=3&id=36&land=all (accessed May 2015). USDA (United States Department of Agriculture) (2014), Biofuels Annual: Brazil, USDA, Washington, D.C. US DOE (United States Department of Energy) (2015), Vehicle Technologies Office: Batteries, US DOE, Washington, DC, http://energy.gov/eere/vehicles/vehicle-technologies-office-batteries. US EPA (United States Environmental Protection Agency) (2015), EPA Proposes Renewable Fuel Standards for 2014, 2015, and 2016, and the Biomass-Based Diesel Volume for 2017, US EPA, Washington DC, www.epa.gov/otaq/fuels/renewablefuels/documents/420f15028.pdf. US EIA (Energy Information Administration) (2011), Reduced Carbon Intensity of Corn Ethanol May Increase Its Consumption in California, US EIA, Washington, D.C. US EIA (2015), Petroleum and Other Liquids (database), www.eia.gov/petroleum/data.cfm#imports (accessed May 2015). Weinert, J.X. (2007), “The rise of electric two-wheelers in China: Factors for their success and implications for the future”, Research Report UCD-ITS-RR-07-27, Institute of Transportation Studies, University of California, Davis, www.its.ucdavis.edu/research/publications/publication-detail/?pub_id=1125.

RENEWABLE HEAT
242 MEDIUM-TERM RENEWABLE ENERGY MARKET REPORT 2015
RENEWABLE HEAT NB This year’s renewable heat analysis has been abbreviated compared with Medium-Term Renewable Energy Market Report 2014 (MTRMR 2014) pending the finalisation of ongoing changes to the underlying heat modelling approach and exercise. The baseline for MTRMR 2015 heat modelling is 2013 as this represents the latest year for which the relevant historical data is available from IEA statistics. Forecast figures for 2014-20 are as appeared in the MTRMR 2014.
Summary • World final energy use for heat (FEH) accounts for more than half of final energy consumption,
with three-quarters of this being met with fossil fuels. FEH therefore has a significant impact on energy security and is responsible for around one-third of global energy-related carbon dioxide (CO2) emissions. Driven by support policies, final energy supply from renewable sources for heat has risen globally. However, growth rates are generally lagging behind those for renewable electricity.
Figure 94 World final renewable energy use for heat (including commercial heat) 2008-20
0%
5%
10%
15%
20%
25%
30%
0
10
20
30
40
50
60
2008 2009 2010 2011 2012 2013 2014 2015 2016 2017 2018 2019 2020
% re
newa
ble h
eat
EJ
Geothermal Solar thermal Bioenergy (modern)
Bioenergy (traditional) % RES-H of total heat(right axis)
% Modern RES-H of total heat(right axis)
Notes: EJ = exajoules; RE-H = renewable heat. Traditional biomass is estimated here – in line with the methodology used in the International Energy Agency (IEA) World Energy Outlook (WEO) – as the use of solid biomass in the residential sector of non-member countries of the Organisation for Economic Co-Operation and Development (OECD), excluding countries in non-OECD Europe and Eurasia.
Source: Historical data derived from IEA (2015), “World energy statistics”, IEA World Energy Statistics and Balances (database). • World renewable energy use for heat rose approximately 1.8% per year between 2008 and
2013. However, most of this was traditional biomass use1 in buildings in non-OECD countries. The use of renewable energy technologies such as modern bioenergy, solar thermal and geothermal provided an estimated 14.8 Exajoules (EJ) in 2013.
• Over the medium term, global renewable energy use for heat is forecasted to grow from just
under 46 EJ in 2013 to around 49 EJ in 2020 (approximately 1% per year). Use of modern renewable energy technologies for heat continues to grow from just under 15 EJ in 2013 to almost 18 EJ in 2020 (around 3.5% per year). Traditional biomass use is anticipated to account for almost 32 EJ in 2020 due to a forecasted decline in many non-OECD countries.
1 Traditional biomass use refers to the use of fuelwood, animal dung and agricultural residues in simple stoves with very low combustion efficiencies. No observed statistics are available, and IEA estimates may vary from those of other international organisations. Traditional biomass use has been estimated in the modelling for this chapter in line with the methodology used in the IEA WEO, as the use of solid biomass in the residential sector of OECD non-members, excluding countries in non-OECD Europe and Eurasia.
RENEWABLE HEAT
MEDIUM-TERM RENEWABLE ENERGY MARKET REPORT 2015 243
Renewable energy use for heat: Market trends and forecast Market status and forecast There is a range of renewable energy sources that can contribute to provide heat. The key means of achieving this are the direct use of renewable energy sources for heat in buildings or industry, the provision of renewable energy into district heating networks supplying buildings or industry, and the use of renewable energy to generate electricity that can then be turned into heat either directly or by operating a heat pump.2 Heat is usually provided as hot water at varying temperatures or, in the case of some industrial end uses, steam at different temperatures and pressures. World renewable energy use for heat grew from just over 42 EJ in 2008 to around 46 EJ in 2013 (+1.8% per year), and accounted for just over a quarter of world total FEH. The growth was driven primarily by an increase in modern bioenergy and to a smaller extent by growing use of traditional biomass, as well as contributions from solar thermal and geothermal energy use for heat. Modern renewable energy use for heat, i.e. excluding traditional biomass use, stood at an estimated 14.8 EJ in 2013, up 12.48 EJ from 2008 (+3.2% per year). Bioenergy provided around 91% of the total with smaller but fast-growing contributions from solar thermal, and to a lesser extent geothermal. Over the medium term, global renewable energy use for heat is expected to grow by about 1% annually through 2020. While traditional biomass use is expected to decline in most non-OECD countries as a result of urbanisation and enhanced access to modern energy sources, modern renewable energy use for heat is forecasted to grow in excess of 3% per year from 14.8 EJ in 2013 to 17.7 EJ in 2020. Driven by support policies in around 50 countries around the world, modern renewable energy use for heat in the buildings sector reached 6.3 EJ by 2013. Modern renewable heat in the industry sector reached 8 EJ in 2013. However, it is anticipated that the continued absence of policy drivers and the cost-competitiveness of renewable heating technologies in a low oil price environment will present challenges to growth in this sector. OECD market status and forecast
In the OECD, total renewable energy use for heat grew at almost 1% per year, from 6 EJ in 2008 to 6.9 EJ in 2013, with bioenergy accounting for more than 90% of the 2013 total. Regional shares of renewable energy in total FEH reached 15% in OECD Europe, 13% in OECD Americas and 5% in OECD Asia Oceania in 2013, lower than observed for non-OECD regions. Growth from 2008-13 was strongest in OECD Europe with annual increases of almost 5%, where the European Union (EU) renewable energy target for 2020 was a key driver for enhanced use of renewable energy for heat. OECD Asia Oceania also saw an increase in the use of renewable energy for heat of over 3%. Growth in OECD Americas was lower at 0.6% linked to reduced industrial output related to the global economic downturn. In the OECD, the buildings sector accounts for more than half of total renewable energy use for heat in the region. Biomass is the main source of energy for heat (3.4 EJ in 2013), whereas solar thermal energy and geothermal energy make only a relatively small, but growing, contribution to overall renewable energy use today. OECD Europe is the largest consumer (2.4 EJ in 2013), with almost
2 With the exception of the energy (normally electricity) input to the heat pump unit heat produced is from solar energy stored in the air or ground. The ratio of heat output to electricity input is termed the co-efficient of performance (COP). For further information, please refer to Box 15.

RENEWABLE HEAT
244 MEDIUM-TERM RENEWABLE ENERGY MARKET REPORT 2015
18% of total energy demand for heat in buildings being met with renewable energy. Second is OECD Americas (1.2 EJ), followed by OECD Asia Oceania (0.2 EJ). Renewable energy use for heat shows steady growth in OECD Europe (+6 % per year). Over the medium term, OECD renewable energy use in buildings is expected to grow just under 2% per year on average, from 3.75 EJ in 2013 to 4 EJ in 2020. Growth in the OECD is driven by OECD Europe, where EU member state policies in particular drive an increase in renewable energy use for heat in buildings. OECD Americas’ renewable energy use increases more moderately due to the lack of a comprehensive policy framework for renewable heat in the region and availability of economical fossil fuels, in particular natural gas in both the United States and Canada. Lower heating oil prices as a result of the global reduction in crude oil prices observed from mid-2014 may also act as an inhibitor to the uptake of renewable heat. Renewable energy use in buildings is expected in OECD Asia Oceania, driven by an increase in geothermal energy use for heat in Korea. The absolute increase is small, however, when compared with other regions. Consumption of renewable energy for heat in the industry sector of the OECD stood at 3 EJ in 2013, which represents a 0.25 EJ increase from 2007. Renewable energy contributed 13% to total industrial energy use for heat in the OECD in 2013, with greater than 95% of this generated from biomass. Renewable energy use for heat in industry grew in both OECD Asia Oceania and OECD Europe. At the same time, renewable energy use for heat slightly declined in the OECD Americas (0.3 EJ), due to a reduction in overall industrial FEH, and more specifically pulp and paper production, which represents the main sub-sector for bioenergy use for heat. Over the medium term, industrial use of renewables for heat, namely in the form of bioenergy, is forecasted to increase by 0.4 EJ over 2013-20 at around 1.7% per year. Non-OECD market status and forecast
In non-OECD countries, renewable energy use for heat grew at 1.6% per year on average over 2008-13 and accounted for one-third of total FEH in 2013. Considerably higher shares of renewable energy in total FEH exist in regions with a large use of traditional biomass for heat (predominantly for cooking), such as Africa (almost 80%) and non-OECD Asia (50%). The use of modern renewable energy sources for heat, such as biogas and liquid biofuels, as well as solar thermal and geothermal energy, grew at around 3.6% per year over 2008-13, and contributed around 20% of total renewable energy use for heat in 2013. Growth was particularly strong for solar thermal energy use for heat, which grew 27% per year over 2008-13, driven primarily by rapid deployment of solar water heaters in the People’s Republic of China (hereafter “China”). Due to the considerable role of traditional biomass (estimated at around 32 EJ in 2013), the share of renewable energy in total FEH in the non-OECD buildings sector stood at 65% in 2013. The buildings sector therefore accounts for the majority of renewable energy use for heat in the non-OECD region. Modern renewable energy use for heat grew from 1.7 EJ in 2008 to an estimated 2.5 EJ in 2013. A rapid increase in solar thermal energy use for heat is observed in China and, from a lower basis, also in India and Brazil with annual growth rates in all countries three over 20%. Over the medium term, there are two divergent trends in many non-OECD regions. First, the use of traditional biomass for cooking is forecasted to decline in a number of regions, due to economic development and continued urbanisation that allow for access of more efficient fuels. At the same time, the use of modern renewable energy is set to increase as a result of the same dynamics, as well
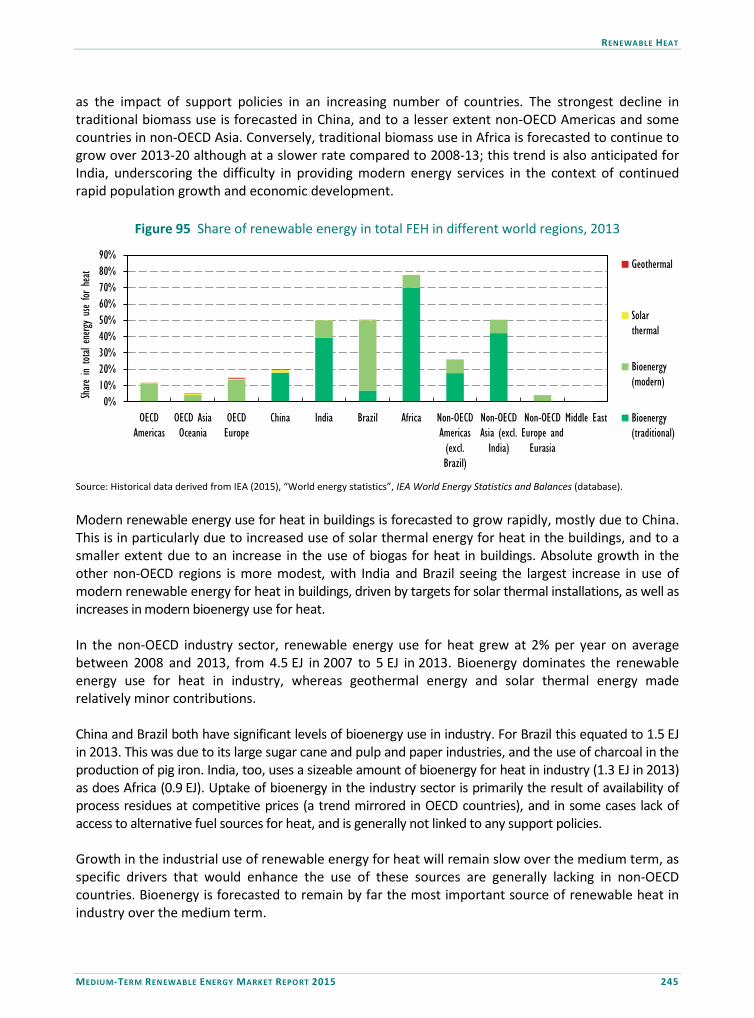
RENEWABLE HEAT
MEDIUM-TERM RENEWABLE ENERGY MARKET REPORT 2015 245
as the impact of support policies in an increasing number of countries. The strongest decline in traditional biomass use is forecasted in China, and to a lesser extent non-OECD Americas and some countries in non-OECD Asia. Conversely, traditional biomass use in Africa is forecasted to continue to grow over 2013-20 although at a slower rate compared to 2008-13; this trend is also anticipated for India, underscoring the difficulty in providing modern energy services in the context of continued rapid population growth and economic development.
Figure 95 Share of renewable energy in total FEH in different world regions, 2013
0%10%20%30%40%50%60%70%80%90%
OECDAmericas
OECD AsiaOceania
OECDEurope
China India Brazil Africa Non-OECDAmericas(excl.Brazil)
Non-OECDAsia (excl.India)
Non-OECDEurope andEurasia
Middle East
Share
in to
tal energy
use
for h
eat Geothermal
Solarthermal
Bioenergy(modern)
Bioenergy(traditional)
Source: Historical data derived from IEA (2015), “World energy statistics”, IEA World Energy Statistics and Balances (database). Modern renewable energy use for heat in buildings is forecasted to grow rapidly, mostly due to China. This is in particularly due to increased use of solar thermal energy for heat in the buildings, and to a smaller extent due to an increase in the use of biogas for heat in buildings. Absolute growth in the other non-OECD regions is more modest, with India and Brazil seeing the largest increase in use of modern renewable energy for heat in buildings, driven by targets for solar thermal installations, as well as increases in modern bioenergy use for heat. In the non-OECD industry sector, renewable energy use for heat grew at 2% per year on average between 2008 and 2013, from 4.5 EJ in 2007 to 5 EJ in 2013. Bioenergy dominates the renewable energy use for heat in industry, whereas geothermal energy and solar thermal energy made relatively minor contributions. China and Brazil both have significant levels of bioenergy use in industry. For Brazil this equated to 1.5 EJ in 2013. This was due to its large sugar cane and pulp and paper industries, and the use of charcoal in the production of pig iron. India, too, uses a sizeable amount of bioenergy for heat in industry (1.3 EJ in 2013) as does Africa (0.9 EJ). Uptake of bioenergy in the industry sector is primarily the result of availability of process residues at competitive prices (a trend mirrored in OECD countries), and in some cases lack of access to alternative fuel sources for heat, and is generally not linked to any support policies. Growth in the industrial use of renewable energy for heat will remain slow over the medium term, as specific drivers that would enhance the use of these sources are generally lacking in non-OECD countries. Bioenergy is forecasted to remain by far the most important source of renewable heat in industry over the medium term.

RENEWABLE HEAT
246 MEDIUM-TERM RENEWABLE ENERGY MARKET REPORT 2015
Policy environment for renewable heat In contrast to the renewable electricity sector, renewable heat has received significantly less attention from policy makers in the past. Around 50 countries worldwide have adopted polices for the promotion of renewable heat, with EU member states prominently represented, with a lower number still establishing specific renewable heat targets. This is compared to in excess of 100 countries that have enacted policy frameworks to promote the use of renewable electricity. The heating sector offers particular challenges for policy makers. Heat is much less amenable to regulation than electricity, as most electricity is distributed via regulated grids with centralised production, transmission and distribution, and in many cases a public ownership history. Heat, on the other hand, cannot be transported over large distances due to the costs of distribution pipework and losses incurred, making this uneconomical. The heat sector is thus much less integrated and comprises numerous separate installations of varying capacities producing hot water and steam at different temperatures and pressures. The heat sector is served by competing fuels and meets demand across industry, commerce, the public sector and private households. Reliable data on heat production, its utilisation patterns and the production costs are more difficult to obtain than those for electricity. Heat metering is less commonplace and more costly than alternatives for electricity. This makes the development of renewable heat policies, as well as the assessment of their effectiveness, much more difficult. A further complication for policy makers is the interaction between policies in the buildings sector designed to promote and encourage renewable heat production, and energy efficiency programmes with the purpose of reducing overall energy use and its associated carbon footprint. The strongest policy drivers today have been adopted in OECD Europe as a result of the EU’s mandatory 2020 targets for renewable energy. A number of countries within the EU have adopted ambitious targets for renewable heating or cooling within their National Renewable Energy Action Plans (NREAPs), and have put different support measures in place to reach these targets. In other OECD countries, such as the United States, renewable heat support measures have been adopted, but without setting specific targets. Looking forward, the detail in regard to the role of heat within the longer-term EU framework for climate and energy agreed by EU countries remains to be seen. The agreed framework includes an overall target for the EU of a 27% share of renewables in final energy consumption and a 40% reduction in greenhouse gas (GHG) emissions (from 1990 levels) (European Commission, 2015a). While, there is no specific sub-target relating to renewable heating or cooling, meeting these targets will likely require higher market penetration of renewables in this end-use sector. For example, the scenarios within the European Commission’s impact assessment for the 2030 framework with GHG reduction in the region of 40% include assumptions of 11-14% of households being connected to district heating systems by 2030 (European Commission, 2014). A clearer overview of the medium- and long-term proposals of the European Commission with regard to
RENEWABLE HEAT
MEDIUM-TERM RENEWABLE ENERGY MARKET REPORT 2015 247
heating and cooling should be provided when the proposed European Heating and Cooling Strategy is published later in 2015. The EU Energy Efficiency Directive (EED) came into force in June 2014. Article 14 of the EED should provide a stimulus to the uptake of co-generation3 and efficient district energy systems (DES) providing heating and cooling. The directive requires member states to identify the potential for the application of these through assessing the case for their use, identifying opportunities for uptake and then instigating adequate measures to ensure that identified potential is reached. This assessment must be provided to the European Commission by the end of 2015, providing information on the policy framework and associated measures to realise the identified potential over the medium term and beyond. In addition, under Article 14 it is mandatory to conduct an analysis on the viability of co-generation and district heat network connection for industrial installations with a capacity above 20 megawatts (MW) when they are built or substantially refurbished (European Commission, 2013). It can be anticipated that the requirement for a feasibility analysis under the EED will create the opportunity to assess the case for the use of renewables in co-generation, e.g. from bioenergy, for the provision of district heating and cooling. In additional, national implementation of the requirements of the EU’s Energy Performance in Buildings Directive can also act as a driver for the adoption of renewable heating and cooling technologies. Policies that support investment in DES also offer opportunities for the uptake of renewable energy for heating, cooling and process use. DES supply steam, hot water or chilled water from a central plant to multiple buildings and can facilitate efficient use of energy and cost-competitive solutions for end users e.g. households, industry, commercial buildings or a mix of the these. DES policies should recognise the high potential of their application in densely populated urban areas that provide constant loads. These in turn will allow for higher capacity factors for the technology providing the energy source and a stronger investment case, although this must be weighed against the potential for significant and capital-intensive retrofitting of plants and infrastructure. This is also applicable for district heating networks with a co-generation source due to the fact that such applications are generally “heat-led”, i.e. sized and operated in order to primarily meet heat demand. This is due to the fact that district heating pipework is a significant cost element of overall investment, and when not provided by the co-generation plant, electricity demand can be met from the local distribution network. DES projects offer the potential for integrating renewable energy technologies within the heating and cooling sectors. While DES can also utilise conventional fuels, where supporting policies provide a platform for the assessment of technology options for energy provision to a project this provides an opportunity for the consideration of renewable alternatives for suitability and, when they fit the required criteria, their selection. This is especially relevant where public-sector bodies are undertaking the investment, and financial criteria are not the only procurement considerations. DES also facilitate the use of renewable technologies as economies of scale associated with initial investment cost can be realised. From a technical perspective the larger thermal storage of DES, 3 Co-generation refers to the combined production of heat and power

RENEWABLE HEAT
248 MEDIUM-TERM RENEWABLE ENERGY MARKET REPORT 2015
compared with individual building-scale systems, is also well suited to the integration of renewable energy technologies. The United Nations Environment Programme (UNEP) has launched a Global District Energy in Cities Initiative, with a focus on cities in developing countries and emerging economies. The purpose of the initiative is to enable improved energy efficiency within the heating and cooling sectors and higher levels of renewable energy integration in participating cities through the development, retrofitting or increase in scale of DES projects. It aims to achieve this through the provision of support, guidance and tools to local and national governments covering DES policy, methodologies and support measures. The initiative will also provide access to training, technical support and information, and utilise the concept of twinning cities that have successful DES policies in place with those still in the development phase to aid the transfer of knowledge and best practice. Twenty-five cities have agreed to participate so far including Paris, Seoul and Warsaw. In addition, a variety of partners from international organisations (including the IEA), industry associations, financial institutions, city networks and the private sector will provide support. The initiative's activities will also include demonstration projects in select pilot cities worldwide, such as in India and China, to highlight the initiative's approach to developing DES and its associated benefits (UNEP, 2015). Policy environment for renewable heat at a national level A number of OECD Europe countries have introduced specific investment support schemes for different renewable heating technologies, including Austria, Germany, Italy and Sweden. Furthermore, the Netherlands, the United Kingdom and Italy have introduced support schemes that are promoting the adoption of higher levels of renewable heating installations. The Netherlands’ feed-in premium scheme, SDE+, includes subsidies for solid or liquid biomass-fuelled boilers at different capacity scales, geothermal heat and co-generation projects across different depth categories, and solar thermal installations with an aperture surface area ≥100 square meters (m²). With regard to renewable heating in the industry sector, a new category has been added to the SDE+ in 2015 for wood pellet-fuelled boilers ≥10 MW producing steam for industrial applications (Netherlands Enterprise Agency, 2015). In addition, in the Netherlands investment in certain renewable heating and cooling technologies is eligible for low interest rate loans and tax credits. In the United Kingdom, two RHI schemes are in place. One is for commercial and industrial applicants (termed non-domestic RHI), launched in 2011, which offers support over a 20-year timescale. The other is a domestic RHI launched in April 2014, providing support for seven years. These RHI schemes are a measure used to deliver key goals within the framework of an overarching UK heat strategy, launched in 2013; this focuses on the following key areas: efficient low-carbon heat in industry, heat networks, heating and cooling for buildings, and grids and infrastructure (European Association for the Promotion of Cogeneration, 2015). As of September 2014 the non-domestic scheme had accredited over 6 000 renewable heat installations and over 1 gigawatt thermal (GWth) of renewable heat capacity, resulting in payments for over 1 500 gigawatt hours (GWh) of heat generated since its launch. Solid biomass systems accounted for 98.7% of the accredited capacity. Three biomethane producers that provide gas to
RENEWABLE HEAT
MEDIUM-TERM RENEWABLE ENERGY MARKET REPORT 2015 249
local distribution networks after upgrading were also registered by the scheme by this time. In 2014, additional technology categories were added including air source heat pumps (ASHPs), deep geothermal and solid biomass co-generation, and existing tariffs revised upwards (OFGEM, 2014a). Within six months 10 000 accreditations were achieved under the domestic RHI scheme.4 Of these, solar thermal systems accounted for just fewer than 26% while biomass systems contributed 22%. The remainder of the systems installed were ASHPs and ground source heat pumps (GSHPs). The most common fuel type replaced by these initial installations was heating oil, suggesting that many domestic applicants did not have access to the gas distribution network (OFGEM, 2014b). This uptake demonstrates that the RHI approach can be considered as one of the most innovative policy measures worldwide for renewable heat and offers scope for replication by other countries. In Italy, the recently adopted incentive scheme for renewable heat, Conto Termico, is also showing a strong update with almost 10 000 applications submitted by the end of 2014. Outside the OECD, policy initiatives remain concentrated in a few key countries. Renewable energy use for heat in China is increasing rapidly with ambitious targets in the 12th Five-Year Plan sustaining this growth. In 2014, China led global capacities for solar, geothermal and biogas-fuelled heating systems. A national target for solar thermal heat of installing 560 GWth by 2020 is in place, with installations supported by grant payments based on the technology type (split or compact systems) and level (1 or 2) of the China energy label scheme (Global Solar Thermal Energy Council, 2015a). Support ranges from USD 16 to USD 90 per installation. Incentives for the use of biomass residues in power and co-generation plants, alongside a rapidly expanding number of district heating networks, regional subsidies for pellet stoves and a biogas development programme, drive the development of bioenergy use for heat. India has set a target for 20 million m2 of solar thermal collectors by 2022 in its Jawaharlal Nehru National Solar Mission (JNNSM), and supports the development of household biogas systems with investment grants. In Thailand, renewable heat is supported under the Alternative Energy Development Plan, which includes sub-targets for solar thermal systems of approximately 1.2 TWh of heat and for bioenergy, composed of biomass, biogas and municipal solid waste, for heat of approximately 113 TWh for 2021 (Theerarattananoon, K., 2015). Thailand is also seeking to support the solar industry via the development of efficiency standards for solar water systems. However, the national feed-in premium scheme applies only to renewable power technologies. Tunisia continued to support installations of solar thermal systems in 2014 through the provision of low interest loans from the national electricity and gas utility STEG that allow participants to pay for the capital cost of a household installation through their energy bills. However, new installations in the year dropped to the lowest levels since 2006, as a result of reaching near market saturation in high-income households who have primarily taken advantage of the scheme and fixed subsidy levels in the context of high inflation rates and rising solar thermal system costs (Global Solar Thermal Energy Council, 2015b).
4 A proportion of these were legacy applications for systems installed prior to the scheme opening, which have a 12-month window to submit applications.

RENEWABLE HEAT
250 MEDIUM-TERM RENEWABLE ENERGY MARKET REPORT 2015
Table 41 OECD country main targets and support policies for renewable heating and cooling
OECD Regulatory support Economic support
Country NR
EAP
SWH
targ
ets
Build
ing
oblig
atio
ns
Feed
-in
tarif
f/pre
miu
m
Capi
tal
gran
ts a
nd
subs
idie
s
Soft
loan
s
Tax
ince
ntiv
e
Inst
alle
rs
certi
ficat
ion
Trai
ning
pr
ogra
mm
es
Exem
plar
y ro
le o
f pub
lic
build
ings
Australia ✓ ✔
Austria 32.6% ✔ ✔ ✔ ✔ ✔
Belgium 11.9% ✔ ✓ ✓ ✔ ✔ ✔ ✔
Canada ✓ ✓ ✔
Chile ✔
Czech Republic 14.1% ✔ ✔ ✔ ✔ ✔
Denmark 39.8% ✔ ✔ ✔ ✔ ✔
Estonia 38.4% ✔ ✔ ✔ ✔
Finland 47.0% ✔ ✔ ✔ ✔ ✔ ✔
France 33.0% ✔ ✔ ✔ ✔ ✔ ✔ ✔ ✔
Germany 15.5% ✔ ✔ ✔ ✔ ✔
Greece 19.7% ✔ ✔ ✔ ✔ ✔ ✔
Hungary 18.9% ✔ ✔ ✔ ✔ ✔
Ireland 12.0% ✔ ✔ ✔ ✔ ✔
Italy 17.1% ✔ ✔ ✔ ✔ ✔ ✔ ✔
Korea ✔
Mexico ✔ ✔
Netherlands 8.7% ✔ ✔ ✔ ✔ ✔
Poland 17.1% ✔ ✔ ✔ ✔
Portugal 30.6% ✔ ✔ ✔ ✔
Spain 18.9% ✔ ✔ ✔
Sweden 62.1% ✔ ✔ ✔ ✔
United Kingdom 12.0% ✔ ● ✔ ✔ ✔ ✔
United States ✓ ✓ ✓ ✓
Policy highlights • Germany: Baden-Württemberg increased its RES-H target for residential buildings from 10% to 15% by 2020. • Italy capped Conto Termico, limiting capital support to 65% of projects’ costs. • United Kingdom opened its RHI for domestic consumers. Tariffs are set for period of seven years, technology dependent and
payable on a quarterly basis. Certain tariffs under non-domestic RHI scheme were increased. • The United States state of Massachusetts expanded its RPS system so renewable heat can qualify for the credit as well.
Note: ✔ = national-level policy; ✓ = state/provincial-level policy, ● = recently updated, ► = to be phased out, ⓪ = recently introduced; ■ – under review. RES-H = final energy consumption for renewable energy sources for heat; SWH = solar water heating; RPS = renewable portfolio standard. For further information, refer to IEA/IRENA Policies and Measures Database for Renewable Energy.

RENEWABLE HEAT
MEDIUM-TERM RENEWABLE ENERGY MARKET REPORT 2015 251
Table 42 Non-OECD select country targets and support policies for renewable heating and cooling
Non-OECD Regulatory support Economic support
Country
NR
EAP
SWH
targ
ets
Bui
ldin
g ob
ligat
ions
Fe
ed-in
ta
riff/p
rem
ium
C
apita
l gra
nts
and
subs
idie
s
Soft
loan
s
Tax
ince
ntiv
e
Inst
alle
rs
cert
ifica
tion
Trai
ning
pr
ogra
mm
es
Exem
plar
y ro
le
of p
ublic
bu
ildin
gs
Albania ✔ ✔
Argentina ✔
Brazil 2.86 million 2011-14
Bulgaria 23.8% ✔ ✔ ✔ ✔ ✔ ✔
China 560 GWth by 2020 ✓ ✔
Croatia 19.6% ✔
Cyprus5 23.5% ✔ ✔
India 20 million m2 by 2022 ✓ ✔ ●
Kenya 60% of annual demand for
buildings ✔ ●
Latvia 53.4% ✔ ✔ ✔
Lithuania 39% ✔ ✔ ✔ ✔ ✔
Malta 6.2% ✔ ✔ ✔ ✔
Romania 22.1% ✔ ● ✔ ✔
South Africa ⓪
Uganda 30 000 m2 by 2017
Uruguay ✔ ✔ ✔
Policy highlights • Algeria launched the ALSOL programme providing grants for solar heating installations. • Chile adopted a grant programme to promote solar water heaters in households and social housing. • India extended tax waivers for imported components used for production of solar thermal systems. • Kenya revised its Value-Added Tax (VAT) Act, removing tax for certain solar batteries. • South Africa adopted 50% renewable hot water mandate for new and retrofitted buildings. • Romania reintroduced its grant programme Casa Verde for solar thermal and biomass systems.
Note: ✔ = national-level policy; ✓ = state/provincial-level policy, ● = recently updated, ► = to be phased out, ⓪ = recently introduced; ■ – under review. For further information, refer to IEA/IRENA Policies and Measures Database for Renewable Energy.
5 Footnote by Turkey. 1. The information in this document with reference to “Cyprus” relates to the southern part of the island. There is no single authority representing both Turkish and Greek Cypriot people on the island. Turkey recognises the Turkish Republic of Northern Cyprus (TRNC). Until a lasting and equitable solution is found within the context of the United Nations, Turkey shall preserve its position concerning the “Cyprus issue”. 2. Footnote by all the European Union Member States of the OECD and the European Union. The Republic of Cyprus is recognised by all members of the United Nations with the exception of Turkey. The information in this document relates to the area under the effective control of the Government of the Republic of Cyprus.

RENEWABLE HEAT
252 MEDIUM-TERM RENEWABLE ENERGY MARKET REPORT 2015
South Africa has established a long-term target of installing 4 million solar water heaters by 2030, driven by the need to cut peak-load electricity demand. In addition, in September 2014 new requirements within building regulations came into force that require at least 50% (by volume) of the annual average water heating demand to be met by a number of eligible renewable heating technologies such as solar thermal systems, heat pumps, geothermal and biomass (Global Solar Thermal Energy Council, 2015c). In Mexico, programmes in place to support solar thermal system installations include partial subsidies for properties within social housing, sub-national mandates and tax exemptions within Mexico City (IRENA, 2015). Mexico also introduced a solar thermal installer certification programme in 2014 to ensure high-quality installations within its solar thermal industry. Brazil has also adopted targets for solar water heaters, mainly targeting low-income households. In both OECD countries and non-OECD countries, there have been more limited efforts to enhance the use of renewable energy in the industry sector. A few countries had previously introduced policies that promote the use of renewable heat in industry, such as some of the Nordic countries through a CO2 tax. More recently, the European Union introduced an Emissions Trading Scheme (ETS) that includes CO2 emissions from co-generation plants and energy-intensive industry sectors such as iron and steel and cement production. However, due to a low carbon price of less than USD 10 per tonne, the ETS does not currently provide a strong enough incentive to promote the large-scale uptake of renewable heat in these sectors. The EU-ETS is set for reform in 2018, however, with changes due to be introduced to remove surplus credits that have damped carbon prices in the market and inhibited investment in switching to renewable heating and cooling. Some incentives for large-scale solar thermal installations, including in industry, have been introduced in countries such as Austria, Germany, Thailand and Tunisia, but solar thermal energy use in industry is at a relatively early stage. Although in Brazil, 17% of solar thermal system installations in 2014 were within the industry sector (Brazilian Association for Refrigeration, Air Conditioning, Ventilation and Heating, 2015). The potential for renewable electricity policies to lead to enhanced use of biomass process residues in co-generation plants that generate heat for the industry sector subsequently used on-site or sold via a district heating network should also be noted. Renewable heating technologies Solar thermal As in last year’s MTRMR, the analysis of solar thermal energy use for heat relies on official IEA statistics, where available, and sources data for some countries from the IEA Solar Heating and Cooling Implementing Agreement, which produces an annual report with detailed country-level data on installed solar thermal heat capacity (Mauthner, Weiss and Spork-Dur, 2015). Solar thermal heating installations have grown considerably in the last decade. In 2013, global installed solar thermal capacity reached over 360 GWth, including district heating and industry installations, with cumulative capacity expanding by 14% versus 2012. In 2014, based on several key markets (e.g. Austria, Brazil, China, Germany, India), it is estimated that capacity topped 390 GWth. China accounts for over 70% of cumulative capacity and drives over 80% of global annual growth. Installed solar thermal capacity there more than tripled between 2008 and 2014, driven by central
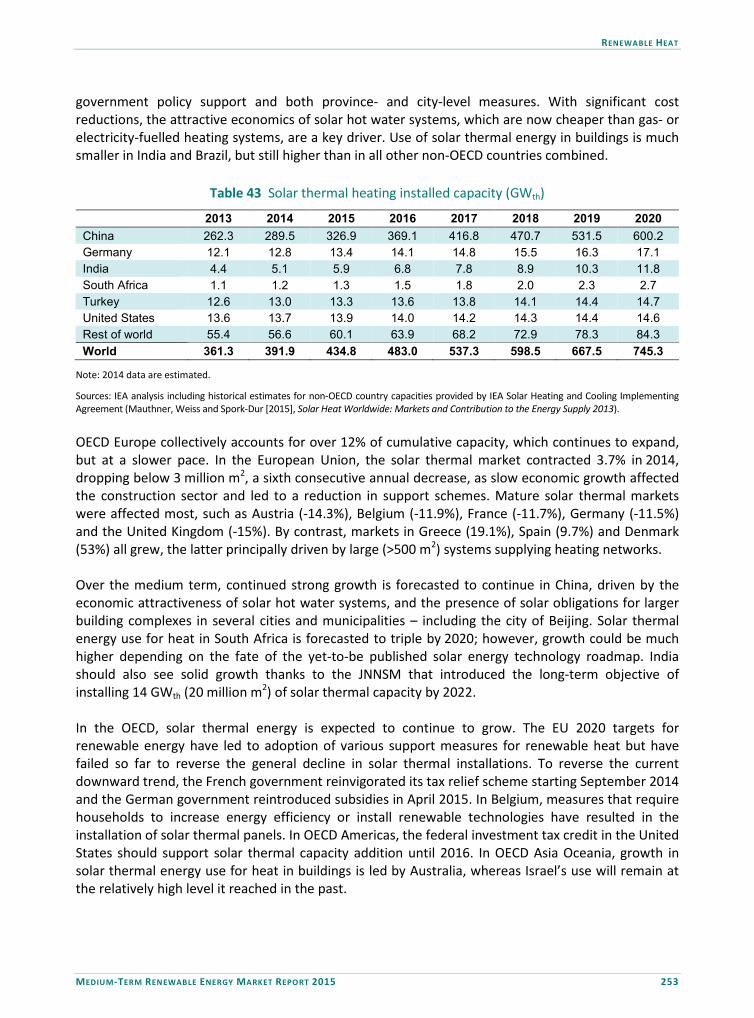
RENEWABLE HEAT
MEDIUM-TERM RENEWABLE ENERGY MARKET REPORT 2015 253
government policy support and both province- and city-level measures. With significant cost reductions, the attractive economics of solar hot water systems, which are now cheaper than gas- or electricity-fuelled heating systems, are a key driver. Use of solar thermal energy in buildings is much smaller in India and Brazil, but still higher than in all other non-OECD countries combined.
Table 43 Solar thermal heating installed capacity (GWth)
2013 2014 2015 2016 2017 2018 2019 2020 China 262.3 289.5 326.9 369.1 416.8 470.7 531.5 600.2 Germany 12.1 12.8 13.4 14.1 14.8 15.5 16.3 17.1 India 4.4 5.1 5.9 6.8 7.8 8.9 10.3 11.8 South Africa 1.1 1.2 1.3 1.5 1.8 2.0 2.3 2.7 Turkey 12.6 13.0 13.3 13.6 13.8 14.1 14.4 14.7 United States 13.6 13.7 13.9 14.0 14.2 14.3 14.4 14.6 Rest of world 55.4 56.6 60.1 63.9 68.2 72.9 78.3 84.3 World 361.3 391.9 434.8 483.0 537.3 598.5 667.5 745.3
Note: 2014 data are estimated.
Sources: IEA analysis including historical estimates for non-OECD country capacities provided by IEA Solar Heating and Cooling Implementing Agreement (Mauthner, Weiss and Spork-Dur [2015], Solar Heat Worldwide: Markets and Contribution to the Energy Supply 2013). OECD Europe collectively accounts for over 12% of cumulative capacity, which continues to expand, but at a slower pace. In the European Union, the solar thermal market contracted 3.7% in 2014, dropping below 3 million m2, a sixth consecutive annual decrease, as slow economic growth affected the construction sector and led to a reduction in support schemes. Mature solar thermal markets were affected most, such as Austria (-14.3%), Belgium (-11.9%), France (-11.7%), Germany (-11.5%) and the United Kingdom (-15%). By contrast, markets in Greece (19.1%), Spain (9.7%) and Denmark (53%) all grew, the latter principally driven by large (>500 m2) systems supplying heating networks. Over the medium term, continued strong growth is forecasted to continue in China, driven by the economic attractiveness of solar hot water systems, and the presence of solar obligations for larger building complexes in several cities and municipalities – including the city of Beijing. Solar thermal energy use for heat in South Africa is forecasted to triple by 2020; however, growth could be much higher depending on the fate of the yet-to-be published solar energy technology roadmap. India should also see solid growth thanks to the JNNSM that introduced the long-term objective of installing 14 GWth (20 million m2) of solar thermal capacity by 2022. In the OECD, solar thermal energy is expected to continue to grow. The EU 2020 targets for renewable energy have led to adoption of various support measures for renewable heat but have failed so far to reverse the general decline in solar thermal installations. To reverse the current downward trend, the French government reinvigorated its tax relief scheme starting September 2014 and the German government reintroduced subsidies in April 2015. In Belgium, measures that require households to increase energy efficiency or install renewable technologies have resulted in the installation of solar thermal panels. In OECD Americas, the federal investment tax credit in the United States should support solar thermal capacity addition until 2016. In OECD Asia Oceania, growth in solar thermal energy use for heat in buildings is led by Australia, whereas Israel’s use will remain at the relatively high level it reached in the past.
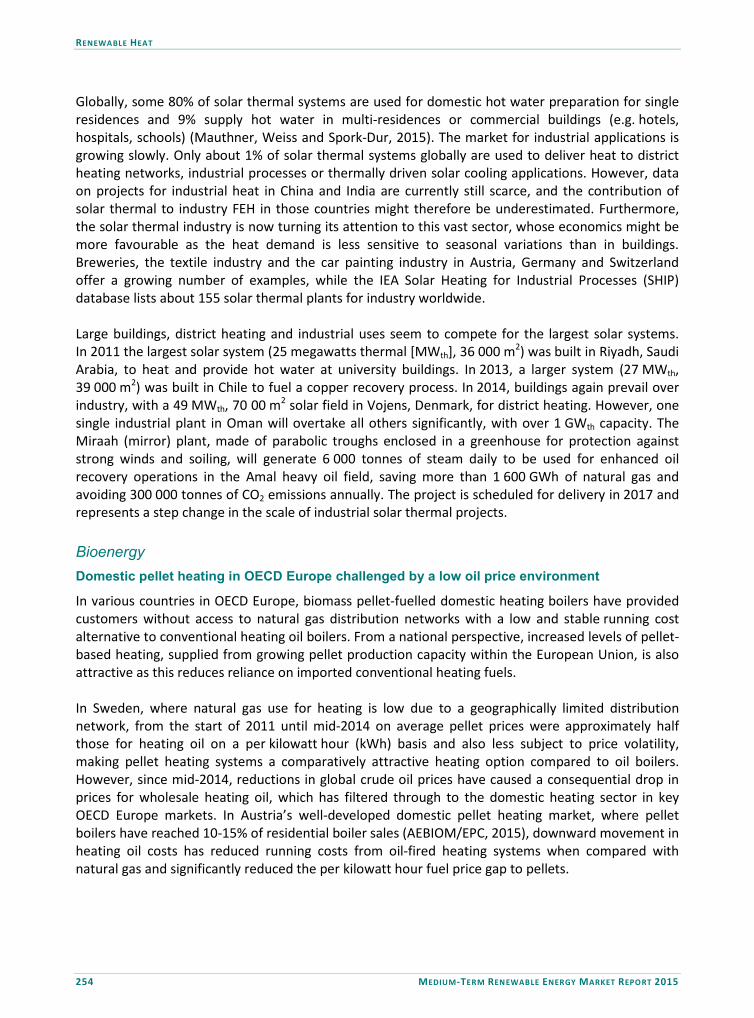
RENEWABLE HEAT
254 MEDIUM-TERM RENEWABLE ENERGY MARKET REPORT 2015
Globally, some 80% of solar thermal systems are used for domestic hot water preparation for single residences and 9% supply hot water in multi-residences or commercial buildings (e.g. hotels, hospitals, schools) (Mauthner, Weiss and Spork-Dur, 2015). The market for industrial applications is growing slowly. Only about 1% of solar thermal systems globally are used to deliver heat to district heating networks, industrial processes or thermally driven solar cooling applications. However, data on projects for industrial heat in China and India are currently still scarce, and the contribution of solar thermal to industry FEH in those countries might therefore be underestimated. Furthermore, the solar thermal industry is now turning its attention to this vast sector, whose economics might be more favourable as the heat demand is less sensitive to seasonal variations than in buildings. Breweries, the textile industry and the car painting industry in Austria, Germany and Switzerland offer a growing number of examples, while the IEA Solar Heating for Industrial Processes (SHIP) database lists about 155 solar thermal plants for industry worldwide. Large buildings, district heating and industrial uses seem to compete for the largest solar systems. In 2011 the largest solar system (25 megawatts thermal [MWth], 36 000 m2) was built in Riyadh, Saudi Arabia, to heat and provide hot water at university buildings. In 2013, a larger system (27 MWth, 39 000 m2) was built in Chile to fuel a copper recovery process. In 2014, buildings again prevail over industry, with a 49 MWth, 70 00 m2 solar field in Vojens, Denmark, for district heating. However, one single industrial plant in Oman will overtake all others significantly, with over 1 GWth capacity. The Miraah (mirror) plant, made of parabolic troughs enclosed in a greenhouse for protection against strong winds and soiling, will generate 6 000 tonnes of steam daily to be used for enhanced oil recovery operations in the Amal heavy oil field, saving more than 1 600 GWh of natural gas and avoiding 300 000 tonnes of CO2 emissions annually. The project is scheduled for delivery in 2017 and represents a step change in the scale of industrial solar thermal projects. Bioenergy Domestic pellet heating in OECD Europe challenged by a low oil price environment
In various countries in OECD Europe, biomass pellet-fuelled domestic heating boilers have provided customers without access to natural gas distribution networks with a low and stable running cost alternative to conventional heating oil boilers. From a national perspective, increased levels of pellet-based heating, supplied from growing pellet production capacity within the European Union, is also attractive as this reduces reliance on imported conventional heating fuels. In Sweden, where natural gas use for heating is low due to a geographically limited distribution network, from the start of 2011 until mid-2014 on average pellet prices were approximately half those for heating oil on a per kilowatt hour (kWh) basis and also less subject to price volatility, making pellet heating systems a comparatively attractive heating option compared to oil boilers. However, since mid-2014, reductions in global crude oil prices have caused a consequential drop in prices for wholesale heating oil, which has filtered through to the domestic heating sector in key OECD Europe markets. In Austria’s well-developed domestic pellet heating market, where pellet boilers have reached 10-15% of residential boiler sales (AEBIOM/EPC, 2015), downward movement in heating oil costs has reduced running costs from oil-fired heating systems when compared with natural gas and significantly reduced the per kilowatt hour fuel price gap to pellets.
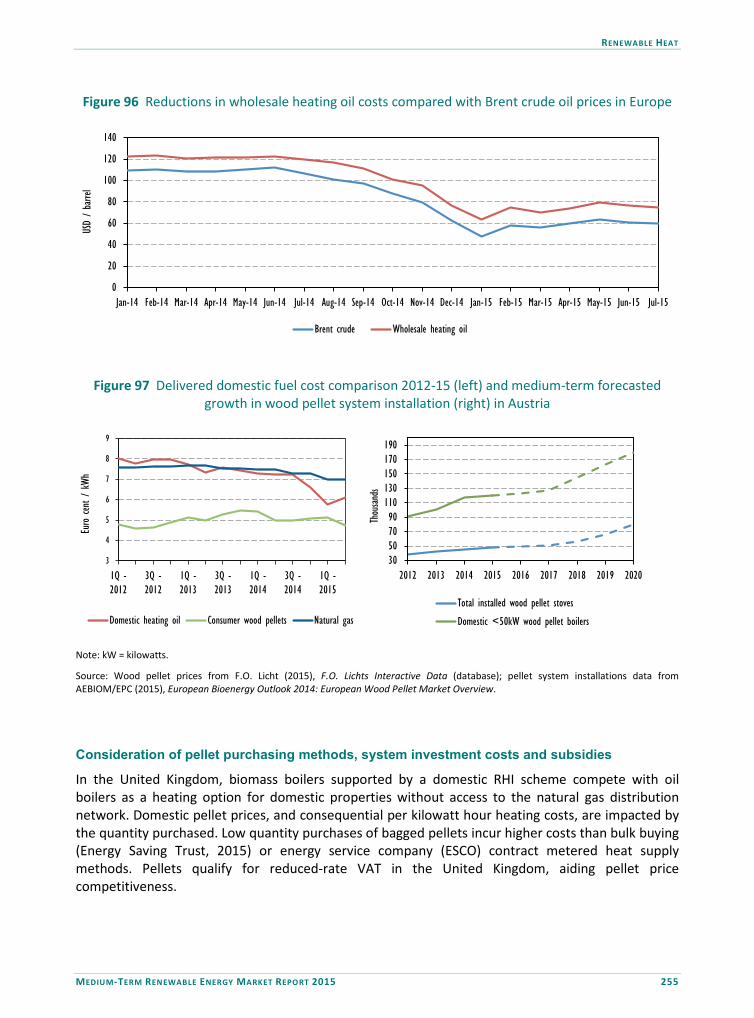
RENEWABLE HEAT
MEDIUM-TERM RENEWABLE ENERGY MARKET REPORT 2015 255
Figure 96 Reductions in wholesale heating oil costs compared with Brent crude oil prices in Europe
0
20
40
60
80
100
120
140
Jan-14 Feb-14 Mar-14 Apr-14 May-14 Jun-14 Jul-14 Aug-14 Sep-14 Oct-14 Nov-14 Dec-14 Jan-15 Feb-15 Mar-15 Apr-15 May-15 Jun-15 Jul-15
USD
/ ba
rrel
Brent crude Wholesale heating oil
Figure 97 Delivered domestic fuel cost comparison 2012-15 (left) and medium-term forecasted growth in wood pellet system installation (right) in Austria
3
4
5
6
7
8
9
1Q -2012
3Q -2012
1Q -2013
3Q -2013
1Q -2014
3Q -2014
1Q -2015
Euro
cent /
kWh
Domestic heating oil Consumer wood pellets Natural gas
30507090
110130150170190
2012 2013 2014 2015 2016 2017 2018 2019 2020
Thou
sands
Total installed wood pellet stoves
Domestic <50kW wood pellet boilers
Note: kW = kilowatts.
Source: Wood pellet prices from F.O. Licht (2015), F.O. Lichts Interactive Data (database); pellet system installations data from AEBIOM/EPC (2015), European Bioenergy Outlook 2014: European Wood Pellet Market Overview.
Consideration of pellet purchasing methods, system investment costs and subsidies
In the United Kingdom, biomass boilers supported by a domestic RHI scheme compete with oil boilers as a heating option for domestic properties without access to the natural gas distribution network. Domestic pellet prices, and consequential per kilowatt hour heating costs, are impacted by the quantity purchased. Low quantity purchases of bagged pellets incur higher costs than bulk buying (Energy Saving Trust, 2015) or energy service company (ESCO) contract metered heat supply methods. Pellets qualify for reduced-rate VAT in the United Kingdom, aiding pellet price competitiveness.
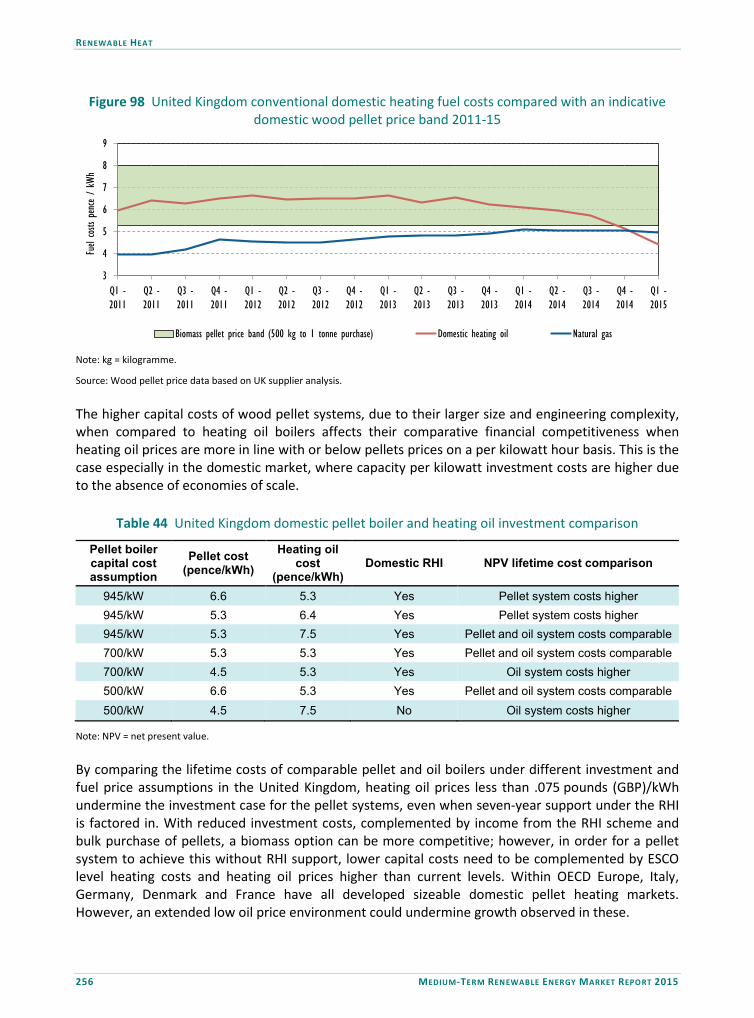
RENEWABLE HEAT
256 MEDIUM-TERM RENEWABLE ENERGY MARKET REPORT 2015
Figure 98 United Kingdom conventional domestic heating fuel costs compared with an indicative domestic wood pellet price band 2011-15
3
4
5
6
7
8
9
Q1 -2011
Q2 -2011
Q3 -2011
Q4 -2011
Q1 -2012
Q2 -2012
Q3 -2012
Q4 -2012
Q1 -2013
Q2 -2013
Q3 -2013
Q4 -2013
Q1 -2014
Q2 -2014
Q3 -2014
Q4 -2014
Q1 -2015
Fuel
costs
pence
/ kW
h
Biomass pellet price band (500 kg to 1 tonne purchase) Domestic heating oil Natural gas Note: kg = kilogramme.
Source: Wood pellet price data based on UK supplier analysis. The higher capital costs of wood pellet systems, due to their larger size and engineering complexity, when compared to heating oil boilers affects their comparative financial competitiveness when heating oil prices are more in line with or below pellets prices on a per kilowatt hour basis. This is the case especially in the domestic market, where capacity per kilowatt investment costs are higher due to the absence of economies of scale.
Table 44 United Kingdom domestic pellet boiler and heating oil investment comparison
Pellet boiler capital cost assumption
Pellet cost (pence/kWh)
Heating oil cost
(pence/kWh) Domestic RHI NPV lifetime cost comparison
945/kW 6.6 5.3 Yes Pellet system costs higher 945/kW 5.3 6.4 Yes Pellet system costs higher 945/kW 5.3 7.5 Yes Pellet and oil system costs comparable 700/kW 5.3 5.3 Yes Pellet and oil system costs comparable 700/kW 4.5 5.3 Yes Oil system costs higher 500/kW 6.6 5.3 Yes Pellet and oil system costs comparable 500/kW 4.5 7.5 No Oil system costs higher
Note: NPV = net present value. By comparing the lifetime costs of comparable pellet and oil boilers under different investment and fuel price assumptions in the United Kingdom, heating oil prices less than .075 pounds (GBP)/kWh undermine the investment case for the pellet systems, even when seven-year support under the RHI is factored in. With reduced investment costs, complemented by income from the RHI scheme and bulk purchase of pellets, a biomass option can be more competitive; however, in order for a pellet system to achieve this without RHI support, lower capital costs need to be complemented by ESCO level heating costs and heating oil prices higher than current levels. Within OECD Europe, Italy, Germany, Denmark and France have all developed sizeable domestic pellet heating markets. However, an extended low oil price environment could undermine growth observed in these.

RENEWABLE HEAT
MEDIUM-TERM RENEWABLE ENERGY MARKET REPORT 2015 257
Box 15 Heat pumps overview
Heat pump systems consist of an air, water or ground heat source, the heat pump unit, and a distribution system for the generated heat or cold. They allow the transfer of heat from a low-temperature system to a higher-temperature system by using an external source of energy (electricity or heat) as source of work. Heat pump systems are based on a cycle where the refrigerant is compressed on the side where the heat is needed, and heat is transferred via a heat exchanger. In the other half of the cycle, the refrigerant pressure is lowered and passes a second heat exchanger (called an evaporator), where it absorbs heat and thus cools the surrounding air or transfer liquid. Heat pump systems can be used for heating as well as cooling when a specific reverse system is installed that provides both heat and cold with the same heat pump (for more details, see IEA, 2014).
Heat pumps can provide efficient means of heating and cooling and are mainly used for space heating, cooling and domestic hot water supply in buildings, as well as in low-temperature heat and cooling applications in industry. Due to the external energy input needed for operating the heat pump, it is important to assess and account for only the actual share of renewable energy provided from the air, ground or water source.
In the European Union, heat generated by both ASHPs and GSHPs is considered renewable under the Renewable Energy Directive (Directive 2009/28/EC). According to the directive, electric heat pumps can be considered a renewable technology as long as they produce at least 15% more usable heat than the primary energy input required to drive them, which corresponds to a seasonal performance factor of 2.527 at an average efficiency of the electricity production of 45.5%. The energy considered renewable is the heat delivered, minus the electricity consumption of the pump.
Data availability and consistency on global market developments, installed capacity, and heat pumps’ contribution to FEH and cooling are limited. Since official IEA statistics do not include heat pumps unless the heat is sold as commercial heat, this report does not cover the dynamically growing heat pump market that could potentially cover low-temperature heat demand in buildings and industry in the future. In 2012, the estimated global installed heat pump capacity stood at 50 GWth with an annual output of around 0.3 EJ of heat. According to REN21 (2015), from 2011 until 2014, worldwide heat pump installations increased from around 1.5 million units to 2 million units, with the majority of growth in Asian markets.
Moving forward, the highest growth is expected to be driven by high demand in the Chinese market, with installations of air-source “monobloc”6 systems the most popular choice of system (BSRIA, 2015). Other countries with significant market penetration of heat pumps, in terms of installed capacities, are the United States, Sweden, Germany and the Netherlands. In Sweden around 9% of district heat was provided by heat pumps in 2012. New developments in heat pump markets include their use alongside variable renewables in integrated systems capable of storing heat generated from excess electricity during periods of low demand. A growing trend is present for such hybrid systems in China, and to a lesser extent Europe (REN21, 2015).
References AEBIOM (European Biomass Association)/EPC (European Pellet Council) (2015), European Bioenergy Outlook 2014: European Wood Pellet Market Overview, AEBIOM, Brussels. Brazilian Association for Refrigeration, Air Conditioning, Ventilation and Heating (2015), Relatório de Pesquisa Produção de Coletores Solares para Aquecimento de Água e Reservatórios Térmicos no
6 Monobloc systems contain refrigerant within a sealed system in an outdoor unit with water, as opposed to refrigerant, transferred to the unit.

RENEWABLE HEAT
258 MEDIUM-TERM RENEWABLE ENERGY MARKET REPORT 2015
Brasil [Production of Solar Thermal Collectors for Water Heating and Accumulators in Brazil], www.solarthermalworld.org/sites/gstec/files/news/file/2015-07-27/market_statistics_2014_brazil.pdf. BSRIA (Building Services Research and Information Association) (2015), “Growth in the world heat pump market”, www.bsria.co.uk/news/article/growth-in-the-world-heat-pump-market/. European Association for the Promotion of Cogeneration (2015), The UK's Heat Strategy: Lessons for the EU, www.cogeneurope.eu/the-uks-heat-strategy-lessons-for-the-eu_282315.html. EC (European Commission) (2015a), 2030 Energy Strategy, http://ec.europa.eu/energy/en/topics/energy-strategy/2030-energy-strategy. EC (2015b), Eurostat (database), http://ec.europa.eu/eurostat (accessed July 2015) European Commission, Brussels. EC (2014), Impact Assessment – Energy Efficiency and Its Contribution to Energy Security and the 2030 Framework for Climate and Energy Policy, European Commission, Brussels. EC (2013), Guidance Note on Directive 2012/27/EU on Energy Efficiency, Amending Directives 2009/125/EC and 2010/30/EC, and Repealing Directives 2004/8/EC and 2006/32/EC – Article 14: Promotion of Efficiency in Heating and Cooling, EC, Brussels. F.O. Licht (2015), F.O. Lichts Interactive Data (database), http://statistics.fo-licht.com/ (accessed July 2015), F.O. Licht, London. Energy Saving Trust (2015), Biomass, www.energysavingtrust.org.uk/domestic/biomass. Global Solar Thermal Energy Council (2015a), China: Subsidy Scheme for Energy-Efficient Products, www.solarthermalworld.org/content/china-subsidy-scheme-energy-efficient-products. Global Solar Thermal Energy Council (2015b), Tunisia: Ups and Downs of Prosol Subsidy Scheme, www.solarthermalworld.org/content/tunisia-ups-and-downs-prosol-subsidy-scheme. Global Solar Thermal Energy Council (2015c), National Building Regulation in South Africa, www.solarthermalworld.org/content/national-building-regulation-south-africa. IEA (International Energy Agency) (2014), Heating Without Global Warming: Market Developments and Policy Considerations for Renewable Heat, OECD/IEA, Paris. IEA (2015), “World energy statistics”, IEA World Energy Statistics and Balances (database), DOI: http://dx.doi.org/10.1787/data-00510-en, (accessed [August 2015]). IRENA (International Renewable Energy Agency) (2015), Renewable Energy in Latin America 2015: An Overview of Policies, IRENA, Abu Dhabi.

RENEWABLE HEAT
MEDIUM-TERM RENEWABLE ENERGY MARKET REPORT 2015 259
Mauthner, F., W. Weiss and M. Spork-Dur (2015), Solar Heat Worldwide 2015: Markets and Contribution to the Energy Supply 2013, www.iea-shc.org/solar-heat-worldwide. OFGEM (Office of Gas and Electricity Markets) (2014a), Renewable Heat Hits 1GW of Installed Capacity Accredited under the Non-Domestic RHI, www.ofgem.gov.uk/sites/default/files/docs/2014/12/rhi_1GW_milestone_0.pdf. OFGEM (2014b), The first 10,000 Domestic Renewable Heat Incentive Accreditations, www.ofgem.gov.uk/sites/default/files/docs/2014/10/drhi_1st_10000.pdf. REN21 (Renewable Energy Policy Network for the 21st Century) (2015), Renewables 2015: Global Status Report, REN21, Paris. Netherlands Enterprise Agency (2015), SDE+ 2015, Netherlands Enterprise Agency, Zwolle. Theerarattananoon, K. (2015), Renewable Energy Development in Thailand, presentation at the EEP Mekong stakeholder meeting, Bangkok, 3 July 2015, www.eepmekong.org/index.php/resources/reports-presentations/eep-mekong-stakeholders-meeting-documents/bangkok-thailand/143-renewable-energy-in-thailand/file. UNEP (United Nations Environment Programme) (2015), District Energy in Cities, http://unep.org/energy/des.
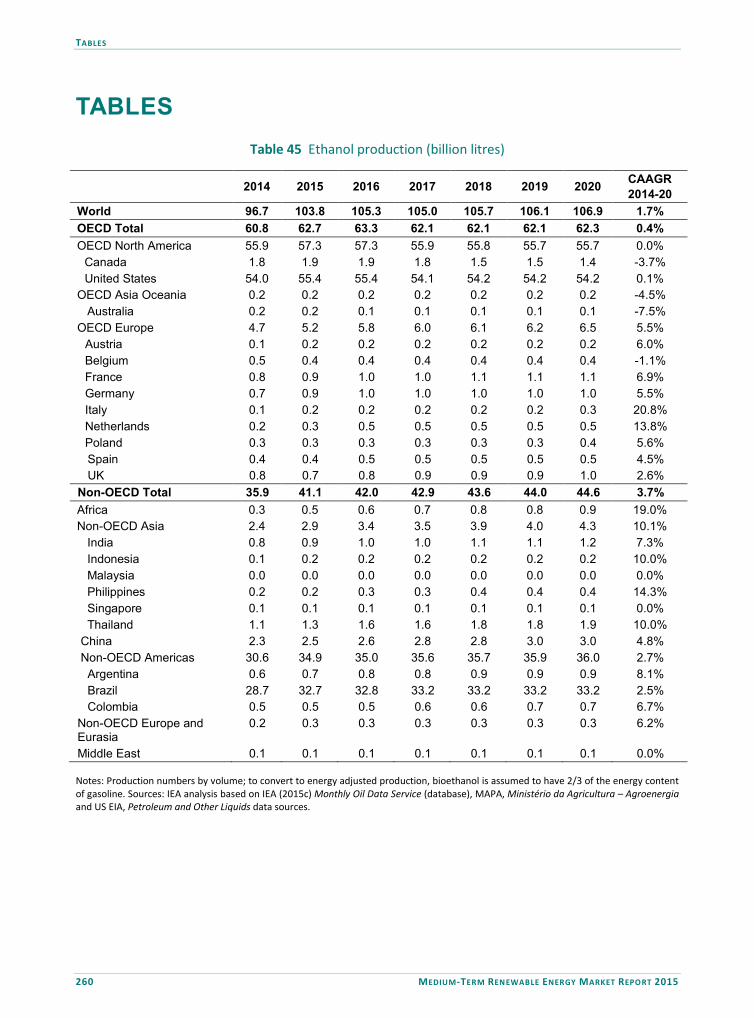
TABLES
260 MEDIUM-TERM RENEWABLE ENERGY MARKET REPORT 2015
TABLES Table 45 Ethanol production (billion litres)
Notes: Production numbers by volume; to convert to energy adjusted production, bioethanol is assumed to have 2/3 of the energy content of gasoline. Sources: IEA analysis based on IEA (2015c) Monthly Oil Data Service (database), MAPA, Ministério da Agricultura – Agroenergia and US EIA, Petroleum and Other Liquids data sources.
2014 2015 2016 2017 2018 2019 2020 CAAGR 2014-20
World 96.7 103.8 105.3 105.0 105.7 106.1 106.9 1.7% OECD Total 60.8 62.7 63.3 62.1 62.1 62.1 62.3 0.4% OECD North America 55.9 57.3 57.3 55.9 55.8 55.7 55.7 0.0%
Canada 1.8 1.9 1.9 1.8 1.5 1.5 1.4 -3.7% 54.0 55.4 55.4 54.1 54.2 54.2 54.2 0.1% United States
OECD Asia Oceania 0.2 0.2 0.2 0.2 0.2 0.2 0.2 -4.5% Australia 0.2 0.2 0.1 0.1 0.1 0.1 0.1 -7.5% OECD Europe 4.7 5.2 5.8 6.0 6.1 6.2 6.5 5.5%
0.1 0.2 0.2 0.2 0.2 0.2 0.2 6.0% 0.5 0.4 0.4 0.4 0.4 0.4 0.4 -1.1% 0.8 0.9 1.0 1.0 1.1 1.1 1.1 6.9% 0.7 0.9 1.0 1.0 1.0 1.0 1.0 5.5% 0.1 0.2 0.2 0.2 0.2 0.2 0.3 20.8% 0.2 0.3 0.5 0.5 0.5 0.5 0.5 13.8% 0.3 0.3 0.3 0.3 0.3 0.3 0.4 5.6% 0.4 0.4 0.5 0.5 0.5 0.5 0.5 4.5%
Austria Belgium France Germany Italy Netherlands Poland
Spain UK 0.8 0.7 0.8 0.9 0.9 0.9 1.0 2.6% Non-OECD Total 35.9 41.1 42.0 42.9 43.6 44.0 44.6 3.7%
0.3 0.5 0.6 0.7 0.8 0.8 0.9 19.0% Africa Non-OECD Asia 2.4 2.9 3.4 3.5 3.9 4.0 4.3 10.1%
0.8 0.9 1.0 1.0 1.1 1.1 1.2 7.3% 0.1 0.2 0.2 0.2 0.2 0.2 0.2 10.0% 0.0 0.0 0.0 0.0 0.0 0.0 0.0 0.0% 0.2 0.2 0.3 0.3 0.4 0.4 0.4 14.3% 0.1 0.1 0.1 0.1 0.1 0.1 0.1 0.0%
India Indonesia Malaysia Philippines Singapore Thailand 1.1 1.3 1.6 1.6 1.8 1.8 1.9 10.0% China 2.3 2.5 2.6 2.8 2.8 3.0 3.0 4.8% Non-OECD Americas 30.6 34.9 35.0 35.6 35.7 35.9 36.0 2.7%
0.6 0.7 0.8 0.8 0.9 0.9 0.9 8.1% 28.7 32.7 32.8 33.2 33.2 33.2 33.2 2.5%
Argentina Brazil Colombia 0.5 0.5 0.5 0.6 0.6 0.7 0.7 6.7%
0.2 0.3 0.3 0.3 0.3 0.3 0.3 6.2% Non-OECD Europe and Eurasia Middle East 0.1 0.1 0.1 0.1 0.1 0.1 0.1 0.0%
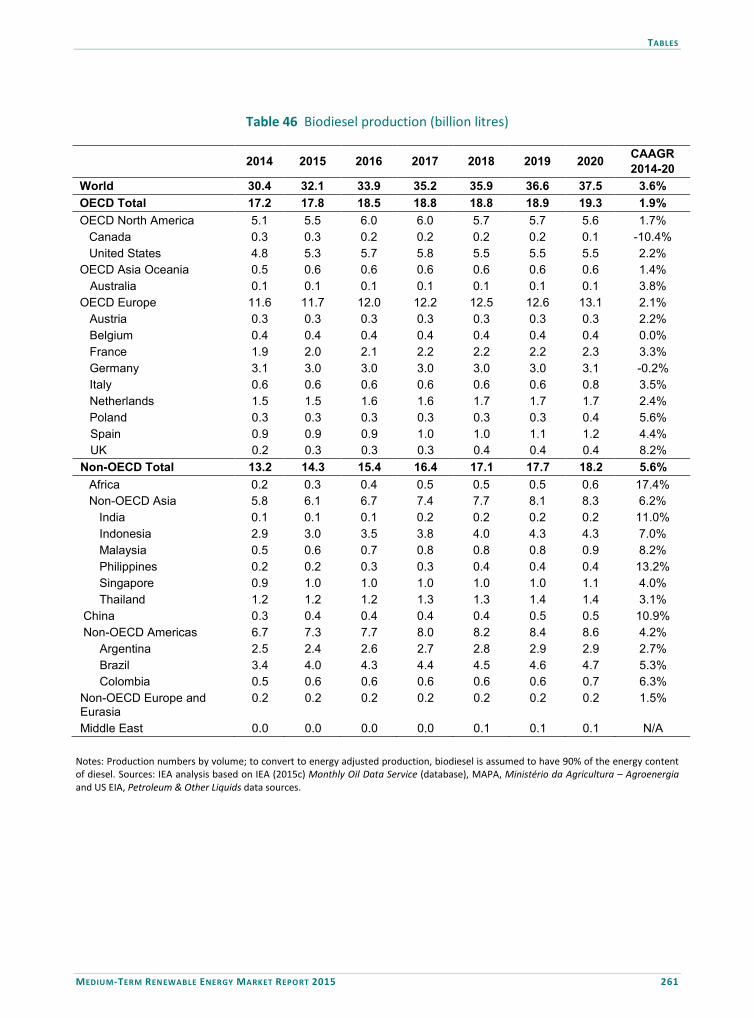
TABLES
MEDIUM-TERM RENEWABLE ENERGY MARKET REPORT 2015 261
Table 46 Biodiesel production (billion litres)
Notes: Production numbers by volume; to convert to energy adjusted production, biodiesel is assumed to have 90% of the energy content of diesel. Sources: IEA analysis based on IEA (2015c) Monthly Oil Data Service (database), MAPA, Ministério da Agricultura – Agroenergia and US EIA, Petroleum & Other Liquids data sources.
2014 2015 2016 2017 2018 2019 2020 CAAGR 2014-20
World 30.4 32.1 33.9 35.2 35.9 36.6 37.5 3.6% OECD Total 17.2 17.8 18.5 18.8 18.8 18.9 19.3 1.9% OECD North America 5.1 5.5 6.0 6.0 5.7 5.7 5.6 1.7%
Canada 0.3 0.3 0.2 0.2 0.2 0.2 0.1 -10.4% 4.8 5.3 5.7 5.8 5.5 5.5 5.5 2.2% United States
OECD Asia Oceania 0.5 0.6 0.6 0.6 0.6 0.6 0.6 1.4% Australia 0.1 0.1 0.1 0.1 0.1 0.1 0.1 3.8% OECD Europe 11.6 11.7 12.0 12.2 12.5 12.6 13.1 2.1%
0.3 0.3 0.3 0.3 0.3 0.3 0.3 2.2% 0.4 0.4 0.4 0.4 0.4 0.4 0.4 0.0% 1.9 2.0 2.1 2.2 2.2 2.2 2.3 3.3% 3.1 3.0 3.0 3.0 3.0 3.0 3.1 -0.2% 0.6 0.6 0.6 0.6 0.6 0.6 0.8 3.5% 1.5 1.5 1.6 1.6 1.7 1.7 1.7 2.4% 0.3 0.3 0.3 0.3 0.3 0.3 0.4 5.6% 0.9 0.9 0.9 1.0 1.0 1.1 1.2 4.4%
Austria Belgium France Germany Italy Netherlands Poland
Spain UK 0.2 0.3 0.3 0.3 0.4 0.4 0.4 8.2% Non-OECD Total 13.2 14.3 15.4 16.4 17.1 17.7 18.2 5.6%
0.2 0.3 0.4 0.5 0.5 0.5 0.6 17.4% Africa Non-OECD Asia 5.8 6.1 6.7 7.4 7.7 8.1 8.3 6.2% India 0.1 0.1 0.1 0.2 0.2 0.2 0.2 11.0%
2.9 3.0 3.5 3.8 4.0 4.3 4.3 7.0% 0.5 0.6 0.7 0.8 0.8 0.8 0.9 8.2% 0.2 0.2 0.3 0.3 0.4 0.4 0.4 13.2% 0.9 1.0 1.0 1.0 1.0 1.0 1.1 4.0%
Indonesia Malaysia Philippines Singapore Thailand 1.2 1.2 1.2 1.3 1.3 1.4 1.4 3.1%
China 0.3 0.4 0.4 0.4 0.4 0.5 0.5 10.9% Non-OECD Americas 6.7 7.3 7.7 8.0 8.2 8.4 8.6 4.2%
2.5 2.4 2.6 2.7 2.8 2.9 2.9 2.7% 3.4 4.0 4.3 4.4 4.5 4.6 4.7 5.3%
Argentina Brazil Colombia 0.5 0.6 0.6 0.6 0.6 0.6 0.7 6.3%
0.2 0.2 0.2 0.2 0.2 0.2 0.2 1.5% Non-OECD Europe and Eurasia Middle East 0.0 0.0 0.0 0.0 0.1 0.1 0.1 N/A
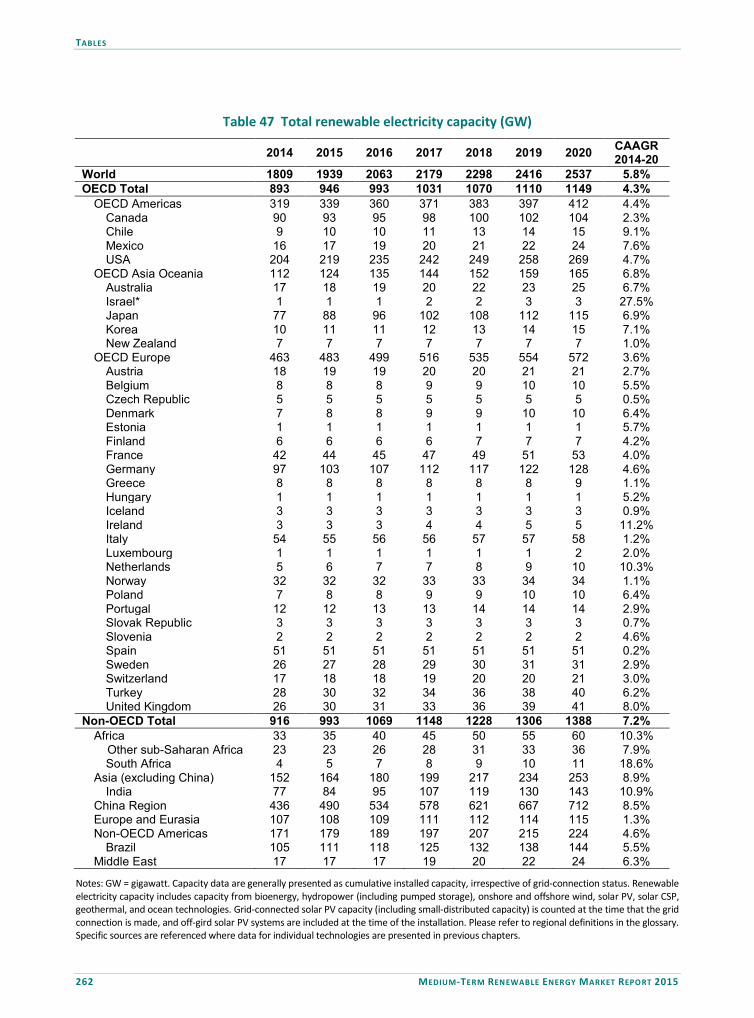
TABLES
262 MEDIUM-TERM RENEWABLE ENERGY MARKET REPORT 2015
Table 47 Total renewable electricity capacity (GW)
2014 2015 2016 2017 2018 2019 2020 CAAGR 2014-20
World 1809 1939 2063 2179 2298 2416 2537 5.8% OECD Total 893 946 993 1031 1070 1110 1149 4.3%
OECD Americas 319 339 360 371 383 397 412 4.4% Canada 90 93 95 98 100 102 104 2.3% Chile 9 10 10 11 13 14 15 9.1% Mexico 16 17 19 20 21 22 24 7.6% USA 204 219 235 242 249 258 269 4.7%
OECD Asia Oceania 112 124 135 144 152 159 165 6.8% Australia 17 18 19 20 22 23 25 6.7% Israel* 1 1 1 2 2 3 3 27.5% Japan 77 88 96 102 108 112 115 6.9% Korea 10 11 11 12 13 14 15 7.1% New Zealand 7 7 7 7 7 7 7 1.0%
OECD Europe 463 483 499 516 535 554 572 3.6% Austria 18 19 19 20 20 21 21 2.7% Belgium 8 8 8 9 9 10 10 5.5% Czech Republic 5 5 5 5 5 5 5 0.5% Denmark 7 8 8 9 9 10 10 6.4% Estonia 1 1 1 1 1 1 1 5.7% Finland 6 6 6 6 7 7 7 4.2% France 42 44 45 47 49 51 53 4.0% Germany 97 103 107 112 117 122 128 4.6% Greece 8 8 8 8 8 8 9 1.1% Hungary 1 1 1 1 1 1 1 5.2% Iceland 3 3 3 3 3 3 3 0.9% Ireland 3 3 3 4 4 5 5 11.2% Italy 54 55 56 56 57 57 58 1.2% Luxembourg 1 1 1 1 1 1 2 2.0% Netherlands 5 6 7 7 8 9 10 10.3% Norway 32 32 32 33 33 34 34 1.1% Poland 7 8 8 9 9 10 10 6.4% Portugal 12 12 13 13 14 14 14 2.9% Slovak Republic 3 3 3 3 3 3 3 0.7% Slovenia 2 2 2 2 2 2 2 4.6% Spain 51 51 51 51 51 51 51 0.2% Sweden 26 27 28 29 30 31 31 2.9% Switzerland 17 18 18 19 20 20 21 3.0% Turkey 28 30 32 34 36 38 40 6.2% United Kingdom 26 30 31 33 36 39 41 8.0%
Non-OECD Total 916 993 1069 1148 1228 1306 1388 7.2% Africa 33 35 40 45 50 55 60 10.3%
Other sub-Saharan Africa 23 23 26 28 31 33 36 7.9% South Africa 4 5 7 8 9 10 11 18.6%
Asia (excluding China) 152 164 180 199 217 234 253 8.9% India 77 84 95 107 119 130 143 10.9%
China Region 436 490 534 578 621 667 712 8.5% Europe and Eurasia 107 108 109 111 112 114 115 1.3% Non-OECD Americas 171 179 189 197 207 215 224 4.6%
Brazil 105 111 118 125 132 138 144 5.5% Middle East 17 17 17 19 20 22 24 6.3%
Notes: GW = gigawatt. Capacity data are generally presented as cumulative installed capacity, irrespective of grid-connection status. Renewable electricity capacity includes capacity from bioenergy, hydropower (including pumped storage), onshore and offshore wind, solar PV, solar CSP, geothermal, and ocean technologies. Grid-connected solar PV capacity (including small-distributed capacity) is counted at the time that the grid connection is made, and off-gird solar PV systems are included at the time of the installation. Please refer to regional definitions in the glossary. Specific sources are referenced where data for individual technologies are presented in previous chapters.
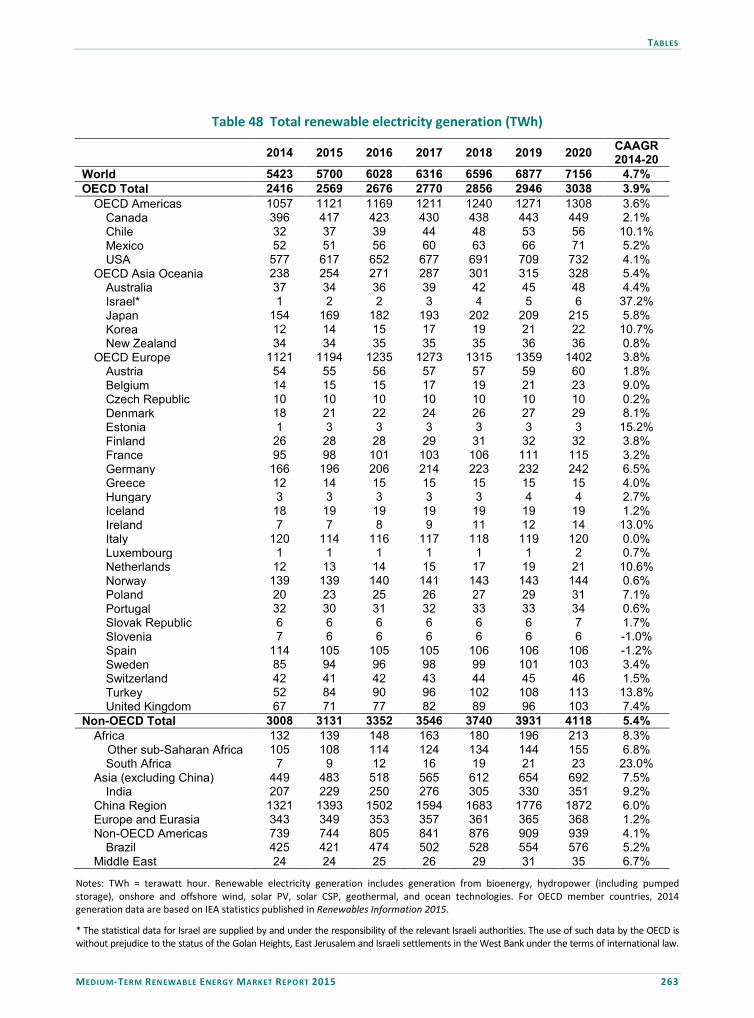
TABLES
MEDIUM-TERM RENEWABLE ENERGY MARKET REPORT 2015 263
Table 48 Total renewable electricity generation (TWh)
2014 2015 2016 2017 2018 2019 2020 CAAGR 2014-20
World 5423 5700 6028 6316 6596 6877 7156 4.7% OECD Total 2416 2569 2676 2770 2856 2946 3038 3.9%
OECD Americas 1057 1121 1169 1211 1240 1271 1308 3.6% Canada 396 417 423 430 438 443 449 2.1% Chile 32 37 39 44 48 53 56 10.1% Mexico 52 51 56 60 63 66 71 5.2% USA 577 617 652 677 691 709 732 4.1%
OECD Asia Oceania 238 254 271 287 301 315 328 5.4% Australia 37 34 36 39 42 45 48 4.4% Israel* 1 2 2 3 4 5 6 37.2% Japan 154 169 182 193 202 209 215 5.8% Korea 12 14 15 17 19 21 22 10.7% New Zealand 34 34 35 35 35 36 36 0.8%
OECD Europe 1121 1194 1235 1273 1315 1359 1402 3.8% Austria 54 55 56 57 57 59 60 1.8% Belgium 14 15 15 17 19 21 23 9.0% Czech Republic 10 10 10 10 10 10 10 0.2% Denmark 18 21 22 24 26 27 29 8.1% Estonia 1 3 3 3 3 3 3 15.2% Finland 26 28 28 29 31 32 32 3.8% France 95 98 101 103 106 111 115 3.2% Germany 166 196 206 214 223 232 242 6.5% Greece 12 14 15 15 15 15 15 4.0% Hungary 3 3 3 3 3 4 4 2.7% Iceland 18 19 19 19 19 19 19 1.2% Ireland 7 7 8 9 11 12 14 13.0% Italy 120 114 116 117 118 119 120 0.0% Luxembourg 1 1 1 1 1 1 2 0.7% Netherlands 12 13 14 15 17 19 21 10.6% Norway 139 139 140 141 143 143 144 0.6% Poland 20 23 25 26 27 29 31 7.1% Portugal 32 30 31 32 33 33 34 0.6% Slovak Republic 6 6 6 6 6 6 7 1.7% Slovenia 7 6 6 6 6 6 6 -1.0%Spain 114 105 105 105 106 106 106 -1.2%Sweden 85 94 96 98 99 101 103 3.4%Switzerland 42 41 42 43 44 45 46 1.5%Turkey 52 84 90 96 102 108 113 13.8%United Kingdom 67 71 77 82 89 96 103 7.4%
Non-OECD Total 3008 3131 3352 3546 3740 3931 4118 5.4% Africa 132 139 148 163 180 196 213 8.3%
Other sub-Saharan Africa 105 108 114 124 134 144 155 6.8% South Africa 7 9 12 16 19 21 23 23.0%
Asia (excluding China) 449 483 518 565 612 654 692 7.5% India 207 229 250 276 305 330 351 9.2%
China Region 1321 1393 1502 1594 1683 1776 1872 6.0% Europe and Eurasia 343 349 353 357 361 365 368 1.2% Non-OECD Americas 739 744 805 841 876 909 939 4.1%
Brazil 425 421 474 502 528 554 576 5.2% Middle East 24 24 25 26 29 31 35 6.7%
Notes: TWh = terawatt hour. Renewable electricity generation includes generation from bioenergy, hydropower (including pumped storage), onshore and offshore wind, solar PV, solar CSP, geothermal, and ocean technologies. For OECD member countries, 2014 generation data are based on IEA statistics published in Renewables Information 2015.
* The statistical data for Israel are supplied by and under the responsibility of the relevant Israeli authorities. The use of such data by the OECD is without prejudice to the status of the Golan Heights, East Jerusalem and Israeli settlements in the West Bank under the terms of international law.
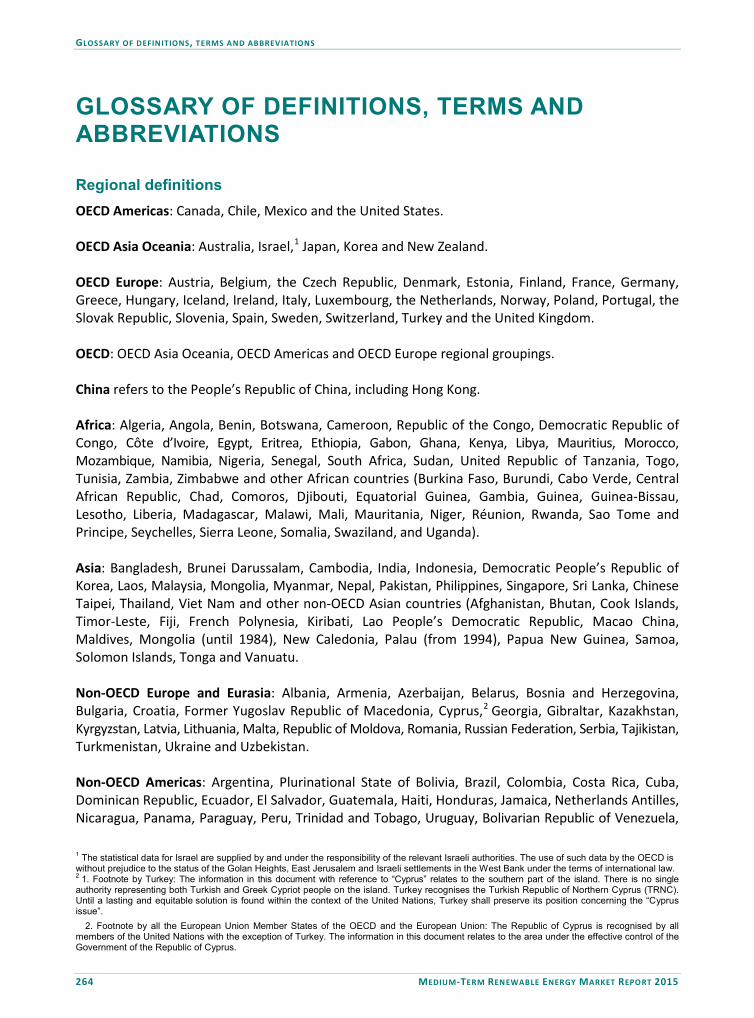
GLOSSARY OF DEFINITIONS, TERMS AND ABBREVIATIONS
264 MEDIUM-TERM RENEWABLE ENERGY MARKET REPORT 2015
GLOSSARY OF DEFINITIONS, TERMS AND ABBREVIATIONS Regional definitions OECD Americas: Canada, Chile, Mexico and the United States. OECD Asia Oceania: Australia, Israel,1 Japan, Korea and New Zealand. OECD Europe: Austria, Belgium, the Czech Republic, Denmark, Estonia, Finland, France, Germany, Greece, Hungary, Iceland, Ireland, Italy, Luxembourg, the Netherlands, Norway, Poland, Portugal, the Slovak Republic, Slovenia, Spain, Sweden, Switzerland, Turkey and the United Kingdom. OECD: OECD Asia Oceania, OECD Americas and OECD Europe regional groupings. China refers to the People’s Republic of China, including Hong Kong. Africa: Algeria, Angola, Benin, Botswana, Cameroon, Republic of the Congo, Democratic Republic of Congo, Côte d’Ivoire, Egypt, Eritrea, Ethiopia, Gabon, Ghana, Kenya, Libya, Mauritius, Morocco, Mozambique, Namibia, Nigeria, Senegal, South Africa, Sudan, United Republic of Tanzania, Togo, Tunisia, Zambia, Zimbabwe and other African countries (Burkina Faso, Burundi, Cabo Verde, Central African Republic, Chad, Comoros, Djibouti, Equatorial Guinea, Gambia, Guinea, Guinea-Bissau, Lesotho, Liberia, Madagascar, Malawi, Mali, Mauritania, Niger, Réunion, Rwanda, Sao Tome and Principe, Seychelles, Sierra Leone, Somalia, Swaziland, and Uganda). Asia: Bangladesh, Brunei Darussalam, Cambodia, India, Indonesia, Democratic People’s Republic of Korea, Laos, Malaysia, Mongolia, Myanmar, Nepal, Pakistan, Philippines, Singapore, Sri Lanka, Chinese Taipei, Thailand, Viet Nam and other non-OECD Asian countries (Afghanistan, Bhutan, Cook Islands, Timor-Leste, Fiji, French Polynesia, Kiribati, Lao People’s Democratic Republic, Macao China, Maldives, Mongolia (until 1984), New Caledonia, Palau (from 1994), Papua New Guinea, Samoa, Solomon Islands, Tonga and Vanuatu. Non-OECD Europe and Eurasia: Albania, Armenia, Azerbaijan, Belarus, Bosnia and Herzegovina, Bulgaria, Croatia, Former Yugoslav Republic of Macedonia, Cyprus,2 Georgia, Gibraltar, Kazakhstan, Kyrgyzstan, Latvia, Lithuania, Malta, Republic of Moldova, Romania, Russian Federation, Serbia, Tajikistan, Turkmenistan, Ukraine and Uzbekistan. Non-OECD Americas: Argentina, Plurinational State of Bolivia, Brazil, Colombia, Costa Rica, Cuba, Dominican Republic, Ecuador, El Salvador, Guatemala, Haiti, Honduras, Jamaica, Netherlands Antilles, Nicaragua, Panama, Paraguay, Peru, Trinidad and Tobago, Uruguay, Bolivarian Republic of Venezuela,
1 The statistical data for Israel are supplied by and under the responsibility of the relevant Israeli authorities. The use of such data by the OECD is without prejudice to the status of the Golan Heights, East Jerusalem and Israeli settlements in the West Bank under the terms of international law. 2 1. Footnote by Turkey: The information in this document with reference to “Cyprus” relates to the southern part of the island. There is no single authority representing both Turkish and Greek Cypriot people on the island. Turkey recognises the Turkish Republic of Northern Cyprus (TRNC). Until a lasting and equitable solution is found within the context of the United Nations, Turkey shall preserve its position concerning the “Cyprus issue”. 2. Footnote by all the European Union Member States of the OECD and the European Union: The Republic of Cyprus is recognised by all members of the United Nations with the exception of Turkey. The information in this document relates to the area under the effective control of the Government of the Republic of Cyprus.

GLOSSARY OF DEFINITIONS, TERMS AND ABBREVIATIONS
MEDIUM-TERM RENEWABLE ENERGY MARKET REPORT 2015 265
and other Latin American countries (Antigua and Barbuda, Aruba, Bahamas, Barbados, Belize, Bermuda, British Virgin Islands, Cayman Islands, Dominica, Falkland Islands [Malvinas], French Guyana, Grenada, Guadeloupe, Guyana, Martinique, Montserrat, Saint Kitts and Nevis, Saint Lucia, Saint Pierre et Miquelon, Saint Vincent and the Grenadines, Suriname, and Turks and Caicos Islands). Middle East: Bahrain, Islamic Republic of Iran, Iraq, Jordan, Kuwait, Lebanon, Oman, Qatar, Saudi Arabia, Syrian Arab Republic, United Arab Emirates and Yemen. Non-OECD: Africa, Asia, China, non-OECD Europe and Eurasia, non-OECD Americas, and the Middle East. The European Union – 28 (EU-28): Austria, Belgium, Bulgaria, Croatia Cyprus,3 the Czech Republic, Denmark, Estonia, Finland, France, Germany, Greece, Hungary, Ireland, Italy, Latvia, Lithuania, Luxembourg, Malta, the Netherlands, Poland, Portugal, Romania, the Slovak Republic, Slovenia, Spain, Sweden and the United Kingdom. Abbreviations and acronyms CSP concentrating solar power DC direct current EIA Energy Information Administration EPA Environmental Protection Agency (United States) EU European Union EU-ETS European Union Greenhouse Gas Emissions Trading Scheme EV electric vehicle EWEA European Wind Energy Association FiT feed-in tariff GDP gross domestic product GWEC Global Wind Energy Council IEA International Energy Agency IEA-OES International Energy Agency Ocean Energy Systems Programme IEA-PVPS International Energy Agency Photovoltaic Power Systems Programme IMF International Monetary Fund IPP independent power producer ITC investment tax credit LCOE levelised cost of electricity NPV net present value NREAP National Renewable Energy Action Plan OECD Organisation for Economic Co-operation and Development PPA power purchase agreement PTC production tax credit PV photovoltaics R&D research and development
3 1. Footnote by Turkey The information in this document with reference to “Cyprus” relates to the southern part of the island. There is no single authority representing both Turkish and Greek Cypriot people on the island. Turkey recognises the Turkish Republic of Northern Cyprus (TRNC). Until a lasting and equitable solution is found within the context of the United Nations, Turkey shall preserve its position concerning the “Cyprus issue”. 2. Footnote by all the European Union Member States of the OECD and the European Union The Republic of Cyprus is recognised by all members of the United Nations with the exception of Turkey. The information in this document relates to the area under the effective control of the Government of the Republic of Cyprus.

GLOSSARY OF DEFINITIONS, TERMS AND ABBREVIATIONS
266 MEDIUM-TERM RENEWABLE ENERGY MARKET REPORT 2015
RD&D research, development and demonstration RE renewable energy RECs renewable energy certificates RES renewable energy sources RES-E electricity generated from renewable energy sources RES-H final energy consumption of renewable energy sources for heat RES-T renewable energy sources used in transport RPS renewable portfolio standard ROC renewable obligation certificate STE solar thermal electricity TGC tradable green certificate US United States WEO World Energy Outlook Currency codes BRL Brazilian real CAD Canadian dollar CNY Chinese Yuan renminbi EUR Euro GBP British pound INR Indian rupee MAD Moroccan dirham USD United States dollar ZAR South African rand Units of measure bbl/d barrels per day EJ exajoule GW gigawatt, 1 gigawatt equals 109 watt GWh gigawatt hour, 1 gigawatt hour equals 109 watt hours GWth gigawatt thermal kW kilowatt, 1 kilowatt equals 103 watt kWh kilowatt hour, 1 kilowatt hour equals 103 watt hours L litre MW megawatt, 1 megawatt equals 106 watt MWth megawatt thermal MWh megawatt hour, 1 megawatt hour equals 106 watt hours m2 square metre TWh terawatt hour, 1 terawatt hour equals 1012 watt hours W watt

Onl
in
e bookshopPDF versions at 20% discount
ww
w.i
ea.o
rg/booksIn
tern
atio
nal
Energy Agency
Secure Sustain
able T
oget
her
World Energy Outlook series
Energy Statistics series
Energy Policiesof IEA
Countriesseries
Energy Technology
Perspectives series
E-mail: books@
iea.org
Medium-Term Market
Reports series
Oil
Coal
Gas
RenewableEnergy
EnergyPolicies
Beyond IEA Countries
series
EnergyEfficiency
Market Report
This publication reflects the views of the International Energy Agency (IEA) Secretariat but does not necessarily reflect those of individual IEA member countries. The IEA makes no representation or
warranty, express or implied, in respect to the publication’s contents (including its completeness or accuracy) and shall not be responsible for any use of, or reliance on, the publication.
This document and any map included herein are without prejudice to the status of or sovereignty over any territory, to the delimitation of international frontiers and boundaries and to the name of
any territory, city or area.
The paper used has been produced respecting ecological, social and ethical standards.
IEA Publications, 9, rue de la Fédération, 75739 Paris cedex 15Layout in France by Jouve, Printed in France by IEA, "fourth edition", November 2015
(612015231P1) ISBN 9789264243613; ISSN 2307-0269 Cover design: IEA. Photo credits: © GraphicObsession
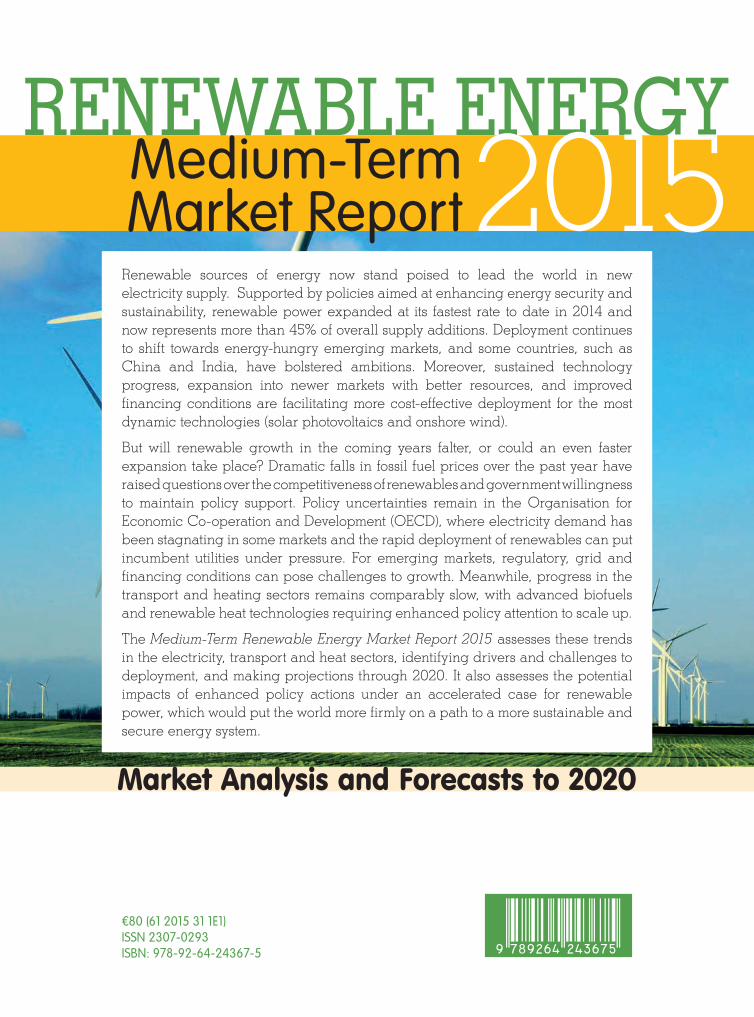
RENEWABLE ENERGYMedium-Term Market Report2015
€80 (61 2015 31 1E1) ISSN 2307-0293 ISBN: 978-92-64-24367-5
9HSTCQE*cedghf+
Renewable sources of energy now stand poised to lead the world in new electricity supply. Supported by policies aimed at enhancing energy security and sustainability, renewable power expanded at its fastest rate to date in 2014 and now represents more than 45% of overall supply additions. Deployment continues to shift towards energy-hungry emerging markets, and some countries, such as China and India, have bolstered ambitions. Moreover, sustained technology progress, expansion into newer markets with better resources, and improved financing conditions are facilitating more cost-effective deployment for the most dynamic technologies (solar photovoltaics and onshore wind).
But will renewable growth in the coming years falter, or could an even faster expansion take place? Dramatic falls in fossil fuel prices over the past year have raised questions over the competitiveness of renewables and government willingness to maintain policy support. Policy uncertainties remain in the Organisation for Economic Co-operation and Development (OECD), where electricity demand has been stagnating in some markets and the rapid deployment of renewables can put incumbent utilities under pressure. For emerging markets, regulatory, grid and financing conditions can pose challenges to growth. Meanwhile, progress in the transport and heating sectors remains comparably slow, with advanced biofuels and renewable heat technologies requiring enhanced policy attention to scale up.
The Medium-Term Renewable Energy Market Report 2015 assesses these trends in the electricity, transport and heat sectors, identifying drivers and challenges to deployment, and making projections through 2020. It also assesses the potential impacts of enhanced policy actions under an accelerated case for renewable power, which would put the world more firmly on a path to a more sustainable and secure energy system.
Market Analysis and Forecasts to 2020