identifying key assumptions and differences in life cycle
TRANSCRIPT
1
Identifying key assumptions and differences in life cycle 1
assessment studies of lithium-ion traction batteries with 2
focus on greenhouse gas emissions 3
Linda Ager-Wick Ellingsen1, Christine Roxanne Hung, Anders Hammer Strømman 4
Norwegian University of Science and Technology, Program for Industrial Ecology and Department of Energy and 5 Process Engineering, Sem Sælandsvei 7, NO-7491 Trondheim, Norway. 6
1Corresponding author, e -mail: [email protected] 7
8
Abstract 9
The various studies that consider the life cycle environmental impacts of lithium-ion traction batteries 10
report widely different results. This article evaluates the inventory data and results to identify the key 11
assumptions and differences in the studies. To aid the identification, we compile the reported life cycle 12
greenhouse gas emissions of batteries. The studies find production-related emissions in the range of 38-13
356 kg CO2-eq/kWh. One of the main sources of the large variations stems from differing assumptions 14
regarding direct energy demand associated with cell manufacture and pack assembly. Further 15
differences are due to assumptions regarding the amount of cell materials and other battery components. 16
The indirect emissions associated with the use phase depend on the conversion losses in the battery, the 17
energy required to transport the weight of the battery, and the carbon intensity of the electricity. Of the 18
reviewed studies assessing the use phase, all estimate energy use associated with conversion losses while 19
only one considers the mass-induced energy requirement. Although there are several industrial end-of-20
life treatment alternatives for lithium-ion batteries, very few studies consider this life cycle stage. Studies 21
using the “recycled content” approach report emissions in the range of 3.6-27 kg CO2-eq/kWh battery, 22
while studies using the “end-of-life" approach report emission reductions in the range of 16-32 kg CO2-23
eq/kWh battery. The uncertainty associated with the end-of-life results is high as the data availability on 24
industrial process is limited. Based on our findings, we discuss how the life emissions of lithium-ion 25
traction batteries may be reduced. 26
Keywords: life cycle assessment, life cycle inventory analysis, lithium-ion traction battery, electric 27
vehicle, greenhouse gas emissions 28
29
Abbreviations BEV battery electric vehicle
EOL end-of-life
GHG greenhouse gas
LCA life cycle assessment
LCO lithium cobalt oxide
LFP lithium iron phosphate
LMO lithium manganese oxide
LTO lithium titanium oxide
NCA lithium nickel-cobalt-aluminum oxide
NCM lithium nickel-cobalt-manganese oxide
2
PHEV plug-in hybrid electric vehicle
SiNW silicon nanowire
30
31
1 Introduction 32
Transport-related greenhouse gas (GHG) emissions have more than doubled since 1970, and have 33
increased at a faster rate than any other energy end-use sector. The transport sector consumed over half 34
of global primary oil and was responsible for nearly one-fourth of global energy-related CO2 emissions 35
in 2010 (Sims et al., 2014). Light duty vehicles were responsible for around half of the total transport 36
energy use. From the current number of around one billion vehicles (Sousanis, 2011), the total light duty 37
vehicle ownership is expected to double in the next few decades (IEA, 2009). These patterns forecast a 38
dramatic increase in gasoline and diesel demands, and have implications for climate change, urban air 39
quality, and energy security. The projected increase in GHG emissions makes it particularly difficult for 40
the transport sector to reduce its emissions and oil dependency, and this has led to policies that mandate 41
more stringent fuel economy standards and encourage alternative drivetrain configurations and fuels 42
(Wallington et al., 2016). Electric vehicles have emerged as strong candidates among the available 43
transport alternatives (Hawkins et al., 2012). Compared to conventional vehicles, electric vehicles can 44
offer advantages in terms of powertrain efficiency, maintenance, and reduced tailpipe emissions. 45
Understanding the system-wide trade-offs of replacing conventional vehicles by electric vehicles 46
requires a life cycle perspective. Environmental trade-offs that arise from the change in powertrain 47
configuration are best analyzed using life cycle assessment (LCA) (Nealer and Hendrickson, 2015). As 48
lithium-ion battery cells offer an unmatchable combination of high energy and power density, it makes 49
them the battery of choice for electric vehicles (Nitta et al., 2015). Several studies have assessed the 50
production impact of lithium-ion traction batteries (LIBs) as part of a battery electric vehicle (BEV), a 51
plug-in hybrid electric vehicle (PHEV), or as its own product. Studies have mainly assessed LIBs with 52
a graphitic anode in combination with a cathode of either lithium nickel-cobalt-manganese oxide 53
(NCM), lithium iron phosphate (LFP), lithium nickel-cobalt-aluminum oxide (NCA), lithium 54
manganese oxide (LMO), or a blended LMO-NCM cathode material. In addition, studies have also 55
assessed a lithium titanium oxide (LTO) anode in combination with an LFP cathode and a silicon 56
nanowire (SiNW) anode in combination with an NCM cathode. In contrast to production, the use phase 57
and end-of-life (EOL) treatment of the battery are only evaluated in a few studies. Although several 58
LCA studies have assessed LIBs, these assessments find significantly different results. Thus, there is 59
much uncertainty associated with the data and results, making it difficult to provide direction for 60
reducing environmental impacts of LIBs. Moving forward, it is important to understand why the studies 61
obtain such widely different results. The main objective of this article is to identify the key assumptions 62
and differences between the various LCA studies on LIBs. This will also allow us to identify potential 63
issues that should be considered in future studies on LIBs and point out where further work is needed. 64
In this article, we considered LCAs of LIBs from various literature sources. Studies assessing only the 65
LIB as well as those examining BEVs and PHEVs studies were evaluated. Unfortunately, few of the 66
BEV and PHEV studies provide a transparent inventory or a detailed contribution analysis of the LIB. 67
Furthermore, many of these studies base their battery inventory on previously published studies and 68
therefore do not contribute new data. Although there are fewer studies that assess only the LIB, these 69
3
studies more often include inventory data and a detailed contribution analysis. We mainly considered 70
studies published in peer-reviewed journals, but we also included three grey literature cradle-to-gate 71
studies. The first of these is the Volkswagen assessment of the battery used in the electric Golf 72
(Volkswagen AG, 2012). Volkswagen has a long tradition of performing LCAs of their various vehicle 73
models, and their reports are certified according to the ISO 14040 and 14044 standards. The other two 74
studies were performed by the Paul Scherrer Institut (Bauer, 2010) and the United States Environmental 75
Protection Agency (USEPA; 2013), two institutes that have extensive experience with LCA. To more 76
easily pinpoint differences between the reviewed studies, we collected the reported cradle-to-gate 77
results. Although most of the studies considered several different types of emissions, we limited our 78
presentation to GHG emissions as global warming potential is the most consistently reported 79
environmental impact category in the reviewed literature. Because the studies report GHG emissions 80
based on different functional units, we recalculated the emissions for a common functional unit of 1 81
kWh of battery capacity. Even though there are much fewer studies that assess the use phase and EOL, 82
which simplifies the search, we recalculate the reported GHG emissions for these life cycle stages where 83
possible. 84
This article is divided into four sections, including this introductory section. In section 2, we examine 85
the underlying assumptions and key parameters to uncover the causes of discrepancies in reported 86
results. Section 3 discusses our findings, distil the information from the LCA literature, and use this to 87
suggest measures that can succeed in reducing life cycle GHG emissions of LIBs. Finally, section 4 88
summarizes the most important findings, discusses knowledge gaps, and provides directions from the 89
literature. 90
2 Life cycle inventory data and reported results 91
In the text below, we present the results and examine the life cycle inventories from the various studies. 92
We start by reporting the compiled GHG emissions associated with production. Using the emissions as 93
a starting point, we seek to identify and discuss key assumptions and differences among the various 94
studies. Then, we examine the use phase and EOL treatment. 95
2.1 Production 96
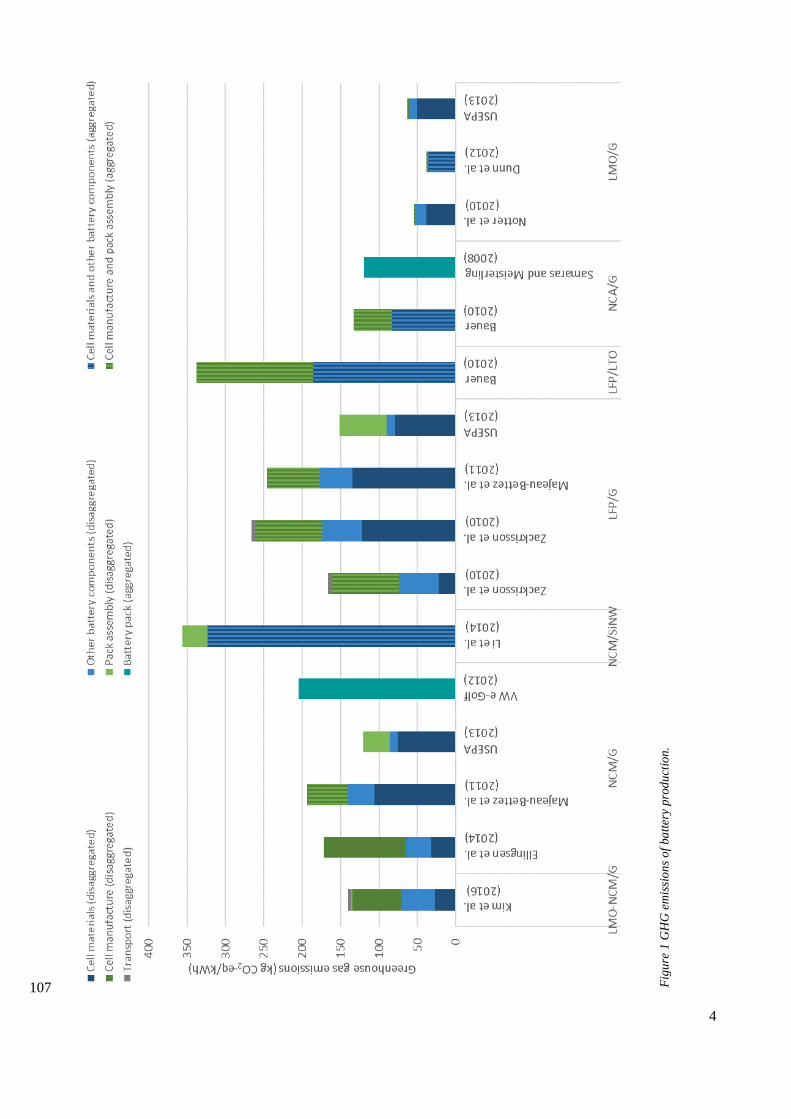
The different studies vary in how they report the breakdown of the GHG emissions due to production. 97
Where possible, we disaggregated emissions associated with cell materials (dark blue), other battery 98
components (pale blue), cell manufacture (dark green), battery pack assembly (pale green), and transport 99
(grey). For studies where fewer details are provided, we reported aggregated emissions associated with 100
production of cell materials and battery components combined (blue, striped), and aggregated emissions 101
associated with direct energy demand in cell manufacture and battery pack assembly combined (green, 102
striped). For two studies, we were unable to disaggregate into component- and energy-related emissions 103
and therefore, these results are reported aggregated battery pack emissions (turquoise). Figure 1 presents 104
the results in terms of kilograms of carbon dioxide equivalents per kWh of battery capacity (kg CO2-105
eq/kWh).106
4
107 Fig
ure
1 G
HG
em
issi
on
s o
f ba
tter
y p
rod
uct
ion
.
5
Figure 1 reports great variation in the overall production emissions with results between 38-356 kg CO2-108
eq/kWh, corresponding to 0.9-8.6 tonnes of CO2-eq for a 24 kWh battery. As can be seen in Figure 1, the 109
studies also report different contributions from battery components and energy demand. To uncover the reasons 110
for the different results, we examine the underlying data and assumptions in the different studies. Below, we 111
go through some of the most important differences and contributing factors. 112
A major source of the difference in production-related GHG emissions stems from the energy demand in cell 113
manufacture and battery pack assembly. Kim et al. (2016) report that use of utilities (electricity, natural gas, 114
and water) in cell manufacture account for 45% of the total production GHG emissions. Ellingsen et al. (2014) 115
found that electricity demand in cell manufacture causes 62% of the cradle-to-gate emissions. In contrast to 116
the abovementioned studies, Dunn et al., (2012), Notter et al. (2010), and USEPA (2013) report insignificant 117
GHG emissions associated with cell manufacture. Of the studies that report emissions associated with pack 118
assembly, Kim et al. (2016), Ellingsen et al. (2014), Dunn et al. (2012), and Notter et al. (2010) are much lower 119
(these are barely visible in Figure 1) than in Li et al. (2014). Interestingly, USEPA (2013) report that pack 120
assembly of the NCM and LFP batteries contribute as much as 28% and 40% of total production emissions, 121
while for the LMO battery, pack assembly has no contribution at all. Majeau-Bettez et al. (2011), Zackrisson 122
et al. (2010), and Bauer (2010) respectively find found that cell manufacture and pack assembly combined 123
contribute to 28%, 33-53%, and 38-45% of total production-related GHG emissions. To find out why the 124
studies reach such different results, we examined the various approaches taken by the different studies in 125
estimating energy demand in cell manufacture and pack assembly. Table 1 reports energy data and sources for 126
cell manufacture and pack assembly from the studies that provided this information. 127
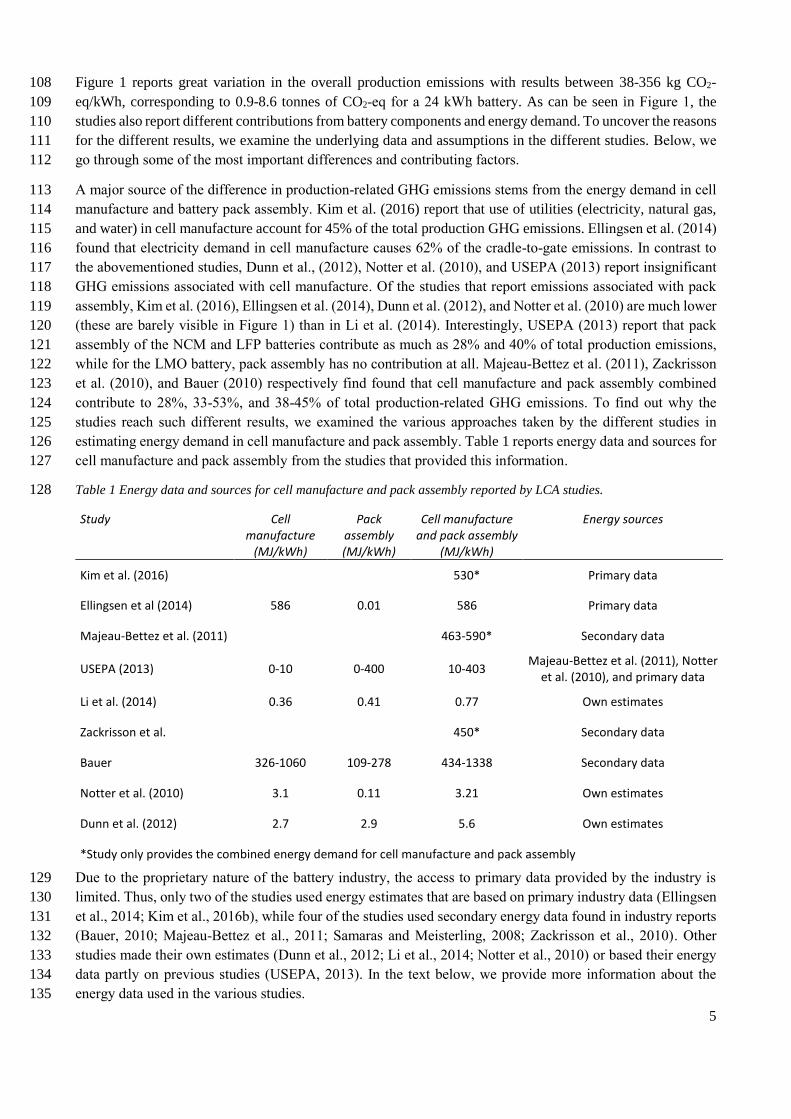
Table 1 Energy data and sources for cell manufacture and pack assembly reported by LCA studies. 128
Study Cell manufacture
(MJ/kWh)
Pack assembly (MJ/kWh)
Cell manufacture and pack assembly
(MJ/kWh)
Energy sources
Kim et al. (2016) 530* Primary data
Ellingsen et al (2014) 586 0.01 586 Primary data
Majeau-Bettez et al. (2011) 463-590* Secondary data
USEPA (2013) 0-10 0-400 10-403 Majeau-Bettez et al. (2011), Notter
et al. (2010), and primary data
Li et al. (2014) 0.36 0.41 0.77 Own estimates
Zackrisson et al. 450* Secondary data
Bauer 326-1060 109-278 434-1338 Secondary data
Notter et al. (2010) 3.1 0.11 3.21 Own estimates
Dunn et al. (2012) 2.7 2.9 5.6 Own estimates
*Study only provides the combined energy demand for cell manufacture and pack assembly
Due to the proprietary nature of the battery industry, the access to primary data provided by the industry is 129
limited. Thus, only two of the studies used energy estimates that are based on primary industry data (Ellingsen 130
et al., 2014; Kim et al., 2016b), while four of the studies used secondary energy data found in industry reports 131
(Bauer, 2010; Majeau-Bettez et al., 2011; Samaras and Meisterling, 2008; Zackrisson et al., 2010). Other 132
studies made their own estimates (Dunn et al., 2012; Li et al., 2014; Notter et al., 2010) or based their energy 133
data partly on previous studies (USEPA, 2013). In the text below, we provide more information about the 134
energy data used in the various studies. 135
6
To assess the manufacture of the Ford Focus battery cells, Kim et al. (2016) used primary energy data from 136
LG Chem for the period between January to December 2014. The energy use by the Piston Group who 137
assembled the LG Chem cells into Ford Focus battery packs was based on normal operation in their facility in 138
Michigan. Kim et al. (2016) report that the combined primary energy demand from utility use (electricity, 139
natural gas, and water) during cell manufacture and pack assembly amounted to 120 MJ per kg of battery. 140
Using a primary to electric energy conversion factor of 0.35 (Kim et al., 2016b), we calculated the combined 141
energy demand for cell manufacture and pack assembly. Based on the GHG emissions that Kim et al. (2016) 142
found, one can deduce that most of the energy use stems from cell manufacture. Ellingsen et al. (2014) relied 143
on primary energy data from a cell manufacturer covering an 18-month period in 2011 and 2012. For pack 144
assembly, Ellingsen et al. (2014) received energy data that included the welding of cell tabs to busbars, but did 145
not account for electricity use for testing of the modules or the initial charging process in battery pack 146
assembly. 147
Next, we consider studies that based their energy estimates on industry reports. Bauer (2010) and Zackrisson 148
et al. (2010) based their energy data on reports from Hitachi Maxell (2005, 2003) and SAFT (2008), 149
respectively. Samaras and Meisterling (2008) and Majeau-Bettez et al. (2011) based their energy data on an 150
energy analysis of a SAFT battery published by Rydh and Sandén (2005). While Bauer (2010) decided to 151
divide the reported energy demand between cell manufacture (80%) and pack assembly (20%), Zackrisson et 152
al. (2010) and Majeau-Bettez et al. (2011) assumed that the energy demand covered both cell manufacture and 153
pack assembly. 154
Some of the studies made their own estimates for the processes involved in cell manufacture and pack 155
assembly. To determine what processes were considered in the various studies, we inspected the inventories. 156
In cell manufacture, Notter et al. (2010) considered heating of electrodes, calendaring, and a 70 % cell charge. 157
Thus, their estimate did not consider cell assembly, which is a process that places strict constraints on the 158
ambient environment and must take place in a dry-room (Schönemann, 2017; Wood et al., 2015). Furthermore, 159
it appears that Notter et al. (2010) underestimated the electricity required for formation cycling and aging. For 160
testing in battery pack assembly, Notter et al. (2010) assumed electricity for a single charge of the battery to 161
95 % of full capacity. Dunn et al. (2012) received an energy consumption estimate for a dry-room of 1860 m2 162
at 21 ̊C by a dry-room manufacturer, and assumed that the energy demand scales linearly with floor area. They 163
converted the values to a per-mass-of-battery basis for a room of 3000 m2 with a cell production rate of six 164
million accepted cells per year. For the conditioning, Dunn et al. (2012) assumed a total of four cycles, one 165
formation cycle and three aging cycles. Their total energy demand was sufficient to fully charge their battery 166
five and a half times. Therefore, after the assumed four cycles, less than 30 % of their estimated total energy 167
demand is available for electrode production and cell assembly. This seemingly contradicts their assumption 168
that the operation of dry-rooms and conditioning account for 60 % of total energy demand. Thus, it seems that 169
both Notter et al. (2010) and Dunn et al. (2012) neglected processes in cell manufacture and therefore 170
underestimate the energy demand. Li et al. (2014) report results for a cell with an NCM cathode and a SiNW 171
anode. However, their cell inventory provides data for an LMO cathode and a graphite anode. For cell 172
manufacture, their low estimated energy demand correspond with the reported low GHG emissions, but the 173
low estimated energy demand in pack assembly do not align with the reported higher GHG emissions. Thus, 174
we suspect that Li et al. (2014) may have published the wrong sub-inventories for the cell and battery pack, 175
which, along with the lack of description for energy inputs, constrains further discussion of their energy data. 176
USEPA (2013) based their energy data partly on Majeau-Bettez et al. (2011), Notter et al. (2010), and primary 177
data. The energy data used in the study are not found in the report. Therefore, the primary to electric energy 178
conversion factor of 0.35 was used to estimate the energy demand based on the reported primary energy use. 179
We find that USEPA (2013) report very different energy use associated with cell manufacture and pack 180
assembly for the NCM, LFP, and LMO batteries. Unfortunately, USEPA (2013) offers no explanation for why 181
7
the energy demands for these processes are so different themselves, but Kim et al. (2016) suggested that they 182
may have misinterpreted the industry information. For the NCM and LFP batteries, it appears USEPA (2013) 183
ascribed the aggregated energy demand for cell manufacture and battery pack assembly reported by Majeau-184
Bettez et al. (2011) entirely to battery pack assembly and nothing to cell manufacture. For the LMO battery, 185
USEPA (2013) modelled low energy use for both processes, which corresponds with the energy data Notter et 186
al. (2010) used for their LMO battery. 187
Another source of variation in production-related GHG emissions stems from assumptions regarding the cell 188
materials and the amount of these. Bauer (2010), Dunn et al. (2012) and Kim et al. (2016) do not provide a 189
contribution analysis of cell materials, which limits the discussion of cell-related emissions reported by these 190
studies. The majority of the studies are in good agreement with respect to GHG emissions associated with 191
graphite-based anodes, with emissions ranging between 7.5 and 9.9 kg CO2-eq/kWh (Ellingsen et al., 2014; 192
Notter et al., 2010; USEPA, 2013). Due to the binder used in the study by Majeau-Bettez et al. (2011), their 193
study report higher anode emissions at 18.2 kg CO2-eq/kWh. With a water solvent, Zackrisson et al. (2010) 194
report only 1.6 kg CO2-eq/kWh. Li et al. (2014) assess a LIB using silicon nanowire as anode material, which, 195
due to the very high energy demand of its synthesis, emits 130 kg CO2-eq/kWh. Except for the SiNW anode, 196
the study by Li et al. (2014) appears to be exclusively based on the USEPA (2013) study; thus in the remainder 197
of the text, we only refer to the results from the USEPA (2013) study. For the cathode, most studies find 198
emissions in the range of 16-19 kg CO2-eq/kWh (Ellingsen et al., 2014; Notter et al., 2010; Zackrisson et al., 199
2010), but Majeau-Bettez et al. (2011) report much higher emissions at 72 kg CO2-eq/kWh, which again is due 200
to the binder. The higher emission of 49 kg CO2-eq/kWh reported by USEPA (2013) is likely attributable to 201
the assumed larger amount of cathode materials in the cell. The studies find that the emissions related to the 202
electrolyte are relatively low, ranging from 2.1 to 3.9 kg CO2-eq/kWh (Ellingsen et al., 2014; Majeau-Bettez 203
et al., 2011; Zackrisson et al., 2010), although USEPA (2013) reports higher impact at 14.6 kg CO2-eq/kWh. 204
The reported emissions associated with the separator are also low, ranging between 0.4 and 2.2 kg CO2-205
eq/kWh. 206
Another source of differences in production-related GHG emissions is due to assumptions regarding other 207
battery components, such as battery electronics, thermal system, and packaging. The studies report a large 208
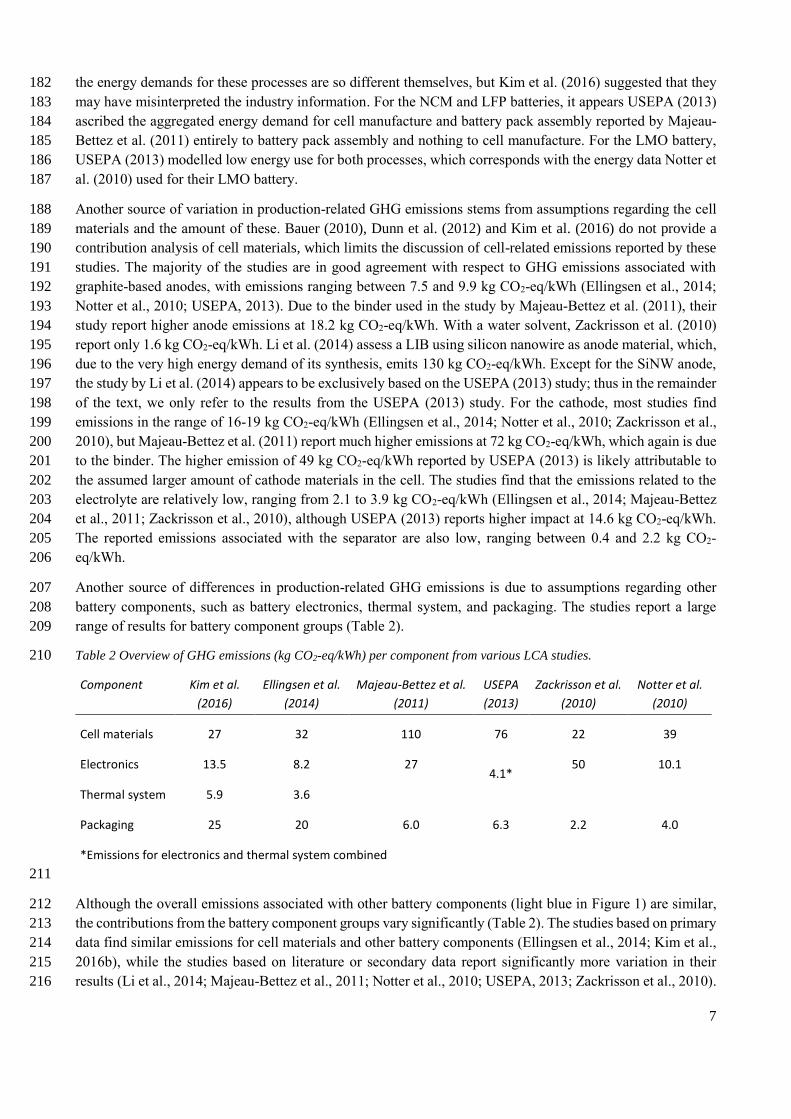
range of results for battery component groups (Table 2). 209
Table 2 Overview of GHG emissions (kg CO2-eq/kWh) per component from various LCA studies. 210
Component Kim et al.
(2016)
Ellingsen et al.
(2014)
Majeau-Bettez et al.
(2011)
USEPA
(2013)
Zackrisson et al.
(2010)
Notter et al.
(2010)
Cell materials 27 32 110 76 22 39
Electronics 13.5 8.2 27 4.1*
50 10.1
Thermal system 5.9 3.6
Packaging 25 20 6.0 6.3 2.2 4.0
*Emissions for electronics and thermal system combined
211
Although the overall emissions associated with other battery components (light blue in Figure 1) are similar, 212
the contributions from the battery component groups vary significantly (Table 2). The studies based on primary 213
data find similar emissions for cell materials and other battery components (Ellingsen et al., 2014; Kim et al., 214
2016b), while the studies based on literature or secondary data report significantly more variation in their 215
results (Li et al., 2014; Majeau-Bettez et al., 2011; Notter et al., 2010; USEPA, 2013; Zackrisson et al., 2010). 216
8
The latter studies seem to underestimate the amount of packaging that LIBs require and consequently report 217
lower packaging GHG emissions. The studies that find lower emissions from electronics and packaging had 218
very limited sub-inventories for these components. Furthermore, many of the studies did not include a thermal 219
system. The underestimation of the amount and weight of other battery components in LIBs results in the 220
studies modeling batteries with considerably higher gravimetric energy density than actual LIBs currently used 221
in electric vehicles. Because commercialized batteries have lower gravimetric energy density than that 222
assumed by many of the academic studies, they are heavier and therefore demand more energy during BEV 223
operation. Thus, the assumed high energy density by can potentially lead to underestimation of the GHG 224
emissions associated with both the production and the use phase. 225
2.2 Use phase 226
During use, the battery has indirect emissions that are influenced by the energy conversion losses, energy 227
required to carry the battery weight, and the carbon intensity of the electricity. The energy conversion losses 228
in the battery depends on the energy efficiency of the battery and the operational energy demand (Wh/km) of 229
the vehicles. Because it is difficult to find information regarding energy efficiency of LIBs, LCA studies often 230
make an assumption for the battery energy efficiency. Thus far, LCA studies have generally not taken into 231
account that different cell format types (e.g., pouch, cylinder, prismatic) and cathode materials (LMO, NCM, 232
LFP, NCA) offer different efficiencies (Mulder et al., 2013). USEPA (2013) assumed an energy efficiency of 233
85%, whereas Majeau-Bettez et al. (2011) and Zackrisson et al. (2010) assumed 90%. For the NCM pouch 234
cells in their study, Ellingsen et al. (2016b) used the measured energy efficiency of 95% (Ellingsen et al., 235
2014). Depending on the carbon intensity of the electricity used for charging and the operational energy 236
demand of the vehicle, the differences can significantly influence the total life cycle emissions of LIBs. With 237
a total driving distance of 180 000 km, Ellingsen et al., (2016b) find the indirect energy demands due to 238
conversion losses to cause 638 kg CO2-eq when charged with the average European electricity mix and 18 kg 239
CO2-eq when charged with purely wind-based electricity. Zackrisson et al. (2010) also evaluated how much 240
of the operational energy demand can be ascribed to the weight of a battery. The study estimated the total 241
energy use due to the battery weight based on the ratio of battery to vehicle weight, the share of operational 242
energy use due to total vehicle weight, the operational energy demand of the vehicle, total driving distance, 243
and the share of the time the PHEV was in electric mode. When charged with the average European electricity 244
mix for 180 000 km, indirect emissions associated with the battery weight results in a total of 236 kg CO2-eq. 245
2.3 End-of-life 246
At the EOL, useful components and materials can be reused or recycled. LIB recycling is typically a 247
combination of two or more processes (Hanisch et al., 2015). There are several competing industrial LIB 248
recycling processes, but very few LCA studies consider the emissions associated with the EOL treatment of 249
LIBs. Hawkins et al., (2012) model EOL treatment consisting of dismantling and a cryogenic chattering 250
process. Ellingsen et al. (2016b) compiled a recycling inventory based on secondary industry data for the 251
pyrometallurgical treatment described by Dewulf et al. (2010). Li et al. (2014) assume a combined direct 252
physical, hydro- and pyrometallurgical treatment process, but only consider the direct energy requirements for 253
this process. Dunn et al. (2012) and USEPA (2013) consider hydrometallurgical, intermediate physical, and 254
direct physical recycling. Dunn et al. (2012) report purchased energy consumption for this process. USEPA 255
(2013) obtained primary data from battery recyclers, but do not provide an EOL inventory. While Hawkins et 256
al., (2012), Ellingsen et al. (2016b), and Li et al., (2014) use the “recycled content” approach and report 257
emissions associated with recycling, USEPA (2013) and Dunn et al. (2012) use the “end-of-life" approach and 258
respectively report the reduction in emissions and total energy consumption that may be possible through 259
various recycling scenarios. Hawkins et al. (2012) and Ellingsen et al. (2016b) report 3.6 and 8.0 kg CO2-260
eq/kWh battery associated with recycling, respectively, while Li et al., (2014) report emissions of 27 kg CO2-261
eq/kWh battery. USEPA (2013) report emission reductions in the range of 16-32 kg CO2-eq/kWh battery for 262
9
the average EOL treatment options. Dunn et al. (2012) find that the use of recycled battery materials offers 263
reduced energy consumption compared to the use of virgin materials. Due to the lack of access to industry 264
data, there is large uncertainty associated with the use of materials (e.g., solvents) and energy. As a result, 265
there is also significant uncertainty associated with the reported results across all of the reviewed studies. 266
3 Discussion of LCA findings 267
We have reviewed the relevant LCA literature on LIBs and examined the key assumptions and differences 268
between the studies. We found that all of the reviewed studies have assessed the production impact, while only 269
a few have assessed the use and EOL stages. Below, we discuss the findings and evaluate the reliability of the 270
results and inventory data before we point out measures that can reduce life cycle GHG emissions of LIBs. 271
3.1 Evaluation and analysis of inventories and results 272
Energy demand in battery production has been much discussed in the LCA literature (Dunn et al., 2015, 2012, 273
Ellingsen et al., 2015, 2014; Kim et al., 2016b; Majeau-Bettez et al., 2011) and the literature reports two 274
opposing views. On one hand, we have studies that assume low energy demand in cell manufacture and find 275
that energy use has insignificant contributions to production-related GHG emissions. On the other hand, we 276
have studies that report high energy demand and consequently find this to be a main source of GHG emissions. 277
Below, we consider what we know of the cell manufacturing process and review the associated energy 278
demands. Cell manufacture is a complex and protracted process that places constraints on ambient conditions 279
and therefore requires strictly controlled environments (Schönemann, 2017; Wood et al., 2015). Due to the 280
proprietary nature of the industry, the information available on the various production steps and requirements 281
is limited and data are scarce. As a result, estimating energy demands of the various production steps in cell 282
manufacture is a formidable task. Having examined the inventories, we find that studies attempting to estimate 283
the energy demand seemingly omit or underestimate energy inputs for some production steps. Furthermore, 284
two independent LCA studies based on primary industry data report significant energy use. Although some 285
have suggested that the high energy demand may be due to low production volumes (Dunn et al., 2015), this 286
has been disputed (Ellingsen et al., 2015) and proved not to be the case (Kim et al., 2016b). Thus, we conclude 287
that cell manufacture is an energy-intensive process and a main contributor to production-related GHG 288
emissions of LIBs. Unlike cell manufacture, battery pack assembly does not place constraints on ambient 289
conditions and the main energy requirements are associated with welding, testing, and charging (Schönemann, 290
2017). The low energy inputs for pack assembly reported by the majority of the LCA studies thus seem 291
reasonable. 292
Further disagreements among the studies were due to assumptions regarding cell materials and other battery 293
components. For cell materials, some of the differences are the result of assumptions regarding material types 294
and the amount of these. In general, the studies agree that the cathode and the anode have, in that order, the 295
highest cell GHG emissions and that the contributions from the electrolyte and the separator are about an order 296
of magnitude smaller. At this point, we should also mention that not all of the cathode materials assessed by 297
LCA studies are used in LIBs for electric vehicles. Although LMO is a low-cost material that has safer 298
characteristics than NCA and NCM (Kim et al., 2012), it is only used as a blended cathode material with either 299
NCM or NCA (Anderman, 2016a) as it does not provide adequate energy density or lifetime for electric vehicle 300
applications when used alone (Ellingsen et al., 2016a). LFP provides excellent cycle stability and lifetime, but 301
the material is no longer used in commercial BEVs due to its low energy density (Anderman, 2016a; Ellingsen 302
et al., 2016a). Initially, LFP was used in the Chevy Bolt battery, but in 2015 it was substituted with NCM for 303
its higher energy density (Anderman, 2016a; Voelcker, 2014). LFP is, however, still used in some PHEVs 304
(Anderman, 2016b). Of the current cathode materials, NCM and NCA have the highest energy density 305
(Ellingsen et al., 2016a) and are the only unblended cathode materials used in commercial BEVs (Anderman, 306
2016a). Regarding other battery components, studies based on literature or secondary data seemingly misjudge 307
10
the amount of other battery components required for LIBs. Compared to the two studies based on primary 308
industry data, the other studies particularly underestimate the amount of packaging. In addition, many of the 309
studies have not included a thermal system. Thus, we deem the studies based on primary data sources to provide 310
higher certainty in the contribution of these components than those based on literature or secondary data 311
sources. 312
LIBs can be made with various anode and cathode materials and, as seen in Figure 1, this is reflected in the 313
LCA literature. If one only considers the overall production impact without examining the underlying 314
assumptions and differences, one could mistakenly draw the conclusion that the difference between the studies 315
is due to electrode materials. However, as we have uncovered in the text above and seen in Figure 1, the 316
difference in electrode materials is not the main driver to differences between the various studies, instead it is 317
primarily due to assumptions regarding energy demand and battery components. 318
For the use phase, studies mainly evaluate emissions as a product of energy conversion losses and the carbon 319
intensity of the electricity used for charging, while omitting emissions associated with the energy required to 320
transport the weight of the battery. The energy conversion losses depend on the energy efficiency of the battery 321
and the operational energy use of the vehicle. Although energy efficiency is cell-specific, a generic approach 322
assuming a certain energy efficiency has been used by most of the reviewed studies. To make evaluations of 323
the energy losses that are more realistic, studies should attempt to obtain and use energy efficiency data that 324
are representative for the analyzed electrode materials and cell format types. Similarly, rather than using energy 325
consumption data for vehicles based on driving cycle tests (e.g., the New European Driving Cycle) that often 326
underestimate operational energy use, using measured energy consumption data could provide higher 327
confidence in estimated energy conversion losses. Only one of the reviewed studies estimate the energy 328
required to transport the weight of the battery. A recent publication presents a new physics-based model that 329
captures the mass-induced energy demand for vehicles with different powertrains (Kim et al., 2016a), which 330
can be used to estimate the energy required to transport the battery in future studies. 331
LCA studies assessing battery recycling consider different recycling processes and generally suffer from poor 332
data quality. This results in high uncertainty with respect to the considered recycling alternatives, particularly 333
with respect to the use of materials and energy. LCA studies suggest that production of secondary metals from 334
battery recycling is less energy demanding than extraction of primary metals and that recycling in this way is 335
beneficial with respect to GHG emissions. 336
3.2 Potential for emission reductions 337
Based on the findings reported by the studies, we can point out various measures that can reduce the life cycle 338
GHG emissions of LIBs. Studies that report high energy demand in cell manufacture propose reducing energy 339
demand or using renewable energy sources as the most efficient measures to reduce GHG emissions associated 340
with battery production. Studies that assume low energy demand recommend recycling as an important 341
measure as it can reduce impacts associated with extraction of virgin metals. While lowering energy demands 342
and the use of recycled metals can both reduce the production-related impacts, the most efficient measure to 343
reduce GHG emissions is perhaps to manufacture cells in facilities that are supplied entirely by renewable 344
energy sources. Future cell manufacturing practices following this strategy are likely to produce battery cells 345
with lower GHG emissions than current practices that use electricity from the grid and heat from natural gas. 346
Battery recycling is an important source of secondary metals and can reduce the need of extracting primary 347
metals. As a result, battery recycling and the use of recycled metals in batteries may offer reductions in GHG 348
emissions and other environmental impacts. In the use phase, emissions can be reduced by lowering the energy 349
conversion losses. Thus, increasing the energy efficiency of the cells and reducing vehicular operational energy 350
demand can lower use phase emissions. Making lighter vehicles through material substitution and higher 351
energy density batteries may reduce operational energy demand, but it does not necessarily reduce the total 352
11
life cycle GHG emissions as production impacts may increase (Ellingsen et al., 2016a; Kim and Wallington, 353
2013). Therefore, lightweighting efforts of electric vehicles should be carefully evaluated through a holistic 354
life cycle perspective. Evidently, the use of cleaner energy sources in electricity production will reduce indirect 355
GHG emissions associated with the battery use phase. Unfortunately, the LCA literature on EOL treatment 356
offers little guidance, as there is limited access to primary data on any of the numerous recycling schemes. 357
4 Conclusion 358
In this article, we have examined the inventory data and results from LCA studies assessing the life cycle GHG 359
emissions of LIBs. Based on this, we conclude that the production phase is the main contributor to life cycle 360
GHG emissions of LIBs, while the use phase end EOL treatment hold much smaller contributions. Because 361
the various LCA studies report widely different results for the production of LIBs, there has been some 362
disagreement with respect to the amount and main sources of production-related emissions. As a result, the 363
LCA community has not been able to provide a unified answer about the production-related emissions of LIBs. 364
However, as the battery industry has provided primary data for recent studies, the data quality is much 365
improved and this increases confidence in the results. Furthermore, the studies based on primary data obtain 366
similar results and conclude that cell manufacture is energy-intensive. Consequently, we now have improved 367
information about the amount and main sources of production-related GHG emissions. As the production is 368
the main contributor to life cycle GHG emissions of LIBs, reducing production-related emissions is particularly 369
important and the use of renewable energy sources in cell manufacture may be a particularly effective measure. 370
Although the data quality and certainty of LCA studies assessing LIBs have increased, knowledge gaps still 371
exist. Primary energy data provided by the industry has proven that cell manufacture is energy demanding, but 372
more details about use of heat and electricity for the various production steps in cell manufacture is still 373
desirable. Such information could provide further insights as to how the battery industry can reduce energy 374
demand and GHG emissions. Furthermore, very few studies assess the use phase and EOL treatment, and the 375
data quality of these studies is low. Further research efforts are therefore required for these life cycle stages to 376
obtain higher confidence in the reported results, but this demands increased transparency and data from the 377
battery industry and recyclers. On their part, LCA practitioners should strive to be updated on the LIB 378
technology so that they assess relevant battery technologies, rather than chemistries that have already been 379
ruled out for use in LIBs for electric vehicles. The LIB technology is still progressing and continued LCA 380
efforts are necessary to provide updated information regarding improvement opportunities and the 381
sustainability of LIBs and electric vehicles. 382
383
Acknowledgement 384
The work was supported by the Research Council of Norway through the Centre for Sustainable Energy 385
Studies. 386
387
References 388
Anderman, M., 2016a. Extract from The Tesla Battery Report. 389
Anderman, M., 2016b. Extract from the Battery Pack of Modern xEVs Report. 390
Bauer, C., 2010. Ökobilanz von Lithium-Ionen Batterien [Life cycle assessment of lithium-ion batteries], Analyse der 391 Herstellung von Energiespeichern für den Einsatz in Batteriefahrzeugen. PSI, Technology Assessment / GaBE, 392 Villigen, Switzerland. 393
12
Dewulf, J., Van der Vorst, G., Denturck, K., Van Langenhove, H., Ghyoot, W., Tytgat, J., Vandeputte, K., 2010. 394 Recycling rechargeable lithium ion batteries: Critical analysis of natural resource savings. Resour. Conserv. Recycl. 395 54, 229–234. doi:10.1016/j.resconrec.2009.08.004 396
Dunn, J.B., Gaines, L., Kelly, J.C., James, C., Gallagher, K.G., 2015. The significance of Li-ion batteries in electric 397 vehicle life-cycle energy and emissions and recycling’s role in its reduction. Energy Environ. Sci. 8, 158–168. 398
Dunn, J.B., Gaines, L., Sullivan, J., Wang, M.Q., 2012. Impact of recycling on cradle-to-gate energy consumption and 399 greenhouse gas emissions of automotive lithium-ion batteries. Environ. Sci. Technol. 46, 12704–12710. 400 doi:10.1021/es302420z 401
Ellingsen, L.A.-W., Hung, C.R., Majeau-Bettez, G., Singh, B., Chen, Z., Whittingham, M.S., Strømman, A.H., 2016a. 402 Nanotechnology for environmentally sustainable electromobility. Nat. Nanotechnol. 11, 1039–1051. 403 doi:10.1038/nnano.2016.237 404
Ellingsen, L.A.-W., Majeau-Bettez, G., Singh, B., Srivastava, A.K., Valøen, L.O., Strømman, A.H., 2014. Life cycle 405 assessment of a lithium-ion battery vehicle pack. J. Ind. Ecol. 18, 113–124. doi:10.1111/jiec.12072 406
Ellingsen, L.A.-W., Majeau-Bettez, G., Strømman, A.H., 2015. Comment on “The significance of Li-ion batteries in 407 electric vehicle life-cycle energy and emissions and recycling’s role in its reduction” in Energy & Environmental 408 Science. J. Ind. Ecol. 19, 518–519. doi:10.1111/jiec.12309 409
Ellingsen, L.A.-W., Singh, B., Strømman, A.H., 2016b. The size and range effect: lifecycle greenhouse gas emissions of 410 electric vehicles. Environ. Res. Lett. 11, 1–8. doi:10.1088/1748-9326/11/5/054010 411
Hanisch, C., Diekmann, J., Stieger, A., Haselrieder, W., Kwade, A., 2015. Recycling of Lithium-Ion Batteries, in: 412 Handbook of Clean Energy Systems. pp. 1–24. doi:10.1002/9781118991978.hces221 413
Hawkins, T.R., Gausen, O.M., Strømman, A.H., 2012. Environmental impacts of hybrid and electric vehicles—a review. 414 Int. J. Life Cycle Assess. 17, 997–1014. doi:10.1007/s11367-012-0440-9 415
Hawkins, T.R., Singh, B., Majeau-Bettez, G., Strømman, A.H., 2012. Comparative Environmental Life Cycle Assessment 416 of Conventional and Electric Vehicles. J. Ind. Ecol. 17, 53–64. doi:10.1111/j.1530-9290.2012.00532.x 417
Hitachi Maxell Ltd., 2005. Environmental report. Tokyo, Japan. 418
Hitachi Maxell Ltd., 2003. Annual report. Tokyo, Japan. 419
IEA, 2009. Transport, Energy and CO2: Moving Toward Sustainability. 420
Kim, H.C., Wallington, T.J., 2013. Life-Cycle Energy and Greenhouse Gas Emission Benefits of Lightweighting in 421 Automobiles : Review and Harmonization. Environ. Sci. Technol. 47, 6089–6097. 422
Kim, H.C., Wallington, T.J., Sullivan, J.L., Keoleian, G.A., 2016a. Life Cycle Assessment of Vehicle Lightweighting: 423 Novel Mathematical Methods to Estimate Use-Phase Fuel Consumption. Environ. Sci. Technol. 50, 11226−11233. 424 doi:10.1021/acs.est.5b01655 425
Kim, H.C., Wallington, T.J., Arsenault, R., Bae, C., Ahn, S., Lee, J., 2016b. Cradle-to-Gate Emissions from a Commercial 426 Electric Vehicle Li-Ion Battery: A Comparative Analysis. Environ. Sci. Technol. 50, 7715–7722. 427 doi:10.1021/acs.est.6b00830 428
Kim, T.-H., Park, J.-S., Chang, S.K., Choi, S., Ryu, J.H., Song, H.-K., 2012. The Current Move of Lithium Ion Batteries 429 Towards the Next Phase. Adv. Energy Mater. 2, 860–872. doi:10.1002/aenm.201200028 430
Li, B., Gao, X., Li, J., Yuan, C., 2014. Life Cycle Environmental Impact of High-Capacity Lithium Ion Battery with 431 Silicon Nanowires Anode for Electric Vehicles. Environ. Sci. Technol. 48, 3047–3055. doi:10.1021/es4037786 432
Majeau-Bettez, G., Hawkins, T.R., Strømman, A.H., 2011. Life cycle environmental assessment of lithium-ion and nickel 433 metal hydride batteries for plug-in hybrid and battery electric vehicles. Environ. Sci. Technol. 45, 4548–54. 434 doi:10.1021/es103607c 435
Mulder, G., Omar, N., Pauwels, S., Meeus, M., Leemans, F., Verbrugge, B., De Nijs, W., Van Den Bossche, P., Six, D., 436 Van Mierlo, J., 2013. Comparison of commercial battery cells in relation to material properties. Electrochim. Acta 437 87, 473–488. doi:10.1016/j.electacta.2012.09.042 438
Nealer, R., Hendrickson, T.P., 2015. Review of Recent Lifecycle Assessments of Energy and Greenhouse Gas Emissions 439 for Electric Vehicles. Curr. Sustain. Energy Reports 66–73. doi:10.1007/s40518-015-0033-x 440
13
Nitta, N., Wu, F., Lee, J.T., Yushin, G., 2015. Li-ion battery materials: present and future. Mater. Today 18, 252–264. 441 doi:10.1016/j.mattod.2014.10.040 442
Notter, D.A., Gauch, M., Widmer, R., Wäger, P., Stamp, A., Zah, R., Althaus, H.-J., 2010. Contribution of Li-ion batteries 443 to the environmental impact of electric vehicles. Environ. Sci. Technol. 44, 6550–6. doi:10.1021/es903729a 444
Rydh, C.J., Sandén, B.A., Sande, A., Sandén, B.A., 2005. Energy analysis of batteries in photovoltaic systems. Part I: 445 Performance and energy requirements. Energy Convers. Manag. 46, 1957–1979. 446 doi:10.1016/j.enconman.2004.10.003 447
Saft, 2008. Annual Report 2008, Management. Saft Group SA, Bagnolet, France. 448
Samaras, C., Meisterling, K., 2008. Life cycle assessment of greenhouse gas emissions from plug-in hybrid vehicles: 449 implications for policy. Environ. Sci. Technol. 42, 3170–6. doi:10.1021/es702178s 450
Schönemann, M., 2017. Battery Production and Simulation, in: Herrmann, C., Kara, S. (Eds.), Multiscale Simulation 451 Approach for Battery Production Systems. Springer International Publishing, pp. 11–37. doi:10.1007/978-3-319-452 49367-1 453
Sims, R., Schaeffer, R., Creutzig, F., Cruz-Núñez, X., D’Agosto, M., Dimitriu, D., Meza, M.J.F., Fulton, L., Kobayashi, 454 S., Lah, O., McKinnon, A., Newman, P., Ouyang, M., Schauer, J.J., Sperling, D., Tiwari, G., Bruckner, T., 455 Bashmakov, I.A., Mulugetta, Y., Chum, H., Navarro, A. de la V., Edmonds, J., Faaij, A., Fungtammasan, B., Garg, 456 A., Hertwich, E., Honnery, D., Infield, D., Kainuma, M., Khennas, S., Kim, S., Nimir, H.B., Riahi, K., Strachan, 457 N., Wiser, R., Zhang, X., 2014. Transport., in: Edenhofer, O., Pichs-Madruga, R., Sokona, Y., Farahani, E., Kadner, 458 S., Seyboth, K., Adler, A., Baum, I., Brunner, S., Eickemeier, P., Kriemann, B., Savolainen, J., Schlömer, S., 459 Stechow, C. von, Zwickel, T., Minx, J.C. (Eds.), Climate Change 2014: Mitigation of Climate Change. Contribution 460 of Working Group III to the Fifth Assessment Report of the Intergovernmental Panel on Climate Change. 461 Cambridge University Press, Cambridge University Press, Cambridge, United Kingdom and New York, NY, USA. 462
Sousanis, J., 2011. World Vehicle Population Tops 1 Billion Units [WWW Document]. URL 463 http://wardsauto.com/ar/world_vehicle_population_110815 (accessed 9.16.15). 464
United States Environmental Protection Agency, 2013. Application of Life-Cycle Assessment to Nanoscale Technology: 465 Lithium-ion Batteries for Electric Vehicles. 466
Voelcker, J., 2014. 2015 Chevrolet Spark EV Switches Battery Cells; 82-Mile Range Remains [WWW Document]. Green 467 Car Reports. URL http://www.greencarreports.com/news/1092094_2015-chevrolet-spark-ev-switches-battery-468 cells-82-mile-range-remains (accessed 7.22.16). 469
Volkswagen AG, 2012. The e-mission. Electric mobility and the environment. Wolfsburg, Germany. 470
Wallington, T.J., Anderson, J.E., De Kleine, R.D., Kim, H.C., Maas, H., Brandt, A.R., Keoleian, G.A., 2016. When 471 Comparing Alternative Fuel-Vehicle Systems, Life Cycle Assessment Studies Should Consider Trends in Oil 472 Production. J. Ind. Ecol. doi:10.1111/jiec.12418 473
Wood, D.L., Li, J., Daniel, C., 2015. Prospects for reducing the processing cost of lithium ion batteries. J. Power Sources 474 275, 234–242. doi:10.1016/j.jpowsour.2014.11.019 475
Zackrisson, M., Avellan, L., Orlenius, J., 2010. Life cycle assessment of lithium-ion batteries for plug-in hybrid electric 476 vehicles - Critical issues. J. Clean. Prod. 18, 1519–1529. doi:DOI 10.1016/j.jclepro.2010.06.004 477
478