identifying hurricane impacts on barbuda using … · 3.1 field work:globe observer is nasa’s...
TRANSCRIPT

IDENTIFYING HURRICANE IMPACTS ON BARBUDA USING CITIZEN SCIENCE GROUND OBSERVATIONS, DRONE PHOTOGRAPHY AND SATELLITE IMAGERY
Rebecca Boger1 , Russanne Low2, Peder Nelson3
1 Brooklyn College, City University of New York2 Institute for Global Environmental Strategies, Arlington
3 College of Earth, Ocean, Atmospheric Sciences, Oregon State University
KEY WORDS: Barbuda, land cover, citizen science, hurricanes
ABSTRACT:
Barbuda is a low-lying leeward island in the West Indies. In September 2017 Hurricane Irma battered the island with 185 mph winds. Damage to housing and infrastructure was so extensive that all 1800 residents of the island were immediately evacuated post hurricane to the neighboring island of Antigua. Our research is focused on documenting and analyzing the landscape scalechanges that took place on the island as a result of the hurricane using a nested methodology. Ground level observations wererecorded using a beta version of the Global Learning and Observation to Benefit the Environment (GLOBE) Observer Land Cover tool. Aerial photographs provide medium scale landscape resolution. Satellite images were processed to provide NDVI values. Wedescribe how nested data at several spatial scales enable detailed description of Hurricane Irma’s impact across the landscape ofthis 62 sq. mile island. Here we are connecting observations at different spatial scales, using citizen science observations, aerial drone photography and satellite imagery to document and analyze hurricane impacts on the island of Barbuda, eastern Caribbean.
1. INTRODUCTION
This project employs both remotely-sensed and ground observational data in an effort to describe and quantify the environmental impacts of Hurricane Irma on the island of Barbuda in the West Indies. In September 2017, category 5 Hurricane Irma directly hit Barbuda and devastated the built and natural environments. The main human habitation zone of the island is the village of Codrington, located on the eastern side of Codrington Bay. Damage to Barbuda’s infrastructure was so extensive that the 1800 residents were under mandatory evacuation to the neighboring island of Antigua immediately following the extreme weather event. By early 2019, when this fieldwork took place, about half of the residents had returned and are now rebuilding their lives on the island (Boger, Perdikaris, and Rivera-Collazo, in Press).
Pre- and post- hurricane scientific visualizations of Barbuda using Normalized Difference Vegetation Index (NDVI) data provide a quantitative comparison of damage to vegetation zones (Figure 1). Damage resulted from both the storm surge that submerged the low-lying areas to the west and north, as well as high winds that uprooted vegetation and stripped off leaves. The storm surge from Hurricane Irma is estimated at over 2.4 meters (Cangialosi et al., 2018), which would have caused an inundation of about a third of the island (Figure 1).
Quantifying the impact of the hurricane event on Barbuda’s landscape is an important critical step guiding restoration of ecosystem communities. Periodic natural disturbance events such as hurricanes contribute to the characteristic vegetation and land cover of the island. Coastal habitats are the critical first line of defense from storm damage. Barbuda is fringed
by mangroves, known to significantly reduce both annual and catastrophic damages from storms through flood protection (Narayan et al., 2020).
Satellite data documenting land cover is available for both pre- and post- Hurricane Irma, but the classification land cover products is a challenge on small islands such as Barbuda, which display unique vegetation structures and highly fragmented vegetation complexes. Existing global land cover land use (LCLU) products have spatial resolutions ranging from 30 m – 4 km, resulting in highly heterogenous pixels averaging the spectral response of multiple land cover types (Révillion et al., 2019).
Figure 1: A (left): Hurricane Irma storm surge model. Areas in orange are within the storm surge area. The area in yellow, Palmetto Point, was likely flooded during the event. A value of 2.64 m was initially used as the height of terrain impacted by the storm surge and refined by ground observations and local informants. B and C: NDVI maps of Barbuda contrasting before (B) and after (C) Hurricane Irma hit in September 2017.
Data collected by citizen scientists is gaining recognition as potential and important source of data for research (Bonnie
The International Archives of the Photogrammetry, Remote Sensing and Spatial Information Sciences, Volume XLII-3/W11, 2020 PECORA 21/ISRSE 38 Joint Meeting, 6–11 October 2019, Baltimore, Maryland, USA
This contribution has been peer-reviewed. https://doi.org/10.5194/isprs-archives-XLII-3-W11-23-2020 | © Authors 2020. CC BY 4.0 License.
23

et al. 2014; Follett and Strezov, 2015; McKinley et al., 2017). The National Aeronautics and Space Administration’s (NASA) GLOBE Observer (observer.globe.gov) released the Land Cover app as part of the suite of tools available for use on the mobile GLOBE Observer app. Designed for use by citizen scientists, it enables the capture of photo validation data to accompany land cover classification in the field. A secondary goal of this project was to employ the mobile app in a research setting and make any recommendations for a future version so it best serves the needs of the land cover research community. Barbuda provides a variety of unique landscapes and environments where the methodologies and categories employed in the app can be applied and tested, to ensure the tool is appropriate for use in all land cover conditions.
To proceed with land cover classification of Barbuda’s terrain, this project initiated descriptive research documenting land cover characteristics. This report describes outcome of fieldwork conducted January 4-18, 2019, where aerial photography and ground observation of land cover were collected simultaneously for eventual application to development of a regional a tool to interpret satellite land cover data products.
Guiding questions used to develop the research design include:
Can ground observations of land cover be used tosupport classification of drone imagery and remotelysensed land cover observations from space?Can ground observations of storm surge or hurricanedamage be identified in the drone imagery and remotelysensed land cover data collected from space?Are the features and data collection capabilities of theGLOBE Observer land cover tool sufficient fordeployment in a scientific field research context.How well do the reported observations using theGLOBE Observer Land Cover tool correspond topublished maps and descriptions of Barbuda vegetationdata?
2. SITE LOCATION
Barbuda is a low-lying coral island of 161 square km in the Caribbean located midway along the island chain known as the Lesser Antilles. Barbuda is part of the nation of Antigua and Barbuda and is about 50 km northeast of its sister island (Figure 2). The highest elevations rise to 40 meters and are located toward the east in an area called the Highlands. There is a network of historic wells built during the Colonial period in the 1700 and 1800s that are fed by either springs or surface aquifers. The limestone interior of the island contains numerous sinkholes and caves that contain fresh water throughout the year. The soil is generally thin and nutrient-poor. The coastline is almost completely surrounded by fringing and barrier reefs teeming with extensive marine resources, some of the richest in the region
1 Data downloaded from WorldWeatherOnline.com
(Perdikaris and Hejtmanek 2014). The mangroves at the Codrington lagoon to the northwest are the home of one of the largest breeding colonies (after the Galapagos) of the Frigate birds (Fregata magnificens).
Figure 2: Location of Barbuda along the chain of islands that form the Lesser Antilles. The highest elevations on Barbuda are along the eastern side.
Barbuda has a tropical climate with wet and dry seasons and an average temperature in Codrington is 26.7 °C. Figure 3 shows the monthly average precipitation1; the driest months are January – March and the wettest months are August –November. The average annual rainfall is 924 mm.
Figure 3. Average monthly temperatures for Codrington, Barbuda. Source climate-data.org.
The Köppen- Geiger climate classification classifies Barbuda as an Aw, tropical savanna climate with non-
0
50
100
150
Jan
Feb
Mar Ap
rM
ay Jun Jul
Aug
Sep
Oct
Nov
Dec
Average Monthly Precipitation (mm)
The International Archives of the Photogrammetry, Remote Sensing and Spatial Information Sciences, Volume XLII-3/W11, 2020 PECORA 21/ISRSE 38 Joint Meeting, 6–11 October 2019, Baltimore, Maryland, USA
This contribution has been peer-reviewed. https://doi.org/10.5194/isprs-archives-XLII-3-W11-23-2020 | © Authors 2020. CC BY 4.0 License.
24

seasonal or dry-winter characteristics2. The surrounding ocean waters averages around 27°C with little variation. Barbuda is located within the Atlantic hurricane belt. Most hurricanes occur between August and October, with September being the month with the most hurricanes3.
3. METHODS
3.1 Field work: GLOBE Observer is NASA’s data collection and sharing mobile app developed for citizen science participation in Earth system observations. Ground observations and voucher photographs recorded by citizen scientists using this app are collected for use to augment the interpretation of data remotely sensed from space. The Land Cover tool provides a protocol for data collection. Users identify the centroid of their observational field. The app automatically identifies the latitude, longitude, date and time of observation. Observations are made in the four cardinal directions from the center point, and voucher photographs are taken to record the land cover observed in each direction. Up and down photographs provide information about the atmospheric conditions, vegetation canopy, as well as detail about low lying ground cover. A series of questions about the surface conditions (wet/dry) and phenology provide additional information.
To make an observation and photograph, the user is instructed to tilt the mobile device slightly downward so that approximately 50 m of the ground is observed in the photograph. A built-in compass function enables the user to point their mobile device in the cardinal directions without additional instruments.
Once photographs have been uploaded the device, there is a series of pull-down menus that enable the user to distinguish different vegetation growth forms (such as forests, wetlands, grasslands, barren) as well as some common land use features (such as structures, pavement, croplands, pastures, athletic fields, cemeteries) (Figure 4). The landcover features are identified in the app, and then the user is prompted to estimate the percentage cover of each of the cover types identified. Both ground cover and canopy cover are estimated.
The GLOBE Observer tool returns a land cover classification based on percent cover by applying the Modified UNESCO Classification. (MUC). This classification system is physiogmonic-structural in character and does not include cultural landcover types (i.e. messicol vegetation), nor other land cover classes that are needed to support classification of remotely sensed land cover data from satellites, so other categories have been added to the Land Cover tool to support those needs.
2 Climate-Data.org: https://en.climate-data.org/north-america/antigua-and-barbuda-165/#example03 NOAA historical hurricane tracks: https://coast.noaa.gov/hurricanes/
Figure 4. Screenshots of the GLOBE Observer Landcover tool. Left: voucher photographs of landcover for each cardinal direction. Middle: landcover elements available for selection by app user. Right: Slides enable user to estimate landcover in 10% increments.
One limitation of the GLOBE Observer app is that its data upload function is only available in countries where the government has agreed to share data with the GLOBE Program. Since the Nation of Antigua and Barbuda is not a GLOBE member country, Esri Survey1234 web-based tools were used to recreate the data fields within the GLOBE Observer (GO) Land Cover app, and exported data as acomma delimited file which was then brought into Excel for further analysis.
3.2 Drone Photography: A 3D Robotics Solo drone with a GoPro Hero 3 camera was flown at a 50-meter altitude. The open source Mission Planner5 was used to create the flight plans. Aerial photos were collected with 80% transect overlap and 80% consecutive photo overlap. Aerial drone photography was collected throughout the island at many locations where the land cover data were being collected. In this way, there was a coordination of map and side views of the vegetation cover estimates.
3.3 Computer Analysis: Although data can be directly brought into ArcGIS Pro, the data was first brought into Excel to edit the data and create summaries for total vegetative cover. The points with latitude and longitude values were brought into ArcGIS Pro. The individual photostaken with the drone were mosaiced with AgiSoft6. The orthrectified mosaiced image was then brought into ArcGIS Pro and overlayed with the point Survey123 data.
A search for Sentinel 2 (S2), and Landsat 8 (L8) imagery with less than 20% cloud cover per scene was done through GloVis7 for the time period of one month before or after the time of field collection. For S2 the best imagery was collected on February 1, 2019 and for L8, the best one was collected on December 4, 2018. Although there is nearly twomonths difference between the two dates, they are both within a similar period of rainfall and plant growth. The hurricane season is over and the dry season has not started in
4 https://survey123.arcgis.com/5 http://ardupilot.org/planner/6 https://www.agisoft.com/7 https://glovis.usgs.gov/
The International Archives of the Photogrammetry, Remote Sensing and Spatial Information Sciences, Volume XLII-3/W11, 2020 PECORA 21/ISRSE 38 Joint Meeting, 6–11 October 2019, Baltimore, Maryland, USA
This contribution has been peer-reviewed. https://doi.org/10.5194/isprs-archives-XLII-3-W11-23-2020 | © Authors 2020. CC BY 4.0 License.
25

full. The months of December and January have relatively moderate rainfall. So, although all three sets of imagery (Sentinel 2, Landsat 8, and drone) were not collected at exactly the same time, the vegetative cover should be similar to explore a nested analysis.
In ArcGIS Pro, composited images were created for both the L8 and S2 datasets. Bands 1-7 with 30-meter spatial resolution were composited for L8 while bands 2, 3, 4, and 8 with 10-meter resolution were composited for S2. In this way, NDVI images using the visible and Near Infrared bands could be created for 30-meter (L8) and 10-meter (S2) resolutions.
Fifty-meter buffers were created around the survey points to create an area around the citizen scientist on the ground for which the citizen scientist is asked to collect data about (e.g., percentages of vegetative ground and canopy cover). The buffers were then used to clip out the NDVI data and the drone imagery. Percent vegetative cover can be estimated from the drone imagery and compared to the estimates collected by the citizen scientist. NDVI data can be compared between the satellite imagery at the coarser and finer resolutions, as well as compared to the drone.
4. RESULTS
Land cover data using the Survey123 app was collected at 61 100-meter quadrants around the island. After data processing, 9 quadrants with incomplete data were removed from the study to ensure data quality, leaving 52 quadrants available for analysis (Figure 5). Drone photography were collected at 17 sites.
Figure 5: Location of survey points collected in January 2019.
To illustrate the process of comparison between citizen scientist collected data and satellite and drone imagery, one
site called Pie Crust will be shown. Figure 6 shows the two satellite datasets and the drone photography. The citizen scientist stands in the center and a 50-meter radius buffer shown in the red circle. The graduated green tones for the NDVI imagery goes from light to dark green, low to higher NDVI values. The Sentinel 2 data captures the variability of the landscape shown in the drone photography. This area is characterized by patchy shrub vegetation with exposed limestone bedrock and reddish-brown soil. There are large amounts of dead trees and branches that are remnants from Hurricane Irma (Figure 7).
Figure 6: Pie Crust site comparing NDVI for the Landsat imagery collected on December 4, 2018 at 30 meter resolution to the left, Sentinel 2 imagery collected on February 1, 2019 at 10 meter resolution, and the drone imagery collected on January 8, 2019 with a submeter resolution. NDVI images showed more contrast among individual pixels than either true-color or NIR false-color composites, especially for Sentinel 2 data. The diameter of the circles is 100 meters.
Figure 7: Close-up of the drone photography to show the exposed limestone, soil, dead trees, and green shrubs.
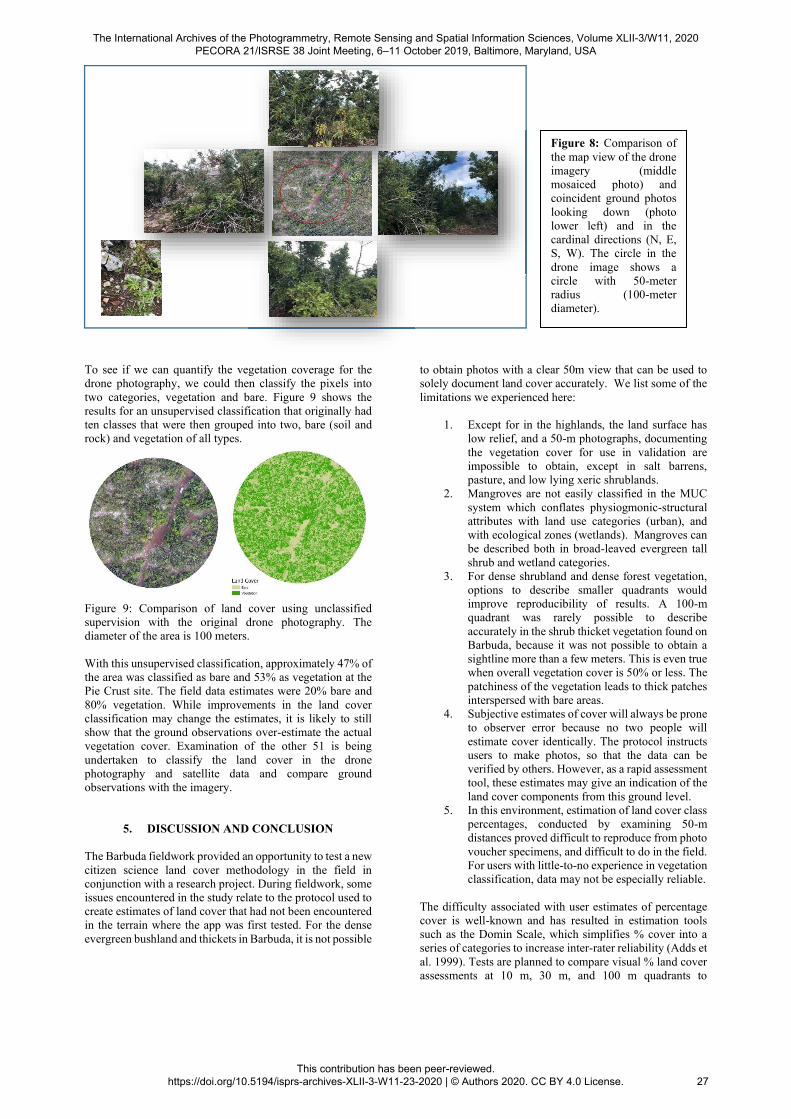
Figure 8 shows the drone photography in the center with the photos collected using the Survey 123 app going North, East, South, and West. The picture in the lower left shows theground where the observer was standing. At this particular site, vegetation cover was estimated each in the four directions and then averaged to give one value characterizing the entire 100-meter quadrant (or circle for the buffer analysis). A visual comparison indicates that there is a fairly good match between the ground estimates and the drone photography. Other sites with different vegetation coverage also seem to have a reasonable match.
The International Archives of the Photogrammetry, Remote Sensing and Spatial Information Sciences, Volume XLII-3/W11, 2020 PECORA 21/ISRSE 38 Joint Meeting, 6–11 October 2019, Baltimore, Maryland, USA
This contribution has been peer-reviewed. https://doi.org/10.5194/isprs-archives-XLII-3-W11-23-2020 | © Authors 2020. CC BY 4.0 License.
26
To see if we can quantify the vegetation coverage for the drone photography, we could then classify the pixels into two categories, vegetation and bare. Figure 9 shows the results for an unsupervised classification that originally had ten classes that were then grouped into two, bare (soil and rock) and vegetation of all types.
Figure 9: Comparison of land cover using unclassified supervision with the original drone photography. The diameter of the area is 100 meters.
With this unsupervised classification, approximately 47% of the area was classified as bare and 53% as vegetation at the Pie Crust site. The field data estimates were 20% bare and 80% vegetation. While improvements in the land cover classification may change the estimates, it is likely to still show that the ground observations over-estimate the actual vegetation cover. Examination of the other 51 is being undertaken to classify the land cover in the drone photography and satellite data and compare ground observations with the imagery.
5. DISCUSSION AND CONCLUSION
The Barbuda fieldwork provided an opportunity to test a new citizen science land cover methodology in the field in conjunction with a research project. During fieldwork, some issues encountered in the study relate to the protocol used to create estimates of land cover that had not been encountered in the terrain where the app was first tested. For the dense evergreen bushland and thickets in Barbuda, it is not possible
to obtain photos with a clear 50m view that can be used to solely document land cover accurately. We list some of the limitations we experienced here:
1. Except for in the highlands, the land surface haslow relief, and a 50-m photographs, documentingthe vegetation cover for use in validation areimpossible to obtain, except in salt barrens,pasture, and low lying xeric shrublands.
2. Mangroves are not easily classified in the MUCsystem which conflates physiogmonic-structuralattributes with land use categories (urban), andwith ecological zones (wetlands). Mangroves canbe described both in broad-leaved evergreen tallshrub and wetland categories.
3. For dense shrubland and dense forest vegetation,options to describe smaller quadrants wouldimprove reproducibility of results. A 100-mquadrant was rarely possible to describeaccurately in the shrub thicket vegetation found onBarbuda, because it was not possible to obtain asightline more than a few meters. This is even truewhen overall vegetation cover is 50% or less. Thepatchiness of the vegetation leads to thick patchesinterspersed with bare areas.
4. Subjective estimates of cover will always be proneto observer error because no two people willestimate cover identically. The protocol instructsusers to make photos, so that the data can beverified by others. However, as a rapid assessmenttool, these estimates may give an indication of theland cover components from this ground level.
5. In this environment, estimation of land cover classpercentages, conducted by examining 50-mdistances proved difficult to reproduce from photovoucher specimens, and difficult to do in the field.For users with little-to-no experience in vegetationclassification, data may not be especially reliable.
The difficulty associated with user estimates of percentage cover is well-known and has resulted in estimation tools such as the Domin Scale, which simplifies % cover into a series of categories to increase inter-rater reliability (Adds et al. 1999). Tests are planned to compare visual % land cover assessments at 10 m, 30 m, and 100 m quadrants to
Figure 8: Comparison of the map view of the drone imagery (middle mosaiced photo) and coincident ground photos looking down (photo lower left) and in the cardinal directions (N, E, S, W). The circle in the drone image shows a circle with 50-meter radius (100-meter diameter).
The International Archives of the Photogrammetry, Remote Sensing and Spatial Information Sciences, Volume XLII-3/W11, 2020 PECORA 21/ISRSE 38 Joint Meeting, 6–11 October 2019, Baltimore, Maryland, USA
This contribution has been peer-reviewed. https://doi.org/10.5194/isprs-archives-XLII-3-W11-23-2020 | © Authors 2020. CC BY 4.0 License.
27

determine whether citizen scientist evaluation of smaller quadrants produces outcomes with higher accuracy and if decreasing the size of sampling quadrants has potential significance for data applications in the classification and ground validation of remotely-sensed data.
6. FUTURE RESEARCH
The exploratory research here has potentially great significance, both in the ultimate creation of a land cover classification system honed for use in Caribbean island nations, but also in providing potential test data for newly developed tools now being tested in other regions. Révillion et al. (2019) recently released an object-based classification process in use interpreting terrain on small islands in the Indian Ocean, which is returning results with an accuracy of 86%. Continued development of land cover classification tools that work on small islands will require extensive field work and analysis, and both ground observations collected by both scientists and citizen scientists and drone photography will contribute to this goal.
The research discussed here is a component of a multiyear sustainability project conducted in collaboration with the Barbuda Archaeological Research Center, an NGO providing scientific and logistical support for visiting research scientists, located in Codrington, Barbuda.
7. REFERENCES
Adds, J. and Larkcom, E., 1999. Tools, techniques and assessment in biology: a course guide for students and teachers. Nelson Thornes.
Boger, R., Perdikaris,S., and Rivera-Collazo, I., 2019. Cultural heritage and local ecological knowledge under threat: Two Caribbean examples from Barbuda and Puerto Rico, Journal of Anthropology and Archaeology, 7(2): 1-14.
Bonney, R., Shirk, J.L., Phillips, T.B., Wiggins, A., Ballard, H.L., Miller-Rushing, A.J. and Parrish, J.K., 2014. Nextsteps for citizen science. Science, 343(6178), pp.1436-1437.
Cangialosi, J.P., Latto, A.S. and Berg, R., 2018. Hurricane Irma (AL112017). National Hurricane Center Tropical Cyclone Report.
Follett, R. and Strezov, V., 2015. An analysis of citizen science based research: usage and publication patterns. PloS one, 10(11), p.e0143687.
Küchler, A.W. and Zonneveld, I.S., 2012. Vegetation mapping (Vol. 10). Springer Science & Business Media.
McKinley, D.C., Miller-Rushing, A.J., Ballard, H.L., Bonney, R., Brown, H., Cook-Patton, S.C., Evans, D.M., French, R.A., Parrish, J.K., Phillips, T.B. and Ryan, S.F., 2017. Citizen science can improve conservation science, natural resource management, and environmental protection. Biological Conservation, 208, pp.15-28.
Narayan, S., Thomas, XC., Matthewman, J., Shepard, C., Geselbrach, L, Nzerem, K., Beck, M., 2020. Valuing the Flood Risk Reduction Benefits of Florida’s Mangroves. UC Santa Cruz and the Nature Conservancy. Downloaded from https://www.rms.com/assets/blt681abe87cb1cb8d6/Mangrove_Report_digital_FINAL.pdf.
Révillion, C., Attoumane, A. and Herbreteau, V., 2019. Homisland-IO: Homogeneous Land Use/Land Cover over the Small Islands of the Indian Ocean. Data, 4(2), p.82 -92.
Santiago-Valentin, E., Olmstead, R.G., 2004.. Historical Biogeography of Caribbean Plants: Introduction to Current Knowledge and Possibilities from a Phylogenetic Perspective. Taxon, vol. 53( 2): 299–319.
Wulder, M. A., Coops, N. C., Roy, D. P, White, J. C. and Hermosilla, T., 2018. Land cover 2.0, International Journal of Remote Sensing, 39:12, 4254-4284, DOI: 10.1080/01431161.2018.1452075
The International Archives of the Photogrammetry, Remote Sensing and Spatial Information Sciences, Volume XLII-3/W11, 2020 PECORA 21/ISRSE 38 Joint Meeting, 6–11 October 2019, Baltimore, Maryland, USA
This contribution has been peer-reviewed. https://doi.org/10.5194/isprs-archives-XLII-3-W11-23-2020 | © Authors 2020. CC BY 4.0 License.
28