identification of the tumour-associated gene s100a14 and
TRANSCRIPT
Identification of the tumour-associated gene S100A14 and analysis of its regulation
DISSERTATION
zur Erlangung des akademischen Grades
doctor rerum naturalium (Dr. rer. nat.)
im Fach Biologie
eingereicht an der
Mathematisch-Naturwissenschaftlichen Fakultät I
der Humboldt-Universität zu Berlin
von
Diplom-Biotechnologin Agnieszka Pietas
geb. am 14. April 1975 in Lublin, Polen
Präsident der Humboldt-Universität zu Berlin
Prof. Dr. Jürgen Mlynek
Dekan der Mathematisch-Naturwissenschaftlichen Fakultät I
Prof. Thomas Buckhout, PhD
Gutachter/innen: 1. Prof. Dr. Harald Saumweber
2. PD Dr. Christine Sers
3. Prof. Dr. Iver Petersen
Datum der Promotion: 22.11.2004
I
Table of Contents
List of Figures...................................................................................................... IV
List of Tables ...................................................................................................... VII
List of Abbreviations......................................................................................... VIII
Zusammenfassung............................................................................................... X
Abstract............................................................................................................... XII
1 Introduction...................................................................................................1
1.1 Multi-Step Progression of Tumours ............................................................1
1.2 The S100 Protein Family ............................................................................3
1.2.1 Genomic Organization and Chromosomal Localization of
S100 Genes .......................................................................................4
1.2.2 Biological Functions ...........................................................................5
1.2.3 Association with Human Diseases .....................................................7
1.3 Aim of This Work ......................................................................................10
2 Materials and Methods ...............................................................................11
2.1 Materials ...................................................................................................11
2.1.1 Chemicals ........................................................................................11
2.1.2 Kits ...................................................................................................11
2.1.3 Materials...........................................................................................12
2.1.4 Enzymes ..........................................................................................12
2.1.5 Antibodies ........................................................................................12
2.1.6 Mammalian Cell Lines ......................................................................13
2.1.7 E. coli Strain .....................................................................................15
2.1.8 RNA Samples from Mammalian Cell Lines ......................................15
2.1.9 Tissue Specimens............................................................................16
2.1.10 Plasmids and Expression Constructs ...............................................16
2.1.11 Oligonucleotides...............................................................................18

II
2.2 Methods....................................................................................................19
2.2.1 Bacterial Culture...............................................................................19
2.2.2 Culturing of Mammalian Cells ..........................................................21
2.2.3 Preparation, Enzymatic Manipulation and Analysis of DNA .............26
2.2.4 Dual-Luciferase Reporter Assay ......................................................33
2.2.5 Preparation and Analysis of RNA.....................................................34
2.2.6 Analysis of Proteins..........................................................................38
2.2.7 S100A14 Antibody Generation.........................................................44
2.2.8 Immunofluorescence Analysis..........................................................45
2.2.9 Immunohistochemistry .....................................................................46
2.2.10 Tissue Microarrays (TMA) Generation .............................................48
2.2.11 Statistical Analysis............................................................................48
2.2.12 Bioinformatics...................................................................................48
3 Results.........................................................................................................50
3.1 Identification of the Human S100A14 cDNA .............................................50
3.1.1 Screening of SSH cDNA Libraries....................................................50
3.1.2 Sequence Analysis of S100A14 cDNA.............................................51
3.2 Expression Profile in Tumour Cell Lines, Normal, and
Neoplastic Tissues....................................................................................53
3.2.1 S100A14 mRNA Level in Tumour Cell Lines....................................53
3.2.2 Expression Profile in Normal Human Tissues ..................................56
3.2.3 S100A14 mRNA Level in Tumour Tissues .......................................58
3.2.4 S100A14 Protein Expression in Lung Tumours and
Association with Clinicopathological Factors....................................60
3.2.5 S100A14 Protein Expression in Breast Tumours and
Association with Clinicopathological Factors....................................62
3.2.6 S100A14 is not Re-Expressed Following Growth of
Human Cancer Cell Lines Transplanted into Mice ...........................65
3.3 Subcellular Localization of the S100A14 Protein ......................................66
3.4 Genomic Organization and Chromosomal Localization of the
S100A14 Gene .........................................................................................69

III
3.5 Identification and Characterization of the Promoter for the
S100A14 Gene .........................................................................................75
3.6 ERBB Ligands Induce S100A14 Expression at the
Transcriptional Level in 9442 Cells ...........................................................79
3.6.1 Effects of Signalling Pathways Inhibition on Activation of
S100A14 by the EGF .......................................................................82
3.6.2 EGF-Induced S100A14 Gene Expression is Dependent on
de novo Protein Synthesis................................................................86
3.7 Transcriptional Induction by Protein Kinase C ..........................................87
4 Discussion...................................................................................................89
4.1 Identification of the S100A14 cDNA..........................................................89
4.2 S100A14 is Differentially Expressed in Human Tumours .........................90
4.3 Identification and Characterization of the Genomic Locus of
S100A14 ...................................................................................................96
4.4 Oncogenic Signalling Pathways Mediate S100A14
Transcriptional Induction.........................................................................100
5 References ................................................................................................110
Danksagung.......................................................................................................127
Curriculum Vitae................................................................................................129
Publications .......................................................................................................130
Eidesstattliche Erklärung .................................................................................132
IV
List of Figures
Fig. 1 The S100 gene cluster on human chromosome 1q21............................5
Fig. 2 The scoring system used for immunohistochemical analysis
of S100A14...........................................................................................47
Fig. 3 Nucleotide and deduced amino acid sequence of the human
S100A14 gene......................................................................................52
Fig. 4 Alignment of the predicted amino acid sequences of the
human S100A14 and the mouse orthologue 1110013O05RIK
with the most homologous S100 family members ................................53
Fig. 5 Expression of the S100A14 mRNA in normal human tissues...............57
Fig. 6 Expression profile of S100A14 in human tumours................................59
Fig. 7 S100A14 protein is overexpressed in primary lung tumour
tissue in comparison to normal lung tissue...........................................60
Fig. 8 S100A14 localizes to plasma membrane in lung tumour
tissue ....................................................................................................61
Fig. 9 S100A14 protein is up-regulated in primary breast carcinoma
relative to normal breast tissue.............................................................63
Fig. 10 S100A14 overexpression correlates with ERBB2
overexpression in primary breast tumours............................................63
Fig. 11 S100A14 localizes to plasma membrane in breast cancer
tissue ....................................................................................................64
Fig. 12 S100A14 is not re-expressed in lung cancer cell line
xenografts from nude mice ...................................................................65
Fig. 13 Cellular localization of S100A14-V5 protein in human lung
tumour and COS-7 cells .......................................................................67
Fig. 14 Subcellular localization of the endogenous S100A14 protein
in immortalized lung cells, and lung and colon tumour cells .................68
Fig. 15 The S100A14 protein is distributed through the cytoplasmic
and membranous fractions of 9442 cells ..............................................69
Fig. 16 Southern blot analysis of the genomic PAC clones positive
for S100A14 .........................................................................................71

V
Fig. 17 Genomic structure of the human S100A14...........................................72
Fig. 18 Southern blot analysis of the S100A14 gene in lung cancer
cell lines................................................................................................73
Fig. 19 Chromosomal localization of S100A14 by FISH...................................73
Fig. 20 S100A14 is localized within the S100 gene cluster on human
chromosome 1q21................................................................................74
Fig. 21 Transcription activities of S100A14 promoter constructs......................76
Fig. 22 Comparison of nucleotide sequence and potential regulatory
elements of the S100A14 promoter fragment in mouse and
human genomic DNAs..........................................................................78
Fig. 23 Up-regulation of S100A14 expression in H322 cells after
stimulation with serum..........................................................................79
Fig. 24 Treatment of 9442 and HMEB cells with EGF leads to the
induction of S100A14 ...........................................................................79
Fig. 25 S100A14 is induced by EGF in a time-dependent manner in
9442 cells .............................................................................................80
Fig. 26 Induction of S100A14 is EGF dose-dependent ....................................80
Fig. 27 TGF-α induces S100A14 mRNA in 9442 cells......................................81
Fig. 28 Up-regulation of S100A14 expression in 9442 cells after
stimulation with fresh medium ..............................................................81
Fig. 29 S100A14 protein is not induced following treatment with EGF .............82
Fig. 30 Kinetics of the growth factor-induced response for the
ERK1/2, p38, and JNK MAPK pathways and the PI3K
cascade ................................................................................................83
Fig. 31 The inhibitory efficacy of various pharmacological agents on
activation of the ERK1/2, p38, and JNK MAPK pathways and
the PI3K cascade .................................................................................84
Fig. 32 ERK1/2 MAPK signalling pathway determines S100A14
induction following stimulation with EGF ..............................................85
Fig. 33 EGF-induced S100A14 expression is dependent on de novo
protein synthesis...................................................................................86
Fig. 34 PMA exerts stimulation of S100A14 via PKC activation .......................88
Fig. 35 Generic S100 gene structure................................................................97
VI
Fig. 36 Pharmacological modulation of the ERBB-induced signalling
pathways ............................................................................................102
Fig. 37 Schematic representation of the signalling pathways leading
to S100A14 up-regulation in response to EGF and PMA in
9442 cells ...........................................................................................107

VII
List of Tables
Table 1 S100 proteins: functions and association with human
diseases .................................................................................................7
Table 2 Expression of S100A14 mRNA in human cancer cell lines ..................54
Table 3 Expression of S100A14 mRNA in other mammalian cell lines .............55
Table 4 Expression of the S100A14 protein in normal human tissues ..............58
Table 5 Association of S100A14 protein expression in lung tumours
with clinicopathological factors .............................................................62
Table 6 Association of S100A14 protein expression in breast tumours
with clinicopathological factors .............................................................65
Table 7 Exon/intron boundaries of the human S100A14 gene ..........................72

VIII
List of Abbreviations
A Adenine aa Amino acid ADC Adenocarcinoma APS Ammonium Persulphate Asp Asparagine ATCC American Type Culture Collection bp Base pair BSA Bovine Serum Albumine C Cytosine Ca Carcinoma cDNA Complementary DNA CIAP Calf Intestinal Alkaline Phosphatase Da Dalton DABCO 1,4-Diazabicyclo (2,2,2)-octane DAPI 4,6-Diamidino-2-phenylindole hydrochloride DEPC Diethylpyrocarbonate DMEM Dulbecco Modified Eagle’s Medium DMF Dimethylformamide DMSO Dimethyl Sulfoxide DNA Deoxyribonucleic Acid dNTP Deoxyribonucleoside Triphosphate DTT Dithiothreitol FCS Fetal Calf Serum EB Elution Buffer E.coli Escherichia coli EDTA Ethylendiamin-tetra-acetate EGF Epidermal Growth Factor EGFP Enhanced Green Fluorescent Protein ER Oestrogen Receptor ERBB Avian erythroblastic leukemia viral oncogene FITC Fluorescein Isothiocyanate G Guanine Glu Glutamine Gly Glycine h Hour IPTG Isopropyl-I-thio-β-D-galactopyranoside KLH Keyhole Limpet Hemocyanin l Liter L-15 Leibovitz-15

IX
LB Luria-Bertani LAR II Luciferase Assay Reagent II LCLC Large Cell Lung Carcinoma M Molar mM Milimol min Minute ml Mililiter MOPS 3-(N-Morpholino)-propanylsulfon acid NFĸB Nuclear factor ĸB NSCLC Non-Small Cell Lung Cancer nt Nucleotide OD Optical Density ORF Open Reading Frame PAGE Polyacrylamide Gel Electrophoresis PBS Phosphate Buffered Saline PCR Polymerase Chain Reaction PKC Protein Kinase C PMA Phorbol 12-myristate 13-acetate PMSF Phenyl Methyl-Sulfonyl Fluoride PR Progesteron rpm Rotations per minute RPMI Rosewell Park Memorial Institute RTK Receptor tyrosine kinase SCC Squamous Cell Carcinoma SCLC Small Cell Lung Carcinoma SDS Sodium Dodecyl Sulphate sec Second Ser Serine SSC Sodium chloride-Sodium Citrate T Thymine Ta Annealing Temperature TBE Tris-Boric acid-EDTA TBST Tris-Buffered Saline Tween-20 TEMED N,N,N’,N’-Tetramethylethylendiamine TGF-α Transforming Growth Factor-α Tm Melting Temperature Tris Tris-(hydroxymethyl)-aminomethan U Unit UTR Untranslated region V Volt X-gal 5-bromo, 4-chloro-3-indol-β-D-galactopyranoside µl Microliter µM Micromolar

X
Zusammenfassung
Durch Analyse der Subtraktion-cDNA Bibliothek einer humanen Lungentumor
Zelllinie haben wir ein neues Mitglied der S100 Genfamilie identifiziert und
charakterisiert, welches S100A14 benannt wurde. Die vollständige cDNA hat eine
Länge von 1067 bp und kodiert für ein Protein von 104 Aminosäuren, welches die
S100-spezifische Kalzium-bindende Domäne enthält und die größte Homologie zu
S100A13 zeigt. Das Gen wird in normalen humanen Epithelien ubiquitär
exprimiert, zeigt jedoch Expressionsverluste in vielen Tumorzelllinien aus
unterschiedlichem Gewebe. Im Gegensatz zu Tumorzelllinien ist S100A14 auf
mRNA- und Proteinebene in vielen humanen Primärtumoren stärker exprimiert,
unter anderem in Lungen- und Brustkarzinomen. Das Protein ist vorzugsweise in
der Region der Plasmamembran und im Zytoplasma lokalisiert.
Das Gen liegt auf Chromosom 1 im Bereich der Bande 1q21, einer Region
mit hoher chromosomaler Instabilität in Malignomen, in der sich auch mindestens
16 weitere S100 Gene befinden. Es ist aus vier Exons und drei Introns aufgebaut
und erstreckt sich über 2165 bp genomischer DNA.
In der 5´ Region proximal der transkriptionellen Initiationsstelle des S100A14
Gens wurde mit Hilfe von Deletionsmutationen eine minimale Promoteregion
identifiziert, die vermutlich zur basalen Promoteraktivität beiträgt. Um den Mechanismus der erhöhten S100A14 Expression in Lungen- und
Brustkarzinomen zu verstehen, haben wir die Effekte des EGF (epidermal growth
factor) und des TGF-α (transforming growth factor-α) untersucht. Beide Faktoren
sind Liganden des ERBB Rezeptors und induzieren in der immortalisierten
bronchialen Epithelzelllinie S100A14 Expression. Unter Verwendung spezifischer
Inhibitoren konnte gezeigt werden, dass für die EGF-vermittelte transkriptionelle
Induktion der ERK1/2 Signalweg (extracellular signal-regulated kinase)
verantwortlich ist und eine de novo Proteinsynthese erfordert. Diese Ergebnisse
unterstützend konnte immunhistologisch eine signifikante Korrelation zwischen der
Überexpression von ERBB2 und S100A14 in primären Brustkarzinomen
nachgewiesen werden.

XI
Phorbolester-12-Myristat-13-Acetat (PMA) verstärkte gleichfalls die S100A14
mRNA Expression in 9442 Zellen, was eine Regulation durch die Protein Kinase C
(PKC) vermuten lässt. Die PMA-induzierte Expression von S100A14 wird ebenso
wie die TGF-α/EGF-Induktion durch die Aktivierung des ERK1/2 Signalweges
vermittelt.
In Anbetracht der großen Bedeutung der ERK1/2 und PKC Signalwege in der
Tumorentstehung und Tumorprogression ist zu vermuten, dass S100A14 über die
aberrante Regulation dieser Signalwege an die maligne Transformation gekoppelt
ist.
Schlagwörter: S100A14, S100, EGF, TGF-α, PKC, PMA, ERK1/2
XII
Abstract
By analysing a human lung tumour cell line subtraction cDNA library, we have
identified and characterized a novel member of the human S100 gene family that
we designated S100A14. The full-length cDNA is 1067 bp and encodes a putative
protein of 104 amino acids. The predicted protein contains the S100-specific EF-
hand calcium-binding domain and shares the highest sequence homology to
S100A13. The gene is ubiquitously expressed in normal human tissues of
epithelial origin, with the highest expression in colon. S100A14 transcript was
found to be down-regulated in many immortalized and tumour cell lines from
diverse tissues. In contrast to the tumour cell lines, S100A14 shows up-regulation
at the mRNA and protein level in many human primary tumours, including lung and
breast carcinomas. S100A14 protein localizes predominately to the plasma
membrane and the cytoplasm.
We localized the S100A14 gene to a region of chromosomal instability on
human chromosome 1q21, where at least 16 other S100 genes are clustered. We
subsequently resolved the gene structure of S100A14 in human by demonstrating
its organization of four exons and three introns spanning a total of 2165 bp of
genomic sequence. By analysing the proximal 5’ upstream region of the S100A14
transcription initiation site, we identified the minimal promoter region which
possibly contributes to the basal activity of the promoter fragment.
To elucidate mechanisms whereby S100A14 expression is enhanced in lung
and breast tumours, we studied the effects of epidermal growth factor (EGF) and
transforming growth factor-α (TGF-α) on its expression. Both are ligands of ERBB
receptor and induced S100A14 expression in the immortalized bronchial epithelial
cells. By use of specific inhibitors, we found that EGF-mediated transcriptional
induction of S100A14 involves extracellular signal-regulated kinase (ERK1/2)
signalling and requires de novo protein synthesis. In support of these findings, we
demonstrated by immunohistochemistry a significant correlation between ERBB2
and S100A14 protein overexpression in primary breast carcinomas.
Our studies showed that the phorbol ester 12-myristate 13-acetate (PMA)
increases S100A14 mRNA expression in immortalized bronchial epithelial cells

XIII
suggesting regulation by protein kinase C (PKC). Similar to TGF-α/EGF induction,
the PMA-induced S100A14 expression was also mediated by activation of the
ERK1/2 signalling cascade.
Considering the importance of the ERK1/2 and PKC signalling pathways in
tumour development and progression we suggest that it is the aberrant regulation
of these signalling cascades that couples S100A14 to malignant transformation.
Keywords: S100A14, S100, EGF, TGF-α, PKC, PMA, ERK1/2

1
1 Introduction
1.1 Multi-Step Progression of Tumours Several lines of evidence indicate that tumorigenesis in humans is a multi-step
process, formally analogous to Darwinian evolution, in which a succession of
genetic and epigenetic changes, each conferring a different type of growth
advantage, leads to the progressive conversion of normal cells into cancer cells
(Nowell, 1976). The accumulation of genetic changes liberates neoplastic cells
from the homeostatic mechanisms that govern normal cell proliferation.
Observations of human cancers and animal models implicate a limited number of
molecular pathways, the disruption of which contributes to most cancers. In
humans, at least four to six distinct somatic mutations are required to reach this
state (Renan, 1993; Kinzler et al., 1996).
Several properties are shared by most of human tumours: self-sufficiency in
growth signals, insensitivity to growth-inhibitory signals, evasion of programmed
cell death (apoptosis), limitless replicative potential, sustained angiogenesis, and
tissue invasion and metastasis (Hanahan and Weinberg, 2000). Each of these
novel capabilities acquired during tumour development represents the successful
breaking of an anti-cancer defense mechanism applied by cells and tissues.
Molecular studies have identified three groups of genes, which are frequently
deregulated in cancer:
1. proto-oncogenes, which are activated by mutations and become
oncogenes. Their acquired oncogenic functions lead to uncontrolled
cellular growth and proliferation.
2. tumour-suppressor genes, which normally negatively regulate cell growth
and proliferation preventing the development of tumour. Loss or
mutational inactivation of these genes leads to the deregulation of cell
cycle progression as well as other intracellular processes resulting in
cancer progression.
3. genes responsible for maintaining the genomic integrity and genes
encoding the DNA-repair system. Loss of function of these genes results
in a genetic instability that is characteristic of tumour cells.

Introduction 2
Development of gene-expression profiling as well as advances in tumour
diagnosis revealed, however, a striking conceptual inconsistency in the prevailing
multi-step model of tumour progression (Bernards and Weinberg, 2002). Gene-
expression pattern of metastatic tumour cells is often strikingly similar to that of the
cells confined to the primary tumour mass from which they were derived. Equally
relevant are other studies in which the gene-expression profiles of the dominant
populations of breast-cancer cells within a primary tumour mass have been used
to predict, with 90% accuracy, whether the tumour will remain localized or whether
the patient will experience metastases and disease relapse.
Based on these findings, it is suggested that a subset of the mutant alleles
acquired by incipient tumour cells early in tumorigenesis confer not only the
selected replicative advantage, but also, later in tumorigenesis, the tendency to
metastasize. This tendency will become manifest only much later in tumour
progression, in the context of yet other mutations that have struck the genomes of
descendant cells.
This reasoning has important implications. First, genes and genetic changes
specifically and exclusively involved in orchestrating the process of metastasis do
not exist. Instead, it is the particular combination of genes that enables cells to
create primary tumour mass that also empowers them to become metastatic.
Second, because important components of the genotype of metastasis are already
implanted in cells relatively early in tumorigenesis, even relatively small primary
tumour cell populations may already have the ability to dispatch metastatic cells to
distant sites in the body.
Moreover, several independent lines of evidence seem to support the idea
that tumorigenesis is governed not only by the tumour cells per se, but also by the
microenvironment (Chang and Werb, 2001). For example, tumour-associated
fibroblasts can direct tumour progression (Olumi et al., 1999), and endothelial cells
foster tumour angiogenesis (Carmeliet and Jain, 2000). Inflammatory cells might
also promote tumour development, as shown by studies on skin tumorigenesis in
K14-HPV16 transgenic mice that lack mast cells or metalloproteinase-9 (Coussens
et al., 1999; Coussens et al., 2000).

Introduction 3
1.2 The S100 Protein Family Calcium (Ca2+) functions as a universal second messenger that plays a regulatory
role in a great variety of cellular processes such as memory and transmission of
nerve impulses, muscle contraction, secretion, cell motility and volume regulation,
cell growth and differentiation, gene expression, cross-talk between different
enzyme systems, apoptosis, and necrosis (Berridge et al., 2000). The Ca2+
signalling networks are composed of many molecular components including the
large family of Ca2+-binding proteins characterized by the EF-hand structural motif
(Kawasaki et al., 1998). Certain members, notably calbindin D28k and
parvalbumin, serve as cytosolic Ca2+ buffers, whereas others, such as calmodulin,
troponin C, and the S100 proteins, are Ca2+-dependent regulatory proteins.
S100 proteins represent the largest subgroup within the EF-hand protein
family. They have received increasing attention in recent years due to their
association with various human pathologies including cancer, neurodegenerative
disorders, inflammation, and cardiomyopathy (Heizmann et al., 2002). Moreover,
they have been of value in the diagnosis of these diseases. Twenty-two members
have been identified so far. Unlike the ubiquitous calmodulin, most of them show
cell- and tissue-specific expression.
S100 proteins are small (10 to 12 kDa) acidic proteins that form homo- and
heterodimers. They are characterized by a pair of helix-loop-helix (the EF-hand)
motifs connected by a central hinge region. The two EF-hand structural motifs
display different affinities for calcium. The C-terminal EF-hand contains the
canonical Ca2+-binding loop consisting of 12 amino acids. The N-terminal EF-hand
consists of 14 amino acids and is specific for S100 proteins. Upon Ca2+ binding
S100 proteins undergo a conformational change required for target recognition
and binding. Generally, the dimeric S100 proteins bind four Ca2+ per dimer.
Besides Ca2+, a number of S100 proteins bind Zn2+ with a wide range of affinities.
For S100B, S100A5, and S100A13 Cu2+ binding was reported (Nishikawa et al.,
1997; Schäfer et al., 2000; Mandinova et al., 2003).
Another distinguishing feature of S100 proteins is that individual members
are localized within specific cellular compartments from which some of them re-
locate upon Ca2+ or Zn2+ activation (Davey et al., 2001). A signalling event is thus
transduced in a temporal and spatial manner by specific targeting for each S100

Introduction 4
protein. Furthermore, some S100 proteins are secreted from cells acting in a
cytokine-like manner. The individual members are believed to utilize distinct
pathways (ER-Golgi route, tubulin- or actin-dependent) for their translocation/
secretion into the extracellular space (Hsieh et al., 2002). S100B and S100A12
specifically bind to the surface receptor RAGE (receptor for advanced glycation
endproduct) – a multiligand member of the immunoglobulin superfamily (Schmidt
et al., 2000). The extracellular levels of S100B thereby play a crucial role in that
nanomolar concentrations of S100B have trophic effects on cells whereas
pathological levels (as found in Alzheimer’s patients) induce apoptosis (Huttunen
et al., 2000).
Characteristic of the S100 protein family is that most S100 genes form a
cluster on human chromosome 1q21, a region frequently involved in chromosomal
rearrangements and deletions in human cancers (Schäfer et al., 1995; Weterman
et al., 1996; Gendler et al., 1990).
S100 proteins were recently found to be reliable diagnostic markers for
hypoxic brain damage and for monitoring the outcome after cardiac arrest (S100B;
Böttiger et al., 2001), acute myocardial infarction (S100A1; Kiewitz et al., 2000),
amyotrophic lateral sclerosis (S100A6; Hoyaux et al., 2000), for the classification
of astrocytomas and glioblastomas (Camby et al., 2000; Camby et al., 1999),
melanoma metastasis formation (S100B; Krähn et al., 2001), as prognostic
indicators for gastric cancer (S100A4; Yonemura et al., 2000), laryngeal (S100A2;
Lauriola et al., 2000) and esophageal squamous cell carcinomas (S100A4;
Ninomiya et al., 2001), and for breast cancer (Platt-Higgins et al., 2001).
1.2.1 Genomic Organization and Chromosomal Localization of S100 Genes
The structural organization of S100 genes is highly conserved both within an
organism and in different species (Heizmann et al., 2002). A typical S100 gene
consists of three exons whereby the first exon carries exclusively 5’ untranslated
sequences. The second exon contains the ATG translation start codon and codes
for the N-terminal EF-hand, and the third exon encodes the carboxy-terminal
canonical EF-hand. Presently, 16 S100 genes are found in a tight gene cluster on
human chromosome 1q21 within a genomic region of 260 kb (Fig. 1).

Introduction 5
Fig. 1 The S100 gene cluster on human chromosome 1q21. Genes located in the cluster region are indicated as well as two commonly used genomic markers (D1S1664 and D1S2346). p and q indicate the short and the long arm of the chromosome, respectively.
Four additional S100 genes are found on other human chromosomes: Xp22
(calbindin-D9K), 21q22 (S100B), 4p16 (S100P) and 5 (S100Z). Within the gene
cluster, epidermal differentiation genes as well as a gene of unknown function
called NICE2 interrupt the S100 genes. Furthermore, there are three proteins
encoded in 1q21 that carry in the N-terminus an S100-like domain, namely
trichohyalin, profilaggrin, and C1 or f10. The small distances between the genes
on the chromosome and the phylogenetic tree indicate that S100 genes most likely
originate from late gene duplication events. It is interesting that the clustered
organization of the human genes seems to be evolutionarily conserved, at least in
the mouse. In other species, S100 genes are less well characterized.
1.2.2 Biological Functions
S100 proteins generally are involved in a large number of cellular activities such
as signal transduction, cell differentiation, regulation of cell motility, transcription
and cell cycle progression. Such activities can be expected since S100 proteins
are thought to modulate the activity of target proteins in a Ca2+- (and possibly also
in a Zn2+- and Cu2+-) dependent manner, thereby transferring the signal from the

Introduction 6
second messenger. Therefore, understanding the biological function of S100
proteins will crucially depend on the identification of their target proteins. During
the last decade, a large number of such possible interactions have been described
involving enzymes, cytoskeletal elements as well as transcription factors.
Apart from these intracellular functions, some S100 proteins like
S100A8/S100A9, S100B, S100A4 and probably others can be secreted from cells,
as noted above, and exibit cytokine-like extracellular functions. These include
chemotactic activities related to inflammation (S100A8/A9 and A12), neurotrophic
activities (S100B), and angiogenic effects (S100A4 and S100A13). In all cases,
the mechanisms of secretion as well as the nature of high affinity surface
receptors remain largely unknown. One candidate receptor to mediate at least
some of the described extracellular functions is the RAGE, which is activated upon
binding of S100A12, S100A13, S100P, and S100B (Hofmann et al., 1999;
Huttunen et al., 2000; Arumugam et al., 2004; Hsieh et al., 2004). It is currently not
known whether RAGE is a universal S100 receptor.
Generation of animal models has been initiated to study the physiological
significance of S100 proteins. Ectopic overexpression in the mouse has been
described for S100B and S100A4. In the case of S100B, enhanced expression in
the brain led to hyperactivity associated with an impairment of hippocampal
function (Gerlai and Roder, 1995). In contrast to this mild phenotype, expression of
S100A4 in oncogene-bearing transgenic mice can induce metastasis of mammary
tumours, suggesting that S100A4 plays an important role in the acquisition of the
metastatic phenotype (Ambartsumian et al., 1996; Davies et al., 1996).
Inactivation through homologous recombination in mouse embryonic stem
cells has been demonstrated for S100B, S100A8, and S100A1. While inactivation
of S100B has no obvious consequences for life (Xiong et al., 2000), S100A8 null
mice die via early resorption of the mouse embryo (Passey et al., 1999), a result
that suggests a role for this protein in prevention of maternal rejection of the
implanting embryo. S100A1 null mice have significantly reduced responses to
acute and chronic hemodynamic stress that are associated with reduced cardiac
calcium sensitivity (Du et al., 2002).
Since S100 proteins can form homo- and heterodimers and usually more
than one S100 protein is expressed in a given cell type, functional redundancy or
Introduction 7
n
compensatory mechanisms might explain the lack of phenotype observed in some
animal models.
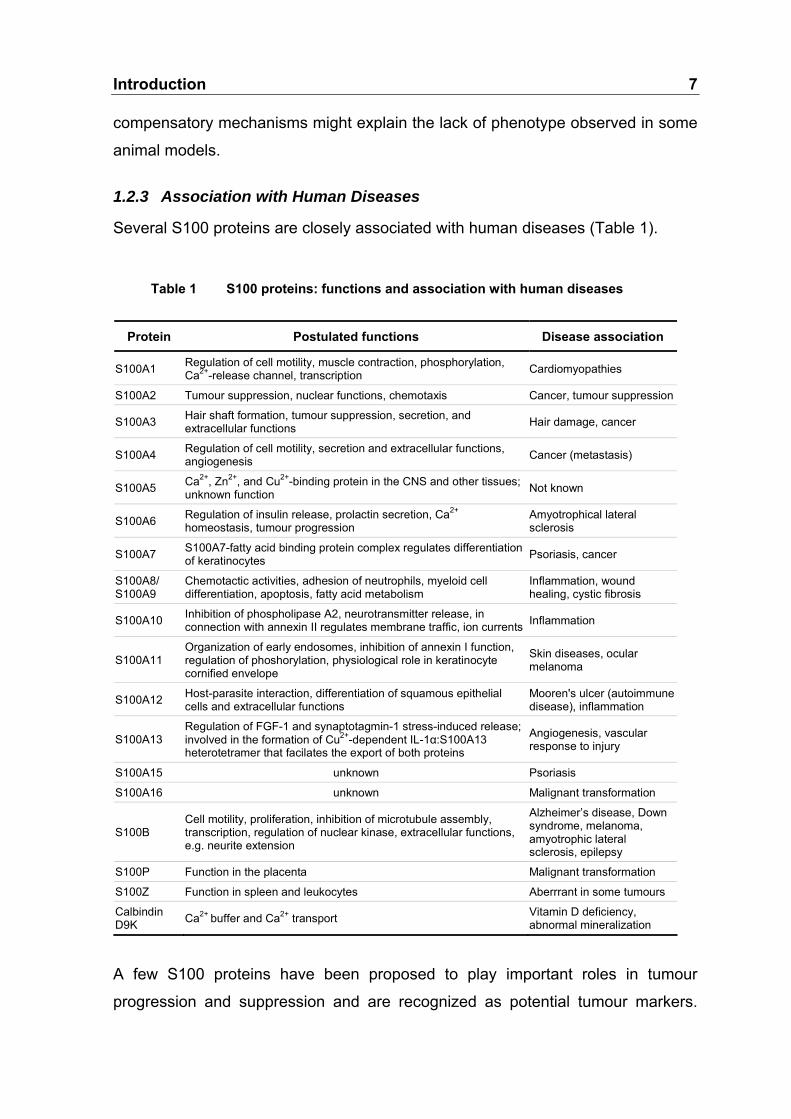
1.2.3 Association with Human Diseases
Several S100 proteins are closely associated with human diseases (Table 1).
Table 1 S100 proteins: functions and association with human diseases
Protein Postulated functions Disease associatio
S100A1 Regulation of cell motility, muscle contraction, phosphorylation, Ca2+-release channel, transcription Cardiomyopathies
S100A2 Tumour suppression, nuclear functions, chemotaxis Cancer, tumour suppression
S100A3 Hair shaft formation, tumour suppression, secretion, and extracellular functions Hair damage, cancer
S100A4 Regulation of cell motility, secretion and extracellular functions, angiogenesis Cancer (metastasis)
S100A5 Ca2+, Zn2+, and Cu2+-binding protein in the CNS and other tissues; unknown function Not known
S100A6 Regulation of insulin release, prolactin secretion, Ca2+
homeostasis, tumour progression Amyotrophical lateral sclerosis
S100A7 S100A7-fatty acid binding protein complex regulates differentiation of keratinocytes Psoriasis, cancer
S100A8/ S100A9
Chemotactic activities, adhesion of neutrophils, myeloid cell differentiation, apoptosis, fatty acid metabolism
Inflammation, wound healing, cystic fibrosis
S100A10 Inhibition of phospholipase A2, neurotransmitter release, in connection with annexin II regulates membrane traffic, ion currents Inflammation
S100A11 Organization of early endosomes, inhibition of annexin I function, regulation of phoshorylation, physiological role in keratinocyte cornified envelope
Skin diseases, ocular melanoma
S100A12 Host-parasite interaction, differentiation of squamous epithelial cells and extracellular functions
Mooren's ulcer (autoimmune disease), inflammation
S100A13 Regulation of FGF-1 and synaptotagmin-1 stress-induced release; involved in the formation of Cu2+-dependent IL-1α:S100A13 heterotetramer that facilates the export of both proteins
Angiogenesis, vascular response to injury
S100A15 unknown Psoriasis
S100A16 unknown Malignant transformation
S100B Cell motility, proliferation, inhibition of microtubule assembly, transcription, regulation of nuclear kinase, extracellular functions, e.g. neurite extension
Alzheimer’s disease, Down syndrome, melanoma, amyotrophic lateral sclerosis, epilepsy
S100P Function in the placenta Malignant transformation
S100Z Function in spleen and leukocytes Aberrrant in some tumours
Calbindin D9K Ca2+ buffer and Ca2+ transport Vitamin D deficiency,
abnormal mineralization
A few S100 proteins have been proposed to play important roles in tumour
progression and suppression and are recognized as potential tumour markers.

Introduction 8
The association of S100 proteins with cancer development originates in the finding
that the evolutionary conserved gene cluster on human chromosome 1q21 is
implicated in gene rearrangements during tumour development. As discussed
below, up-regulation in tumours has been reported for S100A1, S100A4, S100A6,
S100A7, S100A8, S100A9, S100A10, S100A16, S100B, and S100P, whereas
S100A2 and S100A11 have been postulated to be tumour suppressor genes.
S100A1 and S100B are overexpressed in human cancers and have been
suggested to play a role in the hyperactivation of Ndr kinase in melanomas
(Millward et al., 1998). Inhibition of p53 activity by S100B could be one
mechanism, whereby overexpressed S100B is involved in neoplastic
transformation. Blood levels of S100B are used to monitor malignant melanomas
(Krähn et al., 2001).
S100A4 has been implicated in invasion and metastasis. The prognostic
significance of its selective expression in various cancers has been exploited. In
gastric cancer the opposite expression of S100A4 in relation to a tumour
suppressor E-cadherin was found to be a powerful aid in histological typing and in
evaluating the metastatic potential/prognosis of patients with this type of cancer
(Yonemura et al., 2000). It was also demonstrated that extracellular S100A4 could
act as an angiogenic factor and might induce tumour progression via an
extracellular route stimulating angiogenesis (Kriajevska et al., 2002).
S100A5 has been postulated to be a marker of recurrence in WHO grade I
meningiomas (Hancq et al., 2004).
S100A6 has been found overexpressed in human pancreatic
adenocarcinomas (Logsdon et al., 2003) as well as in intrahepatic tumours, where
it was activated by TNF-α and NFκB (Joo et al., 2003).
S100A7 (psoriasin) expression has been associated with psoriasiform
hyperplasia, tumour progression in breast cancer and a worse prognosis in
estrogen receptor-negative invasive ductal breast carcinomas (Emberley et al.,
2003) as well as with gastric tumours (El-Rifai et al., 2002). In addition, S100A7 is
a potential tumour marker for non-invasive follow-up of patients with urinary
bladder squamous cell carcinoma (Ostergaard et al., 1999).
The two calgranulins – S100A8 and S100A9 – are differentially expressed at
sites of acute and chronic inflammation. Recent reports, however, indicate that

Introduction 9
they are also overexpressed during skin carcinogenesis (Gebhardt et al., 2002), in
poorly differentiated lung adenocarcinomas (Arai et al., 2001), gastric tumours
(El-Rifai et al., 2002), and at the invasive margin of colorectal carcinomas (Stulik et
al., 1999).
S100P expression has been noted in various cancer cell lines. It is
associated with cellular immortalization in breast cancer cell lines (Guerreiro et al.,
2000). In colon cancer cell lines, its expression is elevated in doxorubicin-resistant
cells (Bertram et al., 1998). S100P is expressed in prostate cancer, where its
expression is androgen-sensitive (Averboukh et al., 1996) and in pancreatic
adenocarcinoma, where its expression has been localized to the neoplastic
epithelium of pancreas (Logsdon et al., 2003). Furthermore, it was found that
S100P expression correlates with decreased survival in patients with lung cancer
(Beer et al., 2002).
S100A10 is an annexin 2 protein ligand and a key plasminogen receptor of
the extracellular cell surface that is overexpressed in esophageal squamous cell
carcinomas (Zhi et al., 2003), renal cell carcinomas (Teratani et al., 2002), and
gastric tumours (Rifai et al., 2002). It was shown that S100A10 stimulates the
conversion of plasminogen to plasmin on the tumour cell surface thereby
contributing to the increased invasiveness of tumour cells (Zhang et al., 2004).
The recently identified S100A16 is up-regulated at the transcriptional level in
tumours of the bladder, lung, thyroid gland, pancreas, and ovary (Marenholz and
Heizmann, 2004).
By contrast, S100A2 is markedly down-regulated in breast tumour biopsies
and can be re-expressed in mammary carcinoma cells by 5-azadeoxycytidine
treatment (Wicki et al., 1997). A prognostic significance of S100A2 in laryngeal
squamous-cell carcinoma has also been found allowing discrimination of high and
low risk patients in the lymph-node negative subgroup to provide better therapy
(Lauriola et al., 2000). Using DNA array technology, S100A2 was identified as
differentially expressed in normal versus tumorigenic human bronchial epithelial
cells (Feng et al., 2001).
A role for S100A11 as a tumour suppressor protein was postulated. This was
based on its down-regulation in immortalized versus normal cells (Sakaguchi et

Introduction 10
al., 2000) and the observation that microinjection of an anti-S100A11 antibody into
normal confluent quiescent cells induced DNA synthesis (Sakaguchi et al., 2003).
1.3 Aim of This Work The primary aim of the study was to identify novel tumour-associated genes with
potential application in the detection or treatment of cancer. The starting point was
a collection of partial cDNA clones of yet unknown genes from a suppression
subtractive hybridization (SSH) cDNA library preferentially representing genes that
were down-regulated in the small cell lung carcinoma cell line as compared to
normal human bronchial epithelial cells.
An unknown human transcript was selected for further characterization in
view of its differential expression in tumour cell lines and in primary tumours, as
well as its homology to a protein family known to be associated with
tumorigenesis.
I aimed to elucidate the rationale for the differential expression of the gene in
tumours as well as to evaluate its potential clinical relevance. A further intention
was to shed light on the mechanism of regulation of the gene in order to determine
its association with malignant transformation.

11
2 Materials and Methods
2.1 Materials
2.1.1 Chemicals
All chemicals used in this work were purchased from Roche Diagnostics GmbH,
Mannheim, Germany; Calbiochem, CA, USA; Sigma-Aldrich Chemie GmbH,
Munich, Germany; Sigma, MS, USA; Biozym Diagnostik GmbH, Oldendorf,
Germany; Merck, Darmstadt, Germany; Serva Electrophoresis GmbH, Heidelberg,
Germany; R&D Systems Inc., MN, USA.
Milli-Q 18.2 MΩ · cm water was used in all procedures if required.
2.1.2 Kits
5’-RACE Kit BD Biosciences, CA, USA BEGM Bullet Kit Clonetics, San Diego, CA, USA ChemMate Detection Kit DAKO, Glostrup, Denmark Developer RP X-OMAT EX Eastman Kodak Company, NY, USA Dual-Luciferase Reporter Assay System Promega, WI, USA ECL Western Blotting Detection Kit Amersham Pharmacia Biotech, Freiburg, Germany Endofree Plasmid Maxiprep Kit Qiagen GmbH, Hilden, Germany ExpressHyb solution BD Biosciences, CA, USA FastTrack 2.0 Kit for Isolation of mRNA Invitrogen, CA, USA Fixer RP X-OMAT LO Eastman Kodak Company, NY, USA Megaprime DNA Labelling System Amersham Pharmacia Biotech, Buckinghamshire, UK Opti-MEM I Reduced Serum Medium Invitrogen, CA, USA Plasmid Mini and Maxi Kit Qiagen GmbH, Hilden, Germany Protease Inhibitors Cocktail Roche Diagnostics GmbH, Mannheim, Germany QIAquick PCR Purification Kit Qiagen GmbH, Hilden, Germany QIAquick Nucleotide Removal Kit Qiagen GmbH, Hilden, Germany Qiaquick Gel Extraction Kit Qiagen GmbH, Hilden, Germany Rapid Ligation Kit Roche Diagnostics GmbH, Mannheim, Germany SequaGel XR National Diagnostics, GE, USA Thermoscript RT-PCR System Invitrogen, CA, USA Thermo-Sequenase Fluorescent-Labeling Cycle-Sequencing Kit
Amersham Pharmacia Biotech, Buckinghamshire, UK
TRIzol Invitrogen, CA, USA

Materials and Methods 12
2.1.3 Materials
Hybond-N membrane Amersham Pharmacia Biotech, Buckinghamshire, UK Hybond-N+ membrane Amersham Pharmacia Biotech, Buckinghamshire, UK Hybond-P PVDF membrane Amersham Pharmacia Biotech, Buckinghamshire, UK Kodak X-ray Film NEN Life Science Products, MA, USA Hybond Hyperfilm Amersham Pharmacia Biotech, Buckinghamshire, UK Human Multiple Tissue Northern (MTN) Blot
BD Biosciences, CA, USA
Cancer Profiling Array BD Biosciences, CA, USA Metaphases of normal human lymphocytes
Vysis, IL, USA
2.1.4 Enzymes
Ampli Taq DNA Polymerase Perkin Elmer, MA, USA Calf Intestinal Alkaline Phosphatase (CIAP) Promega, Mannheim, Germany Restriction Endonucleases: BamHI, XbaI, KpnI, SacI, PstI, XhoI, SalI, NotI, EcoRI
Promega, Mannheim, Germany
2.1.5 Antibodies
Anti-β-actin Sigma-Aldrich, Inc., MS, USA Anti-AKT Cell Signalling Technology, Inc., MA, USA Anti-ER Novocastra, Newcastle, UK Anti-ERBB2 DAKO, Glostrup, Denmark Anti-c-JUN Cell Signalling Technology, Inc., MA, USA Anti-Ki-67 Dianova, Hamburg, Germany Anti-p38 Cell Signalling Technology, Inc., MA, USA Anti-Phospho-AKT (Ser473) Cell Signalling Technology, Inc., MA, USA Anti-Phospho-HSP27 (Ser82) Cell Signalling Technology, Inc., MA, USA Anti-Phospho-c-JUN (Ser63) Cell Signalling Technology, Inc., MA, USA Anti-Phospho-p38 (Thr180/Tyr182) Cell Signalling Technology, Inc., MA, USA Anti-Phospho-p44/42 MAPK (Thr202/Tyr204) Cell Signalling Technology, Inc., MA, USA Anti-Phospho-SAPK/JNK (Thr183/Tyr185) Cell Signalling Technology, Inc., MA, USA Anti-PR DAKO, Glostrup, Denmark Anti-S100A14 affinity-purified A. Pietas, Charité, Berlin, Germany Anti-SAPK/JNK Cell Signalling Technology, Inc., MA, USA Anti-pan-Ras BD Biosciences, CA, USA Anti-α-tubulin Monosan, Sanbio b.v., Netherlands Anti-V5 Invitrogen, CA, USA
Materials and Methods 13
FITC(DTAF)-Conjugated Goat Anti-Mouse IgG (H + L)
Jackson ImmunoResearch Laboratories, Baltimore, MD, USA
FITC(DTAF)-Conjugated Goat Anti-Rabbit IgG (H + L)
Jackson ImmunoResearch Laboratories, Baltimore, MD, USA
Horseradish Peroxidase-Conjugated Rabbit Anti-Mouse
DAKO, Glostrup, Denmark
Horseradish Peroxidase-Conjugated Goat Anti-Rabbit
Amersham Pharmacia Biotech, Buckinghamshire, UK
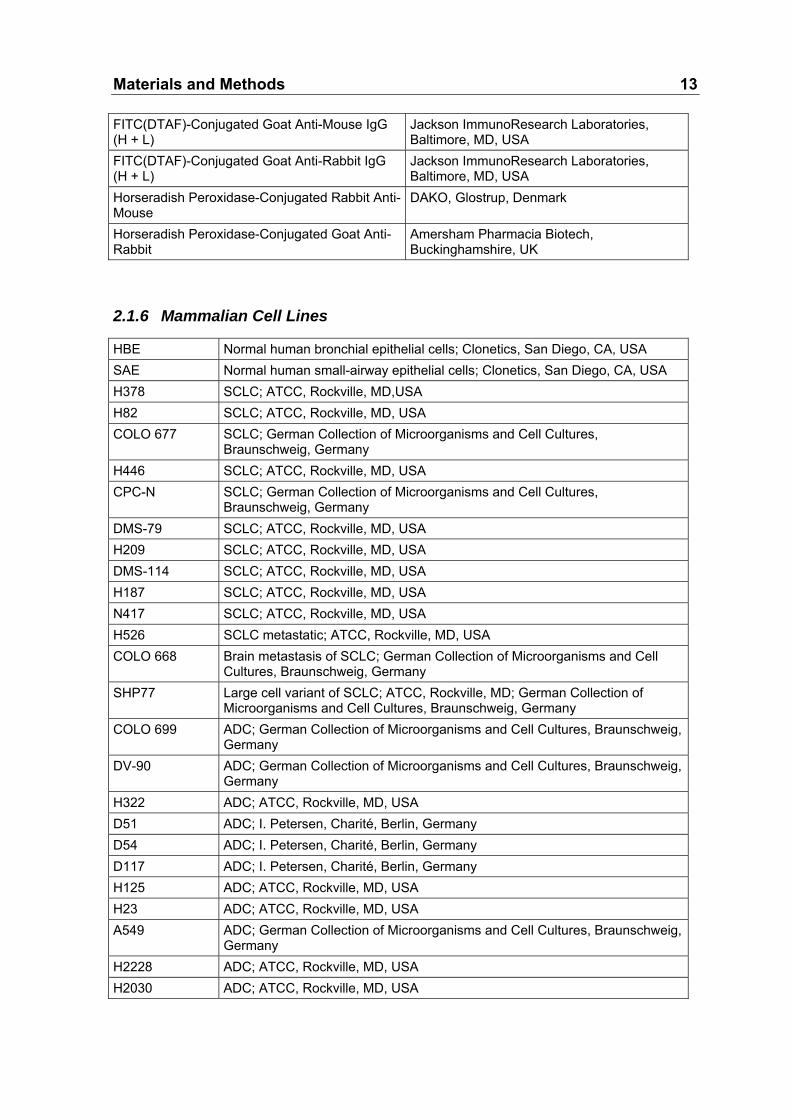
2.1.6 Mammalian Cell Lines
HBE Normal human bronchial epithelial cells; Clonetics, San Diego, CA, USA SAE Normal human small-airway epithelial cells; Clonetics, San Diego, CA, USA H378 SCLC; ATCC, Rockville, MD,USA H82 SCLC; ATCC, Rockville, MD, USA COLO 677 SCLC; German Collection of Microorganisms and Cell Cultures,
Braunschweig, Germany H446 SCLC; ATCC, Rockville, MD, USA CPC-N SCLC; German Collection of Microorganisms and Cell Cultures,
Braunschweig, Germany DMS-79 SCLC; ATCC, Rockville, MD, USA H209 SCLC; ATCC, Rockville, MD, USA DMS-114 SCLC; ATCC, Rockville, MD, USA H187 SCLC; ATCC, Rockville, MD, USA N417 SCLC; ATCC, Rockville, MD, USA H526 SCLC metastatic; ATCC, Rockville, MD, USA COLO 668 Brain metastasis of SCLC; German Collection of Microorganisms and Cell
Cultures, Braunschweig, Germany SHP77 Large cell variant of SCLC; ATCC, Rockville, MD; German Collection of
Microorganisms and Cell Cultures, Braunschweig, Germany COLO 699 ADC; German Collection of Microorganisms and Cell Cultures, Braunschweig,
Germany DV-90 ADC; German Collection of Microorganisms and Cell Cultures, Braunschweig,
Germany H322 ADC; ATCC, Rockville, MD, USA D51 ADC; I. Petersen, Charité, Berlin, Germany D54 ADC; I. Petersen, Charité, Berlin, Germany D117 ADC; I. Petersen, Charité, Berlin, Germany H125 ADC; ATCC, Rockville, MD, USA H23 ADC; ATCC, Rockville, MD, USA A549 ADC; German Collection of Microorganisms and Cell Cultures, Braunschweig,
Germany H2228 ADC; ATCC, Rockville, MD, USA H2030 ADC; ATCC, Rockville, MD, USA

Materials and Methods 14
H157 SCC; ATCC, Rockville, MD, USA H2170 SCC; ATCC, Rockville, MD, USA H226 SCC mesothelioma; ATCC, Rockville, MD, USA A427 Lung Ca; German Collection of Microorganisms and Cell Cultures,
Braunschweig, Germany BEN Lung Ca, lymph node metastasis; German Collection of Microorganisms and
Cell Cultures, Braunschweig, Germany D97 LCLC; I. Petersen, Charité, Berlin, Germany HBE4-E6/E7 HBE immortalized with E6 and E7 genes of HPV-16; ATCC, Rockville, MD,
USA 9442 (BET-1A)
HBE immortalized with SV40 early region; ATCC, Rockville, MD, USA
BEAS-2B HBE immortalized with SV40 early region; ATCC, Rockville, MD, USA YP44 HBE immortalized with SV40 early region; kindly provided by Dr. Cheng,
Cancer Institute, Beijing, China HMEC Normal human mammary epithelial cells; Clonetics, San Diego, CA, USA HMEB HMEC immortalized with telomerase and SV40 early region; kindly provided
by Dr. B. Weinberg, Whitehead Institute for Biomedical Research, Massachusetts Institute of Technology, USA
MCF-10A Spontaneously immortalized mammary epithelial cells; kindly provided by Dr. A. Gontarewicz, Charité, Berlin, Germany
MCF-7 Breast Ca; kindly provided by Dr. A. Gontarewicz, Charité, Berlin, Germany SK-BR-3 Breast Ca; kindly provided by Dr. A. Gontarewicz, Charité, Berlin, Germany MDA-MD-231 Breast Ca; kindly provided by Dr. A. Gontarewicz, Charité, Berlin, Germany HT-29 Colon Ca; kindly provided by Dr. K. Jürchott, Charité, Berlin, Germany SW-480 Colon Ca; kindly provided by Dr. K. Jürchott, Charité, Berlin, Germany HCT-116 Colon Ca; kindly provided by Dr. K. Jürchott, Charité, Berlin, Germany CaCo-2 Colon Ca; kindly provided by Dr. K. Kölble, Charité, Berlin, Germany WiDr Colon Ca; kindly provided by Dr. K. Kölble, Charité, Berlin, Germany Lovo Colon Ca; kindly provided by Dr. A. Siegert, Charité, Berlin, Germany CX-2 Colon Ca; kindly provided by Dr. A. Siegert, Charité, Berlin, Germany HRT-18 Colon Ca; kindly provided by Dr. A. Siegert, Charité, Berlin, Germany HEP-2 Head and neck Ca; kindly provided by J. Möller, Charité, Berlin, Germany D36-1/95 Head and neck Ca; I. Petersen, Charité, Berlin, Germany D36-2/95 Head and neck Ca; I. Petersen, Charité, Berlin, Germany D6/95 Head and neck Ca; I. Petersen, Charité, Berlin, Germany D3/02 Head and neck Ca; I. Petersen, Charité, Berlin, Germany D40/97 Head and neck Ca; I. Petersen, Charité, Berlin, Germany IMR-90 Fetal lung fibroblasts; kindly provided by Dr. A. Gontarewicz, Charité,
Berlin, Germany HAKAT Immortalized keratinocytes; kindly provided by Dr. N. Fusenig, DKFZ,
Heidelberg, Germany HEK 293 Human embryonic kidney epithelial cells; kindly provided by
Dr. A. Gontarewicz, Charité, Berlin, Germany

Materials and Methods 15
COS-7 African green monkey kidney fibroblasts; kindly provided by Dr. I. Nazarenko, Charité, Berlin, Germany
RAW 264.7 Mouse macrophagoid immortalized cells; ATCC, Rockville, MD, USA L-cells Mouse fibroblasts; ATCC, Rockville, MD, USA L-Wnt 3 cells Mouse fibroblasts transfected with Wnt-3A; ATCC, Rockville, MD, USA C57MG Mouse mammary epithelial cells, kindly provided by Dr. R. Nusse, Stanford
University School of Medicine, USA
2.1.7 E. coli Strain
One Shot TOP10F’ F’lacIqTn10(TetR) mcrA∆(mrr-hsdRMS-mcrBC) Φ80lacZ∆M15 deoR recA1 endA1
Invitrogen, CA, USA
2.1.8 RNA Samples from Mammalian Cell Lines
H596 Lung Ca; Cancer Profiling Array, BD Biosciences, CA, USA DU 145 Prostate Ca; kindly provided by Dr. A. Gontarewicz, Charité, Berlin, Germany PC-3 Prostate Ca; kindly provided by Dr. A. Gontarewicz, Charité, Berlin, Germany Kato III Metastasis of gastric Ca; kindly provided by Dr. A. Gontarewicz, Charité, Berlin,
Germany EJ Bladder Ca; kindly provided by Dr. A. Gontarewicz, Charité, Berlin, Germany HeLa Cervical Ca; kindly provided by Dr. A. Gontarewicz, Charité, Berlin, Germany Daudi Burkitt’s lymphoma; Cancer Profiling Array, BD Biosciences, CA, USA K562 Chronic myelogenous leukemia; Cancer Profiling Array, BD Biosciences, CA, USA HL-60 Promyeolocytic leukemia; Cancer Profiling Array, BD Biosciences, CA, USA MOLT-4 Lymphoblastic leukemia; Cancer Profiling Array, BD Biosciences, CA, USA Raji Burkitt’s lymphoma; Cancer Profiling Array, BD Biosciences, CA, USA G361 Melanoma; Cancer Profiling Array, BD Biosciences, CA, USA SKOV-3 Ovarian Ca; kindly provided by Dr. A. Gontarewicz, Charité, Berlin, Germany OVCAR-3 Ovarian Ca; kindly provided by Dr. A. Gontarewicz, Charité, Berlin, Germany HT 1080 Fibrosarcoma; kindly provided by Dr. A. Gontarewicz, Charité, Berlin, Germany ROSE 199 Rat ovarian surface epithelial cells; kindly provided by Dr. A. Gontarewicz, Charité,
Berlin, Germany ROSE A2/1 Rat ovarian surface epithelial cells transfected with KRas; kindly provided by
Dr. A. Gontarewicz, Charité, Berlin, Germany ROSE A2/5 Rat ovarian surface epithelial cells transfected with KRas; kindly provided by
Dr. A. Gontarewicz, Charité, Berlin, Germany 208F Immortalized rat fibroblasts; kindly provided by Dr. A. Gontarewicz, Charité, Berlin,
Germany FE-8 HRAS-transformed derivative of 208F; kindly provided by Dr. A. Gontarewicz,
Charité, Berlin, Germany IR-4 208F cells transfected with IPTG-inducible Ras; kindly provided by
Dr. A. Gontarewicz, Charité, Berlin, Germany

Materials and Methods 16
2.1.9 Tissue Specimens
Tumour specimens used in this study include xenografts of the following lung
cancer cell lines transplanted subcutaneously into immunodefficient mice: CPC-N,
H526, H446, H82, H209, N417 (SCLC); Colo 668 (brain metastasis of SCLC); D54
(adenocarcinoma), and D97 (LCLC). They were obtained from experiments
conducted by Prof. Dr. I. Petersen on tumorigenicity of various human cultured
lung cancer cell lines in nude mice (unpublished results). These specimens were
shock frozen in liquid nitrogen and stored at -80°C until RNA extraction.
Normal human colon tissue and tumour tissue specimens used in the
immunohistochemical analysis were obtained from surgical resections at the
Department of Surgery of the Charité Hospital at the Humboldt University Berlin.
Operation specimens were transferred to the Institute of Pathology within 1 hour
after surgical removal. Generally, no adjuvant radiotherapy or chemotherapy was
applied before surgery. These specimens were shock frozen in liquid nitrogen and
stored at -80°C until RNA extraction.
2.1.10 Plasmids and Expression Constructs
S100A14-V5 The expression construct was generated by PCR-amplification of the ORF of the S100A14 cDNA using H1043for-tr and H1043rev-tr primers. The amplified fragment of 316-bp was ligated into the BamHI and XbaI sites of the pcDNA3.1/V5 vector.
pcDNA3.1/V5 Invitrogen, CA, USA
D1-4 human S100A14 genomic construct
The human S100A14 genomic construct was generated by cloning of the 3173-bp positive fragment (hybridizing with S100A14 coding region, intron 2, and 3 in Southern blot analysis) produced by BamHI digestion of the PAC clone D11609 into pBluescript II KS(+) phagemid vector.
pBluescript II KS(+) phagemid vector
Stratagene, La Jolla, Canada
H1043 The DKFZp404H1043 clone containing the human full-length S100A14 cloned in pSPORT1 vector, was provided by RZPD, Heidelberg, Germany.
H1043(-)0.5/10 The human full-length S100A14 expression construct was generated by subcloning from the H1043 clone by restriction digestion with NotI and XbaI.
pGL3-Basic The firefly luciferase reporter vector lacking eukaryotic promoter and enhancer elements upstream of the firefly luciferease gene.

Materials and Methods 17
pRL-TK The Renilla luciferase reporter vector containing the herpes simplex virus thymidine kinase promoter region upstream of Renilla luciferase gene.
p500-luc The p500-luc luciferase reporter vector was generated by restriction digestion with KpnI (multiple cloning site) and SacI (endogenous restriction site; position 496 bp in D1-4) of the S100A14 genomic construct D1-4. The fragment of 495-bp was ligated into the compatible restriction sites of the pGL3-Basic firefly luciferase reporter vector.
p300-luc The p300-luc luciferase reporter vector was generated by restriction digestion with PstI (endogenous restriction site; position 192 bp in D1-4) of the p500-luc fragment. The resulting PstI-SacI (-313 bp to -12 bp) restriction fragment was amplified by PCR using the oligonucleotides Prom2b-for and Prom2b-rev. The amplified fragment of 300-bp was ligated into KpnI and SacI sites of the pGL3-Basic firefly luciferase reporter vector.
p250-luc The p250-luc luciferase reporter vector was generated by restriction digestion with PstI (endogenous restriction site; position 192 bp in D1-4) of the p500-luc fragment. The resulting PstI (the multiple cloning site)- PstI (-573 bp to -313 bp) restriction fragment was amplified by PCR using the oligonucleotides Prom1b-for and Prom1b-rev. The amplified fragment of 192-bp was ligated into KpnI and SacI sites of the pGL3-Basic firefly luciferase reporter vector.
p2A-luc The p2A-luc deletion construct was created by PCR-amplification of the fragment (-313 bp to -269 bp) of the p300-luc, using prom2A-for and prom2A-rev primers. The amplified fragment of 51-bp was ligated into the KpnI and SacI sites of the pGL3-Basic firefly luciferase reporter vector.
p2B-luc The p2B-luc deletion construct was created by PCR-amplification of the fragment (-313 bp to -206 bp) of the p300-luc, using prom2A-for and prom2B-rev primers. The amplified fragment of 107-bp was ligated into the KpnI and SacI sites of the pGL3-Basic firefly luciferase reporter vector.
p2C-luc The p2C-luc deletion construct was created by PCR-amplification of the fragment of the p300-luc (-208 bp to -12 bp) using prom2C-for and prom2C-rev primers. The amplified fragment of 196-bp was ligated into the KpnI and SacI sites of the pGL3-Basic firefly luciferase reporter vector
EGFP (enhanced green fluorescent protein)
BD Biosciences, San Diego, TX, USA
p65/Flag The p65 expression vector containing p65 full-length cDNA fused with Flag epitope, was a generous gift from Dr. C. Scheidereit, MDC, Berlin, Germany.
pcDNA3/Flag The empty vector pcDNA3/Flag was a generous gift from Dr. C. Scheidereit (MDC, Berlin, Germany).
pCR2.1 TA Cloning Vector
Invitrogen, Groningen, Netherlands
m-S100A14 The IMAGp998M1311375Q3 clone containing the mouse full-length S100A14 cDNA cloned in pCMV-SPORT6 phagemid vector, was provided by RZPD (Berlin, Germany).

Materials and Methods 18
2.1.11 Oligonucleotides
IRD-labelled oligonucletides were purchased from MWG-Biotech, Ebersberg,
Germany. Non-labelled oligonucleotides were purchased from BioTeZ GmbH,
Berlin-Buch, Germany.
Oligonucl. Labelling Sequence Prom1b-for 5’– TTA GGG GTA CCC CCC AGG CAG GCT TGA GTG – 3’ Prom1b-rev 5’– TTA TAT CGA GCT CGT GCA GGG CAG GGA AGG – 3’ Prom2b-for 5’– TAG GGG TAC CCC TGC AGT TCG CCA GGG C – 3’ Prom2b-rev 5’– GCG ACC ACG AGC TCA GCT CTT ATA CCT G – 3’ 18S-for 5’– GGG GAG GTA GTG ACG AA – 3’ 18S-rev 5’– ACA AAG GGC AGG GAC TT – 3’ Prom2A-for 5’– TTA GGG GTA CCC CTG CAG TTC GCC AGG GCC – 3’ Prom2A-rev 5’– TTA TAT CGA GCT CGA CTT CGA GAC CTC ATG GG – 3’ Prom2B-rev 5’– TTA TAT CGA GCT CGG ATC AGC ATG CAG AGT CAC – 3’ Prom2C-for 5’– TTA GGG GTA CCC CTG CTG ATC GGA GGC CAG – 3’ Prom2C-rev 5’– TTA TAT CGA GCT CGA GCT CTT ATA CCT GGG GG – 3’ GAPDH-for 5’– GAA CGG GAA GCT TGT CAT CA – 3’ GAPDH-rev 5’– GTA GCC AAA TTC GTT GTC ATA C – 3’ mA14-for 5’– ATG GGA CAG TGT CGG TCA – 3’ mA14-rev 5’– TCA GCT CCG AGT AAC AGG – 3’ pGL3basic-f IRD800 5’– CTA GCA AAA TAG GCT GTC CC – 3’ pGL3basic-r IRD800 5’– CTT TAT GTT TTT GGC GTC TTC CA – 3’ exon1 for 5’– CTC AGC GGC TGC CAA CAG – 3’ exon2 for 5’– CAG TGT CGG TCA GCC AAC – 3’ exon3 for 5’– GAA CTT TCA CCA GTA CTC CG – 3’ D1-4prom-for 5’– CAT GAG GTC TCG AAG TCC – 3’ D1-4prom-rev 5’– CAG CTC ACC TGA GCT CAG – 3’ H1043for-2 5’– TCA TGC CGA GCA ACT GTG G – 3’ H1043rev-2 5’– GCC TCT CCA GCT TCA CAC T – 3’ H1043for-3 5’– GCT GCC AAC AGA TCA TGA – 3’ H1043rev-3 5’– TTG GCT GAC CGA CAC TGT – 3’ H1043 f 5’– CAA CAG AAC TCT CAC CAA AG – 3’ H1043 r 5’– TCC AGA GGG AGT TCT CAG T – 3’ H1043 i1 for 5’– GGC TGC CAA GTA AGG AAA C – 3’ H1043 i1 rev 5’– TCA TGA TCT GCT TAG AGG AG – 3’ H1043 i2 for 5’– AAC GCA GAG GTG GGC TCA T – 3’ H1043 i2 rev 5’– CTG AGC ATC CTG AGG GCA G – 3’ H1043 i3 for 5’– TCT CAT GCC GGT ATG GAC – 3’ H1043 i3 rev 5’– CCA CAG TTG CTC TGA GGG – 3’

Materials and Methods 19
H1043for-tr 5’– CGG GAT CCC GCA CCA TGG GAC AGT GTC GG – 3’ H1043rev-tr 5’– GCT CTA GAG CGT GCC CCC GGA CAG GCC T – 3’ GPS1 5’– AGG CCT CTC CAG CTT CAC ACT CTT G – 3’ NGPS1 5’– CAA CAG AAC TCT CAC CAA AG – 3’ NGPS2 5’– GCC TCT CCA GCT TCA CAC T – 3’ D1-4 T7-1 IRD800 5’– AGG CTG CTG CAA TAG CAG – 3’ D1-4 T7-2 IRD800 5’– TCT AAG CAG ATC ATG AGC – 3’ D1-4 T7-3 IRD800 5’– CAT CTC ATG CCG GTA TGG – 3’ H1043 M13 IRD800 5’– TGA GGT CAG ATC TCA GAA C – 3’ H1043 T7 IRD800 5’– CCT ACT TAT AAA CTC CCT A – 3’ pcDNA3.1R IRD800 5’– CCT CGA CTG TGC CTT CTA – 3’ pcDNA3.1R-2 IRD800 5’– TAG AAG GCA CAG TCG AGG – 3’ M13 IRD800 5’– GTA AAA CGA CGG CCA G – 3’ M13R IRD800 5’– CAG GAA ACA GCT ATG AC – 3’ T7 IRD800 5’– TAA TAC GAC TCA CTA TAG GG – 3’
2.2 Methods
2.2.1 Bacterial Culture
2.2.1.1 Routine Culturing and Storage Conditions
E.coli cultures were routinely grown at 37°C on Luria Bertani (LB) agar or in the LB
broth, containing Ampicillin (50 µg/ml) or Kanamycin (25 µg/ml).
For long-term storage, a fresh overnight culture was prepared as follows:
bacteria were streaked onto an agar plate containing the selective antibiotic, and
incubated at 37°C overnight. Individual bacterial colonies were picked into Greiner
tubes (Greiner Bio-One, Germany) containing 3 ml LB broth, and incubated for
14-16 hours at 37°C with shaking at 160 rpm. Then 800 µl of 2 x bacteria storage
medium and 800 µl of bacterial culture were added into the storage tube. The vials
were immediately transferred to -70°C and stored until use. To recover a bacteria
culture, a small amount of the frozen stock was inoculated into 3 ml LB broth,
containing the appropriate antibiotic, and incubated overnight at 37°C with shaking
at 160 rpm.

Materials and Methods 20
2 x Bacteria storage medium
8.25 g K2HPO4*3H2O
1.80 g KH2PO4
0.45 g Na-citrate*2H2O
0.09 g MgSO4*7H2O
5.90 g (NH4)2SO4
35.75 ml 87% Glycerol
sterile H2O was added to a final volume of 500 ml and the medium was filter-
sterilised under sterile conditions.
1 x LB broth
1% Bacto tryptone
0.5 % Bacto yeast extract
1% NaCl
1 x LB agar
LB broth with 1.5% Bacto agar
To prepare agar plates, the LB agar was cooled to ~50°C, appropriate antibiotics
were added and 15 ml of LB agar per 100-mm plate were poured. For
β-galactosidase assay, LB agar plates were prepared with 80 µg/ml X-gal
(5-bromo-4-chloro-3-indol-β-D-galactopyranisode) and 20 mM IPTG (isopropyl-I-
thio-β-D-galactopyranisode). IPTG was prepared in sterile water, and X-gal in
dimethylformamide (DMF).
2.2.1.2 Transformation
Chemically competent TOP10F’ E.coli were thawed on ice and mixed gently. The
cells were transformed with an aliquot of 2 µl of the ligation reaction and incubated
for 30 min on ice. Next, the cells were incubated for 30 sec in the 42°C water bath
and placed on ice. 250 µl of pre-warmed SOC medium (Invitrogen) were added,
the vials were placed horizontally and shaken at 220 rpm and 37°C for 1 hour in a
rotary shaker incubator. Finally, 50 and 200 µl of each transformed culture were
spread on separate LB agar plates containing 50 µg/ml ampicilin and incubated
overnight at 37°C.

Materials and Methods 21
Individual transformants were selected for plasmid miniprep DNA isolation by
Plasmid Mini Kit and analysed by restriction endonuclease digestion and
sequencing. The plates were sealed with parafilm and stored at 4°C for up to four
weeks.
2.2.2 Culturing of Mammalian Cells
2.2.2.1 Routine Culturing
Mammalian cell lines were maintained at 37°C and 95% humidity in the presence
of 5% CO2. Cells were typically grown in T-75 flasks and 100-mm dishes (BD
Biosciences).
The cell lines used in this study were cultivated in the following media:
Cell line Medium HBE BEGM SAE SAGM HBE-E6/E7 BEGM 9442 (BET-1A) BEGM BEAS-2B BEGM YP44 BEGM H378 RPMI + 10% FCS H82 RPMI + 10% FCS COLO 677 RPMI + 10% FCS H446 RPMI + 10% FCS CPC-N McCoys + 10% FCS DMS-79 RPMI + 10% FCS H209 RPMI + 10% FCS DMS-114 Waymouth's + 10% FCS H187 RPMI + 10% FCS N417 RPMI + 10% FCS H526 RPMI + 10% FCS COLO 668 RPMI + 10% FCS SHP77 RPMI + 10% FCS COLO 699 RPMI + 10% FCS DV-90 RPMI + 10% FCS H322 RPMI + 10% FCS D51 Leibovitz 15 medium (L-15) + 10% FCS + 1% glutamine D54 L-15 + 10% FCS + 1% glutamine D117 L-15 + 10% FCS + 1% glutamine H125 RPMI + 10% FCS

Materials and Methods 22
H23 RPMI + 10% FCS A549 F12/Ham + 10% FCS H2228 RPMI + 10% FCS H2030 RPMI + 10% FCS H157 RPMI + 10% FCS H2170 RPMI + 10% FCS H226 RPMI + 10% FCS A427 RPMI + 10% FCS BEN Dulbecco modified Eagle’s medium (DMEM) + 10% FCS + 2
mM glutamine + 4.5 g/l glucose D97 L-15 + 10% FCS + 1% glutamine HMEC MEBM HMEB MEBM + G418 (0.4 mg/ml) + hygromycine (0.1 mg/ml) +
puromycine (1 ng/ml) MCF 10A DMEM:F12 HAM + 5% horse serum + 10 µg/ml insulin + 5
µg/ml hydrocortisone + 20 ng/ml EGF + 100 ng/ml cholera toxin MCF-7 DMEM + 10% FCS + 2 mM glutamine SK-BR 3 DMEM + 10% FCS + 2 mM glutamine MDA MD 231 DMEM + 10% FCS + 2 mM glutamine HT-29 L-15 + 10% FCS + 1% glutamine SW-480 L-15 + 10% FCS + 1% glutamine HCT-116 L-15 + 10% FCS + 1% glutamine CaCo-2 RPMI + 10% FCS WiDr RPMI + 10% FCS Lovo DMEM + 10% FCS + 2 mM glutamine + 4.5 g/l glucose CX-2 RPMI + 10% FCS HRT-18 RPMI + 10% FCS HEP-2 RPMI + 10% FCS D36-1/95 L-15 + 10% FCS + 1% glutamine D36-2/95 L-15 + 10% FCS + 1% glutamine D6/95 L-15 + 10% FCS + 1% glutamine D3/02 L-15 + 10% FCS + 1% glutamine D40/97 L-15 + 10% FCS + 1% glutamine IMR-90 DMEM + 20% FCS + 2 mM glutamine HAKAT DMEM + 10% FCS + 2 mM glutamine HEK 293 DMEM + 10% FCS + 2 mM glutamine + 4.5 g/l glucose COS-7 DMEM + 10% FCS + 2 mM glutamine RAW 264.7 DMEM + 10% FCS + 2 mM glutamine + 4.5 g/l glucose L-cells DMEM + 10% FCS + 2 mM glutamine + 4.5 g/l glucose L-Wnt 3 cells DMEM + 10% FCS + 2 mM glutamine + 4.5 g/l glucose + G418
(400 µg/ml) C57MG DMEM + 10% FCS + 2 mM glutamine + 4.5 g/l glucose + 10
µg/ml insulin

Materials and Methods 23
For sub-culturing of the cells, the medium was removed, and the cells were rinsed
once with 1 x PBS buffer. Then, the buffer was removed and 2 ml of trypsin-EDTA
solution was added per 75-cm2 culture flask. The cells were incubated for a few
minutes at 37°C until they detached. Then, 8 ml of a fresh culture medium was
added, aspirated, and dispensed into new culture flasks. Fresh medium was
added every 2 to 3 days.
Trypsin-EDTA 10 x stock solution (Biochrom AG) contained 0.5% Trypsin
and 0.2% EDTA. For use in cell culture, the solution was diluted 1:10 with PBS,
filter-sterilized, and frozen at -20°C in 80 ml aliquots. Before use, an aliquot was
thawed in a water bath at 37°C and used as described above.
10 x PBS
2 g/l KCl
2 g/l KH2PO4
21.6 g/l Na2HPO4*7 H2O
pH was adjusted to 7.4
2.2.2.2 Freezing and Thawing Procedure
Following tripsinization, the cells were transferred into a 15 ml Falcon tube and
centrifuged at 1 000 x g for 5 min at room temperature. The cell pellet was
resuspended in 1 ml of storage medium, transferred into a cryo-tube and placed in
a cryo-container with isopropanol. The cells were kept at -70°C for 24 hours to
allow them to freeze slowly. After this time, they were stored in liquid nitrogen.
Storage medium consisted of the respective cell culture medium supplemented
with 5% DMSO.
Thawing of cells was performed quickly in a 37°C water bath for ~2 min.
Then, the cells were transferred immediately into a culture flask containing pre-
warmed culture medium. The next day, the medium was replaced with the fresh
one to remove traces of DMSO.
2.2.2.3 Cell Treatments
For the treatment with EGF, TGF-α, and TNF-α, 9442 (BET-1A) cells were grown
to ~70% confluence in regular medium (BEBM) supplemented with growth factors
(BEGM) for 3 days. After this time, subconfluent cultures were treated with

Materials and Methods 24
50 ng/ml of human recombinant EGF, 20 ng/ml of human recombinant TGF-α, and
25 ng/ml of human recombinant TNF-α without medium change, cultured for the
indicated times, and harvested. The growth and treatment of cells as well as the
RNA and protein extraction were performed at least 3 independent times.
For the stimulation with medium, BEBM medium was supplemented with a
double set of growth factors (BEGM; we refer to this as “stimulation medium”).
After 3 days of incubation in regular culture medium, the medium was replaced
with the “stimulation medium” and cells were cultured for the indicated times and
harvested.
To determine the kinetics of MAPK pathways stimulation, 9442 cells were
grown in regular medium for 3 days and then stimulated for various periods of time
(5, 15, 30, 60, 90, 120 min) with “stimulation medium”.
In order to determine the effective drug concentration, 9442 cells were grown
in regular medium for 3 days and then preincubated for 1 hour with 10 µM
AG1478, 20 µM U0126, 40 µM SB203580, 40 µM SP600125, 40 µM LY294002,
respectively, without medium change. Next, the cells were stimulated with
“stimulation medium” for the optimal time course determined from the stimulation
kinetics studies. The drug concentrations were chosen based on maximal
suppressive efficacy and minimal cell toxicity. Stock solutions of 15.8 mM AG1478,
10 mM U0126, 25 mM SB203580, and 22.7 mM SP600125 were prepared in
DMSO, and 50 mM LY294002 in 100% ethanol. As a control, cells were treated
with the vehicle, DMSO or ethanol, respectively.
For inhibition studies, 9442 cells were incubated for 12 hours (RNA analysis)
and 24 hours (protein analysis) with EGF or TGF-α without medium change, in the
presence or absence of the inhibitors, which were added 1 hour prior to treatment
with the growth factors.
To inhibit protein synthesis, cells were pretreated for 1 hour with
cycloheximide (2-10 µg/ml) before adding EGF. Stock solution of 100 mg/ml
cycloheximide was prepared in DMSO.
Protein kinase C (PKC) was induced by treatment with phorbol 12-myristate
13-acetate (PMA; 10 nM and 100 nM) for the indicated times. Inhibition of PKC
was carried out by preincubating cells for 1 hour with a broad PKC inhibitor
bisindolylmaleimide I (5 µM) before stimulation with PMA or EGF. Stock solutions

Materials and Methods 25
of 2 mg/ml PMA and 3 mM bisindolylmaleimide I were prepared in 100% ethanol
and DMSO, respectively. Control plates were treated with the vehicle.
For the treatment with thapsigargin, cells were preincubated with the
stimulation buffer containing 1 mM CaCl2 for 10 min (Davey et al., 2001). Then,
0.5 µM thapsigargin was added and the cells were incubated for 15 and 30 min at
37°C, fixed and immunostained for the endogenous S100A14 protein. Stock
solution of 1.5 mM thapsigargin was prepared in DMSO. Control incubations were
performed with DMSO as the vehicle. For Zn2+ treatment, cells were incubated
with 40 µM of ZnCl2 for 15 and 30 min at 37°C.
Stimulation buffer
140 mM NaCl
5 mM KCl
1 mM MgCl2
10 mM Glucose
10 mM HEPES
1 mM CaCl2
H2O was added and the solution was filter-sterilised.
Lung tumour cell lines (H525, COLO 668, COLO 667, H157, SHP-77, D117, H23,
N417) were treated with 20 µM 5-aza-2’-deoxycytydine for 5 days and processed
for RNA. Stock solution of 10 mM 5-aza-2’-deoxycytydine was prepared in
1 x PBS, pH 6.0.
Stimulation of HEK 293 and Lovo cells with EGF and TNF-α was performed
24 hours after the transfection with p2C promoter construct, following 24 hours
incubation in serum-containing, or serum-free medium. Cells were incubated for 6,
12, and 24 hours in the presence or absence of EGF and TNF-α and harvested
after indicated times.
2.2.2.4 Transfection of Mammalian Cells
Cationic lipid-mediated transfection was employed as a method of introducing
DNA into cells.
A total of 6 x 10⁴ cells/well of the H157, A549, and COS-7 cells were seeded
in 6-well plates a day before transfection. The cells were transfected with 0.8 µg

Materials and Methods 26
(H157), 1.9 µg (COS-7), and 3.8 µg (A549) of S100A14-V5 construct using 5.2 µl
of Lipofectin reagent (Invitrogen, MD, USA), 6 µl, and 12 µl of LipofectAMINE
reagent (Invitrogen, MD, USA), respectively. Transfection was performed
according to the following protocol: for each transfection, DNA and
Lipofectin/LipofectAMINE were diluted into separate aliquots (200 µl) of Opti-MEM
I Reduced Serum Medium (Invitrogen). Diluted Lipofectin Reagent was allowed to
stand at room temperature for 30 min. The two solutions were then combined,
mixed gently and incubated at room temperature for 15 min (Lipofectin) or 45 min
(LipofectAMINE) for lipid-DNA complexes formation. The cells were washed once
with Opti-MEM, then 800 µl of Opti-MEM was added per well and the cells were
overlaid with lipid-DNA complexes. Cells were then incubated for 5 hours at 37°C
in a CO2 incubator. After this time, DNA-lipid containing medium was replaced with
growth medium. Cells were assayed for gene expression 48 hours after
transfection.
To control the transfection efficiency, cells were transfected with an EGFP
plasmid (enhanced green fluorescent protein) and viewed 48 hours after
transfection using inverted microscope equipped with UV-lamp. The number of
green fluorescent cells was visually estimated. Mock-transfected cells were used
as negative controls.
2.2.3 Preparation, Enzymatic Manipulation and Analysis of DNA
2.2.3.1 Mini-Preparation of Plasmid DNA
Mini-preparation of plasmid DNA was performed with Qiagen Plasmid Miniprep Kit
according to the manufacturer’s recommendations. For isolation of ~15 µg of
plasmid DNA, 3 ml overnight culture of E.coli in LB medium was prepared. DNA
was eluted in 15 µl of the elution buffer (EB; 10 mM Tris-HCl, pH 8.5) and stored at
-20°C.
2.2.3.2 Large-Scale Preparation of Plasmid DNA
For large-scale plasmid isolation, the Qiagen Plasmid Maxiprep Kit was used.
Plasmid DNA preparations for transfection experiments were performed with
Qiagen Endofree Plasmid Maxiprep Kit. Plasmid DNA was isolated according to

Materials and Methods 27
the supplier’s manual. A 150 ml (Qiagen Plasmid Maxiprep Kit) or 100 ml (Qiagen
Endofree Plasmid Maxiprep Kit) E.coli overnight culture was prepared for each
experiment. The pellet was resuspeded in a volume of EB buffer that the final
concentration of DNA was ~1.0-1.5 µg/µl.
2.2.3.3 Measurement of DNA Concentration
Concentration of DNA was measured using a GeneQuant II RNA/DNA
spectrophotometer (Pharmacia Biotech). Typical OD 260/280 ratios were ~1.7-1.8.
2.2.3.4 Digestion of DNA with Restriction Endonucleases
Digestion of DNA with restriction endonucleases was performed according to the
recommendations of the manufacturer. For the digestion of 1-2 µg of DNA, 10 U of
enzyme were added with an appropriate buffer in a final volume of 20 µl.
Reactions were incubated for 14-16 hours.
For cloning experiments, the digested DNA was subsequently separated in
agarose gel, excised from the gel, and purified with QIAquick Gel Extraction Kit.
Alternatively, QIAquick PCR Purification Kit was used to purify PCR-amplified
fragments with incorporated restriction sites. An additional purification step for
DNA was included for cloning experiments. The DNA was precipitated with 0.5
volumes of 4 M NaAc, pH 5.2 and 2.5 volumes of cold 100% ethanol, and
incubated for 1 hour at -20°C. For PCR-amplified and subsequently digested DNA
fragments, Pellet Paint Co-Precipitant (Novagen) was included in the precipitation
reaction. Then, the solution was centrifuged at 14 000 x g and 4°C for 30 min, the
pellet was washed with 1 ml 70% ethanol, and centrifuged a second time at
14 000 x g and 4°C for 5 min. Finally, the pellet was shortly air-dried and
resuspeded in 10 µl of EB buffer.
2.2.3.5 Vector Dephoshorylation
To exclude self-ligation of the vector DNA, the protruding 5’-end of the vector was
dephosphorylated with calf intestinal alkaline phosphatase (CIAP). The reaction
was performed according to the recommendations of the supplier. One unit of
CIAP was diluted for immediate use in 1 x CIAP Reaction Buffer and incubated
with the vector DNA at 37°C for 30 minutes. After that time, another aliquot of

Materials and Methods 28
diluted CIAP was added and the incubation was continued at 37°C for additional
30 minutes. The reaction was stopped by incubation at 75°C for 15 minutes. The
dephosphorylated DNA was then purified by QIAquick PCR Purification Kit
followed by DNA precipitation.
2.2.3.6 DNA Ligation
Ligation of DNA fragments into plasmid vectors was performed with Rapid DNA
Ligation Kit. Experiments were performed according to the protocol of the supplier.
A maximum of 200 ng of total DNA (vector + insert) at the molar ratios of vector
DNA to insert DNA 1:2 and 1:5 were used. The reactions were incubated for 5 min
at room temperature and then placed on ice. To determine the efficiency of
ligation, 5 µl of the reaction mix were run on an agarose gel and visualised with
ethidium bromide.
2.2.3.7 Polymerase Chain Reaction (PCR)
Amplification of DNA was performed according to the following protocol:
Template DNA 25.0 ng – 0.5 µg 10 x PCR buffer (including 15 mM MgCl2) 2.50 µl dNTP mix (each 10 nM) 1.00 µl 5’- and 3’- oligonucleotide primers 1.00 µl (each) AmpliTaq DNA polymerase (1U) 0.25 µl H2O filled up to 25.0 µl
For amplification of DNA fragments from PAC genomic clone, 5% DMSO was
added to the reaction.
Typical cycling profiles were programmed in Primus 96 Plus Thermal Cycler
(MWG-Biotech) as follows:
Denaturation of double-stranded DNA 95°C 30 sec Annealing of oligonucleotides to the template DNA
Ta 30 sec
Elongation 72°C 30/60 sec
30 cycles
Extension 72°C 5 min Chilling 4°C up to 1 h

Materials and Methods 29
Annealing temperatures were calculated using the formula: Ta = Tm - 2°C, where
Tm is the melting temperature of the primers used for amplification. Tm of each
oligonucleotide primer was calculated as follows: Tm = 4 x (G + C) + 2 x (A + T),
where G – guanine, C – cytosine, T – thymine, A – adenine.
2.2.3.8 Purification of PCR-Amplified Fragments of DNA
Purification of PCR-amplified DNA fragments was performed with QIAquick PCR
Purification Kit according to the supplier’s protocol. Purified PCR fragments were
controlled by agarose gel electrophoresis.
2.2.3.9 Sequencing
Sequencing analysis was performed on a LI-COR automated DNA sequencer
(MWG-Biotech) using fluorescent primers labelled with the tricarbocyanine dye
IRD800 at their 5’-end.
Gel components were pre-mixed the following way:
30 ml Sequagel XR (Biozym)
7.5 ml Sequagel-buffer (Biozym)
150 µl 10% Ammonium persulfate (APS)
15 µl TEMED
and polymerised for 1 hour.
Cycle sequencing reactions were done using the Thermo-Sequenase
Fluorescent-Labeling Cycle-Sequencing Kit according to a protocol of the supplier.
The reactions were pre-mixed the following way:
4 µl H2O
4 µl plasmid DNA (100-300 ng/µl)
4 µl IRD800-labelled primer (2 pmol/µl)
to a total reaction volume of 12 µl.
The pre-mix was distributed in four tubes, 3 µl in each, and 1.3 µl of Thermo-
Sequenase DNA Polymerase and Termination Mix A/C/G/T was added to each
tube.

Materials and Methods 30
The following parameters were used for a cycle-sequencing:
30 sec 95°C 15 sec Ta 30 cycles 1 min 70°C
Each reaction was stopped with 4 µl of a Stop/Loading Buffer. Samples were then
analysed by electrophoresis or stored at -20°C.
The reaction tubes were heated for 5 min at 70°C to denature the samples.
Then 1.3 µl/well was loaded onto sequencing gel, and run overnight. Data were
analysed using a LI-COR user program.
2.2.3.10 Electrophoretic Separation of DNA
Gel electrophoretic separation of DNA was performed in 1 to 2% agarose gels run
at 30 to 80V with 0.5 x TBE as a running buffer. Samples were diluted in
6 x Loading Dye (Promega) and loaded on gels containing 0.1 µg/ml ethidium
bromide for visualisation.
10 x TBE
108 g Tris-base
55 g Boric acid
40 ml 0.5 M EDTA, pH 8.0
adjusted with H2O to 1 l
2.2.3.11 Elution of DNA Fragments from a Gel
For elution of DNA fragments from agarose gels, the QIAquick Gel Extraction Kit
was used. DNA fragments were excised from the gel on UV light and handled as
recommended by the manufacturer. DNA was eluted in 30 µl of EB buffer, purified,
and concentrated by ethanol precipitation.
2.2.3.12 Southern Blot Analysis
For Southern blot analysis, DNA samples were loaded onto a 1% agarose gel and
run at 50V for 4 hours or overnight. Following electrophoresis, the gel was
processed for blotting by depurination, denaturation, and neutralization. The gel
was rinsed in H2O between each step.

Materials and Methods 31
For depurination, the gel was placed in 0.25 M HCl and agitated gently for 15 min.
Then, the gel was submerged in denaturation buffer (0.5 M NaOH/1.5 M NaCl)
and incubated for 45 min with gentle agitation. To neutralize the gel, it has been
submerged in neutralization buffer (0.5 M Tris-HCl/1.5 M NaCl) and incubated for
30 min with gentle agitation. Then, the neutralization solution was replaced with
the fresh one and incubated for further 30 min.
The DNA was transferred from the gel onto the Hybond-N+ membrane by
vacuum transfer using the Vacuum blotter (Model 785, BIO-RAD) for 90 min. 10 x
SSC was used as a transfer buffer. The membrane was pre-wetted with H2O and
then submerged for 5 min in transfer buffer. Following the transfer, the membrane
was rinsed for 5 min in 2 x SSC, air-dried, and cross-linked by UV exposure at
120 000 microjoules/cm2. The membrane was wrapped in plastic foil and stored at
4°C until use.
DNA probes were labelled with [α-32P] dCTP by random oligonucleotide
priming using Megaprime DNA Labeling System, according to the manufacturer’s
recommendations. Typically, 25 ng of labelled probe was used for each
hybridization. Unincorporated nucleotides were removed using QIAquick
Nucleotide Removal Kit, according to the protocol of the supplier. Subsequently,
the radioactively labelled probe was denatured at 98°C for 5 min and quickly
placed on ice.
Prehybridization and hybridization were carried out in glass tubes in a
commercial hybridization oven. The membrane was placed RNA-side-up in a
hybridization tube, ~5 ml of pre-warmed ExpressHyb solution were added and it
was prehybridized with rotation at 60°C for 30 min. Following prehybridization, the
denaturated probe was added into the hybridization solution and the incubation
was continued at 60°C overnight.
The next day, the blot was rinsed quickly in 2 x SSPE/0.1% SDS wash
solution. Then, the washing solution was replaced with the fresh one and
incubated with rotation for 1 hour at room temperature. After that time, the solution
solution was replaced with 0.1 x SSPE/0.1% SDS wash solution and incubated
with rotation for 1 hour at 60°C. After the final wash, the membrane was
immediately covered with plastic wrap and mounted. Autoradiography was
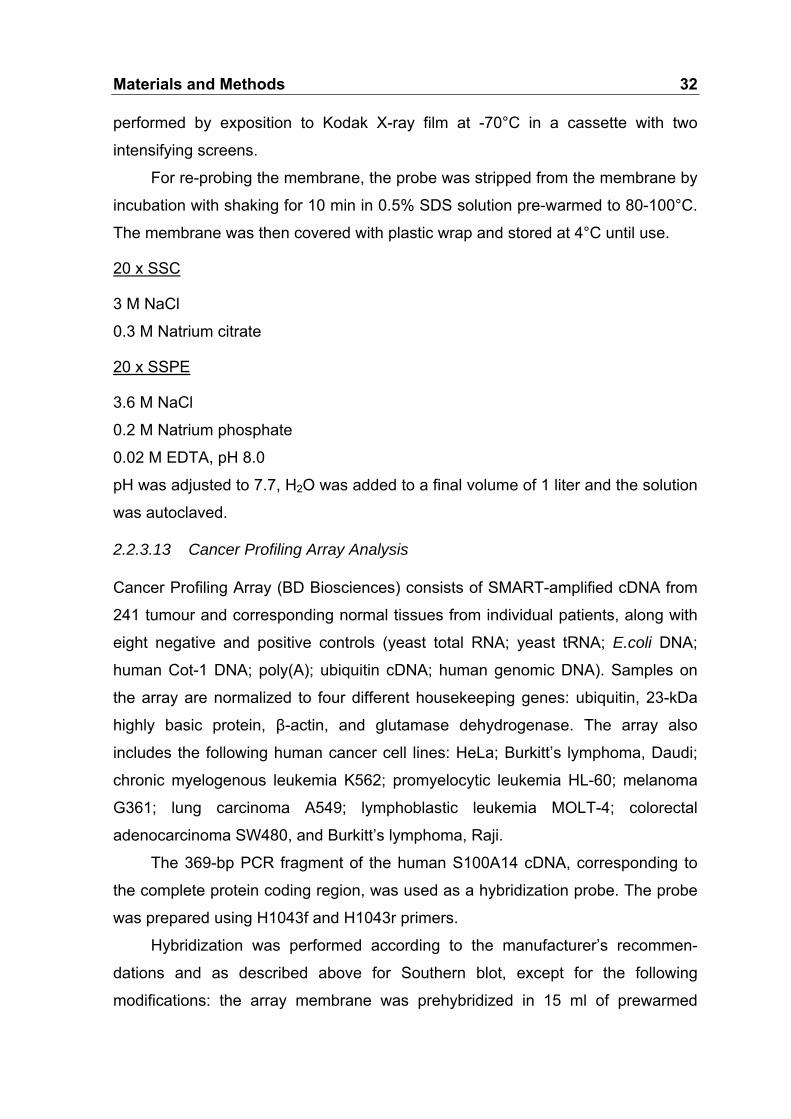
Materials and Methods 32
performed by exposition to Kodak X-ray film at -70°C in a cassette with two
intensifying screens.
For re-probing the membrane, the probe was stripped from the membrane by
incubation with shaking for 10 min in 0.5% SDS solution pre-warmed to 80-100°C.
The membrane was then covered with plastic wrap and stored at 4°C until use.
20 x SSC
3 M NaCl
0.3 M Natrium citrate
20 x SSPE
3.6 M NaCl
0.2 M Natrium phosphate
0.02 M EDTA, pH 8.0
pH was adjusted to 7.7, H2O was added to a final volume of 1 liter and the solution
was autoclaved.
2.2.3.13 Cancer Profiling Array Analysis
Cancer Profiling Array (BD Biosciences) consists of SMART-amplified cDNA from
241 tumour and corresponding normal tissues from individual patients, along with
eight negative and positive controls (yeast total RNA; yeast tRNA; E.coli DNA;
human Cot-1 DNA; poly(A); ubiquitin cDNA; human genomic DNA). Samples on
the array are normalized to four different housekeeping genes: ubiquitin, 23-kDa
highly basic protein, β-actin, and glutamase dehydrogenase. The array also
includes the following human cancer cell lines: HeLa; Burkitt’s lymphoma, Daudi;
chronic myelogenous leukemia K562; promyelocytic leukemia HL-60; melanoma
G361; lung carcinoma A549; lymphoblastic leukemia MOLT-4; colorectal
adenocarcinoma SW480, and Burkitt’s lymphoma, Raji.
The 369-bp PCR fragment of the human S100A14 cDNA, corresponding to
the complete protein coding region, was used as a hybridization probe. The probe
was prepared using H1043f and H1043r primers.
Hybridization was performed according to the manufacturer’s recommen-
dations and as described above for Southern blot, except for the following
modifications: the array membrane was prehybridized in 15 ml of prewarmed
Materials and Methods 33
ExpressHyb solution with 1.5 mg yeast tRNA at 65°C for 2 hours. The
radioactively labelled cDNA probe was mixed with 100 µg of yeast tRNA,
denatured at 98°C for 10 min, and hybridized to the array at 65°C overnight.
Following exposure to a phosphor screen for 14 hours and 7 hours, the array was
scanned with the GS-250 Molecular Imager (BIO-RAD, Munich, Germany) at a
800-µm resolution. The results were quantified using the Molecular Analyst
Software Version 1.4 by applying a grid to the image to measure the intensity of
the hybridization signal of every spot. After background subtraction, the image was
normalized using all spots on the membrane as reference points. The threshold
values for up- and down-regulation were chosen based on careful inspection of
tumour/normal intensity ratios for all the spots on the membrane (intensity ratio >2
for up-regulation and <0.5 for down-regulation).
2.2.3.14 Fluorescence in situ Hybridization (FISH) Analysis
The FISH analysis was performed by Ms. N. Deutschmann (Institute of Pathology,
Berlin, Germany) as described by Lichter and Ried (Godsen, 1994). The DNA from
the genomic PAC clones I22230, A12752, and D11609 was purified with Qiagen
Maxi Kit and labelled by nick-translation with biotin-16-dUTP (Roche). Next,
hybridization on metaphases of normal lymphocytes was performed. Images were
captured with a cooled charge-coupled device camera (Photometrics, Tucson,
Arizona) and processed using a custom made program (Karyomed, KaryoMedics,
Germany).
2.2.3.15 5’ Rapid Amplification of cDNA Ends (5’ RACE)
The 5’-end of the S100A14 cDNA was determined with 5’ RACE Kit according to
the supplier’s manual, using poly(A) RNA from normal colon tissue. The gene-
specific primers for 5’ RACE included GPS1, NGPS1, and NGPS2. The PCR
products were cloned into the pCR2.1 TA Cloning Vector and 24 clones were
sequenced.
2.2.4 Dual-Luciferase Reporter Assay
Human embryonic epithelial kidney cells HEK 293 were plated in 6-well plates at
1.5 x 10⁵ cells/well a day before transfection. The cells were transfected for

Materials and Methods 34
6 hours using a transfection mixture consisting of 200 µl of Opti-MEM, 4 µl of
LipofectAMINE, 1 µg of Firefly luciferase reporter constructs driven by the
S100A14 promoter fragments, and 0.1 µg of pRL-TK Renilla luciferase reporter
vector as an internal control for transfection efficiency.
For co-transfection experiments, cells were transfected with a total of 1 µg
DNA, consisting of a mixture of 0.5 µg of the p2C-luc plasmid and 0.5 µg of the
expression vector encoding wild type p65. Where necessary, “empty” vector for
p65 (pcDNA3Flag) or pGL3-Basic vector were included to maintain constant
amounts of DNA.
The assays for firefly and Renilla luciferase activity were performed using the
Dual-Luciferase Reporter Assay Kit (Promega), as recommended by the
manufacturer. Forty-eight hours after transfection, the cells were washed once
with 1 x PBS and cell lysates were prepared by passive lysis in 250 µl of freshly
prepared 1 x passive lysis buffer (Promega). Firefly and Renilla luciferase activities
were assayed in 20 µl of cell lysate pre-dispensed into 5-ml Sarstedt tubes,
followed by sequential autoinjection of 25 µl LAR II and Stop&Glo reagents using
the Lumat LB9507 luminometer fitted with automatic injection system (Berthold
Technologies, Germany). The luminometer was programmed to perform a
2-second per measurement delay, followed by a 10-second measurement period
for each reporter assay.
Luciferase read-out was obtained from triplicate transfections and averaged.
Firefly luciferase activity was normalized to the Renilla luciferase activity, and the
results were expressed as relative luciferase activity.
2.2.5 Preparation and Analysis of RNA
2.2.5.1 RNA Preparation
Total RNA from cultured cells was isolated using TRIzol (Invitrogen). Cells growing
on 100-mm dishes were washed once with pre-cooled 1 x PBS and lysed by
adding 2 ml of TRIzol reagent and passing the cell lysate several times through a
pipette. Then the lysed cells were scraped off with a sterile cell scraper (Sarstedt)
and transferred to 11-ml Sarstedt tubes. The samples were then extracted with
0.4 ml of chloroform (0.2 ml chloroform per 1 ml of TRIzol reagent) by inversion
Materials and Methods 35
mixing. Phase separation was achieved by placing the samples at room tempe-
rature for 5 min, and centrifuging at 9 000 x g and 4°C for 20 min. The aqueous
layer was mixed with 1 ml of isopropanol (0.5 ml isopropanol per 1 ml of TRIzol
reagent) to precipitate the RNA. Samples were incubated at room temperature for
10 min, then centrifuged at 10 000 x g and 4°C for 10 min. The RNA pellet was
washed with 2 ml of 80% ethanol (1 ml ethanol per 1 ml of TRIzol reagent), and
centrifuged at 7 500 x g and 4°C for 5 min. The pellet was air-dried, resuspended
in DEPC-treated water, and the RNA was quantified using a GeneQuant II
RNA/DNA spectrophotometer (Pharmacia Biotech). The concentration of RNA was
adjusted to ~1.0-1.5 µg/µl. Typical OD 260/280 ratios were ~1.4-1.5. To assess
the integrity of the RNA preparations, a test formaldehyde-agarose gel
electrophoresis was performed.
Tissue samples were homogenized in 4 ml of TRIzol reagent using a power
homogenizer (MICRA). The homogenized samples were incubated at room
temperature for 5 min and followed the standard RNA extraction procedure as
outlined above.
Poly(A) RNA was isolated using FastTrack 2.0 Kit (Invitrogen) according to
the recommendations of the manufacturer.
DEPC-treated H2O
1 l H2O
1 ml Diethylpyrocarbonate (DEPC)
The solution was stirred on a magnetic stirrer overnight in a fume hood and
autoclaved the next day.
2.2.5.2 Electrophoretic Separation of RNA
A 10-µg aliquot of total RNA was size-fractionated on 1% denaturing agarose gel
in the presence of 2.2 M formaldehyde.
To denature the RNA sample, a denaturation reaction was set up:
RNA 10.0 µg 10 x MOPS 1.0 µl Formaldehyde 3.5 µl Formamide 10.0 µl 10 x Gel-loading buffer 2.0 µl

Materials and Methods 36
The RNA solution was incubated for 10 min at 55°C and then quickly chilled on
ice. After loading, the gel was run in 1 x MOPS electrophoresis buffer at 50V for
~5 hours, visualised and photographed on a UV transilluminator.
Denaturing agarose gel
1 g Agarose
72.2 ml of DEPC-treated H2O
agarose was disolved by boiling in a microwave oven and cooled to ~50°C. In a
chemical fume hood, 10 ml of 10 x MOPS electrophoresis buffer and 17.8 ml of
formaldehyde were added and the gel was casted.
10 x MOPS
0.2 M MOPS
50 mM Sodium acetate
10 mM EDTA, pH 8.0
pH was adjusted to 7.0 with NaOH
10 x Gel-loading buffer
500 µl Formamide
2 µl EDTA, pH 8.0
5 µl Ethidium bromide
0.1% w/v Bromophenol blue
2.2.5.3 Northern Blot Analysis
Electrophoretically separated RNA was transferred from gel onto Hybond-N
membrane by upward capillary transfer. Prior to the transfer, the gel was rinsed
with H2O. The membrane was prepared for the transfer by immersing in 10 x SSC
for 5 min and the gel was placed on a solid support in an inverted position. Then,
the membrane was placed on the top of the gel, followed by 6 pieces of Whatman
3MM papers and a stack of paper towels. A glass plate was put on it and weighted
down with a 500-g weight. The transfer occurred overnight in 20 x SSC buffer. The
next day, the membrane was immersed for 5 min in 2 x SSC, air-dried, and cross-
linked by UV irradiation. If not used immediately, the membrane was stored at 4°C.

Materials and Methods 37
The radioactive labelling of the probe, hybridization, washing of the blots, and
stripping of radiolabelled probes were carried out as described for Southern blot
analysis (Section 2.2.3.12). Following modifications to the protocol were
introduced for Northern blot analysis: the hybridization temperature was 64°C and
the membrane washing times were 40 min. All the washing steps were performed
with solutions prepared with DEPC-treated H2O. As a hybridization probe, the PCR
fragment of the human S100A14 cDNA corresponding to the complete protein
coding region was used. To confirm equal RNA loading and transfer, the 180-bp
fragment of the mouse 18S cDNA that cross-hybridizes with human 18S RNA was
used.
Typically, the blots were exposed to a phosphor screen for different time
periods and scanned with the GS-250 Molecular Imager (BIO-RAD, Munich,
Germany) at a 200-µm resolution. The results were quantified using the Molecular
Analyst Software Version 1.4. Alternatively, if autoradiography was performed, the
autoradiographs were scanned to quantify the intensity of the radiographic bands
using a scanning laser BIO-RAD Laboratories Imaging Densitometer Model
GS-670 and densitometry was performed.
2.2.5.4 Reverse Transcriptase-PCR (RT-PCR) Analysis
For the detection and expression analysis of the S100A14 mRNA, the
THERMOSCRIPT RT-PCR System (Invitrogen) was applied. First, cDNA
synthesis was performed using 3 µg of total RNA primed with gene-specific primer
H1043-rev and control gene primer GAPDH-rev. The RNA was reverse-
transcribed at 55°C for 1 hour according to the manufacturer’s recommendations.
The reaction was terminated by heating at 85°C for 5 min. In the second step,
PCR amplification was carried out using 2 µl of the cDNA synthesis reaction and
primed with gene specific primers designed from open reading frame: ex1-for or
ex3-for, and H1043-rev. A control PCR reaction for GAPDH was performed in
parallel using the primer pair: GAPDH-for and GAPDH-rev. Amplification resulted
in DNA fragments of 249-bp (ex1-for and H1043-rev), 425-bp (ex1-for and
H1043-rev), and 800-bp (GAPDH-for and GAPDH-rev). PCR products were
analysed on a 1.2% agarose gel and viewed on UV light.
Materials and Methods 38
2.2.6 Analysis of Proteins
2.2.6.1 Protein Isolation from Mammalian Cells
For protein isolation, cells were washed twice with cold 1 x PBS and lysed with
denaturing hypotonic lysis buffer on ice. The lysed cells were scraped off the
plates, transferred into 1.5-ml Eppendorf tubes, and incubated with shaking for
10 min at 95°C. Then, the protein samples were aliquoted and stored at -20°C.
Denaturing hypotonic lysis buffer
1% SDS
10 mM Tris-HCl, pH 7.5
2 mM EDTA, pH 8.0
2.2.6.2 Subcellular Fractionation
Cells were washed twice with cold 1 x PBS and lysed in hypotonic lysis buffer
(1.2 ml per 100-mm plate) for 10 min. The cell lysate was homogenized in a pre-
cooled Dounce homogenizer by repeated strokes and centrifuged for 10 min at
2 700 x g to pellet the nuclei using a Sorvall SA-600 rotor. The nuclear pellet was
resuspended in a volume of 50 µl of 2 x SDS sample buffer.
The postnuclear supernatant was transferred into Beckman tubes (13 x
15 mm) and centrifuged for 30 min at 60 000 x g and 4°C to pellet the membranes
using a Beckman TLN 100.3 rotor. The crude membranes were resuspended in a
volume of 100 µl of 2 x SDS sample buffer.
The postmembrane supernatant was further fractionated by methanol/
chloroform precipitation to recover cytoplasmic proteins. Four ml methanol were
added to the postmembrane supernatant, then 1 ml chloroform was added and
mixed, then 3 ml of H2O were added and mixed. The solution was centrifuged at
15 000 x g for 15 min at 4°C. The upper phase was discarded, and 6 ml methanol
were added, mixed and centrifuged again at 15 000 x g for 15 min at 4°C. The
pellet was dried and resuspended in 100 µl of 2 x SDS sample buffer.
Following dissolving of the pellets in 2 x SDS sample buffer, samples were
incubated with shaking for 10 min at 95°C, centrifuged for 5 min at 14 000 x g, and
stored at -20°C until use.

Materials and Methods 39
The resulting fractions were tested for their enrichment in soluble, membrane, and
nuclear fractions by Western blotting with anti-α-tubulin, anti-pan RAS, and anti-
phospho-c-JUN antibodies, respectively.
Hypotonic lysis buffer
10 mM Tris-HCl, pH 8.0
0.1 mM DTT
1 mM PMSF
1 tab/10 ml protease inhibitor Complete tabs (Roche)
2 x SDS sample buffer
120 mM Tris-HCl, pH 6.8
200 mM DTT
4% w/v SDS
10% w/v Glycerol
0.002% w/v Bromophenol blue
2.2.6.3 Determination of Protein Concentration
Protein content was determined by colorimetric amido-black method as described
by Schaffner and Weissmann (1973).
A standard curve for bovine serum albumine (BSA) was created by preparing 0.5,
0.75, 1, 2, 4, 8, and 10-µg duplicate dilutions of 200 mg/ml stock solution of BSA.
Then, 1 µl of protein standards (applied in duplicates) and 1 µl of protein
sample were applied to the nitrocelulose membrane (Schleicher & Schüll). The
membrane was placed in 0.1% amido-black for 1 min and then washed
extensively with shaking using freshly prepared destaining solution. The destaining
solution was replaced several times till the membrane was completely destained.
The protein spots were cut out, put into Eppendorf tubes, and 800 µl of elution
solution were added. The tubes were placed in an Eppendorf shaker and shaken
for 30 min.
Absorbance of standards and protein samples was measured at 630 nm in
disposable 1.5 ml semi-micro cuvettes (Brand) using Biochrom 4060 software in
UV-Visible Spectrophotometer (Pharmacia LKB). Protein concentration was
Materials and Methods 40
determined by plotting absorbance of the protein samples against the standard
curve using Microsoft Excel program.
Destaining solution
90 ml Methanol
2 ml Acetic acid
8 ml H2O
Elution solution
50 ml Ethanol
10 µl 0.5 M EDTA, pH 8.0
0.5 ml 5 M NaOH
49.5 ml H2O
2.2.6.4 One-Dimensional SDS Gel Electrophoresis (PAGE)
Protein samples were separated by polyacrylamide gel electrophoresis (PAGE)
using the standard Laemmli method.
Protein samples were mixed with 1 volume of 2 x SDS sample buffer and
denatured for 5 min at 95°C. Equal amounts of proteins were loaded onto 12% gel
and run ~4 hours at 65V in 1 x running buffer using Mini-PROTEAN 3 Cell
electrophoresis tank (BIO-RAD). Protein separation was controlled by running a
Prestained Broad Range Protein Marker (BIO-RAD).
Separating gel: 10 ml of 12% gel
3.35 ml H2O
2.5 ml 1.5 M Tris-HCl, pH 8.8
4.0 ml 30% Acrylamide/Bisacrylamide
100 µl 10% SDS
50 µl APS
10 µl TEMED
Stacking gel: 5 ml of 4% gel
3.05 ml H2O
1.25 ml 0.5 M Tris-HCl, pH 6.8
0.66 ml 30% Acrylamide/Bisacrylamide

Materials and Methods 41
50 µl 10% SDS
50 µl APS
10 µl TEMED
5 x running buffer
15.1 g/l Tris-base
72.0 g/l Glycine
5.0 g/l SDS
An alternative protocol was used for S100A14 gel electrophoresis. Protein
samples were mixed with 1 volume of 2 x tricine sample buffer and denatured for
5 min at 95°C. Equal amounts of proteins were loaded onto 15% Tris-tricine gel
and run in 1 x cathode (upper tank) and 1 x anode (lower tank) electrophoresis
buffer for ~1 hour at 35V and ~5 hour at 50V.
2 x Tricine sample buffer
2.0 ml 0.5 M Tris-HCl, pH 6.8
2.4 ml Glycerol
4.2 ml 20% SDS
0.31 g DTT
0.02% w/v Coomassie blue
adjusted with H2O to 10 ml
Separating gel: 10 ml of a 15% gel
1.66 ml H2O
3.32 ml 3 M Tris-HCl, pH 8.45
1.06 ml Glycerol
3.75 ml 40% Acrylamide/Bisacrylamide
150 µl 20% SDS
50 µl APS
10 µl TEMED
Stacking gel: 5 ml of 4% gel
2.71 ml H2O
1.66 ml 3 M Tris-HCl, pH 8.45

Materials and Methods 42
0.5 ml 40% Acrylamide/Bisacrylamide
75 µl 20% SDS
50 µl APS
10 µl TEMED
Cathode electrophoresis buffer
12.11 g/l Tris-base
17.92 g/l Tricine
1 g/l SDS
stored at 4°C
Anode electrophoresis buffer
24.22 g Tris-base
diluted to 1 l with H2O, adjusted to pH 8.9, and stored at 4°C
2.2.6.5 Western Blot Analysis
Following electrophoresis, the stacking gel was discarded, and the separating gel
was submerged in transfer buffer for 20 min. During that time, PVDF membrane
(Amersham) was activated in methanol for 11 sec, washed in H2O for 5 min, and
equilibrated in transfer buffer for 10 min. On a semidry transfer unit (Peqlab
Biotechnology GmbH) 6 sheets of Whatman paper pre-wetted in transfer buffer,
the PVDV membrane, the gel, and 6 sheets of pre-wetted Whatman paper were
assembled. The protein transfer proceeded for 45 min at 200 mA.
Transfer efficiency was controlled by Coomassie blue staining of the gel for
30 min, followed by destaining and visualisation. After the transfer, the membrane
was washed briefly in TBST buffer and blocked for 1 hour in 10 ml of blocking
buffer at room temperature with shaking on a rotor platform. After the blocking
procedure, the membrane was washed 3 x 5 min in 20 ml TBST, and incubated
overnight with the primary antibody in 5% BSA solution (5% BSA in TBST) at 4°C.
The next day, the membrane was washed 3 x 10 min in 20 ml TBST, and
incubated with the corresponding secondary antibody for 1 hour. The membrane
was washed again 3 x 10 min in TBST, and the immunocomplexes were detected
with an Enhanced Chemiluminescence Kit (ECL, Amersham), as recommended by
the supplier.

Materials and Methods 43
For S100A14 detection, the membranes were incubated with the primary antibody
for 2 hours in blocking buffer at room temperature.
For re-probing, the membranes were incubated in stripping buffer for 30 min
at 70°C and washed 3 x 10 min in TBST. The membranes were subsequently
blocked in blocking buffer and immunoblotted with a primary antibody as outlined
above.
Primary antibodies, corresponding secondary antibodies, and their dilutions
Primary antibody Dilution Secondary antibody Dilution Anti-β-actin 1:10 000 Peroxidase-conjugated rabbit anti-
mouse 1:5000
Anti-AKT 1:1000 Peroxidase-conjugated goat anti- rabbit
1:5000
Anti-c-JUN 1:1000 Peroxidase-conjugated goat anti- rabbit
1:5000
Anti-p38 1:1000 Peroxidase-conjugated goat anti- rabbit
1:5000
Anti-Phospho-AKT (Ser473) 1:1000 Peroxidase-conjugated goat anti- rabbit
1:5000
Anti-Phospho-HSP27 (Ser82) 1:1000 Peroxidase-conjugated goat anti- rabbit
1:5000
Anti-Phospho-c-JUN (Ser63) 1:1000 Peroxidase-conjugated goat anti- rabbit
1:5000
Anti-Phospho-p38 (Thr180/Tyr182)
1:1000 Peroxidase-conjugated goat anti- rabbit
1:5000
Anti-Phospho-p44/42 MAPK (Thr202/Tyr204)
1:1000 Peroxidase-conjugated goat anti- rabbit
1:5000
Anti-Phospho-SAPK/JNK (Thr183/Tyr185)
1:1000 Peroxidase-conjugated goat anti- rabbit
1:5000
Anti-S100A14 affinity-purified 1:2700 Peroxidase-conjugated goat anti- rabbit
1:5000
Anti-SAPK/JNK 1:1000 Peroxidase-conjugated goat anti- rabbit
1:5000
Anti-pan-RAS 1:800 Peroxidase-conjugated rabbit anti-mouse
1:5000
Anti-α-tubulin 1:5000 Peroxidase-conjugated rabbit anti-mouse
1:5000
Anti-V5 1:5000 Peroxidase-conjugated rabbit anti-mouse
1:5000
Transfer buffer
5.81 g Tris-base
2.93 g Glycine

Materials and Methods 44
1.875 ml 20% SDS
200 ml Methanol
H2O was added to 1 l
TBST
10 ml 1 M Tris-base, pH 8.0
30 ml 5 M NaCl
500 µl Tween-20
H2O was added to 1 l
Coomassie blue staining solution
50% v/v Methanol
0.05% v/v Coomassie blue R-250
10% v/v Acetic acid
40% H2O
Coomassie blue destaining solution
5% v/v Methanol
7% v/v Acetic acid
88% H2O
Blocking buffer
5% Non-fat dry milk (Difco, Becton Dickinson, MD, USA) in TBST
Stripping buffer
25 ml Tris-HCl, pH 6.7
20 ml 20% SDS
1.4 ml 14.3 M β-Mercaptoethanol
H2O was added to 200 ml
2.2.7 S100A14 Antibody Generation
The anti-S100A14 polyclonal antibody was raised by immunizing two rabbits with
the NH2 – CEAAKSVKLERPVRGH – COOH peptide located in the C-terminus of
S100A14 protein (Eurogentec, Belgium). Animals were immunized four times at
2-weeks intervals by subcutaneous injection of 50-100 µg of peptide in an

Materials and Methods 45
emulsion with KLH. The titer of the antiserum was determined by ELISA using
100 ng of the antigen peptide. A dilution of maximally 1:1000 (antiserum SA1349)
is possible for the detection of 4 µg of the antigen peptide. The antibody was
affinity-purified with the antigen peptide using standard methods (Eurogentec,
Belgium).
Potential cross-reactivity of the antibody with other S100 family members
was examined by Western blot using recombinant S100 proteins: S100A1,
S100A2, S100A3, S100A4, S100A5, S100A6, S100A8, S100A9, S100A12,
S100A13, S100B, and a protein extract from HBE cells as a positive control. The
recombinant proteins were kindly provided by Prof. Dr. C. Heizmann (University of
Zürich, Switzerland) and Dr. C. Kerkhoff (University of Münster, Germany). No
cross-reactivity with any S100 protein tested was detected confirming that the
C-terminal peptide used for rabbit immunisation is indeed S100A14-specific (data
not shown).
2.2.8 Immunofluorescence Analysis
For immunofluorescence analysis, cells were seeded and grown on 18 x 18 mm
glass cover slips. After fixation with freshly prepared 3% paraformaldehyd in
1 x PBS for 15 min at room temperature, cells were permeabilized with 0.2%
Triton X-100 for 2 min, washed 3 x 5 min with 1 x PBS and incubated for 1 hour in
blocking buffer (10% FCS in 1 x PBS).
The S100A14 affinity-purified antibody was diluted 1:2000, and anti-V5
antibody 1:200 in blocking buffer. Cover slips were incubated with the primary
antibodies for 2 hours at room temperature, then washed 3 x 5 min in PBS, and
incubated with the secondary antibodies for 1 hour. Fluorescein isothiocyanate
(FITC)-conjugated goat anti-mouse IgG (H + L) antibody at 1:200 and FITC-
conjugated goat anti-rabbit antibody at 1:200 were used. Nuclei were stained with
4,6-diamidino-2-phenylindole (DAPI) (Sigma, Steinheim, Germany) for 5 min.
Cover slips were then washed with PBS, air-dried, and mounted on glass slides
with DABCO anti-fade reagent (Merck, Darmstadt, Germany). They were
examined using Leica confocal laser-scanning microscope (Jena, Germany).

Materials and Methods 46
2.2.9 Immunohistochemistry
Immunohistochemical staining of tissue sections was performed by Ms. B. Thews,
Ms. K. Witkowski, and Ms. K. Petri at the Immunohistochemistry Laboratory of the
Institute of Pathology, Charité in Berlin.
Paraffin-embedded archive material was retrieved from the files of the
Institute of Pathology of the Charité University Hospital. One-µm sections were cut
from the blocks, mounted on superfrost slides (Menzel-Gläser, Germany) or
ChemMate Capillary Cap Microscope slides (DAKO), dewaxed with xylene and
gradually hydrated. Antigen retrieval was performed by pressure cooking in 0.01 M
citrate buffer for 5 min. The primary antibody was incubated at room temperature
for 30 min. The biotinylated secondary antibody reagent of the ChemMate
Detection Kit (DAKO, Denmark), that reacts equally well with rabbit and mouse
immunoglobulins, was applied as recommended by the supplier. Detection took
place by indirect streptavidin-biotin method with alkaline phosphatase as the
reporting enzyme according to the manufacturer’s instructions. Chromogen-Red
(ChemMate Detection Kit) served as chromogen, afterwards the slides were briefly
counterstained with haematoxylin and aquaeously mounted.
Primary antibodies, corresponding secondary antibodies, and their dilutions
Primary antibody Dilution Secondary antibody
Anti-S100A14 1:1000 ChemMate biotinylated goat anti-rabbit
Anti-ERBB2 1:1000 ChemMate biotinylated goat anti-rabbit
Anti-Ki-67 1:1000 ChemMate biotinylated goat anti-mouse
Anti-ER 1:100 ChemMate biotinylated goat anti-mouse
Anti-PR 1:500 ChemMate biotinylated goat anti-mouse
Specificity of the S100A14 antibody was verified by incubating tissue sections with
pre-immune serum, demonstrating completely negative staining.
Immunostained slides were analysed under a Zeiss Axioskop light
microscope and scored after the entire slide had been evaluated. The
immunohistochemical evaluation was performed by Prof. Dr. I. Petersen.
In order to analyse the expression level of S100A14, we introduced a
semiquantitative scoring system consisting of four different staining patterns to

Materials and Methods 47
distinguish between positive and negative staining. The highest positive score has
been assigned to score 3, where the entire tissue shows strong positive staining.
Moderately positive staining represents score 2. Score 1 was assigned to
borderline positive staining of the protein and score 0 represents the complete
negative staining (Fig. 2).
Score 0 Score 1
Score 2 Score 3
Score 0 Score 1
Score 2 Score 3
Fig. 2 The scoring system used for immunohistochemical analysis of S100A14. Examples shown are lung tumour tissue spots stained with anti-S100A14 antibody. The four different scores used are indicated.
ERBB2 immunostaining was evaluated using the method employed by the
HercepTest (DAKO) according to the degree and the proportion of plasma
membrane staining. ERBB2 expression was negative for a score of 0 to 1+.
A score of 0 was defined as no staining or plasma membrane staining in less than
10% of tumour cells. A score of 1+ comprised faint or partly stained plasma
membrane in more than 10% of tumour tissue. Tumours with scores of 2 or
greater were considered to be positive for ERBB2 overexpression. A score of 2+
was defined as weak to moderate complete plasma membrane staining in more

Materials and Methods 48
than 10% of tumour cells. A score of 3+ was interpreted as strong, complete
plasma membrane staining in more than 10% of tumour cells.
2.2.10 Tissue Microarrays (TMA) Generation
Tissue microarrays containing normal human tissues, as well as breast and lung
tumours were generated by Dr. Y. Yongwei and Ms. N. Deutschmann. The normal
human tissue array consisted of 29 tissue samples, the lung tumour array
consisted of 150 tissue samples, and the breast tumour array was composed of
146 tissue samples. All the tissue samples were derived from randomly selected
patients who underwent surgical resections performed at the Department of
Surgery, University Hospital Charité between 2000 and 2002.
Suitable areas for tissue retrieval were marked on standard haematoxylin-
eosin (HE) sections. Then, tissue cylinders with a diameter of 1.0 or 0.6 mm were
punched out of the paraffin block and transferred into a recipient array block using
a manual tissue arrayer purchased from Beecher Instruments (Woodland, USA).
The tissue array was cut in 1-µm sections without any sectioning aid like adhesive
tapes or additionally coated slides.
Limitations of the tumour material and slide damages were the main reasons
for the missing specimens on the tissue microarray slides. Tissue spots with
heterogeneous expression patterns for S100A14 were subsequently examined by
whole tissue section immunohistostaining.
2.2.11 Statistical Analysis
The Fisher’s exact test for categorical variables was used to compare
immunohistochemical results for S100A14 with other immunohistochemical
markers and clinicopathologic characteristics. All analysis were two-tailed, and the
criterion of significance was set at p < 0.05. The statistical analysis was
undertaken using the SPSS statistical package (Version 11.5).
2.2.12 Bioinformatics
Blast analysis was performed to search for homologies at the nucleotide level and
for pairwaise sequence alignments (National Center for Biotechnology Information,
http://www.ncbi.nlm.nih.gov/BLAST). Recognition sites for restriction enzymes
Materials and Methods 49
were identified with the Webcutter program at the Web address
http://www.firstmarket.com/cutter/cut2.html. S100A14 promoter region was
analysed by TRANSFAC 4.0 (http://www.transfac.gbf.de/TRANSFAC), using the
MatInspector V2.2 program. Parameters for MatInspector were set for 1.0 core
similarity (a 4-nt highly conserved sequence) and 0.85 matrix similarity, employing
the vertebrates matrix group. ClustalW 1.8 program was used for multiple
alignments of DNA sequences (http://www.ebi.ac.uk).
The ExPASy nucleotide translation tool (Swiss Institute of Bioinformatics,
http://www.expasy.ch/tools/dna.html) was applied to translate cDNA in all six
possible open reading frames. Sequence homologies at the amino acid level were
determined with the EMBnet-CH Blast program and potential posttranslational
modification sites with the PROSITE program (all the programs are available at the
ExPASy Molecular Biology Server). Hydrophobicity analysis based on the method
of Kyte and Doolittle was performed using the program ProtScale at the ExPASy
Molecular Biology Server. Protein secondary structure was predicted with the
PSIpred V2.0 (University College London, UK http://bioinf.cs.ucl.ac.uk/psipred).

50
3 Results
3.1 Identification of the Human S100A14 cDNA
3.1.1 Screening of SSH cDNA Libraries
To identify new potential cancer diagnostic or therapeutic targets, suppression
subtractive hybridization (SSH) transcript profiling was performed between normal
human cultured bronchial epithelial cells (HBE) and the metastatic small cell lung
carcinoma cell line H526 (Difilippantonio et al., 2003).
The quality of the SSH library was confirmed by Northern blot analysis,
indicating that 69% (236/342) of the clones were differentially expressed in the
tumour cell line. In an initial evaluation we used a limited panel of cell lines
including HBE cells, as well as lung tumour cell lines 2170, H526, and D51,
representing the three major subtypes (squamous cell carcinoma, adeno-
carcinoma, and small cell lung carcinoma). Thirty-one cDNAs scored as
differentially expressed in at least two of the tumour cell lines were analysed more
extensively on an extended panel of cell lines including small airway epithelial cells
(SAE), four immortalized HBE cells, and 32 lung cancer cell lines. The DNA
sequences of isolated cDNA fragments were then determined and compared with
those deposited in the GenBank database.
Based on our interest in further examining those transcripts with no homology
to any known gene, 6 partial cDNAs representing transcripts that were abundantly
expressed in normal lung epithelial cells but were absent or under-represented in
the majority of lung tumour cell lines were selected for further analysis. These
cDNA fragments were sent to the German Resource Center of the Human
Genome Project (RZPD, Heidelberg, Germany) for screening of human cDNA
libraries enriched in full-length cDNAs. Three of those cDNA fragments
represented the same unknown gene. Screening of the human lung, trachea, and
primary keratinocyte cDNA libraries yielded 13 positive clones out of which 9 were
confirmed positive by Southern blot analysis. Out of 5 clones containing the
longest inserts determined by NotI/SalI-restriction digest, clones DKFZp404H1043,
DKFZp404B1018, and DKFZp719J2437 were identified as candidate full-length
cDNA clones. Clone DKFZp404H1043 (designated H1043) with cDNA insert of

Results 51
1057 bp was chosen for further characterization. The insert size was in
accordance with the transcript size estimated by Northern blot analysis.
On the nucleotide level no homology to any known gene was found. Analysis
of the predicted protein sequence revealed an S100-specific EF-hand Ca2+-binding
domain as well as a high homology to the S100A13 calcium-binding protein.
Therefore, we designated the transcript S100A14 and submitted it to the NCBI
GenBank database under Accession No NM_020672 (LocusID LOC57402).
To verify the full-length cDNA sequence of S100A14 we performed 5’ RACE
on human colon cDNAs since this organ showed the most abundant expression of
the transcript in our Northern blot analysis. It provided additional 5’ UTR sequence,
not present in the H1043 clone. The predominant cDNA product was 1067 bp in
length.
3.1.2 Sequence Analysis of S100A14 cDNA
The cDNA was predicted to contain an open reading frame (ORF) of 104 amino
acids (nt 109-423), a 5’ untranslated region (UTR) of 108 bp, and a 3’ UTR of
644 bp. The putative ATG initiation codon was embedded in a strong Kozak
consensus sequence (CACCATGG) (Kozak, 1996) and was preceded by an in-
frame stop codon. A polyadenylation signal (nt 1028-1033) and a poly(A)-tail
beginning after nucleotide 1053 oriented the fragment and provided further
evidence for the predicted ORF. The nucleotide sequence and the predicted open
reading frame of S100A14 are shown in Fig. 3.
Computer-assisted analysis of the deduced amino acid sequence revealed
an S100-specific EF-hand Ca2+-binding domain at the N-terminus (aa 33-45)
consisting of 13 amino acids. The second putative canonical EF-hand motif has
been deduced from the secondary structure and hydrophobicity analysis of the
protein. It contained only 2 out of 6 conserved residues (Asp76 and Glu80) and
might start at Gly72 ending at Ser83. In addition, the protein was predicted to
contain a N-glycosylation site (aa 75-78), a protein kinase C phosphorylation site
(aa 94-96), 5 casein kinase II phosphorylation sites (aa 16-19, 42-45, 73-76,
77-80, 83-86), and a N-myristoylation site (aa 2-7).
The calculated molecular weight of S100A14 is 11 662 Da and the isoelectric
point is 4.99. Protein secondary structure analysis indicated two helix-loop-helix

Results 52
structural motifs characteristic of calcium-binding sites. There was an extended
hydrophilic loop at the extreme N-terminus in contrast to other S100 family
members.
CTCCTGTCTTGTCTCAGCGGCTGCCAACAGATCATGAGCCATCAGCTC 48 CTCTGGGGCCAGCTATAGGACAACAGAACTCTCACCAAAGGACCAGACACAGTGAGCACC 108 ATGGGACAGTGTCGGTCAGCCAACGCAGAGGATGCTCAGGAATTCAGTGATGTGGAGAGG 168
1 M G Q C R S A N A E D A Q E F S D V E R
GCCATTGAGACCCTCATCAAGAACTTTCACCAGTACTCCGTGGAGGGTGGGAAGGAGACG 22821 A I E T L I K N F H Q Y S V E G G K E T
CTGACCCCTTCTGAGCTACGGGACCTGGTCACCCAGCAGCTGCCCCATCTCATGCCGAGC 28841 L T P S E L R D L V T Q Q L P H L M P S
AACTGTGGCCTGGAAGAGAAAATTGCCAACCTGGGCAGCTGCAATGACTCTAAACTGGAG 34861 N C G L E E K I A N L G S C N D S K L E
TTCAGGAGTTTCTGGGAGCTGATTGGAGAAGCGGCCAAGAGTGTGAAGCTGGAGAGGCCT 40881 F R S F W E L I G E A A K S V K L E R P
GTCCGGGGGCACTGAGAACTCCCTCTGGAATTCTTGGGGGGTGTTGGGGAGAGACTGTGG 468101 V R G H *
GCCTGGAGATAAAACTTGTCTCCTCTACCACCACCCTGTACCCTAGCCTGCACCTGTCCT 528 CATCTCTGCAAAGTTCAGCTTCCTTCCCCAGGTCTCTGTGCACTCTGTCTTGGATGCTCT 588 GGGGAGCTCATGGGTGGAGGAGTCTCCACCAGAGGGAGGCTCAGGGGACTGGTTGGGCCA 648 GGGATGAATATTTGAGGGATAAAAATTGTGTAAGAGCCAAAGAATTGGTAGTAGGGGGAG 708 AACAGAGAGGAGCTGGGCTATGGGAAATGATTTGAATAATGGAGCTGGGAATATGGCTGG 768 ATATCTGGTACTAAAAAAGGGTCTTTAAGAACCTACTTCCTAATCTCTTCCCCAATCCAA 828 ACCATAGCTGTCTGTCCAGTGCTCTCTTCCTGCCTCCAGCTCTGCCCCAGGCTCCTCCTA 888 GACTCTGTCCCTGGGCTAGGGCAGGGGAGGAGGGAGAGCAGGGTTGGGGGAGAGGCTGAG 948 GAGAGTGTGACATGTGGGGAGAGGACCAGCTGGGTGCTTGGGCATTGACAGAATGATGGT 1008 TGTTTTGTATCATTTGATTAATAAAAAAAAATGAAAAAAGTGAAAAAAAAAAAAAAAAA 1067
Fig. 3 Nucleotide and deduced amino acid sequence of the human S100A14 gene. The predicted start codon and polyadenylation signal are underlined. An asterisk indicates the putative stop codon. Numbers to the left correspond to the single-letter amino acid sequence. Numbers to the right correspond to the nucleotide sequence.
The deduced protein of S100A14 shares 68% similarity and 38% identity to
S100A13 (Accession No Q99584) being the closest human match. Significant
similarity was also found with S100A4 (62% similarity; 30% identity), S100A2 (60%
similarity; 30% identity), S100A10 (58% similarity; 31% identity), and S100A9
(55% similarity; 34% identity), as illustrated in Fig. 4. Furthermore, in the

Results 53
SwissProt database we identified an apparent mouse orthologue, 1110013O05RIK
protein (Accession No Q9D2Q8), showing 97% similarity (93% identity) using the
human S100A14 amino acid sequence as a query. A comparison between the
S100A14 cDNA and RIKEN 1110013O05 (1110013O05Rik) cDNA (GenBank
Accession No NM_025393) revealed 87% identity.
S100A14 MGQCRSANAEDAQEFSDVERAIETLIKNFHQYS-VEGGKETLTPSELRDLVTQQLPHLMP 59RIK MGQCRSANAEDAQEFSDVERAIETLIKNFHKYS-VAGKKETLTPAELRDLVTQQLPHLMP 59S100A13 ---------MAAEPLTELEESIETVVTTFFTFARQEGRKDSLSVNEFKELVTQQLPHLLK 51S100A4 -------------MACPLEKALDVMVSTFHKYSGKEGDKFKLNKSELKELLTRELPSFLG 47S100A2 -------------MCSSLEQALAVLVTTFHKYSCQEGDKFKLSKGEMKELLHKELPSFVG 47S100A10 --------------PSQMEHAMETMMFTFHKFAGDKG--Y-LTKEDLRVLMEKEFPGFLE 43S100A9 ----------MTCKMSQLERNIETIINTFHQYSVKLGHPDTLNQGEFKELVRKDLQNFLK 50 S100A14 ----SNCGLEEKIANLGSCNDSKLEFRSFWELIGEAAKSVKLER--PVRGH--------- 104RIK ----SNCGLEEKIANLGNCNDSKLEFGSFWELIGEAAKSVKMER--PVTRS--------- 104S100A13 ----DVGSLDEKMKSLDVNQDSELKFNEYWRLIGELAKEIRKKKDLKIRKK--------- 98S100A4 KR-TDEAAFQKLMSNLDSNRDNEVDFQEYCVFLSCIAMMCNEFFEGFPDKQPRKK----- 101S100A2 EK-VDEEGLKKLMGNLDENSDQQVDFQEYAVFLALITVMCNDFFQGCPDR-P-------- 97S100A10 NQ-KDPLAVDKIMKDLDQCRDGKVGFQSFFSLIAGLTIACNDYFVVHMKQKGKK------ 96S100A9 KENKNEKVIEHIMEDLDTNADKQLSFEEFIMLMARLTWASHEKMHEGDEGPGHHHKPGLG 110 S100A14 ---- RIK ---- S100A13 ---- S100A4 ---- S100A2 ---- S100A10 ---- S100A9 EGTP 114
Fig. 4 Alignment of the predicted amino acid sequences of the human S100A14 and the mouse orthologue 1110013O05RIK with the most homologous S100 family members. Homology is represented by shading of the amino acid identities. Identical amino acid residues are indicated as black boxes whereas similar amino acids are indicated as gray boxes.
3.2 Expression Profile in Tumour Cell Lines, Normal, and Neoplastic Tissues
3.2.1 S100A14 mRNA Level in Tumour Cell Lines
To characterize S100A14 expression in tumour cell lines from other tissues we
extended the expression analysis to normal human cultured mammary epithelial
cells, four immortalized epithelial cell lines, and 31 different human tumour cell
lines as well as ten mouse and rat cell lines. The complete list of the examined cell
lines is given in Table 2 and Table 3.
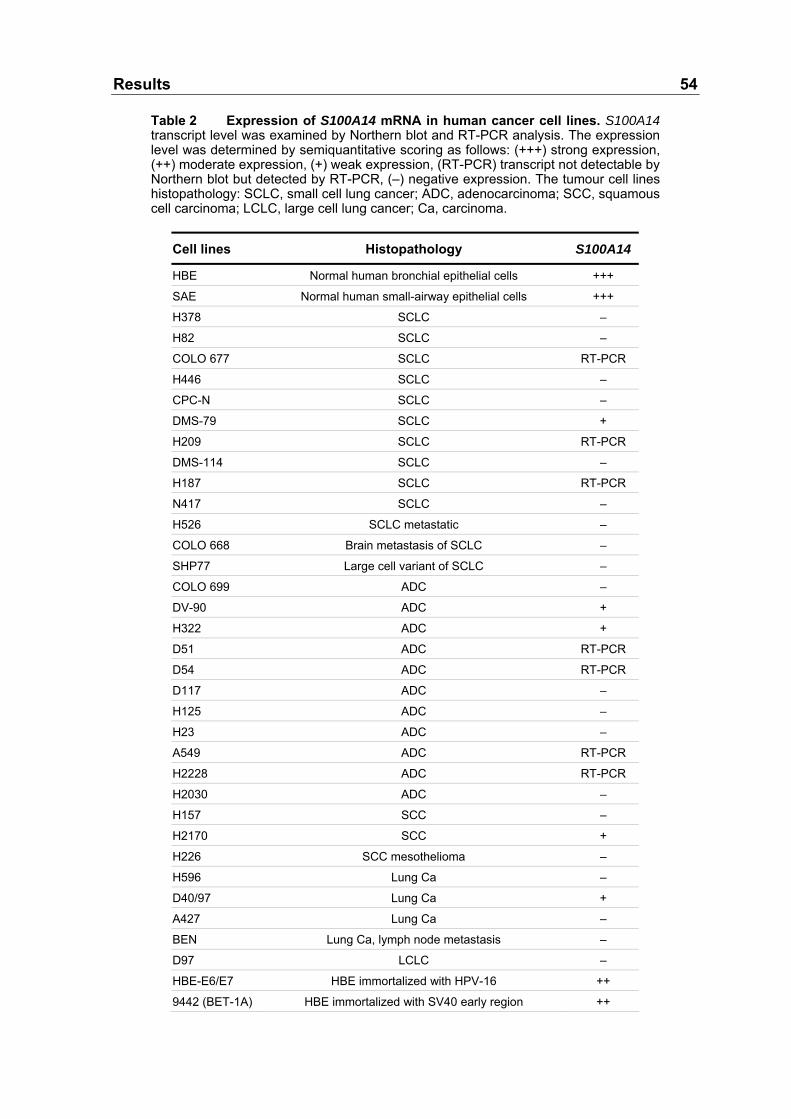
Results 54
Table 2 Expression of S100A14 mRNA in human cancer cell lines. S100A14 transcript level was examined by Northern blot and RT-PCR analysis. The expression level was determined by semiquantitative scoring as follows: (+++) strong expression, (++) moderate expression, (+) weak expression, (RT-PCR) transcript not detectable by Northern blot but detected by RT-PCR, (–) negative expression. The tumour cell lines histopathology: SCLC, small cell lung cancer; ADC, adenocarcinoma; SCC, squamous cell carcinoma; LCLC, large cell lung cancer; Ca, carcinoma.
Cell lines Histopathology S100A14
HBE Normal human bronchial epithelial cells +++
SAE Normal human small-airway epithelial cells +++
H378 SCLC –
H82 SCLC –
COLO 677 SCLC RT-PCR
H446 SCLC –
CPC-N SCLC –
DMS-79 SCLC +
H209 SCLC RT-PCR
DMS-114 SCLC –
H187 SCLC RT-PCR
N417 SCLC –
H526 SCLC metastatic –
COLO 668 Brain metastasis of SCLC –
SHP77 Large cell variant of SCLC –
COLO 699 ADC –
DV-90 ADC +
H322 ADC +
D51 ADC RT-PCR
D54 ADC RT-PCR
D117 ADC –
H125 ADC –
H23 ADC –
A549 ADC RT-PCR
H2228 ADC RT-PCR
H2030 ADC –
H157 SCC –
H2170 SCC +
H226 SCC mesothelioma –
H596 Lung Ca –
D40/97 Lung Ca +
A427 Lung Ca –
BEN Lung Ca, lymph node metastasis –
D97 LCLC –
HBE-E6/E7 HBE immortalized with HPV-16 ++
9442 (BET-1A) HBE immortalized with SV40 early region ++

Results 55
BEAS-2B HBE immortalized with SV40 early region ++
YP44 HBE immortalized with SV40 early region ++
DU 145 Prostate Ca –
PC-3 Prostate Ca –
HMEC Normal human mammary epithelial cells ++
HMEB HMEC immortalized with telomerase and SV40 +
MCF-10A Spontaneously immortalized mammary epithelial cells ++
MCF-7 Breast Ca –
SK-BR-3 Breast Ca –
MDA-MD-231 Breast Ca –
Kato III Metastasis of gastric Ca ++
HT-29 Colon Ca +
SW-480 Colon Ca –
HCT-116 Colon Ca +
CaCo-2 Colon Ca ++
WiDr Colon Ca +
Lovo Colon Ca +++
CX-2 Colon Ca +
HRT-18 Colon Ca ++
EJ Bladder Ca –
HeLa Cervical Ca –
Daudi Burkitt’s lymphoma –
K562 Chronic myelogenous leukemia –
HL-60 Promyeolocytic leukemia –
MOLT-4 Lymphoblastic leukemia –
Raji Burkitt’s lymphoma –
G361 Melanoma –
SKOV-3 Ovarian Ca –
OVCAR-3 Ovarian Ca +
HT 1080 Fibrosarcoma –
HEP-2 Head and neck Ca –
D36-1/95 Head and neck Ca +
D36-2/95 Head and neck Ca +
D6/95 Head and neck Ca +
D3/02 Head and neck Ca –
IMR-90 Fetal lung fibroblasts –
HAKAT Immortalized keratinocytes +
HEK 293 Human embryonic kidney epithelial cells –
The S100A14 mRNA is most abundant in cells cultured from normal human
epithelial cells, but is absent from the vast majority of cancer-derived cell lines.
Interestingly, most of the immortalized human cell lines also show significant
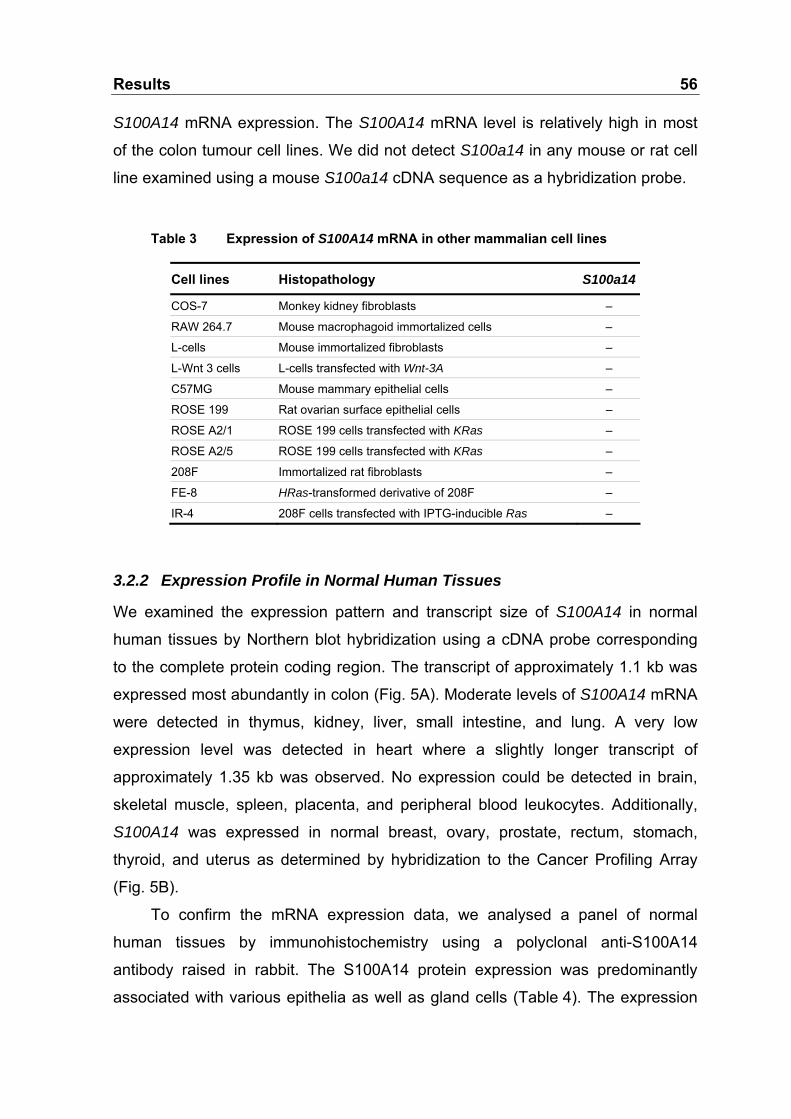
Results 56
S100A14 mRNA expression. The S100A14 mRNA level is relatively high in most
of the colon tumour cell lines. We did not detect S100a14 in any mouse or rat cell
line examined using a mouse S100a14 cDNA sequence as a hybridization probe.
Table 3 Expression of S100A14 mRNA in other mammalian cell lines
Cell lines Histopathology S100a14
COS-7 Monkey kidney fibroblasts –
RAW 264.7 Mouse macrophagoid immortalized cells –
L-cells Mouse immortalized fibroblasts –
L-Wnt 3 cells L-cells transfected with Wnt-3A –
C57MG Mouse mammary epithelial cells –
ROSE 199 Rat ovarian surface epithelial cells –
ROSE A2/1 ROSE 199 cells transfected with KRas –
ROSE A2/5 ROSE 199 cells transfected with KRas –
208F Immortalized rat fibroblasts –
FE-8 HRas-transformed derivative of 208F –
IR-4 208F cells transfected with IPTG-inducible Ras –
3.2.2 Expression Profile in Normal Human Tissues
We examined the expression pattern and transcript size of S100A14 in normal
human tissues by Northern blot hybridization using a cDNA probe corresponding
to the complete protein coding region. The transcript of approximately 1.1 kb was
expressed most abundantly in colon (Fig. 5A). Moderate levels of S100A14 mRNA
were detected in thymus, kidney, liver, small intestine, and lung. A very low
expression level was detected in heart where a slightly longer transcript of
approximately 1.35 kb was observed. No expression could be detected in brain,
skeletal muscle, spleen, placenta, and peripheral blood leukocytes. Additionally,
S100A14 was expressed in normal breast, ovary, prostate, rectum, stomach,
thyroid, and uterus as determined by hybridization to the Cancer Profiling Array
(Fig. 5B).
To confirm the mRNA expression data, we analysed a panel of normal
human tissues by immunohistochemistry using a polyclonal anti-S100A14
antibody raised in rabbit. The S100A14 protein expression was predominantly
associated with various epithelia as well as gland cells (Table 4). The expression

Results 57
pattern was virtually consistent with the S100A14 mRNA expression in normal
human tissues. The exceptions were brain and placenta, showing a weak
expression of S100A14 protein, in contrast to the absence of the transcript in
Northern blot analysis.
brai
n
hear
t
skel
etal
mus
cle
colo
n
thym
us
sple
en
kidn
ey
liver
smal
lint
estin
e
plac
enta
lung
perip
hera
lblo
odle
ukoc
ytes
0
0,5
1
1,5
2
2,5
3
brea
st
colo
n
kidn
ey
lung
ovar
y
pros
tate
rect
um
stom
ach
thyr
oid
uter
us
norm
aliz
ed a
vera
ge v
alue
s
1.35 kb
ß-actin
A
B
S100A14
brai
n
hear
t
skel
etal
mus
cle
colo
n
thym
us
sple
en
kidn
ey
liver
smal
lint
estin
e
plac
enta
lung
perip
hera
lblo
odle
ukoc
ytes
0
0,5
1
1,5
2
2,5
3
brea
st
colo
n
kidn
ey
lung
ovar
y
pros
tate
rect
um
stom
ach
thyr
oid
uter
us
norm
aliz
ed a
vera
ge v
alue
s
1.35 kb
ß-actin
A
B
S100A14
Fig. 5 Expression of the S100A14 mRNA in normal human tissues. A: A human 12-lane Multiple Tissue Northern Blot (BD Biosciences) containing 2 µg poly(A)+ RNA in each lane was hybridized with a 32P-labelled S100A14 cDNA probe. β-actin was assayed as a loading control. B: Expression of S100A14 mRNA in additional normal human tissues examined by hybridization to the Cancer Profiling Array (BD Biosciences).
These results suggest that there is a very low S100A14 expression in these
tissues and a not sufficient sensitivity of Northern blot to detect low abundant
transcripts.

Results 58
Table 4 Expression of the S100A14 protein in normal human tissues
Tissue S100A14 Expression
Pancreas Islet cells, endocrine pancreas Spleen Negative Breast Mammary gland cells Smooth muscle Muscle fibres weakly positive Skeletal muscle Negative Salivary glands Salivary gland cells, exocrine salivary glands Gall bladder Basal cytoplasm of goblet cells Thyroid Follicular epithelium Kidney Tubular epithelium Tonsille Squamous epithelium Appendix Epithelium Lung Pneumocytes Uterus Apical epithelium, stroma cells and smooth muscle weakly positive Prostate Epithelium, stroma cells and smooth muscle weakly positive Stomach Epithelium, gland cells weakly positive Parathyroid gland Epithelium Placenta Trophoblast cells weakly positive Colon Epithelium Testis Spermatocytes and stroma cells weakly positive Small intestine Epithelium Heart Cardiac muscle fibres weakly positive Cervix Suprabasal cells of squamous epithelium, basal cells weakly positive Liver Hepatocytes, bile duct epithelium Brain Ganglia cells Skin Squamous epithelium, hair follicles, sweat glands Endothelium Weakly positive
3.2.3 S100A14 mRNA Level in Tumour Tissues
Since S100A14 mRNA was not expressed in most of the tumour-derived cell lines,
we hypothesized that its expression might be suppressed also in primary tumour
tissue. To examine its expression in primary tissue we applied a commercially
available Cancer Profiling Array, which contains cDNAs from 241 tumours and
corresponding normal tissues from individual patients. This analysis, however,
revealed a varied expression of the gene in different tumours (Fig. 6A). Significant
overexpression was detected in ovary (78.6%), breast (62%), and uterus (45.2%)
tumour tissues. Also lung (38.1%), prostate (25%), and thyroid gland (16.7%)
tumours showed up-regulated levels of S100A14 transcript. In contrast, marked
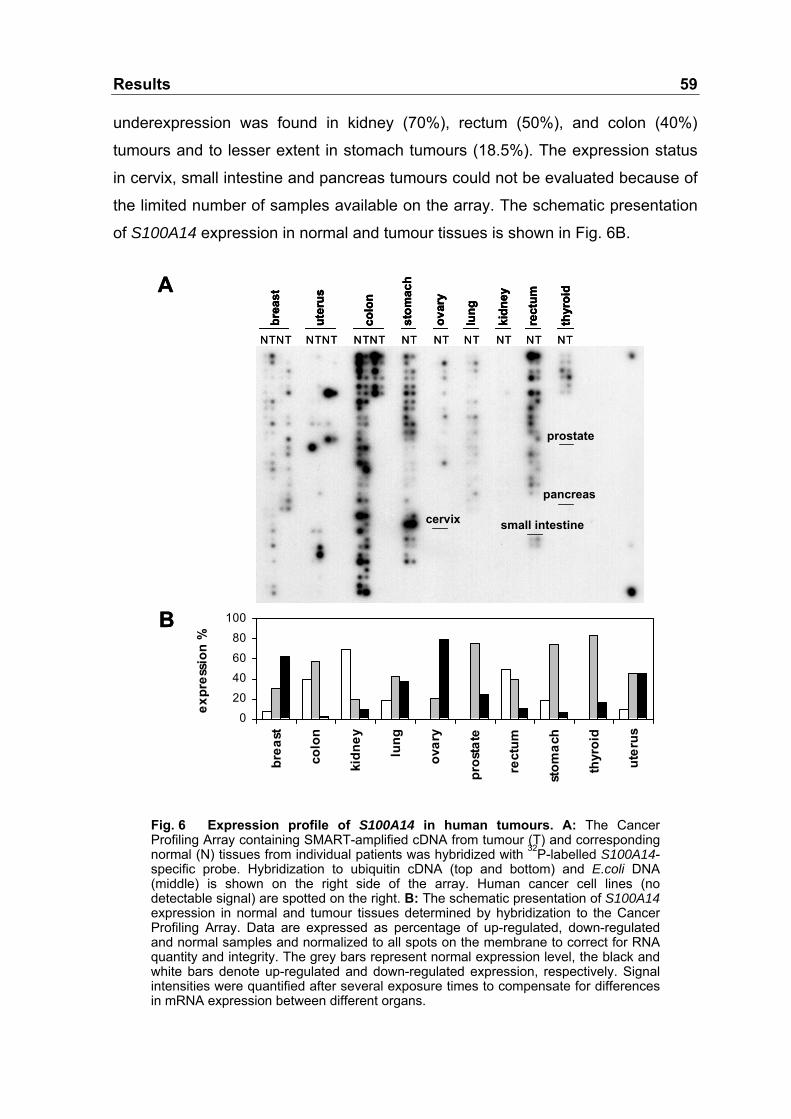
Results 59
underexpression was found in kidney (70%), rectum (50%), and colon (40%)
tumours and to lesser extent in stomach tumours (18.5%). The expression status
in cervix, small intestine and pancreas tumours could not be evaluated because of
the limited number of samples available on the array. The schematic presentation
of S100A14 expression in normal and tumour tissues is shown in Fig. 6B.
0
20
4060
80
100
brea
st
colo
n
kidn
ey
lung
ovar
y
pros
tate
rect
um
stom
ach
thyr
oid
uter
us
expr
essi
on %
prostate
pancreas
small intestinecervix
NTNT NTNT NTNT NTNT NTNT NT
brea
st
uter
us
colo
n
stom
ach
ovar
y
kidn
ey
lung
thyr
oid
rect
um
NT
A
B
0
20
4060
80
100
brea
st
colo
n
kidn
ey
lung
ovar
y
pros
tate
rect
um
stom
ach
thyr
oid
uter
us
expr
essi
on %
prostate
pancreas
small intestinecervix
NTNT NTNT NTNT NTNT NTNT NT
brea
st
uter
us
colo
n
stom
ach
ovar
y
kidn
ey
lung
thyr
oid
rect
um
brea
st
uter
us
colo
n
stom
ach
ovar
y
kidn
ey
lung
thyr
oid
rect
um
NT
A
B
Fig. 6 Expression profile of S100A14 in human tumours. A: The Cancer Profiling Array containing SMART-amplified cDNA from tumour (T) and corresponding normal (N) tissues from individual patients was hybridized with 32P-labelled S100A14-specific probe. Hybridization to ubiquitin cDNA (top and bottom) and E.coli DNA (middle) is shown on the right side of the array. Human cancer cell lines (no detectable signal) are spotted on the right. B: The schematic presentation of S100A14 expression in normal and tumour tissues determined by hybridization to the Cancer Profiling Array. Data are expressed as percentage of up-regulated, down-regulated and normal samples and normalized to all spots on the membrane to correct for RNA quantity and integrity. The grey bars represent normal expression level, the black and white bars denote up-regulated and down-regulated expression, respectively. Signal intensities were quantified after several exposure times to compensate for differences in mRNA expression between different organs.

Results 60
3.2.4 S100A14 Protein Expression in Lung Tumours and Association with Clinicopathological Factors
Our transcript expression analysis in primary tumour tissues suggested that
S100A14 is not a simple suppressor of tumour cell growth as might have been
concluded from the cell line model system. It is possible that its altered expression
is a result of, or otherwise associated with, tumour progression. To shed light on
the association of S100A14 protein with malignant transformation and to verify the
RNA expression data we used immunohistochemistry to investigate its expression
in tumour tissues.
S100A14 protein was examined in 120 histological sections of human lung
cancer and 10 specimens of normal human lung epithelium. The cohort of tumour
samples included 62 cases of adenocarcinoma (51.7%) and 58 cases of
squamous cell carcinoma (SCC) (48.3%). The small number of samples precluded
a separate analysis of large cell lung cancer (LCLC) tumour specimens. We
observed a low cytoplasmic S100A14 staining in normal lung epithelium (score 0
to 1+; Fig. 7). Therefore, we approved a scoring of 2+ and 3+ as indicative of
protein overexpression for our analysis. Scores 0 or 1+ were considered as
physiologically normal expression.
Normal lung tissue Lung squamous cell carcinomaNormal lung tissue Lung squamous cell carcinoma
Fig. 7 S100A14 protein is overexpressed in primary lung tumour tissue in comparison to normal lung tissue. Immunohistochemical staining of S100A14 protein in tissue sections of normal lung pneumocytes (left, indicated by an arrow) and lung squamous cell carcinoma (right). Specimens were stained with an anti-S100A14 antibody. Photographs were taken with a 40x objective.
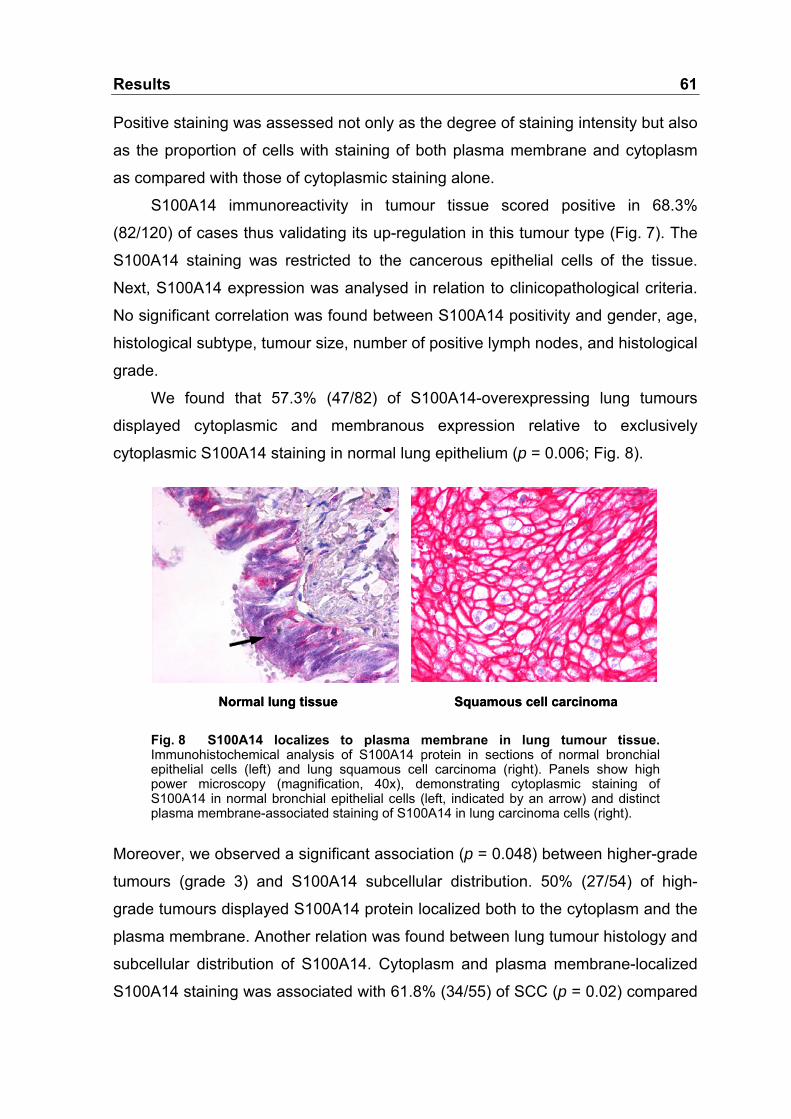
Results 61
Positive staining was assessed not only as the degree of staining intensity but also
as the proportion of cells with staining of both plasma membrane and cytoplasm
as compared with those of cytoplasmic staining alone.
S100A14 immunoreactivity in tumour tissue scored positive in 68.3%
(82/120) of cases thus validating its up-regulation in this tumour type (Fig. 7). The
S100A14 staining was restricted to the cancerous epithelial cells of the tissue.
Next, S100A14 expression was analysed in relation to clinicopathological criteria.
No significant correlation was found between S100A14 positivity and gender, age,
histological subtype, tumour size, number of positive lymph nodes, and histological
grade.
We found that 57.3% (47/82) of S100A14-overexpressing lung tumours
displayed cytoplasmic and membranous expression relative to exclusively
cytoplasmic S100A14 staining in normal lung epithelium (p = 0.006; Fig. 8).
Normal lung tissue Squamous cell carcinomaNormal lung tissue Squamous cell carcinoma
Fig. 8 S100A14 localizes to plasma membrane in lung tumour tissue. Immunohistochemical analysis of S100A14 protein in sections of normal bronchial epithelial cells (left) and lung squamous cell carcinoma (right). Panels show high power microscopy (magnification, 40x), demonstrating cytoplasmic staining of S100A14 in normal bronchial epithelial cells (left, indicated by an arrow) and distinct plasma membrane-associated staining of S100A14 in lung carcinoma cells (right).
Moreover, we observed a significant association (p = 0.048) between higher-grade
tumours (grade 3) and S100A14 subcellular distribution. 50% (27/54) of high-
grade tumours displayed S100A14 protein localized both to the cytoplasm and the
plasma membrane. Another relation was found between lung tumour histology and
subcellular distribution of S100A14. Cytoplasm and plasma membrane-localized
S100A14 staining was associated with 61.8% (34/55) of SCC (p = 0.02) compared

Results 62
to 38.2 % (20/58) of adenocarcinoma tumours, the latter detecting predominantly
cytoplasmic S100A14 (65.5%; 38/58). S100A14-negative tumours were not
included in the statistical analysis of the subcellular distribution of S100A14. These
results are summarized in Table 5.
Table 5 Association of S100A14 protein expression in lung tumours with clinicopathological factors
Parameter S100A14 positive/total p memb.+cytopl.
positive/total p
S100A14 overexpression 68.3% (82/120) Membranous+cytoplasmic 57.3% (47/82) < 0.01 High grade 50% ( 27/54) 0.048 Histological subtype Adenocarcinoma 38.2% (20/58) Squamous cell carcinoma 61.8% (34/55) < 0.01
3.2.5 S100A14 Protein Expression in Breast Tumours and Association with Clinicopathological Factors
A significant up-regulation of S100A14 mRNA in breast tumours prompted us to
investigate this tumour type by immunohistochemistry. We examined S100A14
protein expression in 93 breast tumour samples, 14 lymph node metastases and
10 normal mammary epithelia. In our cohort of breast tumours were 77 invasive
ductal carcinomas (IDC), 14 invasive lobular carcinomas (ILC) and 2 cases of
mixed type (IDC+ILC).
Normal mammary epithelium stained rather weakly for S100A14 protein with
cytoplasm-localized staining (score 1+; Fig. 9). Therefore we applied the same
scoring as for lung tumours, i.e. scores 0 to 1+ were considered as normal
physiological expression, whereas scores of 2+ and 3+ were assessed as positive
and indicative of protein overexpression. S100A14 positivity was detected in
68.8% (64/93) of breast tumour samples and 71.4% (10/14) of lymph node
metastases (Fig. 9). Clinical relevance of S100A14-overexpressing tumours was
investigated only in IDC cases due to small sample number of other tumour
subtypes. No significant correlation with gender, age, histological subtype, tumour
size, number of positive lymph nodes or histological grade was observed.
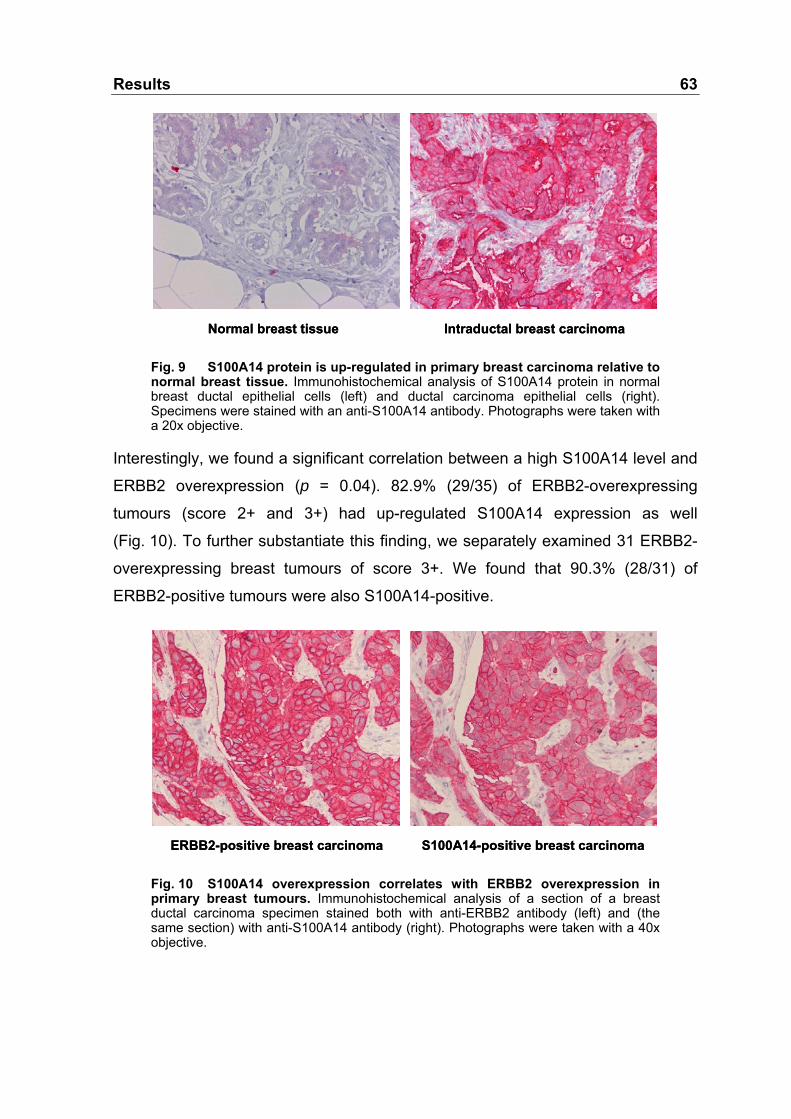
Results 63
Normal breast tissue Intraductal breast carcinomaNormal breast tissue Intraductal breast carcinoma
Fig. 9 S100A14 protein is up-regulated in primary breast carcinoma relative to normal breast tissue. Immunohistochemical analysis of S100A14 protein in normal breast ductal epithelial cells (left) and ductal carcinoma epithelial cells (right). Specimens were stained with an anti-S100A14 antibody. Photographs were taken with a 20x objective.
Interestingly, we found a significant correlation between a high S100A14 level and
ERBB2 overexpression (p = 0.04). 82.9% (29/35) of ERBB2-overexpressing
tumours (score 2+ and 3+) had up-regulated S100A14 expression as well
(Fig. 10). To further substantiate this finding, we separately examined 31 ERBB2-
overexpressing breast tumours of score 3+. We found that 90.3% (28/31) of
ERBB2-positive tumours were also S100A14-positive.
ERBB2-positive breast carcinoma S100A14-positive breast carcinomaERBB2-positive breast carcinoma S100A14-positive breast carcinoma
Fig. 10 S100A14 overexpression correlates with ERBB2 overexpression in primary breast tumours. Immunohistochemical analysis of a section of a breast ductal carcinoma specimen stained both with anti-ERBB2 antibody (left) and (the same section) with anti-S100A14 antibody (right). Photographs were taken with a 40x objective.

Results 64
Oestrogen receptor-α (ER-α) negativity was also significantly associated with
elevated levels of S100A14 (p = 0.024). 87.5% (21/24) of ER-α-negative tumour
specimens were S100A14-positive. Moreover, a significant association to
increased tumour cells proliferation index (MIB) was observed (p = 0.033). 100%
(11/11) of tumours assessed as highly proliferating (60-100% of actively
proliferating cells) stained positively for S100A14.
Also in this case the subcellular distribution of S100A14 was related to
S100A14 protein abundance. 79.7% (59/74) of S100A14-overexpressing tumours
displayed prominent plasma membrane and cytoplasmic localization of S100A14
(p < 0.01) relative to 34.8% (8/23) of low-expressing tumours showing
predominantly cytoplasmic staining (65.2%; 15/23). In contrast to this tumour cell
plasma membrane localization, normal human breast epithelial cells showed solely
diffuse cytosolic S100A14 expression (Fig. 11). For the statistical analysis of
subcellular localization of S100A14 we omitted the S100A14-negative samples.
These results are summarized in Table 6.
Normal breast tissue Intraductal breast carcinomaNormal breast tissue Intraductal breast carcinoma
Fig. 11 S100A14 localizes to plasma membrane in breast cancer tissue. S100A14 immunostaining in sections of normal breast ductal epithelial cells (left) and breast ductal carcinoma sections (right). Panels show high power microscopy (magnification, 40x), demonstrating cytoplasmic staining of S100A14 in normal breast ductal epithelial cells (left, indicated by an arrow) and plasma membrane-associated staining of S100A14 in breast carcinoma cells (right).
Our transcriptional and protein analysis demonstrated that expression of S100A14
in primary tumours differed from that in cell line model; the gene was significantly
overexpressed in multiple lung and breast tumour samples. Nevertheless, our data
also confirmed the differential expression of the gene in a wide range of primary

Results 65
tumours as well as its potential clinical relevance with regard to the positive
correlation with ERBB2 overexpression in breast tumours. Therefore, we decided
to further characterize the gene and the molecular determinants of its regulation.
Table 6 Association of S100A14 protein expression in breast tumours with clinicopathological factors
Parameter S100A14 positive/total p
S100A14 overexpression 68.8% (64/93) ERBB2 overexpression 82.9% (29/35) 0.04 ER-α negativity 87.5% (21/24) 0.024 MIB 100 % (11/11) 0.033 Membranous+cytoplasmic 79.7% (59/74) < 0.01
3.2.6 S100A14 is not Re-Expressed Following Growth of Human Cancer Cell Lines Transplanted into Mice
To determine if the absence of S100A14 in the vast majority of cultured tumour
cell lines could be due to differences between the cell model system and the
primary tissue, we examined 9 mouse xenograft tumours of human cultured lung
cancer cell lines. They represented the following histopathological types: SCLC
(CPC-N, H526, H446, H82, H209, N417), brain metastasis of SCLC (Colo 668),
adenocarcinoma (D54), and LCLC (D97). These cell lines do not express
endogenous S100A14 in Northern blot analysis.
RT-PCR analysis did not reveal re-expression of the S100A14 transcript in
the majority of the examined xenografts (Fig. 12).
S100A14
GAPDH
CL MT CL MT CL MT CL MT CL MT CL MT CL MT CL MT CL MTD97 CPC-N N417 H446 Colo 668 H526 D54 H82 H209
S100A14
GAPDH
CL MT CL MT CL MT CL MT CL MT CL MT CL MT CL MT CL MTCL MTCL MT CL MTCL MT CL MTCL MT CL MTCL MT CL MTCL MT CL MTCL MT CL MTCL MT CL MTCL MT CL MTCL MTD97 CPC-N N417 H446 Colo 668 H526 D54 H82 H209
Fig. 12 S100A14 is not re-expressed in lung cancer cell line xenografts from nude mice. Nine S100A14-negative human lung cancer cell lines (CPC-N, H526, H446, H82, H209, N417, Colo 668, D54, and D97) were transplanted subcutaneously into immunodefficient mice. Mouse xenograft tumours (MT) and the respective lung cancer cell lines (CL) were examined by RT-PCR. GAPDH was used as a loading control.

Results 66
An enhanced S100A14 mRNA expression was clearly present only in the D54
xenograft tumour as compared with the corresponding cell line. A very weak
mRNA expression was detected in the H82 cell line and the corresponding
xenograft as well as in the D97 cell line. A modest mRNA expression was
observed in the H209 cell line and a weak expression in the corresponding
xenograft.
3.3 Subcellular Localization of the S100A14 Protein
In an attempt to achieve a better understanding of the biology of the S100A14
protein, we examined its subcellular localization by immunfluorescence. Initially,
we expressed the protein as carboxyl-terminal fusion of V5-epitope, and
determined expression of the fusion protein after transient transfection by confocal
laser-scanning microscopy. H157, A549, and COS-7 cells were chosen for their
absence of S100A14 transcript in Northern blot analysis.
Distinct subcellular localizations were detected in all analysed cell lines.
Immunoreactivity was observed in the cytoplasm with a higher expression around
the nucleus in A549 and COS-7 cells (Fig. 13A, B). H157 cells displayed a
pronounced immunoreactivity in the perinuclear area (Fig. 13C). Control
incubation with mock-transfected cells was completely negative (Fig. 13D).
Expression of the protein was also confirmed by Western blot analysis (Fig. 13E).
To confirm that the localization studies performed with epitope-tagged protein
corresponded to the subcellular distribution of endogenous protein, we applied the
polyclonal antibody against the endogenous S100A14 protein. Patterns of
subcellular distribution and expression of S100A14 protein were examined in
immortalized lung cells (9442, 2078), colon tumour (Caco-2, HCT-116, Lovo,
WiDr), and lung tumour (H322) cells.
9442 and 2078 cells displayed strong plasma membrane immunoreactivity of
sharp and clear pattern with the exception of cell protrusions where more diffuse
staining was observed (Fig. 14A, B). Additionally, a very weak and diffuse
cytoplasmic S100A14 staining was detectable. This staining pattern is consistent
with our analysis of fractionated proteins in 9442 cells (see below).

Results 67
AB
B
C
C D E
β-actin
S100A14
vect
or
S100
A14
-V5
AB
B
C
C
C
C DD E
β-actin
S100A14
vect
or
S100
A14
-V5
Fig. 13 Cellular localization of S100A14-V5 protein in human lung tumour and COS-7 cells. A: A549 (lung tumour), B: COS-7 (monkey kidney fibroblasts), and C: H157 (lung tumour) cells were transiently transfected with the S100A14-V5 expression vector. Forty-eight hours after transfection immunofluorescent analysis was performed using confocal laser scanning microscopy. Cells were examined for localization of S100A14-V5 after indirect staining with monoclonal anti-V5 primary antibody and anti-mouse FITC-conjugated secondary antibody. Magnification using 60x oil immersion objective. D: Control incubation with mock-transfected cells was completely negative. E: Expression of the protein was confirmed by immunoblotting analysis. Vector-transfected cells were used as a negative control. Equal loading was determined by immunoblotting with anti-β-actin antibody.
Moreover, strong S100A14 expression was observed in actively proliferating cells
(Fig. 14C). Interestingly, staining of distinct vesicles of unknown origin was also
observed in these cells (Fig. 14D). H322 and HCT-116 cells, which grow in
colonies, expressed S100A14 in similar patterns (Fig. 14E, F). Immunofluorescent
staining in these cells revealed distinct immunoreactivity at cell junctions with
occasionally stronger plasma membrane expression relative to neighbouring cells
indicating a heterogeneous expression. Weak and diffuse cytoplasmic staining
was also observed. In contrast, Caco-2 cells had diffuse rather than sharp staining
at cell junctions and moderately strong and homogenous cytosol immunoreactivity
(Fig. 14G). Prominent membranous staining was observed in Lovo cells with
focally stronger expression (Fig. 14H). Overall staining was low in WiDr cells
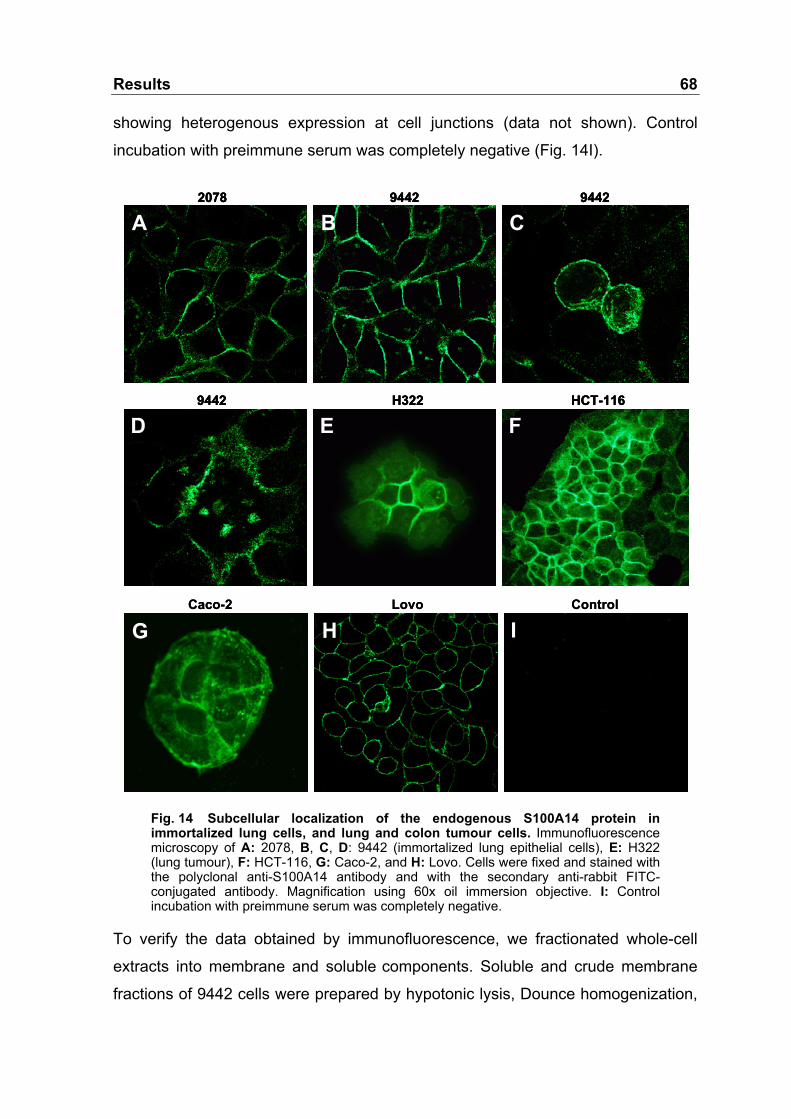
Results 68
showing heterogenous expression at cell junctions (data not shown). Control
incubation with preimmune serum was completely negative (Fig. 14I).
2078 9442
9442
A
D
CB9442
EH322
FHCT-116
Caco-2 Lovo Control
G H I
2078 9442
9442
A
D
CB9442
EH322
FHCT-116
2078 9442
9442
A
D
CB9442
EH322
FHCT-116
Caco-2 Lovo Control
G H I
Fig. 14 Subcellular localization of the endogenous S100A14 protein in immortalized lung cells, and lung and colon tumour cells. Immunofluorescence microscopy of A: 2078, B, C, D: 9442 (immortalized lung epithelial cells), E: H322 (lung tumour), F: HCT-116, G: Caco-2, and H: Lovo. Cells were fixed and stained with the polyclonal anti-S100A14 antibody and with the secondary anti-rabbit FITC-conjugated antibody. Magnification using 60x oil immersion objective. I: Control incubation with preimmune serum was completely negative.
To verify the data obtained by immunofluorescence, we fractionated whole-cell
extracts into membrane and soluble components. Soluble and crude membrane
fractions of 9442 cells were prepared by hypotonic lysis, Dounce homogenization,

Results 69
and differential centrifugation. Western blot analysis with anti-S100A14 antibody
revealed that S100A14 was predominantly associated with the membrane fraction,
whereas only very little S100A14 protein was detected in the soluble form
(Fig. 15). These data indicate that the cells endogenously expressing S100A14
preferentially target the protein to the plasma membrane.
α-tubulin RAS
S100A14
CY ME
α-tubulin RAS
S100A14
CY ME
Fig. 15 The S100A14 protein is distributed through the cytoplasmic and membranous fractions of 9442 cells. Total proteins from 9442 cells were fractionated. For SDS-PAGE, 80 µg of protein extract from each fraction was used for loading. Immunoblotting was performed with a polyclonal anti-S100A14 antibody. The specific S100A14 band was detected in the cytoplasmic (CY) and membranous fraction (ME). α-tubulin and RAS were assayed as loading controls for cytoplasmic and membranous fraction, respectively.
It was of interest to determine whether divalent cations could affect the subcellular
localization of S100A14. To characterize the dependence of the subcellular
distribution of S100A14 on the intracellular Ca2+ and Zn2+ levels, we treated 9442,
2078, Caco-2, WiDr, Lovo, HCT-116, and H322 cells with thapsigargin in
conjunction with 1 mM CaCl2 as well as with ZnCl2. Thapsigargin increases
intracellular Ca2+ levels by blocking endoplasmic reticulum calcium pumps. We
observed predominantly plasma membrane anti-S100A14 staining under all
conditions tested, with no detectable alterations in distribution pattern.
3.4 Genomic Organization and Chromosomal Localization of the S100A14 Gene
Most of the human S100 genes are clustered on the chromosome 1q21, a region
which is frequently involved in chromosomal rearrangements and deletions in
human cancers. In order to identify the mechanisms of abnormal S100A14
expression in tumours we sought to determine its genomic structure and
localization.
Results 70
To obtain S100A14 genomic sequence data, human RPCI 1,3-5 PAC blood
genomic libraries (RZPD) were screened with the purified insert of the full-length
cDNA clone of human S100A14 (H1043). We obtained 18 positive clones that we
re-screened by PCR using several cDNA-derived primer pairs: H1043f,
H1043ex1f, H1043ex2f, H1043ex3f, and H1043r.
We identified three candidate positive clones, RPCIP704 I22230Q2A,
RPCIP704 A12752Q2, and RPCI P704 D11609Q2 (designated I22230, A12752,
and D11609), and subjected them to a second screening by PCR to confirm their
positive status. Following assembly of the genomic sequence of S100A14 based
on the Celera’s human genome-unassembled fragments database (Venter et al.,
2001), we designed the following PCR primers located in the flanking region of the
exon/intron junctions of the relevant putative introns: H1043i1for, and H1043i1rev;
H1043i2for, and H1043i2rev; H1043i3for, and H1043i3rev. The three genomic
PAC clones were confirmed positive by this screening. Southern blot analysis
revealed an approximately 3-kb region of overlap among the three clones that
were positive for hybridization with the S100A14 cDNA and intronic probes
(Fig. 16A). The restriction enzyme-digested fragments covering that region were
subcloned and sequenced to identify the genomic organization of S100A14
(Fig. 16B).
In total, we obtained 3173 bp of continuous genomic sequence. In addition to
the genomic locus of the S100A14 gene, it included part of the putative 5’
upstream promoter sequence and the 3’ downstream region of the gene. It was
consistent with the compiled sequence identified in Celera’s human genome-
unassembled fragments database using S100A14 cDNA as a query. The
sequence was submitted to GenBank under Accession No AF426828.
Comparison of the genomic and cDNA sequence revealed that the gene
spanned 2165 bp. It was organized in four exons and three introns (Fig. 17).
Exon 1 is untranslated, exon 2 contains the translation initiation codon and the
putative N-myristoylation site, and exon 3 codes for the N-terminal EF-hand motif.
The latter exon contains the C-terminal EF-hand motif and the translation
termination codon followed by 630 bp of 3’-untranslated sequence. All the
intron/exon boundaries confirmed to the GT-AG rule (Table 7).

Results 71
λHin
dIII
A12752 I22230 D11609
BamHI
2322 bp
2027 bp
4361 bp
6557 bp
B
A
D11
609
I222
30
A12
752
D11
609
I222
30A
1275
2D
1160
9I2
2230
A12
752
D11
609
I222
30
A12
752
D11
609
I222
30A
1275
2
K11
781
K11
781
KpnI SalI XbaI XhoI BamHI
2322 bp
4361 bp6557 bp
λHin
dIII
A12752 I22230 D11609
BamHI
2322 bp
2027 bp
4361 bp
6557 bp
λHin
dIII
A12752 I22230 D11609
BamHI
2322 bp
2027 bp
4361 bp
6557 bp
B
A
D11
609
I222
30
A12
752
D11
609
I222
30A
1275
2D
1160
9I2
2230
A12
752
D11
609
I222
30
A12
752
D11
609
I222
30A
1275
2
K11
781
K11
781
KpnI SalI XbaI XhoI BamHI
2322 bp
4361 bp6557 bp
Fig. 16 Southern blot analysis of the genomic PAC clones positive for S100A14. Southern blot analysis of the candidate S100A14-positive clones, RPCIP704 I22230Q2A, RPCIP704 A12752Q2, and RPCI P704 D11609Q2. A: Restriction analysis with BamHI, XbaI, KpnI, XhoI, and SalI restriction endonucleases revealed a ~3-kb region of overlap (rectangle) among the three clones that were positive for hybridization with the S100A14 cDNA and intronic probes. B: The BamHI-digested fragments covering that region (rectangles) were subcloned and sequenced. Genomic PAC clone K11781, which was negative by PCR, was assayed as a negative control. λHindIII-digested DNA was used as a molecular size marker.
We also identified a candidate TATAA box, lacking the third and fourth adenosine
residues (Bucher, 1990), 26 bp upstream from the transcription initiation site
determined by RACE. No other consensus promoter sequences were identified in
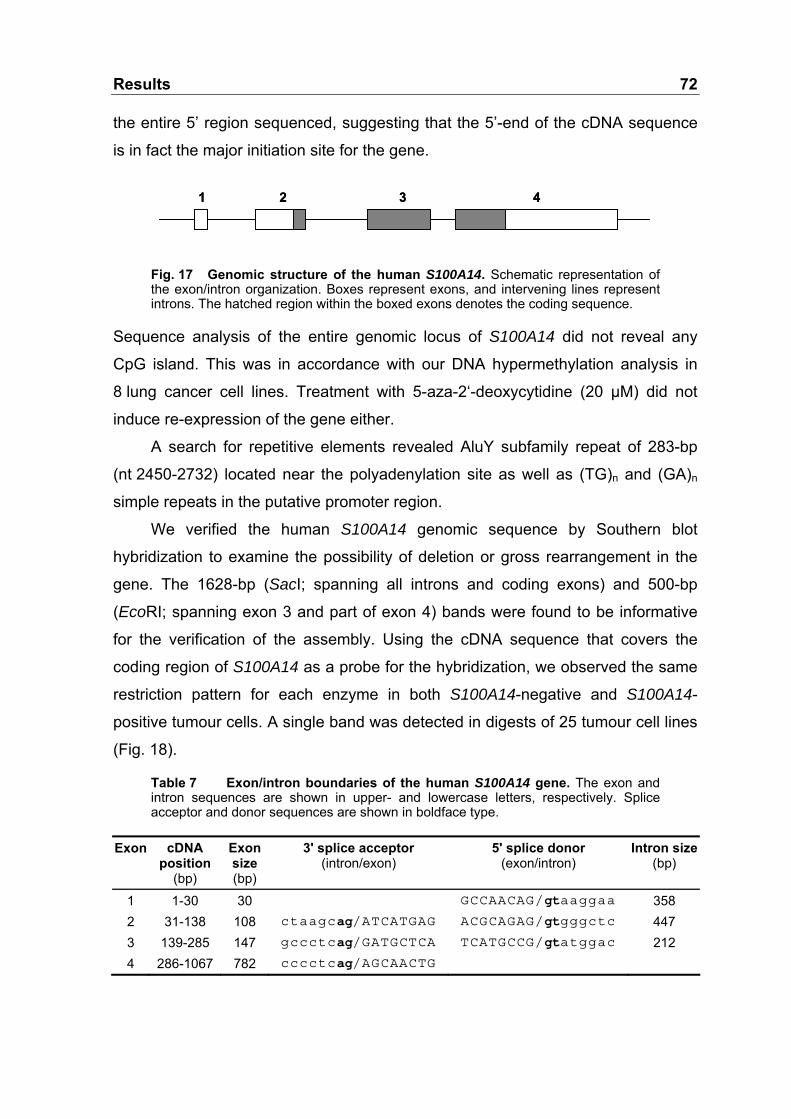
Results 72
the entire 5’ region sequenced, suggesting that the 5’-end of the cDNA sequence
is in fact the major initiation site for the gene.
1 2 3 41 2 3 4
Fig. 17 Genomic structure of the human S100A14. Schematic representation of the exon/intron organization. Boxes represent exons, and intervening lines represent introns. The hatched region within the boxed exons denotes the coding sequence.
Sequence analysis of the entire genomic locus of S100A14 did not reveal any
CpG island. This was in accordance with our DNA hypermethylation analysis in
8 lung cancer cell lines. Treatment with 5-aza-2‘-deoxycytidine (20 µM) did not
induce re-expression of the gene either.
A search for repetitive elements revealed AluY subfamily repeat of 283-bp
(nt 2450-2732) located near the polyadenylation site as well as (TG)n and (GA)n
simple repeats in the putative promoter region.
We verified the human S100A14 genomic sequence by Southern blot
hybridization to examine the possibility of deletion or gross rearrangement in the
gene. The 1628-bp (SacI; spanning all introns and coding exons) and 500-bp
(EcoRI; spanning exon 3 and part of exon 4) bands were found to be informative
for the verification of the assembly. Using the cDNA sequence that covers the
coding region of S100A14 as a probe for the hybridization, we observed the same
restriction pattern for each enzyme in both S100A14-negative and S100A14-
positive tumour cells. A single band was detected in digests of 25 tumour cell lines
(Fig. 18).
Table 7 Exon/intron boundaries of the human S100A14 gene. The exon and intron sequences are shown in upper- and lowercase letters, respectively. Splice acceptor and donor sequences are shown in boldface type.
Exon cDNA position
(bp)
Exon size (bp)
3' splice acceptor (intron/exon)
5' splice donor (exon/intron)
Intron size(bp)
1 1-30 30 GCCAACAG/gtaaggaa 358 2 31-138 108 ctaagcag/ATCATGAG ACGCAGAG/gtgggctc 447 3 139-285 147 gccctcag/GATGCTCA TCATGCCG/gtatggac 212 4 286-1067 782 cccctcag/AGCAACTG
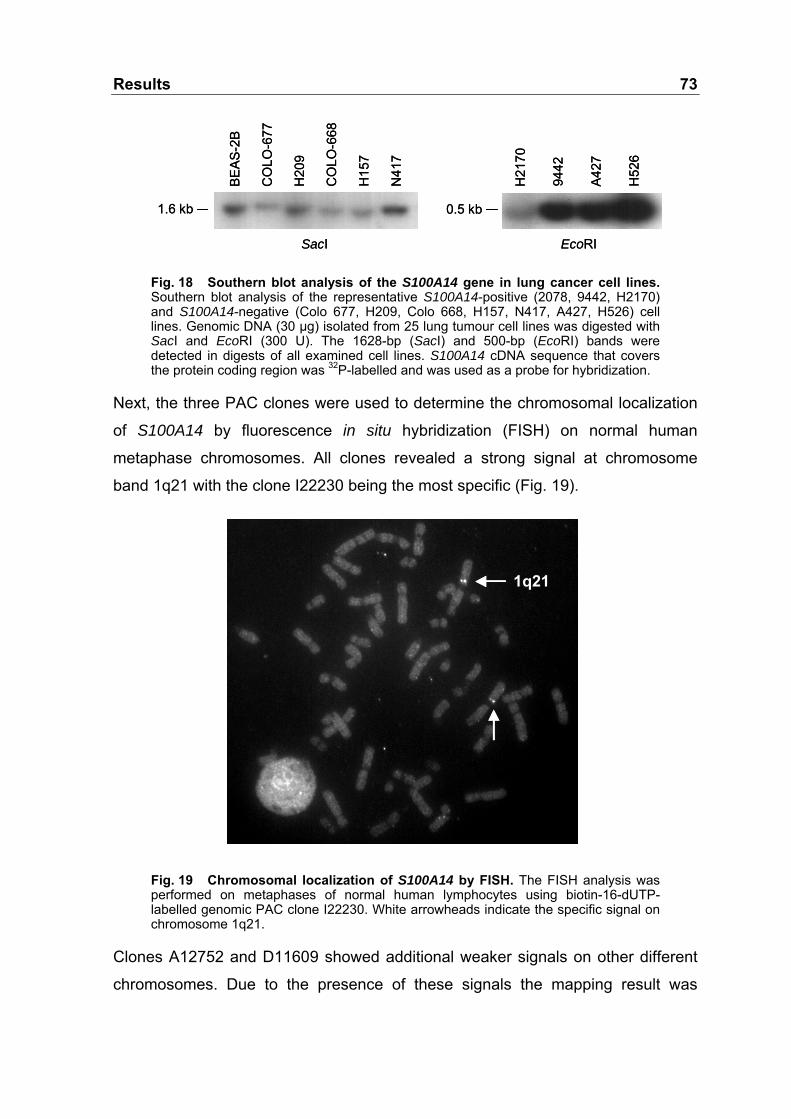
Results 73
SacI EcoRI
0.5 kb1.6 kb
BEAS
-2B
CO
LO-6
77
H20
9
CO
LO-6
68
H15
7
N41
7
H21
70
9442
A427
H52
6
SacI EcoRI
0.5 kb1.6 kb
BEAS
-2B
CO
LO-6
77
H20
9
CO
LO-6
68
H15
7
N41
7
H21
70
9442
A427
H52
6
Fig. 18 Southern blot analysis of the S100A14 gene in lung cancer cell lines. Southern blot analysis of the representative S100A14-positive (2078, 9442, H2170) and S100A14-negative (Colo 677, H209, Colo 668, H157, N417, A427, H526) cell lines. Genomic DNA (30 µg) isolated from 25 lung tumour cell lines was digested with SacI and EcoRI (300 U). The 1628-bp (SacI) and 500-bp (EcoRI) bands were detected in digests of all examined cell lines. S100A14 cDNA sequence that covers the protein coding region was 32P-labelled and was used as a probe for hybridization.
Next, the three PAC clones were used to determine the chromosomal localization
of S100A14 by fluorescence in situ hybridization (FISH) on normal human
metaphase chromosomes. All clones revealed a strong signal at chromosome
band 1q21 with the clone I22230 being the most specific (Fig. 19).
1q211q21
Fig. 19 Chromosomal localization of S100A14 by FISH. The FISH analysis was performed on metaphases of normal human lymphocytes using biotin-16-dUTP-labelled genomic PAC clone I22230. White arrowheads indicate the specific signal on chromosome 1q21.
Clones A12752 and D11609 showed additional weaker signals on other different
chromosomes. Due to the presence of these signals the mapping result was

Results 74
confirmed and refined by hybridizing the S100A14 cDNA to the established 6 Mb
YAC contig and to the genomic restriction map of region 1q21 (Marenholz et al.,
1996, 2001). The specific probe detected two of the 24 YACs of the contig,
100_f_3 and 950_e_2, which were already known to contain several other genes
of the S100 gene cluster in chromosomal region 1q21 (Schäfer et al., 1995,
Marenholz et al., 1996) (Fig. 20A). S100A14 was mapped on the same SalI
fragment as S100A1 and S100A13, the most telomeric genes of the established
S100 cluster (Fig. 20B).
Fig. 20 S100A14 is localized within the S100 gene cluster on human chromosome 1q21. A Southern blot that contains SalI-digested DNA of 24 YACs covering chromosomal region 1q21 was hybridized with the 32P-labelled S100A14 cDNA. A: Four YACs of the contig that cover the distal S100 genes including the adjacent regions, are shown. Two YACs were positive for the S100A14-specific probe (right) that detected the same restriction fragments as the S100A1 probe (left). The second fragment identified in YAC 100_f_3 is probably due to an additional, rearranged clone in the original YAC culture. B: SalI restriction map of YAC 100_f_3. A vertical bar represents the YAC. Boxes represent SalI restriction fragments that were detected by the genes above. The order of genes has been resolved previously (South et al., 1999). The position of S100A14 relative to S100A13 and S100A1 could not be resolved. C: Ideogram of human chromosome 1.

Results 75
We additionally confirmed localization of the gene in the region 1q21 on the
genomic restriction map of the H2LCL cell line (Marenholz et al., 1996), on which
the S100A14 probe detected the same NotI-, NruI-, MluI-, and BsiWI-fragments as
the adjacent S100 genes (data not shown).
3.5 Identification and Characterization of the Promoter for the S100A14 Gene
To further investigate the reasons for deregulated S100A14 expression in
tumours, we examined regulation of its putative promoter. As cell model system
we chose HEK 293 cells, which do not express endogenous S100A14, and Lovo
cells, which express the gene at a high level.
Isolation of S100A14 genomic DNA provided 511 bp of the 5’ upstream
region of the major transcription initiation site of the gene. In order to identify
potential regulatory sequences within this region, a panel of deletion mutants,
covering the region of 495-bp immediately adjacent to the transcription start site,
was generated and linked to a promoterless luciferase reporter gene. The
presence of endogenous SacI and PstI sites was used to aid the subcloning. The
p500-luc luciferase reporter driven by the longest promoter fragment showed a
significant luciferase activity in extracts from HEK 293 and Lovo cells (Fig. 21A, B).
Thus, we generated deletion mutants of this fragment to locate the minimal
promoter region responsible for the observed activity.
The p300-luc promoter construct that covers the proximal region of the
promoter (-313/-12) conferred a 4-fold activation. The other promoter fragment
(p250-luc) covering the -495/-313 region showed a very low level of activity, similar
to the level obtained with the control vector pGL3 Basic. This indicated that the
-313/-12 region of the S100A14 promoter is sufficient to induce a potent luciferase
activity. Therefore, we investigated deletion mutants of this promoter fragment.
p2A-luc and p2B-luc luciferase reporters showed activity at a level approximately
equal to that of the control vector. On the contrary, transfection of a p2C-luc
construct, covering the most proximal promoter fragment (-208/-12) of 196-bp,
resulted in an enhanced luciferase activity that could be indicative of the presence
of possible transcription factor binding sites.
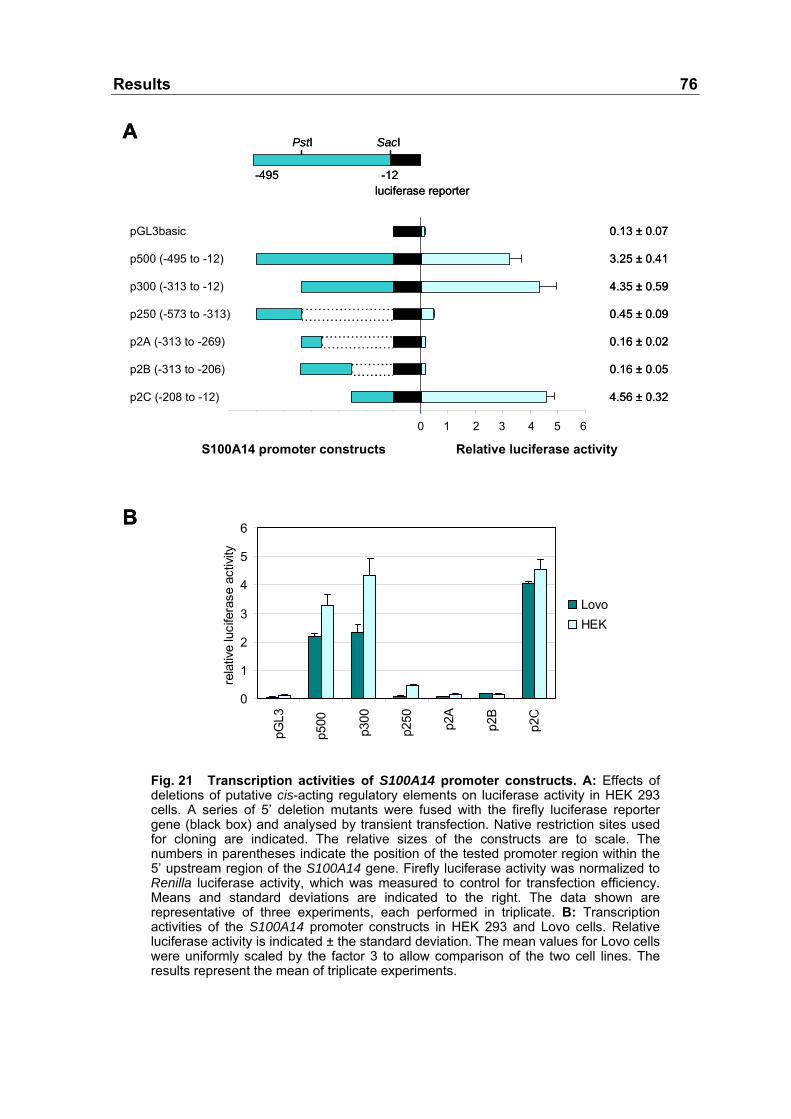
Results 76
-14 -12 -10 -8 -6 -4 -2 0 2 4 6 8 10 12
pGL3basic
p500 (-495 to -12)
p300 (-313 to -12)
p250 (-573 to -313)
p2A (-313 to -269)
p2B (-313 to -206)
p2C (-208 to -12)
0.2 0.4 0.6 0.8 1.0
0.13 ± 0.07
3.25 ± 0.41
4.35 ± 0.59
0.45 ± 0.09
0.16 ± 0.02
0.16 ± 0.05
4.56 ± 0.32
S100A14 promoter constructs
SacIPstI
luciferase reporter-12-495
A
0
1
2
3
4
5
6
pGL3
p500
p300
p250 p2A
p2B
p2C
rela
tive
luci
fera
se a
ctiv
ity
LovoHEK
0 1 2 3 4 5 6
pGL3basic
p500 (-495 to -12)
p300 (-313 to -12)
p250 (-573 to -313)
p2A (-313 to -269)
p2B (-313 to -206)
p2C (-208 to -12)
B
Relative luciferase activity-14 -12 -10 -8 -6 -4 -2 0 2 4 6 8 10 12
pGL3basic
p500 (-495 to -12)
p300 (-313 to -12)
p250 (-573 to -313)
p2A (-313 to -269)
p2B (-313 to -206)
p2C (-208 to -12)
0.2 0.4 0.6 0.8 1.0
0.13 ± 0.07
3.25 ± 0.41
4.35 ± 0.59
0.45 ± 0.09
0.16 ± 0.02
0.16 ± 0.05
4.56 ± 0.32
S100A14 promoter constructs
SacIPstI
luciferase reporter-12-495
A
0
1
2
3
4
5
6
pGL3
p500
p300
p250 p2A
p2B
p2C
rela
tive
luci
fera
se a
ctiv
ity
LovoHEK
0 1 2 3 4 5 6
pGL3basic
p500 (-495 to -12)
p300 (-313 to -12)
p250 (-573 to -313)
p2A (-313 to -269)
p2B (-313 to -206)
p2C (-208 to -12)
B
Relative luciferase activity
Fig. 21 Transcription activities of S100A14 promoter constructs. A: Effects of deletions of putative cis-acting regulatory elements on luciferase activity in HEK 293 cells. A series of 5’ deletion mutants were fused with the firefly luciferase reporter gene (black box) and analysed by transient transfection. Native restriction sites used for cloning are indicated. The relative sizes of the constructs are to scale. The numbers in parentheses indicate the position of the tested promoter region within the 5’ upstream region of the S100A14 gene. Firefly luciferase activity was normalized to Renilla luciferase activity, which was measured to control for transfection efficiency. Means and standard deviations are indicated to the right. The data shown are representative of three experiments, each performed in triplicate. B: Transcription activities of the S100A14 promoter constructs in HEK 293 and Lovo cells. Relative luciferase activity is indicated ± the standard deviation. The mean values for Lovo cells were uniformly scaled by the factor 3 to allow comparison of the two cell lines. The results represent the mean of triplicate experiments.

Results 77
Computer-assisted analysis of the minimal promoter fragment revealed a TATA
box, multiple potential transcription factor binding sites for Elk-1, and RFX-1, as
well as single binding sites for SRF (serum response factor), AP-1, CEBP, CHOP,
USF, NFκB, and N-myc.
In search for conserved elements in the human S100A14 promoter, we
retrieved 3460 bp in the sequence 5’ upstream of the mouse S100a14 gene.
Comparison of the region with the 511 bp of the human S100A14 promoter
revealed presence of two fragments immediately upstream of the transcription start
site that were conserved in the human gene (Fig. 22). One of the fragments
(-7/-48) showed 97% identity with the human counterpart and encompassed the
TATA box. The other fragment (-76/-135) showed 89% identity with the human
sequence and contained a CAAT sequence. This sequence, however, lacked
significance to the consensus CCAAT box in our promoter prediction analysis.
Within the conserved fragment from -76 to -135 bp two possible transcription
factor binding sites for CEBP and C/EBP homologous protein (CHOP), also known
as growth arrest- and DNA damage-inducible gene 153 (GADD153) were
detected. Both of them belong to the CCAAT/enhancer binding protein (CEBP)
family of transcription factors.
Additionally, a potential NFκB consensus motif was conserved in the mouse
and human DNA within the minimal promoter fragment but further upstream of the
two strongly conserved promoter fragments. This putative consensus site was
located in equivalent position in alignment between the two orthologous
sequences. No significant homology of sequences further upstream could be
detected.
To determine if the potential NFκB binding site represents a functional NFκB
response element, we examined it in more detail. Therefore, it was evaluated
whether the S100A14 promoter was subjected to transactivation by wild type p65
– the DNA binding subunit of NFκB. HEK 293 cells were co-transfected with
p65/Flag and the p2C-luc luciferase reporter or with empty vectors. Measurement
of luciferase activity revealed a weak decrease in the p2C-luc luciferase reporter
activity following transient transfection with an empty vector for p65, indicating an
inhibitory effect of pcDNA3/Flag vector (data not shown). Nevertheless, no
increase of activity was detected upon co-transfection of HEK 293 with p65

Results 78
compared with the co-transfection with the empty vector (data not shown).
Treatment with TNF-α also did not induce any significant transactivation of the
promoter in any concentration tested (5-25 ng/ml) thus confirming our Northern
blot results (data not shown).
mouse_ CCTTTCAACCTTTCATCTCTAGGCTGTCAGGACTGAGAGGCTTGACTCT-AGGTTTCAGC 59 human_ CCAGGCAGGCTTGAGTGTCAG---TATCCAAGCTG---GGCCTGACTGGGAGAAGTGTGC 54 ** ** *** * ** * ** *** *** ***** ** * ** mouse_ AGGCCCGAGTGATCCAAGCCAAATTAGCTCTAGTTGGAAGGGAGAGGAGAAGAGAGATGC 119human_ GTGTGCGTGTGTGTGTGTGTGTGTGTGCACGTGA-GAGAGAGAGAGAGAGAGACAGACAG 113 * ** *** * ** * * * ** ***** *** *** mouse_ CAAAGCACAGAGATCCATGGGCCTCGTTCAAGCTTCTCCTTCCATAAGCTTCCGTTGATC 179human_ ACACACATGGAGGGTACAGAGGCTCCT----GCTTCTCCTTCCT--GGTCACAGAT--TC 165 * ** *** * * *** * ************ * * * * ** mouse_ AGCCCTTGCTTCTCTTTTGTCGACCCCCTCTGCTCCCCTGCATCATAGCTGCCTCAGGTT 239human_ AGACCC--CCTCTCCTTCCCTGCCCTGCAGTTCGCCAGGGCCCTTCCACTTCCTAGGGTG 223 ** ** * **** ** * ** * * * ** ** ** *** *** mouse_ CTTACCCTCCTAGCTAAGATCCCCTCTGCATCTCCCTAGCTTT-TCTTTTTCCTCTCCCT 298human_ AC--CCCATGAGGTCTCGAAGTCCTCTCTGTCTCCCCAGCCTTCTCGCTTCTCTTTCTCT 281 *** * ** ***** ****** *** ** ** ** ** ** ** NFκB Elk-1 RFX-1 SRF mouse_ GTGACTCTGTAAGGTGATCTTGCGCCAGGGGCATCCCGTACCCAGCCCTCCACGGCTTCC 358human_ GTGACTCTGCATGCTGATCGGAGGCCAGGGGTTTCCCAGCCCCAGCCCTCTGTGGCTCCC 341 ********* * * ***** ******** **** ********** **** ** N-myc USF AP-1 RFX Elk-1 mouse_ TCCTCATGATAGGGGTGGGGACTGACTCTAGAGCT-------GTAGAGGGTGGGGCTCAT 411human_ TCCTCGTGGCAGGG-TCATGGTAGGCTCTGGAACTCTGGCCAGCGGAGGGTGGGGCCCAT 400 ***** ** **** * * * **** ** ** * *********** *** CEBP CHOP mouse_ AAAGCTGGCTCCCAGCCCAGGAGGCTGCAATAGCTGGGGTGGCTGAGGGATAAGGCCCTG 471human_ AAAGCTGGCTCATAGCCCAGGCTGCTGCAATAGCAGGGGTGGCTTAGG--------CCCA 452 *********** ******** *********** ********* *** ** mouse_ GCCCTGCCCCGTCTCCCCTCCCTTCCCCCAGGTATAAGAGCAGAGCTCAGGTGAGCTGGC 531human_ GCCC---CCTGCCTCCCCTCCCTTCCCCCAGGTATAAGAGCTGAGCTCAGGTGAGCTGGC 512 **** ** * ***************************** ****************** mouse_ TCCTCCATCCTGTCT 546 human_ TCCTCCTGTCTTGTC 527 ****** **
Fig. 22 Comparison of nucleotide sequence and potential regulatory elements of the S100A14 promoter fragment in mouse and human genomic DNAs. The consensus sequences of the potential transcription factor-binding sites are underlined or in bold. Nucleotide identities are indicated by asterisks. The predicted TATA box and CAAT sequence are represented by shading the consensus sequence. The major transcription initiation site identified in the human S100A14 is indicated by boxes.

Results 79
3.6 ERBB Ligands Induce S100A14 Expression at the Transcriptional Level in 9442 Cells
Preliminary experiments with H322 lung tumour cells revealed that stimulation of
the cells with serum induced S100A14 transcript (Fig. 23). Furthermore, our initial
analysis by immunohistochemistry of breast tumours demonstrated a significant
correlation between a high S100A14 level and ERBB2 overexpression (p = 0.04).
This prompted us to investigate whether S100A14 could be subjected to epidermal
growth factor (EGF) regulation.
6 12 24 48 72 1 3 0
S100A14
18S RNA
time (h) 6 12 24 48 72 1 3 0
S100A14
18S RNA
time (h)
Fig. 23 Up-regulation of S100A14 expression in H322 cells after stimulation with serum. Northern blot analysis of S100A14 expression in H322 cells was performed after stimulation with 20% serum for the indicated times. S100A14 cDNA sequence that covers the protein coding region was 32P-labelled and used as a probe for hybridization. 18S RNA was assayed as a loading control.
Eight human cell lines were treated with recombinant human EGF and S100A14
mRNA expression was measured by Northern blot analysis. The eight cell lines
included immortalized bronchial epithelial cells (9442) and immortalized mammary
epithelial cells (HMEB), which express S100A14 as well as six S100A14-negative
tumour cell lines: three breast (SK-BR-3, MCF-7, MDA-MB-231) and three lung
(H157, DMS-114, A549) tumour cell lines. Expression of endogenous S100A14
mRNA was remarkably induced by EGF in S100A14-positive 9442 and HMEB
cells, but not in S100A14-negative tumour cell lines (Fig. 24).
18S RNA
S100A14
EGF - -+ +9442 HMEB
18S RNA
S100A14
EGF - -+ +9442 HMEB
Fig. 24 Treatment of 9442 and HMEB cells with EGF leads to the induction of S100A14. 9442 and HMEB cells were grown for 3 days in regular culture medium and then treated for 12 hours with 50 ng/ml of EGF without medium change. 10 µg of total RNA was size-fractionated followed by Northern blot analysis. S100A14 cDNA sequence was applied as a probe for hybridization. 18S RNA was used as a loading control.

Results 80
Based on this result, we decided to further characterize regulation of the gene by
EGF using 9442 cells as a cell model. The 9442 (BET-1A) cells are derived from
normal human bronchial epithelial cells that were immortalized with the SV40 early
region and represent non-tumorigenic cells.
First, we determined the kinetics of S100A14 induction by EGF in 9442 cells.
Following the growth factor treatment, S100A14 levels were induced at 3 hours
post-treatment and then gradually increased, reaching a maximal level at 12 hours
(Fig. 25). The observed sustained response remained for up to 24 hours, with a
subsequent gradual decrease to slightly above pre-stimulation level. These results
clearly demonstrated an EGF-dependent induction of endogenous S100A14
expression and indicated that S100A14 is an EGF target gene.
S100A14
6 12 24 48 72 961 3 0
18S RNA
time (h)
S100A14
6 12 24 48 72 961 3 0
18S RNA
time (h)
Fig. 25 S100A14 is induced by EGF in a time-dependent manner in 9442 cells. 9442 cells were grown for 3 days in regular culture medium and then treated for the indicated times with 50 ng/ml of EGF without medium change. Northern blot analysis was performed using specific 32P-labelled S100A14 cDNA probe for the detection. 18S RNA was used to correct for equal loading.
Next, we examined the dose dependency of the S100A14 mRNA induction in 9442
cells. The response appeared to be maximal at a concentration of 50 to 100 ng/ml
of EGF (Fig. 26). Therefore, 50 ng/ml of EGF treatment for 12 hours was used in
this study.
18S RNA
1 10 50 100
S100A14
EGF (ng/ml)
18S RNA
1 10 50 100
S100A14
EGF (ng/ml)
Fig. 26 Induction of S100A14 is EGF dose-dependent. 9442 cells were grown for 3 days in regular culture medium and then treated with 1-100 ng/ml of EGF for 12 hours without medium change. S100A14 was detected by Northern blot analysis using a specific 32P-labelled cDNA probe. 18S RNA was used as a loading control.

Results 81
Treatment of the cells with transforming growth factor-α (TGF-α), another ERBB
receptor ligand, also resulted in an increase of the S100A14 transcript level
(Fig. 27). The kinetics of the TGF-α-induced response was similar for the EGF and
TGF-α ligands with a delayed time course relative to the EGF-induced response.
The induction was transient, starting at 6 hours post-treatment, reaching maximal
levels 12 hours post-stimulation and remaining for up to 48 hours, with levels
returning to basal by 72 hours.
6 12 24 48 72 961 30
18S RNA
S100A14
time (h) 6 12 24 48 72 961 30
18S RNA
S100A14
time (h)
Fig. 27 TGF-α induces S100A14 mRNA in 9442 cells. 9442 cells were grown for 3 days in regular culture medium and then treated for the indicated times with 20 ng/ml of TGF-α without medium change. 10 µg of total RNA was size-fractionated followed by Northern blot analysis. S100A14 cDNA sequence was 32P-labelled and used as a probe for hybridization. 18S RNA was used as a loading control.
S100A14 was also induced in response to fresh medium or “stimulation medium”
showing a maximal level at 6 hours (Fig. 28). Notably, the induction was less
potent than in response to EGF.
96
18S RNA
6 12 24 48 72 1 3 0
S100A14
time (h) 96
18S RNA
6 12 24 48 72 1 3 0
S100A14
time (h)
Fig. 28 Up-regulation of S100A14 expression in 9442 cells after stimulation with fresh medium. 9442 cells were grown for 3 days in regular culture medium and then incubated for the indicated times with fresh medium. Northern blot analysis was performed using 32P-labelled S100A14 cDNA probe for the detection. 18S RNA was used to correct for equal loading.
It was of interest to determine whether the minimal positive promoter element,
which we identified, confers EGF responsiveness to the luciferase reporter gene.
Treatment of the p2C-luc-transfected HEK 293 and Lovo cells with EGF revealed
no significant induction of the promoter fragment (data not shown).
The up-regulation of S100A14 by EGF was examined at the protein level by
Western blotting of the whole cell lysates. The cells were collected 24 hours after
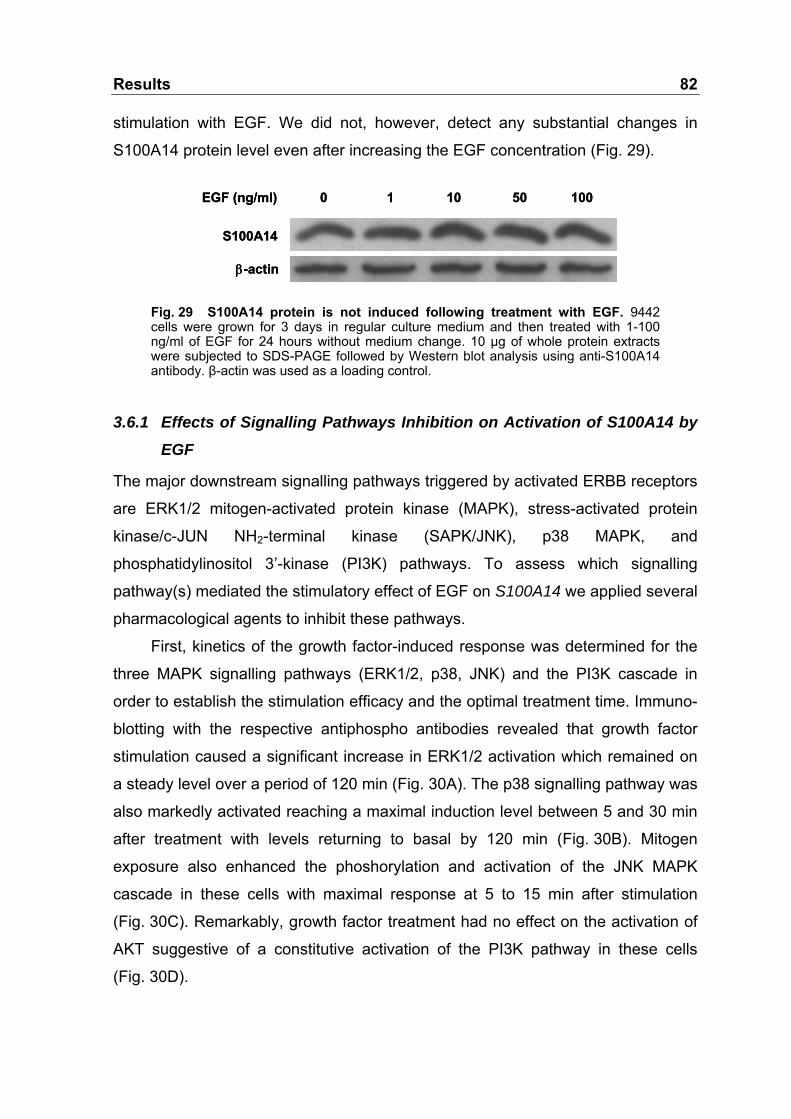
Results 82
stimulation with EGF. We did not, however, detect any substantial changes in
S100A14 protein level even after increasing the EGF concentration (Fig. 29).
S100A14
β-actin
1 10 50 1000EGF (ng/ml)
S100A14
β-actin
1 10 50 1000EGF (ng/ml)
Fig. 29 S100A14 protein is not induced following treatment with EGF. 9442 cells were grown for 3 days in regular culture medium and then treated with 1-100 ng/ml of EGF for 24 hours without medium change. 10 µg of whole protein extracts were subjected to SDS-PAGE followed by Western blot analysis using anti-S100A14 antibody. β-actin was used as a loading control.
3.6.1 Effects of Signalling Pathways Inhibition on Activation of S100A14 by EGF
The major downstream signalling pathways triggered by activated ERBB receptors
are ERK1/2 mitogen-activated protein kinase (MAPK), stress-activated protein
kinase/c-JUN NH2-terminal kinase (SAPK/JNK), p38 MAPK, and
phosphatidylinositol 3’-kinase (PI3K) pathways. To assess which signalling
pathway(s) mediated the stimulatory effect of EGF on S100A14 we applied several
pharmacological agents to inhibit these pathways.
First, kinetics of the growth factor-induced response was determined for the
three MAPK signalling pathways (ERK1/2, p38, JNK) and the PI3K cascade in
order to establish the stimulation efficacy and the optimal treatment time. Immuno-
blotting with the respective antiphospho antibodies revealed that growth factor
stimulation caused a significant increase in ERK1/2 activation which remained on
a steady level over a period of 120 min (Fig. 30A). The p38 signalling pathway was
also markedly activated reaching a maximal induction level between 5 and 30 min
after treatment with levels returning to basal by 120 min (Fig. 30B). Mitogen
exposure also enhanced the phoshorylation and activation of the JNK MAPK
cascade in these cells with maximal response at 5 to 15 min after stimulation
(Fig. 30C). Remarkably, growth factor treatment had no effect on the activation of
AKT suggestive of a constitutive activation of the PI3K pathway in these cells
(Fig. 30D).

Results 83
β-actin
P-ERK1/2
MS - + + + + + +time (min) 0 5 15 30 60 90 120
P-p38
p38
MStime (min)
- + + + + + +0 5 15 30 60 90 120
SAPK/JNK
P-SAPK/JNK
Akt
P-Akt
MStime (min)
A
B
C
D
MStime (min)
- + + + + + +0 5 15 30 60 90 120
- + + + + + +0 5 15 30 60 90 120
β-actin
P-ERK1/2
MS - + + + + + +time (min) 0 5 15 30 60 90 120
P-p38
p38
MStime (min)
- + + + + + +0 5 15 30 60 90 120- + + + + + +0 5 15 30 60 90 120
SAPK/JNK
P-SAPK/JNK
Akt
P-Akt
MStime (min)
A
B
C
D
A
B
C
D
MStime (min)
- + + + + + +0 5 15 30 60 90 120- + + + + + +0 5 15 30 60 90 120
- + + + + + +0 5 15 30 60 90 120- + + + + + +0 5 15 30 60 90 120
Fig. 30 Kinetics of the growth factor-induced response for the ERK1/2, p38, and JNK MAPK pathways and the PI3K cascade. 9442 cells were grown for 3 days in regular culture medium. The medium was then replaced with the medium that was supplemented with a double set of growth factors (referred to as “stimulation medium”; MS). The cells were cultured for the indicated times and harvested. 20 µg of whole protein extracts were subjected to SDS-PAGE followed by Western blot analysis using A: anti-phospho ERK1/2, B: anti-phospho p38, C: anti-phospho SAPK/JNK, and D: anti-phospho AKT antibodies. β-actin, p38, SAPK/JNK, and AKT were used as loading controls, respectively.
Next, we examined the inhibitory efficacy of various pharmacological agents on
activation of the intracellular signalling pathways triggered in response to EGF.
U0126 (MEK1 and MEK2 inhibitor) markedly suppressed growth factors-induced
ERK1/2 activation in 9442 cells (Fig. 31A). AG1478 (ERBB receptor tyrosine
kinase inhibitor) also markedly attenuated ERK1/2 phosphorylation (Fig. 31B). The
suppressive efficacy of SB203580 (p38 kinase inhibitor) on the p38 MAPK

Results 84
pathway and SP600125 (JNK kinase inhibitor) on the JNK pathway was confirmed
by the ability to block the activation of their downstream targets: HSP27 and
c-JUN, respectively. This was determined by immunoblotting with the respective
antiphospho antibodies (Fig. 31C, D). Pretreatment with LY294002 (a PI3K
inhibitor) only partially inhibited the response to growth factors (Fig. 31E).
Increasing concentration of the inhibitor failed to alter the inhibitory response in
these cells.
β-actin
P-ERK1/2
MS - + + +DMSO U0126
β-actin
P-ERK1/2
MS - + + +DMSO AG1478
A B
C D
p38
P-HSP27
MS - + + +DMSO SB203580
c-JUN
P-c-JUN
MS - + + +DMSO SP600125
E
AKT
P-AKT
MS - + + +EtOH LY294002
β-actin
P-ERK1/2
MS - + + +DMSO U0126
β-actin
P-ERK1/2
MS - + + +DMSO AG1478
A B
C D
p38
P-HSP27
MS - + + +DMSO SB203580
c-JUN
P-c-JUN
MS - + + +DMSO SP600125
E
AKT
P-AKT
MS - + + +EtOH LY294002
Fig. 31 The inhibitory efficacy of various pharmacological agents on activation of the ERK1/2, p38, and JNK MAPK pathways and the PI3K cascade. 9442 cells were grown in regular medium for 3 days and then preincubated for 1 hour with A: 20 µM U0126, B: 10 µM AG1478, C: 40 µM SB203580, D: 40 µM SP600125, and E: 40 µM LY294002, respectively, without medium change. Next, the cells were stimulated with the medium that was supplemented with a double set of growth factors (referred as “stimulation medium”; MS) for 10 min (A), 10 min (B), 5 min (C), 5 min (D), and 10 min (E). As negative controls, cells were treated with the vehicle: DMSO (A, B, C, D) or ethanol (E). 20 µg of whole protein extracts were subjected to SDS-PAGE followed by Western blot analysis using anti-phospho ERK1/2 (A, B), anti-phospho HSP27 (C), anti-phospho c-JUN (D), and anti-phospho AKT (E) antibodies. β-actin, p38, c-JUN, and AKT were assayed as loading controls.
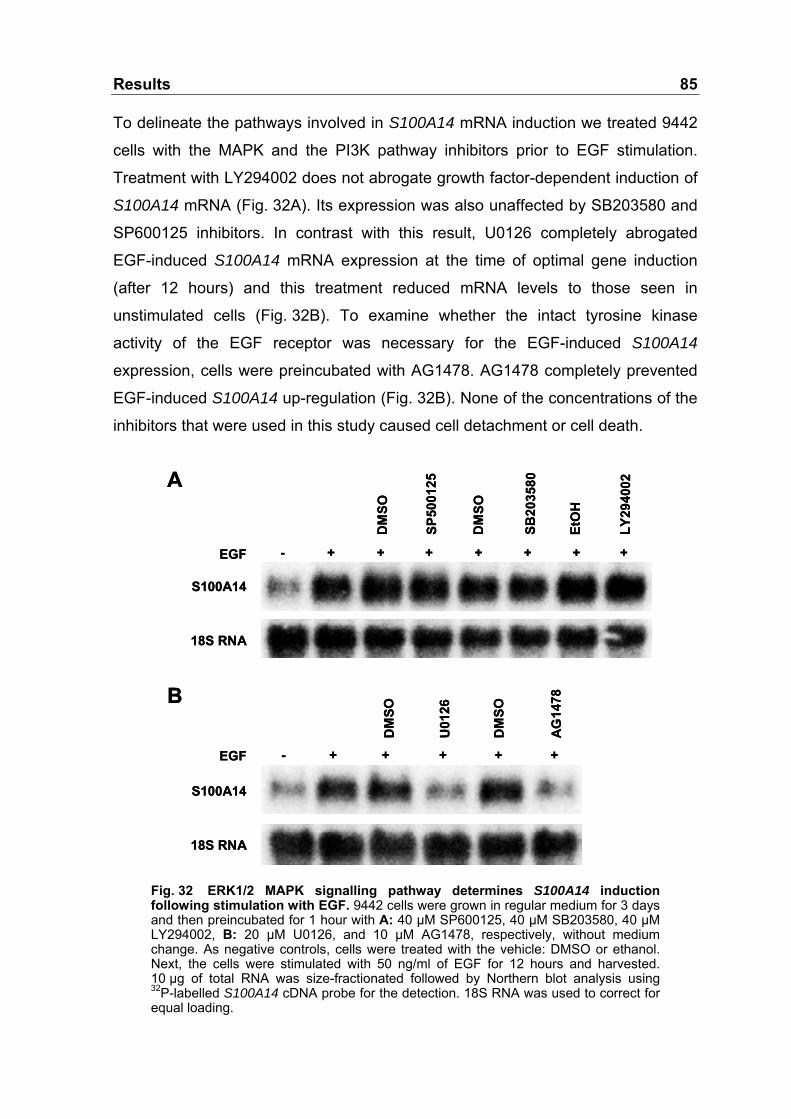
Results 85
To delineate the pathways involved in S100A14 mRNA induction we treated 9442
cells with the MAPK and the PI3K pathway inhibitors prior to EGF stimulation.
Treatment with LY294002 does not abrogate growth factor-dependent induction of
S100A14 mRNA (Fig. 32A). Its expression was also unaffected by SB203580 and
SP600125 inhibitors. In contrast with this result, U0126 completely abrogated
EGF-induced S100A14 mRNA expression at the time of optimal gene induction
(after 12 hours) and this treatment reduced mRNA levels to those seen in
unstimulated cells (Fig. 32B). To examine whether the intact tyrosine kinase
activity of the EGF receptor was necessary for the EGF-induced S100A14
expression, cells were preincubated with AG1478. AG1478 completely prevented
EGF-induced S100A14 up-regulation (Fig. 32B). None of the concentrations of the
inhibitors that were used in this study caused cell detachment or cell death.
EGF
DM
SO
SB20
3580
- + + + + +
SP50
0125
DM
S O
+ +Et
OH
LY29
4002
AG
1478
DM
SO
EGF - + + + + +
U01
26
DM
SO
S100A14
18S RNA
A
B
S100A14
18S RNA
EGF
DM
SO
SB20
3580
- + + + + +
SP50
0125
DM
S O
+ +Et
OH
LY29
4002
AG
1478
DM
SO
EGF - + + + + +
U01
26
DM
SO
S100A14
18S RNA
A
B
S100A14
18S RNA
Fig. 32 ERK1/2 MAPK signalling pathway determines S100A14 induction following stimulation with EGF. 9442 cells were grown in regular medium for 3 days and then preincubated for 1 hour with A: 40 µM SP600125, 40 µM SB203580, 40 µM LY294002, B: 20 µM U0126, and 10 µM AG1478, respectively, without medium change. As negative controls, cells were treated with the vehicle: DMSO or ethanol. Next, the cells were stimulated with 50 ng/ml of EGF for 12 hours and harvested. 10 µg of total RNA was size-fractionated followed by Northern blot analysis using 32P-labelled S100A14 cDNA probe for the detection. 18S RNA was used to correct for equal loading.
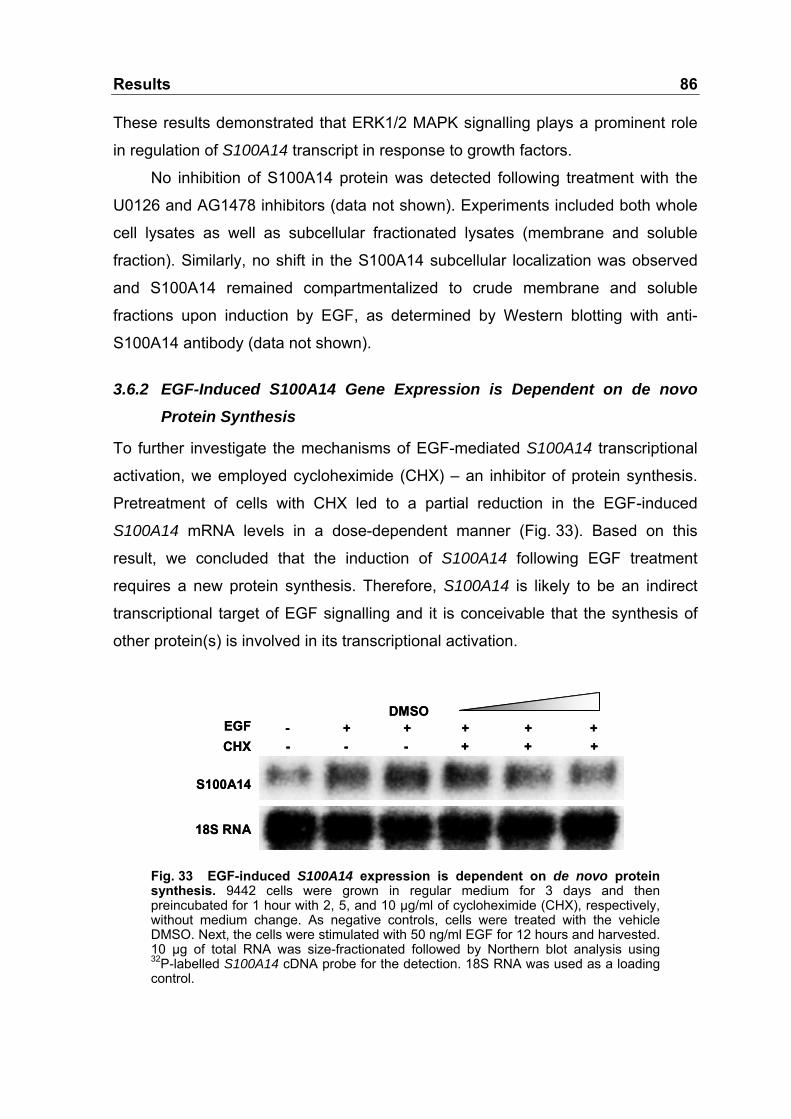
Results 86
These results demonstrated that ERK1/2 MAPK signalling plays a prominent role
in regulation of S100A14 transcript in response to growth factors.
No inhibition of S100A14 protein was detected following treatment with the
U0126 and AG1478 inhibitors (data not shown). Experiments included both whole
cell lysates as well as subcellular fractionated lysates (membrane and soluble
fraction). Similarly, no shift in the S100A14 subcellular localization was observed
and S100A14 remained compartmentalized to crude membrane and soluble
fractions upon induction by EGF, as determined by Western blotting with anti-
S100A14 antibody (data not shown).
3.6.2 EGF-Induced S100A14 Gene Expression is Dependent on de novo Protein Synthesis
To further investigate the mechanisms of EGF-mediated S100A14 transcriptional
activation, we employed cycloheximide (CHX) – an inhibitor of protein synthesis.
Pretreatment of cells with CHX led to a partial reduction in the EGF-induced
S100A14 mRNA levels in a dose-dependent manner (Fig. 33). Based on this
result, we concluded that the induction of S100A14 following EGF treatment
requires a new protein synthesis. Therefore, S100A14 is likely to be an indirect
transcriptional target of EGF signalling and it is conceivable that the synthesis of
other protein(s) is involved in its transcriptional activation.
18S RNA
CHXEGF
-+- -
- +DMSO
+ + +
S100A14
+ + +
18S RNA
CHXEGF
-+- -
- +DMSO
+ + +
S100A14
+ + +
Fig. 33 EGF-induced S100A14 expression is dependent on de novo protein synthesis. 9442 cells were grown in regular medium for 3 days and then preincubated for 1 hour with 2, 5, and 10 µg/ml of cycloheximide (CHX), respectively, without medium change. As negative controls, cells were treated with the vehicle DMSO. Next, the cells were stimulated with 50 ng/ml EGF for 12 hours and harvested. 10 µg of total RNA was size-fractionated followed by Northern blot analysis using 32P-labelled S100A14 cDNA probe for the detection. 18S RNA was used as a loading control.
Results 87
PMA induced S100A14 mRNA in 9442 cells reaching a maximal level by 12
hours and returning to a level slightly above basal by 24 hours (Fig. 34A). The
kinetics of this response paralleled the time course of the EGF effect, although
PMA was less potent than EGF in inducing S100A14.
3.7 Transcriptional Induction by Protein Kinase C Screening for transcriptional modulators of S100A14 revealed phorbol ester
12-myristate 13-acetate (PMA) as a potential activator of the gene. PMA acts as a
specific agonist of both conventional and novel protein kinase C (PKC)
isoenzymes activation. The phospholipase Cγ – PKC pathway is well known to be
coupled to activation of ERBB receptors and PKC has often been implicated as a
mediator of ERBB receptor transactivation. The involvement of PKC was therefore
investigated to determine whether PKC could mediate S100A14 mRNA induction.
To confirm that S100A14 induction in response to PMA was PKC-dependent,
we tested the ability of the PKC inhibitor bisindolylomaleimide I to block PMA-
stimulated S100A14 induction. As demonstrated in Fig. 34B, bisindolylomaleimide
I (5 µM) did not abrogate S100A14 induction in response to PMA.
The ability of PMA to cause the phosphorylation and activation of ERK1/2
MAP kinases is well established and has been shown to depend upon PKC-
mediated activation of upstream elements of the ERK1/2 MAPK pathway,
including RAS and RAF-1. We therefore addressed the question whether PMA
had the capacity to activate the ERK1/2 MAPK pathway in 9442 cells. PMA
induced a rapid increase in the amount of phospho-ERK1/2 in 9442 cells and this
activation continued for at least 60 min (Fig. 34C). To determine whether the PMA-
induced increase in S100A14 mRNA also depends upon the activation of ERK1/2,
we stimulated 9442 cells with PMA and tested by Northern blot analysis the ability
of U0126 to inhibit S100A14 mRNA. In the presence of U0126, the S100A14
mRNA level decreased to slightly above pre-stimulation level (Fig. 34B).
The ability of both EGF and PMA to stimulate ERK1/2 activity in 9442 cells
could suggest that the capacity of EGF to stimulate S100A14 might be PKC-
dependent. We therefore tested the effect of the PKC inhibitor on S100A14
induction in response to EGF. Pretreatment of cells with bisindolylmaleimide I did
not significantly influence S100A14 up-regulation in response to EGF suggesting
that the induction is not mediated by PKC (Fig. 34D).

Results 88
A
S100A14
18S RNA
PMA - + ++ +
BIS
DM
SO
U01
26
DM
SO
B
PMA - ++12 24
18S RNA
S100A14
time (h) 0
C
PMA
β-actin
P-ERK1/2
- + ++ ++ +10 100 10 100 10 100
15 30 60conc (nM)time (min)
-+EGF
-+
PMA+-
DM
SO
18S RNA
S100A14
BIS
--
D
A
S100A14
18S RNA
PMA - + ++ +
BIS
DM
SO
U01
26
DM
SO
B
PMA - ++12 24
18S RNA
S100A14
time (h) 0
C
PMA
β-actin
P-ERK1/2
- + ++ ++ +10 100 10 100 10 100
15 30 60conc (nM)time (min)
-+EGF
-+
PMA+-
DM
SO
18S RNA
S100A14
BIS
--
D
Fig. 34 PMA exerts stimulation of S100A14 via PKC activation. 9442 cells were grown for 3 days in regular culture medium. A: The cells were then treated without medium change with 100 nM of PMA for the indicated times and harvested for Northern blot analysis. B: The cells were preincubated for 1 hour with 5 µM of bisindolylomaleimide I (BIS) or 20 µM of U0126, respectively, without medium change. As negative controls, cells were treated with the vehicle DMSO. Next, the cells were stimulated with 100 nM of PMA for 12 hours and harvested. 10 µg of total RNA was size-fractionated followed by Northern blot analysis using 32P-labelled S100A14 cDNA probe for the detection. 18S RNA was used as a loading control. C: The cells were stimulated without medium change with 10 and 100 nM of PMA for the indicated times and harvested. 20 µg of whole protein extracts were subjected to SDS-PAGE followed by Western blot analysis using anti-phospho ERK1/2 antibody. β-actin was used as a loading control. D: The cells were preincubated for 1 hour with 5 µM of bisindolylomaleimide I (BIS) without medium change. Next, the cells were stimulated with 100 nM of PMA or 50 ng/ml of EGF, respectively, for 12 hours and harvested. As negative controls, cells were treated with the vehicle DMSO. Northern blot analysis was performed using 32P-labelled S100A14 cDNA probe for the detection. 18S RNA was used as a loading control.
89
4 Discussion
4.1 Identification of the S100A14 cDNA This study was undertaken in order to identify tumour-associated genes with
potential application in the detection or treatment of the disease. For this purpose,
suppression subtractive hybridization (SSH) was performed using cDNA
synthesized from normal human bronchial epithelial cells and cells derived from a
metastatic small cell lung carcinoma (Difilippantonio et al., 2003).
SSH was developed by Diatchenko and colleagues (Diatchenko et al., 1996)
providing a powerful approach for identification of genes differentially expressed in
one cell population compared to another. The technique has been successfully
used in many experimental settings and two important applications are differential
gene expression in multiple tumour systems and identification of tumorigenesis
relevant genes. Although cDNA microarrays are increasingly used for the global
analysis of gene expression, SSH is still widely applied. It not only permits
identification of tumour-associated genes with known function but also unbiased
isolation of novel sequences that are not yet available on microchips. Moreover, it
enables the recovery of abundant as well as low-copy-number mRNA transcripts.
Using this approach, we recovered a set of genes differentially expressed in
lung tumour cells compared to normal lung cells. These genes then provided the
groundwork for identifying unknown transcripts with diagnostic and prognostic
value for cancer. In this set of cDNAs, it was then confirmed that one of the under-
represented transcripts, with no homology to any known gene, was differentially
expressed in a panel of lung tumour cell lines. Hence, we decided to analyse this
transcript more extensively.
The isolated full-length cDNA is 1067 bp in length and encodes a putative
protein of 104 amino acids. The predicted protein contains the S100-specific EF-
hand calcium-binding domain and shares the highest sequence homology with
S100A13. We therefore assigned this unknown transcript as a novel member of
the S100 gene family and designated it S100A14 (Pietas et al., 2002).
The S100 protein family forms a growing subfamily of proteins related by
Ca2+-binding motifs to the EF-hand Ca2+-binding protein superfamily. The
Discussion 90
members of this family are involved in Ca2+-, Zn2+-, and Cu2+-dependent regulation
of many cellular processes, including tumour development and acquisition of
metastatic phenotype (Donato, 2001; Heizmann et al., 2002). The homology to the
protein family known to be associated with tumorigenesis prompted us to
investigate the involvement of S100A14 in tumour biology.
Further analysis of the cDNA sequence revealed that the S100-specific
N-terminal EF-hand of S100A14 consists of 13 amino acids. This is in contrast
with the 14 amino acid loop characteristic for the S100 family. However, it should
still be a functional calcium-binding domain since the critical Glu45 is present
(Kawasaki et al., 1998). The carboxyl terminal canonical EF-hand, also referred to
as the high affinity calcium-binding site, seems to be mutated as only 2 out of 6
conserved amino acid residues are present. The presence of the N-myristoylation
site at the N-terminus of S100A14 poses the possibility of an interaction with a
membrane receptor or with the lipid bilayer itself. In contrast to other S100 protein
family members the deduced protein contains an extended hydrophilic loop at the
N-terminus spanning at least 17 amino acids. The calculated molecular weight and
isoelectric point for the S100A14 protein are in accordance with characteristic
features of the S100 family as small acidic proteins. Also the structural
organization of the protein based on hydropathy plots is similar to other members
of the family.
4.2 S100A14 is Differentially Expressed in Human Tumours Expression of S100A14 was found in epithelial cells of a variety of tissues
including colon, thymus, kidney, liver, small intestine, lung, breast, cervix, ovary,
uterus, pancreas, prostate, rectum, stomach and thyroid gland, most of them
having mainly an epithelial-parenchymal phenotype. In contrast, most
mesenchymal-stromal tissues like skeletal muscle, white blood cells and spleen
are negative (Fig. 5). This is largely consistent with our database searches
indicating many S100A14-related ESTs present in libraries of normal as well as
tumour tissue such as squamous cell carcinoma of the skin, colon, stomach and
pancreas adenocarcinoma as well as uterus and lung cancers. Normal tissues
were additionally represented by head and neck as well as placenta. In contrast,
we did not observe detectable mRNA expression in placenta even after prolonged

Discussion 91
exposure indicating that the expression level of the protein must be very low (data
not shown). We found mouse S100a14 transcript mainly in libraries of embryonal
origin.
We were primarily interested in identifying transcripts differentially expressed
in a wide range of tumours. Differential expression of S100A14 was therefore
confirmed by Northern blot analysis of various immortalized and tumour cell lines
from different tissues. S100A14 was abundantly expressed in cells cultured from
normal human epithelial cells, moderately expressed in immortalized epithelial
cells, and absent from most of the examined tumour cell lines. The relatively high
S100A14 expression in most of the colon tumour cell lines could be due to its high
basal expression level in normal colon tissue. These results indicate that altered
S100A14 expression occurs in most of the human tumour cell lines. Therefore, we
hypothesized that its expression might be also suppressed in primary tumour
tissue.
Using the BD Biosciences array with 241-matched tumour/normal cDNA
samples from individual patients we determined the expression status of S100A14
in 10 different human tumour types. The gene is preferentially overexpressed in
ovary, breast, and uterus tumours, and mainly underexpressed in kidney, rectum,
and colon tumours. Most notably, increased rather than decreased expression of
S100A14 has been found in lung tumours. The reason for this discrepancy is
unclear, although it may be due to differences between the cell model system and
the primary tissue. This highlights the need to supplement cell culture-derived
transcript abundance data with transcriptional or immunohistochemical analysis of
primary material. Thus, using immunohistochemistry, we sought to determine
S100A14 protein expression in lung tumour specimens. Additionally, we examined
breast tumour samples since this tumour type showed significant S100A14
overexpression in our transcriptional analysis.
Whilst normal lung and breast epithelial cells express S100A14 at a low level,
we observed strong tumour cell-localized cytoplasmic and membranous S100A14
protein expression in over 60% of the analysed tumour samples. Thus, our
analysis on the expression of S100A14 in primary tumours differs from the cell
culture data by demonstrating a consistent and strong overexpression of this gene
in multiple lung and breast tumour samples. We therefore speculated that the

Discussion 92
expression of the gene might be modulated by extrinsic factors or by the
microenvironment in which the cancer cells reside.
The influence of cell culture conditions on gene expression patterns of
cultured cell lines is a longstanding concern. Cells grown in culture have unlimited
access to nutrients under conditions most favourable for growth and proliferation
and only little exposure to extrinsic factors that modulate growth and
differentiation, e.g. cytokines. In contrast, cells in a tumour growing in a host tissue
environment face conditions with more limited nutrients and oxygen and are
subjected to or benefit from a wide variety of host factors. Recently, global gene
expression profiling of tumour cells grown in vitro versus the same cells
transplanted into an in vivo environment (nude mice) have been performed
(Creighton et al., 2003). This revealed specific up-regulation of one set of genes
related to cell growth and proliferation when in culture and a different set of genes
related to cell adhesion, extracellular matrix, growth substances, and
neovascularization when developing as an in vivo tumour.
Our expression analysis of nine S100A14-negative lung tumour cell lines
transplanted into immunodeficient mice as well as spheroides of 2 ovary tumour
cell lines did not reveal a general re-expression of the gene (Fig. 12). Thus, our
results cannot imply an essential physiological role of the tumour environment for
S100A14 expression. The interpretation of this finding remains to be elucidated.
Our expression analysis also suggests that up-regulation of S100A14 is not a
universal feature of epithelial cell tumours. A potential mechanism for the
apparently contradictory role of S100A14 in renal, colon and rectum cancer could
be context-dependent. Since most genes act within networks, differences in
S100A14 expression pattern may arise from differences in the expression profile
of its interacting proteins as well as differential availability of signalling pathways
involved in its regulation in various cell types. A growing number of genes
regulated by the relative contributions of specific signalling pathways in a particular
cell type have been revealed in the recent years as exemplified by S100A2 and
maspin. S100A2 was found to be frequently down-regulated early in lung cancer
development (Feng et al., 2001). Supporting these data, a number of expression
studies implicated this gene as a breast tumour suppressor gene (Liu et al., 2000;
Wicki et al., 1997). However, contrary to the proposed role of S100A2 as a tumour

Discussion 93
suppressor protein, it was found to be overexpressed in gastric and ovarian
tumours (El-Rifai et al., 2002; Hough et al., 2001).
Maspin (SERPIN B5) was also found to be down-regulated in breast and
prostate cancer and was suggested to be a suppressor of metastasis (Seftor et al.,
1998). Paradoxically, it was reported that the gene was strongly expressed relative
to normal tissue in pancreatic tumours (Maas et al., 2001) and lung tumours
(Heighway et al., 2002). The seemingly contradictory results of S100A14, S100A2
and maspin suggest that these and other genes perhaps not only behave
differently in particular tumours, but also that they may play different roles in
various tissue types and perhaps even within distinct components of a tissue.
Significant up-regulation of S100A14 in lung and breast tumours directed our
attention towards its clinical significance in these tumours. Most interestingly, we
found that S100A14 overexpression was significantly associated with ERBB2
overexpression in breast tumours.
The ERBB family of receptor tyrosine kinases (RTKs) couples binding of
extracellular growth factor ligands to intracellular signalling pathways regulating
diverse biologic responses, including proliferation, differentiation, cell motility, and
survival (reviewed in Prenzel et al., 2001; Olayioye et al., 2000; Marmor et al.,
2004). It consists of four receptors: ERBB1 (also called epidermal growth factor
receptor – EGFR or HER1), ERBB2 (HER2/neu), ERBB3 (HER3), and ERBB4
(HER4). All the family members have in common an extracellular ligand-binding
domain, a single membrane-spanning region and a cytoplasmic tyrosine kinase
domain. A family of ERBB ligands, the EGF-related peptide growth factors, have
been characterized, including epidermal growth factor (EGF), transforming growth
factor-α (TGF-α), amphiregulin, heparin-binding EGF-like growth factor,
betacellulin, epiregulin, and neuroregulins (NRG-1,-2,-3,-4). The binding affinity of
the EGF-like ligands to various ERBB receptors differs as is their potency to
induce signalling. No direct ligand for ERBB2 has yet been discovered. However,
increasing evidence suggests that the primary function of ERBB2 is as a co-
receptor. In fact, ERBB2 is the preferred heterodimerization partner for all other
ERBB family members and plays a role in the potentiation of ERBB receptor
signalling.

Discussion 94
The ERBB RTKs have a broad expression pattern on epithelial, mesenchymal,
and neuronal cells. Signalling through these receptors plays a critical
developmental role in inductive cell fate determination in many organ systems.
This is exemplified by the perinatal (ERBB1) or early embryonic lethality (ERBB2,
-3, and -4) of knock-out mice as a result of insufficient heart and nervous system
development (Burden and Yarden, 1997). Furthermore, ERBB RTKs are involved
in mammary gland development during puberty and pregnancy.
Ligand binding drives receptor dimerization leading to the formation of both
homo- and heterodimers. Dimerization consequently stimulates the intrinsic
tyrosine kinase activity of the receptors and triggers autophosphorylation of
specific tyrosine residues within the cytoplasmic domain. Each ERBB receptor
displays a distinct pattern of C-terminal autophosphorylation sites. These
phosphorylated residues serve as docking sites for signalling effector molecules
containing Src homology 2 (SH2) or phosphotyrosine binding (PTB) domains.
Examination of the binding preferences of different effector proteins revealed a
great deal of overlap in the signalling pathways activated by the four ERBB
receptors. All ERBB family members apparently utilize the mitogen-activated
protein (MAP) kinase pathways as the major signalling routes.
A wealth of clinical data demonstrates the importance of ERBB receptors, in
particular ERBB1 and ERBB2, in multiple human cancers, including lung, colon,
breast, prostate, brain, head and neck, thyroid, ovarian, bladder, gliomas, and
renal carcinoma (Yarden and Sliwkowski, 2001). Several phenomena are
resposible for hyperactivation of ERBB receptors in tumours, including
overexpression, amplification, and constitutive activation of mutant receptors or
autocrine growth factor loops. Most notably, ERBB2 is overexpressed in 20-30%
of breast and ovarian tumours and its overexpression correlates with tumour
chemoresistance and poor patient prognosis, yielding a median survival of
3 years, compared with 6-7 years when unassociated with ERBB2 (Miles et al.,
1999; Witton et al., 2003).
Due to their frequent overexpression in various cancers and their high
signalling capacity ERBB receptors are promising targets for therapeutic
intervention in human cancers. Monoclonal antibodies raised against several
epitopes of the ERBB1 and ERBB2, as well as EGF and TGF-α blocking
Discussion 95
antibodies, have been validated in the clinic as an ERBB-directed therapeutic
approach. Herceptin, a monoclonal antibody that targets the extracellular domain
of ERBB2, was the first target-selective drug raised against an oncogenic cell
surface receptor and therefore represents the first example of a new era of anti-
cancer therapy. This antibody is now applied in the treatment of metastatic breast
cancer patients.
The immunohistochemical detection of ERBB2 in our study (29.3%) is in
keeping with the reported frequency of the protein overexpression in breast
cancer. In contrast to a number of previous reports, however, ERBB2 expression
was not related to oestrogen receptor negativity in our study.
Immunohistochemical analysis of primary lung and breast tumours revealed
a significant association between the subcellular distribution of S100A14 and the
protein abundance. The majority of S100A14-overexpressing tumours displayed
both plasma membrane and cytoplasmic localization of S100A14 relative to low-
expressing tumours showing predominantly cytoplasmic staining. Also, there was
a significant correlation between higher-grade (grade 3) lung tumours and
S100A14 cytoplasmic and plasma membrane localization. Moreover, subcellular
distribution of S100A14 was related to lung tumour histology. Both cytoplasmic
and plasma membrane-localized staining were associated with squamous cell
carcinomas compared to adenocarcinomas detecting cytoplasmic-only S100A14.
In contrast to this tumour cell plasma membrane localization, normal human
breast and lung epithelial cells showed exclusively diffuse cytosolic S100A14
expression (Fig. 8 and Fig. 11). These data suggest that translocation of S100A14
to the plasma membrane could be unique to cancer cells over normal lung and
breast epithelial cells and could represent the disease-associated state.
Many S100 proteins translocate to different cellular compartments in
response to elevated intracellular Ca2+ and Zn2+ level and this process was shown
to be cell type specific (Hsieh et al., 2004). Exposure of several different cell lines
to elevated Ca2+ and Zn2+ level did not affect the subcellular localization of
S100A14 in our study, suggesting that fluctuations of divalent cations do not
regulate S100A14 protein distribution. The prevalence and the clinical relevance of
the plasma membrane relative to cytoplasmic S100A14 distribution remains to be
established in other tumour types. It is conceivable that the subset of lung and
Discussion 96
breast cancers that show both plasma membrane and cytoplasmic localization
define a molecularly different mechanism of regulation on the protein.
Analysis of cultured cells demonstrated predominantely plasma membrane-
localized endogenous S100A14 (Fig. 14). Most notably, prominent staining at cell
junctions was detected in several tumour cell lines suggesting a potential role in
establishing cell-cell contacts. Cellular fractionation of 9442 cells and testing the
different fractions with anti-S100A14 antibody confirmed the immunofluorescence
data. S100A14 can be detected in both membrane-bound and soluble forms,
although the soluble protein is present only in very small amounts (Fig. 15).
Analysis of cells transiently transfected with epitope-tagged protein showed
predominantely cytoplasmic and perinuclear localization of the S100A14 protein
(Fig. 13). This result, however, requires further confirmation by cellular
fractionation. A challenge of future investigations will be to address whether the
sites of action of S100A14 are in the cytosol or in membranes.
4.3 Identification and Characterization of the Genomic Locus of S100A14 Numerous studies have described frequent alterations of the chromosomal region
1q21 in tumours where the human S100 gene cluster is located. In order to
elucidate the rationale for the differential S100A14 expression in tumours, we
defined its chromosomal localization as well as the nature of its genomic locus in
size, structure, and sequence of its introns and exons. Furthermore, we analysed
its immediately upstream regulatory region to get some insights into the regulation
of the gene.
The human S100 gene family encodes a set of structurally related proteins
sharing a common genomic organization of three exons and two introns, with the
first exon being short and untranslated and the second and third exons containing
the coding sequence (Fig. 35). Exceptions are S100A5 consisting of four exons
with exon three and four being the coding ones, S100A4 containing an additional
alternatively spliced untranslated exon, S100A11 with the coding sequence
beginning already in the first exon, and S100A16, which is composed of four
exons and three introns with coding sequence in the third and fourth exon and the
first and second exon being alternatively transcribed.

Discussion 97
Unlike other S100 genes, S100A14 contains an additional intron that interrupts the
sequence encoding the N-terminal part of the protein. Lack of nucleotide sequence
homology to any of the S100 family members and lack of strong conservation of
the genomic structure may indicate that S100A14 is less closely related to other
members of the S100 family.
S100A1
S100A4
S100A5
S100A11
S100A14
S100A1
S100A4
S100A5
S100A11
S100A14
Fig. 35 Generic S100 gene structure. A typical S100 gene, e.g. S100A1 is composed of three exons (boxes) with exon 1 being not translated (open boxes) and exons two and three containing the coding region (black boxes). Exceptions to this general rule are depicted below with straight lines in S100A4 indicating alternative splicing and arrows indicating the translational start.
An Alu element belonging to the “young” Alu subfamily (AluY) was identified in the
direct proximity of the polyadenylation signal in the 3’ UTR reaching beyond the
genomic locus of S100A14. This family of repetitive DNA has been implicated in
the stimulation of homologous and non-homologous recombination and triggering
chromosomal rearrangements (Deininger and Batzer, 1999). The frequent
involvement of the highly conserved 26-bp core sequence of Alu elements in gene
rearrangements suggested that this sequence might represent a recombinational
hotspot (Rüdiger et al., 1995). The Alu element present in the genomic locus of
S100A14 contains the 26-bp core sequence and therefore might contribute
specifically to gene rearrangements.
We mapped S100A14 to the chromosome band 1q21 where 16 other S100
genes are tightly clustered (Heizmann et al., 2002). This region is known to be
involved in structural and numerical aberrations in various human tumours
(Weterman et al., 1996; Gendler et al., 1990). Our Southern blot analysis of
S100A14-negative as well as S100A14-positive lung cancer cell lines, however, so
far indicates that the S100A14 gene itself is not affected by rearrangements.
S100A14 was present in all tumour cell lines examined and showed no detectable

Discussion 98
deletions or gross rearrangements (Fig. 18). Thus, it seems likely that the
differential expression observed in tumour cell lines is not driven by dramatic gene
deletions or gross rearrangements. This, however, does not completely rule out a
possible correlation of S100A14 expression with the frequently observed
chromosome 1q21 rearrangements in solid tumours.
It has been previously shown that the chromosome region 1q21-q22 contains
extended regions of high CpG island density (Wright et al., 2001). Consistent with
this observation are reports of site-specific methylation associated with
transcriptional repression in the promoter region of S100A2 in tumorigenic cells
(Wicki et al., 1997; Lee et al., 1992). Examination of the 5’ upstream region as well
as introns of S100A14 did not reveal any CpG island. Similarily, we did not
observe re-expression of the gene in eight lung cancer cell lines on treatment with
5-aza-2'-deoxycytidine as determined by Northern blot and RT-PCR analysis (data
not shown).
In the course of our studies on the genomic organization of S100A14, we
identified the S100A14 promoter fragment, located within 511 bp upstream of the
transcription initiation site, and containing constitutive promoter elements (TATA
box) that might support basal transcription at this promoter.
The primary aim of our promoter analysis was to determine whether the
aberrant regulation of S100A14 at the promoter level might be responsible for its
altered expression in tumours. Therefore, we chose for the transient expression
analysis HEK 293 cells, which are well established in promoter assays but do not
express endogenous S100A14, and Lovo cells, which have a high level of
S100A14 mRNA. Another reason for selecting these cell lines was the high
transfection efficiency with standard procedures. Using a luciferase reporter
system, a panel of deletion mutants covering the entire putative promoter fragment
was constructed in the promoterless pGL3 Basic vector.
Transient luciferase expression experiments indicated the presence of a core
promoter located within 196 bp immediately upstream of the major transcription
initiation site (Fig. 21). The 4.5-fold activation of the promoter fragment in HEK 293
and Lovo cells compared with the control vector-transfected cells is in accord with
many previously published promoter analyses supporting the significance of our
data (Perrais et al., 2002; Nichols et al., 2003; Diaz-Guerra et al., 1997; Bordonaro

Discussion 99
et al., 2002). Besides a TATA box and an incomplete CCAAT box, consensus
motifs for transcription factors located within the promoter region included Elk-1,
RFX-1, SRF, AP-1, CEBP, CHOP, USF, NFκB, and N-myc, many of which are
associated with proliferative response.
Site conservation is a good indicator of its functional importance and
comparative genome sequence analysis (phylogenetic footprinting) can eliminate
up to 90% of false binding-site predictions (Wasserman and Sandelin, 2004).
Therefore, we compared the region immediately upstream of the mouse
orthologue with the 511-bp fragment of the human S100A14 promoter. The
analysis revealed the presence of two fragments immediately upstream from the
transcription start site that were conserved in the mouse and the human gene
(Fig. 22). They encompassed the TATA box and the CAAT sequence. Additionally,
a potential NFκB consensus motif was conserved in the mouse and the human
DNA within the minimal promoter fragment but further upstream of the two highly
conserved promoter fragments. No other sequences matching the further
upstream consensus transcription factor binding sites related to mitogenic
response could be detected.
Thus, the strong conservation between the mouse and the human S100A14
promoter fragment concerns only constitutive promoter elements that probably
contribute to the basal activity of the promoter. It is therefore conceivable that the
respective homologous promoter fragment is present further upstream in the
mouse promoter or that the regulation of the mouse S100a14 is different from the
regulation of the human counterpart.
A potential NFκB transcription factor binding site was conserved in the
mouse and the human promoter fragment. NFκB has been reported to be involved
in TNF-α-induced expression of other S100 genes (Joo et al., 2003). Therefore,
we have analysed the potential role of NFκB in the regulation of the S100A14
transcription. We found that NFκB could not transactivate S100A14 by co-
transfection experiments with the NFκB subunit p65 and the S100A14 luciferase
reporter. Similarly, treatment of cells with TNF-α, which induces degradation of IκB
and translocation of NFκB to the nucleus, did not enhance the S100A14 promoter-
driven reporter gene transcription. Moreover, TNF-α did not induce S100A14

Discussion 100
expression at the mRNA level in Northern blot analysis. Thus, we found no
evidence that NFκB transactivates the S100A14 promoter fragment.
Taken together, our analysis of two cell lines although differing in S100A14
expression yielded the same activation pattern of the analysed promoter fragment.
This means that the transcription regulatory region that we identified is most
probably not the critical determinant of S100A14 expression in tumours. Based on
these findings, we suggest that a further distal promoter or enhancer confers
induction to S100A14 and possibly influences its expression in tumours.
4.4 Oncogenic Signalling Pathways Mediate S100A14 Transcriptional Induction
S100A14 is differentially expressed in many human tumours and its expression is
enhanced in lung and breast tumours (Pietas et al., 2002). No data pertinent to the
molecular mechanisms responsible for the regulation of the S100A14 gene are
available.
Based on our initial finding that serum stimulation enhanced S100A14
expression in H322 cells, we reasoned that this effect could be mediated by
growth factors. In this context, the additional finding of positive correlation with
ERBB2 overexpression in breast tumours raised the possibility that epidermal
growth factor (EGF) might function as a positive regulator of the gene. To
elucidate mechanisms whereby S100A14 expression is enhanced in lung tumours,
we studied the effects of EGF on S100A14 expression in 9442 human
immortalized bronchial epithelial cells as well as the signal transduction pathways
that trigger its expression.
EGF induced a significant increase in S100A14 mRNA expression in a time-
and dose-dependent manner in 9442 cells but not in S100A14-negative cell lines
(Fig. 25 and Fig. 26). This result implies that a low EGF concentration in culture
media cannot account for the absence of S100A14 transcript in the examined
negative cell lines. The EGF effects on S100A14 expression were also detected in
another cell line examined in this study – HMEB, indicating similar transcriptional
regulation in immortalized breast epithelial cells (Fig. 24).
Moreover, treatment of 9442 cells with transforming growth factor-α (TGF-α),
a member of the EGF ligand family that binds to and activates the ERBB receptor,

Discussion 101
also enhanced S100A14 transcript with similar kinetics to EGF, thus confirming the
involvement of ERBB receptor signalling in growth factor-induced S100A14
expression (Fig. 27).
TGF-α is an essential mediator of oncogenesis and malignant progression.
Its overexpression in transgenic mice leads to hyperplasia as well as malignancy
in pancreas and breast tissues (Sandgren et al., 1990). TGF-α also acts as a
strong collaborator in promoting carcinogenesis by other oncogenes (Sandgren et
al., 1993) and chemical carcinogens (Takagi et al., 1993). Among the ERBB family
members, TGF-α binds only to the ERBB1 receptor and is best known as an
autocrine stimulatory growth factor (Riese et al., 1996). Strong expression of
TGF-α has been found in 67% of pulmonary adenocarcinomas (Tateishi et al.,
1991) pointing to an important role in non-small cell lung cancer (Rusch et al.,
1997; Fontanini et al., 1998).
S100A14 was also induced in response to fresh medium or “stimulation
medium” showing, however, an earlier and less potent maximal response relative
to the response induced by EGF (Fig. 28). The less potent response in
comparison to that induced by stimulation with EGF could be due to the lower EGF
concentration present in the medium than the concentration applied in our EGF-
stimulation experiments (50 ng/ml). In addition, other unknown growth factors
could contribute to this more rapid stimulation.
Regulatory promoter regions responsive to EGF or PMA could not be
identified in this study, neither in the 511-bp fragment nor in the minimal S100A14
upstream regulatory fragment. This suggests the existence of other cooperative
elements present at more distant site or in the intervening sequences of the
S100A14 gene.
The analysis of S100A14 expression at the protein level did not reveal any
induction following EGF treatment (Fig. 29). Moreover, treatment with U0126 and
AG1478 inhibitors also had no impact on the S100A14 protein level as determined
by Western blotting of whole cell- and fractionated cell-extracts. These findings
raise the possibility of an additional post-transcriptional regulation of the gene.
Regulatory elements modulating mRNA half-life are often found within
3' untranslated regions (3' UTR) (Chen et al., 1995; Hollams, 2002). They include
AU-rich elements (AREs) that are associated with stabilization-destabilization of

Discussion 102
the mRNA or hairpin (stem-loop) structure. Binding of a trans-acting factor to these
elements influences the turnover of the mRNA or its translational efficiency (Baker
et al., 2000; Ranganathan et al., 2000). AREs are found in the 3' UTR of many
mRNAs that code for proto-oncogenes, nuclear transcription factors, and cytokines
e.g. COX-2, p21Waf1, TNF-α, interferon-β, GM-CSF, c-myc, and c-fos (Dixon et al.,
2000; Giles et al., 2003; Wang et al., 1997; Kruys et al., 1989; Han et al., 1990;
Levine et al., 1993). The 644-bp 3' UTR of S100A14 accounts for over 60% of the
transcript length suggesting that it might be a target of post-transcriptional
regulation.
Although, long tracts of the highly conserved AREs could not be found in the
3’ UTR of S100A14, we cannot exclude that the few poorly conserved AREs found
in the 3’ UTR of S100A14 confer post-transcriptional control to its mRNA.
Moreover, it is possible that sequestration of some factors involved in translation
that are present in limiting amounts may be responsible for the observed inhibition
of translation of the S100A14 mRNA.
The development of efficient and selective inhibitors against protein kinases
involved in signalling has made significant progress. These inhibitors provide a
suitable alternative to transfection experiments using dominant-negative mutants
of protein kinases, in particular for cells which cannot be transfected efficiently in
culture with standard procedures. In the present study, we used several inhibitors
to characterize the signalling events involved in EGF-induced expression of
S100A14 (Fig. 36).
ERBB
SP600125
MKK 4/7
c-JUN
JNK SB203580
MKK 3/6
HSP-27
p38
RAF
ERK1/2
MEK1/2
LY294002 PI3K RAS
AKTU0126
AG1478ERBB
SP600125
MKK 4/7
c-JUN
JNK SB203580
MKK 3/6
HSP-27
p38
RAF
ERK1/2
MEK1/2
LY294002 PI3K RAS
AKTU0126
AG1478
Fig. 36 Pharmacological modulation of the ERBB-induced signalling pathways

Discussion 103
In order to determine the effects of the inhibitors on the signalling cascades we
first carried out an analysis of the kinetics of the mitogen-induced response for the
three MAPK signalling pathways (ERK1/2, p38, JNK) and the PI3K cascade in
9442 cells.
Growth factor stimulation caused a significant increase in phosphorylation
and activation of ERK1/2, p38, and JNK kinases but had no effect on the activation
of AKT, suggestive of a constitutive activation of the PI3K pathway in these cells
(Fig. 30). The EGF-induced S100A14 expression was inhibited by mitogen-
activated protein (MAP) kinase kinase (MEK) inhibitor U0126 but not by p38, JNK,
and PI3K pathway inhibitors (Fig. 32). Inhibition of ERBB receptor tyrosine kinase
activity by AG1478 inhibitor also resulted in a reduction of S100A14 mRNA levels
to those seen in unstimulated cells, thus confirming the results obtained with the
MEK1/2 inhibitor. Taken together, these inhibitor studies demonstrate that the
activation of ERBB tyrosine kinase by its ligands EGF and TGF-α, leads to the
synthesis of S100A14 mRNA via the activation of the RAS-RAF-MEK-ERK
signalling pathway.
The importance of constitutively activated mitogenic signalling pathways in
oncogenesis is well established. Binding of extracellular growth factor ligands
couples the ERBB family of receptor tyrosine kinases to intracellular signalling
pathways regulating diverse biologic responses including proliferation,
differentiation, cell motility, and survival, all of them implicated in tumorigenesis.
The RAS-RAF-MEK-ERK pathway is at the heart of signalling networks that
govern these processes. It may be noted that about 30% of human tumours carry
RAS gene mutations that may prolong the activation of mitogenic signalling
pathways (Khosravi-Far and Der, 1994). Of the three genes in this family
(composed of KRAS, NRAS, and HRAS), KRAS is the most frequently mutated
member in human tumours, including adenocarcinoma of the pancreas (~70-90%
incidence), colon (~50%), and lung (~25-50%) (Pellegata et al., 1994; Bos et al.,
1987; Mills et al., 1995).
Thus, multiple components of mitogenic signal transduction pathways are
either overexpressed (ERBB receptor family and ligands, and cyclin D1) or
mutated (KRAS) in cancer, leading to excessive activation of these important
growth-modulating cascades. We therefore suggest that the involvement of ERBB
Discussion 104
receptor signalling and the RAS-RAF-MEK-ERK pathway in S100A14 transcript
regulation links the gene to oncogenic signalling pathways in cancer. Identification
of target genes of ERBB signalling such as S100A14 may, therefore, prove
important for a clearer understanding of the output of the ERBB module and
consequently contribute to future ERBB-directed approaches that are more
beneficial for cancer treatment.
S100 family members have been specifically related to the ERBB status in
breast tumorigenesis including S100A4 and S100P (Perou et al., 2000; Rudland et
al., 2000; Sorlie et al., 2001; Mackay et al., 2003). S100A4 is a direct target of
ERBB2 signalling in medulloblastoma cells and levels of ERBB2 and S100A4 are
tightly correlated in samples of primary medulloblastoma (Hernan et al., 2003).
The induction involves phosphatidylinositol 3-kinase, AKT and ERK1/2 kinase.
In this context, it should be noted that signalling by ERBB receptors is
accompanied in many cell types by a transient increase in the cytosolic
concentration of Ca2+. This process is mediated by phospholipase Cγ-protein
kinase C (PLCγ-PKC) pathway (Marmor et al., 2004). PLCγ phosphorylation by
ERBB1 and ERBB2 results in its activation. PLCγ hydrolyzes phosphatidylinositol
4,5-biphosphate to generate the second messengers diacylglycerol and inositol
triphosphate. Binding of inositol triphosphate to receptors on the endoplasmic
reticulum results in Ca2+ release, which lead to the activation of calcium/
calmodulin-dependent protein kinases and phosphatases, including Pyk2 and
calcineurin. Furthermore, Ca2+ and diacylglycerol activate protein kinase C (PKC),
resulting in the phosphorylation of a large variety of substrates. PKC also mediates
a feedback attenuation of the signalling by ERBB receptors due to its capacity to
phosphorylate ERBBs and to inhibit the receptor’s tyrosine kinase activity (Welsh
et al., 1991).
ERBB receptors also play an important role in the regulation of cell motility
and cytoskeletal reorganization mainly by the recruitment of Ca2+ and
phosphatidylinositol 4,5-biphosphate (Feldner and Brandt, 2002). Many
experimental data support the notion that PLCγ is the most important molecule in
the ERBB2-mediated migratory/invasive ability of certain tumour cells (Brandt et
al., 1999). Interestingly, ERBB1 homodimers and ERBB1:ERBB2 heterodimers
differentially modulate the time course of PLCγ activation thereby generating

Discussion 105
different patterns of oscillations in Ca2+ level (Dittmar et al., 2002). EGF-induced
breast tumour cell migration was attributed to a transient, rather than sustained,
activation of PLCγ due to ERBB2 signalling.
There are multiple ways how EGF signalling could have an effect on the
expression level of S100A14: 1) direct transcriptional regulation, 2) influence on
the mRNA stability or 3) indirectly through other transcription factors/signalling
pathways. We wished to determine which of these mechanisms is responsible for
EGF-mediated S100A14 transcriptional activation. Although the effect of EGF on
the stability of S100A14 mRNA was not examined in this study, cycloheximide –
an inhibitor of protein synthesis – partially blocked S100A14 induction by EGF,
indicating requirement for de novo protein synthesis (Fig. 33). Therefore, we
suggest that S100A14 is an indirect transcriptional target of EGF signalling.
Treatment with the phorbol ester PMA enhanced S100A14 expression in
9442 cells (Fig. 34A). PMA is a potent tumour promoter as well as a growth
regulator of many different cell types (Hunter and Karin, 1992). It activates protein
kinase C (PKC), a ubiquitous family of serine/threonine kinases. These kinases
play key regulatory roles in a multitude of cellular processes, including
proliferation, apoptosis, differentiation, cell migration, and adhesion (Mellor and
Parker, 1998; Lafon et al., 2000; Zhao et al., 2000). The PKC family consists of at
least 11 isoforms. Specific isoforms are activated, depending on isoform, by Ca2+,
phospholipids or diacylglycerol generated by phospholipase Cγ (PLCγ) or
phospholipase D (PLD) from phosphatidylinositol 4,5-biphosphate.
We used bisindolylomaleimide I which acts as a competitive inhibitor for the
ATP-binding site of PKC to inhibit PKC in 9442 cells. Bisindolylmaleimide I shows
high selectivity for PKC-α, -β1, -β2, -γ, -δ, and -ε isozymes with a ranked order of
potency α>β1>ε>δ (Martiny-Baron et al., 1993). Pretreatment with the inhibitor did
not significantly affect PMA-induced S100A14 expression in 9442 cells (Fig. 34B).
The reason for this is unclear considering that the concentration of the inhibitor we
applied was shown by others to block completely the activity of PKCs in bronchial
epithelial cells (Reibman et al., 2000; Graness et al., 2002). Furthermore, the
range of phorbol ester-sensitive isoforms of PKC (PKC-α, -β1, -β2, -γ, -δ, -ε, -η, -θ)
virtually matches that of isoforms inhibited by bisindolylmaleimide I. Nevertheless,
Discussion 106
we cannot exclude that the PKC isotypes that are not inhibited or only weakly
inhibited by the inhibitor are responsible for S100A14 induction.
We next examined whether EGF-induced stimulation of S100A14 was
mediated by PKC. Preincubation of cells with bisindolylomaleimide I does not
prevent the EGF-induced stimulation of S100A14 indicating that this induction is
not mediated by PKC, in agreement with the finding that EGF activates the
ERK1/2 cascade in a PKC-independent manner, via the RAS-dependent pathway
(Boulikas, 1995), see Fig. 34D.
Previous studies have demonstrated that acute treatment with phorbol esters
leads to a rapid activation of ERK MAPK in most cell types (Rossomando et al.,
1989). Since PKC is the major target for these tumour promoters, it has been
implicated in the activation of the ERK MAPK pathway and the consequent
triggering of cellular responses such as differentiation and proliferation (Mischak et
al., 1993; Murray et al., 1993). Accordingly, it has been demonstrated that
members of all three groups of PKC isoforms (conventional, novel, and atypical)
are able to activate upstream elements of the ERK MAPK pathway, including RAS
and RAF-1, and the mechanism of activation shows some isotype specificity
(Schönwasser et al., 1998; Marais et al., 1998).
We found that PMA indeed induces activation of the ERK1/2 signalling
pathway in 9442 cells (Fig. 34C). Moreover, MEK1/2 inhibitor – U0126 inhibited
PMA-induced S100A14 expression indicating that the ERK1/2 MAPK pathway is
the signalling pathway that targets S100A14 expression in response to PMA
(Fig. 34B).
Protein kinase C overexpression is associated with increased tumorigenicity
and metastatic potential in several experimental models, and its activity is
increased in tumours of breast and lung as compared with their normal counter-
parts (Blobe et al., 1994; O’Brian et al., 1989; Clegg et al., 1999). The essential
role of PKC in processes relevant to neoplastic transformation and tumour
invasion renders it a potentially suitable target for anticancer therapy (Basu, 1993).
PKC-α, an important tumour-promoting factor is currently being studied as a target
in treating patients with cancer.
In summary, our results demonstrate that PMA exerts stimulation of S100A14
via PKC activation in 9442 cells. We also show that the PMA-induced S100A14
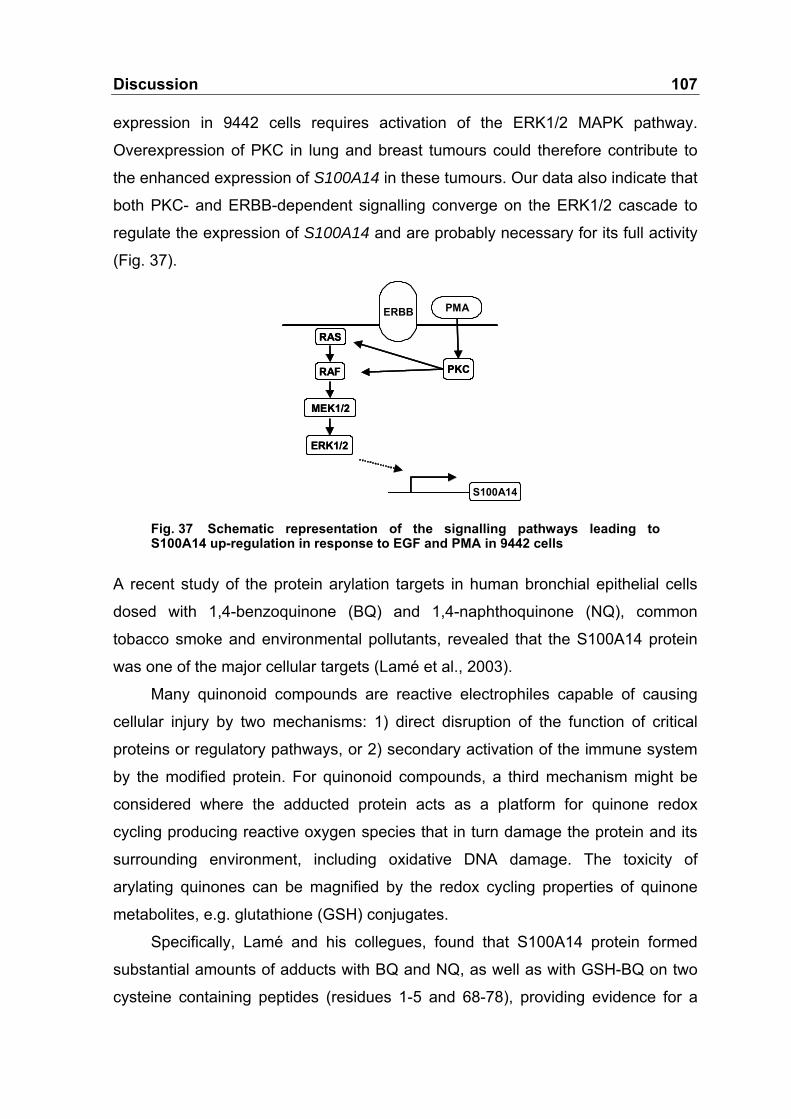
Discussion 107
expression in 9442 cells requires activation of the ERK1/2 MAPK pathway.
Overexpression of PKC in lung and breast tumours could therefore contribute to
the enhanced expression of S100A14 in these tumours. Our data also indicate that
both PKC- and ERBB-dependent signalling converge on the ERK1/2 cascade to
regulate the expression of S100A14 and are probably necessary for its full activity
(Fig. 37).
PKCRAF
ERK1/2
MEK1/2
RAS
S100A14
PMAERBB
PKCRAF
ERK1/2
MEK1/2
RAS
S100A14
PMAERBB
Fig. 37 Schematic representation of the signalling pathways leading to S100A14 up-regulation in response to EGF and PMA in 9442 cells
A recent study of the protein arylation targets in human bronchial epithelial cells
dosed with 1,4-benzoquinone (BQ) and 1,4-naphthoquinone (NQ), common
tobacco smoke and environmental pollutants, revealed that the S100A14 protein
was one of the major cellular targets (Lamé et al., 2003).
Many quinonoid compounds are reactive electrophiles capable of causing
cellular injury by two mechanisms: 1) direct disruption of the function of critical
proteins or regulatory pathways, or 2) secondary activation of the immune system
by the modified protein. For quinonoid compounds, a third mechanism might be
considered where the adducted protein acts as a platform for quinone redox
cycling producing reactive oxygen species that in turn damage the protein and its
surrounding environment, including oxidative DNA damage. The toxicity of
arylating quinones can be magnified by the redox cycling properties of quinone
metabolites, e.g. glutathione (GSH) conjugates.
Specifically, Lamé and his collegues, found that S100A14 protein formed
substantial amounts of adducts with BQ and NQ, as well as with GSH-BQ on two
cysteine containing peptides (residues 1-5 and 68-78), providing evidence for a
Discussion 108
cycle of oxidation of the resulting BQ-GSH conjugate metabolite followed by
attachment to the protein. Formation of such protein adducts is expected to
increase the residence time of redox cycling substances and therefore induce
single and double strand breaks in DNA.
The finding of the modification of S100A14 protein by quinones is the first
report, to our knowledge, implicating one of the putative functions of this protein.
Future research aimed at identifying target proteins of S100A14 needs to be done
to determine further functions of this novel gene and elucidate its role in neoplastic
transformation.
In summary, by analysing a human lung tumour cell line subtraction cDNA library,
we have identified and characterized a novel member of the human S100 gene
family that we designated S100A14. It encodes an mRNA that is ubiquitously
expressed in normal human tissues of epithelial origin. We demonstrated that
S100A14 transcript is down-regulated in many immortalized and tumour cell lines
from different tissues. In contrast, studies on human primary tumours, including
lung and breast, revealed predominantly up-regulation of the gene at the mRNA
and protein level.
We mapped the S100A14 gene to a region of chromosomal instability on
human chromosome 1q21 and subsequently resolved the gene structure of
S100A14 in human by demonstrating its organization of four exons and three
introns spanning a total of 2165 bp of genomic sequence. By analysing the
5’ upstream proximal region of the S100A14 gene, we identified and characterized
the minimal promoter fragment of the gene.
Studies on regulation of S100A14 in 9442 immortalized bronchial epithelial
cells identified it as a growth factor-inducible gene that is induced by epidermal
growth factor (EGF) and transforming growth factor-α (TGF-α). EGF-mediated
transcriptional induction of S100A14 depends on extracellular signal-regulated
kinase (ERK1/2) signalling and requires de novo protein synthesis. In support of
these findings, we demonstrated co-existence of ERBB2 overexpression and
S100A14 protein accumulation in primary breast tumours.
Discussion 109
Further studies identified phorbol ester 12-myristate 13-acetate (PMA) as an
activator of S100A14 in 9442 cells suggesting regulation by protein kinase C
(PKC). The PMA-induced S100A14 expression is mediated by activation of the
ERK1/2 signalling cascade indicating that both PKC- and ERBB-dependent
signalling converge on the ERK1/2 cascade to regulate the expression of
S100A14. Considering the frequent incidence of aberrant activation of the ERK1/2
and PKC signalling pathways in tumours as well as their oncogenic potential we
suggest that it is the impaired regulation of these signalling cascades that couples
S100A14 to malignant transformation.
The challenge of future investigations will be to define the binding partners of
S100A14 to determine the function of this novel gene in cancer, and to further
elucidate the functional importance of ERBB- and PKC-dependent signalling for
the S100A14 gene regulation.

110
5 References
Ambartsumian N.S., Grigorian M.S., Larsen I.F., Karlstrom O., Sidenius N.,
Rygaard J., Georgiev G., Lukanidin E. Metastasis of mammary carcinomas in
GRS/A hybrid mice transgenic for the mts1 gene. Oncogene. 1996. 13, 1621-
1630
Arai K., Teratani T., Nozawa R., Yamada T. Immunohistochemical investigation of
S100A9 expression in pulmonary adenocarcinomas: S100A9 expression is
associated with tumour differentiation. Oncol Rep. 2001. 8, 591-596
Arumugam T., Simeone D.M., Schmidt A.M., Logsdon C.D. S100P stimulates cell
proliferation and survival via receptor for activated glycation end products
(RAGE). J Biol Chem. 2004. 7, 5059-5065
Averboukh L., Liang P., Kantoff P.W., Pardee A.B. Regulation of S100P
expression by androgen. Prostate. 1996. 29, 350-355
Baker D.M., Wang S.L., Bell D.J., Drevon C.A., and Davis R.A. One or more labile
proteins regulate the stability of chimeric mRNAs containing the 3'-
untranslated region of cholesterol-7α-hydroxylase mRNA. J Biol Chem. 2000.
275, 19985-19991
Beer D.G., Kardia S.L., Huang C.C., Giordano T.J., Levin A.M., Misek D.E., Chen
G., Gharib T.G., Thomas D.G., Lizyness M.L., Kuick R., Hayasaka S., Taylor
J.M., Iannettoni M.D., Orringer M.B., Hanash S. Gene-expression profiles
predict survival of patients with lung adenocarcinoma. Nat Med. 2002. 8, 816-
824
Bernards R., Weinberg R.A. A progression puzzle. Nature. 2002. 418, 823
Berridge M.J., Lipp P., Bootman M.D. The versatility and universality of calcium
signalling. Nat Rev Mol Cell Biol. 2000. 1, 11-21
Bertram J., Palfner K., Hiddemann W., Kneba M. Elevated expression of S100P,
CAPL and MAGE 3 in doxorubicin-resistant cell lines: comparison of mRNA
differential display reverse transcription-polymerase chain reaction and

References 111
subtractive suppressive hybridization for the analysis of differential gene
expression. Anticancer Drugs. 1998. 9, 311-317
Blobe G.C., Obeid L.M., Hannun Y.A. Regulation of protein kinase C and role in
cancer biology. Cancer Met Rev. 1994. 13, 411-431
Bordonaro M., Lazarova D.L., Augenlicht L.H., Sartorelli A.C. Cell type- and
promoter-dependent modulation of the Wnt signaling pathway by sodium
butyrate. Int J Cancer. 2002. 97, 42-51
Bos J.L., Fearon E.R., Hamilton S.R., Verlaan-de Vries M., van Boom J.H., van
der Eb A.J., Vogelstein B. Prevalence of ras gene mutations in human
colorectal cancers. Nature. 1987. 327, 293-297
Boulikas T. The phosphorylation connection to cancer. Int J Oncol. 1995. 6, 271-
279
Böttiger B.W., Möbes S., GlätzerR., Bauer H., Gries A., Bärtsch P., Motsch J.,
Martin E. Astroglial protein S100 is an early and sensitive marker of hypoxic
brain damage and outcome after cardiac arrest in humans. Circulation. 2001.
103, 2694-2698
Brandt B.H., Roetger A., Dittmar T., Nikolai G., Merschjann A., Nofer J.R.,
Dehmer-Moller G., Junker R., Assmann G., Zaenker K.S. erbB-2/EGF-R as
dominant heterodimerization partners determine the motogenic phenotype in
human breast cancer cells. FASEB J. 1999. 13, 1939-1949
Bucher P. Weight matrix descriptions of four eukaryotic RNA polymerase II
promotor elements derived from 502 unrelated promotor sequences. J Mol
Biol. 1990. 212, 563-578
Burden S., Yarden Y. Neuregulins and their receptors: A versatile signalling
module in organogenesis and oncogenesis. Neuron. 1997. 18, 847-855
Camby I., Nagy N., Lopes M.B., Schäfer B.W., Maurage C.A., Ruchoux M.M.,
Murmann P., Pochet R., Heizmann C.W., Brotchi J., Salmon I., Kiss R.,
Decaestecker Ch. Supratentorial pilocytic astrocytomas, astrocytomas,
anaplastic astrocytomas and glioblastomas are characterized by a differential
expression of S100 proteins. Brain Pathol. 1999. 9, 1-19

References 112
Camby I., LeFranc F., Titeca G., Neuci S., Fastrez M., Dedecken L., Schäfer B.W.,
Brotchi J., Heizmann C.W., Pochet R., Salmon I., Kiss R., Decaestecker Ch.
Differential expression of S100 calcium-binding proteins characterizes
distinct clinical entities in both WHO grade II and III astrocytic tumors.
Neuropathol Applied Neurobiol. 2000. 26, 76-90
Carmeliet P., Jain R.K. Angiogenesis in cancer and other diseases. Nature. 2000.
407, 249-257
Chang C., Werb Z. The many faces of metalloproteases: cell growth, invasion,
angiogenesis and metastasis. Trends Cell Biol. 2001. 11, S37-S43
Chen C.Y., Shyu A.B. AU-rich elements: characterization and importance in
mRNA degradation. Trends Biochem Sci. 1995. 20, 465-470
Clegg R.A., Gordge P.C., Miller W.R. Expression of enzymes of covalent protein
modification during regulated and dysregulated proliferation of mammary
epithelial cells: PKA, PKC and NMT. Advan Enzyme Regul. 1999. 39, 175-
203
Coussens L.M., Raymond W.W., Bergers G., Laig-Webster M., Behrendtsen O.,
Werb Z., Caughey G.H., Hanahan D. Inflammatory mast cells up-regulate
angiogenesis during squamous epithelial carcinogenesis. Genes Dev. 1999.
13, 1382-1397
Coussens L.M., Tinkle C.L., Hanahan D., Werb Z. MMP-9 supplied by bone
marrow-derived cells contributes to skin carcinogenesis. Cell. 2000. 103,
481-490
Creighton C., Kuick R., Misek D.E., Rickman D.S., Brichory F.M., Rouillard J.-M.,
Omenn G.S., Hanash S. Profiling of pathway-specific changes in gene
expression following growth of human cancer cell lines transplanted into
mice. Genome Biology. 2003. 4, R46
Davey G.E., Murmann P., Heizmann C.W. Intracellular Ca2+ and Zn2+ levels
regulate the alternative cell density-dependent secretion of S100B in human
glioblastoma cells. J Biol Chem. 2001. 276, 30819-30826
References 113
Davies M.P., Rudland P.S., Robertson L., Parry E.W., Jolicoeur P., Barraclough R.
Expression of the calcium-binding protein S100A4 (p9Ka) in MMTV-neu
transgenic mice induces metastasis of mammary tumours. Oncogene. 1996.
13, 1631-1637
Deininger P.L., Batzer M.A. Alu repeats and human disease. Mol Genet Metabol.
1999. 67, 183-193
Diatchenko L., Lau Y.F., Campbell A.P., Chenchik A., Moqadam F., Huang B.,
Lukyanov S., Lukyanov K., Gurskaya N., Sverdlov E.D., Siebert P.D.
Suppression subtractive hybridization: a method for generating differentially
regulated or tissue-specific cDNA probes and libraries. Proc Natl Acad Sci
USA. 1996. 93, 6025-6030
Diaz-Guerra M.J.M., Velasco M., Martin-Sanz P., Bosca L. Nuclear factor κB is
required for the transcriptional control of type II NO synthase in regenerating
liver. Biochem J. 1997. 326, 791-797
Difilippantonio S., Chen Y., Pietas A., Schlüns K., Pacyna-Gengelbach M.,
Deutschmann N., Padilla-Nash H.M., Ried T., Petersen I. Gene expression
profiles in human non-small and small-cell lung cancer. Eur J Cancer. 2003.
39, 1936-1947
Dittmar T., Husemann A., Schewe Y., Nofer J.-R., Niggemann B., Zänker K.S.,
Brandt B.H. Induction of cancer cell migration by epidermal growth factor is
initiated by specific phosphorylation of tyrosine 1248 of c-erbB-2 receptor via
EGFR. FASEB J. 2002. 16, 1823-1825
Dixon D.A., Caplan C.D., McIntyre T.M., Zimmerman G.A., Prescott S.M. Post-
transcriptional control of cyclooxygenase-2 gene expression. J Biol Chem.
2000. 16, 11750-11757
Donato R. S100: a multigenic family of calcium-modulated proteins of the EF-hand
type with intracellular and extracellular functional roles. J. Biochem. Cell Biol.
2001. 33, 637-668

References 114
Du X.-J., Cole T.J., Tenis N., Gao X.-M., Köntgen F., Kemp B.E., Heierhorst J.
Impaired cardiac contractility response to hemodynamic stress in S100A1-
deficient mice. Mol Cell Biol. 2002. 22, 2821-2829
El-Rifai W., Moskaluk C.A., Abdrabbo M.K., Harper J., Yoshida C., Frierson H.F.
Jr., Powell S.M. Gastric cancers overexpress S100A calcium-binding
proteins. Cancer Res. 2002. 62, 6823-6826
Emberley E.D., Niu Y., Njue C., Kliewer E.V., Murphy L.C., Watson P.H. Psoriasin
(S100A7) expression is associated with poor outcome in estrogen receptor-
negative invasive breast cancer. Clin Cancer Res. 2003. 9, 2627-2631
Feldner J.C., Brandt B.H. Cancer cell motility – on the road from c-erbB-2 receptor
steered signalling to actin reorganization. Exp Cell Res. 2002. 272, 93-108
Feng G., Xu X., Youssef E.M., Lotan R. Diminished expression of S100A2, a
putative tumor suppressor, at early stage of human lung carcinogenesis.
Cancer Res. 2001. 61, 7999-8004
Fontanini G., De Laurentiis M., Vignati S., Chine S., Lucchi M., Silvestri V., Mussi
A., De Placido S., Tortora G., Bianco A.R., Gullick W., Angeletti C.A.,
Bevilacqua G., Ciardiello F. Evaluation of epidermal growth factor-related
growth factors and receptors and of neoangiogenesis in completely resected
stage I-III non-small cell lung cancer: amphiregulin and microvessel count are
independent prognostic indicators of survival. Clin Cancer Res. 1998. 4, 241-
249
Gebhardt C., Breitenbach U., Tuckermann J.P., Dittrich B.T., Richter K., Angel P.
Calgranulins S100A8 and S100A9 are negatively regulated by
glucocorticoids in a c-Fos-dependent manner and overexpressed throughout
skin carcinogenesis. Oncogene. 2002. 21, 4266-4276
Gendler S.J., Cohen E.P., Craston A., Duhig T., Johnstone G., Barnes D. The
locus of the polymorphic epithelial mucin (PEM) tumor antigen on
chromosome 1q21 shows a high frequency of alteration in primary human
breast tumors. Int J Cancer. 1990. 45, 431-435
References 115
Gerlai R., Roder J. Abnormal exploratory behaviour in transgenic mice carrying
multiple copies of the human gene for S100 beta. J Psychiatry & Neurosci.
1995. 20, 105-112
Giles K.M., Daly J.M., Beveridge D.J., Thomson A.M., Voon D.C., Furneaux H.M.,
Jazayeri J.A., Leedman P.J. The 3'-untranslated region of p21WAF1 mRNA is
a composite cis-acting sequence bound by RNA-binding proteins from breast
cancer cells, including HuR and poly(C)-binding protein. J Biol Chem. 2003.
5, 2937-2946
Godsen J.R. Molecular Analysis of Chromosome Aberrations. Methods in
Molecular Biology. 29. Humana Press Inc. Totowa, NJ. 1994
Graness A., Chwieralski C.E., Reinhold D., Thim L., Hoffmann W. Protein kinase C
and ERK activation are required for TFF-peptide stimulated bronchial
epithelial cell migration and tumor necrosis factor-α-induced interleukin-6 (IL-
6) and IL-8 secretion. J Biol Chem. 2002. 277, 18440-18446
Guerreiro Da Silva I.D., Hu Y.F., Russo I.H., Ao I.H., Salicioni X., Yang A.M.,
Russo J. S100P calcium-binding protein overexpression is associated with
immortalization of human breast epithelial cells in vitro and early stages of
breast cancer development in vivo. Int J Oncol. 2000. 16, 231-240
Han J., Brown T., Beutler B. Endotoxin-responsive sequences control
cachectin/tumor necrosis factor biosynthesis at the translational level. J Exp
Med. 1990. 171, 465-475
Hanahan D., Weinberg R.A. The hallmarks of cancer. Cell. 2000. 100, 57-70
Hancq S., Salmon I., Brotchi J., De Witte O., Gabius H.J., Heizmann C.W., Kiss
R., Decaestecker C. S100A5: a marker of recurrence in WHO grade I
meningiomas. Neuropathol Appl Neurobiol. 2004. 30, 178-187
Heighway J., Knapp T., Boyce L., Brennand S., Field J.K., Betticher D.C.,
Ratschiller D., Gugger M., Donovan M., Lasek A., Rickert P. Expression
profiling of primary non-small cell lung cancer for target identification.
Oncogene. 2002. 21, 7749-7763

References 116
Heizmann C.W., Fritz G., Schäfer B.W. S100 proteins: structure, functions and
pathology. Frontiers Biosci. 2002. 7, 1356-1368
Hernan R., Fasheh R., Calabrese Ch., Frank A.J., Maclean K.H., Allard D.,
Barraclough R., Gilbertson R.J. ERBB2 up-regulates S100A4 and several
other prometastatic genes in medulloblastoma. Cancer Res. 2003. 63, 140-
148
Hofmann M., Drury S., Caifeng F., Qu W., Lu Y., Avila C., Kambhan N., Slattery
T., McClary J., Nagashima M., Morser J., Stern D., Schmidt A.-M. RAGE
mediates a novel proinflammatory axis: the cell surface receptor for
S100/calgranulin polypeptides. Cell. 1999. 97, 889-901
Hollams E.H., Giles K.M., Thomson A.M., Leedman P.J. mRNA stability and the
control of gene expression: implications for human disease. Neurochem Res.
2002. 27, 957-980
Hough C.D, Cho K.R., Zonderman A.B., Schwartz D.R., Morin P.J. Coordinately
up-regulated genes in ovarian cancer. Cancer Res. 2001. 61, 3869-3876
Hoyaux D., Alao J., Fuchs J., Kiss R., Keller B., Heizmann C.W., Pochet R.,
Frermann D. S100A6, a calcium- and zinc-binding protein, is overexpressed
in SOD1 mutant mice, a model for amyotrophic lateral sclerosis. Biochim
Biophys Acta. 2000. 1498, 264-272
Hsieh H.-L., Schäfer B.W., Cox J.A., Heizmann C.W. S100A13 and S100A6 exibit
distinct translocation pathways in endothelial cells. J Cell Sci. 2002. 115,
3149-3158
Hsieh H.-L., Schäfer B.W., Weigle B., Heizmann C.W. S100 protein translocation
in response to extracellular S100 is mediated by receptor for advanced
glycation endproducts in human endothelial cells. Bioch Bioph Res Com.
2004. 316, 949-959
Hunter T., Karin M. The regulation of transcription by phosphorylation.
Cell. 1992. 70, 375-87
Huttunen H.J., Kuja-Panulat J., Sorci G., Agneletti A.L., Donato R., Rauvala H.
Coregulation of neurite outgrowth and cell survival by amphoterin and S100

References 117
proteins through receptor for advanced glycation end products (RAGE)
activation. J Biol Chem. 2000. 275, 40096-40105
Joo J.H., Kim J.W., Lee Y., Yoon S.Y., Kim J.H., Paik S.-G., Choe I.S. Involvement
of NFκB in the regulation of S100A6 gene expression in human
hepatobalstoma cell line HepG2. Biochem Biophys Res Commun. 2003. 307,
274-280
Kawasaki H., Nakayama S., Kretsinger R.H. Classification and evolution of EF-
hand proteins. BioMetals. 1998. 11, 277-295
Khosravi-Far R., Der C.J. The Ras signal transduction pathway. Cancer Met Rev.
1994. 13, 67-89
Kiewitz R., Acklin C., Minder E., Huber P.R., Schäfer B.W., Heizmann C.W.
S100A1, a new marker for acute myocardial ischemia. Biochem Biophys Res
Commun. 2000. 274, 865-871
Kinzler K.W., Vogelstein B. Lessons from hereditary colorectal cancer. Cell. 1996.
87, 159-170
Kozak M. Interpreting cDNA sequences: some insights from studies on translation.
Mamm. Genome. 1996. 7(8), 563-574
Krähn G., Kaskel P., Sander S., Pereira J., Waizenhöfer Y., Wortmann S., Leiter
U., Peter R.U. S100β is a more reliable tumor marker in peripheral blood for
patients with newly occurred melanoma metastases compared with MIA,
albumin and lactate-dehydrogenase. Anticancer Res. 2001. 21, 1311-1316
Kriajevska M., Fischer-Larsen M., Moertz E., Vorm O., Tulchinsky E., Grigorian M.,
Ambartsumian N., Lukanidin E. Liprin β1, a member of the family of LAR
transmembrane tyrosine phosphatase-interacting proteins, is a new target for
the metastasis-associated protein S100A4 (Mts1). J Biol Chem. 2002. 277,
5229-5235
Kruys V., Marinx O., Shaw G., Deschamps J., Huez G. Translational blockade
imposed by cytokine-derived UA-rich sequences. Science. 1989. 245, 852-
855

References 118
Lafon C., Mazars P., Guerrin M., Barboule N., Charcosset J.Y., Valette A. Early
gene responses associated with transforming growth factor-beta 1 growth
inhibition and autoinduction in MCF-7 breast adenocarcinoma cells. Bioch
Biophys Acta. 1995. 1266, 288-295
Lauriola L., Michetti F., Maggiano N., Galli J., Cadoni G., Schäfer B.W., Heizmann
C.W., Ranelletti F.O. Prognostic significance of the Ca2+ binding protein
S100A2 in laryngeal squamous-cell carcinoma. Int J Cancer. 2000. 89, 345-
349
Lee S.W., Tomasetto C., Swisshelm K., Keyomarsi K., Sager R. Down-regulation
of a member of the S100 gene family in mammary carcinoma cells and re-
expression by azadeoxycytidine treatment. Proc Natl Acad Sci USA. 1992.
89, 2504-2508
Levine T.D., Gao F., King P.H., Andrews L.G., Keene J.D. Hel-N1: an autoimmune
RNA-binding protein with specificity for 3' uridylate-rich untranslated regions
of growth factor mRNAs. Mol Cell Biol. 1993. 13, 3494-3504
Liu D., Rudland P.S., Sibson D.R., Platt-Higgins A., Barraclough R. Expression of
calcium-binding protein S100A2 in breast lesions. Br J Cancer. 2000. 83,
1473-1479
Logsdon C.D., Simeone D.M., Binkley C., Arumugam T., Greenson J.K., Giordano
T.J., Misek D.E., Hanash S. Molecular profiling of pancreatic
adenocarcinoma and chronical pancreatitis identifies multiple genes
differentially regulated in pancreatic cancer. Cancer Res. 2003. 63, 2649-
2657
Maass N., Hojo T., Ueding M., Luttges J., Kloppel G., Jonat W., Nagasaki K.
Expression of the tumor suppressor gene Maspin in human pancreatic
cancers. Clin. Cancer Res. 2001. 7, 812-817
Mackay A., Jones Ch., Dexter T., Silva R.L.A., Bulmer K., Jones A., Simpson P.,
Harris R.A., Parmjit S.J., Neville A.M., Reis L.F.L., Lakhani S.R., O’Hare M.J.
cDNA microarray analysis of genes associated with ERBB2 (HER2/neu)

References 119
overexpression in human mammary luminal epithelial cells. Oncogene. 2003.
22, 2680-2688
Mandinova A., Soldi R., Graziani I., Bagala C., Bellum S., Landriscina M., Tarantini
F., Prudovsky I., Maciag T. S100A13 mediates the copper-dependent stress-
induced release of IL-1α from both human U937 and murine NIH 3T3 cells. J
Cell Sci. 2003. 116, 2687-2696
Marais R., Light Y., Mason C., Paterson H., Olson M.F., Marshall C.J.
Requirement of Ras-GTP-Raf complexes for activation of Raf-1 by protein
kinase C. Science. 1998. 280, 109-112
Marenholz I., Volz A., Ziegler A., Davies A., Ragoussis I., Korge B.P., Mischke D.
Genetic analysis of the epidermal differentiation complex (EDC) on human
chromosome 1q21: chromosomal orientation, new markers, and a 6-Mb YAC
contig. Genomics. 1996. 37, 295-302
Marenholz I., Zirra M., Fischer D.F., Backendorf C., Ziegler A., Mischke D.
Identification of human epidermal differentiation complex (EDC)-encoded
genes by subtractive hybridization of entire YACs to a gridded keratinocyte
cDNA library. Genome Res. 2001. 11, 341-355
Marenholz I., Heizmann C.W. S100A16, a ubiquitously expressed EF-hand protein
which is up-regulated in tumors. Biochem Biophys Res Commun. 2004. 313,
237-244
Marmor M.D., Kochupurakkal B.S., Yarden Y. Signal transduction and
oncogenesis by ERBB/HER receptors. Int J Rad Oncol Biol Phys. 2004. 58,
903-913
Martiny-Baron G., Kazanietz M.G., Mischak H., Blumberg P.M., Kochs G., Hug H.,
Marme D., Schachtele C. Selective inhibition of protein kinase C isozymes by
the indolocarbazole Go 6976. J Biol Chem. 1993. 268, 9194-9197
Mellor H., Parker P.J. The extended protein kinase C superfamily. Biochem J.
1998. 332, 281-292
Miles D.W., Harris W.H., Gillett C.E., Smith P., Barnes D.M. Effect of c-erbB(2)
and estrogen receptor status on survival of women with primary breast

References 120
cancer treated with adjuvant cyclophosphamide/methotrexate/fluorouracil.
Int. J. Cancer. 1999. 84, 354-359
Mills N.E., Fishman C.L., Rom W.N., Dubin N., Jacobson D.R. Increased
prevalence of K-ras oncogene mutations in lung adenocarcinoma. Cancer
Res. 1995. 55, 1444-1447
Millward T.A., Heizmann C.W., Schafer B.W., Hemmings B.A. Calcium regulation
of Ndr protein kinase mediated by S100 calcium-binding proteins. EMBO J.
1998. 17, 5913-5922
Mischak H., Pierce J.H., Goodnight J., Kazanietz M.G., Blumberg P.M., Mushinski
J.F. Phorbol ester-induced myeloid differentiation is mediated by protein
kinase C-α and -δ. J Biol Chem. 1993. 268, 20110-20115
Murray N.R., Baumgardner G.P., Burns D.J., Fields A.P. Protein kinase C isotypes
in human erythroleukemia (K562) cell proliferation and differentiation.
Evidence that beta II protein kinase C is required for proliferation. J Biol
Chem. 1993. 268, 15847-15853
Nichols A.F., Toshiki I., Zolezzi F., Hutsell S., Linn S. Basal transcriptional
regulation of human damage-specific DNA-binding protein genes DDB1 and
DDB2 by Sp1, E2F, N-myc and NF1 elements. Nucleic Acids Res. 2003. 31,
562-569
Ninomiya I., Ohta T., Fushida S., Endo Y., Hashimoto T., Yagi M., Fujimura T.,
Nishi-mura G., Tani T., Shimizu K., Yonemura Y., Heizmann C.W., Schäfer
B.W., Sasaki T., Miwa K. Increased expression of S100A4 and its prognostic
significance in esophageal squamous cell carcinoma. Int J Cancer. 2001. 18,
715-720
Nishikawa T., Lee I.S., Shiraishi N., Ishikawa T., Ohta Y., Nishikimi M.
Identification of S100b protein as copper-binding protein and its suppression
of copper-induced cell damage. J Biol Chem. 1997. 272, 23037-23041
Nowell P.C. The clonal evolution of tumor cell populations. Science. 1976. 194,
23-28

References 121
O’Brian C.A., Vogel V.G., Singletary S.E., Ward N.E. Elevated protein kinase C
expression in human breast tumor biopsies relative to normal breast tissue.
Cancer Res. 1989. 49, 3215-3217
Olayioye M.A., Neve R.M., Lane H.A., Hynes N.E. The ERBB signalling network:
receptor heterodimerization in development and cancer. EMBO J. 2000. 19,
3159-3167
Olumi A.F., Grossfeld G.D., Hayward S.W., Carroll P.R., Tlsty T.D., Cunha G.R.
Carcinoma-associated fibroblasts direct tumor progression of initiated human
prostatic epithelium. Cancer Res. 1999. 59, 5002-5011
Ostergaard M., Wolf H., Orntoft T.F., Celis J.E. Psoriasin (S100A7): a putative
urinary marker for the follow-up of patients with bladder squamous cell
carcinomas. Electrophoresis. 1999. 20, 349-354
Passey R.J., Williams E., Lichanska A.M., Wells C., Hu S., Geczy C.L., Little M.H.,
Hume D.A. A null mutation in the inflammation-associated S100 protein
S100A8 causes early resorption of the mouse embryo. J Immunol. 1999.
163, 2209-2216
Pellegata N.S., Sessa F., Renault B., Bonato M., Leone B.E., Solcia E., Ranzani
G.N. K-ras and p53 gene mutations in pancreatic cancer: ductal and
nonductal tumors progress through different genetic lesions. Cancer Res.
1994. 54, 1556-1560
Perou C.M., Sorlie T., Eisen M.B., van de Rijn M., Jeffrey S.S., Rees C.A., Pollack
J.R., Ross D.T., Johnsen H., Akslen L.A., Fluge O., Pergamenschikov A.,
Williams C., Zhu S.X., Lonning P.E., Borresen-Dale A.L., Brown P.O.,
Botstein D. Molecular portraits of human breast tumours. Nature. 2000. 406,
747-752
Perrais M., Pigny P., Copin M.-Ch., Aubert J.-P., Van Seuningen I. Induction of
MUC2 and MUC5AC mucins by factors of the epidermal growth factor (EGF)
family is mediated by EGF receptor/Ras/Raf/extracellular signal-regulated
kinase cascade and Sp1. J Biol Chem. 2002. 277, 32258-32267

References 122
Pietas A., Schluns K., Marenholz I., Schafer B.W., Heizmann C.W., Petersen I.
Molecular cloning and characterization of the human S100A14 gene
encoding a novel member of the S100 family. Genomics. 2002. 79, 513-522
Platt-Higgins A.M., Renshaw Ch.A., West Ch. R., Winstanley J.H.R., De Silva
Rudland S., Barraclough R., Rudland Ph.S. Comparison of the metastasis-
inducing protein S100A4 (p9Ka) with other prognostic markers in human
breast cancer. Int J Cancer. 2000. 89, 198-208
Prenzel N., Fischer O.M., Streit S., Hart S., Ullrich A. The epidermal growth factor
receptor family as a central element for cellular signal transduction and
diversification. Endocrine Cancer. 2001. 8, 11-31
Ranganathan G., Li C., Kern P.A. The translational regulation of lipoprotein lipase
in diabetic rats involves the 3'-untranslated region of the lipoprotein lipase
mRNA. J Biol Chem. 2000. 275, 40986-40991
Reibman J., Talbot A.T., Hsu Y., Ou G., Jover J., Nilsen D., Pillinger M.H.
Regulation of expression of granulocyte-macrophage colony-stimulating
factor in human bronchial epithelial cells: roles of protein kinase C and
mitogen-activated protein kinases. J Immun. 2000. 165, 1618-1625
Riese D.J., Kim E.D., Elenius K., Buckley S., Klagbrun M., Plowman G.D., Stern
D.F. The epidermal growth factor receptor couples transforming growth
factor-α, heparin-binding epidermal growth factoe-like factor, and
amphiregulin to Neu, ERBB-3, and ERBB-4. J Biol Chem. 1996. 271, 20047-
20052
Renan M.J. How many mutations are required for tumorigenesis? Implications
from human cancer data. Mol. Carcinogenesis. 1993. 7, 139-146
Rossomando A.J., Payne D.M., Weber M.J., Sturgill T.W. Evidence that pp42, a
major tyrosine kinase target protein, is a mitogen-activated serine/threonine
protein kinase. Proc Natl Acad Sci USA. 1989. 86, 6940-6943
Rudland P.S., Platt-Higgins A., Renshaw C., West C.R., Winstanley J.H.,
Robertson L., Barraclough R. Prognostic significance of the metastasis-

References 123
inducing protein S100A4 (p9Ka) in human breast cancer. Cancer Res. 2000.
60, 1596-1603
Rüdiger N.S., Gregersen N., Kielland-Brandt M. C. One short well conserved
region of Alu-sequences is involved in human gene rearrangements and has
homology with prokaryotic chi. Nucleic Acids Res. 1995. 23, 256-260
Rusch V., Klimstra D., Venkatraman E., Pisters P.W., Langenfeld J., Dmitrovsky E.
Overexpression of the epidermal growth factor receptor and its ligand
transforming growth factor alpha is frequent in resectable non-small cell lung
cancer but does not predict tumor progression. Clin Cancer Res. 1997. 3,
515-522
Salomon D.S., Brandt R., Ciardiello F., Normanno N. Epidermal growth factor-
related peptides and their receptors in human malignancies. Crit Rev Oncol
Hematol. 1995. 19, 183-232
Sandgren E.P., Luetteke N.C., Palmitter R.D., Brinster R.L., Lee D.C.
Overexpression of TGF-α in transgenic mice: induction of epithelial
hyperplasia, pancreatic metaplasia, and carcinoma of the breast. Cell. 1990.
61, 1121-1135
Sandgren E.P., Luetteke N.C., Qiu T.H., Palmiter R.D., Brinster R.L., Lee D.C.
Transforming growth factor α dramatically enhances oncogene-induced
carcinogenesis in transgenic mouse pancreas and liver. Mol Cell Biol. 1993.
13, 320-330
Sakaguchi M., Miyazaki M., Inoue Y., Tsuji T., Kouchi H., Tanaka T., Yamada H.,
Namba M. Relationship between contact inhibition and intranuclear S100C of
normal human fibroblasts. J Cell Biol. 2000. 149, 1193-1206
Sakaguchi M., Miyazaki M., Takaishi M., Sakaguchi Y., Makino E., Kataoka N.,
Yamada H., Namba M., Huh N. S100C/A11 is a key mediator of Ca2+-
induced growth inhibition of human epidermal keratinocytes. J Cell Biol.
2003. 163, 825-835
Schaffner W., Weissmann C. A rapid, sensitive, and specific method for the
determination of protein in dilute solution. Anal Biochem. 1973. 56, 502-514

References 124
Schäfer B.W., Wicki R., Engelkamp D., Mattei M.G., Heizmann C.W. Isolation of a
YAC clone covering a cluster of nine S100 genes on human chromosome
1q21: rationale for a new nomenclature of the S100 calcium-binding protein
family. Genomics. 1995. 25, 638-643
Schäfer B.W., Fritschy J.-M., Murmann P., Troxler H., Durussel I., Heizmann C.W.,
Cox J.A. Brain S100A5 is a novel calcium-, zinc-, and copper ion-binding
protein of the EF-hand superfamily. J Biol Chem. 2000. 275, 30623-30630
Schmidt A.M., Yan S.D., Yan S.F., Stern D.M. The biology of the receptor for
advanced glycation end products and its ligands. Biochim Biophys Acta.
2000. 1498, 99-111
Schönwasser D.C., Marais R.M., Marshall C.J., Parker P.J. Activation of the
mitogen-activated protein kinase/extracellular signal-regulated kinase
pathway by conventional, novel, and atypical protein kinase C isotypes. Mol
Cell Biol. 1998. 18, 790-798
Seftor R.E., Seftor E.A., Sheng S., Pemberton P.A., Sager R., Hendrix M.J.
Maspin suppresses the invasive phenotype of human breast carcinoma.
Cancer Res. 1998. 58, 5681-5685
Sorlie T., Perou C.M., Tibshirani R., Aas T., Geisler S., Johnsen H., Hastie T.,
Eisen M.B., van de Rijn M., Jeffrey S.S., Thorsen T., Quist H., Matese J.C.,
Brown P.O., Botstein D., Lonning P., Borresen-Dale A.L. Gene expression
patterns of breast carcinomas distinguish tumor subclasses with clinical
implications. Proc Natl. Acad Sci USA. 2001. 98, 10869-10874
South A.P., Cabral A., Ives J.H., James C.H., Mirza G., Marenholz I., Mischke D.,
Backendorf C., Ragoussis J., Nizetic D. Human epidermal differentiation
complex in a single 2.5 Mbp long continuum of overlapping DNA cloned in
bacteria integrating physical and transcript maps. J Invest Dermatol. 1999.
112, 910-918
Stulik J., Osterreicher J., Koupilova K., Knizek K., Macela A., Bures J., Jandik P.,
Langr F., Dedic K., Jungblut P.R. The analysis of S100A8 and S100A9
expression in matched sets of macroscopically normal colon mucosa and

References 125
colorectal carcinoma: the S100A9 and S100A8 positive cells underlie and
invade tumour mass. Electrophoresis. 1999. 20, 1047-1054
Takagi H., Sharp R., Takayama H., Anver M.R., Ward J.M., Merlino G.
Collaboration between growth factors and diverse chemical carcinogens in
hepatocarcinogenesis of transforming growth factor α transgenic mice.
Cancer Res. 1993. 53, 4329-4336
Teratani T., Watanabe T., Kuwahara F., Kumagai H., Kobayashi S., Aoki U.,
Ishikawa A., Arai K., Nozawa R. Induced transcriptional expression of
calcium-binding protein S100A1 and S100A10 genes in human renal cell
carcinoma. Cancer Lett. 2002. 175, 71-77
Venter J.C., et al. The sequence of the human genome. Science. 2001. 291, 1304-
1351
Wang E., Ma W.-J., Aghajanian C., Spriggs D. R. Posttranscriptional regulation of
protein expression in human epithelial carcinoma cells by adenine-uridine-
rich elements in the 3'-untranslated region of tumor necrosis factor-alpha
messenger RNA. Cancer Res. 1997. 57, 5426-5433
Wasserman W.W., Sandelin A. Applied bioinformatics for the identification of
regulatory elements. Nat Rev Genet. 2004. 5, 276-287
Welsh J.B., Gill G.N., Rosenfeld M.G., Wells A. A negative feedback loop
attenuates EGF-induced morphological changes. J Cell Biol. 1991. 114, 533-
543
Weterman M.A.J., Wilbrink M., Dijkhuizen T., van den Berg E., van Kessel A.G.
Fine mapping of the 1q21 breakpoint of the papillary renal cell carcinoma-
associated (X;1) translocation. Hum Genet. 1996. 98, 16-21
Wicki R., Franz C., Scholl F.A., Heizmann C.W., Schäfer B.W. Repression of the
candidate tumor suppressor gene S100A2 in breast cancer is mediated by
site-specific hypermethylation. Cell Calcium. 1997. 22, 243-254
Witton C.J., Reeves J.R., Going J.J., Cooke T.G., Bartlett J.M.S. Expression of the
HER1-4 family of receptor tyrosine kinases in breast cancer. J Pathol. 2003.
200, 290-297

References 126
Wright F.A., Lemon W.J., Zhao W.D., Sears R., Zhuo D., Wang J.P., Yang H.Y.,
Baer T., Stredney D., Spitzner J., Stutz A., Krahe R., Yuan B. A draft
annotation and overview of the human genome. Genome Biol. 2001. 2(7),
0025.1-0025.18
Xiong Z., O’Hanlon D., Becker L.E., Roder J., MacDonalds J.F., Marks A.
Enhanced calcium transients in glial cells in neonatal cerebellar cultures
derived from S100B null mice. Exp Cell Res. 2000. 257, 281-289
Yarden Y., Sliwkowski M.X. Untangling the ERBB signalling network. Nature Rev.
2001. 2, 127-137
Yonemura Y., Endou Y., Kimura K., Fushida S., Bandou E., Taniguchi K.,
Kinoshita K., Ninomiya I., Sugiyama K., Heizmann C.W., Schäfer B.W.,
Sasaki T. Inverse expression of S100A4 and E-cadherin is associated with
metastatic potential in gastric cancer. Clin Cancer Res. 2000. 6, 4234-4242
Zhang L., Fogg D.K., Waisman D.M. RNA interference-mediated silencing of the
S100A10 gene attenuates plasmin generation and invasiveness of Colo 222
colorectal cancer cells. J Biol Chem. 2004. 279, 2053-2062
Zhao Y., Neltner B.S., Davis H.W. Role of MARCS in regulating endothelial cell
proliferation. Am J Physiol. 2000. 279, C1611-C1620
Zhi H., Zhang J., Hu G., Lu J., Wang X., Zhou C., Wu M., Liu Z. The deregulation
of arachidonic acid metabolism-related genes in human esophageal
squamous cell carcinoma. Int J Cancer. 2003. 106, 327-333

127
Danksagung
Meinem Betreuer Herrn Prof. Dr. Iver Petersen, dem Leiter der Arbeitsgruppe
Tumorgenetik am Institut für Pathologie der Charité, möchte ich für die
Projektleitung, seine fachliche Unterstützung und den großen Freiraum bei der
Bearbeitung des Themas danken.
Prof. Dr. Harald Saumweber möchte ich für die fachlichen Diskussionen,
seine stimulierenden Hinweise und insbesondere seine Bereitschaft danken, mich
beim Promotionsverfahren am Fachbereich Biologie der Humboldt Universität
Berlin zu betreuen.
Frau Priv. Doz. Dr. Christine Sers danke ich herzlich für ihre wertvollen
Anregungen, ihre Diskussionsbereitschaft und ihre freundliche Unterstützung
während der gesamten Zeit meiner Doktorarbeit.
Mein besonderer Dank gilt Herrn Prof. Dr. Reinhold Schäfer für seine
wertvolle Hilfestellung, seinen vielseitigen fachlichen Rat und insbesondere die
Bereitschaft, mir die Teilnahme an den wissenschaftlichen Kolloquien seiner
Arbeitsgruppe zu ermöglichen.
Herrn Dr. Karsten Jürchott danke ich für seine konstruktiven Hinweise, die
wesentlicher Anstoß in einer wichtigen Etappe der Arbeit waren, für die stete
Diskussionsbereitschaft und besonders für die intensive Durchsicht des
Manuskripts.
Unserem Institutsdirektor Prof. Dr. Manfred Dietel danke ich für die
angenehme Arbeitsatmosphäre und die Bereitstellung der technischen und
materiellen Infrastruktur am Institut für Pathologie.
Nicht zuletzt gilt mein großer Dank Herrn Dr. Karsten Schlüns, der mich
durch seine wissenschaftliche, aber auch persönliche Unterstützung durch alle
Höhen und Tiefen dieser Arbeit begleitet hat.
Frau Nicole Deutschmann möchte ich für ihre Mithilfe in der Zellkultur,
Anfertigung der Gewebe-Arrays und für das Heraussuchen unzähliger
Paraffinblöcke danken.

128
Nicht versäumen will ich, mich bei dem MTA-Team der Abteilung
Immunhistochemische Diagnostik für die hochwertigen immunhistochemischen
Färbungen zu bedanken.
Den gesamten Arbeitsgruppen Schäfer und Sers danke ich herzlich für
unschätzbare Hilfen in vielen molekularbiologischen Methoden.
Nicht unerwähnt möchte ich jene lassen, die mir unermüdlich und immer
freundlich in den Laboren des Instituts für Pathologie tatkräftige Hilfen waren,
sowie alle, die mir zur praktischen Umsetzung und Fertigstellung der Arbeit
verhalfen. Ihnen allen gilt mein herzlicher Dank.
129
Curriculum Vitae
14.4.1975 Born in Lublin, Poland
1982-1990 Szkola podstawowa im. Tadeusza Kosciuszki (primary
school), Poland
1990-1994 Jan Zamoyski Liceum (high school), Poland
May 1994 School-leaving Exams
1994-1999 Study of Biotechnology at the Maria Curie-Sklodowska
University, Lublin, Poland
Sept 1997 - Feb 1998 Work at the Telomere Biology Laboratory, Institute of
Pathology, University Hospital Charité, Berlin,
Germany
June 1999 Master Thesis “Analysis of telomerase activity in
human testicular germ cell tumours“ at Maria Curie
Memorial Cancer Centre and Institute of Oncology,
Warsaw, Poland
Sept 1999 - Dec 1999 Visiting Scholar, Institute of Immunology and Virology,
Würzburg, Germany
Jan 2000 Begin of PhD thesis
Since Jan 2000 Research Assistent, Tumour Genetics Group (Prof.
Dr. Iver Petersen), Institute of Pathology, University
Hospital Charité, Berlin, Germany
.....................................................
Berlin, den 28. Juni 2004
Agnieszka Pietas
130
Publications
Nowak R., Sikora K., Pietas A., Skoneczna I., Chrapusta S.J. Germ cell-like
telomeric length homeostasis in nonseminomatous testicular germ cell
tumors. Oncogene. 2000. 19 (35), 4075-4078
Pietas A., Schluns K., Marenholz I., Schafer B.W., Heizmann C.W., Petersen I.
Molecular cloning and characterization of the human S100A14 gene
encoding a novel member of the S100 family. Genomics. 2002. 79 (4),
513-522
Chen Y., Petersen S., Pacyna-Gengelbach M., Pietas A., Petersen I. Identification
of a novel homeobox-containing gene, LAGY, which is downregulated in lung
cancer. Oncology. 2003. 64 (4), 450-458
Chen Y., Knosel T., Kristiansen G., Pietas A., Garber M.E., Matsuhashi S., Ozaki
I., Petersen I. Loss of PDCD4 expression in human lung cancer correlates
with tumour progression and prognosis. J Pathol. 2003. 200 (5), 640-646
Difilippantonio S., Chen Y., Pietas A., Schluns K., Pacyna-Gengelbach M.,
Deutschmann N., Padilla-Nash H.M., Ried T., Petersen I. Gene expression
profiles in human non-small and small-cell lung cancers. Eur J Cancer. 2003.
39 (13), 1936-1947
Oral Presentations and Posters
Pietas A., Schluns K., Petersen I. Molecular cloning and characterization of the
human S100A14 gene encoding a novel member of the S100 family. 85th
Annual Meeting of the German Society of Pathology, Vienna, Austria, April
2002 (oral presentation)
Pietas A., Schluns K., Marenholz I., Schafer B.W., Heizmann C.W., Petersen I.
Molecular cloning and characterization of the human S100A14 gene
encoding a novel member of the S100 family. European Conference on
Calcium Signaling in Normal and Transformed Cells, Brussels, Belgium, June
2002 (poster)
131
Pietas A., Schluns K., Petersen I. Epidermal growth factor induces S100A14 in
human lung and mammary tumour cells via the mitogen-activated protein
kinase pathway. 87th Annual Meeting of the German Society of Pathology,
Rostock, Germany, June 2004 (poster)
Pietas A., Schluns K., Petersen I. Epidermal growth factor induces S100A14 in
human lung and breast tumour cells via the extracellular signal-regulated
kinase cascade. European Conference on Calcium Signaling in Normal and
Transformed Cells, Cambridge, England, July 2004 (accepted poster)
.....................................................
Berlin, den 28. Juni 2004
Agnieszka Pietas

132
Eidesstattliche Erklärung
Hiermit erkläre ich, dass ich die vorliegende Dissertation selbstständig verfasst
und keine anderen als die angegebenen Quellen und Hilfsmittel verwendet habe.
.....................................................
Berlin, den 28. Juni 2004
Agnieszka Pietas