gene expression signature of primary breast tumour stromal cells
TRANSCRIPT
Gene expression signature of primary breast tumour stromal
cells
MC Hartmann, RM Dwyer and MJ KerinDepartment of Surgery, National University of Ireland, Galway
Breast cancer microenvironment
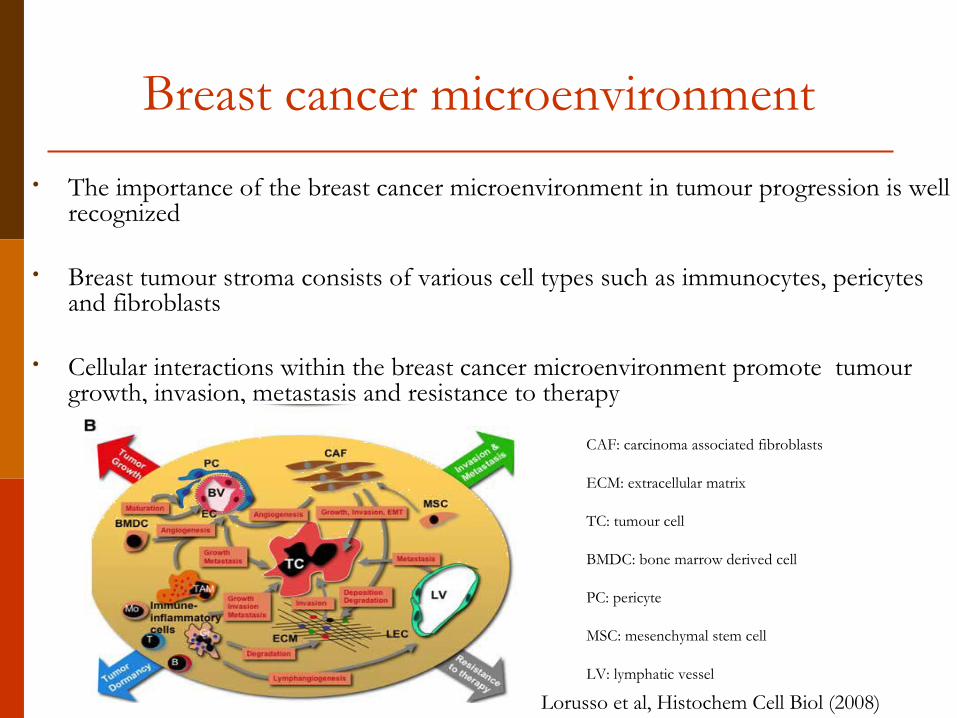
• The importance of the breast cancer microenvironment in tumour progression is well recognized
• Breast tumour stroma consists of various cell types such as immunocytes, pericytes and fibroblasts
• Cellular interactions within the breast cancer microenvironment promote tumour growth, invasion, metastasis and resistance to therapy
Lorusso et al, Histochem Cell Biol (2008)
CAF: carcinoma associated fibroblasts
ECM: extracellular matrix
TC: tumour cell
BMDC: bone marrow derived cell
PC: pericyte
MSC: mesenchymal stem cell
LV: lymphatic vessel
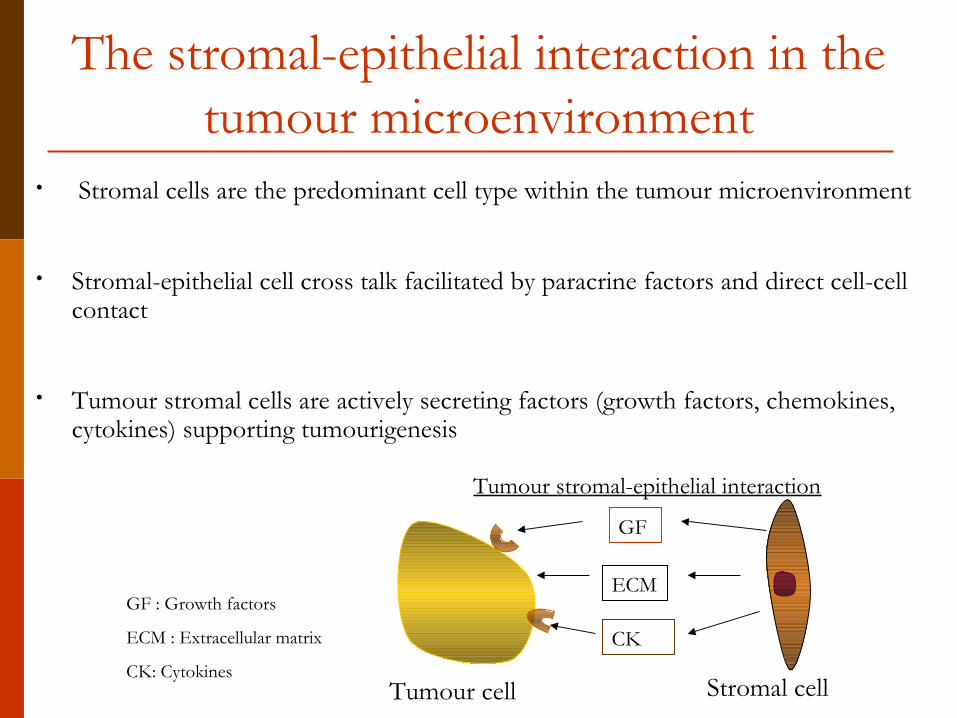
• Stromal cells are the predominant cell type within the tumour microenvironment
• Stromal-epithelial cell cross talk facilitated by paracrine factors and direct cell-cell contact
• Tumour stromal cells are actively secreting factors (growth factors, chemokines, cytokines) supporting tumourigenesis
Stromal cell Tumour cell
Tumour stromal-epithelial interaction
GF
ECM
CK
The stromal-epithelial interaction in the tumour microenvironment
GF : Growth factors
ECM : Extracellular matrix
CK: Cytokines

Aim
Characterise stromal cells derived from primary breast tumours and potentially elucidate mechanisms through
which they exert their actions
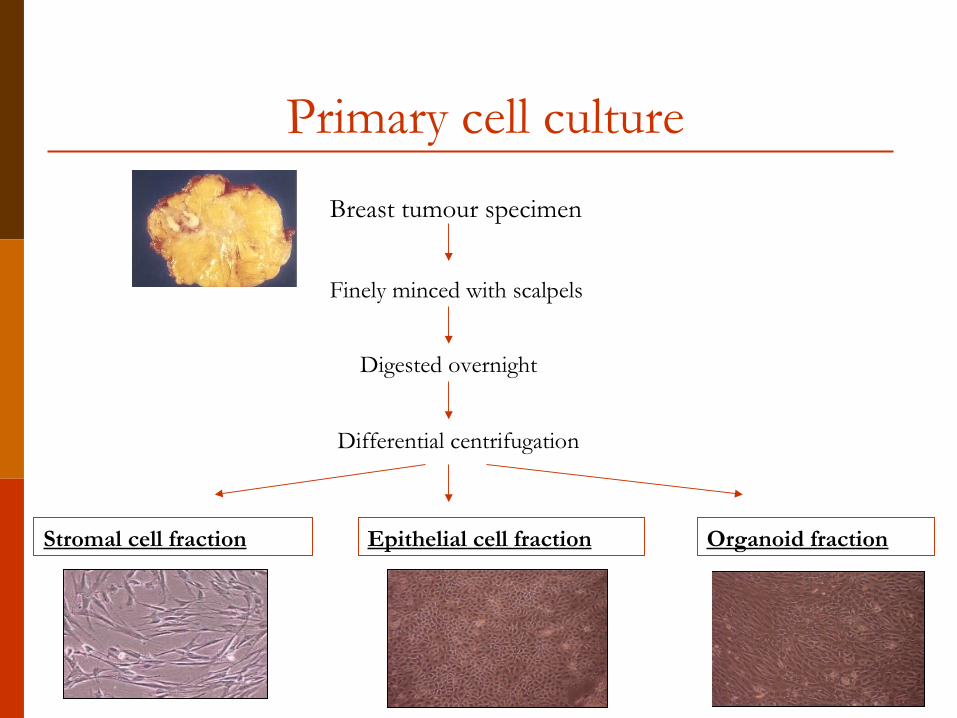
Primary cell culture
Stromal cell fraction
Breast tumour specimen
Finely minced with scalpels
Digested overnight
Differential centrifugation
Epithelial cell fraction Organoid fraction

Analysis of gene expression
Primary stromal cells isolated, cultured and harvested
RNA Extraction
Targets of interest
•Vascular endothelial growth factor (VEGF)
• Matrix metalloproteinase 3 (MMP3)
• Transforming growth factor beta 1 (TGFβ1)
• Transforming growth factor beta receptor 2 (TGFβ R2)
•Fibroblast activation protein (FAP)
cDNA synthesis
Real time quantitative PCR

MMP3 expression in stromal cells
Tan StroTum StroNorm Stro
5
4
3
2
1
Log1
0 re
lati
ve M
MP3
exp
ress
ion
MMP3 expr ession in st r omal cel ls
N=4 N=24 N=12
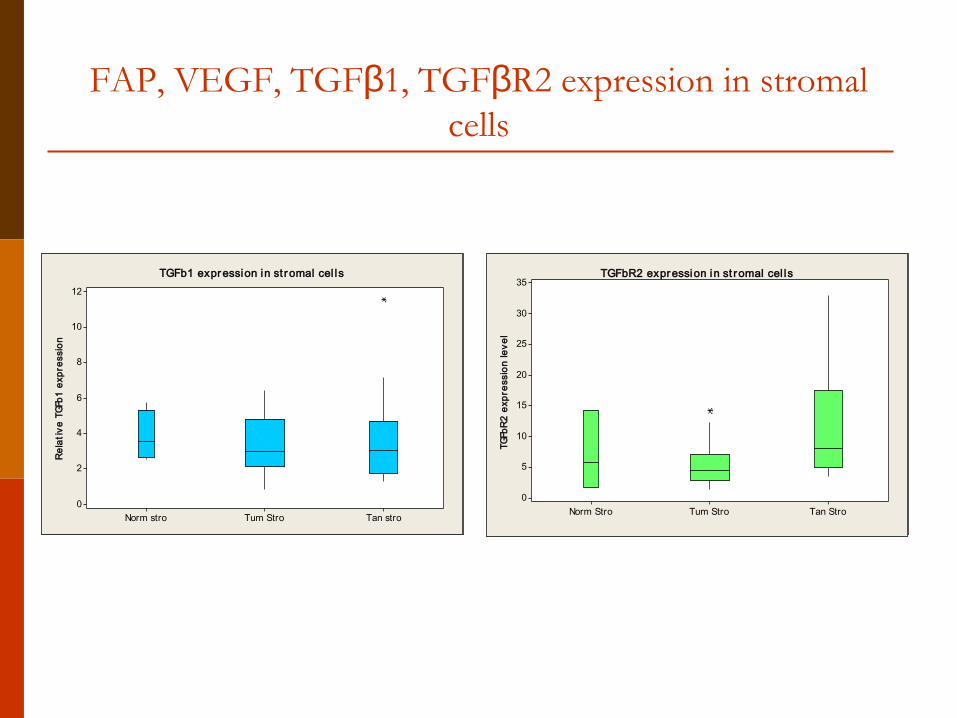
FAP, VEGF, TGFβ1, TGFβR2 expression in stromal cells
Tan StroTum StroNorm Stro
20
15
10
5
0
rela
tive
FA
P ex
pres
sion
FAP expression in st romal cel ls
Tan StroTum StroNorm Stro
16
14
12
10
8
6
4
2
0R
elat
ive
VEG
F ex
pres
sion
VEGF expression in st r omal cel ls
Tan stroTum StroNorm stro
12
10
8
6
4
2
0
Rel
ativ
e TG
Fb1
expr
essi
on
TGFb1 expression in st romal cel ls
Tan StroTum StroNorm Stro
35
30
25
20
15
10
5
0TG
FbR
2 ex
pres
sion
leve
l
TGFbR2 expression in st romal cel ls

Correlation of TGFβ 1 and TGFβ R2 expression
Correlation of TGFβ1 and TGFβ R2
0
2
4
6
8
10
12
14
16
18
Primary stromal cells n=40
Rel
ativ
e T
GF
β1 a
nd
TG
FβR
2 e
xpre
ssio
n le
vel
TGFβ1
TGFβR2
R=0.65 P<0.01

Correlation of VEGF and MMP3 expression
Correlation of VEGF and MMP3
0
2
4
6
8
10
12
14
16
18
Primary stromal cells n=40
Rel
ativ
e le
vel o
f V
EG
F a
nd
M
MP
3 ex
pre
ssio
n
MMP3VEGF
R=0.29 P<0.05

Correlation of FAP and TGFβR2 expression
Correlation of FAP and TGFβR2
0
5
10
15
20
25
30
35
Primary stromal cells n=40
Rel
ativ
e le
vel
of
FA
P a
nd
TG
FβR
2
FAP
TGFBR2
R=0.28 P<0.05

Summary
• Trend towards increased expression of MMP3 in tumour compared to normal stromal cells
• Significant positive Pearson correlation found between • TGFβ1 and TGFβR2 • MMP3 and VEGF• FAP and TGFβR2

Conclusion
Tumour stromal cells secrete proangiogenic and prometastatic factors, such as MMP3 and may support
breast cancer progression through promotion of tumour angiogenesis and invasion