identification of altered pathways in down syndrome-associated congenital heart ...€¦ · ·...
TRANSCRIPT
©FUNPEC-RP www.funpecrp.com.brGenetics and Molecular Research 15 (2): gmr.15027601
Identification of altered pathways in Down syndrome-associated congenital heart defects using an individualized pathway aberrance score
Y.Q. Chen, T. Li, W.Y. Guo, F.J. Su and Y.X. Zhang
Department of Cardiology, Lanzhou General Hospital of Lanzhou Military Area Command, Lanzhou, Gansu Province, China
Corresponding author: Y.Q. ChenE-mail: [email protected]
Genet. Mol. Res. 15 (2): gmr.15027601Received November 9, 2015Accepted December 9, 2015Published April 26, 2016DOI http://dx.doi.org/10.4238/gmr.15027601
ABSTRACT. The aim of this study was to identify disrupted pathways related to Down syndrome (DS), and DS-associated congenital heart defects (DS-CHD). The gene expression profile and pathway data of 10 human DS patients and 5 control samples in E-GEOD-1789 were recruited and analyzed by the individualized pathway aberrance score (iPAS) method, consisting of the data processing, gene-level statistics, pathway-level statistics, and significant measurement steps. The pre-processing step identified 12,493 genes and 1022 pathways (4269 genes). The pathway significant analysis identified eight pathways (adjusted P value <0.1) that differed between the disease and control samples. The cross-presentation of particulate exogenous antigen (phagosomes) and methionine salvage pathways showed the most significant differences among these. The gene expression levels of key pathway genes, such as CYBB and ADI1, were higher in disease samples than in normal controls. Based on our results, we predicted that the cross-presentation of particulate exogenous

2Y.Q. Chen et al.
©FUNPEC-RP www.funpecrp.com.brGenetics and Molecular Research 15 (2): gmr.15027601
antigens (phagosomes) and the methionine salvage pathway could be good indicators of DS-CHD.
Key words: Down syndrome; Congenital heart defect; Individualized pathway aberrance score (iPAS)
INTRODUCTION
Down syndrome (DS) is a chromosomal aneuploidy characterized by the presence of a supernumerary copy of the whole, or a part of, human chromosome 21 (Hsa21), which gives rise to a syndromic intellectual disability (Antonarakis and Epstein, 2006). Congenital heart defect (CHD) occurs in approximately 40% of the DS patients (Sailani et al., 2013). The relatively higher infant mortality rate in DS patients has been largely attributed to their having a higher incidence of CHD (Weijerman et al., 2008). Based on human genetic data, it has been delimited that a short interval on the distal tip of chromosome 21, containing a small set of candidate genes, may contribute to CHD in human DS (DS-CHD) (Grossman et al., 2011).
Over the past few years, extensive efforts have been undertaken to gain a better understanding of the genetic basis of DS-CHD, using cases of partial trisomy 21. A study of rare partial trisomy 21 cases suggested the presence of a minimal, 1.77-Mb CHD candidate region at 21q22.3, between markers D21S3 and PFKL (Korbel et al., 2009). Recent studies have also suggested the potential contribution of VEGFA (Ackerman et al., 2012), cleome and Hedgehog (Ripoll et al., 2012), and folate (Locke et al., 2010) pathways to the pathogenicity of DS-CHD. The transcription profile of DS-CHD was obtained based on the Hsa21 genes in the heart of 18-22-week-old human fetuses (Conti et al., 2007). However, the underlying contribution of the variations in gene expression to the incidence of DS-CHD remains unknown.
Genes are tightly regulated to execute the proper biological functions of a cell in response to internal or external perturbations (Kostka and Spang, 2004); therefore, changes in their expression during the disease deterioration process are causally associated with phenotypic changes. Pathway analysis has become the first choice to extract and explain the underlying biology of high-throughput molecular measurements (Draghici et al., 2007). Khatri et al. (2012) classified the pathway methods into three approaches: the over-representation analysis (ORA), functional class scoring (FCS), and pathway topology (PT)-based approaches. The traditional methods of pathway analysis mainly used ORA, which typically applied an arbitrary threshold value (e.g., fold-change > 2 or P < 0.05) on gene expression to assess whether the number of genes beyond the threshold were significantly over- or under-represented in the given pathway (Ritchie et al., 2007). In other words, the traditional pathway analysis techniques were mainly focused on discovering pathways that were altered between normal and disease groups, and were not suitable for the identification of the pathway aberrance that might occur in an individual sample.
However, two exceptional studies also examined the individualized pathway analytical methods pathway recognition algorithm using data integration on genomic models (PARADIGM) (Vaske et al., 2010) and pathway deregulation score (PDS) (Drier et al., 2013). However, these approaches could not interpret a single sample, such as the recurrent tumor of a patient that did not accompany a cohort dataset to extract the principal curve. An additional pathway analysis method, which used Average Z as the individualized pathway aberrance
3Identifying pathway changes in DS-CHD using iPAS
©FUNPEC-RP www.funpecrp.com.brGenetics and Molecular Research 15 (2): gmr.15027601
score (iPAS), has also been used to conduct pathway cluster analysis for the identification of altered pathways (Ahn et al., 2014). This method compared one disease sample with many accumulated samples (‘nRef’ referred to the accumulated normal samples). In addition, the iPAS method could be adapted to single-layer OMICS data, and could be used to interpret patient genes in the context of many published or user-defined pathway gene sets. The iPAS method had more freedom in terms of data and gene sets compared to PARADIGM, as it preferred multi-layered OMICS data, and required predefined functional structures among OMICS objects. This method did not assume that an individual sample belongs to a cohort (Ahn et al., 2014) compared to PDS, as it used nRef as the reference.
Therefore, in this study, iPAS was used to quantify the aberrations in the pathway of an individual sample, by comparing it with accumulated normal samples; this in turn was used to identify significantly differential pathways. This was achieved by individual recruitment of the gene expression profile and pathway data from the database. Subsequently, the iPAS method, including data preprocessing, gene-level statistics, pathway-level statistics, and a significance test, was conducted to identify the altered pathways. The aim of this study was to obtain a better understanding of the mechanism of DS-CHD, from the perspective of altered pathways.
MATERIAL AND METHODS
Gene expression data recruitment
A microarray gene expression profile deposited in the Gene Expression Omnibus (GEO) database (http://www.ncbi.nlm.nih.gov/geo/; accession No. GSE1789) was recruited. GSE1789 comprised a total of 15 samples, including 10 samples from fetuses trisomic for Hsa21 and 5 from euploid normal control fetuses (Conti et al., 2007). The expression profile also existed on the Affymetrix GeneChip Human Genome U133A Platform. The gene expression profile was converted from the probe level to the gene symbol level. The duplicated symbols were wiped off, resulting in a total of 12,493 gene symbols for further analysis.
Pathway data recruitment
The pathways of all human beings were recruited from the Reactome Pathway Database (http://www.reactome.org/). The complexity of the metabolic reactions is believed to be directly proportional to the number of genes enriched in the pathway. However, pathways with a small number of genes are more easily understood by researchers. Therefore, the pathways with gene set size >100 were discarded. Meanwhile, the differences between the genetic data in the different platforms resulted in the removal of pathways in the gene expression profile with gene intersection values equal to zero. Finally, 1022 pathways containing 4269 genes were obtained.
Individualized analysis of pathways
Altered pathways in each individual DS-CHD sample were identified using the iPAS method; the iPAS method is composed of four steps (Ahn et al., 2014): data preprocessing (Figure 1A), gene-level statistics (Figure 1B), pathway-level statistics (Figure 1C), and significant measurement (Figure 1D).

4Y.Q. Chen et al.
©FUNPEC-RP www.funpecrp.com.brGenetics and Molecular Research 15 (2): gmr.15027601
Data preprocessing
The quality of the gene expression profiles was controlled by standard pre-treatment prior to the analysis. Individual normal genes were subjected to background correction and normalization using the robust multi-array average (RMA) algorithm; the quantile-based algorithm was applied to eliminate the influence of nonspecific hybridization (Bolstad et al., 2003; Irizarry et al., 2003). The Micro Array Suite 5.0 (MAS 5.0) algorithm was then applied to revise the perfect match and mismatch values (Bolstad, 2013), and the median polish method was used to summarize the expression value (Irizarry et al., 2003).
Gene-level statistics
Gene expression in individual disease samples was standardized using the mean and standard deviation of the nRef as the reference. The gene-level value was calculated as follows:
Figure 1. Schematic representation of the individualized pathway analysis conducted using accumulated normal data (nRef).
( )( )
nDii
n
f mean NZ
stdev N−
= (Equation 1)
Here, the mean (Nn) symbolized the mean expression value of the genes of nRef, stdev (Nn) symbolized the standard deviation of the normal control sample set, fDi symbolized the expression value of i-th gene in the disease samples, and Zi symbolized the standardized expression value of i-th gene in the disease samples, where the number of genes belonging to the gene was i.

5Identifying pathway changes in DS-CHD using iPAS
©FUNPEC-RP www.funpecrp.com.brGenetics and Molecular Research 15 (2): gmr.15027601
Pathway-level statistics
The Average Z method was used to perform pathway-level statistics following the standardization of gene expression (through the mean and standard deviation of datasets). This method was a modification of the existing pathway analysis techniques, enabling the testing of pathway aberrance in an individual case sample, using nRef as the reference. The gene-level statistic value of all genes was extracted for each pathway, and the average of the gene-level statistics value was defined as the pathway statistics value. iPAS was calculated using the following formula:
(Equation 2)n
ii ZiPAS= n∑
where vector Z = (z1, z2 … zn) denotes the expression status of a pathway, Zi symbolizes the standardized expression value of the i-th gene, and n denoted the number of genes belonging to the pathway.
Differential pathway analysis
The linear models for microarray data (LIMMA) package is a core component of Bioconductor, an R-based open-source software development project in statistical genomics (Gentleman et al., 2004). In this study, the differences between the value of pathway statistics in the normal and disease groups were calculated using LIMMA in pairs. The P value was proofread by the false-discovery rate (FDR) (Genovese et al., 2002) and the P value of the pathways was obtained separately. The pathways with P < 0.1 were regarded as differential pathways. The pathways differing between the disease and control samples were then extracted to draw a heatmap.
Individual pathway analysis
The individual pathways contained in the disease set were analyzed using the iPAS of nRef. Initially, the personal pathway of the disease set was analyzed according to the iPAS, in order to obtain the empirical P value of the pathway in the disease sample set. This was followed by a statistical analysis of the altered pathways in the disease set with the empirical P < 0.05. The frequency of the changed pathways was calculated as follows:
NF= n (Equation 3)
where N symbolizes the number of samples in one pathway (P < 0.05), and n denotes the total number of samples. The ease with which the pathway could be altered was directly proportional to the F value. The genes contained in the significant pathways were individually imported to STRING (http://string-db.org/), in order to study the gene interactions.
6Y.Q. Chen et al.
©FUNPEC-RP www.funpecrp.com.brGenetics and Molecular Research 15 (2): gmr.15027601
RESULTS
Altered pathway analysis
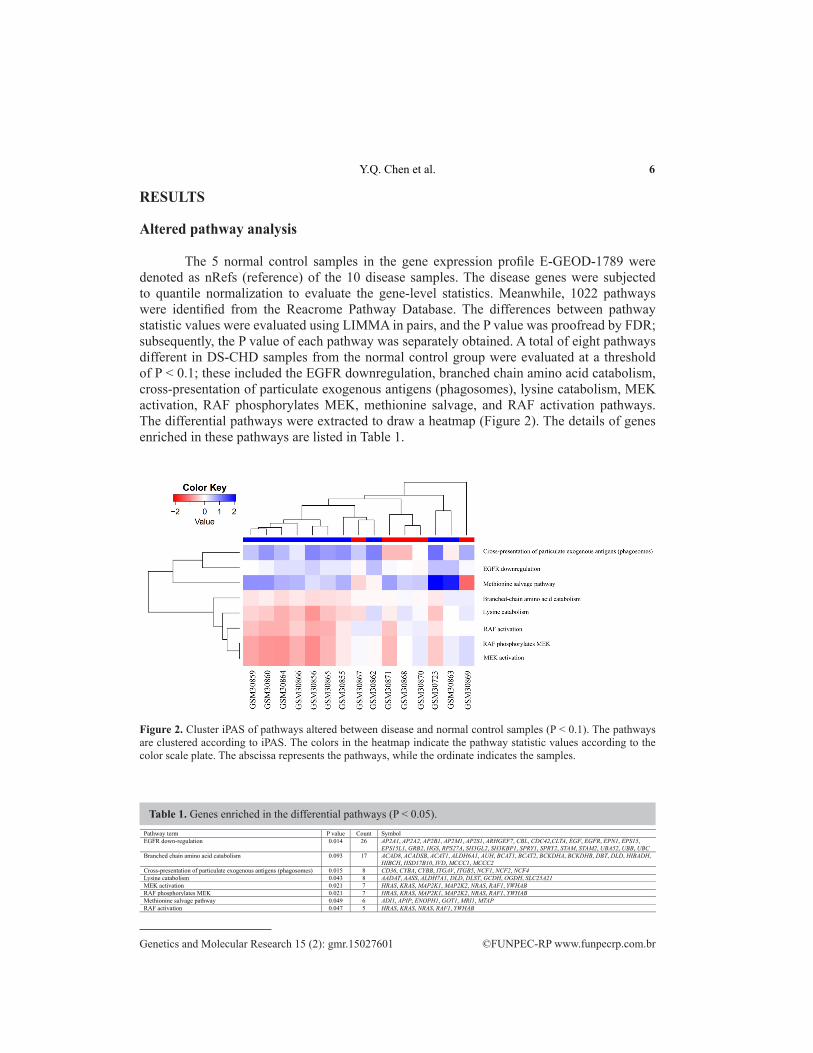
The 5 normal control samples in the gene expression profile E-GEOD-1789 were denoted as nRefs (reference) of the 10 disease samples. The disease genes were subjected to quantile normalization to evaluate the gene-level statistics. Meanwhile, 1022 pathways were identified from the Reacrome Pathway Database. The differences between pathway statistic values were evaluated using LIMMA in pairs, and the P value was proofread by FDR; subsequently, the P value of each pathway was separately obtained. A total of eight pathways different in DS-CHD samples from the normal control group were evaluated at a threshold of P < 0.1; these included the EGFR downregulation, branched chain amino acid catabolism, cross-presentation of particulate exogenous antigens (phagosomes), lysine catabolism, MEK activation, RAF phosphorylates MEK, methionine salvage, and RAF activation pathways. The differential pathways were extracted to draw a heatmap (Figure 2). The details of genes enriched in these pathways are listed in Table 1.
Figure 2. Cluster iPAS of pathways altered between disease and normal control samples (P < 0.1). The pathways are clustered according to iPAS. The colors in the heatmap indicate the pathway statistic values according to the color scale plate. The abscissa represents the pathways, while the ordinate indicates the samples.
Table 1. Genes enriched in the differential pathways (P < 0.05).Pathway term P value Count SymbolEGFR down-regulation 0.014 26 AP2A1, AP2A2, AP2B1, AP2M1, AP2S1, ARHGEF7, CBL, CDC42,CLTA, EGF, EGFR, EPN1, EPS15,
EPS15L1, GRB2, HGS, RPS27A, SH3GL2, SH3KBP1, SPRY1, SPRY2, STAM, STAM2, UBA52, UBB, UBCBranched chain amino acid catabolism 0.093 17 ACAD8, ACADSB, ACAT1, ALDH6A1, AUH, BCAT1, BCAT2, BCKDHA, BCKDHB, DBT, DLD, HIBADH,
HIBCH, HSD17B10, IVD, MCCC1, MCCC2Cross-presentation of particulate exogenous antigens (phagosomes) 0.015 8 CD36, CYBA, CYBB, ITGAV, ITGB5, NCF1, NCF2, NCF4Lysine catabolism 0.043 8 AADAT, AASS, ALDH7A1, DLD, DLST, GCDH, OGDH, SLC25A21MEK activation 0.021 7 HRAS, KRAS, MAP2K1, MAP2K2, NRAS, RAF1, YWHABRAF phosphorylates MEK 0.021 7 HRAS, KRAS, MAP2K1, MAP2K2, NRAS, RAF1, YWHABMethionine salvage pathway 0.049 6 ADI1, APIP, ENOPH1, GOT1, MRI1, MTAPRAF activation 0.047 5 HRAS, KRAS, NRAS, RAF1, YWHAB
7Identifying pathway changes in DS-CHD using iPAS
©FUNPEC-RP www.funpecrp.com.brGenetics and Molecular Research 15 (2): gmr.15027601
Individual pathway analysis
The conditions of these altered pathways in all disease samples were elucidated by individual pathway analysis. Two of the eight differential pathways, the cross-presentation of particulate exogenous antigen (phagosome) and methionine salvage pathways, were significantly varied (P < 0.05) in all disease samples. These pathways were significantly upregulated in a majority of the disease samples, as observed in Figure 2.
Gene compositions of altered pathways
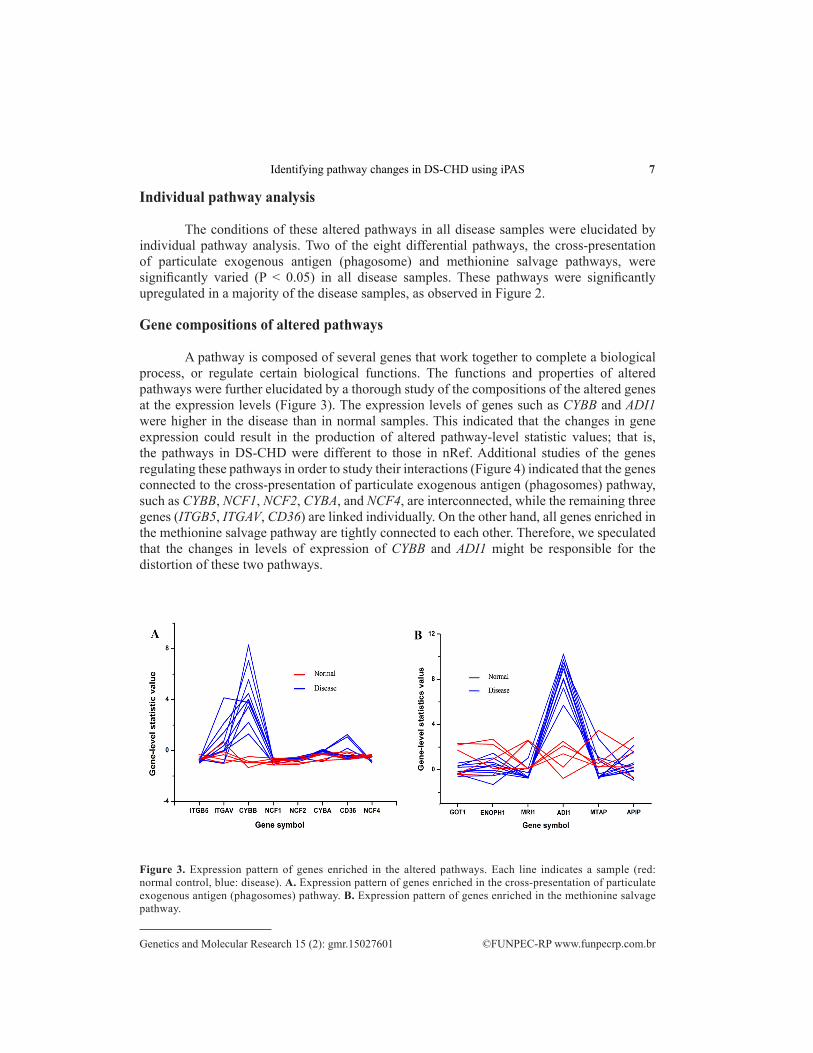
A pathway is composed of several genes that work together to complete a biological process, or regulate certain biological functions. The functions and properties of altered pathways were further elucidated by a thorough study of the compositions of the altered genes at the expression levels (Figure 3). The expression levels of genes such as CYBB and ADI1 were higher in the disease than in normal samples. This indicated that the changes in gene expression could result in the production of altered pathway-level statistic values; that is, the pathways in DS-CHD were different to those in nRef. Additional studies of the genes regulating these pathways in order to study their interactions (Figure 4) indicated that the genes connected to the cross-presentation of particulate exogenous antigen (phagosomes) pathway, such as CYBB, NCF1, NCF2, CYBA, and NCF4, are interconnected, while the remaining three genes (ITGB5, ITGAV, CD36) are linked individually. On the other hand, all genes enriched in the methionine salvage pathway are tightly connected to each other. Therefore, we speculated that the changes in levels of expression of CYBB and ADI1 might be responsible for the distortion of these two pathways.
Figure 3. Expression pattern of genes enriched in the altered pathways. Each line indicates a sample (red: normal control, blue: disease). A. Expression pattern of genes enriched in the cross-presentation of particulate exogenous antigen (phagosomes) pathway. B. Expression pattern of genes enriched in the methionine salvage pathway.

8Y.Q. Chen et al.
©FUNPEC-RP www.funpecrp.com.brGenetics and Molecular Research 15 (2): gmr.15027601
DISCUSSION
In this study, we analyzed DS-CHD by personalized identification of pathways altered in disease samples using the iPAS method. We determined that the cross-presentation of particulate exogenous antigen (phagosomes) and methionine salvage pathways were significantly different in subjects with and without DS-CHD. In addition, a comprehensive analysis of the genes enriched in the altered pathways indicated that changes in these pathways could be attributed to genes that were differentially expressed (such as CYBB and ADI1) between DS-CHD and normal subjects. Here, we have attempted to further elucidate the relationship between changes in key pathways, the enriched genes within these pathways, and DS-CHD.
In this study, the cross-presentation of particulate exogenous antigen (phagosomes) pathway was found to be significantly different between diseased and normal samples. Dendritic cells are known to uptake and process exogenous particulate or cell-associated antigens, including microbes or tumor cells, for MHC-I cross-presentation (Amigorena and Savina, 2010). The enriched CYBB gene was shown to be significantly upregulated in DS-CHD samples, compared to normal controls. Mutations in the CYBB gene result in a lack of, or an incomplete loss of, gp91 phox expression, because of the instability of the corresponding mRNA or protein (Condino-Neto and Newburger, 2000). Meanwhile, CYBB, in combination with other genes, has been indicated to play a major role in heart diseases (Perumal and Mahalingam, 2013). The gene-level analyses conducted in this study indicated that CYBB was significantly differentially expressed, which might be the main cause of changes in the pathway.
ADI1, in the methionine salvage pathway, was found to be significantly different in DS samples compared to the control samples. ADI1, a 5’-methylthioadenosine (MTA) cycle enzyme, belongs to the cupin domain superfamily, and has aci-reductone dioxygenase enzymatic activity (Chou et al., 2014). The ADI1 gene, in association with Fe2+, produces formate and 2-keto-4-methylthiobutyrate (MTOB), the keto-acid precursor of methionine. Alternatively, ADI1, in association with Ni2+ produces formate, carbon monoxide, and 3-methylthiopropionate (Hirano et al., 2005). ADI1 has also been reported to be affected by fecundity, through the regulation of methionine metabolism (Chou et al., 2014). The
Figure 4. STRING figures of pathway genes. A. String figure of genes enriched in the cross-presentation of particulate exogenous antigen (phagosomes) pathway. B. String figure of genes enriched in the methionine salvage pathway.

9Identifying pathway changes in DS-CHD using iPAS
©FUNPEC-RP www.funpecrp.com.brGenetics and Molecular Research 15 (2): gmr.15027601
methionine salvage pathway, also called the MTA cycle, is a sequential pathway comprising six reactions, which is responsible for the creation of methionine from MTA, a byproduct of polyamine biosynthesis in nearly all organisms (Albers, 2009). Downregulated or decelerated synthesis of methionine has been reported as a pathogenic mechanism causing dementia in DS (Regland and Gottfries, 1992). Pozzi et al. (2009), in a study of factors affecting centromeric hypomethylation in the pathogenesis of DS, reported a correlation between polymorphisms in the methionine synthetase-reductase (MTRR) A66G and DS. A recent study reported that the MTRR c.66A>G polymorphism could be a risk factor for DS in newborn children (Coppedè et al., 2014). Similarly, a recent meta-analysis of the literature reporting non-DS-CHD cases revealed an association between the maternal MTRR 66A>G polymorphism and increased risk of CHD in the offspring (Cai et al., 2014).
In conclusion, we successfully identified two significant pathways and some key genes that were significantly altered in DS-CHD, using a method based on iPAS analysis. We predicted that the cross-presentation of particulate exogenous antigen (phagosomes) and methionine salvage pathways could function as good indicators of DS-CHD.
Conflicts of interest
The authors declare no conflict of interest.
ACKNOWLEDGMENTS
Research supported by the Department of Cardiology of the Army General Hospital in Lanzhou. We thank all members of the research group; in addition, we would like to thank the Ji’nan Evidence Based Medicine Science-Technology Center, for their technical support pertaining to data processing and analysis.
REFERENCES
Ackerman C, Locke AE, Feingold E, Reshey B, et al. (2012). An excess of deleterious variants in VEGF-A pathway genes in Down-syndrome-associated atrioventricular septal defects. Am. J. Hum. Genet. 91: 646-659. http://dx.doi.org/10.1016/j.ajhg.2012.08.017
Ahn T, Lee E, Huh N and Park T (2014). Personalized identification of altered pathways in cancer using accumulated normal tissue data. Bioinformatics 30: i422-i429. http://dx.doi.org/10.1093/bioinformatics/btu449
Albers E (2009). Metabolic characteristics and importance of the universal methionine salvage pathway recycling methionine from 5'-methylthioadenosine. IUBMB Life 61: 1132-1142. http://dx.doi.org/10.1002/iub.278
Amigorena S and Savina A (2010). Intracellular mechanisms of antigen cross presentation in dendritic cells. Curr. Opin. Immunol. 22: 109-117. http://dx.doi.org/10.1016/j.coi.2010.01.022
Antonarakis SE and Epstein CJ (2006). The challenge of Down syndrome. Trends Mol. Med. 12: 473-479. http://dx.doi.org/10.1016/j.molmed.2006.08.005
Bolstad B (2013). affy: Built-in processing methods. Website: http://www.bioconductor.org/packages/release/bioc/vignettes/affy/inst/doc/builtinMethods.pdf.
Bolstad BM, Irizarry RA, Astrand M and Speed TP (2003). A comparison of normalization methods for high density oligonucleotide array data based on variance and bias. Bioinformatics 19: 185-193. http://dx.doi.org/10.1093/bioinformatics/19.2.185
Cai B, Zhang T, Zhong R, Zou L, et al. (2014). Genetic variant in MTRR, but not MTR, is associated with risk of congenital heart disease: an integrated meta-analysis. PLoS One 9: e89609. http://dx.doi.org/10.1371/journal.pone.0089609
Chou H-Y, Lin Y-H, Shiu G-L, Tang H-Y, et al. (2014). ADI1, a methionine salvage pathway enzyme, is required for Drosophila fecundity. J. Biomed. Sci. 21: 64. http://dx.doi.org/10.1186/s12929-014-0064-4

10Y.Q. Chen et al.
©FUNPEC-RP www.funpecrp.com.brGenetics and Molecular Research 15 (2): gmr.15027601
Condino-Neto A and Newburger PE (2000). Interferon-gamma improves splicing efficiency of CYBB gene transcripts in an interferon-responsive variant of chronic granulomatous disease due to a splice site consensus region mutation. Blood 95: 3548-3554.
Conti A, Fabbrini F, D’Agostino P, Negri R, et al. (2007). Altered expression of mitochondrial and extracellular matrix genes in the heart of human fetuses with chromosome 21 trisomy. BMC Genomics 8: 268. http://dx.doi.org/10.1186/1471-2164-8-268
Coppedè F, Bosco P, Lorenzoni V, Denaro M, et al. (2014). The MTRR 66A>G polymorphism and maternal risk of birth of a child with Down syndrome in Caucasian women: a case-control study and a meta-analysis. Mol. Biol. Rep. 41: 5571-5583. http://dx.doi.org/10.1007/s11033-014-3462-5
Draghici S, Khatri P, Tarca AL, Amin K, et al. (2007). A systems biology approach for pathway level analysis. Genome Res. 17: 1537-1545. http://dx.doi.org/10.1101/gr.6202607
Drier Y, Sheffer M and Domany E (2013). Pathway-based personalized analysis of cancer. Proc. Natl. Acad. Sci. U. S. A. 110: 6388-6393. http://dx.doi.org/10.1073/pnas.1219651110
Genovese CR, Lazar NA and Nichols T (2002). Thresholding of statistical maps in functional neuroimaging using the false discovery rate. Neuroimage 15: 870-878. http://dx.doi.org/10.1006/nimg.2001.1037
Gentleman RC, Carey VJ, Bates DM, Bolstad B, et al. (2004). Bioconductor: open software development for computational biology and bioinformatics. Genome Biol. 5: R80. http://dx.doi.org/10.1186/gb-2004-5-10-r80
Grossman TR, Gamliel A, Wessells RJ, Taghli-Lamallem O, et al. (2011). Over-expression of DSCAM and COL6A2 cooperatively generates congenital heart defects. PLoS Genet. 7: e1002344. http://dx.doi.org/10.1371/journal.pgen.1002344
Hirano W, Gotoh I, Uekita T and Seiki M (2005). Membrane-type 1 matrix metalloproteinase cytoplasmic tail binding protein-1 (MTCBP-1) acts as an eukaryotic aci-reductone dioxygenase (ARD) in the methionine salvage pathway. Genes Cells 10: 565-574. http://dx.doi.org/10.1111/j.1365-2443.2005.00859.x
Irizarry RA, Bolstad BM, Collin F, Cope LM, et al. (2003). Summaries of Affymetrix GeneChip probe level data. Nucleic Acids Res. 31: e15-e15. http://dx.doi.org/10.1093/nar/gng015
Khatri P, Sirota M and Butte AJ (2012). Ten years of pathway analysis: current approaches and outstanding challenges. PLoS Comput. Biol. 8: e1002375. http://dx.doi.org/10.1371/journal.pcbi.1002375
Korbel JO, Tirosh-Wagner T, Urban AE, Chen XN, et al. (2009). The genetic architecture of Down syndrome phenotypes revealed by high-resolution analysis of human segmental trisomies.Proc. Natl. Acad. Sci. U. S. A. 106: 12031-12036. http://dx.doi.org/10.1073/pnas.0813248106
Kostka D and Spang R (2004). Finding disease specific alterations in the co-expression of genes. Bioinformatics 20 (Suppl 1): i194-i199. http://dx.doi.org/10.1093/bioinformatics/bth909
Locke AE, Dooley KJ, Tinker SW, Cheong SY, et al. (2010). Variation in folate pathway genes contributes to risk of congenital heart defects among individuals with Down syndrome. Genet. Epidemiol. 34: 613-623. http://dx.doi.org/10.1002/gepi.20518
Perumal V and Mahalingam V (2013). Insights from the clustering of microarray data associated with the heart disease. Bioinformation 9: 759-765. http://dx.doi.org/10.6026/97320630009759
Pozzi E, Vergani P, Dalpra L, Combi R, et al. (2009). Maternal polymorphisms for methyltetrahydrofolate reductase and methionine synthetase reductase and risk of children with Down syndrome. Am. J. Obstet. Gynecol. 200: 636. e631-636. e636.
Regland B and Gottfries CG (1992). Slowed synthesis of DNA and methionine is a pathogenetic mechanism common to dementia in Down’s syndrome, AIDS and Alzheimer’s disease? Med. Hypotheses 38: 11-19. http://dx.doi.org/10.1016/0306-9877(92)90153-4
Ripoll C, Rivals I, Ait Yahya-Graison E, Dauphinot L, et al. (2012). Molecular signatures of cardiac defects in Down syndrome lymphoblastoid cell lines suggest altered ciliome and Hedgehog pathways. PLoS One 7: e41616. http://dx.doi.org/10.1371/journal.pone.0041616
Ritchie ME, Silver J, Oshlack A, Holmes M, et al. (2007). A comparison of background correction methods for two-colour microarrays. Bioinformatics 23: 2700-2707. http://dx.doi.org/10.1093/bioinformatics/btm412
Sailani MR, Makrythanasis P, Valsesia A, Santoni FA, et al. (2013). The complex SNP and CNV genetic architecture of the increased risk of congenital heart defects in Down syndrome. Genome Res. 23: 1410-1421. http://dx.doi.org/10.1101/gr.147991.112
Vaske CJ, Benz SC, Sanborn JZ, Earl D, et al. (2010). Inference of patient-specific pathway activities from multi-dimensional cancer genomics data using PARADIGM. Bioinformatics 26: i237-i245. http://dx.doi.org/10.1093/bioinformatics/btq182
Weijerman ME, van Furth AM, Vonk Noordegraaf A, van Wouwe JP, et al. (2008). Prevalence, neonatal characteristics, and first-year mortality of Down syndrome: a national study. J. Pediatr. 152: 15-19. http://dx.doi.org/10.1016/j.jpeds.2007.09.045