comparison of pathways associated with hepatitis b- and c ... · comparison of pathways associated...
TRANSCRIPT

Genomics 99 (2012) 347–354
Contents lists available at SciVerse ScienceDirect
Genomics
j ourna l homepage: www.e lsev ie r .com/ locate /ygeno
Comparison of pathways associated with hepatitis B- and C-infected hepatocellularcarcinoma using pathway-based class discrimination method
Sun Young Lee a,b, Kwang Hoon Song a,c, Imhoi Koo d, Kee-Ho Lee e, Kyung-Suk Suh f, Bu-Yeo Kim a,c,⁎a Division of Constitutional Medicine Research, Korea Institute of Oriental Medicine, Daejeon, Republic of Koreab School of Computational Sciences and Center for In Silico Protein Science, Korea Institute for Advanced Study, Seoul, Republic of Koreac Herbal Medicine Research Division, Korea Institute of Oriental Medicine, Daejeon, Republic of Koread Department of Bioinformatics and Biostatistics, University of Louisville, Louisville, USAe Laboratory of Radiation Molecular Oncology, Korea Institute of Radiological and Medical Sciences, Seoul, Republic of Koreaf Department of Surgery, Seoul National University School of Medicine, Seoul, Republic of Korea
Abbreviations: HCC, Hepatocellular carcinoma; HBV,tis C virus; PAM, Prediction Analysis of Microarrays; RF,vector machine; LDA, Linear discriminant analysis; KNNGSA, Gene set analysis; CV, Cross-validation; FDR, Falsgen-activated protein kinase; TGF-β, Transforming gJanus kinase/signal transducer and activator of transcrassociated protein 2.⁎ Corresponding author at: Herbal Medicine Researc
Oriental Medicine, 1672 Yuseongdae-ro, Yuseong-gu, DKorea. Fax: +82 42 868 9480.
E-mail address: [email protected] (B.-Y. Kim).
0888-7543/$ – see front matter © 2012 Elsevier Inc. Alldoi:10.1016/j.ygeno.2012.04.004
a b s t r a c t
a r t i c l e i n f oArticle history:Received 17 November 2011Accepted 20 April 2012Available online 29 April 2012
Keywords:Hepatocellular carcinomaPathwayMicroarrayHBVHCVPrediction
Molecular signatures causing hepatocellular carcinoma (HCC) from chronic infection of hepatitis B virus(HBV) or hepatitis C virus (HCV) are not clearly known. Using microarray datasets composed of HCV-positive HCC or HBV-positive HCC, pathways that could discriminate tumor tissue from adjacent non-tumor liver tissue were selected by implementing nearest shrunken centroid algorithm. Cancer-related sig-naling pathways and lipid metabolism-related pathways were predominantly enriched in HCV-positiveHCC, whereas functionally diverse pathways including immune-related pathways, cell cycle pathways, andRNA metabolism pathways were mainly enriched in HBV-positive HCC. In addition to differentially involvedpathways, signaling pathways such as TGF-β, MAPK, and p53 pathways were commonly significant in bothHCCs, suggesting the presence of common hepatocarcinogenesis process. The pathway clustering also veri-fied segregation of pathways into the functional subgroups in both HCCs. This study indicates the functionaldistinction and similarity on the pathways implicated in the development of HCV- and/or HBV-positive HCC.
© 2012 Elsevier Inc. All rights reserved.
1. Introduction
Hepatocellular carcinoma (HCC) is one of the most fatal cancersworldwide, and about half million patients die from this diseaseeach year [1]. Chronic infection of hepatitis B virus (HBV) or hepatitisC virus (HCV) is the major risk factors for HCC. Although histologicalevaluation and clinical manifestation are indistinguishable betweenchronic hepatitis patients with HBV or HCV infection [2], gene expres-sion pattern in HBV- or HCV-infected livers has been reported to bedifferent [3,4]. Moreover, microarray studies have demonstratedthat HBV and HCV cause hepatocarcinogenesis by different molecularmechanisms [5–8]. For example, based on the differentially expressedgenes between HBV- and HCV-positive HCC, biological functions such
Hepatitis B virus; HCV, Hepati-Random forest; SVM, Support, k-nearest neighbor classifier;e discovery rate; MAPK, Mito-rowth factor-beta; JAK/STAT,iption; SKP2, S-phase kinase-
h Division, Korea Institute ofaejeon, 305-811, Republic of
rights reserved.
as apoptosis, DNA repair responses, and inflammatory pathways havebeen differently implicated in two types of HCC [4,5]. Although themi-croarray revealed the different molecular signatures responsible fordevelopment of HBV-positive HCC or HCV-positive HCC, the differentmicroarray platforms and heterogeneous clinicopathological natureof samples used in the experiments makes it hard to obtain commongenes or common signaling pathways that can be applied to all data-sets. For example, we previously reported that only a small part ofthe principle genes in HBV-positive HCC were in common with thoseselected from other microarray datasets [9,10]. Moreover, since mostresearch involving high-throughput data have eventually focused ononly a handful of significant genes, it is difficult to obtain biological in-formation that can be extracted from a network relationship of wholegenes. In addition, individual genes are more susceptible to noise in-herent to the microarray technology. One of the approaches to over-come these limitations is using functionally- or structurally-relatedpre-defined gene sets, such as pathway, rather than using individualgenes [11,12]. Recent reports also demonstrated that the pathway-based approach yieldsmore interpretable results on particular cellularor physiological functions by simplifying the complex structure of agenetic network [13–15]. A variety of methods have been proposedto identify pathways associated with the phenotype of subjects, in-cluding discriminant analysis [16,17] and enrichment methods[11,18]. Recently, Pang et al. used random forest algorithm to identify
348 S.Y. Lee et al. / Genomics 99 (2012) 347–354
pathways discriminating sample classes and further built pathwayclusters to understand possible crosstalk between pathways [19,20].
Because biological processes associated with development of HCChave not been clearly elucidated in pathway level, it is important toidentify the functional changes involved in the development ofHBV-positive HCC or HCV-positive HCC. In this study, we identifiedthat cancer-related signaling pathways and lipid metabolism-relatedpathways were predominantly enriched in HCV-positive HCC, where-as diverse functions including immune-related pathways, cell cyclepathways, and RNA metabolism pathways were mainly enriched inHBV-positive HCC. In addition, many cancer-related signaling path-ways were also commonly significant in both HBV-positive HCC andHCV-positive HCC indicating the presence of common hepatocarcino-genesis mechanism.
2. Results
2.1. Assessment of the discrimination methods
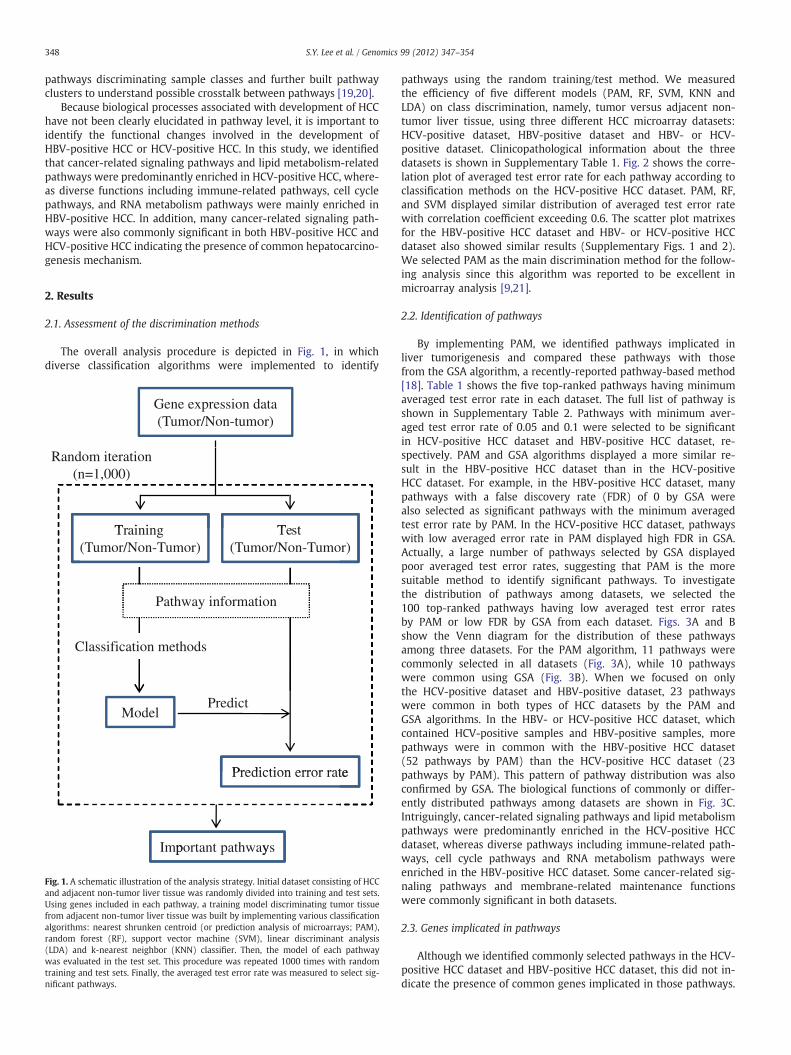
The overall analysis procedure is depicted in Fig. 1, in whichdiverse classification algorithms were implemented to identify
Gene expression data(Tumor/Non-tumor)
Training Test
Random iteration (n=1,000)
Training(Tumor/Non-Tumor)
Test(Tumor/Non-Tumor)
Prediction error rate
ModelPredict
Prediction error rate
Important pathwaysp y
Pathway information
Classification methods
Fig. 1. A schematic illustration of the analysis strategy. Initial dataset consisting of HCCand adjacent non-tumor liver tissue was randomly divided into training and test sets.Using genes included in each pathway, a training model discriminating tumor tissuefrom adjacent non-tumor liver tissue was built by implementing various classificationalgorithms: nearest shrunken centroid (or prediction analysis of microarrays; PAM),random forest (RF), support vector machine (SVM), linear discriminant analysis(LDA) and k-nearest neighbor (KNN) classifier. Then, the model of each pathwaywas evaluated in the test set. This procedure was repeated 1000 times with randomtraining and test sets. Finally, the averaged test error rate was measured to select sig-nificant pathways.
pathways using the random training/test method. We measuredthe efficiency of five different models (PAM, RF, SVM, KNN andLDA) on class discrimination, namely, tumor versus adjacent non-tumor liver tissue, using three different HCC microarray datasets:HCV-positive dataset, HBV-positive dataset and HBV- or HCV-positive dataset. Clinicopathological information about the threedatasets is shown in Supplementary Table 1. Fig. 2 shows the corre-lation plot of averaged test error rate for each pathway according toclassification methods on the HCV-positive HCC dataset. PAM, RF,and SVM displayed similar distribution of averaged test error ratewith correlation coefficient exceeding 0.6. The scatter plot matrixesfor the HBV-positive HCC dataset and HBV- or HCV-positive HCCdataset also showed similar results (Supplementary Figs. 1 and 2).We selected PAM as the main discrimination method for the follow-ing analysis since this algorithm was reported to be excellent inmicroarray analysis [9,21].
2.2. Identification of pathways
By implementing PAM, we identified pathways implicated inliver tumorigenesis and compared these pathways with thosefrom the GSA algorithm, a recently-reported pathway-based method[18]. Table 1 shows the five top-ranked pathways having minimumaveraged test error rate in each dataset. The full list of pathway isshown in Supplementary Table 2. Pathways with minimum aver-aged test error rate of 0.05 and 0.1 were selected to be significantin HCV-positive HCC dataset and HBV-positive HCC dataset, re-spectively. PAM and GSA algorithms displayed a more similar re-sult in the HBV-positive HCC dataset than in the HCV-positiveHCC dataset. For example, in the HBV-positive HCC dataset, manypathways with a false discovery rate (FDR) of 0 by GSA werealso selected as significant pathways with the minimum averagedtest error rate by PAM. In the HCV-positive HCC dataset, pathwayswith low averaged error rate in PAM displayed high FDR in GSA.Actually, a large number of pathways selected by GSA displayedpoor averaged test error rates, suggesting that PAM is the moresuitable method to identify significant pathways. To investigatethe distribution of pathways among datasets, we selected the100 top-ranked pathways having low averaged test error ratesby PAM or low FDR by GSA from each dataset. Figs. 3A and Bshow the Venn diagram for the distribution of these pathwaysamong three datasets. For the PAM algorithm, 11 pathways werecommonly selected in all datasets (Fig. 3A), while 10 pathwayswere common using GSA (Fig. 3B). When we focused on onlythe HCV-positive dataset and HBV-positive dataset, 23 pathwayswere common in both types of HCC datasets by the PAM andGSA algorithms. In the HBV- or HCV-positive HCC dataset, whichcontained HCV-positive samples and HBV-positive samples, morepathways were in common with the HBV-positive HCC dataset(52 pathways by PAM) than the HCV-positive HCC dataset (23pathways by PAM). This pattern of pathway distribution was alsoconfirmed by GSA. The biological functions of commonly or differ-ently distributed pathways among datasets are shown in Fig. 3C.Intriguingly, cancer-related signaling pathways and lipid metabolismpathways were predominantly enriched in the HCV-positive HCCdataset, whereas diverse pathways including immune-related path-ways, cell cycle pathways and RNA metabolism pathways wereenriched in the HBV-positive HCC dataset. Some cancer-related sig-naling pathways and membrane-related maintenance functionswere commonly significant in both datasets.
2.3. Genes implicated in pathways
Although we identified commonly selected pathways in the HCV-positive HCC dataset and HBV-positive HCC dataset, this did not in-dicate the presence of common genes implicated in those pathways.

0.05 0.15 0.25 0.35 0.10 0.25 0.40
PAM
0.1
0.2
0.3
0.4
PAM
cor = 0.668 cor = 0.668 cor = 0.257cor = 0.87
0
150.
250.
35
RF
RF
cor =0.225cor =0.593cor = 0.751
0.05
0.1
SVM
30.
4
M
cor = 0.557 cor = 0.447
0.1
0.2
0.3
0.40
KNN
SVM
cor = 0.351
0.10
0.25
KNN
KN
N
00.
250.
40
LDA
LD
A
0.1 0.2 0.3 0.4 0.1 0.2 0.3 0.4 0.10 0.25 0.40
0.10
PAM RF SVM KNN LDA
Fig. 2. Scatter plot matrix with histogram of averaged test error on the diagonal and pairwise comparisons of the averaged test error among the five different prediction methods(PAM, RF, SVM, KNN and LDA) on the off-diagonal for the HCV-positive HCC dataset with correlation coefficient.
349S.Y. Lee et al. / Genomics 99 (2012) 347–354
For example, in mitogen-activated protein kinase (MAPK) signalingpathway, axon guidance pathway and transforming growth factor-beta (TGF-β) signaling pathway, which were all enriched in boththe HCV-positive HCC dataset and HBV-positive HCC dataset, the ex-pression pattern of genes was different depending on the dataset(Supplementary Fig. 3). Therefore, the activities of these pathwaysmight be different in each dataset.
2.4. Pathway clusters
We classified pathways into subgroups based on the functionalcategories in Fig. 3C. Next, pathway clusters were measured basedon similarity of class discrimination ability of pathways. Althoughthe overall cluster structure was different between the HCV-positive HCC dataset and HBV-positive HCC dataset, cancer-relatedsignaling pathways and metabolism-related pathways were clus-tered into separate subgroups as Class 1 and Class 2, respectively,in both datasets (pb0.01) (Fig. 4). This result suggests the presenceof network of pathways commonly acting on the development ofboth types of HCC.
3. Discussion
HBV and HCV are completely different viruses. HBV contains adouble-stranded DNA genome that integrates into the host genome,while HCV is a RNA virus that replicates in the cytoplasm of the cell[2]. Despite their different life cycles and genomes, they share com-mon characteristics in chronic liver diseases such as hepatitis, whichcan progress to cirrhosis and HCC. Although this process is not distin-guishable by histological examination or clinical manifestations,molecular investigations have identified the differentially expressedgenes between HBV- and HCV-positive HCC [5–8]. This result stronglysuggests that diagnostic and therapeutic targets for HCC should beconsidered differently between HBV- and HCV-positive HCC.
In the present study, we measured a pathway's ability to discrim-inate tumor tissues from adjacent non-tumor liver tissues from theHCV-positive HCC dataset or HBV-positive HCC dataset. When thisapproach was compared with conventional gene-based approach, itwas evident that pathway-based method was less affected by exper-imental variations from multiple microarray platforms. For example,23% of pathways were commonly selected between HCV-positiveHCC dataset and HBV-positive HCC dataset in our approach, whereas

Table 1Significant pathways associated with each HCC dataset.
Pathway PAM GSA⁎
Error rate⁎⁎ P⁎⁎ CV Error⁎⁎⁎ P⁎⁎⁎ Score P FDR
HCV-positive Sphingolipid metabolism 0.050 0.054 0.057 0.006 0.253 0.15 0.642PDGF pathway 0.057 0.163 0.057 0.028 −0.064 0.33 0.768Downstream signal transduction 0.059 0.199 0.046 0.032 0.323 0.08 0.555Small cell lung cancer 0.060 0.271 0.057 0.057 0.278 0.05 0.555Hedgehog signaling pathway 0.061 0.213 0.057 0.038 −0.367 0.04 0.523
HBV-positive TGF beta signaling pathway 0.102 0.010 0.094 0.002 −0.667 0.00 0.000Mitotic M-M/G1 phases 0.106 0.159 0.099 0.107 0.398 0.00 0.000Antigen processing and presentation 0.116 0.020 0.109 0.019 0.804 0.02 0.331mRNA splicing 0.119 0.173 0.109 0.125 0.414 0.00 0.000Apoptosis 0.121 0.169 0.115 0.133 0.510 0.00 0.000
HBV- or HCV-positive Metabolism of proteins 0.052 0.139 0.049 0.077 0.472 0.00 0.000Influenza life cycle 0.055 0.100 0.043 0.038 0.507 0.00 0.000Lysosome 0.056 0.175 0.049 0.123 0.333 0.04 0.276Platelet activation 0.058 0.260 0.056 0.266 −0.090 0.17 0.765Translation 0.058 0.040 0.056 0.014 0.473 0.01 0.112
⁎ For GSA, score represents gene set score measured by maxmean statistic. P-value and FDR were obtained using restandardization method implemented in GSA R package.⁎⁎ Error rate was computed by averaging over-all the prediction error rates. P-value was measured by random permutation.⁎⁎⁎ CV Error represents 10-fold cross-validated error rate. P-value was measured by random permutation.
350 S.Y. Lee et al. / Genomics 99 (2012) 347–354
only 4.6% of genes were in common in gene-based approach (Fig. 3Aand Supplementary Fig. 4). The clinicopathological characteristicsalso support the similar pathophysiology of three HCC datasets;HCV-positive dataset, HBV-positive dataset and HBV- or HCV-positive dataset (Supplementary Table 1). Variables related withliver pathology; fibrosis stage distribution, total bilirubin, alanineaminotransferase and alpha-fetoprotein level were similar amongdatasets. Tumor characteristics such as tumor number, size and stagealso did not significantly differ among datasets, although the HBV-positive HCC dataset was composed of more poorly differentiated
Signaling pathways (79)
HCV HBV
HBV or HCV
36
36
41
65
12
12
11
(A)
(C)
HCV
HBV
HBV or HCV
PAM
Fig. 3. Comparison of significant pathways among the HCV-positive HCC dataset, HBV-positwith low averaged test error for PAM and (B) top ranked 100 pathways with low FDR for Gmeasured in a Venn diagram. (C) Functional distribution of significant pathways (gray colosignaling-related class, cell cycle class, immune class, lipid metabolism class, tissue homoand virus-related class. The number in parentheses represents the number of pathways inc
tumor samples (25.8%) compared with other datasets (~18% in HCV-positive HCC dataset and HBV- or HCV-positive HCC dataset,p=0.0497). This clinicopathological information demonstrated thatphysiological differences among three datasets were mainly derivedfrom viral infection status.
Intriguingly, signaling pathways including diverse cancer path-ways were mainly enriched in HCV-positive HCC. In contrast,immune-related pathways, cell cycle pathways and RNA metabolismpathways were mainly enriched in HBV-positive HCC, suggesting thepresence of different molecular mechanism in hepatocarcinogenesis
Rep
air (
2)
Cellcycle (15) Im
mun
e (8
)
Lip
id (6
)T
issu
eho
mog
enei
ty
(13)
Ene
rgy
met
abol
ism
(1
5) RNA(14) V
irus
(9)
HCV HBV
HBV or HCV
52
45
32
71
6
13
10
(B)GSA
ive HCC dataset and HBV- or HCV-positive HCC dataset. (A) Top ranked 100 pathwaysSA were selected from each dataset. Overlapping of the pathways among datasets wasr) was measured among datasets. Functional category was divided as follows: cancer/geneity class, energy metabolism class, nucleotide repair class, RNA metabolism classluded in each category.

SignalingMetabolism
Class 1 Class 2
Class 1 Class 2
Class 1 Class 2
(A)HCV-positive HCC
HBV-positive HCC
HBV- or HCV-positive HCC
(B)
(C)
SignalingMetabolism
SignalingMetabolism
Fig. 4. Tree structure of pathway cluster. Top-ranked 100 pathways were classified into subclasses on similarity of classification error matrix using consensus clustering method forthe (A) HCV-positive HCC dataset, (B) HBV-positive HCC dataset and (C) HBV- or HCV-positive HCC dataset. Classes 1 and 2 represent clusters enriched with signaling pathways andmetabolism-related pathways, respectively, as colored in black bar.
351S.Y. Lee et al. / Genomics 99 (2012) 347–354
depending on the status of viral infection. Involvement of signalingpathways such as diverse cancer-related, apoptosis, Wnt and janus ki-nase/signal transducer and activator of transcription (JAK/STAT) path-ways indicates de-regulation of signal pathways in HCV-positive HCC(Table 1 and Supplementary Table 2). It has been reported that HCVinfection de-regulates many signal pathways and causes tumor devel-opment, although which viral protein plays a key role has not beenfully elucidated [22,23]. In addition to cancer- and signal pathways,we identified other functional changes in lipid metabolism inHCV-positive HCC. The glycero-phopholipid metabolism pathway,inositol-phosphate metabolism pathway and sphingolipid metabo-lism pathway were enriched in HCV-positive HCC. These findings areconsistent with the recent report that HCV infection induces abnor-mality of lipid metabolism and contributes to hepatic steatosis andthe development of cancer [24,25]. In addition, the presently-identified autophagy pathway was reported to be critical in suppress-ing innate antiviral immunity in HCV infection [26].
While signaling pathways were mainly enriched in HCV-positiveHCC, relatively diverse biological functions were implicated in HBV-positive HCC suggesting that hepatocarcinogenesis from chronicHBV infection causes more various changes in cellular function thanin HCV infection. Although partly involved also in HCV-positive HCC,diverse functional pathways including immune pathways, cell cyclepathways and RNA metabolism pathway were selected as significantpathways in HBV-positive HCC. Previous studies have indicated thatdynamic interactions among HBV, hepatocytes and the host immunesystem may determine viral persistence and disease progression[5,6,27]. Recently, genetic variations at the locus involved in immuneresponse were also reported to be risk factors for HCC [28]. More-over, involvement of S-phase kinase-associated protein 2 (SKP2)-mediated p21 degradation pathway in HBV-positive HCC, a cellcycle pathway, is consistent with the recent report that mutation in
HBV core promoter increases the risk for HCC development by up-regulating SKP2 and then down-regulating p21 via ubiquitin-mediated proteasomal degradation [29]. In addition, enrichment ofa group of RNA processing pathways in HBV-positive HCC may alsobe critical in HBV-positive HCC, as evidenced by the finding thataberrant splicing of mRNA is associated with HCC development andprogression [30,31].
These differences between HBV- and HCV-positive HCCs indicatethe different molecular mechanism of hepatocarcinogenesis causedby two types of viruses. Although cirrhosis induced by HBV or HCVis a commonmajor risk factor for HCC development, it has been dem-onstrated that several viral factors including the HBx, pre-S2/S andspliced protein in HBV, and Core, E2 and NS5A in HCV have oncogenicproperties acting on different targets in the host [32]. Furthermore,HBV integrated into host genome leads to global changes in genomicfunction and chromosomal instability.
Previous reports were mainly focused on the identification ofdifference between HBV- and HCV-positive HCC. However, the pre-sent study identified that many cancer-related signaling pathwaysare commonly significant in both types of HCC, which impliesthe presence of a common hepatocarcinogenesis process. For ex-ample, the TGF-β pathway, MAPK pathway and p53 pathwaywere included in this category, all of which were already reportedto be involved in HCC development and progression [33–35]. An-other notable common feature in both HBV-positive HCC andHCV-positive HCC was membrane-related maintenance function in-cluding actin cytoskeleton, focal adhesion and axon guidance path-ways (Supplementary Table 2). Because maintenance of tissuehomeostasis is important in the control of cell growth and differ-entiation, de-regulated tissue maintenance is critically implicatedin tumor progression and metastasis in HCC [36,37]. For example,tight junctions play a key role in HCV entry into host cells [38].

352 S.Y. Lee et al. / Genomics 99 (2012) 347–354
In addition to signaling pathways, energy metabolism pathwaysincluding glycolysis have emerged as a potent driving force ofliver tumorigenesis [39,40]. We also identified that general meta-bolic pathways such as glycolysis, oxidative phosphorylation,amino-acid metabolism and nucleotide metabolism were alsohighly significant in both types of HCC. Considering that Wnt sig-naling induces a shift in the glucose metabolism from oxidativephosphorylation to glycolysis in the liver [41], the signaling path-ways regulating general metabolism may be a key target to controlthe HCC development.
Although we applied pathway-based class discrimination methodto overcome the limitation associated with single gene-based ap-proach, problems involving small size of samples and differenttypes of microarray platforms can still influence on process of thepathway identification. Therefore, it would be important to increasesample numbers with diverse types of microarrays to demonstratethe efficacy of our pathway-based approach in extracting significantbiological information.
4. Conclusions
In conclusion, we identified diverse pathways implicated in HCCdevelopment according to the status of viral infection. Our findingsclearly demonstrate the differences and similarities in biologicalfunctions between HBV- and HCV-positive HCC, and the possiblepresence of a global network of pathways in the development ofboth types of HCC.
5. Materials and methods
5.1. HCC dataset
Three different microarray datasets of HCC were used in ourstudy. The first set (HCV-positive HCC dataset) was composed of87 only HCV-positive specimen containing 43 HCCs and 44 non-tumor liver tissues [42] in which, total RNA from frozen samples,or human reference RNA was labeled with fluorescent dyes (Cy5and Cy3, respectively), and hybridized on arrays (Agilent Technologies).Raw microarray data was archived in Gene Expression Omnibus(GSE17856). For normalization, the log2 values of probe intensityratio (Cy5/Cy3) were smoothed by LOWESS method [43]. Multipleprobes per single gene were averaged and 19,371 genes were finallyincluded for study.
As the second microarray dataset, we used only HBV-positivesamples (HBV-positive HCC dataset, GSE14811), previously reportedby us [10]. This dataset was composed of 96 HCCs and 96 pair-matched non-tumor liver tissues. Total RNA from each frozen sampleand placental reference RNA were labeled with fluorescent dyes (Cy5and Cy3, respectively) and hybridized with approximately 14,000cDNAs printed onto glass microscope slides. The log2 ratios of probeintensity (Cy5/Cy3) were normalized using LOWESS method. Espe-cially, space- and intensity-dependent LOWESS method was appliedto eliminate intensity bias associated with manufacturing process ofspot-type slide microarray in this dataset [44]. After averaging ratiosof multiple probes per single gene, 6122 genes were included in thepresent study.
Finally, the third dataset (HBV- or HCV-positive HCC dataset,GSE10143) included 162 samples (80 HCCs and 82 non-tumor livertissues) composed of heterogeneous viral types of specimen fromHosida et al. [45]. The samples had been kept in formalin-fixed andparaffin-embedded blocks. Total RNA extracted from tissues was con-verted into cDNA and then was employed to the cDNA-mediatedannealing, selection, extension, and ligation (DASL) assay (Illumina).The amplified products were hybridized to a bead microarray. Theone color signal intensities of quality controlled 6100 genes were
normalized using quantile method to make the distribution ofprobe intensities of each array the same [43].
5.2. Classification algorithm
Fig. 1 shows a schematic diagram of overall procedure appliedto identify significant pathways. Initially, each microarray datasetwas split into two groups randomly as the training and test set com-posed of 60% and 40% of the samples, respectively. With pre-definedgenes belonging to each pathway, the prediction model was built byimplementing five different algorithms in the training set to discrim-inate tumor samples from adjacent non-tumor samples; nearestshrunken centroid (or Prediction Analysis of Microarrays; PAM)[21], random forest (RF) [19], support vector machine (SVM) [46],linear discriminant analysis (LDA), and k-nearest neighbor classifier(KNN). Finally, the prediction error rate was evaluated on indepen-dent test data. This procedure was repeated 1000 times to extractas much information as possible from all samples. Then, the meantest error rate was computed by averaging over-all the predictionerror rates for a pathway. Finally, to estimate the statistical signifi-cance of an averaged test error rate, the permutation-based ap-proach was used. The gene labels (gene symbol) were randomlypermuted 1000 times. For each permutation, the random test errorrate was measured as the same procedure used in the original data-set. By comparing the original averaged test error rate with permu-tated random error rates, the statistical significance for a pathwaywas estimated. We applied a gene-based permutation rather than aclass (phenotype)-based permutation, reflecting the fact that the ex-pression of many genes are already changed between HCC and adja-cent non-tumor liver tissues [9,10].
We also measured the pathway prediction efficacy using a cross-validation (CV) method. In that analysis, the prediction model wasbuilt and evaluated on 10-fold CV for PAM. The statistical signifi-cance of cross-validated error rate was also measured using gene-based random permutation method (n=1000). All procedureswere performed using R (v2.12.0; the R source code for our programis available upon request). On the other hand, t-test was used for se-lection of genes discriminating between HCC and adjacent non-tumor liver tissue.
5.3. Gene set analysis (GSA)
GSA is an improved version of Gene Set Enrichment Analysis(GSEA) [11,18]. GSA measures the gene-set score for each gene setand searches for significantly correlated gene sets with the phenotyp-ic class. For comparison with our method, we performed GSA algo-rithm using GSA R package (v1.03).
5.4. Pathway information
The pathway database was obtained from Molecular SignaturesDatabase (MSigDB) [11], from which manually curated pathway in-formation of Kyoto Encyclopedia of Genes and Genomes (KEGG, 186pathways) [47], BioCarta (217 pathways, http://www.biocarta.com/genes/allpathways.asp) and Reactome database (430 pathways)[48] were initially included in this study. From a total of 833 path-ways, only pathways containing expression values of at least fivegenes were included in this study. Therefore, 818 pathways (185from KEGG, 214 from BioCarta and 419 from Reactome) for HCV-positive HCC dataset, 680 pathways (175 from KEGG, 159 fromBioCarta and 346 from Reactome) for HBV-positive HCC dataset and799 pathways (183 from KEGG, 216 from BioCarta and 400 fromReactome) for HBV- or HCV-positive HCC dataset were used.

353S.Y. Lee et al. / Genomics 99 (2012) 347–354
5.5. Pathway cluster
The similarity of pathways was measured by the consensus clus-tering method [49], which is a tool for unsupervised class discoveryinvolving subsampling. The matrix of classification error rate mea-sured on each sample and each pathway using PAM algorithms wasused for clustering (ConsensusClusterPlus R package v1.0.1). We in-cluded 100 top-ranked pathways from KEGG having low averagedtest error. Cluster count (k) of 5 was applied after graphical deter-mination of cumulative distribution function. Statistical significancefor functional clustering of pathways was measured by Chi-squaretest performed in R.
Acknowledgments
This study was supported by a grant (kiom-2010-2) from the Inter-Institutional Collaboration Research Program under the Korea ResearchCouncil of Fundamental Science & Technology (KRCF) and by theNational Research Foundation of Korea grant (NRF, No. 20110027738).
Appendix A. Supplementary data
Supplementary data to this article can be found online at doi:10.1016/j.ygeno.2012.04.004.
References
1 D.M. Parkin, F. Bray, J. Ferlay, P. Pisani, Global cancer statistics, 2002, CA CancerJ. Clin. 55 (2005) 74–108.
2 R. Colombari, A.P. Dhillon, E. Piazzola, A.A. Tomezzoli, G.P. Angelini, F. Capra, A.Tomba, P.J. Scheuer, Chronic hepatitis in multiple virus infection: histopathologicalevaluation, Histopathology 22 (1993) 319–325.
3 M. Honda, S. Kaneko, H. Kawai, Y. Shirota, K. Kobayashi, Differential gene expres-sion between chronic hepatitis B and C hepatic lesion, Gastroenterology 120(2000) 955–966.
4 M. Honda, T. Yamashita, T. Ueda, H. Takatori, R. Nishino, S. Kaneko, Different signal-ing pathways in the livers of patients with chronic hepatitis B or chronic hepatitisC, Hepatology 44 (2006) 1122–1138.
5 N. Iizuka, M. Oka, H. Yamada-Okabe, N. Mori, T. Tamesa, T. Okada, N. Takemoto,A. Tangoku, K. Hamada, H. Nakayama, T. Miyamoto, S. Uchimura, Y. Hamamoto,Comparison of gene expression profiles between hepatitis B virus- and hepatitisC virus-infected hepatocellular carcinoma by oligonucleotide microarray data onthe basis of a supervised learning method, Cancer Res. 62 (2002) 3939–3944.
6 N. Iizuka, M. Oka, H. Yamada-Okabe, N. Mori, T. Tamesa, T. Okada, N. Takemoto,K. Hashimoto, A. Tangoku, K. Hamada, H. Nakayama, T. Miyamoto, S. Uchimura,Y. Hamamoto, Differential gene expression in distinct virologic types of hepato-cellular carcinoma: association with liver cirrhosis, Oncogene 22 (2003) 3007–3014.
7 C.F. Lee, Z.Q. Ling, T. Zhao, K.R. Lee, Distinct expression patterns in hepatitis Bvirus- and hepatitis C virus-infected hepatocellular carcinoma, World J. Gastroen-terol. 14 (2008) 6072–6077.
8 S.Y. Yoon, J.M. Kim, J.H. Oh, Y.J. Jeon, D.S. Lee, J.H. Kim, J.Y. Choi, B.M. Ahn, S. Kim,H.S. Yoo, Y.S. Kim, N.S. Kim, Gene expression profiling of human HBV- and/orHCV-associated hepatocellular carcinoma cells using expressed sequence tags,Int. J. Oncol. 29 (2006) 315–327.
9 B.Y. Kim, J.G. Lee, S. Park, J.Y. Ahn, Y.J. Ju, J.H. Chung, C.J. Han, S.H. Jeong, Y.I. Yeom, S.Kim, Y.S. Lee, C.M. Kim, E.M. Eom, D.H. Lee, K.Y. Choi, M.H. Cho, K.S. Suh, D.W. Choi,K.H. Lee, Feature genes of hepatitis B virus-positive hepatocellular carcinoma,established by its molecular discrimination approach using prediction analysis ofmicroarray, Biochim. Biophys. Acta 1739 (2004) 50–61.
10 S.H. Chang, K.S. Suh, N.J. Yi, K.H. Lee, B.Y. Kim, J.J. Jang, Predicting the prognosis ofhepatocellular carcinoma using gene expression, J. Surg. Res. 171 (2011) 524–531.
11 A. Subramanian, P. Tamayo, V.K. Mootha, S. Mukherjee, B.L. Ebert, M.A. Gillette, A.Paulovich, S.L. Pomeroy, T.R. Golub, E.S. Lander, J.P. Mesirov, Gene set enrichmentanalysis: a knowledge-based approach for interpreting genome-wide expressionprofiles, Proc. Natl. Acad. Sci. U. S. A. 102 (2005) 15545–15550.
12 L. Abatangelo, R. Maglietta, A. Distaso, A. D'Addabbo, T.M. Creanza, S. Mukherjee, N.Ancona, Comparative study of gene set enrichment methods, BMC Bioinformatics10 (2009) 275.
13 M. Murohashi, K. Hinohara, M. Kuroda, T. Isagawa, S. Tsuji, S. Kobayashi, K.Umezawa, A. Tojo, H. Aburatani, N. Gotoh, Gene set enrichment analysis providesinsight into novel signalling pathways in breast cancer stem cells, Br. J. Cancer102 (2010) 206–212.
14 N.G. Copeland, N.A. Jenkins, Deciphering the genetic landscape of cancer—fromgenes to pathways, Trends Genet. 25 (2009) 455–462.
15 M.A. Ali, T. Sjoblom, Molecular pathways in tumor progression: from discovery tofunctional understanding, Mol. Biosyst. 5 (2009) 902–908.
16 F. Tai, W. Pan, Incorporating prior knowledge of predictors into penalized classi-fiers with multiple penalty terms, Bioinformatics 23 (2007) 1775–1782.
17 M.C. Wu, L. Zhang, Z. Wang, D.C. Christiani, X. Lin, Sparse linear discriminant anal-ysis for simultaneous testing for the significance of a gene set/pathway and geneselection, Bioinformatics 25 (2009) 1145–1151.
18 B. Efron, R. Tibshirani, On testing the significance of sets of genes, Ann. Appl. Stat. 1(2007) 107–129.
19 H. Pang, A. Lin, M. Holford, B.E. Enerson, B. Lu, M.P. Lawton, E. Floyd, H. Zhao, Path-way analysis using random forests classification and regression, Bioinformatics 22(2006) 2028–2036.
20 H. Pang, H. Zhao, Building pathway clusters from Random Forests classificationusing class votes, BMC Bioinformatics 9 (2008) 87.
21 R. Tibshirani, T. Hastie, B. Narasimhan, G. Chu, Diagnosis of multiple cancer types byshrunken centroids of gene expression, Proc. Natl. Acad. Sci. U. S. A. 99 (2002)6567–6572.
22 M. Levrero, Viral hepatitis and liver cancer: the case of hepatitis C, Oncogene 25(2006) 3834–3847.
23 K. Koike, Hepatitis C virus contributes to hepatocarcinogenesis by modulatingmetabolic and intracellular signaling pathways, J. Gastroenterol. Hepatol. 22(Suppl. 1) (2007) S108–S111.
24 J.M. Wu, N.J. Skill, M.A. Maluccio, Evidence of aberrant lipid metabolism in hepatitisC and hepatocellular carcinoma, HPB (Oxford) 12 (2010) 625–636.
25 K. Koike, Steatosis, liver injury, and hepatocarcinogenesis in hepatitis C viral infec-tion, J. Gastroenterol. 44 (Suppl. 19) (2009) 82–88.
26 P.Y. Ke, S.S. Chen, Activation of the unfolded protein response and autophagy afterhepatitis C virus infection suppresses innate antiviral immunity in vitro, J. Clin. In-vest. 121 (2011) 37–56.
27 T.F. Baumert, R. Thimme, F. von Weizsacker, Pathogenesis of hepatitis B virus in-fection, World J. Gastroenterol. 13 (2007) 82–90.
28 R.J. Clifford, J. Zhang, D.M. Meerzaman, M.S. Lyu, Y. Hu, C.M. Cultraro, R.P. Finney,J.M. Kelley, S. Efroni, S.I. Greenblum, C.V. Nguyen, W.L. Rowe, S. Sharma, G. Wu,C. Yan, H. Zhang, Y.H. Chung, J.A. Kim, N.H. Park, I.H. Song, K.H. Buetow, Geneticvariations at loci involved in the immune response are risk factors for hepatocellu-lar carcinoma, Hepatology 52 (2010) 2034–2043.
29 Y. Huang, S. Tong, A.W. Tai, M. Hussain, A.S. Lok, Hepatitis B virus core promotermutations contribute to hepatocarcinogenesis by deregulating SKP2 and its target,p21, Gastroenterology 141 (2011) 1412–1421.
30 X. Lu, X. Feng, X. Man, G. Yang, L. Tang, D. Du, F. Zhang, H. Yuan, Q. Huang, Z. Zhang,Y. Liu, D. Strand, Z. Chen, Aberrant splicing of Hugl-1 is associated with hepatocel-lular carcinoma progression, Clin. Cancer Res. 15 (2009) 3287–3796.
31 X.Q. Wang, J.M. Luk, P.P. Leung, B.W. Wong, E.J. Stanbridge, S.T. Fan, AlternativemRNA splicing of liver intestine-cadherin in hepatocellular carcinoma, Clin. CancerRes. 11 (2005) 483–489.
32 J. Fung, C.L. Lai, M.F. Yuen, Hepatitis B and C virus-related carcinogenesis, Clin.Microbiol. Infect. 15 (2009) 964–970.
33 G. Giannelli, A. Mazzocca, E. Fransvea, M. Lahn, S. Antonaci, Inhibiting TGF-β signal-ing in hepatocellular carcinoma, Biochim. Biophys. Acta 1815 (2011) 214–223.
34 H.J. Baek, M.J. Pishvaian, Y. Tang, T.H. Kim, S. Yang, M.E. Zouhairi, J. Mendelson, K.Shetty, B. Kallakury, D.L. Berry, K.H. Shin, B. Mishra, E.P. Reddy, S.S. Kim, L.Mishra, Transforming growth factor-beta adaptor, beta2-spectrin, modulates cyclindependent kinase 4 to reduce development of hepatocellular cancer, Hepatology53 (2011) 1676–1684.
35 L. Min, B. He, L. Hui, Mitogen-activated protein kinases in hepatocellular carcinomadevelopment, Semin. Cancer Biol. 21 (2011) 10–20.
36 Y. Nakashima, T. Ono, A. Yamanoi, O.N. El-Assal, H. Kohno, N. Nagasue, Expressionof gap junction protein connexin32 in chronic hepatitis, liver cirrhosis, and hepato-cellular carcinoma, J. Gastroenterol. 39 (2004) 763–768.
37 T. Sakaguchi, S. Suzuki, H. Higashi, K. Inaba, S. Nakamura, S. Baba, T. Kato, H. Konno,Expression of tight junction protein claudin-5 in tumor vessels and sinusoidalendothelium in patients with hepatocellular carcinoma, J. Surg. Res. 147 (2008)123–131.
38 M.B. Zeisel, I. Fofana, S. Fafi-Kremer, T.F. Baumert, Hepatitis C virus entry into hepa-tocytes: molecular mechanisms and targets for antiviral therapies, J. Hepatol. 54(2011) 566–576.
39 T. Amann, U. Maegdefrau, A. Hartmann, A. Agaimy, J. Marienhagen, T.S. Weiss, O.Stoeltzing, C. Warnecke, J. Scholmerich, P.J. Oefner, M. Kreutz, A.K. Bosserhoff, C.Hellerbrand, GLUT1 expression is increased in hepatocellular carcinoma and pro-motes tumorigenesis, Am. J. Pathol. 174 (2009) 1544–1552.
40 K. Daskalow, D. Pfander, W. Weichert, N. Rohwer, A. Thelen, P. Neuhaus, S. Jonas, B.Wiedenmann, C. Benckert, T. Cramer, Distinct temporospatial expression patternsof glycolysis-related proteins in human hepatocellular carcinoma, Histochem. CellBiol. 132 (2009) 21–31.
41 P. Chafey, L. Finzi, R. Boisgard, M. Cauzac, G. Clary, C. Broussard, J.P. Pegorier, F.Guillonneau, P. Mayeux, L. Camoin, B. Tavitian, S. Colnot, C. Perret, Proteomic anal-ysis of beta-catenin activation in mouse liver by DIGE analysis identifies glucosemetabolism as a new target of the Wnt pathway, Proteomics 9 (2009) 3889–3900.
42 M. Tsuchiya, J.S. Parker, H. Kono, M. Matsuda, H. Fujii, I. Rusyn, Gene expression innontumoral liver tissue and recurrence-free survival in hepatitis C virus-positivehepatocellular carcinoma, Mol. Cancer 9 (2010) 74.
43 B.M. Bolstad, R.A. Irizarry, M. Astrand, T.P. Speed, A comparison of normalizationmethods for high density oligonucleotide array data based on variance and bias,Bioinformatics 19 (2003) 185–193.
44 Y.H. Yang, S. Dudoit, P. Luu, D.M. Lin, V. Peng, J. Ngai, T.P. Speed, Normalization forcDNA microarray data: a robust composite method addressing single and multipleslide systematic variation, Nucleic Acids Res. 30 (2002) e15.
45 Y. Hoshida, A. Villanueva, M. Kobayashi, J. Peix, D.Y. Chiang, A. Camargo, S. Gupta, J.Moore, M.J. Wrobel, J. Lerner, M. Reich, J.A. Chan, J.N. Glickman, K. Ikeda, M.Hashimoto, G. Watanabe, M.G. Daidone, S. Roayaie, M. Schwartz, S. Thung, H.B.

354 S.Y. Lee et al. / Genomics 99 (2012) 347–354
Salvesen, S. Gabriel, V. Mazzaferro, J. Bruix, S.L. Friedman, H. Kumada, J.M. Llovet,T.R. Golub, Gene expression in fixed tissues and outcome in hepatocellular carcino-ma, N. Engl. J. Med. 359 (2008) 1995–2004.
46 C.C. Chang, C.J. Lin, LIBSVM: a library for support vector machines, ACM TIST 2(2011) 27.
47 M. Kanehisa, M. Araki, S. Goto, M. Hattori, M. Hirakawa, M. Itoh, T. Katayama, S.Kawashima, S. Okuda, T. Tokimatsu, Y. Yamanishi, KEGG for linking genomes tolife and the environment, Nucleic Acids Res. 36 (2008) D480–D484.
48 L. Matthews, G. Gopinath, M. Gillespie, M. Caudy, D. Croft, B. de Bono, P. Garapati, J.Hemish, H. Hermjakob, B. Jassal, A. Kanapin, S. Lewis, S. Mahajan, B. May, E.Schmidt, I. Vastrik, G. Wu, E. Birney, L. Stein, P. D'Eustachio, Reactome knowledge-base of human biological pathways and processes, Nucleic Acids Res. 37 (2009)D619–D622.
49 S. Monti, P. Tamayo, J. Mesirov, T. Golub, Consensus clustering: a resampling-basedmethod for class discovery and visualization of gene expression microarray data,Mach. Learn. 52 (2003) 91–118.