identi cation of isotopes created in heavy-ion induced...
TRANSCRIPT

Identification of isotopes created in heavy-ion inducedfission reaction using PRISMA spectrometer
Cesar Lizarazo Sabogal1,2, E. Merchan2,3 L.F. Cristancho1,2
1Departamento de Fısica, Universidad Nacional de Colombia.
2Centro Internacional de Fısica, Bogota, Colombia.
3TU Darmstadt, Germany.
January 19, 2012
Abstract
The heavy-ion induced fission reaction 136Xe+238U, at 960 MeV beam energy, was studied using
the magnetic mass spectrometer PRISMA coupled to the AGATA-Demonstator γ-array. The present
work explains the data analysis of the information provided by PRISMA, which enables to identify
the produced isotopes in the reaction via the measurement of the mass-charge ratio, time of flight
(TOF), Length of the ion’s path, kinetic energy, charge state and other relevant data. The results of
the created isotopes from the inelastic channel of the reaction (i.e Xe isotopes) are outlined.
1

Contents
1 Introduction 4
2 Spectroscopic studies of heavy-ions 52.1 Nuclear reactions with heavy ions . . . . . . . . . . . . . . . . . . . . . . . . . . 52.2 γ-particle coincidence experiments . . . . . . . . . . . . . . . . . . . . . . . . . . 5
3 AGATA-PRISMA setup 63.1 AGATA . . . . . . . . . . . . . . . . . . . . . . . . . . . . . . . . . . . . . . . . 73.2 PRISMA . . . . . . . . . . . . . . . . . . . . . . . . . . . . . . . . . . . . . . . . 7
3.2.1 The start-detector . . . . . . . . . . . . . . . . . . . . . . . . . . . . . . 83.2.2 The Focusing Quadrupole . . . . . . . . . . . . . . . . . . . . . . . . . . 93.2.3 Magnetic Dipole . . . . . . . . . . . . . . . . . . . . . . . . . . . . . . . 93.2.4 PRISMA Focal Plane detectors . . . . . . . . . . . . . . . . . . . . . . . 10
4 PRISMA data analysis 114.1 Start Detector spectrum . . . . . . . . . . . . . . . . . . . . . . . . . . . . . . . 114.2 TOF vs. x fp spectrum . . . . . . . . . . . . . . . . . . . . . . . . . . . . . . . . 124.3 Nuclear Charge identification (Z) . . . . . . . . . . . . . . . . . . . . . . . . . . 124.4 A/q separation . . . . . . . . . . . . . . . . . . . . . . . . . . . . . . . . . . . . 144.5 Charge state selection . . . . . . . . . . . . . . . . . . . . . . . . . . . . . . . . 144.6 Mass Calibration . . . . . . . . . . . . . . . . . . . . . . . . . . . . . . . . . . . 164.7 Mass-Energy Matrix . . . . . . . . . . . . . . . . . . . . . . . . . . . . . . . . . 19
5 Perspectives 21
2

.A mi padre, que me dio la cabeza,A mi madre, que me dio el corazon.
3

1 Introduction
One of the more interesting and complex physical system in nature is the nucleus. Since itsdiscovery by Rutherford 80 years ago, it has been strongly investigated until present days. Itis known that protons and neutrons, the main constituents of the nucleus, are governed byquantum mechanical laws and interact via Coulomb and nuclear forces in a region of few fm(10−15m). However, when the number of particles in some nuclei increases, the distributionof the energy levels and the stability of the system rapidly change, phenomena as couplingof angular momentum between nucleons, non-local interactions or Pauli exclusion in nucleonsof the same species, among others, generate an interesting dynamics which is not completelyunderstood.Through the decades physicists have tried to provide the most complete description of thephysics involved in the nucleus using several nuclear models, each one explaining just some ofthe known phenomena. Nowadays, part of the investigation done in nuclear physics centersits effort in the design, execution and analysis of experiments that enable to discover newphenomena and test the proposed models to explain them, the present work is aimed in thisdirection.The collision between heavy ions offered the possibility to bring together two complex systems,exchanging energy, linear and angular momenta, enabling to explore unknown properties on thenuclear structure of the nucleus; it is well known that experiments of fusion-evaporation reac-tions using high resolution γ-detectors arrays have explored regions of large angular momentumand excitation energy [1], discovering interesting phenomena as single-particle or collective be-haviors in the nuclei, some of them previously theoretically predicted, leading the studies inthis field during the last decades.However, different aspects of nuclear dynamics still keep unexplored, as the behavior of isotopesclose to the neutron drip line of the nuclide chart, these cannot be found in nature, their highinstability is reflected in the short lifetime of its ground state. Nevertheless, these unexplorednuclei can provide important information to understand the stability and the dynamics of anuclear system with a certain number of protons and neutrons, that is why they are populatedartificially in laboratories using multi-nucleon transfer reactions.Many of the neutron-rich isotopes do not have a well known level scheme and present a lowcross section of population [2], modern experimental setups of large solid angle spectrometerscoupled to γ-detector arrays have been developed to look transitions of a particular nucleusvia particle-γ coincidences [1], as the PRISMA-AGATA setup [3],[4]. It was used to study theproduced isotopes in the heavy-ion induced fission reaction of 238U (at rest in thin targets of 1mg/cm2) bombarded with 136Xe ions at 960 MeV beam energy. In the present work the dataanalysis process from the set of detectors making up PRISMA is explained, and the results ofthe identified isotopes which arrive from the inelastic channel of the reaction mentioned beforeare outlined.
4

2 Spectroscopic studies of heavy-ions
To study the nuclear structure of isotopes created through nuclear reactions, it must be knownthe different possible collisions involved in the process. Also, from the experimental point ofview, the radiation emitted by a particular created isotope in the reaction, must be detectedand analyzed, in order to test (or to propose) a physical model for the emitter’s behavior. Next,both topics will be discussed.
2.1 Nuclear reactions with heavy ions
A nuclear reaction consist in an accelerated ion, the projectile, colliding with another nucleus atrest, the target. When the kinetic energy of the projectile is enough to overcome the Coulombbarrier of the target, created by its protons, both nuclei will interact via nuclear forces. In anuclear reaction with heavy-ions, three different kind of process have the most relevant crosssection, depending on the projectile energy, the number of nucleons in the projectile and target,and the impact parameter of the reaction [2]:
• Inelastic reactions, which consist in the collision of both nuclei via Coulomb or nuclearinteractions exciting each other without the exchange of nucleons. The projectile and thetarget are scattered and a fraction of the initial kinetic energy is transformed in excitationenergy of both nuclei, further released in γ-radiation (or internal conversion if is possible).
• Fusion-evaporation reactions have the highest cross section when the initial energy of theprojectile is not too high over the Coulomb barrier. Due to the small impact parameterin these reactions both nuclei fusion in a compound nucleus, the time of the interaction(∼10−18 s) is long enough to transform a large amount of the projectile’s kinetic energyin excitation energy of the internal degrees of freedom of the compound nucleus. Fewnucleons are rapidly released to get rid of the excess of energy, the final products areisotopes in high unstable spin states which de-excite emitting γ-rays until reach theirground states.
• Multi-nucleon transfer reactions, take place when the projectile energy increases muchmore over the Coulomb barrier. The impact parameter is similar as in fusion-evaporationreactions but, due to the high kinetic energy of the projectile, the interaction time betweenboth nuclei is shorter (∼ 10−22 s). The projectile briefly graze the target exchanging somenucleons, and a small amount of the kinetic energy is transformed to excitation energy.They are not completely understood yet because the mechanism of nucleons exchangebecomes more complicated as the number of transferred nucleons increases. Nonetheless,they enable to populate isotopes that cannot be obtained with another kind of nuclearreactions, as the nuclei in the region of neutron-rich isotopes, that is why it was used inthe experiment analyzed in the present work.
2.2 γ-particle coincidence experiments
Several kinds of isotopes are obtained after a nuclear reaction, each one is called an exit chan-nel. In the laboratory frame of reference, due to the conservation laws of momentum and
5

energy, these products will have non-zero linear momentum and will be at some excited state,consequently, they will start to de-excite emitting γ-radiation in flight. The de-excitation pro-cess of a nucleus provides valuable information on its nuclear structure, therefore, to detect asmuch radiation as possible, radiation detectors with high efficiency must be placed near to thecollision zone. Since the obtained spectra are a mixture of the γ-rays emitted by all the exitchannels, to study the physics of a particular isotope is necessary to make a discrimination,which consists in the assignment of a sub-set of detected γ-rays to one particular exit channel.In order to identify the emitter, the isotopes are not stopped in the reaction chamber, theycontinue their flight until reach an spectrometer that provides its mass and nuclear charge, i.ethe identity of the nucleus. With fast electronics in the modern experimental setups is possibleto establish coincidences between an identified isotope and a particular set of detected γ-rays,getting the wished assignment. This γ-particle coincidence experiments, known as thin-targetexperiments, are characterized because the target is a thin sheet with thickness no greater than10 mg/cm2.
3 AGATA-PRISMA setup
The experiment analyzed in the present work, was conducted in the Laboratori Nazionali diLegnaro, using the last generation γ-detector array AGATA coupled to the mass spectrometerPRISMA, in order to identify the sub-products of the reaction and some of their γ-transitions.An schematic overview is shown at Figure 1.
Figure 1: Scheme of AGATA-PRISMA setup respect to beam and target positions.
Due to the high photo-peak efficiency and the Doppler reconstruction advantages presentedby the AGATA array, together with the large solid angle of the magnetic mass spectrometerPRISMA, this setup is enable to investigate the radiation emitted by the weak channels of thenuclear reactions with high statistics and precision than its predecessor, the CLARA-PRISMAarray [5]. Below will be exposed the main features of the experimental setup.
6
3.1 AGATA
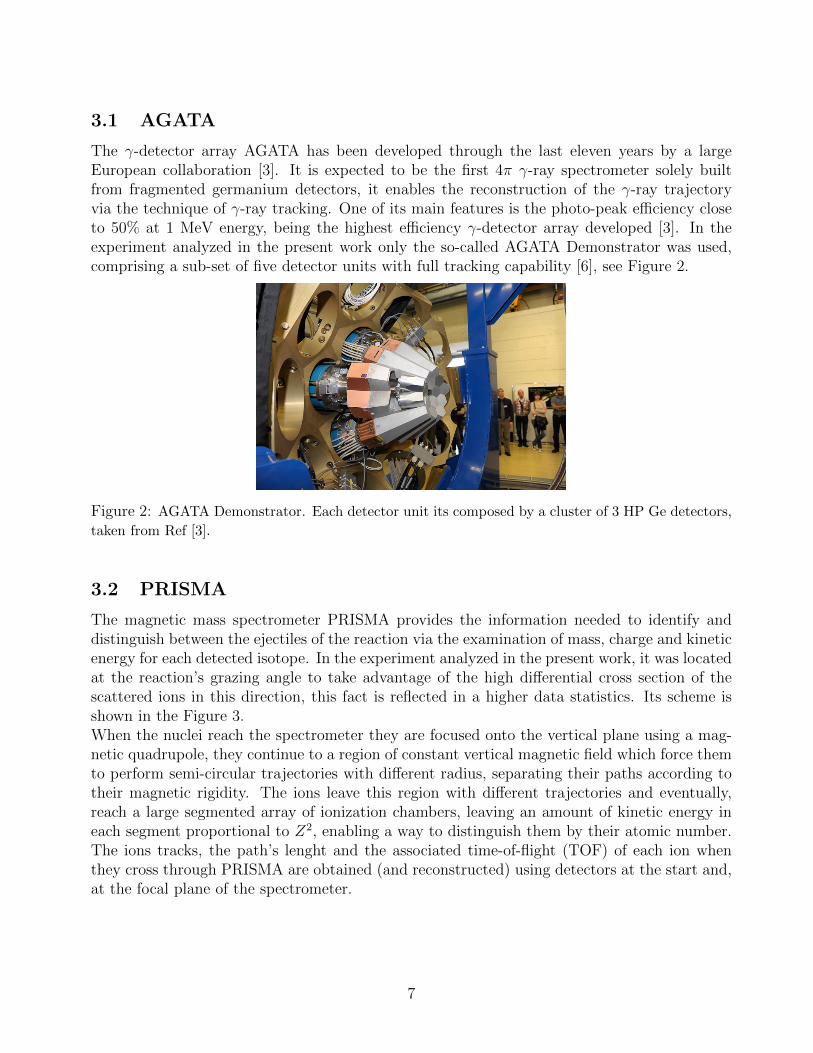
The γ-detector array AGATA has been developed through the last eleven years by a largeEuropean collaboration [3]. It is expected to be the first 4π γ-ray spectrometer solely builtfrom fragmented germanium detectors, it enables the reconstruction of the γ-ray trajectoryvia the technique of γ-ray tracking. One of its main features is the photo-peak efficiency closeto 50% at 1 MeV energy, being the highest efficiency γ-detector array developed [3]. In theexperiment analyzed in the present work only the so-called AGATA Demonstrator was used,comprising a sub-set of five detector units with full tracking capability [6], see Figure 2.
Figure 2: AGATA Demonstrator. Each detector unit its composed by a cluster of 3 HP Ge detectors,
taken from Ref [3].
3.2 PRISMA
The magnetic mass spectrometer PRISMA provides the information needed to identify anddistinguish between the ejectiles of the reaction via the examination of mass, charge and kineticenergy for each detected isotope. In the experiment analyzed in the present work, it was locatedat the reaction’s grazing angle to take advantage of the high differential cross section of thescattered ions in this direction, this fact is reflected in a higher data statistics. Its scheme isshown in the Figure 3.When the nuclei reach the spectrometer they are focused onto the vertical plane using a mag-netic quadrupole, they continue to a region of constant vertical magnetic field which force themto perform semi-circular trajectories with different radius, separating their paths according totheir magnetic rigidity. The ions leave this region with different trajectories and eventually,reach a large segmented array of ionization chambers, leaving an amount of kinetic energy ineach segment proportional to Z2, enabling a way to distinguish them by their atomic number.The ions tracks, the path’s lenght and the associated time-of-flight (TOF) of each ion whenthey cross through PRISMA are obtained (and reconstructed) using detectors at the start and,at the focal plane of the spectrometer.
7

Figure 3: PRISMA spectrometer scheme.
It is essentially divided into five sections, as is shown in Figure 3. Each section involved in thisprocess is described detailed below.
3.2.1 The start-detector
The start detector is placed at 25 cm from the target, see Figure 4. It is made up by a Micro-Channel-Type detector (MCP) with rectangular section of 80×100 mm2 to detect chargedparticles almost with 100% efficiency. In order to not to stop the ejectiles coming from thereaction, only a carbon foil is placed across the ions trajectories, the passage of the ions generatesionization on the carbon atoms and some electrons are taken out from the foil, these areconducted to the MCP pair which provides the following information:
• The x and y coordinates of isotopes when they cross the foil in the start detector, theseare used to reconstruct the ion trajectories (the spatial resolution is in the order of 1 mm).
• The start signal to measure the time of flight (TOF) of the isotopes, with temporal reso-lution of around 130 ps.
Figure 4 shows an schematic view (from above) of the start detector. The carbon foil center isplaced at 25 cm from the target.The grids covering the carbon foil and the external coils generate, respectively, an electric andmagnetic field which accelerate together the electrons released from the carbon atoms up to300 eV, in direction to the MCP detectors. These MCP are in a quasi-parallel configuration(called Chevron configuration) which increases the charge recollection. The produced charge iscollected by a position-sensitive anode.
8

Figure 4: Start Detector schematic overview, taken from Ref [7].
3.2.2 The Focusing Quadrupole
The Quadrupole is placed 50 cm after the target and has an active diameter of 30 cm and aneffective length of 50 cm. Its function is to focus the ions onto the vertical plane. Let the ionsvelocity vector point in positive z direction, with x and y defined as shown in Figure 5.
Figure 5: Focusing Quadrupole of PRISMA spectrometer, taken from Ref [2].
Defining the x, y coordinates as (0,0) in the centre of the focusing quadrupole xy plane, theforce due to the magnetics field always acts in the direction (x,−y), thus the net effect is toreduce the size of the distribution of the ions along the y axis and increase it along the x axis.
3.2.3 Magnetic Dipole
After the alignment of the ions in the focusing quadrupole, their trajectories are separatedaccording to their magnetic rigidity (ρm = mv/q) to allow the identification of the differentincoming isotopes, this is the main purpose of the magnetic dipole. Its main characteristics aresummarized below:
• Bending radius R ∼1.2 m in the center.
• The angle between the direction of entrance and exit is 60◦.
• Maximum magnetic field available B ∼1 T.
• Magnetic rigidity ρm = BR ∼1.2 Tm.
9

The magnetic dipole is a semicircular region with a constant vertical magnetic field, perpen-dicular to the ion’s plane of motion. The Lorentz force produced on the ions is then
F = ma⇒ qBv =mv2
R⇒ mv
q= BR⇒ R =
mv
qB=ρmB, (1)
with B the strength of the magnetic field produced by the dipole and R the radius of the ion’scircular trajectory. The equation 1 expresses that isotopes with different magnetic rigidityρm have a different associated radii R. After crossing the magnetic dipole the isotopes havedifferent trajectories depending on their charge and momentum.A magnetic dipole field in a semi-circular region, focuses in horizontal direction the trajectoriesof ions which have the same energy but a different angle of entrance. It is proved that thePRISMA magnetic dipole behaves like a lens [2] with the object and the image placed in thesame line which cross the vertex circle, as shown in Figure 6. The ions are focused in differentregions of the focal plane by their energy.
Figure 6: Scheme of circular-shape magnetic dipole operating as a lens, taken from Ref [2].
3.2.4 PRISMA Focal Plane detectors
The focal plane detectors are the MWPPAC and the ∆E-E detectors array. They are used toidentify the ions, providing the following information [2],[8]:
• Nuclear charge Z, with resolution of adequate to distinguish ions with Z up to 60 atenergies 2-10 MeV/amu.
• Kinetic energy of the isotopes.
• The timing stop signal, which together with the previously start signal, provides the ion’stime of flight (TOF). Associated resolution is 300-400 ps.
• Ion’s position on the focal plane, spatial resolution is around 1 mm in the x direction and2 mm in the y direction.
MWPPAC
The PRISMA focal plane its located 300 cm after the magnetic dipole. In this position a largearea detector is placed (100×13 cm2) which provides x, y positions and the stop signal, is calledMWPPAC (Multi-Wire Parallel Plate Avalanche Counters). It is made up by 10 independentsections of 10 cm placed adjacent to each other. Each section has a three electrode structure:
10
a central cathode and two wires planes (x and y anodes) orthogonally oriented to each other.
∆E-E detectors
An array of ionization chambers (IC) constitutes a ∆E-E system of detectors whose mainfunctions are enable to distinguish between ions with different atomic number Z and measuretheir kinetic energy. With the purpose of exploiting PRISMA’s large solid angle acceptance,the IC array has a considerable area, 100(x)×20(y) mm2, and an active depth of 120 cm. Withthese dimensions is expected that all ions must be stopped, because the ionization range islong enough even for heavy ions, with high kinetic energy, to be halted. The distribution ofthe array consists in 10 adjacent ∆E-E detectors system, each one composed by 4 IC slots(see Figure 3). The filling gas is methane with 99.9% purity, selected for its high electron driftvelocity.
4 PRISMA data analysis
From the point of view of data analysis an event is a set of information generated by PRISMAdue to the passage of each detected isotope, including the raw signals obtained directly fromthe detectors and complementary information generated via software. The next list summarizethe information supplied in each event.
• Time of flight (TOF): time of flight of the isotope between the MCP and the MWPPAC.
• Impact position at PRISMA’s focal plane (x fp): x coordinate of the isotope when itreaches the MWPPAC, located at the focal plane.
• Length (D): length of the ion’s path between the MCP and the MWPPAC.
• Radius (R): the bending radius for the ion’s trajectory inside the magnetic dipole.
• Isotope’s kinetic energy (IC): energy released in all the slots of the ionization chamber bythe isotope.
• ∆E: energy released by an isotope in the two first slots of the ionization chamber.
• A/q: Ratio between mass number and charge state of the isotope.
• γ-rays: γ-radiation detected in coincidences with the isotope, with Doppler correction.
The analysis was conducted with ROOT 5.24b and GammaWare 0.9 software. Next, theprocess to obtain the nuclear charge, the charge state and the nuclear mass for each one of thesub-products from the reaction analyzed by the spectrometer, will be exposed.
4.1 Start Detector spectrum
The MCP spectrum is a histogram of the isotopes (x, y) positions when they cross the carbonfoil of the start detector. It gives an idea of the input distribution of scattered ions arrivingto PRISMA. Some of them are stopped in a cross with four points of reference placed behindthe carbon foil, its shadow appears in the MCP spectrum because the stopped ions do notgenerate signals in the other detectors an do not generate an event in PRISMA. The cross
11

shadow provides an spatial frame of reference to perform the spatial calibration of the ionsentrance position. Figure 7 shows the MCP matrix, the counts for each (x, y) position arerepresented in a color scale, placed at the right side of the spectrum.
Figure 7: MCP spectrum. The shadow corresponds to the zone with low counts defining a cross with
4 points of reference.
4.2 TOF vs. x fp spectrum
TOF is deduced for each event from the difference time between the stop and start signals.The ten sections of the MWPPAC produce independent signals of position and time, eachone is calibrated to extract the signals in the adequate units, nanoseconds and millimeters,respectively. In some events one of the time signals could be lost, a default TOF value isassigned for those cases. Figure 8 shows, at left, the calibrated TOF vs. x fp spectrum of the10 sections, with all events (those with a lost signal appear in each section at top as a horizontalline with high counts). The wrongly processed events must be segregated from the subsequentanalysis, the procedure to do that is creating a graphical cut, i.e. a polygon enclosing onlythe desired events to work further (the black rectangle shown); at right, only the events whichsatisfies the condition of the cut, named tof350 cut, are plotted.
4.3 Nuclear Charge identification (Z)
When heavy charged particles cross trough matter, like the isotopes trough filling gas of theionization chambers, the differential energy lost per covered distance is expressed by the Bethe-Bloch formula as:
dE
dx= (eZ)2
N0zρ
Amε0
1
(βc)2
[ln
(2mc2β2
I(1− β2)
)− β2
](2)
where eZ is the isotope nuclear charge, v = βc its velocity; A, z and ρ are the mass, the atomicnumber and the density of the stopping material; N0 is Avogadro’s number and m the electronmass [2]. The energy of the isotope can be expressed as E = 1
2Mv2, for a non relativistic regime
12

Figure 8: Left, raw TOF vs x fp spectra and the graphical cut created to select good events. Right,
the 2D histogram of events that satisfies the tof350 cut. Each plot has its own color scale torepresent the counts.
(even for a slightly relativistic regime with β ≤0.1) this formula is aproximated as
dE
dx∝ MZ2
E, (3)
this expression shows that isotopes with different atomic number Z have different energy lossesin the same covered distance. Plotting the energy released in the two first slots of the IC array(∆E) versus the lost energy in all the slots (the nucleus energy E) is possible to distinguishions with different Z, as is shown in Figure 9.
Figure 9: ∆E vs E spectra. Some graphical cuts enclosing events with same Z.
When a nucleus has low kinetic energy , it is completely stopped in the two first slot of the IC,and the ∆E−E spectrum behaves as ∆E = E. If the kinetic energy of the events increases, the
13

ions, to be stopped, release their energy in more than the two first IC slots, consequently thebehavior of the ∆E−E spectrum changes for each isotope following the expression 3, separatingin diferent curves the ions with different Z, see Figure 9. The curve with the highest statisticscorresponds to the beam-isotopes (Xenon) because the inelastic scattering is the process withhigh cross section. To study the mass distribution and the charge state (number of electronsabsent) on events with same Z, some graphical cuts are created enclosing the wished events asis shown in Figure 9. In the following steps of the analysis is used the beam-cut, named Xe,to work only with Xe events.
4.4 A/q separation
With the cut performed in the last section nuclei with the same atomic number Z have beenselected, making it possible to work with a single element. The nuclei arriving to PRISMAusually present different values of charge-state, q, in order to find and calibrate their mass, itbecomes necessary to separate them by their A/q ratio. The motion of the ions in the magneticdipole is given by
mv2
R= qvB ⇒ m
q=RB
v, (4)
the nucleus mass m, is proportional to the mass number, A. The velocity v is deduced fromthe ratio between the path length (D) and the time of flight (TOF), both measured when anisotope goes from the MCP to the MWPPAC,
m
q≈ A
q=
RB
D/TOF. (5)
Due to the ions velocities, which are in the order of β ≈ 0.1 (it is simple to infer plotting thespectra of the ratio D/TOF ), the situation becomes slightly relativistic, then, the correctionto the last equation is
A
q=
RB
D/TOF0
, TOF0 = TOF√
1− β2 (6)
The spectrum of A/q against x fp has to show horizontal lines because the A/q ratio is notdependent of the impact position at the focal plane.
4.5 Charge state selection
Using the expressions
E =1
2mv2,
mv2
R= qvB,
14

Figure 10: A/q ratio versus x fp. Beam cut has been applied to work only with Xe isotopes.
of the kinetic energy and the Lorentz force experienced by the ions, respectively, it is obtained
2E
R= qvB,
E =qB
2(Rv)
E =qB
2
(RD
TOF
). (7)
If the spectrum of the energy E versus the product Rv is plotted, the isotopes with differentcharge state q, will be separated in lines with different slope, as expressed by the last equation.Using the beam-cut, it is possible to distinguish seven different charge states transmitted bythe scattered Xenon ions. The spectra is shown in Figure 11.
Acording to calculations performed previously it is known that the highest charge state trans-mitted by the beam isotopes is q = 40, this value corresponds to the line with the highestslope in Figure 11, the other values are deduced by subtraction of one unit in the charge statenumber to each adjacent line.
15

Figure 11: E versus Rv. Each cut represents different charge states for events belonging to thebeam cut created previously.
4.6 Mass Calibration
In Figure 12 are shown the A/q spectra for the events inside the cuts of each charge-stateidentified before.
Figure 12: A/q histogram for each charge-state selected, different peaks in each histogramcorresponds to different Xe isotopes populated, the highest peak always corresponds to 136Xe.
Each histogram of the different charge states shows one or various peaks, each one correspondsto the different Xe populated isotopes. Usually three peaks are visible, corresponding to 135Xe,136Xe and 137Xe. The tallest peak is related with 136Xe events because the inelastic scattering isthe highest cross-section process in the experiment, the 135Xe and 137Xe peaks must be placed,
16

respectively, at left and right of the former one because for a fixed value of q is satisfied
135
q<
136
q<
137
q.
In most of the cases the peaks are highly mixed and their centers were found fitting a three-Gaussian function,
f(x) = A0exp
(−0.5
[x− x0σ0
]2)+ A1exp
(−0.5
[x− x1σ1
]2)+ A2exp
(−0.5
[x− x2σ2
]2),
to each spectrum. Figure 13 shows the process for a particular charge state.
Figure 13: At top, A/q histogram for events with charge state q = 37. At bottom, Gaussiancenters found and the fit performed.
17

Table 1 show the comparisson between the 136Xe-peak position found for each charge statehistogram and the respective theoretical value.
q value A/q*100 (teor.) A/q*100 (exp.)
40 340.0 342.11(2)
39 348.7 350.52(1)
38 357.9 359.43(9)
37 367.5 369.02(1)
36 377.7 378.71(1)
35 388.5 389.01(2)
34 400.0 399.92(2)
Table 1: Comparison between A/q values found and the theoretical prediction for each chargestate histogram.
It is possible to obtain the mass spectrum performing a linear calibration for each A/q histogramtaking into account that the three peaks centers found must be placed at positions 135, 136and 137. Figure 14 shows the mass histograms obtained.
Figure 14: Mass spectra obtained for each charge state of Xe events.
The mass calibrations performed have the general form
Mass = b+m ∗(AoverQ ∗ q
100
),
the coefficients obtained are listed in the next table. The peak corresponding to 137Xe was notfound in neither in the spectra of charge states 39 and 40, that is why only two gaussians werefitted to the spectra.
18

charge state q m b
40 0.3349(2) 90.1±8.8
39 0.2976(2) 95.2±7.7
38 0.3393(1) 89.7±0.4
37 0.3137(3) 93.13±1.1
36 0.3326(2) 90.72±10.1
35 0.3098 93.80
34 0.2684 99.50
Table 2: Calibration coefficients found for each charge state histogram
4.7 Mass-Energy Matrix
Once the mass spectra is obtained, it is possible to check the γ-rays in coincidence with eachmass found, a mass energy-matrix is shown in Figure 15.
Figure 15: Mass-Energy matrix of Xe events.
Some Projection of mass-energy matrix in the energy axis for bins around different masses areshown below.
19

Figure 16: Projection of mass-energy matrix in the energy axis for bins around A=137.
Figure 17: Projection of mass-energy matrix in the energy axis for bins around A=137.
.
20

Figure 18: Projection of mass-energy matrix in the energy axis for bins around A=137.
5 Perspectives
To explore all the exit channels in the 136Xe+238U reaction the mass calibration process has tobe carried out for each nucleus with different atomic number Z, the analysis of the counts ineach produced isotope can provide information of the cross section of a particular channel inthe reaction performed.
21

References
[1] S. Szilner et al. Multinucleon transfer reactions in closed-shell nuclei. Phys. Rev. C, 76,2007.
[2] A. Gottardo. Study of the neutron-rich nuclei with the CLARA-PRISMA setu and first testof the ancillary detector DANTE. PhD thesis, Universita degli study dy Padova, 2007.
[3] http://www-w2k.gsi.de/agata/overview.htm.
[4] http://www.lnl.infn.it/ prisma/it/index.html.
[5] A. Latina E. Farnea. Monte carlo simulations of the agata demonstrator array coupled tothe prisma magnetic spectrometer. Technical report, INFN Sezione di Padova, 2007.
[6] D. Mengoni. Agata demonstrator at lnl: the coupling with the prisma magnetic spectrom-eter. Technical report, LNL, 2010.
[7] G.Montagnoli et al. The large-area micro-channel plate entrance detector of the heavy-ionmagnetic spectrometer prisma. Nucl. Inst. and Meth. A, 2005.
[8] A.M Stefanini et al. The heavy-ion magnetic spectrometer prisma. Nucl. Inst. and Meth.A, 2002.
22