icici group: strategy & performance · icici bank's filings with the securities and...
TRANSCRIPT

ICICI Group: Strategy & Performance
February 2010

2
Certain statements in these slides are forward-looking statements. These statements are based on management's current expectations and are subject to uncertainty and changes in circumstances. Actual results may differ materially from those included in these statements due to a variety of factors. More information about these factors is contained in ICICI Bank's filings with the Securities and Exchange Commission.
All financial and other information in these slides, other than financial and other information for specific subsidiaries where specifically mentioned, is on an unconsolidated basis for ICICI Bank Limited only unless specifically stated to be on a consolidated basis for ICICI Bank Limited and its subsidiaries. Please also refer to the statement of unconsolidated, consolidated and segmental results required by Indian regulations that has been filed with the stock exchanges in India where ICICI Bank’s equity shares are listed and with the New York Stock Exchange and the US Securities Exchange Commission, and is available on our website www.icicibank.com.

3
Agenda
Market developments
Financial performance
Strategy & execution

4
Key economic indicators
Industrial production grew 11.7% in November 2009, average growth of 10.4% in August-November 2009
Strong capacity utilization in key sectors like steel, aluminium and cement
Increased momentum in home, car and commercial vehicle sales
Strong fundamentals driven by domestic demand
Q2-2010 GDP growth at 7.9% compared to 6.1% in Q1-2010

5
Liquidity, interest rates & credit growthComfortable systemic liquidity: About Rs. 1.0 trillion lent to RBI on a daily basis
Increase in CRR by 75 bps will reduce systemic liquidity by about Rs. 360 billion
10 year G–sec yields increased by about 45 bps in Q3-2010
WPI inflation increased to 7.3% for December 2009Inflation figures continue to be impacted by base effect and high food pricesRBI’s projection at 8.5% by end March 2010
Non-food credit growth muted at 14.4% on Jan 15 RBI’s revised projection at 16% for FY2010

6
Agenda
Market developments
Financial performance
Strategy & execution

7
Strategy for FY2010
Position balance sheet for next phase of growth
Cost• Keep stringent control on
operating expenses
Credit• Focus on select credit
opportunities and reduce unsecured retail portfolio
CASA• Increase the proportion of low
cost CASA deposits• Reduce the proportion of
wholesale deposits
Capital• Maintain high capital adequacy

8
Progress in execution of strategy
Robust growth in CASA deposits
Reduction in operating expenses
Sharp reduction in retail NPL formation
Increase in net interest margin to 2.6%
Substantial progress in
achievement of near term
targets
Well capitalized for a period of sustained growth

9
-50
100150200250300350400450500550
Mar-03
Mar-04
Mar-05
Mar-06
Mar-07
Mar-08
Mar-09
Dec-09
Focus on CASA deposits
1,419
28.7%
Mar 2009
1,6261,262755614562469446Branches
39.6%26.1%21.8%22.7%24.3%23.0%15.5%CASA ratio
Dec 2009
Mar 2008
Mar 2007
Mar 2006
Mar 2005
Mar 2004
Mar 2003
CAGR 47%
Target to reach about 2,000 branches by April 2010
Sav
ings
dep
osi
ts (R
s. b
n)

10
11.5%13.5%13.6%13.8%14.3%14.4%14.6%
16.8%18.3%
19.4%
0.0%
5.0%
10.0%
15.0%
20.0%
Tier-1 Tier-2
High capitalisation levelsC
apita
l ad
equa
cy r
atio
ICICI Bank
Other top 9 Indian banks
As per the latest available financials(December 30, 2009)

11
Stringent cost control
68.35
FY2009
42.14
9M-2010
79.7265.0247.2533.7125.98Operating expenses1
FY2008FY2007FY2006FY2005FY2004Rs. bn
Co
st/a
vera
ge a
sset
s
1. Including DMA
2.2%
1.8%
1.6%
2.3%
2.5%
2.4%
2.3%
1.5%
1.7%
1.9%
2.1%
2.3%
2.5%
2.7%
FY2004 FY2005 FY2006 FY2007 FY2008 FY2009 9M-2010

12
Domestic credit strategy
Enhanced focus on growth going forward
Participate in consumption growth through mortgages, and vehicle loans
Capitalise on growing infrastructure and corporate project pipeline
Increase market share in commercial banking
Further reduce the proportion of unsecured personal loans and credit cards

13
Strategy for international business
Retail business
Build a stable & diversified funding baseDevelop retail deposit franchise by leveraging low cost technologyTap long term sources of funding like bonds and syndicated loans to diversify funding
Funding franchise
Focus on the needs of non-resident IndiansRemittances into IndiaSavings & Investment products
Lending to Indian corporatesLeverage domestic relationships
Trade financeIncluding select non-India exposures linked to imports to India
Lending & trade

14
Non-banking subsidiaries strategy
ICICI Life
Focus on consolidating position as the largest private sector life insurer, while maintaining new business profit margins and cost efficiencies
ICICI GeneralFocus on maintaining leadership, while improving underwriting profitability
ICICI AMCMaintain market position among the top three mutual funds
ICICI Securities
Capitalize on retail broking platform and market opportunities to increase revenues and profitability

15
Agenda
Market developments
Financial performance
Strategy & execution

16
Overview: Q3-20106% increase in standalone profit after tax to Rs. 11.01 billion in Q3-2010 from Rs. 10.40 billion in Q2-2010
Standalone profit after tax lower compared to Rs. 12.72 billion in Q3-2009 due to absence of treasury income in Q3-2010 compared to treasury income of Rs. 9.76 billion in Q3-2009
Standalone profit after tax of Rs. 30.19 billion in 9M-2010 compared to Rs. 30.14 billion in 9M-2009
Consolidated profit after tax increased by 18% to Rs. 33.28 billion in 9M-2010 from Rs. 28.29 billion in 9M-2009

17
Continued improvement in operating trends
Net interest income increased to Rs. 20.58 billion in Q3-2010 from Rs. 19.90 billion in Q3-2009 and Rs. 20.36 billion in Q2-2010
Net interest margin increased from 2.4% in Q3-2009 and 2.5% in Q2-2010 to 2.6% in Q3-2010
Fee income increased to Rs. 14.22 billion in Q3-2010 from Rs. 13.47 billion in Q3-2009 and Rs. 13.87 billion in Q2-2010

18
Continued improvement in operating trends
Continued reduction in operating expenses20% year-on-year and 3% sequential decrease in operating & DMA expenses to Rs. 13.42 billion in Q3-2010 from Rs. 16.80 billion in Q3-2009 and Rs. 13.79 billion in Q2-2010Cost/average asset ratio for Q3-2010 at 1.5% compared to 1.8% for Q3-2009
Total provisions decreased sequentially to Rs. 10.02 billion in Q3-2010 from Rs. 10.71 billion in Q2-2010

19
Balance sheet highlightsCASA ratio of 39.6% at December 31, 2009 compared to 27.4% at December 31, 2008 and 36.9% at September 30, 2009
Increase of about Rs. 100.00 billion in savings deposits during April-December 2009Year-on-year CASA deposits growth of 36.4%
Net NPA ratio of 2.19% at December 31, 2009; at the same level as September 30, 2009
20
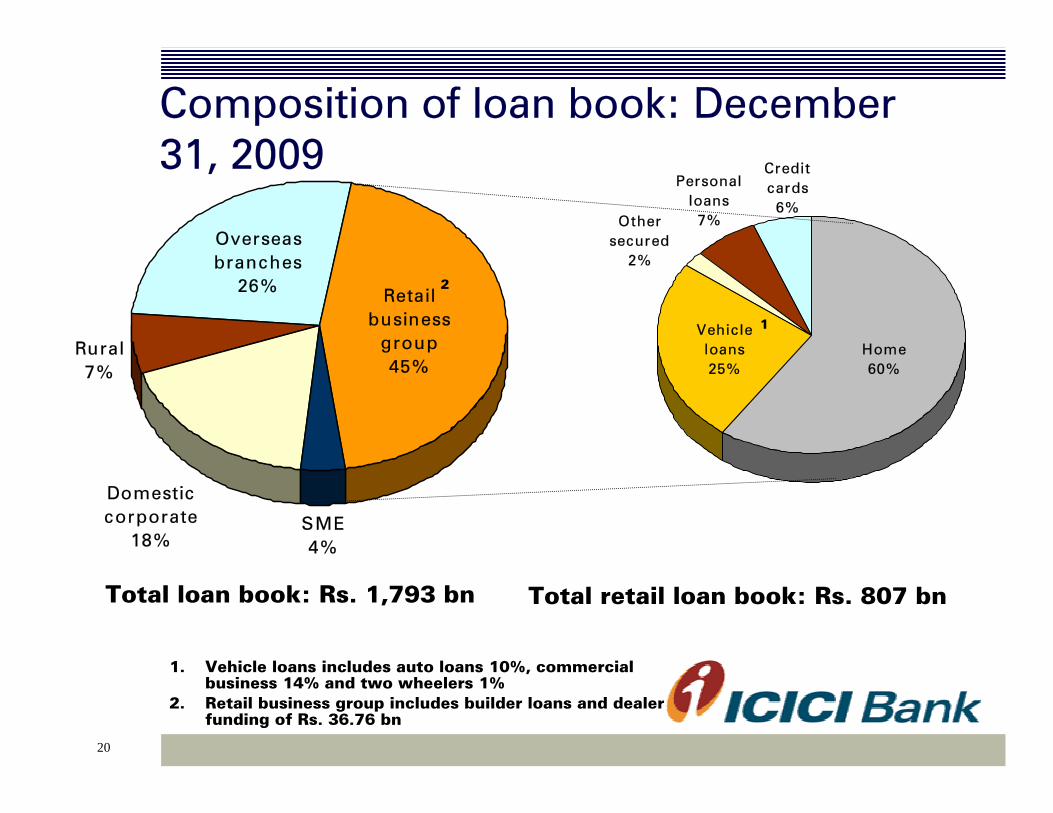
Credit cards
6%Other
secured2%
Personal loans
7%
Home60%
Vehicle loans25%
Composition of loan book: December 31, 2009
SME4%
Rural7%
Retail business
group45%
Overseas branches
26%
Domestic corporate
18%
1. Vehicle loans includes auto loans 10%, commercial business 14% and two wheelers 1%
2. Retail business group includes builder loans and dealer funding of Rs. 36.76 bn
Total loan book: Rs. 1,793 bn Total retail loan book: Rs. 807 bn
2
1

21
Key ratios
1.51.51.81.8Cost/average assets (incl. DMA) 2
27.4%
37.7
30.3
2.4
449
45.3
10.2
Q3-2009
36.9%
36.1
36.4
2.5
460
37.1
8.1
Q2-2010
38.341.4Fee/income
28.7%
43.4
2.4
445
33.8
7.7
FY2009
469Book value (Rs.)
39.6%
36.2
2.6
39.2
8.4
Q3-2010
CASA ratio
Cost/income (incl. DMA)
Net Interest Margin 2
Weighted avg EPS (Rs.) 2
Return on average net worth1, 2
(Percent)
1. Based on quarterly average net worth.2. Annualised for all interim periods

22
2.19%
46.67
50.28
96.95
Jun 30, 2009
2.19%
45.58
49.13
94.71
Sep 30, 2009
14.36Outstanding general provision on standard assets
1.96%
46.19
53.10
99.29
Mar 31, 2009
2.19%
44.16
46.54
90.70
Dec 31, 2009
Net NPA ratio
Net NPAs
Less: Cumulative provisions
Gross NPAs
(Rs. in billion)Asset quality and provisioning
Gross retail NPLs at Rs. 59.75 bn and net retail NPLs at Rs. 27.78 bn at December 31, 200951% of net retail NPLs are from unsecured productsNet restructured loans of Rs. 53.38 bn at December 31, 2009

23
Thank you
24
Annexure

25
Unconsolidated financials

26
Profit & loss statement
-9.85(0.26)2.972.299.764.43- Treasury income
23.69
0.20
0.31
13.11
37.31
2.771
14.22
16.73
20.58
Q3-2010
27.71
0.54
1.03
15.77
45.05
1.92
13.47
25.15
19.90
Q3-2009
67.70
1.58
4.76
47.54
121.58
5.20
51.81
59.30
62.28
9M-2009
24.35
0.46
0.21
13.58
38.60
1.40
13.87
18.24
20.36
Q2-2010
73.33
1.19
0.80
41.34
116.66
4.741
41.28
55.87
60.79
9M-2010
(17.2)%159.70Total income
(14.5)%
(63.0)%
(69.9)%
(16.9)%
44.3%
5.6%
(33.5)%
3.4%
Q3-o-Q3
Growth
5.29DMA expenses
89.25
2.10
63.06
6.36
65.24
76.03
83.67
FY2009
Operating profit
Lease depreciation
Operating expenses
- Lease and other income
- Fee income
Non-interest income
NII
(Rs. in billion)
1. Includes profit of Rs. 2.03 billion related to transfer of merchant acquiring operations to new entity 81% owned by First Data.

27
Profit & loss statement
12.72
4.91
17.63
10.08
27.71
Q3-2009
30.14
10.32
40.46
27.24
67.70
9M-2009
10.40
3.24
13.64
10.71
24.35
Q2-2010
11.01
2.66
13.67
10.02
23.69
Q3-2010
30.19
9.17
39.36
33.97
73.33
9M-2010
(14.5)%89.25Operating profit
(0.6)%38.08Provisions
37.58
13.59
51.17
FY2009
(13.4)%
(45.8)%
(22.5)%
Q3-o-Q3
growth
Profit before tax
Profit after tax
Tax
(Rs. in billion)

28
Balance sheet: Assets(Rs. in billion)
1. Investment in security receipts of asset reconstruction companies at December 31, 2009 was Rs. 35.45 bn.
Credit derivative exposure (including off balance sheet exposure) of Rs. 51.88 bn at December 31, 2009 (underlying comprises Indian corporate credits).
Including impact of exchange rate movement
9.9%752.62778.34633.87684.84- SLR investments
9.0%121.00121.00120.97111.02- Equity investment in
subsidiaries
3,744.10
282.68
2,125.21
1,065.38
270.83
Dec 31, 2008
3,663.74
262.82
1,908.60
1,199.65
292.67
Sep 30, 2009
15.8%1,234.091,030.58Investments
3,562.28
229.72
1,792.69
305.78
Dec 31, 2009
(4.9)%
(18.7)%
(15.6)%
12.9%
Y-o-Y growth
3,793.01
279.66
2,183.11
299.66
Mar 31, 2009
Total assets
Fixed & other assets
Advances
Cash & bank balances

29
Equity investment in subsidiaries
111.02
0.14
0.05
0.61
0.87
1.58
3.00
10.96
10.97
23.25
23.70
35.90
Dec 31, 2008
120.97
0.14
0.05
0.61
0.87
1.58
3.00
10.96
11.12
23.25
33.50
35.90
Mar 31, 2009
11.12ICICI Home Finance
23.25ICICI Bank UK
0.61ICICI AMC
33.50ICICI Bank Canada
3.00ICICI Bank Eurasia
10.96ICICI Lombard General Insurance
1.58ICICI Securities Primary Dealership
0.14Others
121.00
0.05
0.87
35.93
Dec 31, 2009
Total
ICICI Venture Funds Mgmt
ICICI Securities Limited
ICICI Prudential Life Insurance
(Rs. in billion)

30
Balance sheet: Liabilities
32.4%510.54493.18410.36385.72- Savings
44.6%271.93236.12216.32188.10- Current
(7.7)%914.79997.73928.05990.69Borrowings
3,744.10
158.91
2,090.65
3.50
489.22
11.13
500.35
Dec 31, 2008
3,562.28
145.06
1,976.53
3.50
511.26
11.14
522.40
Dec 31, 2009
(4.9)%
(8.7)%
(5.5)%
-
4.5%
0.1%
4.4%
Y-o-Y growth
3,793.01
182.65
2,183.48
3.50
484.20
11.13
495.33
Mar 31, 2009
3,663.74
171.61
1,978.32
3.50
501.44
11.14
512.58
Sep 30, 2009
Total liabilities
Other liabilities
Deposits
Preference capital
- Reserves
- Equity capital
Net worth
(Rs. in billion)
Credit/deposit ratio of 71% on the domestic balance sheet at December 31, 2009
Figures include impact of exchange rate movement

31
Composition of borrowings
997.73
487.82
16.28
504.10
234.42
259.21
493.63
Sep 30, 2009
503.25 564.35 Overseas
143.80200.88 - Other borrowings
267.74 225.46 - Capital instruments
914.79
487.50
15.75
411.54
Dec 31, 2009
990.69
547.87
16.48
426.34
Dec 31, 2008
Total borrowings
- Other borrowings
- Capital instruments
Domestic
(Rs. in billion)
Capital instruments constitute 65% of domestic borrowings
Figures include impact of exchange rate movement

32
Capital adequacy (Basel II)
739.11
2,501.21
3,240.32
141.67
431.42
573.09
Sep 30, 2009
4.4%
13.3%
17.7%
3,081.513,564.63Total RWA
2,363.772,758.15- On balance sheet
717.74806.48- Off balance sheet
159.30
438.44
597.74
131.59
421.96
553.55
3.7%
11.8%
15.5%
Mar 31, 2009
5.2%
14.2%
19.4%
Dec 31, 2009
- Tier II
- Tier I
Total Capital
Rs. billion except %

33
Overseas subsidiaries

34
Loans & advances
52%
Asset backed securi ties
2%
Other assets & investments
4%
Ind ia l inked investments
6%
Cash & l iquid securi ties
11%
Bonds/notes o f financ ial
insti tutions25%
`
ICICI Bank UK asset profile1
1. Includes cash & advances to banks and certificates of deposit
2. Includes US$ 169 mn of India-linked credit derivatives3. Includes securities reclassified to loans & advances in
FY20094. Does not include US$ 156 mn of ABS reclassified as
loans & receivable in FY2009
Total assets:USD 7.5 billion
2
4
Net profit of USD 7.3 million in Q3-2010
Capital adequacy ratio at 17.0%
Net MTM write-back of USD 14.1 million (post-tax) in reserves in Q3-2010
3

35
ICICI Bank UK liability profile
Total liabilities:USD 7.5 billion
Proportion of retail term deposits in total deposits at 64% at December 31, 2009
Long term Debt15%
Net worth8%
Term deposi ts41%
Other l iab i l i ties4%
Syndicated loans &
interbank borrowings
10%
Demand deposi ts
22%`

36
ICICI Bank Canada asset profile
1. Includes cash & advances to banks, government securities and banker’s acceptances/depository notes
2. Includes CAD 132 mn of India-linked credit derivatives
Total assets:CAD 5.8 billion
1
2
Net profit of CAD 4.8 million in Q3-2010
Capital adequacy ratio at 23.5%
Loans to customers
61%
Cash & l iquid securi ties
13%
Federal ly insured
mortgage15%
Other assets & investments
6%Asset backed securi ties
2% Ind ia l inked investments
3%
`

37
ICICI Bank Canada liability profile
Total liabilities:CAD 5.8 billion
ICICI Bank Canada balance sheet funded largely out of retail term deposits
Borrowings1%
Net worth17%
Demand deposi ts
14%
Other l iab i l i ties
1% Term deposi ts67%
`

38
Corporate bonds
4%
Retail loans15%
Other assets &
investments3%
Cash & liquid securit ies
24%
Loans to corporates &
banks54%
ICICI Bank Eurasia
• Total borrowings of USD 344 million at December 31, 2009
• Capital adequacy of 19.8% at December 31, 2009
• Financial breakeven in 9M-2010
Total assets:USD 459 million
1. Includes cash, balances with central bank, nostrobalances, govt bonds & placements with banks
1

39
Domestic subsidiaries

40
ICICI Home Finance
Net profit of Rs. 0.44 billion in Q3-2010 compared to Rs. 0.28 billion in Q2-2010
Deposits27%
Borrowings64%
Shareholders funds 9%
Loans 88%
Investments 10%
Fixed & other assets 2%
Total assets/liabilities: Rs. 138 billion
Capital adequacy ratio of 13.9% at December 31, 2009Net NPA ratio: 1.3%

41
ICICI Life
8.3%
536.19
0.07
18.9%
2.82
40.31
24.11
14.95
Q3-2010
12.0%
284.45
(1.35)
19.0%
1.90
31.73
20.04
10.02
Q3-2009
Expense ratio
Assets Under Management
NBP margin
New Business Profit (NBP)
Renewal premium
APE
Statutory Profit/(Loss)
Total premium
(Rs. in billion)
Continued market leadership in private sector1
Statutory loss of Rs. 0.98 billion in 9M-2010
1. During April - December 2009 on new business retail weighted received premium basis.

42
ICICI General
Continued market leadership in private sector2
1. Excluding remittances from third party motor pool
2. During April - December 2009
0.43
0.45
8.33
Q3-2010
-
0.01
7.97
Q3-2009
PBT
PAT
Gross premium1
(Rs. in billion)

43
Other subsidiaries(Rs. billion)
0.40
0.09
0.16
0.37
Q3-2010
(0.14)
0.04
3.02
-
Q3-2009
ICICI Prudential Asset Management Company
ICICI Securities Ltd.
Profit after tax
ICICI Venture
ICICI Securities PD