i iv. aircraft operations and traffic forecasts i 1 ... · i i i i i i i i i i i i i i i i i i iv....
TRANSCRIPT
I I I I I I I I I I I I I I I I I I
IV. AIRCRAFT OPERATIONS AND TRAFFIC FORECASTS
1. INTRODUCTION
Over the past several years, there have been a number of activity forecasts prepared for Phoenix Sky Hm'bor International Airport (PHX). Among the more important forecasts are:
(1) 1984-Maricopa Association of Governments, Aviation Forecasts, prepared for the Regional Aviation System Plan.
(2) 1985 - DWL, Forecasts of Aviation Activity and Terminal Area Facilities (amended 1987), prepared 10r the analysis of Terminal 4.
(3) 1986 - FAA, Phoenix Hub Forecasts.
(4) 1987 - Coffman Associates, F.A.R. Part 150 Noise Compatibility Study.
(5) 1988 - FAA, Terminal Area Forecasts.
To ensure consistency with other planning programs, these previous forecasts have been reviewed, and the forecasts presented here draw from the material in them.
2. DOMESTIC AIR CARRIER FORECASTS
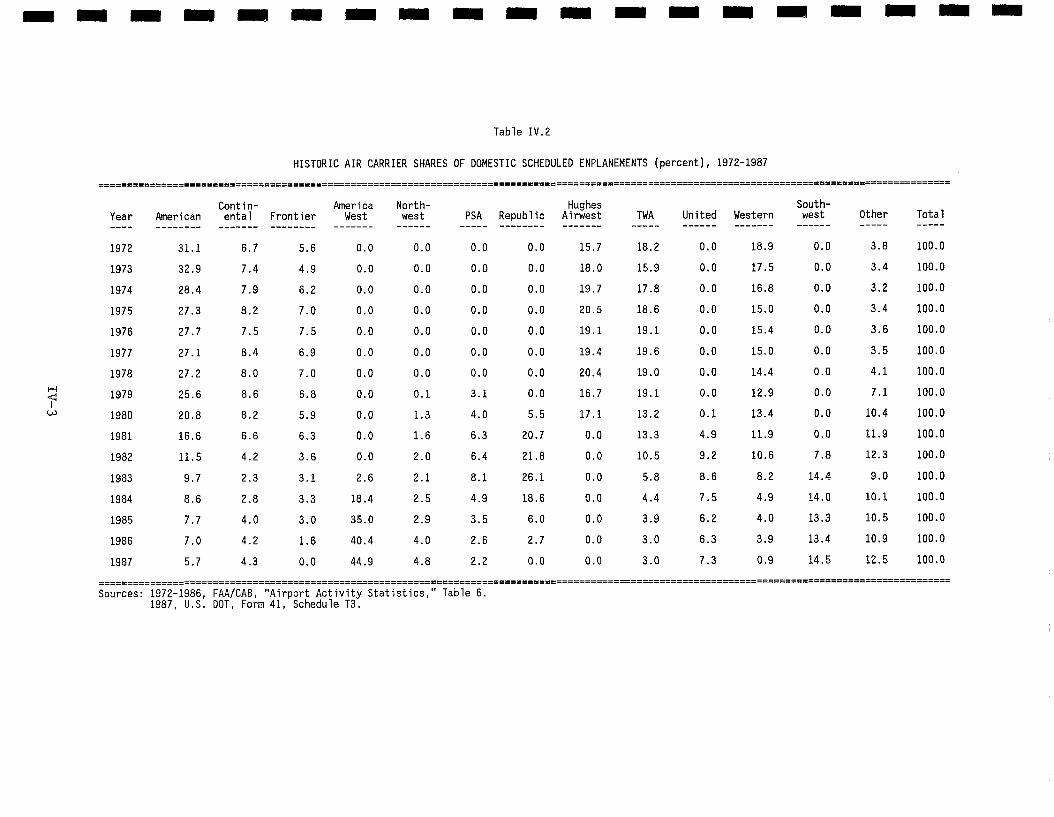
Table IV. 1 presents the historical level of domestic scheduled passenger enplanements for the 1972-87 period. Throughthe period, enplanement growth at the airport was strong. The one weak period was in 1980-81, when the PATCO strike, general economic recession, substantial fare increases due to higher fuel prices and the acquisition of Hughes Airwest by Republic Airlines took place. Not shown in Table IV. 1 is the fact that while traffic growth has been steady, there has been considerable change in the distribution of traffic and services between individual carders.
Table IV.2 illustrates these major shifts which are caused by old carders merging and realigning their networks, .and new carriers beginning service. Perhaps no other airport has experienced as great a variety of carrier/service changes over the past decade as Sky Harbor. These changes reinforce the need for flexible facility planning that can accommodate a wide range of activities.
Another measure of passenger activity is passenger originations. Passenger originations represent only those passengers beginning their air trip at Phoenix, thus excluding passengers using the airport for connecting flights. Table IV.3 shows historical data on originating passengers for domestic scheduled air carder airlines from 1972-86.
IV-l

Table IV.I
AIR CARRIER ERPLANEMENTS
HISTORIC DOMESTIC SCHEDULED AIR CARRIER 1972-1987
ERPLAXEMENTS
Year Enplianements
1972 1,704,303
1973 1,907,784
1974 2,00,5,6.26
1975. 21,033,049
1976. 2,273.,658
1977 2,533,728
1978 3,054,186
1979, 3,586,5.33
1980 3,378,052
198.1 3,39'4,485
1982 3,946,094
1983 4,7919,6.37
198,4 5,745,0:46
1985, 6,69'9,363
1986 7,688,59'4
1987 8,748,423.
Sources: 1972-19S6, FAA/CAB, "Airport Activity Statistics." 1987, ~.S. DOT, Form 41, Schedule T3.
IV-2
I I I I I I I I I I I I I m ~
I I I I !
m mm n m m m n m m m m mmm mm m m m m m m
F-4
Table IV.2
HISTORIC AIR CARRIER SHARES OF DOMESTIC SCHEDULED ENPLANEMENTS (percent), 1972-1987
Contin- America North- Hughes South- Year American enta I Front ier West west PSA Republic Ai rwest TWA United Western west Other Total ..............................................................................................
1972 31.1 8.7 5.6 0.0 0.0 0.0 0.0 15.7 18.2 0.0 18.9 0.0 3.8 100.0
1973 32.9 7.4 4.9 0.0 0.0 0.0 0.0 18.0 15.9 0.0 17.5 0.0 3.4 100.0
1974 28.4 7.9 6.2 O.O 0.0 0.0 0.0 19.7 17.8 0.0 16.8 0.0 3.2 100.0
1975 27.3 8.2 7.0 0.0 0.0 0.0 0.0 20.5 18.6 0.0 15.0 0.0 3,4 100,0
1976 27.7 7.5 7.5 0.0 0.0 0.0 0.0 19.1 19.1 0.0 15.4 0.0 3.6 100.0
1977 27.1 8.4 6.9 0.0 0.0 0.0 0.0 19.4 19.6 0.0 15.0 0.0 3.5 100.0
1978 27.2 8.0 7.0 0.0 0.0 0,0 0,0 20,4 19.0 0,0 14,4 0.0 4.1 100.0
1979 25.6 8.6 6.8 0.0 0.1 3.1 0.0 16.7 19.1 0.0 12.9 0.0 7.1 100.0
1980 20.8 8.2 5.9 0.0 1.3 4.0 5.5 17.1 13.2 0.1 13.4 0.0 10.4 100.0
1981 16.6 6.6 6.3 0.0 1,6 6.3 20.7 0,0 13.3 4.9 11.9 0.0 11.9 100.0
1982 11.5 4.2 3.6 0.0 2.0 6.4 21.8 0.0 10.5 9.2 10.8 7.8 12.3 100.0
1983 9.7 2.3 3.1 2.6 2.1 8.1 28.1 0.0 5.8 8.8 8.2 14.4 9.0 100.0
1984 8.6 2,8 3,3 18.4 2.5 4.9 18.6 0.0 4.4 7.5 4.9 14.0 10.1 100.0
1985 7.7 4.0 3.0 35.0 2.9 3.5 6.0 0.0 3.9 6.2 4.0 13.3 10.5 100.0
1988 7.0 4.2 1.6 40.4 4.0 2.8 2.7 0.0 3.0 6.3 3.9 13.4 10.9 100.0
1987 5.7 4.3 0.0 44.9 4.8 2.2 0.0 0.0 3.0 7.3 0.9 14.5 12.5 100.0
Sources: 1972-1986, FAA/CAB, "Airport Act iv i ty Stat ist ics," Table 6. 1987, U.S. DOT, Form 41, Schedule T3.
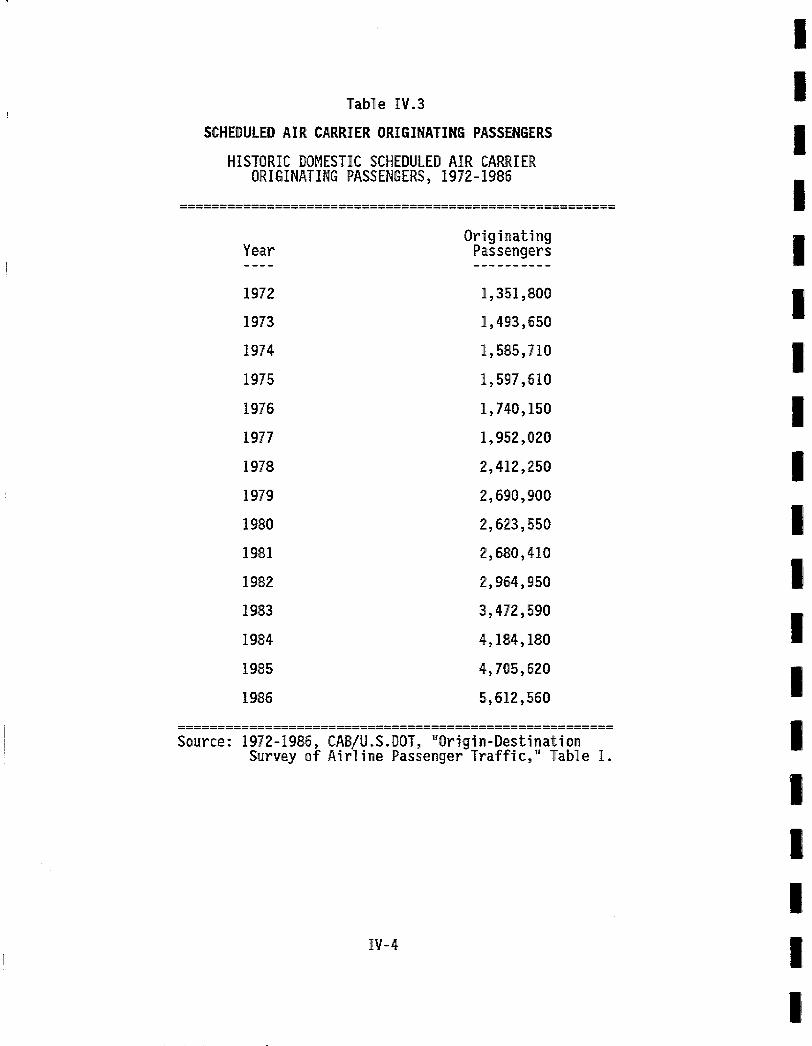
Table IV.3
SCHEDULED AIR CARRIER ORIGINATIHG PASSENGERS
HISTORIC DOMESTIC SCHEDULED AIR 'CARRIER ORIGINATING PASSENGERS, 1972-1986
Originating Year Passengers
1972 1,351,800
1973 1,493,6.50
1974 1,585,710
1975 1,59,7,610
1976 1,740,150
1977 1,952,020
1978 2,412,250
1979 2,690,.900
19,80 2,623,550
1981 2,680,410
1982 2,964,950
1983. 3,472,590
1984 4,184,180
1985 4,705,620
1986 5,612,560
Source: 1972-1986, CAB/U.S.DOT, "Origin-Destination Survey of A~rline Passenger Traff ic," Table
IV-4
I .
I I I i I I I I I I I I I I I I I I
I I I I I I I I I I I I I I I I I I
As expected, the historic trend in passenger originations (Table IV.3) closely follows that of enpl~tnements (Table IV. 1).
Table IV.4 shows the major travel markets for originating passengers in 1986, and indicates the top 30 markets account for over 75 percent of total originations. All of the top 30 markets have direct service, and most have frequent non-stop service.
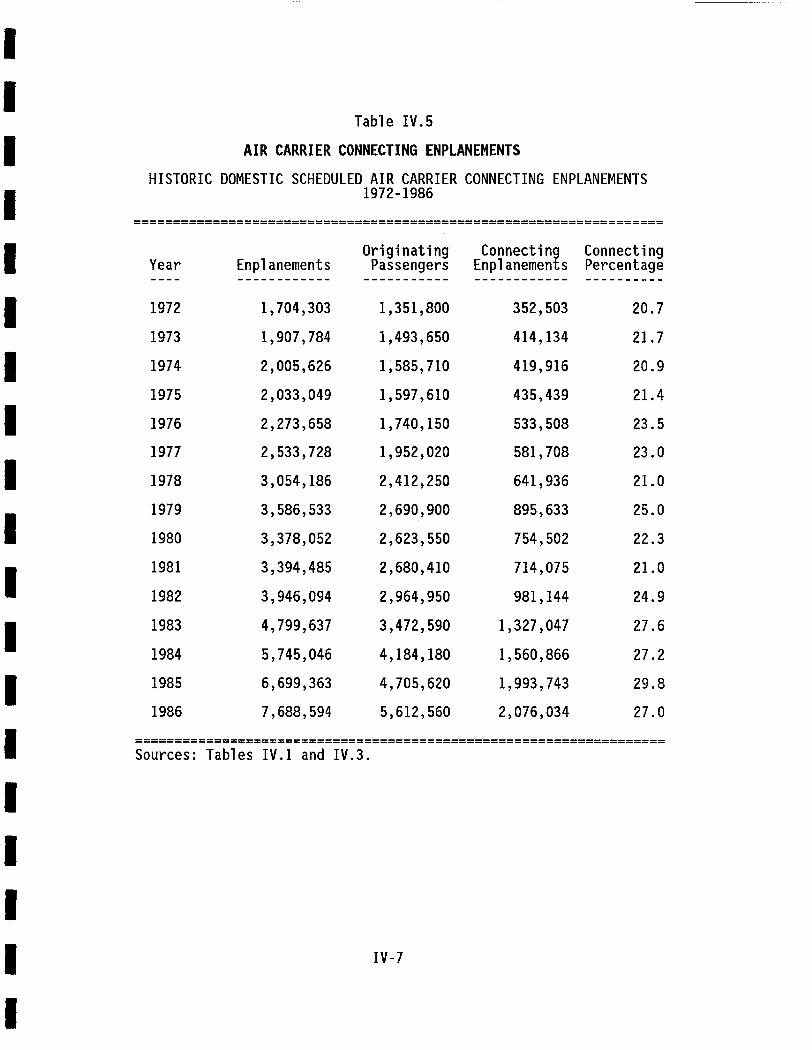
Table IV.5 lists calculations of connecting passenger enplanements (total enplanements minus originations), and shows that over time, there has been a general increase in the percentage of connecting passengers.
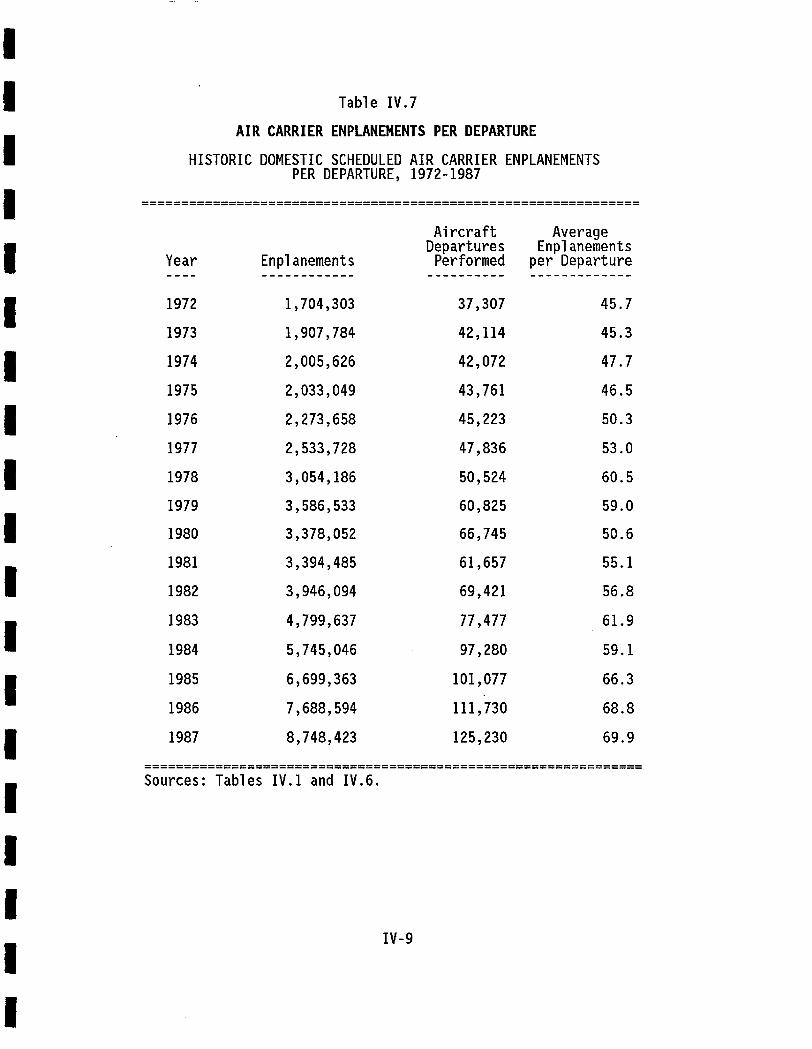
Another measure of air cartier activity is aircraft operations or departures (i.e., "flights"). Table IV.6 shows the historical trend in air carder departures over the 1972-87 period. The trend in departures closely follows the trend in enplanements (Table IV. I). However, the overall growth in aircraft departures has been relatively less than the growth in enplanements due to the airlines' use of larger aircraft (measured by seats per aircraft) and higher enplaning load factors (measured by enplanements per departure).
Table IV.7 shows the historic trend in enplanements per departure at Sky Harbor. An analysis of the air carrier operations in calendar year 1987 indicates that aircrafts averaged 134 seats per departure. This means that in 1987 the average enplaning load factor was 52.1 percent (i.e., 69.9 enplanements per departure/134 seats per departure).
Since originating passengers represent the basic traffic demand that must be met by airlines and airports, the starting point for deriving forecasts for future air carrier activity is previous forecasts of passenger originations. Regression equation techniques were used to estimate the relationship among historic originations, Phoenix Metropolitan Statistical Area (MSA) socio-economic data, an air fare yield variable and a dummy variable for the 1980-198 ! period. Using U.S. Department of Commerce projections of employment for the Phoenix MSA and FAA forecasts of real air fare yield changes, forecasts of future originations were prepared. The passenger origination forecasts are shown in Table IV.8.
In order to obtain forecasts of passenger enplanements, assumptions have been made regarding the trend in airlines using Sky. Harbor as a "hub." The historical data indicates there has been a steady increase in the amount of connecting passenger activity. Also, the known plans of the airlines, particularly America West and Southwest, indicate this trend will continue into the future. The enplanement forecast presented in Table IV.8 assumes the connecting percentage will rise to 34 percent by 1992, and will continue to increase at a diminishing rate through the study period. By the year 2007 it is assumed that connecting passengers will represent 40 percent of the total air carrier enplanements.
IV-5
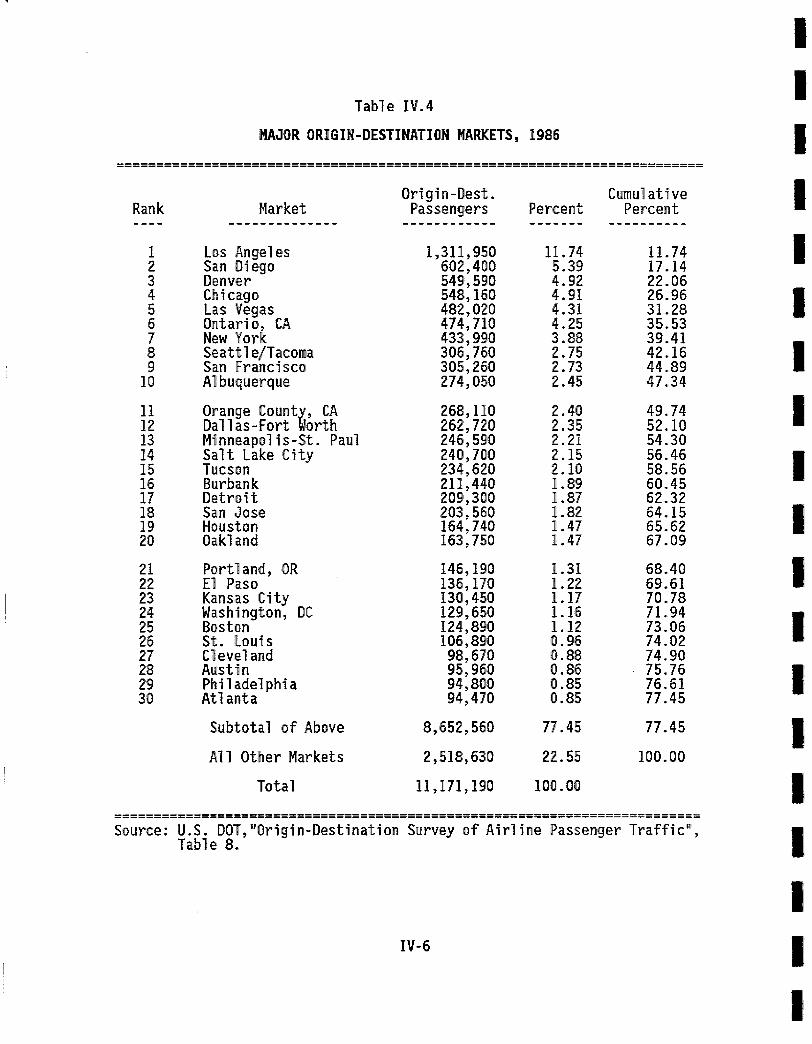
Table IV.4
MAOO,R ORIGIn-DESTINATION MARKETS, 1986
Rank
I 2 3 4 5 6 7 8 9
10i
11 12 13 14 15 16 17 18 19 20
21 22 23 24 25 26 27 28 29 30
Market
Los Angeles San Diego Denver Chicago Las Vegas Ontario., CA New York Seattle/Tacoma San Francisco Albuquerque
Orange County, CA D, allas-Fort Worth Minneapolis-St. Paul Salt Lake City Tucson Burbank Detroi t San Jose Houston Oakland
Portland, OR El Paso Kansas City Washington, DC Boston St. Louis C~eveland Austin Philadelphia Atlanta
Subtotal of Above
All Other Markets
Total
Origin-Dest. Passengers
1,311,950 6:02,400, 549,590 548,160 482,020 474,710 433,990 306,760 305,260 274,050
268,110 262,720 246,59'0 240,700 234,620 211,440 209,300 203,5.60 164,740 163,750
146,.190 13.6,170 130,450 129,6.50 124,890 106,890 98,670 9,5,960 94,8O0 9:4,470
8,652,560
2,518,630,
11,171,190
Cumulative Percent Percent
11.74 11.74 5.39 17.14 4.92 22.06 4.91 26.96 4.31 31.28 4.25 35..53 3.88 39.41 2.75 42.16 2.73 44.89 2.45 47..3.4
2.40 49.74 2.35 52.10 2.21 54.30 2.15 56.46 2.10 5.8.56 1.89 60.45 1.87 621.32 1.82 64.15 1.47 65.62 1.47 67.09
1.31 68.40 1.22 69.61 1.17 70.78 1.16 71.94 1.12 73.06 0.96 74.02 0.88 74.90 0.86 75.76 0.85 76.6.1 0.85 77.45
77.45 77.45
22.55 100.00
100'. 00
I I I I I I I I I I I I
Source: U.S. DOT,"Origin-Destination Table 8.
Survey
IV-6
of A i r l i;ne Passenger T ra f f i c " , I I I
I I I I
HISTORIC
Table IV.5
AIR CARRIER CONNECTING ENPLANEMENTS
DOMESTIC SCHEDULED AIR CARRIER CONNECTING 1972-1986
ENPLANEMENTS
I I I I I I I I I I
Originating Year Enplanements Passengers . . . . . . . . . . . . . . . . . . . . . . . . . . .
1972 1,704,303 1,351,800
1973 1,907,784 1,493,650
1974 2,005,626 1,585,710
1975 2,033,049 1,597,610
1976 2,273,658 1,740,150
1977 2,533,728 1,952,020
1978 3,054,186 2,412,250
1979 3,586,533 2,690,900
1980 3,378,052 2,623,550
1981 3,394,485 2,680,410
1982 3,946,094 2,964,950
1983 4,799,637 3,472,590
1984 5,745,046 4,184,180
1985 6,699,363 4,705,620
1986 7,688,594 5,612,560
Connecting Connecting Enplanements Percentage . . . . . . . . . . . . . . . . . . . . . .
352,503 20.7
414,134 21.7
419,916 20.9
435,439 21.4
533,508 23.5
581,708 23.0
641,936 21.0
895,633 25.0
754,502 22.3
714,075 21.0
981,144 24.9
1,327,047 27.6
1,560,866 27.2
1,993,743 29.8
2,076,034 27.0
Sources: Tables IV.I and IV.3.
I I I I IV-7

Table IV.6
AIR CARRIER OPERATIONS--DEPARTURES
RISTORIC DOMESTIC SCREDULED AIR CARRIER AIRCRAFT DEPARTURES PERFORMED, 1972-1987
Aircraft Departures.
Year Performed
1972 37,307
1973 42,114
1974 42,072
1975 43.,761
1976 45,223.
1977 47,836
1978 50,524
1979 60,825.
1980, 66,745
1981 61,657
1982 69,421
1983 77,477
1984 97,280
1985 101,.077
1986: 111,73.0
1987 125,230
Sources: 1972-1986, FAA/CAB, "Airport Activi ty Stati sti.cs," Tabl e 7. 1987, U.S.DOT,. Form 41, Schedule T3.
IV-8
I I I !
I i I i I I I I I I I !
I I
I ! !
I
Table IV.7
AIR CARRIER ENPLANEMENTS PER DEPARTURE
HISTORIC DOMESTIC SCHEDULED AIR CARRIER ENPLANEMENTS PER DEPARTURE, 1972-1987
i I I i !
I I I I I
Year
1972
1973
1974
1975
1976
1977
1978
1979
1980
1981
1982
1983
1984
1985
1986
1987
Aircraft Average Departures Enplanements
Enplanements Performed per Departure
1,704,303 37,307 45.7
1,907,784 42,114 45.3
2,005,626 42,072 47.7
2,033,049 43,761 46.5
2,273,658 45,223 50.3
2,533,728 47,836 53.0
3,054,186 50,524 60.5
3,586,533 60,825 59.0
3,378,052 66,745 50.6
3,394,485 61,657 55.1
3,946,094 69,421 56.8
4,799,637 77,477 61.9
5,745,046 97,280 59.1
6,699,363 101,077 66.3
7,688,594 111,730 68.8
8,748,423 125,230 69.9
i !
I !
Sources: Tables IV.I and IV.6.
IV-9
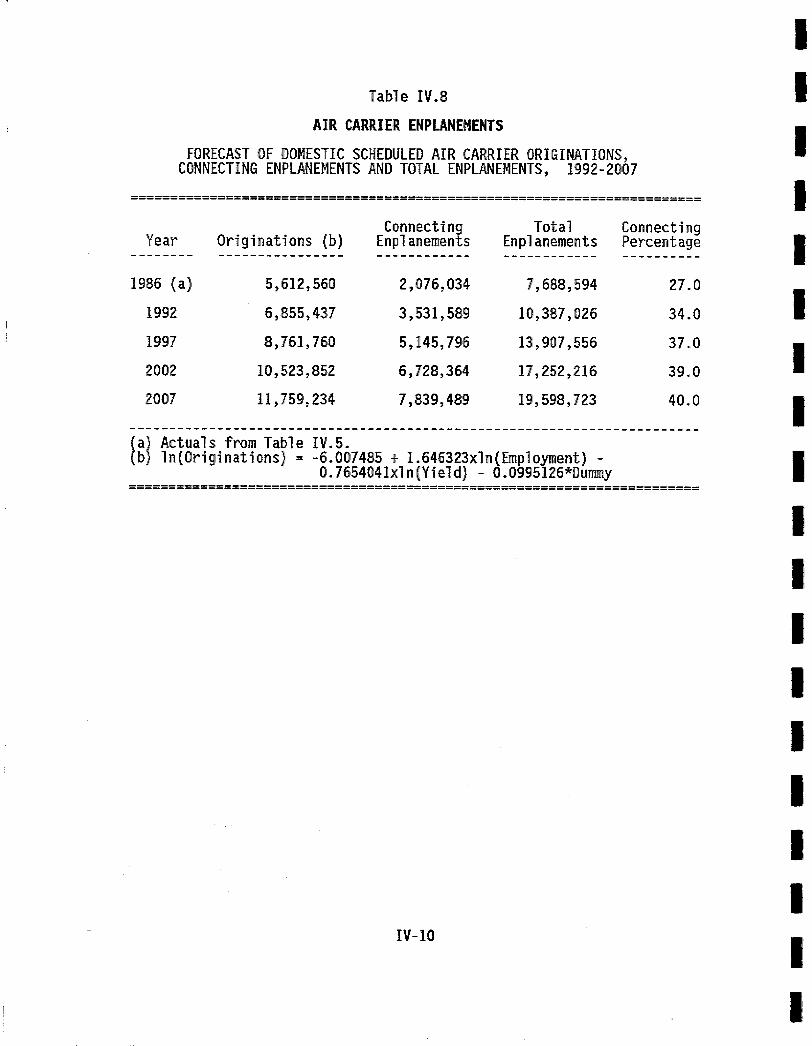
Table IV.8
AIR CARRIER ENPLANEHENTS
FORECAST OF DOMESTIC SCHEDULED AIR CARRIER ORIGINATIONS, CONNECTING ENP'LANEMENTS AND TOTAL ENPLANEMENTS, 1992-2007
I !
I !
Connecting Total Connecting Year Originations (b) Enplanements Enplanements Percentage
1986 {a) 5,612,.560 2 , 0 7 6 . , 0 3 4 7,688,594 27.0
1992 6,855,437 3 , 5 3 1 , 5 8 9 10,3.87,026 34..0
1997 8,761,760 5 ,145 , .796 13,907,556 37.0
2002 10,523,8.52 6 , 7 2 8 , 3 6 4 17,252,216 39.0
2007 11,759,234 7 , 8 3 9 , 4 8 9 19,5.98,723 40.0
I~°i ~ Actoa~s fro° Toblo iv.s=. I n (Origi nations) = -6.007485 + 1.646323xln(Empl oyment)
O. 765404 Ixl n (Y i e~ d) - O. 0995126*Dummy
I i !
I i
IV-IO
I I I I I I I ! !
I I I I I I I !
I I I i I I I I i I
However, it should be noted that connecting passenger traffic will be determined largely by corporate decisions of the airlines, and forecasts of connecting activity are less certain than forecasts of originating passengers. The connecting percentages shown in Table IV.8 are assumed to apply to monthly, daily and hourly enplanement levels.
Because of the multiple passenger terminals at the airport, a special analysis was made of connecting passenger enplanements, by carder. For the
~ ear ending June 30, 1986, the U.S. DOT Origin-Destination Survey (as processed y I.P. Sharp) shows that of the total connecting passengers, America West
accounted for 67.6 percent of the total connections with 65.4 percent of the connections being on-line America West connections. In total, 92.5 percent of the connections were on-line connections, and only 7.5 percent were interline connections requiring passengers to change between airlines. With the current location of carriers in the specific terminal buildings, ~ 5.6 percent o ~ connecting passengers must change between terminals.
The number of connecting passengers needing to move from one terminal to another in the future is not easy to predict. Given the current airlines' abilities to capture their connections through reservation systems and plans for terminal development that include closing Terminal 1 in the short-term and Terminal 2 in the mid- to long-term, it is unlikely that the percentage o f inter-terminal connections will exceed current levels. For planning purposes, most importantly in relation to the inter-terminal transportation system, the conservative assumption that inter-terminal connections will remain at today's levels will be used.
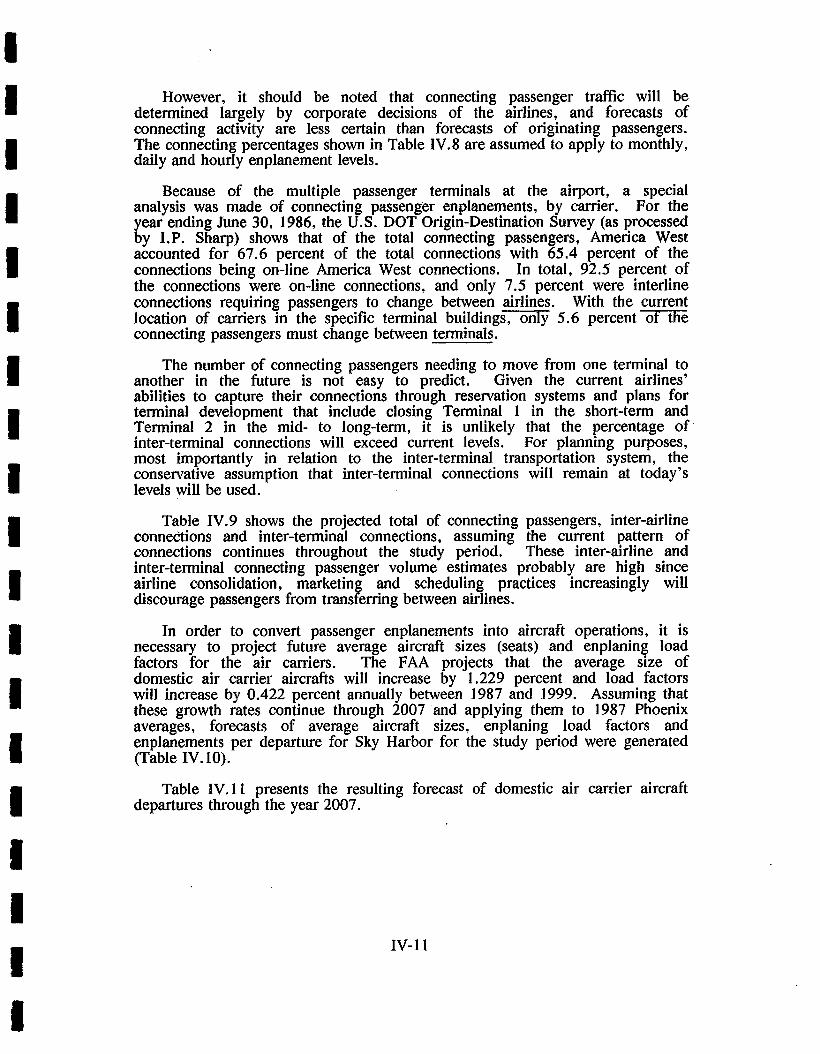
Table IV.9 shows the projected total of connecting passengers, inter-airline connections and inter-terminal connections, assuming the current pattern of connections continues throughout the study period. These inter-airline and inter-terminal connecting passenger volume estimates probably are high since airline consolidation, marketin~g and scheduling practices increasingly will discourage passengers from transterring between airlines.
In order to convert passenger enplanements into aircraft operations, it is necessary to project future average aircraft sizes (seats) and enplaning, load factors for the air carders. The FAA projects that the average s~ze of domestic air carder aircrafts will increase by 1.229 percent and load factors will increase by 0.422 percent annually between 1987 and 1999. Assuming that these growth rates continue through 2007 and applying them to 1987 Phoenix averages, forecasts of average aircraft sizes, enplaning load factors and enplanements per departure for Sky Harbor for the study period were generated (Table IV. 10).
Table IV. 11 presents the resulting forecast of domestic air carder aircraft departures through the year 2007.
IV-11
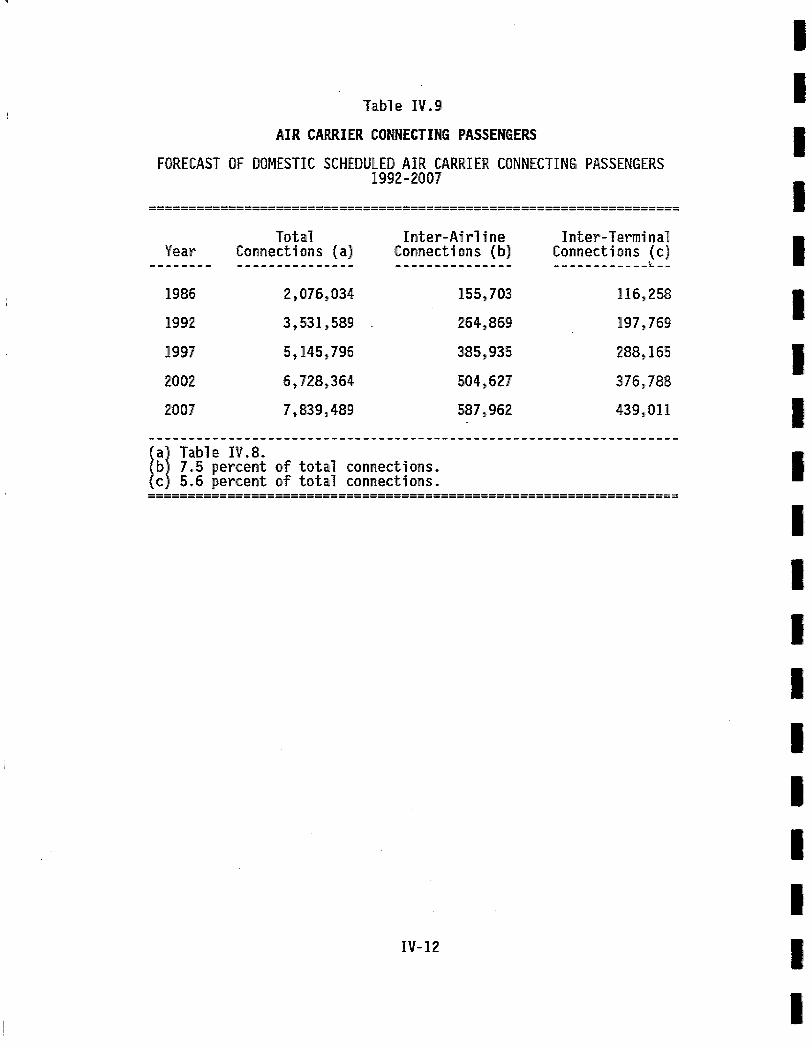
Table IV.9
AIR CARRIER CONNECTING PASSENGERS
FORECAST OF DOMESTIC SCHEDULED AIR CARRIER CONNECTING PASSENGERS 1992-200,7
Total Inter-Airline Inter-Terminal Year Connections (a) Connections (b) Connections (c)
1986 2,076,034 15.5,70,3. 116,258
1992 3,531,58.9 264,86.9 197,769
199:7 5,145,796 3 8 5 , 9 3 5 288,165.
200'2 6,.728,364 504,627 376,.788
2007 7,83'9,489 587,962 43.9,011
!
I I I !
{!} Tab, e Iv.8. 7.5 percent of total connections.
; 5.6 percen, t of total connections.
IV-12
I I I I I I i I I
I I I i
Table IV.IO
ENPLANEMENTS PER DEPARTURE
FORECAST OF DOMESTIC SCHEDULED AIR CARRIER AIRCRAFT SIZE, ENPLANING LOAD FACTOR AND ENPLANEMENTS PER DEPARTURE, 1992-2007
I Average Enplaning Enplanements Aircraft Load Factor Per
Year Size (seats) (percent) Departure
I ............................................ 1987 134 52.1 69.9
i 1992 142 53.2 75.5
1997 151 54.3 82.0
I 2002 161 55.5 89.4
2007 172 56.7 97.5
! !
I I I I I I !
I I
IV-13

Table IV.11
AIR CARRIER AIRCRAFT DEPARTURES
FORECAST OF DOMESTIC SCHEDULED AIR CARRIER AIRC~FT DEPARTURES, 1992-2007
I I I i
Year
1987
1992
1997
20,02
2007
Enplanements A~rcraft Enplanements per Departure Departures
8,.748,423 69.9 125,230
10,387,026 75..5 137,.577
13,907,556 82.0 169,.604
17,252,.216 89.4 192,.978
19,5.98,723 97.5 201,013
I I I I
Sources: Tables IV.8 and IV.IO.
IV- 14
! !
I I I I I I !
i I

I I I I !
I I I I I !
I i i !
i I I
The analysis above addresses annual forecast levels of air carrier activity. These measures that are the primary determinants of such facilities as curb length, ticket counter and baggage claim are the average day of the peak month (ADPM) and peak hour of the ADPM. The 1985 forecasts indicate significant seasonality in Sky Harbor activity. Monthly data of enplanements and aircraft departures for the period 1984-87 were analyzed for seasonality and the results are shown in Table IV.12. In terms~ of both enplanements and aircraft operations, the month of March remains the peak month for air carder activity. For example, March 1987 passenger traffic was over 11 percent higher than April's, which was the next best month. The fact that enplanements increase relatively more in March indicates that for this month, load factors are higher and, therefore, enplanements per departure also are higher.
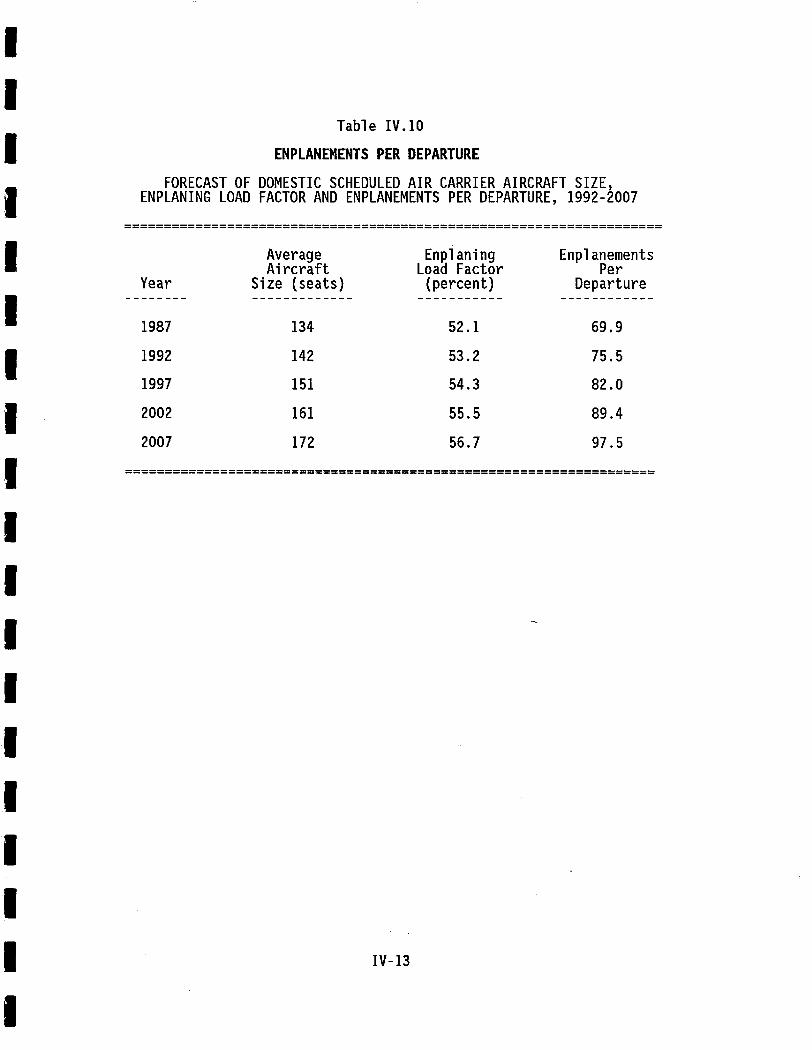
Table IV.13 shows the forecast of peak month enplanements, aircraft departures and enplanements per departure assuming the current seasonality pattern continues through the forecast period. Table IV.14 contains the forecast ofADPM enplanements. It is assumed that ADPM deplanements equal ADPM enplanements.
ADPM peak hour enplanements and deplanements were derived by assuming that hourly enplanements and deplanements are proportional to scheduled aircraft departures and arrivals. Table IV.15 shows the calculation of peak hour enplanements and deplanements for the ADPM.
3. INTERNATIONAL AIR CARRIER FORECASTS
Sky Harbor International Mrport currently has minimal international service. In 1986, the air carriers filing reports with the U.S. DOT indicated there were only 24,443 international passenger enplanements associated with 363 international flights. These intemational flights were exclusively to Mexico. If non-reporting airlines were to be included, the totals would be higher.
Because of the airport's continued growth as a domestic connecting hub airport, the growth in originating passengers, the potential for Sky Harbor to expand its international role, and city policy to develop this traffic, it is likely that there will be substantial increases in international passenger activity. This activity will likely result in the introduction of service to North Atlantic and/or Pacific destinations.
Table IV. 16 shows projections of international activity for the study period. These projections are subject to considerably more uncertainty than the domestic forecasts presented above due to limited historical data and the fact that they dpend upon city policy, corporate decisions and international agreements. The annual levels of intemational passenger and aircraft operations will not add materially to the domestic activity since international
1FAA, Aviation Forecasts: 1988-1999, February 1988.
IV-15

Table IV.12
]984-Ig87 SEASONAL ADJUSTMENT FACTORS FOR ENPLANEMENTS AND AIR CARRIER AIRCRAFT DEPARTURES
Month
January February March
Monthly Activity as a Percent of Annual .......................................
Passenger Aircraft Enplanements Departures . . . . . . . . . . . . . . . . . . . . . .
7.922 8.606 7.977 7.78,4
10.386 8.725
April 9.234 8.38,0 May 8.712 8.252 June 8.503 8.081
July August September
8.178 8.430 8.400 8.565 6.814 8.185
October 7.684 8.319 November 7.764 8.138 December 8.370 8.5,35
Average 8.333 8.333
Source: HNTB analysis.
IV-16
i I I ! !
I !
!1
I i ! !
i I !
I !
I
I I i i
Table IV.13
PEAK MONTH ENPLANEMENTS PER DEPARTURE
FORECAST PEAK MONTH (MARCH) AIR CARRIER ENPLANEMENTS, AIRCRAFT DEPARTURES AND ENPLANEMENTS PER DEPARTURE
1992-2007
! !
I !
I !
Peak Month
Passenger Aircraft Enplanements Year Enplanements (a) Departures (b) per Departure
1987 (c) 749,020 10,620 70.5
1992 1,078,797 12,004 89.9
1997 1,444,439 14,798 97.6
2002 1,791,815 16,837 106.4
2007 2,035,523 17,538 116.1
(~I Annual enplanements (Table IV.t1) times 0.10386. Icl nnual departures (Table IV.11) times 0.08725.
Actual.
!
I !
I i! !
I ! IV-17

Table IV.14
DAILY AIR CARRIER ENPLANEMENTS
FORECAST OF AVERAGE DAY PEAK MONTH AIR CARRIER ENPLANEMEN~S, 1992-2007
ADPM Year Enplanements (a)
. . . . . . . . . . . . . . . . . . . . . . . . .
1987 24,162
1992 34,800,
1997 46,595
2002 57,800
2007 65,6.62
(a) Peak month enplanements (Table. IV..13) divided by 31.
l I !
i !
l !
i ! ! !
I
IV-18
!
l !
!
! !

m m m m m m m m m m mm mm m m mm m mm mm m
Table IV.15
PEAK HOUR PASSENGERS
FORECAST OF PEAK HOUR AIR CARRIER PASSENGER ENPLANEMENTS AND DEPLANEMENTS, 1992-2007
I
Ratio of Ratio of Peak Hour Peak Hour
ADPM (a) ADPM (a) to ADPM to ADPM Peak Hour Peak Hour Year Enplanements (b) Deplanements (c) Departures (d) Arrivals (d) Enplanements Deplanements
1987 24,162 24,162 0.0862 0.0891 2,083 2,153
1992 34,800 34,800 0.0862 0.0891 3,000 3,101
1997 46,595 46,595 0.0862 0.0891 4,016 4,152
2002 57,800 57,800 0.0862 0.0891 4,982 5,150
2007 65,662 65,662 0.0862 0.0891 5,660 5,850
l~I Average ,ay peak month Table IV. 14.
l~I ~ume, ~o o~u~ ~OP. en~n~oent~ HNTB analysis of OAG schedules for March 22-28, 1987.
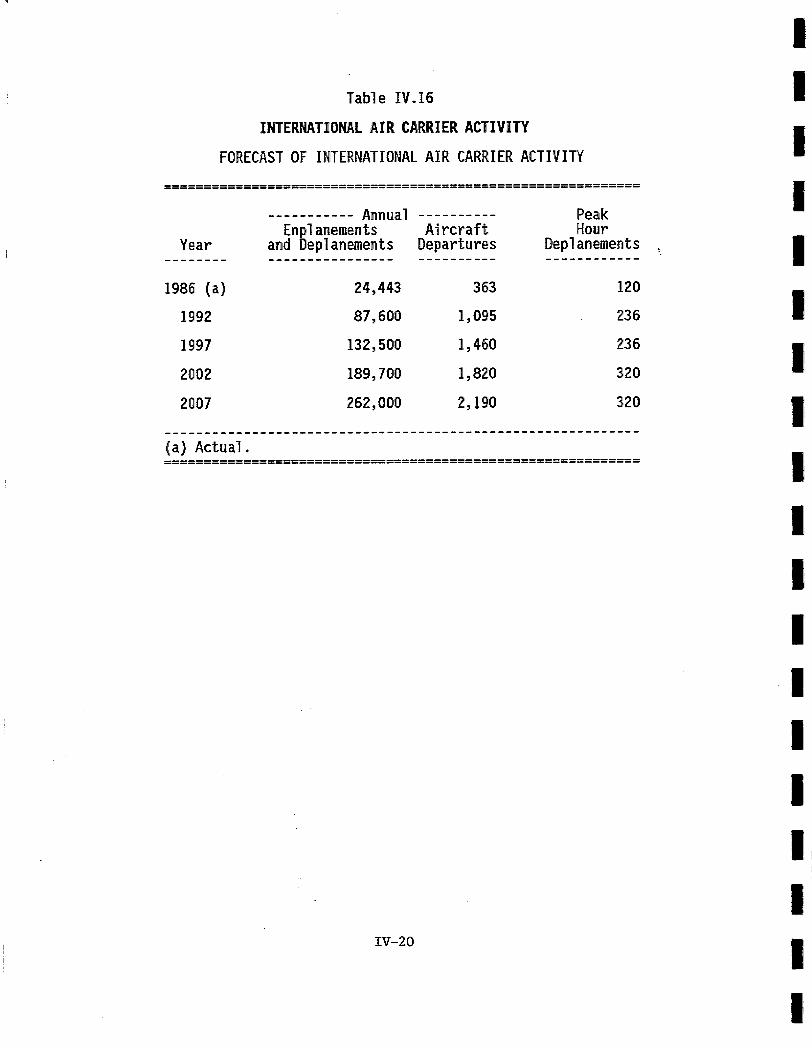
Table IV.16
INTERNATIONAL AIR CARRIER ACTIVITY
FORECAST OF INTERNATIONAL AIR CARRIER ACTIVITY
. . . . . . . . . . . Annual . . . . . . . . . . Peak Enplanements Aircraft Hour
Year and Deplanements Departures Deplanements ..............................................
1986. (a) 24,443 363 120
19,92 87,600 1,0,95 236
1997 132,500 1,460 236
2002 189,700 1,820 320
2007 262,000 2,190 320
(a) Actual.
IV-20,
I I
I
I I !
I
I I I I
I I I
i I I I I

I I I I I I I I !
I I I ! ! !
i I !
arrivals and departures tend to occur during non-peak hours of domestic activity. The activity measure most critical to facility planning is the peak hour deplanement figure, which determines the size o f the Federal Inspection Service (FIS) facility. Table IV.16 indicates that through 1997 the airport should have an FIS sufficiently sized to process an arriving DC-10 aircraft. Given the uncertainties of forecasting international activities and the potential for increases international service, the facilities should be designed so they can be expanded quickly and economically to accommodate two B-747's in any one hour. The timing and scale of the development of these international facilities will be adjusted to the airlines' programs for the introduction of new services.
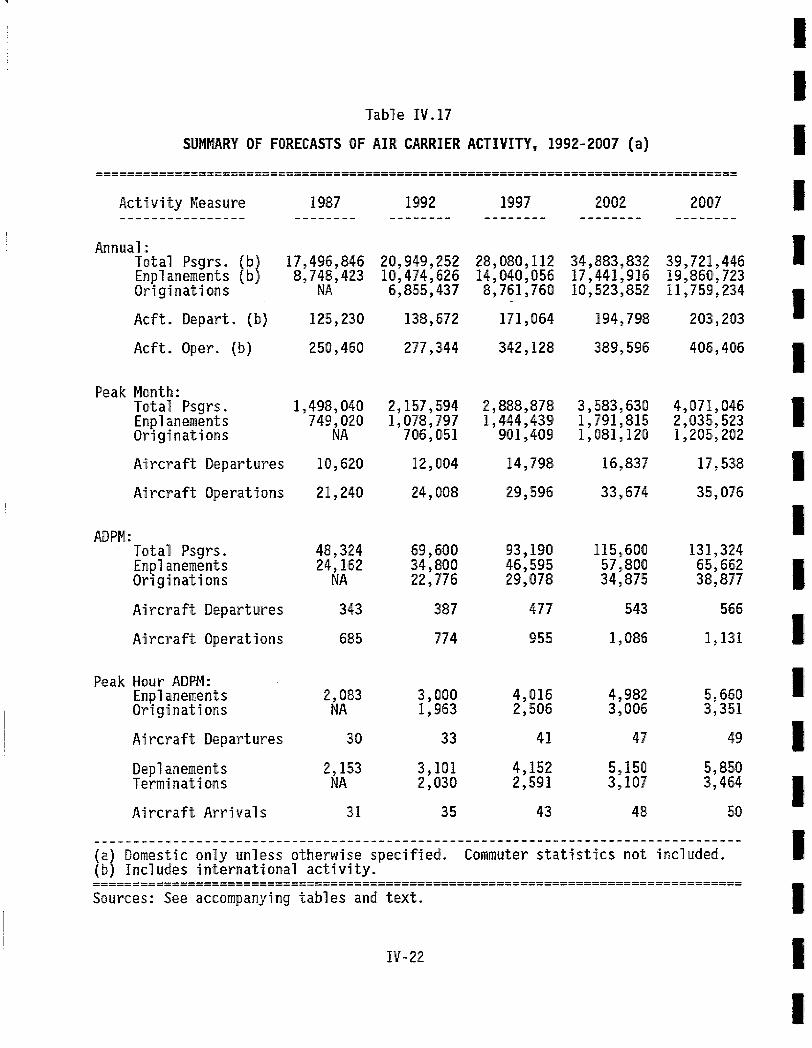
4. AIR CARRIER SUMMARY
Table IV. 17 presents a summary of the air carder activity forecasts.
5. REGIONAL AIRLINE FORECASTS
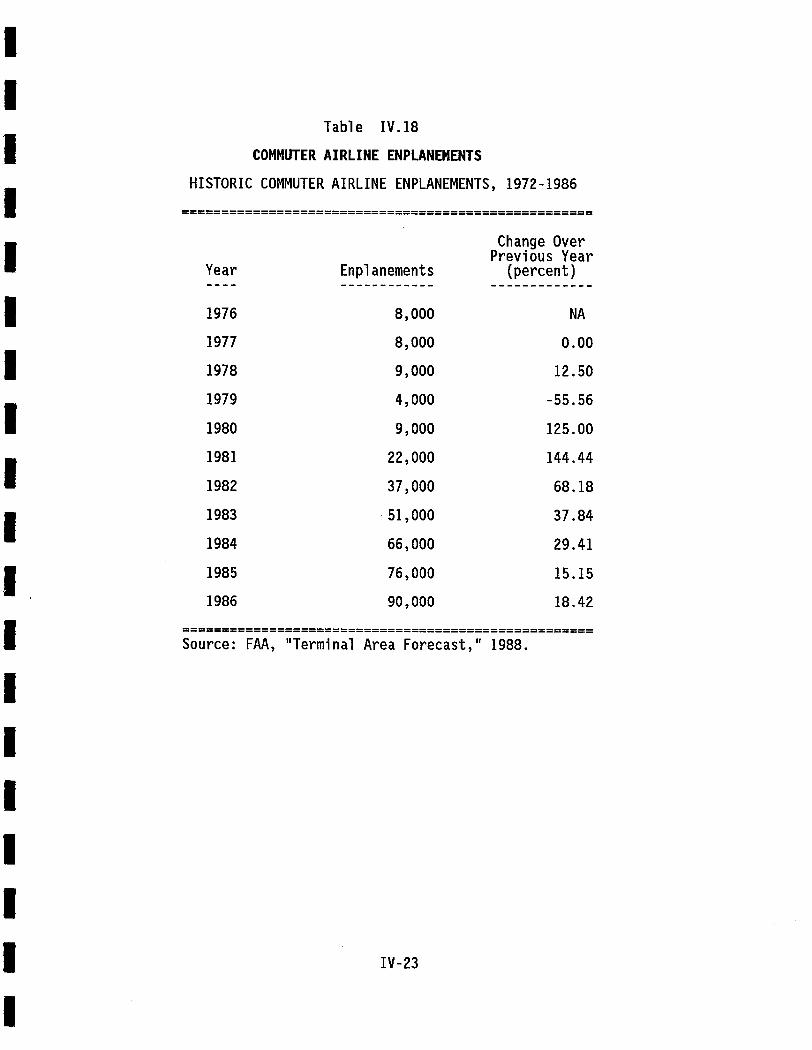
Regional airline (commuter) activity is an increasingly important activity both in terms of passenger movements and aircraft operations. Unfortunately, because of their size, most commuter airlines are not required to report as much information about their operations as the larger air carriers. What data does exist indicate that the commuter airlines at the airport are following the national trend of aligning themselves with larger air carriers through code-sharing arrangements. Such arrangements mean the commuter airlines become feeders to the larger carriers' systems.
Table IV.18 lists historical commuter airline enplanement data for the 1976-86 period. In forecasting future regional a~rline enplanements and aircraft operations, the FAA's national trends were used.'
Table IV. 19 contains the forecasts of annual enplanements and operations for the study period based on the assumption that regional airline activity at Sky Harbor follows the projections for the industry at the national level. Since no data exist on the division of regional airline passengers between connecting and originating passengers, it is assumed that the relationship is the same as for the air carrier airlines. This is a conservative assumption since, because of the increasing role of commuter airlines as feeders to the air carders, it is likely that a relatively larger percentage of regional airline passengers are connecting. The peak month, ADPM and peak hour ADPM activity forecasts for the commuter airlines are derived using the same methodology and assumptions as was used for the air carder forecasts.
1 FAA, Aviation Forecasts: 1988-1999, February 1988.
IV-21
SUMMARY OF
Tabl!e IV.17
FORECASTS OF AIR CARRIER ACTIVITY, I'992-2007 (a)
! ! !
Activity Measure
Arl, nual : Total Psgrs. I~I Enp~ anements OriginatioRs
1987 1992 1997 2002 2007
17,496,846 20,949,252 28,0,80,112 34,883,832 39,721,446 8,748,423 10,474,626 14,0,40,056 17,441,916 19,.860',723
NA 6,855,437 8,761,760 10,,523.,852 11,.759,234
Acft. Depart. (b) 125,230, 138,672 171,0,64 194,798 203,203
Acft. Oper. (b) 250,460' 277,344 342,128 389,596 406,406
1,498,040 2,157,594 2,888,878 3,583,630 4,071,046 749,020 1,078,797 1,444,439, 1,791,815 2,035,523
NA 706,051 901,409 1,081,120 1,205,202
Aircraft Departures 10,620 12,004 14,798 16,837 17,538.
Aircraft Operations 21,240 24,00,8 29,596 33,674 35,076
48,324 69,600, 93,190 115,600 131,324 24,162 34,.8,00 46,595 57,.800, 65,66.2
NA 22,.776 29,,078 3.4,875 38,877
Aircraft Departures 343 387 477 543 566
Aircraft Operations 685 774 955 1,086 1,131
2,083. 3,000 4,016 4,982 5,.660 NA 1,963 2,506 3,00'6 3,351
30 33 41 47 49
2,153 3,101 4,15.2 5,150 5,850 NA 2,030' 2,59'I 3,107 3,464
31 35 43 48 50
Peak Month: Total Psgrs. Enplanements Originat ions
ADPM: Total Psgrs. Znplanements Originations
Peak Hour ADPM: Enp.lanements Originations
Aircraft Departures
Depllanements Terminations
A i r c r a f t Arr iva ls
(a) Domestic only unless otherwise specif ied. Commuter s t a t i s t i c s not included. (b) Includes internat ional a c t i v i t y .
I I I I I I I ! !
I I I
Sources: See accompanying tables and tex t .
IV-22
I
! ! !
I I ! !
I !
i I i !
i I I I !
HISTORIC
Year
1976
1977
1978
1979
1980
1981
1982
1983
1984
1985
1986
Source:
Table IV.18
COMMUTER AIRLINE ENPLANEMENTS
COMMUTER AIRLINE ENPLANEMENTS, 1972-1986
Enplanements
8,000
8,000
9,000
4,000
9,000
22,000
37,000
51,000
66,000
76,000
90,000
Change Over Previous Year
(percent)
NA
0.00
12.50
-55.56
125.00
144.44
68.18
37.84
29.41
15.15
18.42
FAA, "Terminal Area Forecast," 1988.
IV-23
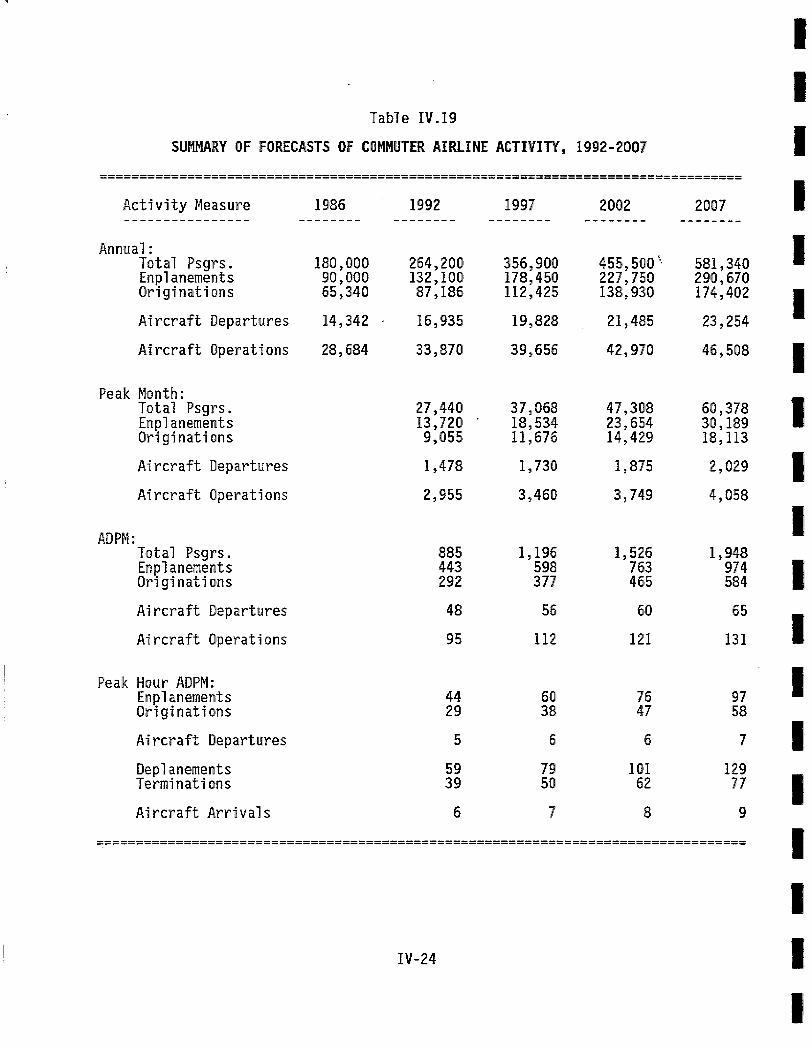
Table IV.19
SUMMARY OF FORECASTS O,F COMMUTER AIRLINE ACTIVITY, 1992-2007
Activi ty Measure
Annual: Total! Psgrs. Enplanements Originations
19=86 19,92 1997
180,000 264,200, 356,900 90,000 132 ,100 178,450 65,3.40 87,186 112,425
Aircraft Departures 14,342 16,935 19,828
Aircraft Operations 28,6.84 33,870 39,656.
2002
455,500 ~ 227,750 138,930
21,.48,5,
42,970
47,30,8 23,65,4 14,429
1,875
3,749
1,526 763. 465
6.0
121
76 47
6
I01 62
8
Peak Month: Total Psgrs. Enplanements Originations
Aircraft Departures
Aircraft Operations
27,440 37,068. 13,720 18,534 9,055 11,676
I,.478 1,730
2,955 3,460
ADPM: Total Psgrs. Enpl!anements OriginatioRs
Aircraft Departures
Aircraft Operations
885 1,196 443 598. 292 377
48 56
95 112
Peak Hour ADPM: Enp.laneme.n~ts Originations
Aircraft Departures
Deplanements Terminations
Aircraft Arrivals
44 60, 29 38
5 6
59' 79 39 50
6 7
2.007
581,340 290,670 174,402
231,25.4
46,508
60,378 30,189 18,113.
2,029
4,058
1,948. 974 584
65
131
97 58.
7
129 77
9
i
I ! !
I I ! ! ! ! !
I I I
IV-24
I I I I I I I I I I I I I I I I I I
6. AIR TAXI OPERATIONS
Air taxi operations consist of for-hire passenger and cargo operations performed on a non-scheduled basis. These operations typically are performed with smaller turboprop aircraft.
Data from the FAA's Airport Traffic Records indicates "air taxi" operations have been increasing. Unfortunately, the FAA's definition of "air taxi" includes operations by the regional (commuter) airlines and cargo operators. This consolidation of several categories of activity makes it difficult to separate the historic trends. Therefore, it is unclear how much of the reported increases in the FAA's definition of "air taxi" operations can be attributed to non-scheduled activity and how much is due to the known growth in commuter and cargo activities.
The recent Part 150 Noise Compatibility Study estimates that of the 62,983 "air taxi" operations reported by the FAA in 1986, 24,522 were associated with true air taxi activity. Table IV.20 shows the forecast of air taxi operations.
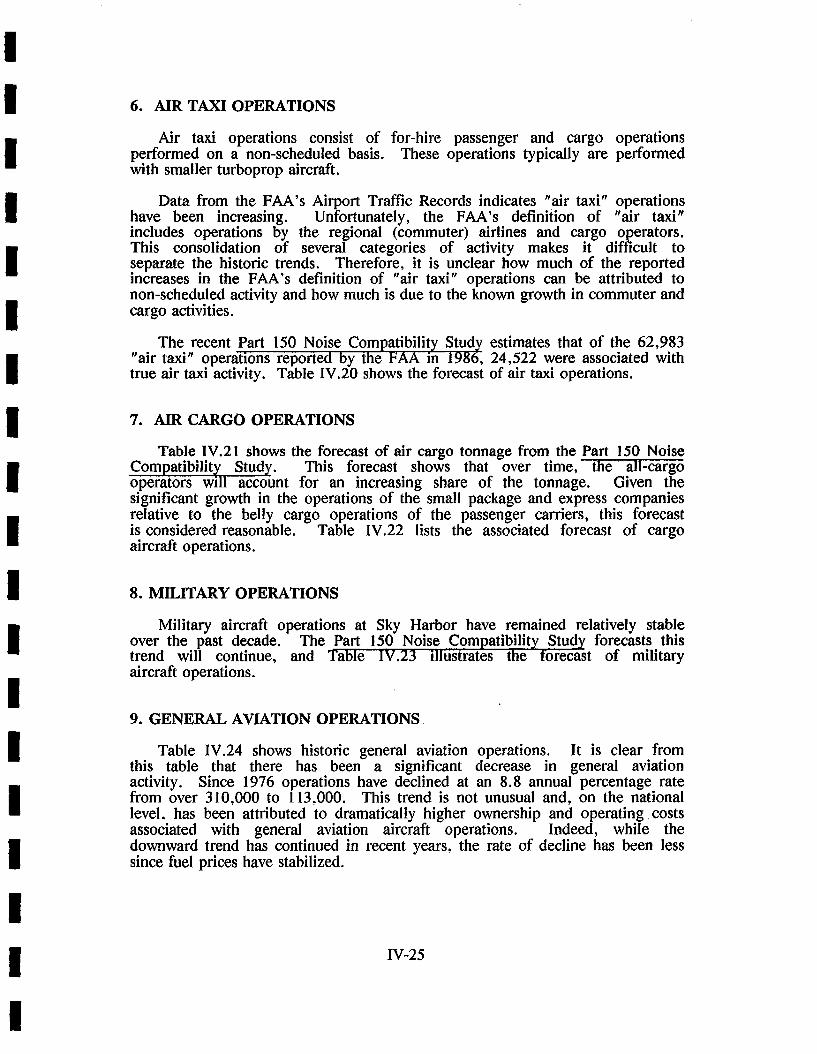
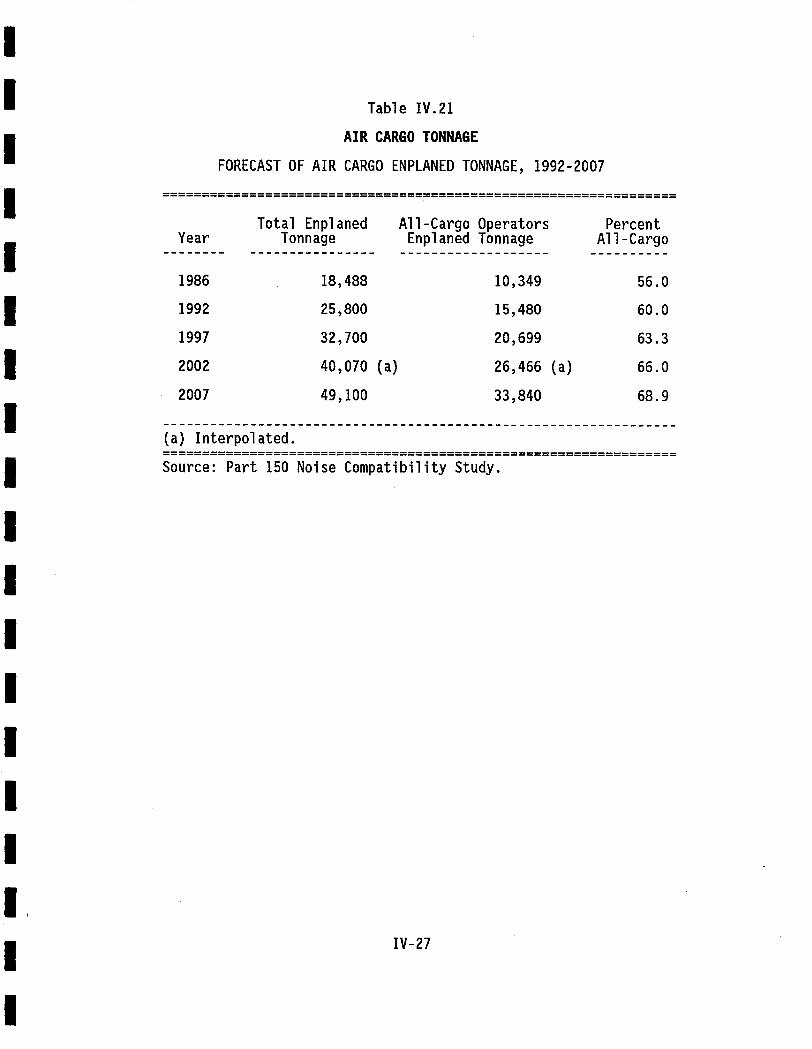
7. AIR CARGO OPERATIONS
Table IV.21 shows the forecast of air cargo tonnage from the Part 150 Noise Compatibility Study. This forecast shows that over time, the all-cat'go operators will account for an increasing share of the tonnage. Given the significant growth in the operations of the small package and express companies relative to the belly cargo operations of the passenger carriers, this forecast is considered reasonable. Table IV.22 lists the associated forecast of cargo aircraft operations.
8. MILITARY OPERATIONS
Military aircraft operations at Sky Harbor have remained relatively stable over the past decade. The Part 150 Noise Compatibility Study forecasts this trend will continue, and Table IV.23 illustrates the forecast of military aircraft operations.
9. GENERAL AVIATION OPERATIONS.
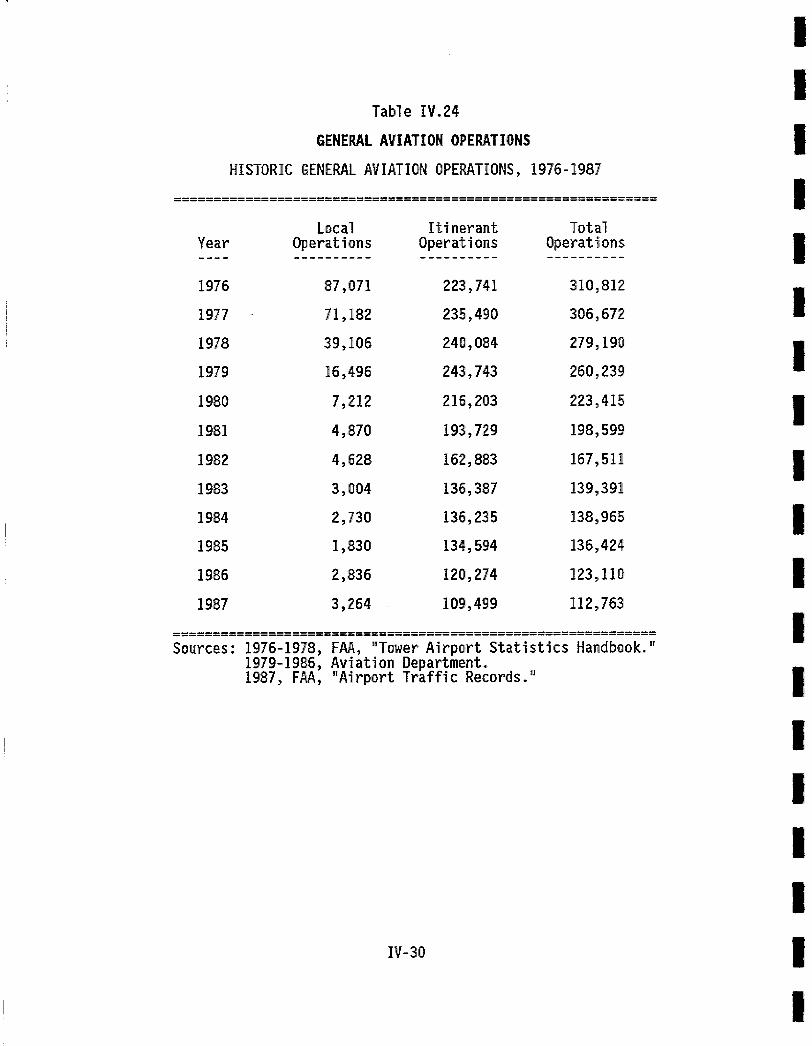
Table IV.24 shows historic general aviation operations. It is clear from this table that there has been a significant decrease in general aviation activity. Since 1976 operations have declined at an 8.8 annual percentage rate from over 310,000 to 113,000. This trend is not unusual and, on the national level, has been attributed to dramatically higher ownership and operating costs associated with general aviation aircraft operations. Indeed, while the downward trend has continued in recent years, the rate of decline has been less since fuel prices have stabilized.
IV-25

Table IV.20
AIR TAXI OPERATIONS
FORECAST OF ANNUAL AIR TAXI AIRCRAFT OPERATIONS, 1992-2007
Aircraft Year Operations
1986 24,522
1992 30,48.2
1997 3.6,190
200,2 42,983. {a)
2007 51,05.0
(a) Interpolated.
Source: Part 150 Noise Compatibility Study.
I ! !
I !
I I !
I !
I ! ! !
I
IV-26
I !
I I
Table IV.21
AIR CARGO TONNAGE
FORECAST OF AIR CARGO ENPLANED TONNAGE, 1992-2007
Total Enplaned All-Cargo Operators Percent Year Tonnage Enplaned Tonnage All-Cargo
1986 18,488 10,349 56.0
1992 25,800 15,480 60.0
1997 32,700 20,699 63.3
2002 40,070 (a) 26,466 (a) 66.0
2007 49,100 33,840 68.9
I I I I
(a) Interpolated.
I I I I I I I I
I
Source: Part 150 Noise Compatibility Study.
IV-27
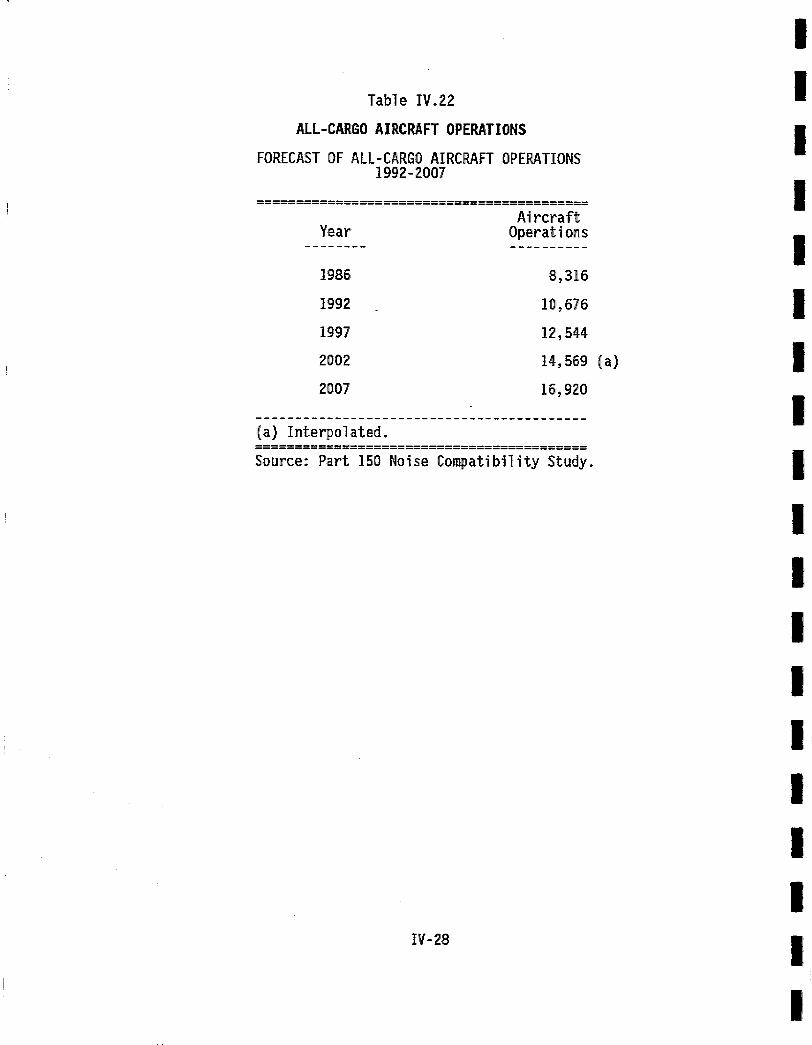
Table IV.22
ALL-CARGO AIRCRAFT OPERATIONS
FORECAST OF ALL-CARGO AIRCRAFT OPERATIONS 1992-2007
Aircraft Year Operations
1986 8,316
1992 10,,676
1997 12,.544
2002 14,569
2.007 16,920
{ra) InterDol ated.
(a)
Source: Part 150, No~se Compatibility Study.
I I I I I I I I I !
II II
IV-28
I
I I I I I I I I I I I I I I I I I I I
Table IV.23
MILITARY AIRCRAFT OPERATIONS
FORECAST OF MILITARY AIRCRAFT OPERATIONS 1992-2007
Aircraft Year Operations
1986 7,597
1992 8,000
1997 8,000
2002 8,000 (a)
2007 8,000
(a) Interpolated.
Source: Part 150 Noise Compatibility Study.
IV-29
HISTORIC
Table IV.24
GENERAL AVIATION OPERATIONS
GENERAL AVIATIOR OPERATIONS, 19,76-1987
I !
I I
Local Itinerant Total Y e a r O p e r a t i o n s Opera t i ons Operations
1976 87,071 223,741 310,812
1977 71,18.2 235,490 306,672
1978 39,I06 240:,08.4 279,190
1979 16,496 243,.743 260,239
1980 7,212 216,.2'03 223,415
1981 4,870 193,729 198,59,9
1982 4,628. 162,883 167,511
1983 3,004 136,387 139,39'I
1984 2,730 13.6,23.5 138,965
1985 1,830 134,5.94 136,424
1986 2,836 120,274 123,110
1987 3,26.4 109,499 112,763
I I I I I ! !
Sources: 1976-1978, 1979,-1986, 1987, FAA,
FAA, "Tower Airport Statistics Handbook." Aviation Department. "Airport Traffic Records."
IV-30
i I I I I I

I !
I I I !
I ! !
I ! ! !
I !
I I !
Table IV.25 shows the forecast of general aviation operations for the study period. This forecast assumes the decline in general aviation operations will continue, reflecting both the historic trend and the fact that increases in other types of aircraft operations at Sky Harbor will make the airport an increasingly unattractive airport for the casual general aviation pilot. General aviation operations are decreased at a constant 5.1 annual percentage rate over the study period.
Table IV.26 shows the associated forecast of based general aviation aircraft for the airport. The overall decline in the total based aircraft reflects the decrease in operations. However, it is anticipated that there will be a significant change in the composition of the based aircraft as the number of business jets increases and the number of small, single engine aircraft decreases.
10. PASSENGER AND OPERATIONAL SUMMARY
Tables IV.27 and IV.28 show summaries of passenger and aircraft activity. In comparison to the 1988 FAA Terminal Area Forecast, the 1997 enplanemment forecast here is approximately 15 percent lower. The largest relative difference in enplanements is for commuter airlines, which the FAA projects to be 23 percent higher. In terms of total aircraft operations, the FAA forecast is 13 percent higher in 1997 with the largest difference being general aviation operations.
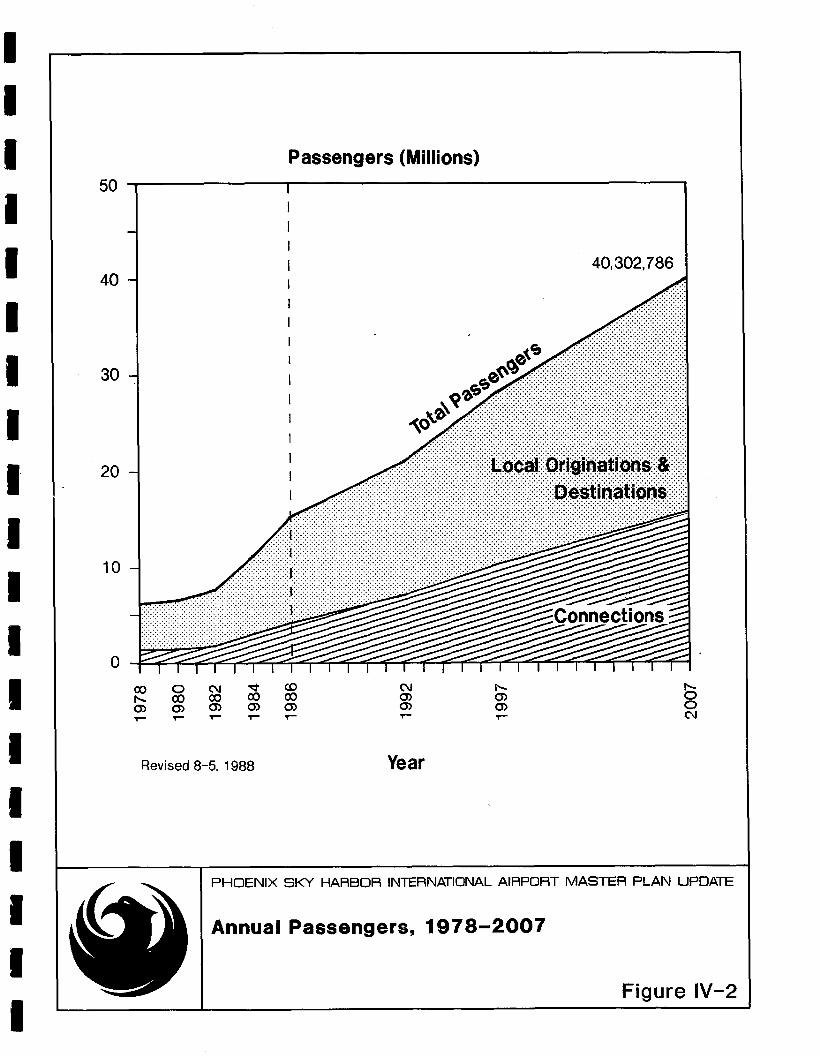
Figures IV.I and IV.2 show graphic summaries of the forecasted aircraft operations and total passengers.
11. AIRCRAFT FLEET MIX
Table IV.29 shows the forecasted mix of aircraft operations by aircraft type.
12. ON-AIRPORT EMPLOYMENT
The number of employees working at the airport generates requirements for employee related services (e.g., parking, food services). Table IV.30 shows the projections for on-airport employment. In forecasting on-airport employment, employment levels were related to a previously forecasted activity measure. Fixed Base Operator (FBO) employment was held constant even though based aircraft and general aviation operations are forecasted to decline because the mix of based aircraft is expected to change to larger and more sophisticated aircraft.
IV-31

Table IV.25
GENERAL AVIATION OPERATIONS
FORECAST GENERAL AVIATION OPERATIONS, 1992-2007
I !
I
I Local Itineran, t Total
Y e a r O p e r a t i o n s Ope ra t i ons Operations
198.7 3,264 109,499 112,763
1992 1,51,0 85,.000, .86,5.10
1997 5.00 65,870 66,370
2002 500 50,400 50,,900
200,7 500 38,55.0 39,050,
! ! !
I
IV-32
i ! !
I I ! !
I I !
I

6 0 0 ,
Operations (Thousands)
5OO
4 0 0
3 0 0 -
2 0 0 -
lOO.
0
567,934
o, ' Si ;ii :ii::i:iiiii:iiiiiiiiiii::iii:i:i:iiii::iiii;iii ''"": :::::i:,
•:i:i:i:!:?:i:!:!:i:!:i:i:!:!:i:i:!:!:[:i:i:i:i:i:i:i:i:i:i:i:!:i:!:!:!:!:i:i:i:!:i:!:i:!:!:i:i:i:i:i:!:!:i:i:i:i:i:i:i:i:i:i:i:i:i:i:i:i:i:i:i:i:i:i:i:i:i:i:i:i:i:i:i:i:i:i:i:ii :i:i:):i:i:i:i:?:!:i:i:i:i:i:i:i:i:i:i:i:i:i:i:i:i:i:i:i:i:i:i:i:i:i:i:i:i:i:i:i:i:i:i:i:i:i:i:i:i:i:?:i:!:i:i:i:i:i:i:i:i:i:i:i:i:i:i:!.i:i:i:i:i:i:!:i:!:!:i:i:!:!:i:i:!:!:i:i: L::::::::::::::::::::::::::::::::::::::::::::::::::::::::::::::::::::::::::::::::::::::::::::::::::::::::::~:::::::::::::::::::::::::.:::::::::::::::::::::::::::::::::::::::::::
- , . . . , . , . . . . • . , . , . , . , . . . . - . . • . . - • - . - . • . , . , . , . , . . . • , - . . , . . . • • - . . . , . . . , . . . . , . , . , . . . . , . . , . . . . - , • . . . . . . - • . • - . . . . , . , . . . .
•i:!:i:i:!:i:i:!:!:i:i:i:i:i:!:i:i:!:i:i:i:!:i:!:?:i:!:i:i:i:i:i:i:i:i:i:i:!:i:!:i:i:i:i:!:!:i:!:i:!:i:!:i:i:!:!:!:!:!:i:i:!:!:!:!:!:!:!:!:!:!::.•.::i:!:i:!:!:i:i:!:!:!:!:!:!:i:
~i~i~i~i~!~!!iiiiiiiii~iiii~iii~!~!!~!!~!!!~iii~i~!!i~i~i!i!i!i~i!i~!!i!i!!~!~!!~!~i~i!~!~!~!~i!~i!~i!!~i~!i!i~i!i~i~:~!:~i!i!~i~i~!i!! •!i!iiiii!iiiiii!i•iiiiiiiiiiii•iiiiiiiiii•iii!iiiiiiiiiiiiigiiiii!iiiiiiiiiii!igiiiigiiiiiiiiiiiiii!iiiii!iiiiiiiiii!ii!iiiiiii!i!!!i!i!!i!iiiii•i!ii•!iiiiiiiii•iiiii!i•i!iiiii
•!i!iii!iii!i!i!iii!i!iii!i!i!iiiiiiiiiiiiiiiiiiiiiiiiiiiiiiiiiiii!!i?iiiiiiiiiiiii?iiii!ii#iiii!i!iiii?iiiiiiiiiiiiiiiiiiiiiiiiii[iiiiiiiiiiiiii?iiiiiiiiiiiiiiiiiiiii!iiiiii
~::::!:!:!:!i!!!!ii!i!i!iii!i!i!i!!i!!!iiiiiii[i!?iiii!i!!i!iiiii!i!i!i!i!iiiiiiii!i!iiii:!:i:!:!:i:i:i:i:i:i:i:i:i:i:i:i:i:!:i:!:i:i:i:i:i:i:i:i:i:i:i:i:i:i:i:i:i:i:i:!:i:i:i g
~1 ~t~ (Re ional Airlines) :
/
QO 0 (Xl ~ ~ (xl ~ r,-- !'~ CO GO oO oo O~ O~ 0 O~ O) 0") 0"~ O'J O) 0") 0
Rev ised 8 - 5 , 1 9 8 8 Year
PHOENIX SKY HARBOI~ INTERNATIONAL AIRPORT MASTER PLAN UPDATE
Annual Operat ions , 1 9 7 8 - 2 0 0 7
Figure IV- 1
I !
I I
50
40
3 0
20
10
0
Passengers (Millions)
1 I
I
_ I I
I 40,302,786
- i ::::iiiil
~ - • _~e~, ~ . ...::::~i~?iiiii!i!!i!i!illiiilliiii!i!!!!!!i! I ~ --'"""'"'"-"":':""'"'"'":"'"""'"'""':'"'-"'""
• , ,,,,~, ~ ! ; i i i i i iii ii!!iiii ii i!i iiiiii; . ...~.~!~i!!!iiiiiii~ii!!!iiiiiiii~i~i!~!!i!i!ii;ii!i!!!!iiiiiiii!!i!i!!ii , ~:~:ii:iiiiii~i!ii!i!::~i:ii~ii~!i!~!:~i~:i:::::ii!~!i~::~ii~i!!i~i:~i:ii!!i!~ I ::::::::::::::::::::::::::::::::::::::::::::::::::::::::::::::::::::::::::::::::::::::::::::::::::::::::::::::::::::::::::: ii!iiiiiii)iiiii iiiiiiiiiiiiiiiii!ii!!iiiiiiiiiiiiii!i!i!!iiiiiiiiiiiii!i!!''''''''''iiii!!i .:iiiii;iiiiiiii)iii;iiii;i)iiiiiiiiiiii;iiiiili;ii iiiiiiiiiii!iiiiiiill iiiiiii!iiiiill iiiii)iiiiiiiiiiiiiiiiii~i~i~:~:::::+""
- .:iil))i)i;i;i)i)i)i; )i)i;i)i)i)))i)i)i)il);)iii)i)i)i)iii)i)))))ii;iiiiiiii~!~:~::::""
I l l l l l l l l l l l l l l t l l l l l l l l l l l l
oo 0 o4 ~ ~ oJ ~., I',-. I'-,, ~0 oo oO ~0 ~ O) 0
~.- ~- ~ ~- ,r- ~ ('4
R e v i s e d 8 -5 , 1 9 8 8 Year
P H O E N I X S K Y H A R B O R I N T E R N A T I O N A L A I R P O R T M A S T E R P L A N U P D A T E
A n n u a l P a s s e n g e r s , 1 9 7 8 - 2 0 0 7
F i g u r e I V - 2

I !
I I
Table IV.26
BASED GENERAL AVIATION AIRCRAFT
FORECAST OF BASED GENERAL AVIATION AIRCRAFT, 1992-2007
Single- Twin- Business Year Engine Engine Jet Helicopter Total
I ........................................ 1987 (a) 270 56 21 8 355
i 1992 207 56 26 9 298
I 1997 160 54 34 10 258
2002 122 53 41 11 227
i 2007 94 52 49 11 206
(a) From Aviation Department and fixed base operators. !
IV-33
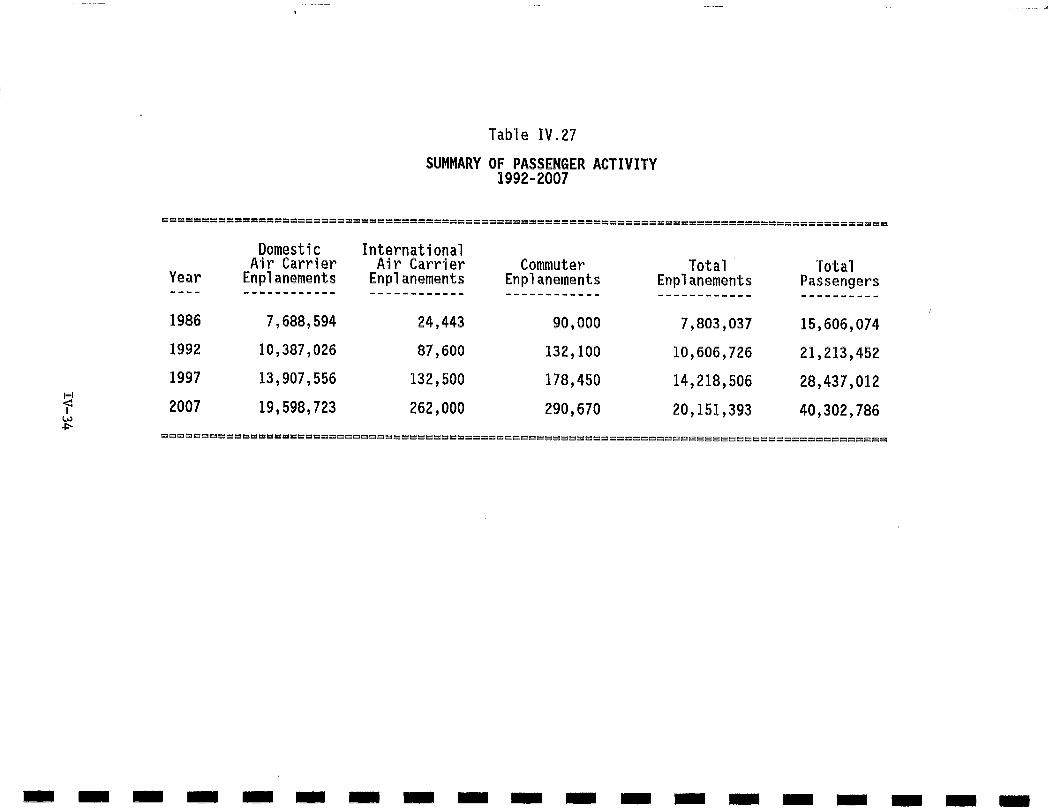
Table iV.27
SUMMARY OF PASSENGER ACTIVITY 1992-2007
F-4
,<
Domestic International Air Carrier Air Carrier Commuter Total Total
Year Enplanements Enplanements Enplanements Enplanements Passengers
1986 7,688,594 24,443 90,000 7,803,037 15,606,074
1992 10,387,026 87,600 132,100 10 ,606 ,726 21,213,452
1997 13,907,556 132,500 178,450 14 ,218 ,506 28,437,012
2007 19,598,723 262,000 290,670 20 ,151 ,393 40,302,786
i I I i i i I I I i I I i I I i I I i

m m m m m m m m mm mm m m m mm mm m m n m
SUMMARY
Table IV.28
OF AIRCRAFT OPERATIONS 1992-2007
,< L.o L.n
General Year Air Carrier (a) Commuter Air Taxi Cargo Military Aviation Total
1986 224,186 28 ,684 24,522 8,316 7,597 123,110 416,415
1992 277,344 33 ,870 30 ,482 10,676 8,000 86,510 446,882
1997 342,128 39 ,656 36 ,190 12,544 8,000 66,370 504,888
2007 406,406 46 ,508 51,050 16,920 8,000 39,050 567,934
(a) Includes domestic and international.
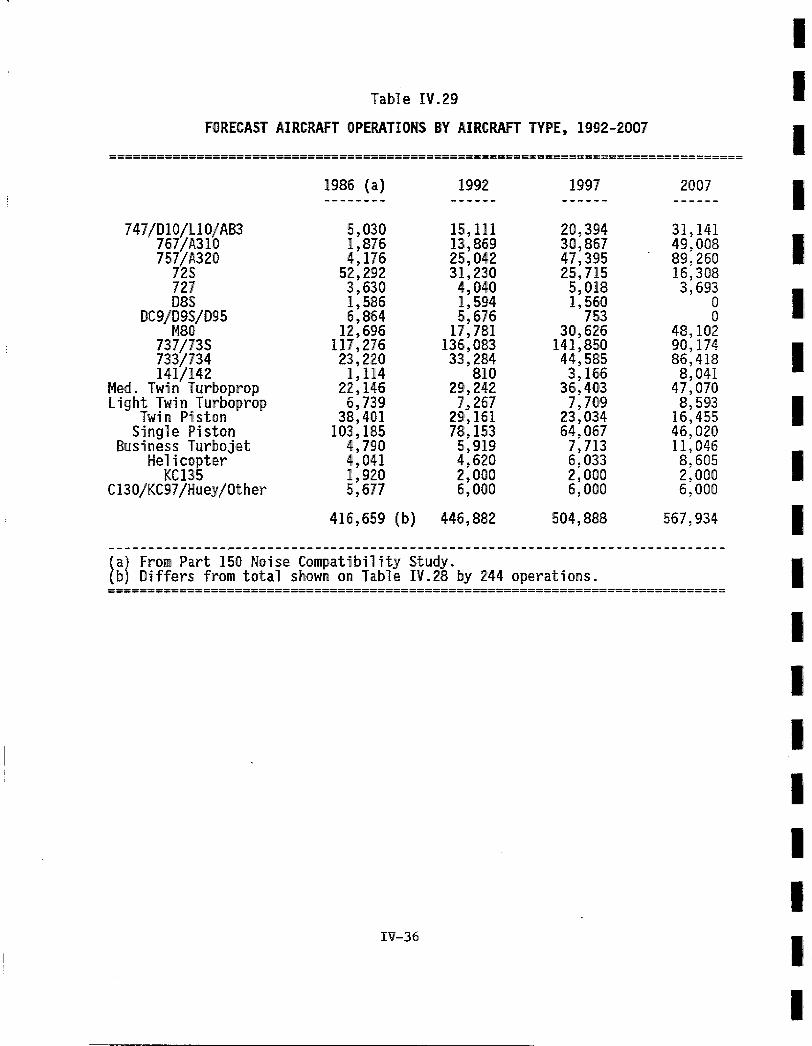
Table IV.29
FORECAST AIRCRAFT OPERATIONS BY AIRCRAFT TYPE,. 1992-2007
i !
I 1986 (a) 1992 1997 2007
747/DIO/LIO/AB3. 5,030 15,.111 20,394 31,141 767/A310 1,876. 13,869 30,867 49,008 757/A320 4,176 25,042 47,395 89,260
72S 52,292 3.1,23.0 25,715 16,.308 727 3,630 4,040 5,0,18. 3,693 D8S 1,586 1,594 1,5.60 0
DCg~D9S/D95 6,864 5,676 753 0 M80 12,696 17,7.81 30,626 48,102
737/73.S 117,276 136,083. 141,850 90,174 733./73.4 23,220 33,284 44,585 86,418 141/142 1,114 810 3,166 8,041
Med. Twin Turboprop 212,146 29,242 36,40,3. 47,070 Light Twin Turboprop 6,739 L267 7,709 8,593
Twin Piston 38,401 29,161 23,034 16,455 Single Piston 103,185 78,153 64,067 46,020
Business Turbojet 4,790 5,919' 7,713 11,046 Helic.opter 4,041 4,620 6,.033 8,605
KC135 1,920 2,000 2,000 2,000 C130/KCg7/Huey/Other 5,677 6,.000 6,000, 6,000
416,659 (b) 446,882 504,888 567,.934
(a) From Part 150 Noise Compatibility Study. (b) Differs from total shown on Table IV.28 by 244 operations.
m I ! ! !
I I i
IV-36
i !
i i I I i

I I I
Table IV.30
FORECAST OF ON-AIRPORT EMPLOYMENT, 1992-2007
I I I I I I I
Airline Airport Air FBOs U.S. Aviation Year (b) Bus. (c) Cargo (d) (e) Gov't. (f) Dept. (g) Total
1987 (a) 4,257 8,600 950 160 1,500 479 15,946
1992 5,751 10,504 1,421 160 1,500 514 19,850
1997 7,700 13,425 1,900 160 1,500 580 25,265
2002 9,552 16,125 2,429 160 1,500 615 30,381
2007 10,851 18,018 3,106 160 1,500 653 34,288
Proportional to forecasted increased l~I P~o,o~on~ ~o ~ore~s~e~ ~nc~e~es
Proportional to forecasted increases l~I Assumed Assumed constant, constant due to increases in
(g) Proportional to forecasted increases
in enplanements. in originations. in all-cargo tonnage. larger based aircraft.
in total operations.
I I I I I I I I I
IV-37