i. introduction - civimi mgmt-449 (content...i. introduction “coca-cola and ... consumer-based...
TRANSCRIPT
1
Soft drink Industry
I. Introduction
“Coca-Cola and Shasta.” These two products are in the same industry and both were
invented around the same time. Nonetheless, a very different perception comes to consumers‟
mind when they hear these two words. In the 21st century, Coca-Cola is considered one of the
most valuable brands in the world, whereas Shasta is mostly known in United States, particularly
in the West Coast region. Coca-Cola is owned and operated by The Coca-Cola Company, and
Shasta is currently owned by National Beverage Corp. This report will examine, compare, and
analyze both companies in terms of operation, promotion, management, and finance. In addition,
SWOT analysis and Porter‟s Five Forces will be conducted to evaluate the companies‟ positions
in the industry. The report will also identify several issues that both companies currently face and
suggest alternatives and recommendations in order assist Shasta, a subsidiary of National
Beverage Corp., to gain more market share. Table 3 exhibits that National Beverage Corp. makes
up only about 2.8% of the soft drink industry in 2010.
Company Background
Dr. John Pemberton, a pharmacist from Atlanta, invented Coca-Cola in 1886. The
world‟s largest non-alcoholic beverage company trademarked its name and logo in 1893. After
thirty years of establishment, the company went public in 1919. The share price of its initial
public offering (IPO) was $40 a share (Datamonitor, 2010). Coca-Cola expanded rapidly; it is
currently available in more than 200 countries and reaches about 99% of the world population
(National Geographic Channel, 2011). Consumption rate of trademarked or licensed products
amounts to 1.7 billion servings a day. As of December 31, 2010, the company has 139,600
employees worldwide (The Coca-Cola Company, 2011).
Similarly, Shasta was founded in 1889, three years after Coca-Cola. In Northern
California, Mt. Shasta, “a group of businessmen opened a health and vacation resort at the site
and featured naturally carbonated spring water.” The carbonated water received positive
feedbacks from clients who stayed at the health and vacation resort. Shortly after, these
businessmen established Shasta Mineral Springs Company and started selling the product
throughout the West Coast region, including California, Oregon, and Washington. In 1928, the
company was renamed The Shasta Water Company, and began to diversify its carbonated water
line to a segment with more flavors. In 1985, Shasta was acquired by National Beverage Corp.
Despite of the acquisition and product diversification, Shasta is serving the same West Coast
market that it was serving decades ago (Shasta Beverage, Inc, 2010).
Target Market
Coca-Cola views everyone as potential consumers. Coca-Cola targets all age groups;
however, the one with most potential is the age group between 18 to 25 years old, which tends to
have busy lifestyles. Furthermore, the company attempts to appeal students and family-oriented
consumers. The socio-economic status of these demographics ranges from lower to upper-lower
income level (Grimm, 2000). These are a few characteristics of Coca-Cola‟s target market.

2
Soft drink Industry
Shasta‟s main focus is variety. Even though the company sells a variety of cola, the sales
of other flavors are better. Statistics show that ethnic groups prefer flavored drinks over cola.
Based on this research, Shasta has centered its target market on ethnic groups. Shasta‟s
demographic targets: low to middle income consumers, less educated individuals, and large
families. Psycho-graphically, the company targets individuals who look for value and quality in a
product, like Shasta cola, as an alternative to Coca-Cola or Pepsi (C. Anicich, E-mail Interview,
April 20, 2011).
Table 3: Industry Trends & Comparison Analysis (source: Beverage Digest)
Source: Beverage-Digest (Top-10 CSD Results for 2010).
II. Operational Analysis
The Coca-Cola Company
Raw Materials
Water is the main ingredient used in Coca-Cola‟s products. The soft drink is made from
diluting water with concentrates and sweeteners. The concentrates used in Coca-Cola‟s beverage
remains a secret; therefore, the company does not allow filming during manufacturing processes.
According to National Geographic (2011), the beverage is made with 90 percent water. Because
water‟s taste varies at every location, Coca-Cola has to neutralize the water to ensure that its
products taste consistently worldwide. The other main ingredient is high fructose corn syrup
(HFCS) and since imported sugar is more expensive, Coca-Cola uses HFCS as its principal
sweetener.
Manufacturing
Coca-Cola is the largest player in the non-alcoholic beverage industry. It operates in over
206 countries and has 900 bottling plants and factories worldwide with locations such as Eurasia,
Africa, Europe, Latin America, as well as North America (National Geographic, 2011). Due to
this, these manufacturers must adhere to strict standards in order to produce standardized Coca-
Cola‟s products. Moreover, Coca-Cola manages its manufacturing processes efficiently. For

3
Soft drink Industry
example, the new factory in Baton Rouge operates 24 hours a day, five days a week, and can
produce up to 4.5 million beverages in one day. Additionally, in recent efforts to be
environmental friendly, the company announces that it will change its electrical equipments and
reduce water usage. The decision is projected to save the company approximately one million
dollars annually.
Distributions
Coca-Cola has the world‟s largest distribution system; hence, it is able to reach almost
every region (Coca-Cola Co., 2011). The company distributes its beverages to consumers
through various retailers, wholesalers, vending machines, and distribution centers. Furthermore,
it sells its syrup and concentrates to cafés and restaurants used in fountain drink dispensers.
National Beverage Corp. (Shasta)
Raw Materials
National Beverage Corp. collaborates with many suppliers for raw materials and
packages. Moreover, the company consolidates its purchasing function for cost containment
purposes (National Beverage Corp. 10K, 2010). This advantage allows the company to compete
against major beverage companies. Some of the materials used to produce the beverages are
sweeteners, juice concentrates, carbon dioxide, water, glass, plastic bottles, aluminum cans,
paper, cartons, and closures (NBC 10K, 2010). The costs of the materials are very volatile;
reasons being are because of gas prices, tariffs, foreign exchange fluctuations, etc. Consequently,
the company purchases forward agreements with suppliers to minimize the price increases on
certain materials.
Manufacturing
National Beverage Corp. sets up manufacturing plants strategically. Its twelve
manufacturing facilities are located near major U.S. metropolitan cities; thus, enabling the
company to distribute products promptly and efficiently (NBC 10K, 2010). In manufacturing
plants, the company bottles and cans its beverages. National Beverage Corp. believes that
ownership of bottling facilities provides a competitive advantage over some competitors‟
dependency on third party bottlers (NBC 10K, 2010). As a result, the company is able build its
own competitive advantage and becomes more experienced and efficient.
Distributions
National Beverage Corp. utilizes a hybrid distribution system to deliver products through
three primary distribution channels: take-home, convenience and food-service (NBC 10K, 2010).
Take-home channel distributes to grocery stores, wholesalers, and warehouse stores such as
Costco. Secondly, the convenience channel, which distributes to gas station and convenient
stores such as 7-Eleven stores. This channel allows the company to charge higher selling price
than the other channels because of lower sales volumes. The last channel is food-service. This
channel distributes its products to schools, hotels, airlines, restaurants, and other food related
places.

4
Soft drink Industry
III. Promotional Analysis
The Coca-Cola Company
Word-of-Mouth
Consumers are talking about brands and companies every day, and it so happens that a
vast number of conversations are about Coca-Cola. According to Keller Fay Group, a research
marketing firm, a study of 25,142 consumers shows that Coca-Cola is currently the most talked
about brand in America (Wang, 2008). This finding demonstrates and measures the sample of
consumers‟ conversations on a daily basis. In addition, the CEO of Keller Fay Group, Ed Keller,
states, “…these brands fall under the realm of „social categories‟ and have greater frequency of
purchase.” As a result, consumers are exposed to packaged goods‟ logos and slogans frequently.
The more products consumers purchase daily, the more likely that they are to start conversations
about the products within their social circles. The table below exhibits the ten most talked about
brands and Coca-Cola is placed first.
Top 10 Word-of-Mouth Most Talked About Brands:
1. Coca-Cola
2. AT&T
3. Verizon
4. Pepsi
5. Wal-Mart
6. Ford
7. Dell Computers
8. Sony
9. Chevrolet
10. McDonald's
Public Relations
Coca-Cola has strong public relations because it is always on the forefront of contributing
to the community and society. For instance, Coca-Cola recently announces to the press that it has
just established the Coca-Cola Japan Reconstruction Fund, which promises to raise 2.5 billion
yens ($31 million U.S dollars), to assist the reconstruction of Japan over the next three years
(“Coca-Cola raises”, 2011). As a result of this generous act, Coca-Cola will receive great public
media presses.
Social Media
Since the emergence of social media on the Internet, Coca-Cola has increased its
presence in the global community. For example, Coca-Cola‟s Facebook page has more than 5.18
million fans and still growing, which makes Coca-Cola‟s page one of the top fan pages on
Facebook (Staff, 2010). This illustrates the immense community support and brand loyalty the
company receives on the Internet. In addition, Coca-Cola also utilizes the Internet as a tool to
support the community in charitable acts. Example being, Coca-Cola promises to give one dollar
to the Boys and Girls Club every time a Facebook user gives a friend a “virtual coke;” thus,
raising about $126,000 for the organization (Staff, 2010). Overall, Coca-Cola uses the social
media for community engagements and also to reach out to more consumers.
Global Branding
As the first mover in the market, Coca-Cola is currently known as a global brand, not just

5
Soft drink Industry
an American brand. For instance, when the company entered the China market in 1928, the first
direct translations of Coca-Cola had absurd meanings; such as "bite the wax tadpole” or “female
horse stuffed with wax.” However, with due diligence and core competency in branding
research, Coca-Cola was able to choose different characters pronounced "K'o K'ou K'o LE,"
which literally means, “let the mouth rejoice” or “happiness in the mouth” (Wooten, 2011). This
proves that the company takes branding seriously and tackles every global venture strategically
by adapting to local cultures.
National Beverage Corp. (Shasta)
Overview
In the company‟s mission statement, National Beverage Corp.‟s main focus is variety. Its
soft drink line has over thirty different flavors with new flavors being tested every day. Its goal is
to have consumers identify themselves with particular flavors. As individuals grow older, their
likes, tastes, and personalities will change. National Beverage Corp. encourages its consumers to
link their transformations to their favorite soft drinks. Its other objective is to promote itself as a
friendly soft drink company that everyone can relate to. By using social media platforms such as
Facebook, the company is able to reach out to current as well as new consumers. Also, word-of-
mouth is known as the greatest influence for consumers; thus, National Beverage Corp. hopes to
satisfy consumers in order to create a word-of-mouth “boom” effect. Conceivably, this tactic can
possibly lure over other consumers who belong to its competitors. The company also follows a
consumer-based promotional strategy that centralizes on fitting the consumer‟s image to his or
her favorite drink, rather than creating an image for consumers like Coca-Cola. With this,
National Beverage Corp.‟s promotional strategy can be dissected into parts by engaging the
promotional strategy mix: advertisement, public relations, sales promotion, personal selling, and
direct mail.
Advertising
Recently, National Beverage Corp. began showing television and online commercials
highlighting its low prices in comparison to larger soft drink companies. These comical
commercials exhibit individuals being hit in the heads with a Shasta can; thus, coining the “Hit
in the Head” theme. The end of the advertisement shows a statement, “Some people wouldn‟t
know a good deal even if it hits them in the head.” The focal point is to gain a satirical image in
the viewers‟ minds to reiterate the fact that National Beverage Corp.‟s soft drinks are usually
priced lower than its competitors. Moreover, the vibrant colors used in the commercial highlight
the many flavors that the company carries.
Public Relations
National Beverage Corp. cleverly uses the Internet as a medium to promote its image as a
“neighborhood friend” to its consumers. By utilizing Facebook, the company starts a monthly
promotional page called “Shasta Pop,” which is maintained by its employees who post three to
four weekly highlights. These posts mainly discuss about advertising soft drinks, especially
around the holidays. In addition, there are recipes on how Shasta can be combined in daily
cooking.

6
Soft drink Industry
Sales promotion
Presently, based on its “Shasta Pop” Facebook page, National Beverage Corp. uses a
Shasta van that travels around California and gives out free soda cans, discounts, coupons, and
T-shirts. This promotional tactic is known as “Shasta Pop Stops.” For example, to promote new
flavors, Stater Bros. will be inviting the Shasta pop van with KFROP radio station to its store
locations. Moreover, fans are able to follow the Shasta van by tuning in to some of their local
radio stations.
Personal Selling
In terms of sales, National Beverage Corp. mainly conducts business with local retail
grocery stores. In order to promote its products, it offers attractive discounts to retailers through
partnerships. For example, a retailer that chooses to place National Beverage Corp.‟s products in
front of the store will receive a higher profit for every sale.
Direct Mail
As Internet usage increased exponentially over the years, National Beverage Corp. uses
the Internet to send promotions to consumers via E-mail. Subscribers of “Shasta Pop” Facebook
page receive periodic coupons through their Facebook‟s wall and E-mail accounts.
IV. Financial Analysis
Sales
Graph 1 shows that Coca-Cola generates most of its revenue from international markets.
The U.S. revenue accounted for 31.7% of the total revenues in 2010, which was $11.1 billion, a
gain of 34.6% compared to 2009 revenues. Moreover, international markets made up 74.1% of
the total revenues in 2010, which was about $23.9 billion, an increase of 4% compared to 2009
international revenues. The significant growth in U.S. sales can be traced to the gain from the
acquisition of Coca-Cola Enterprises and the growth of its other beverage products, such as Fuze,
Trademark Simply, and tea. However, international market sales rose slightly due to the
concurrent growth in emerging markets as well as a decline in developed markets. Additionally,
the unfavorable impact of foreign currency exchange rates was primarily responsible for a
stronger U.S. dollar compared to other currencies (Coca-Cola, 2011, p. 63).
Source: 2010 Coca – Cola 10-K Report
7%13%
11%
32%
14%
23%0%
Graph1: Coca Cola 2010 Sales by Segment
Eurasia & Africa
Europe
Latin America
North America
Pacific
Bottling Investment
Corporate

7
Soft drink Industry
On the other hand, National Beverage Corp. sells its products to U.S. market only.
Therefore, its domestic sales accounted for 100% of the total revenue in 2010, which was $593.5
million, an increase of 3.2% from 2009. Robust revenue in 2010 resulted from growth in the
sales of case volume of 1.2% for energy drinks, juices and waters; and 5.1% for branded
carbonated soft drinks. Moreover, “unit pricing increased 0.9% which mostly due to positive
product mix changes. The improvement was partially offset by a decline in allied branded
volume” (NBC, 2011, p. 13).
For the past six years, Coca-Cola increased its revenues and net incomes with average
growth rates range from 8% to 18% annually. In 2005, sales were only $23.1 billion. However,
2010 sales amounted to $35.1 billion, an increase of 13% from 2009. Additionally, 2010 net
income was $11.8 billion, an increase of 72% from 2009. The large growth was due to when the
company acquired Coca-Cola Enterprises in October 2010, it recorded other income of $4.8
billion. However, Coca-Cola experienced drawbacks in 2009 after the 2008 market crash. Its
revenue dropped 3% to $30.9 billion; nonetheless, its net income still grew to 17.5% during 2009
as a result of price increase and effective cost cutting method of operating expenses as well as
cost of goods sold (see Table 1).
Even though National Beverage Corp. did not experience as much growth as Coca-Cola
in its financial statements, its revenues have also been rising steadily since 2005. In 2010,
revenue reached its highest level at $593.5 million, an increase of 3% from 2009. Likewise, 2010
net income was $32.8 million, an increase of 33% from 2009, primarily due to “higher sales
volume, favorable changes in product mix and lower raw material costs” (NBC 10-K, 2010, pg
13). Since 2005, revenue increased with an average of 3% per year, and net income growth
averaged 11% annually. National Beverage Corp. experienced some setbacks in 2008 when the
recession occurred. Though revenue increased, net income decreased by 9% to $22.5 million (see
Table 2).
Table 1: Coca Cola Company (2005 -2010) (in millions)2010 2009 2008 2007 2006 2005
Net Oper. Revenue 35,119 30,990 31,944 28,857 24,088 23,104
Cost of goods sold 12,693 11,088 11,374 10,406 8,164 8,195
Selling, general and admin expenses 13,158 11,358 11,774 10,945 9,431 8,739
Net Income 11,859 6,906 5,874 5,981 5,080 4,872
Source: sec.gov (Coca – Cola Company 10-K Consolidated Income Statement)
Table 2: National Beverage Corp. (2005 -2010) (in thousands)2010 2009 2008 2007 2006 2005
Net sales 593,465 575,177 566,001 539,030 516,802 495,572
Cost of sales 396,450 405,322 393,420 365,793 349,131 340,206
Selling, general and admin expenses 145,159 131,918 138,447 137,212 135,090 130,037
Net income 32,853 24,742 22,480 24,682 22,226 16,886
Source: sec.gov (NBC 10-K Consolidated Income Statement)

8
Soft drink Industry
Financial Overview
According to data compiled by Bloomberg, Coca-Cola, leader in non-alcoholic beverage
industry, is valued at $153.15 billion via the market capitalization method. On the contrary,
National Beverage Corp., on the mid-size market capitalization roster, is valued at only $628.23
million. In another word, Coca-Cola‟s value is approximately 244 times more than National
Beverage Corp.‟s. Table 1 and table 2 show the income statements for these two companies for
comparison purposes. Coca-Cola has been able to increase its revenues year after year and
recorded top net sales at $35.1 billion in 2010. Gross margin was 63.9%, or another way of
interpreting this is the company took away $0.639 per dollar of sale. Furthermore, after all
expenses and income tax deductions, $0.336 was net income per dollar of sale. The company
boosted its bottom line from $6.8 billion to $11.8 billion primarily through revenue growth
($31.0 billion to $35.1 billion). For costs associated with cost of goods such as selling, general
and administrative expenses (SGA) and income tax, all increased as a percentage of sales.
However, the growth in revenue contributed enough to still see net income improve (Coca-Cola,
2011).
Similarly, National Beverage Corp. has also been able to increase its revenue; therefore,
increasing its net income year after year. Gross margin in 2010 was 33.2% compared to 29.5% in
2009. Due to lower economies of scale, National Beverage Corp.‟s largest expense has been
consistently cost of goods sold. Even though the company was able to reduce cost of goods sold
expense from 70.47% to 66.80%, this expense was still high and is financially harmful.
However, the reduction in cost of goods sold in 2010 was a major driver that led to a bottom line
growth from $24.7 million to $32.9 million (NBC 10-K, 2010).
Financial Ratios Analysis
Coca-Cola
COKE (KO:US)
Current Quick ROA ROE Assets
Turnover
Inventory
Turnover
A/P
Turnover
A/R
Turnover
LT-
Debt to
Assets
Total
Liabilities to
Total Assets
Interest
Coverage
1.17 0.85 14.82% 42.32% 0.58 5.07 times
or 72 days
7.88 times
or 46.32
days
8.58 times
or 42.54
days
0.19 0.57 19.43
Coca-Cola‟s financial ratios indicate that the company is in good health. In respect to
profitability, return on assets (ROA) was 14.82% and return on equity (ROE) was 42.32%. These
figures help the investors to assess management performance. Furthermore, liquidity indicators
measure the company‟s ability to meet short-term obligations. In 2010, current and quick ratios
were 1.17 and 0.85, respectively. The quick ratio presents a more stringent figure on liquidity.
Even though the “Golden Rule” states that it should be at least one, a figure like Coca-Cola‟s can
9
Soft drink Industry
be considered normal for a multinational company.
Solvency calculations include long-term debt to total assets as well as total liabilities to
total assets, which calculated at 0.19 and 0.57, respectively. Additionally, the interest coverage
ratio, which indicates how many times interest expense is covered by operating profits before
taxes and interest are factored in. Coca-Cola‟s interest coverage ratio was 19.43, which meant
operating profit was about 19 times larger than interest expense. Although there were not enough
liquid assets to satisfy current obligations (total liabilities to total assets ratio of 0.57), operating
profit was more than adequate to service the debts.
In addition to the calculations above, activity ratios measure how effective the company
is utilizing its assets. Assets turnover, the amount of sales generated for every dollar's worth of
assets, was 0.6. Inventory turnover, indicates how many times a company's inventory is sold and
replaced over a period, and calculated at 5.07 times per year or every 72 days. This shows that
inventories were managed well. Accounts payable, represents an entity's obligation to pay off a
short-term debt to its creditors, was 7.88 times or every 46 days. Accounts receivable, is used to
quantify a firm's effectiveness in extending credit as well as collecting debts, reported at 8.58
times per year or every 43 days (Coca-Cola, 2011).
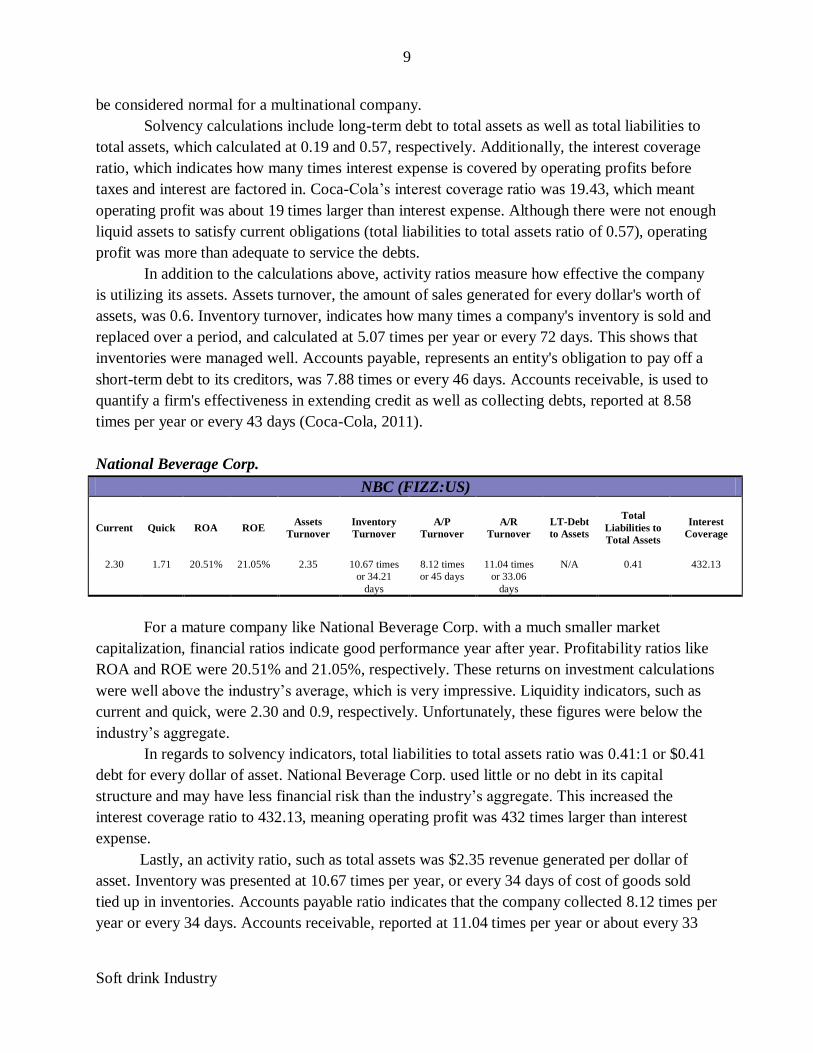
National Beverage Corp.
NBC (FIZZ:US)
Current Quick ROA ROE Assets
Turnover
Inventory
Turnover
A/P
Turnover
A/R
Turnover
LT-Debt
to Assets
Total
Liabilities to
Total Assets
Interest
Coverage
2.30 1.71 20.51% 21.05% 2.35 10.67 times
or 34.21
days
8.12 times
or 45 days
11.04 times
or 33.06
days
N/A 0.41 432.13
For a mature company like National Beverage Corp. with a much smaller market
capitalization, financial ratios indicate good performance year after year. Profitability ratios like
ROA and ROE were 20.51% and 21.05%, respectively. These returns on investment calculations
were well above the industry‟s average, which is very impressive. Liquidity indicators, such as
current and quick, were 2.30 and 0.9, respectively. Unfortunately, these figures were below the
industry‟s aggregate.
In regards to solvency indicators, total liabilities to total assets ratio was 0.41:1 or $0.41
debt for every dollar of asset. National Beverage Corp. used little or no debt in its capital
structure and may have less financial risk than the industry‟s aggregate. This increased the
interest coverage ratio to 432.13, meaning operating profit was 432 times larger than interest
expense.
Lastly, an activity ratio, such as total assets was $2.35 revenue generated per dollar of
asset. Inventory was presented at 10.67 times per year, or every 34 days of cost of goods sold
tied up in inventories. Accounts payable ratio indicates that the company collected 8.12 times per
year or every 34 days. Accounts receivable, reported at 11.04 times per year or about every 33

10
Soft drink Industry
days worth of sales outstanding. In conclusion, National Beverage Corp. also appears to be in
good financial standing.
V. SWOT & Porter’s Five Forces Analysis
SWOT Analysis
Coca-Cola SWOT Analysis
Strengths:
- Strong brand image and customer loyalty
- Robust global infrastructures and distribution
system
- Various product offerings
- Solid financial condition and market presence
Weaknesses:
- High fixed costs of business
- Several product recalls
- Higher prices compared to others
Opportunities:
- Expand to other developing countries
- Offer new beverages/drinks
- Shift focus to volume/price/mix
Threats:
- Change in customer preferences
- Global economic recession
- Foreign exchange fluctuations
National Beverage Corp. SWOT Analysis
Strengths:
- Diverse product offerings
- Hybrid distribution system
Weaknesses:
- Low profit margin
- Limited to U.S. market only
Opportunities:
- Expand to other neighboring countries
- Offer new beverages/drinks
- Increase in the non-alcoholic beverage
industry
Threats:
- Change in customer preferences
- Global economic recession
- Rising cost of inputs
- Competition from major beverage
manufacturers
Porter’s Five Forces (Soft Drink Industry)
Threat of new entrants (Low):
(H): Low switching cost for buyer, Low product differentiation
(L): High economies of scale, High capital requirement, Low access to distribution channel
Power of buyers (Moderate-High):
(H): Low switching cost for buyer, Moderate product differentiation for supplier
(L): Low purchase volume for buyer, Low threat of backward integration
Power of suppliers (High):
(H): High switching cost to another supplier, High suppliers‟ concentration, Low availability for
product substitute

11
Soft drink Industry
(L): High importance of customer, Low threat of forward integration
Threat of substitute product (Moderate-High):
(H): High differentiation of substitute product
(L): Low price performance relationship
Intensity of Rivalry (Very high):
(H): High number of competitors, Low industry growth rate, high fixed cost and storage cost,
Low switching cost for buyers, High exit barriers
(L): None
VI. Management Analysis
The management analysis section will examine management structures, corporate
policies, mission statements, and vision statements of both The Coca-Cola Company and the
National Beverage Corp. The management structure segment will explore the corporate leaders
and executives as well as the workplace environment. A segment on corporate policy will
observe responsibilities and ethics expectations of every employee. The last segment will
analyze each company‟s mission and vision statement and what it means to the company.
The Coca-Cola Company
Management Structure
Management at the corporate level is headed by Muhtar Kent, Chairman of the Board of
Directors and Chief Executive Officer. Other top officers at the Coca-Cola Company include
Executive Vice President Irial Finan, Chief Financial Officer Gary Fayard, President of North
America Alexander Douglas, and President of Latin America Jose Reyes.
Competitive Rivalry
(Very High)
Threat of New Entry
(Low)
Buyer Power
(Moderate High)
Threat of Substitution (Moderate-
High)
Supplier Power (High)

12
Soft drink Industry
Coca-Cola creates a winning culture by developing a diverse workplace. At the core,
there is the “right employee” value proposition, which is directly affected by four key values.
These values are finding the right talent, right capabilities, right leaders, and the right workplace
(Global Diversity, Our Strategic Framework 2010). In order to create the right workplace, the
company must sustain positive diversity and fairness on all levels of operations. Finding the right
talent relates to matching the right people with the market they serve. Building the right
capabilities is about sharing social culture and knowledge in the workplace. The right leaders
leverage talent in the workplace to achieve superior results across the business. Coca-Cola
Company currently employs 139,600 people, also known as “associates” (Businessweek, 2011).
Corporate Policy and Ethics
The Coca-Cola Company has been able to enhance its reputation through integrity and
ethical conduct. Therefore, it is important for the company to safeguard these values and set
standards to ensure employees do the right thing. The company‟s Code of Business Conduct
covers guidelines on integrity around the globe, internal as well as external integrity, and
conflicts of interest.
Mission and Vision Statement
The Coca-Cola Company has set long term road-map of acquiring its bottling partners.
The 2020 vision defines the company‟s attitudes and behaviors that are required to turn the
vision into reality. Furthermore, Coca-Cola‟s mission statement serves as a guideline for
company‟s actions and decisions (Mission, Vision, Values, 2010).
National Beverage Corp.
Management Structure
The executive team at National Beverage Corp. is led by Chairman of the Board and
Chief Executive Officer Nick A. Caporella. Other top officers include President Joseph
Caporella, Principal Financial Officer George Bracken, Executive Vice President of Procurement
Edward Knecht, and Chief Accounting Officer Dean McCoy.
National Beverage Corp. has been able to create a winning culture through several key
factors. First, the company works as a whole towards strength, knowledge, and longevity of
management team ([NBC] The Difference, 2010). Its second factor is the flexibility to plan
globally and act locally, this includes the process of vertical integration, hybrid distribution, and
basket of beverages ([NBC] The Difference, 2010). The company currently employs 1,200
workers (Businessweek, 2010).
Corporate Policy and Ethics
Ethical conduct is vital to ensure successful and lasting business relationships (National
Beverage Corp. Code of Ethics, 2007). National Beverage Corp. also sets high standards of
ethics for all its employees, supervisors, and managers. These include the procedures for the
employees to act accordingly when dealing with the following:
Conflicts of interest
The use of entertainment, gifts, and payments

13
Soft drink Industry
Relationships with customers or suppliers, and government employees
Receipt of items by National Beverage Corp. employees
Complete and accurate financial records as well as communication
The use of company assets
Workplace environment
Mission and Vision Statement
National Beverage Corp. continually strives to set a higher standard for value, quality,
variety and innovation as a leader in the beverage industry ([NBC] The Difference, 2010). It
continually positions itself as a unique beverage company with innovative ideas. Furthermore,
the company places its people, products research and development, environment, packaging, and
consumers at its forefront to create innovative advantages for the company.
VII. Alternatives
Financial Objectives
According to most observers, there are two strategies for achieving superior performance
in any business. One strategy is product and service differentiation; the other is low-cost
leadership. In National Beverage Corp.‟s case, it is appropriate to suggest a low-cost leadership
strategy. This method focuses on consumers‟ attention on product pricing, often using such
slogans as “everyday low prices” or “the lowest price in town.” The goal is for the company to
become the lowest cost producer in the marketplace so it can underprice the competition, achieve
the highest sales volumes, and still make a profit on each sale. This can be attained by making
quantity discount purchases, having a lean administrative structure, and using production
efficiencies from vigorous cost containment.
As the business environment changes, few companies actually pursue just one strategy.
Most will attempt to implement both-developing customer loyalty while controlling costs.
National Beverage Corp.‟s management will now have to decide to: (1) improve profit margin,
(2) increase asset turnover (more sales volume or fewer assets), or (3) both. In this case, it is best
for management to formulate goals to increase profit margin.
05
1015202530
0 0.5 1 1.5 2 2.5 3
Pro
fit
Mar
gin
Assets Turnover
ROA and Competitive Advantage
NBC
COKE

14
Soft drink Industry
Strategic Objectives
The core business from these two companies stems from the production of soft drinks.
Coca-Cola has its Coke line as National Beverage Corp. has Shasta. Unfortunately, there are
many products within National Beverage Corp. that cause brand dilution. To overcome this
effect, the company can shift focus back to the Shasta brand and eliminate low performing
players. This will in turn, strengthen Shasta and consolidate the brands that are left. Some
alternatives the company may want to consider are broken down into short-term and long-term.
Short-term
In order for Shasta to gain greater brand recognition in a short time, it is imperative that National
Beverage Corp. increases its marketing budget. Several possibilities to better market Shasta are:
● Advertise at college sports events
● Target more local domestic stores to increase “Buzz” effect
● Use celebrity advertising, specifically older television show celebrities
● Create a new commercial that is consistent with the marketing strategy of Shasta (example:
promote self-identities of consumers through favorite soft drinks)
These potential marketing strategies all focus on strengthening Shasta‟s brand image. They also
allow the company to remain consistent with its overall marketing plan.
Long-term
Further analysis shows that Shasta‟s range of consumers is very narrow. The company only
distributes in four states: California, Arizona, Utah, and Minnesota. Several approaches to
increase sales of Shasta are:
● Distribute to more states
● Develop distributing partnerships with large retailers like Target
Expanding distribution channels will boost sales of Shasta. The residual income can then be used
to invest in building new production plants. Moreover, developing contracts and partnerships
with large retailers like Target will ensure greater product placement, therefore, revamp brand
awareness among consumers.
VIII. Recommendations
Short Term
Create a new commercial that is consistent with the marketing strategy of Shasta
Shasta rarely advertises on TV or online. However, it does have a popular commercial,
which aired recently, “Hit in the head.” Unfortunately, it is neither good nor interesting. Besides,
it does not match with the company‟s current marketing strategy to have consumers identify
themselves with their favorite beverages. If Shasta is able to create a different approach for its
advertising method and follow its marketing strategy, it may be able to obtain greater brand
recognition and market shares in the soft drink industry. Since Shasta is National Beverage
Corp.‟s core competency, the company should approach the consumers based on this beverage
line. The best way is to create a commercial that promotes self-identity based on the flavors that
Shasta offers. With the target market being very diverse, this new commercial might appeal not

15
Soft drink Industry
to just different ethnic groups, but also younger consumers who like to be different and unique.
Long Term
Develop distributing partnerships with large retailers to increase profit margin
In 2010, National Beverage Corp. had a 66% cost of sales ratio, whereas Coca-Cola had
34.3%. National Beverage Corp.„s cost of sales was excessively high for industry‟s standard;
therefore, was the primary cause of low profit margin. In order to increase profit margin, the
company should lower its production costs by achieving larger economies of scale through
building or developing distributing partnerships with large retailers like Target. This in turn will
lower production and distribution costs. Consequently, Shasta cola brand will be available to
many other states and reach more consumers and markets; thus, boosting revenue and total sales
volume.

16
Soft drink Industry
XI. Bibliography
About National Beverage Corp.. (2009, January 1).National Beverage Corp.. Retrieved March
28, 2011, from http://www.nationalbeverage.com/10AboutNBC.htm
Coca Cola Company. (2008, Feb. 28). 2007 Form 10-K. Retrieved March 29, 2011, from
http://sec.gov/Archives/edgar/data/21344/000119312508041768/d10k.htm
Coca Cola Company. (2011, Feb. 28). 2010 Form 10-K. Retrieved March 28, 2011, from
http://ir.thecoca-colacompany.com/phoenix.zhtml?c=94566&p=IROL-
secToc&TOC=aHR0cDovL2lyLmludC53ZXN0
bGF3YnVzaW5lc3MuY29tL2RvY3VtZW50L3YxLzAwMDEwNDc0NjktMTEtMDAx
NTA2L3RvYy9wYWdl&ListAll=1&sXBRL=1
Coca-Cola Raises Total Pledge to 2.5bln Yen for Japan Relief. (2011). Asia Pulse.
Datamonitor. (2010, Apr. 15). National Beverage Corp: Company Profile. Datamonitor
Company Profiles Authority. Retrieved March 27, 2011, from
http://search.ebscohost.com.lib-proxy.fullerton.edu/login.aspx?direct=true&db=
buh&authdb=dmhco&AN=7E22BD44-DB90-4E61-AE79-F5F25D7169FB&site=bsi-
live
Datamonitor. (2010, May 28). The Coca Cola Company: Company Profile. Datamonitor
Company Profiles Authority. Retrieved March 27, 2011, from
http://search.ebscohost.com.lib-proxy.fullerton.edu/login.aspx?direct=true
&db=buh&authdb=dmhco&AN=37CB5616-D04E-49EE-9F5C-
FFE75047D6FF&site=bsi-live
Disclaimer/Terms of Use. (2009, January 1). National Beverage Corp.. Retrieved March 27,
2011, from http://www.nationalbeverage.com/SiteInfo.htm
Events & Promotions - Shasta. (2010, January 1). Shasta Beverages, Inc. Retrieved March 28,
2011, from http://www.shastapop.com/events-promotions/
Grimm, M. (2000). Drink me. American Demographics, 22(2), 62-63.
Marketing Mix (4 p's) - Promotion and Promotional Strategies. (2010). Welcome to
Learnmarketing.net - Learn about Marketing here. Free Marketing Education, Lessons
and Marketing Resources. Retrieved March 27, 2011, from
http://www.learnmarketing.net/promotion.htm
Mission, Vision, & Values. (2011) Retrieved April 10, 2011, from
http://www.thecoca-colacompany.com/ourcompany/mission_vision_values.html
National Beverage Corp. (2007, Jul. 12). 2007 Form 10-K. Retrieved March 29, 2011, from
http://sec.gov/Archives/edgar/data/69891/000095014407006550/g08320e10vk.htm
National Beverage Corp. (2007). National Beverage Corp. Code of Ethics. National Beverage
Corp: Author
National Beverage Corp. (2009). The Difference - Our Vision.National Beverage Corp..
Retrieved April 10, 2011, from http://www.nationalbeverage.com/32OurVision.htm
National Beverage Corp. (2010, Jul. 15). 2010 Form 10-K. Retrieved March 29, 2011, from
http://sec.gov/Archives/edgar/data/69891/000095012310065795/g24048e10vk.htm
17
Soft drink Industry
National Beverage Corp. (2011, Jan. 21). National Beverage Corp (FIZZ). Value Line Investment
Survey, p. 4633
National Geographic Channel. (2011). Ultimate Factories [Web]. Available from
http://channel.nationalgeographic.com/series/ultimate-factories/5151/Overview#tab-
Videos/09750_00
Nguyen, J. (Interviewer) & Anicich, C. (Interviewee). (April 20, 2011). Shasta Target
Market [E-mail].
Shasta Beverage, Inc. (2010). Our History. Retrieved April 17, 2011, from
http://www.shastapop.com/history/
Sicher, J. (2011, March 17). Beverage-Digest. Top-10 CSD Results for 2010, 59(5), Retrieved
from http://www.beverage-digest.com/pdf/top-10_2011.pdf
Staff, J. (2010). Coke, Pepsi like 'net gains; cola rivals' fans on Facebook, twitter help steer, sell
the brands. The Atlanta Journal-Constitution, 13A.
The Coca-Cola Company. (2010). Code of Business Conduct: Acting with Integrity Around the
Globe. Coca-Cola Company: Author
The Coca-Cola Company (2010). Global Diversity Our Strategic Framework. Coca-Cola
Company: Author
The Coca-Cola Company. (2011). The Coca-Cola Company Fact Sheet. Retrieved April 17,
2011, from http://www.thecoca-colacompany.com/ourcompany/pdf/Company_Fact_Sh
eet.pdf
Van Liew, NC. (2011, Jan. 28). Coca-cola (KO). Proceedings of the Value Line Reports for The
Dow 30. Available from http://www3.valueline.com/dow30/f2084.pdf
Wang, E. (2008). Study: Coke, the most talked about brand in America. Brandweek, 49(38), 009.
Wooten, A. (2011). Preserving brand strength in global markets. Deseret News, WEB.