i ground-based and in-flight shdator studies of flight gharacteristics of a · i ' 2. -,...
TRANSCRIPT

i ' 2. -,
1 ' NASA ~ Technical ' Paper : 2451 I
c -2 I September 1985
Ground-Based and In-Flight Shdator ~ Studies of Flight Gharacteristics of a
.-
https://ntrs.nasa.gov/search.jsp?R=19850025831 2018-07-28T04:50:03+00:00Z

ERRATA
NASh TECHNICAL PAPER 2451
Ground-Based and I n - F l i g h t S imula to r S t u d i e s o f F l i g h t C h a r a c t e r i s t i c s of a Twin-Fuselage Passenge r Transpor t A i r p l a n e
During Approach and Landing
September 1985
W i l l i a m D. Grantham, P a u l M. Smith, W i l l i a m R. Neely, Jr., P e r r y L. Deal, and Kenneth R. Yenni
A p o r t i o n of t a b l e I1 w a s found t o b e i n e r r o r . Replace pages 1 5 and 1 7 w i t h t h e e n c l o s e d c o r r e c t e d pages .
ISSUE DATE:January 1986

TABLE 11. AERODYNAMIC DATA IJSED IN SIMIJLATION OF TWIN-FIJSELA<;E AIRPLANE CONCEPT
61 = 25'
a, deg , d e - ' CX cz Cm
-8 -0.06422 -0.0316 0.1327 0.1130 - .0745 -.3265 -.0655 -.0675 -.7899 -.2143 - ,0250 -1.2558 -.2845
,0420 -1.7328 - ,3078 I .1472 -2.1090 -.3027
-4 0 4
8 12
6,- = SO0
CX cz Cm
-0.1575 -0.2152 -0.0430 -.1870 - .6845 -.2215 -.1755 -1.1499 - .3703 -.1348 - 1.6204 - .4405 - .0665 -2.1025 - ,4638
,0561 -2.4985 - ,4587
a, deg
-8 -4
0 4 8
12
Numerical values at 6, of-
0 f5O *loo f15' f 2 0 0 f250
-8 -0.00214 -0.0021 1 -0.00206 -0.00196
-4 -.00110 -.00108 -.00106 -.00101
0 - .00005 - .00005 -.00005 -.00005
4 .00100 .00098 .00096 .00091
8 ,00204 ,00201 ,00196 ,00186
12 ,00307 ,00303 ,00296 ,00280
-0.04460 I -0.0
-0.00 177 -0.00149 -.00091 -.00077 - .00005 -.00005
,00081 ,00067 ,00167 ,00139 ,00252 .00210
-0.04073 1 -0.03672
-8 -0.01484 -0.0 1465 -0.01432 -0.01356 -4 -.014% -.01476 -.01443 -.01367
0 I -.01500 -.01480 -.01447 -.01370 4 -.01496 -.01476 -.0!443 -.01367
8 -.01486 -.01467 -.01434 -.01358
12 -.01468 -.01449 -.01416 -.01341
-0.0307 1
-0.01222 -0.01022 - .01232 -.01030 -.01235 -.(I1033 -.01232 -.01030 -.01224 -.01024 - ,01209 -.01011
15
LOO -0.04303

TABLE 11. Concluded
Q, deg
-8 -4
0 4 8
12
-8 -4
0 4 8
12
61 = 50' 61 = 25'
Cy,, rad-' rad-l C,, , rad-' Cyr, rad-l Cl, , rad-' Cn,, rad-'
0.6714 0.0983 -0.2383 0.7080 0.1873 -0.2893 .6734 ,1807 -.2421 ,7163 ,2736 - ,2960 .6926 ,2619 -.2491 ,7423 .3582 -.3085 .7229 ,3507 -.2547 .7789 .4496 -.3185 .7665 ,4365 -.2667 .8286 .5405 - .3349 3234 ,4991 -.2788 .8919 .6097 - ,3479
-8 -4
0 4 8
12
a , deg
-8 -4
0 4 8
12
0.00122 .00023
- ,00066 -.00146 - .00213 - .00266
cyp , rac-'
Cy6,, deg-' deg-' C7qr1 deg-' Cm,, rad-' emd, , rad-'
- 33.505
! -7ri -0.00536 0.00046 -0.00170 ,00047 -.00170 ,00048 -.00170 .00050 -.00169 ,00051 - ,00168 ,00051 -.00168
-0.0377 ,0635 ,1753 .2644 .3594 ,4327
6 1 = 25'
0.01265 ,01219 ,01167 .01121 .01028 ,00917
Cl,, rad-'
-0.5642 - .5649 -.5727 -.5944 - ,6233 - ,6556
0.00148 .00169 .00192 .00207 .00222 .00231
Cnp, rad-'
0.0872 ,0157
-.0518 -.0477 -.0947 -.1490
0.00325 ,00128
- ,00065 - ,00249 - ,00426 - .00596
Cyp, radp1
0.0422 .1438 .2558 .3420 .4356 ,5088
61 = 50'
0.02696 .02678 .02645 ,02599 .02540 .02469
elp, rad-l
-0.5467 -.5489 -.5643 -.5917 -.6260 --,6647
Cmg, I deg-'
0.00302 ,00424 ,00501 ,00536 .00557 ,00540
Cn,, rad-'
0.0546 - ,0084 -.0427 -.0423 - .OM0 -.1554
17

NASA Tec hn ica I Paper 2451
1985
N a t io ria I Ae rona u tlc s and Space Adminlstratlon
Scientific and Technical information Branch
Ground- B as ed and In- Fligh t Simulator Studies of Flip& - Characteristics of a Twin-Fuselage Passenger Transport Airplane During Approach and Landing
William D. Grantham Langley Research Center Harnpton, Virginia
Paul M. Smith PRC Kentron, Inc. Hampton, Virginia
William R. Neely, Jr. Air Force Systems Command Liaison Ofice Langley Research Center Hampion, Virginia
Perry L. Deal and Kenneth R. Yenni Langley Research Center Ha rnpton, Virginia
Summary Six-degree-of-freedom ground-based and in-flight
simulator studies were conducted to evaluate the low- speed flight characteristics of a twin-fuselage passen- ger transport airplane and to compare these char- acteristics with those of a large, single-fuselage (ref- erence) transport configuration similar to the Lock- heed C-5A airplane. The primary piloting task was the approach and landing task.
The results of this study indicated that the twin- fuselage transport concept had acceptable but un- satisfactory longitudinal and lateral-directional low- speed flight characteristics, and that stability and control augmentation would be required in order to improve the handling qualities.
The primary pilot objections to the unaugmented handling qualities were (1) low apparent pitch d a m p ing, (2) nonprecise attitude control due to large changes in pitch attitude caused by trailing-edge flap deflections, and (3) sluggish roll response.
Through the use of rate-command/attitude-hold augmentation in the pitch and roll axes, and the use of several turn coordination features, the handling qualities of the simulated transport were improved appreciably.
The in-flight test results showed excellent agree- ment with those of the six-degree-of-freedom ground- based simulator handling qualities tests.
As a result of the in-flight simulation study, a roll- control-induced normal-acceleration criterion was de- veloped. This criterion states that the ratio of maxi- mum incremental acceleration at the pilot station to the steady-state roll rate following a step lateral con- trol input (An,,p/p,,, g unit/(deg/sec)) shall not be greater than 0.020, 0.048, and 0.069 for pilot rating levels 1 (satisfactory), 2 (acceptable but unsatisfac- tory), and 3 (unacceptable), respectively.
No problems were experienced because of engine failure for the simulated aircraft concept.
The handling qualities of the augmented twin- fuselage passenger transport airplane exhibited an improvement over the handling characteristics of the reference (single-fuselage) transport.
,
-
Introduction Flying qualities simulation studies have been con-
ducted recently at the NASA Langley Research Cen- ter on very large and/or unusually configured cargo transports. However, some of these concepts were seen to be impractical because of their present incom- patibility with existing airport facilities. The present study concerns the flying qualities of a 250-passenger twin-fuselage transport. The aircraft is essentially two McDonnell-Douglas DC-9’s joined together, but
it has a gross weight less than twice that of the DC-9 and significantly improved seat-miles per gallon.
As previously stated in reference 1, the aircraft industry has for several years been aware that many of the existing stability and control requirements for aircraft are inappropriate because of the expansion of flight envelopes, the increase in airplane size, and the utilization of complex stability and control aug- mentation systems. Although research is presently being conducted in an effort to remedy this situa- tion, to date essentially no clearly defined stability and control requirements and criteria have been es- tablished for very large conventional or unconven- tional transports. Therefore, in an effort to aid in the future establishment of new stability and control re- quirements, the low-speed handling qualities param- eters of an unconventional, relatively large passenger transport are compared with some existing handling qualities criteria.
Piloted simulation studies offer a means of obtain- ing preliminary handling qualities evaluations of di- verse airplane concepts and assessing the adequacy of current handling qualities requirements. A previous piloted simulation study of a large twin-fuselage de- sign with augmented stability and control character- istics (ref. 1) compared the resulting handling qual- ities with those of a large single-fuselage transport configuration similar to the Lockheed C-5.4 airplane and assessed the adequacy of current handling qual- ities requirements. This paper will also utilize the “pseudo” C-5A as the reference configuration.
The primary objectives of this simulation study, which used both ground-based and in-flight simula- tors, were to evaluate the low-speed handling char- acteristics of a relatively large transport aircraft con- cept and to obtain adequate information to provide guidance for future research requirements. Other major objectives were as follows:
1. Compare the iow-speed dynamic stability and control characteristics of the subject passenger transport with those of a iarge reference trans- port configuration. (The reference aircraft was similar to the C-5A.)
2. Develop the augmentation systems necessary to produce satisfactory handling qualities.
3. Evaluate the effects of pilot lateral offset and various atmospheric conditions on the ability of the pilot to make a satisfactory approach and landing.
Symbols and Abbreviations Measurements and calculations were made in U.S.
Customary Units, and all calculations are based on

the aircraft body axes. Dots over symbols denote differentiation with respect to time.
normal acceleration, g units
lateral acceleration, g units
wing span, ft
lift-curve slope per unit angle of attack, per radian
rolling-moment coefficient
rolling-moment coefficient due to sideslip, per degree
pitching-moment coefficient
pitching-moment coefficient per unit angle of attack, per radian
yawing-moment coefficient
longitudinal-force coefficient
side-force coefficient
vertical-force coefficient
mean aerodynamic chord, ft
acceleration due to gravity ( l g = 32.17 ft/sec2)
altitude, f t
moments of inertia about X , Y , and Z body axes, respectively, slug-ft2
product of inertia, slug-ft2
autothrottle gain, deg/knot
roll-rate gain, deg/sec deg
deg/sec eg
commanded roll-rate gain,
roll-rate-integrator gain, deg/deg
roll-rate gain in yaw axis, /. pitch-rate gain, ezec commanded pitch-rate gain, -& pitch-rate-integrator gain, deg
autothrottle velocity gain, deg/dcg
autothrottle velocity-integrator gain, per second
wing-leveler gain, deg/deg
d deg sec
deg/sec
7
rudder-to-pedal gearing, deg/in.
aileron-to-wheel gearing, deg/deg
pitch-attitude gain, deg/deg
autothrottle pitch-attitude gain, deg/deg
deg/sec pitch-attitude-hold gain, eg
roll-attitude-hold gain, deg/deg
roll-coordination gain, deg/deg
roll-attitude-hold filter gain, per second
lift per unit angle of attack per unit momentum, (qS/mV)C,a, per second
airplane mass, slugs
lateral acceleration measured at pilot station, g units
dl
incremental normal acceleration measured at pilot station, g units
steady-state normal-acceleration change per unit change in angle of attack for an incremental horizontal- tail deflection at constant airspeed, g units/rad
period, sec
period of Dutch roll oscillation, sec
period of longitudinal phugoid oscilla- tion, sec
period of longitudinal short-period oscillation, sec
rolling, pitching, and yawing angular velocities, respectively, deg/sec or radlsec
roll rates at first and second peaks, respectively, deg/sec or rad/sec
dynamic pressure, lbf/ft2
reference wing area, ft
Laplace operator
thrust, lbf
riiirricrator short-period timc constant in pitch response to longitudirial control, sec
time required to double amplitude, sec
2

tq5=30
I t l
time required for spiral mode to double amplitude, sec
time required to bank 30°, sec
time at intersection of pitch-rate- response maximum-slope tangent line and zero-amplitude line after control input (effective time delay), sec
time at intersection of pitch-rate- response maximum-slope tangent line and steady-state pitch-rate line after control input, sec
effective rise time parameter, t 2 - t l , sec
indicated airspeed, knots or ft/sec
stall speed, knots
airplane weight, lbf
pilot lateral location from airplane centerline, f t
angle of attack, deg
angle of sideslip, deg
flight-path angle, deg
increment
ailerion deflection, positive for right roll command, deg
column deflection, in.
elevator deflection, deg
trailing-edge flap deflection, deg
horizontal-tail deflection, deg
pedal deflection, in.
r tdder deflection, deg
spoiler deflection, deg
control wheel deflection, deg
damping ratio
Dutch roll mode damping ratio
longitudinal phugoid-mode damping ratio
longitudinal short-period-mode damp- ing ratio
damping ratio of numerator quadratic 4J/6a transfer function
position of bodies along wing as a fraction of semispan
pitch attitude, deg
initial trim (reference) pitch attitude, deg
magnitude of first pitch-rate over- shoot, deg/sec
magnitude of first pitch-rate under- shoot, deg/sec transient peak ratio
ratio of commanded roll performance to applicable roll performance requirement
effective pitch time constant (time required to reach 63 percent of steady- state pitch rate following a step control input), sec
roll mode time constant (from the characteristic equation of motion), sec
effective roll mode time constant (time required to reach 63 percent of steady- state roll rate following a step control input), sec
angle of roll, deg
heading angle, deg
phase angle expressed as a lag for a cosine representation of Dutch roll oscillation in sideslip, deg
frequency, rad/sec
undamped natural frequency of Dutch roll mode, rad/sec
undamped natural frequency of phugoid mode, rad/sec
longitudinal short-period undamped natnral froniinnrv r.4 Ism-
*-Y-- - -J 7 I --- undamped natural frequency appear- ing in numerator quadratic of 4J/6a transfer function, rad/sec
Subscripts:
aPP approach
av average
cw crosswind
ge ground effect
H hold
e landing
3

max maximum; tor attitude responses, maximum control input was used
min minimum
osc oscillatory
RAH roll-attitude-hold mode on
REF reference
rms root-mean-square
rs roll spiral
ss steady state
WL wing-leveler mode on
Abbreviations:
AD1 attitude director indicator
CTOL conventional takeoff and landing
DQ(P1L) pilot-commanded pitch rate
DWN down
IFR instrument flight rules
ILS instrument landing system
LDG landing gear
PI0 pilot-induced oscillation
PLA power lever angle
PR pilot rating
RAH roll-attitude-hold mode on
SAS stability augmentation system
SCAS stability and control augmentation system
TIFS USAF-AFWAL Total In-Flight Simulator
VFR visual flight rules
VMS Langley Visual/Motion Simulator
WL wing-leveler mode on
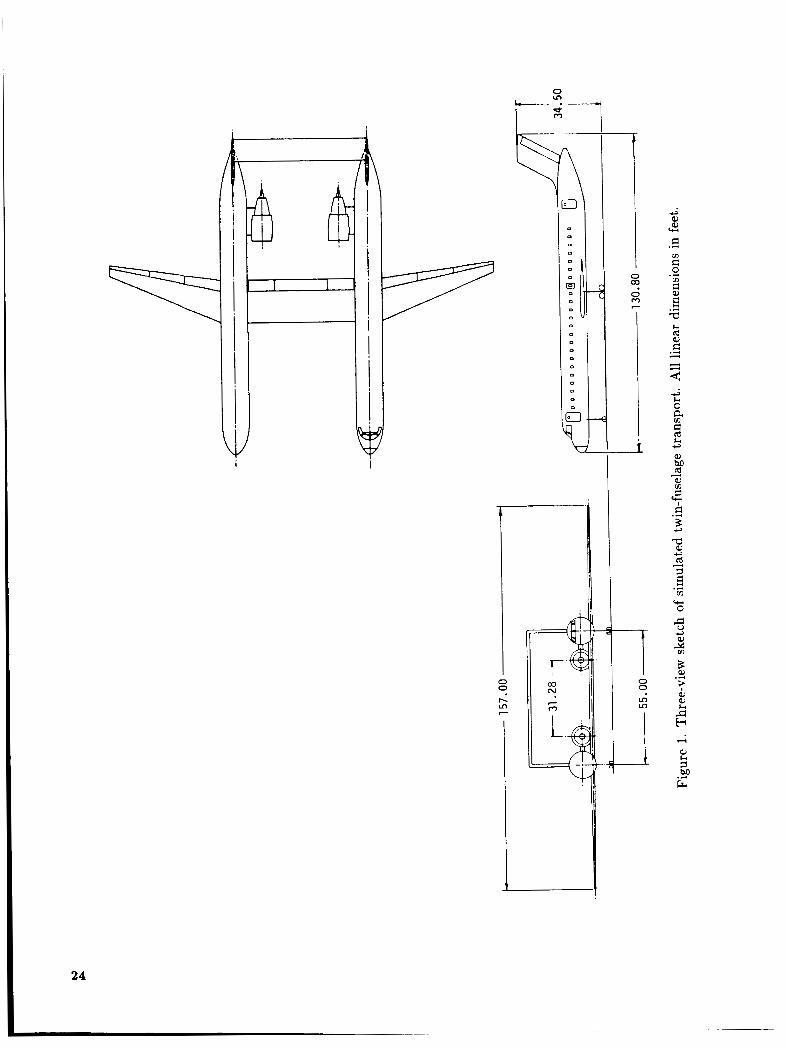
Description of Simulated Airplanes Two distinctly different airplane concepts were
simulated during the ground-based simulator study. Three-view sketches of the two concepts are pre- sented in figures 1 and 2; the representative landing mass and dimensional characteristics as well as the control surface deflections and deflection rate limits for the aircraft are presented in table I. The aerody- namic data used in this study for the twin-fuselage configuration indicated in figure 1 are presented in
table 11, and the aerodynamic data used for the ref- erence airplane configuration indicated in figure 2 are presented in table I11 of reference 1.
Twin-Fuselage Airplane
The twin-fuselage transport concept simulated in this study was developed to carry 250 passengers a distance of 2720 n.mi. at a Mach number of 0.75 and an initial cruise altitude of 37000 ft. (See ref. 2.) The airplane, with the pilot location offset signifi- cantly from the roll axis (approximately 30 ft to the left of the center of gravity), was powered by two large turbofan engines, which provided a static take- off thrust-to-weight ratio of 0.420. (Typical engine thrust response characteristics are indicated in fig. 3.) A three-view sketch of the airplane is presented in figure 1, and the simulated representative landing mass and dimensional characteristics are presented in table I(a).
Reference Airplane
A single-fuselage turbojet transport, similar to the C-5A airplane, was simulated during this study to provide a reference base from which various transport concepts could be evaluated. (See ref. 1.) Although the landing weight of the reference airplane was much greater than that of the twin-fuselage configuration, the reference airplane was used in this study because it has a very large roll moment of inertia, as does the twin-fuselage airplane. (As the separation distance of the two fuselages is increased, the roll moment of inertia of the airplane increases appreciably.) The reference airplane was powered by four turbojet en- gines providing a static takeoff thrust-to-weight ratio of 0.213. (Typical engine thrust response character- istics are indicated in fig. 3.) A three-view sketch of the airplane is presented in figure 2, and the sim- ulated representative landing mass and dimensional characteristics are presented in table I(b).
Description of Simulation Equipment Evaluations of the low-speed handling character-
istics at approach and landing were made at Lang- ley Research Center in the general-purpose cockpit of the Langley Visual/Motion Simulator (VMS). Af- ter the ground-based study, a brief in-flight simula- tion program was conducted in the USAF-AFWAL Total In-Flight Simulator (TIFS) airplane to pro- vide (I) points of reference for interpretation of the ground-based simulator results, and (2) data on the effects of the vertical motion at the pilot station due to rolling maneuvers. The data on vertical motion obtained with the ground-based simulator were only
4

marginally adequate because of the limited ampli- tude of the VMS motion cues.
Ground-Based Simulator The VMS is a six-degree-of-freedom ground-based
motion simulator (fig. 4(a)). For this study, the sim- ulator had a transport-type cockpit equipped with conventional flight and engine-thrust controls as well as a flight-instrument display representative of those found in current transport airplanes. (See fig. 4(b).) Instruments that indicated angle of attack, angle of sideslip, and flap angle were also provided. A conventional cross-pointer-type flight-director instru- ment was used.
The control forces on the wheel, column, and rudder pedals were provided by a hydraulic system coupled with an analog computer. The system allows for the usual variable-feel characteristics of stiffness, damping, coulomb friction, breakout forces, detents, and inertia.
The airport-scene display used an “out-the- window” virtual-image system of the beam-splitter, reflective-mirror type. (See ref. 3.) A runway “model” was programmed which had a maximum width of 200 ft, a total length of 11500 f t , rough- ness characteristics, and a slope from the center to the edge representing a runway crown. Oniy a dry runway was considered in this study.
The motion performance characteristics of the VMS system possess time lags of less than 60 msec. A nonstandard washout system, utilizing nonlinear coordinated adaptive motion, was used to present motion-cue commands to the motion base. (See ref. 4.)
The only aural cues provided were engine noises and landing-gear extension and retraction noises.
In-Flight Simulator
The TIFS is a C-131 airplane with controllers for all six degrees of freedom and a separate fly-by- wire evaluation cockpit forward and below the nor- mal C-131 cockpit. (See fig. 5.) When the airplane is flown from the evaluation cockpit, the pilot con- trol commands are input to a model computer, which determines the aircraft motion commands to be re- produced. These are combined with the TIFS mo- tion sensor signals in another portion of the onboard computer to provide TIFS controller commands. The simulated airplane motions are produced with max- imum time lags of 50 to 150 msec in the frequency range of interest.
The evaluation cockpit instruments were mostly conventional and were positioned as shown in fig- ure 6 . In addition to the conventional instruments,
displays of sideslip angle and angle of attack were provided. Airspeed error was displayed as a tape motion on the right side of the ADI. Aircraft posi- tion relative to the ILS glide slope was displayed (in feet) as a vertical bug motion on the right side of the ADI. A flight-director computer performing the same functions as the computer used in the ground-based simulator was modeled in the TIFS computer. This instrument was used in lieu of the conventional flight director on board the TIFS airplane to ensure that the flight director was compatible with the simulated twin-fuselage passenger transport dynamics.
Tests and Procedures Three research pilots participated in the simula-
tion program; two flew the ground-based simulator and two flew in the in-flight program. Each flew most types of simulated configurations and tasks, and each used standard flight-test procedures in the evaluation of the handling and ride qualities. The primary piloting task was the approach and landing task. The tests consisted of IFR and simulated VFR landing approaches for various configurations, with crosswinds, turbulence, wind shear, glide-slope and localizer offsets, and engine failure as added compli- cating factors. Crosswinds up to 30 knots, heavy tur- bulence, and w i d shear of 8 knets per 1@@ feet (from 200 ft altitude to touchdown) were simulated. The ILS approach was initiated with the airplane in the power-approach condition (power for level flight) at an altitude below the glide slope, and on course but offset from the localizer. The pilot’s task was to cap- ture the localizer and glide slope and maintain them as closely as possible while under simulated IFR con- ditions. At an altitude of approximately 300 f t , the aircraft “broke out)’ of the simulated overcast, where- upon the pilot converted to VFR conditions and at- tempted to land the airplane visually (with limited reference to the Bight instruments).
Using the aforementioned evaluation procedures, this study evaluated handling qualities by analysis or’ recorded aircraft motion time histories, calculation of various flying qualities parameters, and review of pi- lot comments on the flying qualities of the simulated twin-fuselage passenger transport and the effects of stability and control augmentation systems on these characteristics. The more significant results are re- viewed in the following sections.
Results and Discussion The results of this study are discussed in terms
of the previously stated objectives. The flying qual- ity evaluation scale is given in table I11 and the tur- bulence effect rating scale is given in table IV. The
5

results discussed are those obtained during the land- ing phase with the ground-based simulation, unless specifically noted otherwise.
Unaugmented Airplane
The pilot ratings assigned to the longitudinal handling qualities of the unaugmented twin-fuselage passenger transport were 3.0 and 4.5 for pilots A and B, respectively. The primary objections were (1) low apparent pitch damping, and (2) large pitch-attitude excursions with changes in flap position.
A pilot rating of 4.0 was assigned by both pilots to the lateral-directional handling qualities of the unaugmented airplane, the major objection being the sluggish roll response.
Longitudinal characteristics. The static longitu- dinal stability of the subject twin-fuselage transport airplane was considered by the pilots to be satisfac- tory. The aircraft was flown with a static margin of approximately 15 percent on the unstable side (back side) of the thrust-required curve. The variation in thrust required with velocity a(T/W)/aV was ap- proximately -0.00030 per knot, but speed control was not difficult.
The dynamic stability characteristics of this twin- fuselage configuration for the approach and land- ing flight conditions are indicated in table V(a). The short-period undamped natural frequency wsp and the damping ratio q of the simulated twin- "? fuselage transport are indicated in figure 7 along with the wsp and qsp for some present-day jet trans- ports. As shown in table V(a), qsp = 0.704, for the twin-fuselage transport, a value normally considered to be an indication of good pitch damping. How- ever, as stated previously, the pilots commented that the damping in pitch appeared to be low for this configuration. (For comparison, table V(b) shows the dynamic stability characteristics of the reference airplane.)
Figure 8 presents two of the most widely used longitudinal handling qualities criteria. Figure 8(a) shows the short-period frequency requirement of ref- erence 5 and figure 8(b) shows the Shomber-Gertsen longitudinal handling qualities criterion of refer- ence 6. The reference 6 criterion relates the ability of the pilot to change flight path (using normal acceler- ation) to the factor La. By using this parameter and recognizing that the pilot's control technique is not constant for all flight regimes, a criterion for satisfac- tory low-speed short-period characteristics was de- veloped (ref. 6) which correlates well with current air- plaric cxpcrience as well as with the results obtained during the present twin-fuselage transport simulation
program. It can be seen from figure 8 that the low magnitude of wsp prevents the twin-fuselage configu- ration from falling within the satisfactory regions.
Although the pilots did not comment adversely on the pitch response characteristics to a column input, figure 9 indicates that the initial pitch-rate response, calculated from two-degree-of-freedom equations of motion with airspeed constrained, is slightly sluggish. The reference 7 criterion dictates that the pitch-rate rise time parameter At of the simulated twin-fuselage configuration must be less than 0.87 sec for satisfac- tory response (level 1) and less than 2.81 sec for ac- ceptable response (level 2). As noted in table VI and figure 9, the pitch-rate rise time parameter during landing for the unugmented twin-fuselage transport (table VI(a)) was 1.92 sec, which predicts acceptable, but not satisfactory, pitch-rate response characteris- tics. Therefore, stability and control augmentation would be required to achieve satisfactory handling qualities for the approach and landing piloting tasks. The pitch control power was rated acceptable inso- far as the longitudinal control power requirements for the approach and landing tasks were concerned. This is in agreement with the control power require- ments criterion of reference 8, as shown in figure 10. Also note from table VI(b) that the pitch-rate rise time parameter for the reference aircraft was accept- able, but not satisfactory, when compared with the reference 7 criterion.
Lateral-directional characteristics. As stated pre- viously, the pilots assigned a rating of 4.0 to the lateral-directional handling qualities of the unaug- mented airplane. The primary factor that con- tributed to the pilot rating of acceptable but not sat- isfactory was the sluggish roll response. Table VI(a) indicates that it takes approximately 2.9 sec to bank 30' on this unaugmented airplane in the landing con- figuration; however, the requirement of reference 5 is t+30 5 2.5 sec for satisfactory handling qualities. Desirable lateral-directional handling characteristics following a step wheel input require (1) a rapid roll- rate response that reaches a reasonably steady-state value with a minimum of oscillation, (2) essentially zero sideslip, and (3) an immediate response in head- ing. It is evident from figure 11 that the lateral- directional response to a step wheel input is good, with an immediate heading response, and a low level of adverse sideslip.
The dynamic stability characteristics of this twin- fuselage configuration for the approach and landing flight conditions are indicated in table V(a). The roll and spiral mode characteristics are satisfactory, as is the Dutch roll mode.
6

Augmented Airplane
Based on the results obtained for the unaug- mented configuration, the objective for the design of the stability and control augmentation system (SCAS) was that the system should provide satisfac- tory handling qualities (PR 5 3.5) a t all flight condi- tions evaluated during the study. A block diagram of the SCAS design is shown in figure 12. The selected gains for the pitch, roll, and yaw axes SCAS are indi- cated in figures 12(a), 12(b), and 12(c), respectively.
It may be noted from table V(a) that a coupled roll-spiral mode is present for the augmented config- urations. This mode was determined by analyses of the linear quasi-static lateral-dynamic characteristic equations, including the stability and control aug- mentation systems, but was not detected by the pi- lots while flying the ground-based simulator.
Longitudinally, a high-gain pitch-rate command/ attitude-hold system was chosen because (1) the sys- tem provided good short-period characteristics and rapid response to pilot inputs and (2) the attitude- hold feature minimized disturbances due to turbu- lence or variations in flaps and/or thrust.
Laterally, a roll-rate command/attitude-hold sys- tem was employed in an attempt to provide a rapid roll mode and quick uniform response to pilot in- puts. The attitude-hold feature resulted in a desir- able neutrally stable spiral mode while counteract- ing disturbances due to turbulence. In addition, a wings-leveler feature was provided which automati- cally leveled the wings ( 4 = 0) whenever the bank angle was less than 2’ and the wheel was centered. This feature relieved the pilot of the task of “hunt- ing” for zero bank angle and was particularly useful when rolling out of a turn to a desired heading. (See fig. 12(b) for a diagram of the lateral control system.)
Directionally, roll-rate and roll-attitude feedbacks were used to provide good turn coordination and increased Dutch roll damping. (See fig. 12(c).)
!,E autothrott!e that maintained the selected air- speed throughout the landing approach was also used as part of the normal operational augmentation. (See fig. 13 for a block diagram of the autothrottle de- sign.) Since the simulated engine dynamics (e.g., fig. 3) produced very good thrust response, the au- tothrottle generally maintained the desired airspeed within f 3 knots and considerably reduced the pilot workload on the landing approach.
Longitudinal characteristics. The longitudinal SCAS (fig. 12(a)) provided a pitch rate proportional to column deflection and produced the desired char- acteristics of rapid, well-damped responses to pilot inputs, as well as inherent attitude stability.
The improvement in pitch-rate response provided by the SCAS is illustrated in figure 14. As can be seen, the SCAS improved the pitch-rate re- sponse of the twin-fuselage transport appreciably; the pitch time constant was decreased by approx- imately 86 percent ( r p , + ~ decreased from 2.62 to 0.36 sec) and the steady-state pitch rate commanded by a given column input was decreased to the more desirable rate of 1.2 deg/sec, which was the level de- sired by the evaluation pilots. With the augmenta- tion system operative, the pilot rating for the longi- tudinal handling qualities during the ILS approach was improved from 3.0 and 4.5 for pilots A and B, respectively, to 2.0 for both pilots.
Figure 15 compares the longitudinal handling characteristics of the augmented twin-fuselage and reference transports with the short-period handling qualities criteria of references 5 and 6. As can be seen, the twin-fuselage configuration conforms quite well to both criteria; in both cases the augmented configuration is within the satisfactory region.
Figure 16 (ref. 9) represents the proposed re- quirements for short-term pitch response to pitch controller for airplanes during Category C flight phase (approach and landing) and indicates the rel- ative performance of simulations of large transports, twin-fuselage transports, and the reference transport. These results indicate satisfactory dynamic stability characteristics for the augmented transports.
The low-speed pitch-rate response criterion shown in figure 17 and reported in reference 10 was based on the Shomber-Gertsen criterion of reference 6. Indica- tions are that the twin-fuselage configuration meets the pitch-rate response requirements of this criterion. (Note, however, that the simulated reference airplane does not fully meet this criterion.) When the pitch- rate response of the augmented twin-fuselage config- uration is compared with the criterion of reference 7, the predicted characteristics were also at satisfactory levels for effective time delay, transient peak ratio, and the rise time parameter (fig. 18 and table VI(a)).
Lateral-directional characteristics. A block dia- gram of the lateral-directional SCAS is presented in figure 12. Laterally, a rate command system provided roll rate proportional to wheel position (fig. 12(b)), and the directional system consisted of two turn co- ordination features (fig. 12(c)).
Table V(a) shows that the Dutch roll character- istics of the twin-fuselage transport during landing were improved with augmentation; w + / w ~ was in- creased from 0.961 to 0.996 (which indicates that the Dutch roll oscillation should be much less eas- ily excited for roll control inputs), and the damp- ing parameter (dud was increased from 0.175 to
7

0.230 rad/sec. Note, however, that the effective roll mode time constant remains essentially unchanged.
Figure 19 shows the improvement in the roll- rate response of the twin-fuselage transport provided by the SCAS. With the adverse sideslip minimized, the roll rate attained for a given wheel deflection increased appreciably, and the heading response was immediate (no lag). A comparison of the lateral- directional response to a step wheel input for the augmented twin-fuselage airplane and the augmented reference airplane indicates that the twin-fuselage configuration had the more desirable characteristics.
With the SCAS operative, the pilot rating for the lateral-directional handling qualities on the ILS approach in calm air was improved from 4.0 to 2.0.
The roll-rate response characteristics presented in tables V(a) and VI(a) indicate that (1) the effective time delay would be expected to be at a satisfactory level since t l < 0.283 sec, (2) the roll mode time constant would be expected to be at a satisfactory level since TR < 1.4 sec, and (3) the time required to bank 30" would be expected to be at an acceptable level since 2.5 5 t4=30 5 4 sec. As stated previously, the roll response of the augmented configuration was rated as Satisfactory.
Turbulence eflecrs. Flight in rough air was eval- uated with a turbulence model based on the Dryden spectral form. The root-mean-square value of the longitudinal, lateral, and vertical gust-velocity com- ponents was 6 ft,/sec. This value was described by the pilots as being representative of heavy turbulence.
For the twin-fuselage transport simulated, the pi- lots commented that the rating for the approach task on the augmented transports was degraded by 11/2 when the landing approach was made in the simu- lated heavy turbulence because of the significantly increased workload required to maintain ILS track- ing. Utilizing the turbulence effect rating scale (ta- ble IV), both pilots assigned a rating of D to the subject transport.
Engine failure. During the subject study, at- tempts were made to simulate the go-around capabil- ities as well as continued approaches and landings af- ter one engine failed. N o problems were experienced either when attempting to continue the approach to land or when attempting to perform a go-around.
Evaluation of Roll Performance Requirements
The roll requirements of reference 5 for class I11 (largca, heavy, low-to-medium-maneuverability air- planes) thr airplanc class applied to the configu- ration sirriiilated in the present study because of its
large passenger payload, even though it was lighter than many class I11 aircraft-are as follows for satis- factory performance:
1. The roll mode time constant TR shall be no greater than 1.4 sec.
2. The yaw and roll control power shall be ad- equate to develop at least 10' of sideslip in the power-approach flight condition with not more than 75 percent of the available roll con- trol power.
3. It shall be possible to land with normal pilot skill and technique in 90" crosswinds of veloc- ities up to 30 knots.
4. The time required to bank the airplane 30" shall not exceed 2.5 sec.
As can be seen from table V(a), the roll-mode time constant TR was less than 1.4 sec for the aug- mented transport concept. This level met the re- quirement of reference 5 for satisfactory performance. Note, however, that the reference transport had larger roll-mode time constants than those specified for satisfactory performance (table V(b)).
Figure 20 indicates the crosswind trim capability of the twin-fuselage transport concept. It can be seen that (1) the yaw and roll control power is adequate to develop more than 10" sideslip with 75 percent of the roll control power available] and (2) the roll and yaw control power is sufficient to trim the aircraft in 90' crosswinds of velocities up to approximately 27 knots. Therefore, the roll control power is essentially sufficient to meet both of these reference 5 requirements.
In addition to these requirements] reference 5 dic- tates that the time required to bank the airplane 30" shall not exceed 2.5 sec. As can be seen from ta- ble VI, all simulated augmented configurations ex- ceed that requirement. However, the pilots rated the lateral-directional handling qualities of the twin- fuselage transport as satisfactory. Also, when per- forming simulated landing approaches in 90" cross- winds] the pilots rated the subject transport satis- factory in crosswinds up to approximately 22 knots and acceptable in crosswinds up to approximately 29 knots. (See fig. 21.)
Comparison of Ground-Based and In-Flight Results As stated previously, upon completion of the
ground-based simulator tests, a brief in-flight sim- ulation program was conducted in order to pro- vide (I) points of reference for interpretation of the ground-based simulator results and (2) data on the effects of the "verticalll motion a t the pilot station due to rolling maneuvers] which was only marginally
8

adequate with the limited-amplitude motion cues of the VMS. The handling qualities assessments made on the ground-based simulator were substantiated during the in-flight simulator tests. Although the in- flight tests were more realistic (for example, the mo- tions were realistic and the scene out of the window was the real world), these factors did not significantly affect the pilots’ opinions of the handling character- istics of the simulated airplane up to and including touchdown. Both pilots rated the lateral-directional handling qualities of the twin-fuselage configuration, with tasks that included 200-ft lateral runway offsets and 15-knot crosswinds, as satisfactory. Average pi- lot ratings during approach of 2.3 and 3.0 for pilots A and C, respectively, and an overall average pilot rat- ing that included touchdown of 2.7 for pilot A, were obtained from in-flight simulation testing. These rat- ings are compared with average PR’s of 2.5 and 2.6 for pilots A and B, respectively, for the ground-based simulation tests.
In addition to the in-flight comparison tests noted above, a brief investigation was conducted to ascer- tain the effects of pilot lateral offset and variation of airplane effective roll-mode time constant. The additional experimental variables were pilot lateral offsets of 0 and -50 f t and effective roll-mode time conslants of 8.6 and 2.3 sec. Note that the baseline pilot offset position was -30 ft, and the effective roll- mode time constant of the augmented twin-fuselage configuration was approximately 1.1 sec.
The in-flight experimental data presented in ref- erence 11 indicated significant scatter, especially for a pilot lateral offset of -50 ft with an effective roll- mode time constant of 0.6 sec. Averaging each pilots’ rating minimized the scatter, and hence aided in the analysis of the data. Weingarten (ref. 11) postulated that the normal acceleration experienced by the pi- lot during rolling maneuvers may be the character- istic that causes handling probiems when the pilot is laterally offset from the airplane center of grav- ity. He suggested that a measure of this effect can be expressed by Anz,p/pss, the ratio of the maximum incremental normal acceleration experienced at the pilot station to the steady-state roll rate following a step lateral control input. This is similar to the lateral acceleration parameter ny,p/pmax developed during the program reported in reference 12 and pre- sented in reference 7.
The relationship between Anzlp/pSs (established for each configuration from step control response time histories and tabulated in table VII) and av- erage pilot rating is presented in figure 22 for both evaluation pilots for the conditions of approach only and approach to touchdown. A review of the pilots’ comments (ref. 11) made it possible to,identify those
tasks that resulted in PIO’s. The symbols represent- ing these tasks are marked with a flag in figure 22. These data indicate that the pilot ratings degraded as the value of the parameter An,,p/pss increased (an indication of poorer handling and ride qualities) and that the handling qualities were also a strong func- tion of the altitude change effects that caused the PIO’s. This figure suggests that based on incremen- tal normal acceleration experienced at the pilot sta- tion alone, a potential roll-control-induced normal- acceleration criterion would state that the ratio of maximum incremental acceleration at the pilot sta- tion to steady-state roll rate following a step lateral control input should not exceed the values indicated in figure 22 and shown in the following table:
An, ,plPss, Level g units/(deg/sec)
Figure 23 shows the change in pilot rating at each lateral pilot location for the various effective roll- mode time constants evaluated. The shaded areas were determined from the envelope of non-PI0 data from figure 22. It was assumed that the pilot ratings at zero lateral pilot offset were identical for all values of TR. Between the two pilots there was a variation in pilot rating of approximately 1 with the pilot located on the axis of symmetry and approximately 3/4 for the other pilot locations. The shaded parts of this figure indicate that the pilots downgraded the han- dling qualities as the pilot station moved farther from the aircraft center of gravity. The amount of change in pilot rating was a function of effective roll-mode time constant. This figure implies that to maintain satisfart,ory flying qualities on a twin-fuselage air- plane configuration, the fuselage separation distance should be no greater than approximately 60 ft. (That is, the maximum allowable lateral pilot location from the airplane center of gravity would be no greater than approximately 30 ft.)
If it is assumed that the ratio of ny,p/pmax (ref. 7) to Anzlp/pSs (developed in this study) is equivalent to the ratio (ay)rms/(Aa,)rms for the twin-fuselage configurations presented as figure 24 (fig. 26 in ref. 1), then it would be expected that an acceptable value of An,,p/p,s would be as follows:
9

For example, for level 2, ny,p/pmax = 0.035 g units/(deg/sec) (ref. 7) and (ay)rms/(Aa,),ms = 0.265 (fig. 24). Thus An,,p/pss = 0.132 g units/(deg/ sec). Figure 24 also presents the suggested acceptable ride qualities boundaries for CTOL jet transport air- craft from reference 13. The fact that the calculated “acceptable” value of AnZlp/pss is 2.75 times larger than that indicated in figure 22 suggests that all pilot ratings were influenced by the altitude change effects caused by lateral control inputs, even when no PIO’s resulted.
Dynamic Stability Requirements and Criteria
As previously stated, the aircraft industry has for several years been aware that many of the ex- isting aircraft stability and control requirements are inappropriate because of the expansion of flight en- velopes, the increase in airplane size, and the utiliza- tion of complex stability and control augmentation systems. Therefore, in an effort to aid in the future establishment of new stability requirements, the low- speed handling qualities parameters of an unconven- tional, relatively large, passenger transport are com- pared with some existing handling qualities criteria. These results add to the data base developed in ref- erences 1, 7, 12, and 14.
Two of the most widely used longitudinal han- dling qualities criteria are presented in figure 15. Fig- ure 15(a) shows the short-period frequency require- ments of reference 5, and as stated previously, the results predicted by the criterion agree with the re- sults obtained during the present simulation studies. Figure 15(b) shows the Shomber-Gertsen longitudi- nal handling qualities criterion of reference 6; this criterion relates the ability of the pilot to change flight path with normal acceleration to the factor La. By using this parameter and recognizing that the pi- lot’s control technique is not constant for all flight regimes, a criterion for satisfactory low-speed short- period characteristics was developed (ref. 6) that cor- relates well with current airplane experience and is consistent with the results of the present simulation study of the twin-fuselage transport airplane.
Ashkenas (ref. 15) observed that the criterion wspT& of reference 9 (presented in fig. 16) provided a slightly better short-period frequency requirement than did the criterion of reference 5 (presented in fig. 15). Physically, wspTOp represents the sepa- ration in phase between aircraft responses in path and pitch attitude. Figure 16 (ref. 9) gives the proposed requirements for short-term pitch response to pitch controller for airplanes during Category C flight phase, and also presents the results of past and present studies. These results indicate satisfactory
10
dynamic stability characteristics for the noted aug- mented transports and is consistent with the results of the present simulation study of the twin-fuselage transport airplane.
The low-speed pitch-rate response criterion pre- sented in figure 17, and reported in reference 10 was based on the Shomber-Gertsen criterion of ref- erence 6. There is excellent agreement between the results obtained during the present study and the low-speed pitch response criterion. In terms of effec- tive time delay, rise time parameter, and transient peak ratio, as defined in reference 7, the twin-fuselage transport exhibits level 1 (satisfactory) characteris- tics. (See fig. 18.)
The roll-acceleration capability criterion for trans- port aircraft is presented in figure 25 and reported in reference 16. The twin-fuselage passenger trans- port is indicated to have acceptable characteristics, an evaluation not consistent with the satisfactory rat- ings given by the pilots during the ground-based and in-flight simulation tests.
The roll-rate capability criterion for transport air- craft is presented in figure 26 and reported in refer- ence 17. The twin-fuselage transport configuration is indicated to have acceptable characteristics. This evaluation could be interpreted to be consistent with the satisfactory ratings given by the pilots during the ground-based and in-flight simulation tests because the reference 17 criterion only delineates between ac- ceptable and unacceptable handling Characteristics.
The bank-angle oscillation, roll-rate oscillation, and sideslip excursion limitations criteria of refer- ence 5 are presented in figure 27. They relate the phase angle of the Dutch roll component of sideslip ($s) to the measure of the ratio of the oscillating component to the average component of bank angle and roll rate, and also to the maximum sideslip ex- cursion. The twin-fuselage transport configuration is shown to have satisfactory characteristics, an eval- uation consistent with the ratings given by the pi- lots during the ground-based and in-flight simula- tion tests. (Note that c $ ~ ~ ~ / & ~ is not indicated in fig. 27(a) for the reference transport because of the airplane’s strong spiral stability.)
In general, the results of the present simulation study agree reasonably well with the handling qual- ities criteria used for comparison in this paper, with the exception of the roll-acceleration capability cri- terion of reference 16. It may also be noted that the augmented twin-fuselage transport configuration ex- hibited improved handling characteristics relative to the reference transport, and that the pilots consid- ered the reference transport to have good handling characteristics.

Concluding Remarks Six-degree-of-freedom ground-based and in-flight
simulator studies have been conducted to evaluate the low-speed flight characteristics of a twin-fuselage passenger transport airplane and to compare these characteristics with those of a large, single-fuselage (reference) transport configuration similar to the C-5A airplane. The primary piloting task was the ap- proach and landing task. This paper has attempted to summarize the results of these studies, which sup- port the following major conclusions.
The pilot ratings assigned to the longitudinal han- dling qualities of the unaugmented twin-fuselage air- plane were 3.0 and 4.5 for pilots A and B, respec- tively, the primary objections being (1) low apparent pitch damping and (2) unusually large pitch-attitude excursions associated with changes in flaps.
A pilot rating of 4.0 was assigned by both pi- lots to the lateral-directional handling qualities of the unaugmented airplane, the major objection being the sluggish roll response. The longitudinal stability and control augmentation system developed for this twin-fuselage transport airplane consisted of a high- gain pitch-rate command/attitude-hold system and an autothrottle. The augmentation system provided good short-period characteristics and rapid response to pilot inputs, and the attitude-hold feature min- imized disturbances caused by turbulence or varia- tions in flaps and/or thrust. With this augmentation system operative, the pilot ratings for the longitu- dinal handling qualities on the instrument approach improved from 3.0 (satisfactory) and 4.5 (acceptable but unsatisfactory) for pilots A and B, respectively, to 2 for both pilots.
Laterally, a roll-rate command/attitude-hold aug- mentation system was employed in an attempt to provide a rapid roll mode and quick uniform re- sponse to pilot inputs. The attitude-hold feature resulted in a desirable neutrally stable spiral mode ~hi!e ccunteracting disturbances caused by tiirbu- lence. Directionally, roll-rate and roll-attitude feed- backs were used to provide turn coordination and improved Dutch roll characteristics. With this aug- mentation system operative, the pilot rating for the lateral-directional handling qualities on the instru- ment approach in calm air was improved from an average pilot rating of 4.0 (acceptable but unsatis- factory) to a 2.0 (satisfactory) for both evaluation pilots.
These handling qualities assessments determined on the ground-based simulator were substantiated during the in-flight simulator tests.
The pilots commented that the pilot rating for the instrument approach on the augmented twin-fuselage
concept was degraded by 11/2 when the landing ap- proach was made in simulated heavy turbulence be- cause of the increased workload required to maintain glide slope and localizer tracking. The twin-fuselage airplane was assigned a rating of D (moderate dete- rioration of task performance) from the turbulence effect rating scale.
When simulated landing approaches were per- formed in 90' crosswinds, the pilots felt that they could perform satisfactory landings on the twin- fuselage airplane in crosswinds up to 22 knots (pi- lot ratings less than 3.5) and could perform accept- able landings in crosswinds as high as approximately 29 knots (pilot ratings less than 6.5).
The go-around capabilities as well as continued approaches and landings were simulated after one en- gine failed. No handling problems were experienced while performing either task.
Because the pilots are located a significant dis- tance from the roll axis on the simulated twin- fuselage configurations studied, relatively high lev- els of normal acceleration can be generated during certain phases of flight. As a result of the in-flight simulation study, a roll-control-induced normal- acceleration criterion was developed. This criterion states that the ratio of maximum incremental ac- celeration at the pilot station to steady-state roll rate following a step lateral control input (An,,p/pss, g units/(deg/sec)) shall not be greater than 0.020, 0.048, and 0.069 for levels 1, 2, and 3, respectively. However, evidence also indicated that the pilot rat- ings were probably influenced by the altitude change effects at the cockpit caused by lateral control in- put. Pilot ratings also decreased as the pilot sta- tion moved farther from the aircraft center of grav- ity. From these results it was determined that on a twin-fuselage airplane configuration, the fuselage separation distance should be no greater than ap- proximately 60 ft, to yield a maximum lateral pilot location from the airplane center of gravity of ap- proximately 30 ft.
In general, it was concluded that the results of the present simulation study agree reasonably well with the handling qualities criteria used for comparison in this paper, with the exception of the roll-acceleration capability requirement. It was also noted that the augmented twin-fuselage concept exhibits improved handling characteristics over those of the reference (single-body) transport. These experimental results further extend the low-speed data base being devel- oped at the Langley Research Center so that han- dling qualities and ride qualities criteria can be for- mulated for highly augmented and/or unusually con- figured aircraft of the future.
11

References 1.
2.
3.
4.
5.
6.
7.
8.
9.
10
Grantham, William D.; Deal, Perry L.; Keyser, Gerald L., J r . ; and Smith, Paul M.: Simulator Study of Flight Characteristics of a Large Twin-Fuselage Cargo Ilfansport Airplane During Approach and Landing. NASA
Houbolt, John C.: Why Twin-Fuselage Aircraft? Astro- naut. d Aeronaut., vol. 20, no. 4, Apr. 1982, pp. 26-35. Rollins, John D.: Description and Performance of the Langley Visual Landing Display System. NASA
Martin, D. J . , Jr . : A Digital Program for Motion Washout on Langley’s Siz-Degree-of-Freedom Motion Simulator. NASA CR-145219, 1977. Military Specification-Flying Qualities of Piloted Air- planes. MIL-F-8785C, Nov. 5 , 1980. (Supersedes MIL-
Shomber, H. A, ; and Gertsen, W. M.: Longitudinal Handling Qualities Criteria: An Evaluation. AIAA Paper No. 65-780, Nov. 1965. Chalk, C. R.: Recommendations fo r S C R Flying Qualities Design Criteria. NASA CR-159236, 1980. Stability and Control, Flight Control, Hydraulic Sys- tems and Related Structures Criteria. Doc. No. D6- 6800-5, Boeing Co., J an . 1970. Hoh, Roger H.; Mitchell, David G.; Ashkenas, Irving L.; Klein, Richard H.; Heffley, Robert K.; and Hodgkinson, John: Proposed MIL Standard and Handbook-Flying Qualities of Air Vehicles. Volume 11: Proposed M I L Handbook. AFWAL-TR-82-3081, Vol. 11, Nov. 1982. (Available from DTIC as AD A123 726.) Sudderth, Robert W . ; Bohn, Jeff G.; Caniff, Martin A , ; and Bennett, Gregory R.: Development of Longitudinal
TP-2183, 1983.
TM-78742, 1978.
F-8785B, Aug. 7, 1969.)
Handling Qualities Criteria for Large Advanced Super- sonic Aircraft. NASA CR-137635, 1975.
11. Weingarten, Norman C.: An In-Flight Investigation of a Twin Fuselage Configuration in Approach and Landing. NASA CR-172366, 1984.
12. Grantham, William D.; Nguyen, Luat T.; Deal, Perry L.; Neubauer, M. J . , J r . ; Smith, Paul M.; and Gregory, Frederick D.: Ground-Based and In-Flight Sim- ulator Studies of Low-Speed Handling Characteristics of Two Supersonic Cruise Ilfansport Concepts. NASA
13. Stephens, David G.: Developments in Ride Quality Cri- teria. Noise Contr. Eng., vol. 12, no. 1, Jan.-Feb. 1979,
14. Grantham, William D.; Smith, Paul M.; Deal, Perry L.; and Neely, William R., Jr . : Simulator Study of Flight Characteristics of Several Large, Dissimilar, Cargo Ilfans- port Airplanes During Approach and Landing. NASA
15. Ashkenas, I. L: Summary and Interpretation of Recent AIAA Paper
16. Chalk, C. R.; Neal, T . P.; Harris, T . M.; Pritchard, F. E.; and Woodcock, R. J.: Background Information and User Guide for MIL-F-8785B(ASG), “Military Specification- Flying Qualities of Piloted Airplanes. ” AFFDL-TR- 69-72, U.S. Air Force, Aug. 1969. (Available from DTIC as AD 860 856.)
17. Aerospace Recommended Practice: Design Objectives for Flying Qualities of Civil Transport Aircraft. A R P 842B, SOC. Automot., Eng., Aug. 1, 1964. Revised Nov. 30, 1970.
TP-1240, 1978.
pp. 6-14.
TP-2357, 1984.
Longitudinal Flying Qualities Results. NO. 69-898, Aug. 1969.
12

TABLE I . MASS AND DIMENSIONAL CHARACTERISTICS OF SIMULATED TRANSPORT AIRPLANES
(a) Twin-fuselage transport
Weight. lbf Takeoff . . . . . . . . . . . . . . . . . . . . . . . . . . . . . . . 241 300 Landing . . . . . . . . . . . . . . . . . . . . . . . . . . . . . . . 193 000
Reference wing area. ft2 2147 Wing span. ft . . . . . . . . . . . . . . . . . . . . . . . . . . . . . 157.00 Wing leading-edge sweep. deg 23.5 Reference mean aerodynamic chord. ft . . . . . . . . . . . . . . . . . . 15.074 Center-of-gravity location. percent E 62 Static margin. percent . . . . . . . . . . . . . . . . . . . . . . . . . 15.38
Iy. slug-ft2 . . . . . . . . . . . . . . . . . . . . . . . . . . . . . . 5408550 12. slug-ft2 . . . . . . . . . . . . . . . . . . . . . . . . . . . . . . 9 181 470 1x2. slug-ft2 . . . . . . . . . . . . . . . . . . . . . . . . . . . . . 223 410
Maximum control surface deflections:
. . . . . . . . . . . . . . . . . . . . . . . . .
. . . . . . . . . . . . . . . . . . . . . .
. . . . . . . . . . . . . . . . . . .
. . . . . . . . . . . . . . . . . . . . . . . . . . . . Ix. slug-ft2 . . 4003900
Sf. deg (approach/landing) . . . . . . . . . . . . . . . . . . . . . . 25/50
6,. deg . . . . . . . . . . . . . . . . . . . . . . . . . . . . . . 15 to -25
6,. deg . . . . . . . . . . . . . . . . . . . . . . . . . . . . . . . 0t060
6h. deg . . . . . . . . . . . . . . . . . . . . . . . . . . . . . . . 1t0 -10
Sa. deg . . . . . . . . . . . . . . . . . . . . . . . . . . . . . . . f 1 5
6,. deg . . . . . . . . . . . . . . . . . . . . . . . . . . . . . . . f 3 5
Maximum control surface deflection rates: 6f. deg/sec . . . . . . . . . . . . . . . . . . . . . . . . . . . +223. -2.00 bh. deg/sec . . . . . . . . . . . . . . . . . . . . . . . . . . . . . f0 .333 he. deg/sec . . . . . . . . . . . . . . . . . . . . . . . . . . . . . . 5 2 5 ba. deg/sec . . . . . . . . . . . . . . . . . . . . . . . . . . . . . . f 1 5 6,. deg/sec . . . . . . . . . . . . . . . . . . . . . . . . . . . . . . f 6 0 6,. deg/sec . . . . . . . . . . . . . . . . . . . . . . . . . . . . . . f 3 5
Gross horizontal-tail area. ft2 . . . . . . . . . . . . . . . . . . . . . . 500 Meari aerodynamic chord. f t . . . . . . . . . . . . . . . . . . . . . . . 9.33
. . . . . . . . . . 54.50
Exposed vertical-tail area. ft2 . . . . . . . . . . . . . . . . . . . . . . 365 Mean aerodynamic chord. ft . . . . . . . . . . . . . . . . . . . . . . . 12.08
. . . . . . . . . . . 50.34
Horizontal tail:
Distance from center of gravity to horizontal tail 0.25c; f t
Vertical tail:
Distance from center of gravity to vertical tail 0.2Z, f t
Lateral distance from center of gravity to engine centerline. ft Vertical distance from center of gravity to engine centerline. ft
Engines: . . . . . . . . 15.64 . . . . . . . . -0.79
13

TABLE I . Concluded
(b) Reference transport
Weight. lbf Takeoff . . . . . . . . . . . . . . . . . . . . . Landing . . . . . . . . . . . . . . . . . . . . .
Reference wing area. ft2 . . . . . . . . . . . . . . .
Wing leading-edge sweep. deg . . . . . . . . . . . . Reference mean aerodynamic chord. ft Center-of-gravity location. percent . . . . . . . . .
Ix. slug-ft2 . . . . . . . . . . . . . . . . . . . . ly. slug-ft2 . . . . . . . . . . . . . . . . . . . . Iz. slug-ft2 . . . . . . . . . . . . . . . . . . . . Ixz. slug-ft2 . . . . . . . . . . . . . . . . . . .
Wing span. ft . . . . . . . . . . . . . . . . . . .
. . . . . . . .
Static margin. percent . . . . . . . . . . . . . . .
. . . . . . . .
. . . . . . . .
. . . . . . . . .
. . . . . . . . .
. . . . . . . . .
. . . . . . . . .
. . . . . . . . .
. . . . . . . . .
. . . . . . .
. . . . . . . . .
. . . . . . . . .
. . . . . . . . .
. 769000
. 579000
. . 6200
. . 219.20
. . 28
. . 30.93
. . 35
. . 10.77 34 900 000 40 400 000 60 100 000 . . 60600
Maximum control surface deflections: 6f. deg (approach/landing) . . . . . . . . . . . . . . . . . . . . . . . 25/50 6h. deg . . . . . . . . . . . . . . . . . . . . . . . . . . . . . . 2 to -16.5 6.. deg . . . . . . . . . . . . . . . . . . . . . . . . . . . . . . 15 to -25
6.. deg . . . . . . . . . . . . . . . . . . . . . . . . . . . . . . . 0t060 6.. deg . . . . . . . . . . . . . . . . . . . . . . . . . . . . . . . f 4 0
6.. deg . . . . . . . . . . . . . . . . . . . . . . . . . . . . . . . f 3 5
Maximum control surface deflection rates: 61. deg/sec . . . . . . . . . . . . . . . . . . . . . . . . . . . . . . f 1 5 6h. deg/sec . . . . . . . . . . . . . . . . . . . . . . . . . . . . . . f 0 . 5 6.. deg/sec . . . . . . . . . . . . . . . . . . . . . . . . . . . . . . k25 ha. deg/sec . . . . . . . . . . . . . . . . . . . . . . . . . . . . . . f 4 0 h.. deg/sec . . . . . . . . . . . . . . . . . . . . . . . . . . . . . . f 6 0 6.. deg/sec . . . . . . . . . . . . . . . . . . . . . . . . . . . . . . f 3 5
Gross horizontal-tail area. ft2 . . . . . . . . . . . . . . . . . . . . . . 965.82 Mean aerodynamic chord. ft . . . . . . . . . . . . . . . . . . . . . . . 15.29 Distance from center of gravity to horizontal tail 0.2k-, f t . . . . . . . . . . 125.87
Exposed vertical-tail area. ft2 . . . . . . . . . . . . . . . . . . . . . . 961.07 Mean aerodynamic chord. ft . . . . . . . . . . . . . . . . . . . . . . . 27.95 Distance from center of gravity to vertical tail 0.2%, ft . . . . . . . . . . . 110.15
Horizontal tail:
Vertical tail:
Engines: Lateral distance from center of gravity to outboard engine centerline. ft . . . . . 61.9 Lateral distance from center of gravity to inboard engine centerline. ft . . . . . 39.8 Vertical distance from center of gravity to outboard engine centerline. ft . . . . . 5.4 Vertical distance from center of gravity to inboard engine centerline. ft . . . . . 3.4
14

TABLE 11. AERODYNAMIC DATA USED IN SIMULATION OF TWIN-FUSELAGE AIRPLANE CONCEPT
a, deg
-8 -4
0 4 8
12
Cmhh , deg-'
-0.08208
6t = 25O 66 = 50'
-0.1549 -0.1933 -.1864 - .6686 -.1760 -1.1470 -.1349 - 1.6264 - ,0660 -2.1098
.0577 - 2.5078
CX
-0.0293 -.0741 -.0680 - .0249
,0420 ,1486
Cm cz Cm
0.1526 0.4580 -.3136 .0460 -.7860 -.3160 - 1.2628 -.6130 -1.7360 - ,8560 -2.1183 - 1.0270
0.3020 -.1100 -.4720 - ,7690
-1.0120 -1.1830
a, deg
Numerical values at 6= of-
0 *5O *loo f15' *200 *250
-8 -4
0 4 8
12
- 0.0 1465 -.01476 -.01480 -.01476 -.01467 -.01449
-0.00214 -0.00211 -0.00206 -0.00196 - 0.00 177 - 0.00 149 -.00110 -.00108 -.00106 -.00101 -.00091 -.00077 - .00005 - .00005 -.00005 - .00005 - .00005 - ,00005
.00100 .00098 .00096 .00091 .00081 .00067 ,00204 .00201 .00196 ,00186 .00167 ,00139 ,00307 ,00303 1 .00296 1 ,00280 1 .On252 ,00210
-8 1 -0.05700 I -0.05624
4 8
12
-0.01432 -.Oi443 -.01447 -.01443 -.01434 -.01416
-.01496 -.01486 -.01468
-0.01356 -.GI357 -.01370 -.Cis67 -.01358 -.01341
-0.05499 I -0.05206
-0.01222 - n12.72
-.01235 ,91232
-.01224 -.01209
-0.01022 -.01030 -.01033 - .o imo -.01024 -.01011
-0.04693
1
15

a, deg 0.075 0.10 0.15 0.20 0.25 0.30 0.40 0.50 0.60 0.80 1.c
TABLE 11. Continued
Numerical values at h / b of-.
-0.0?21 ,0055 ,0313 ,0644 .lo27 .I330
-0.0182 ,0061
,0408 ,0842 ,1339 .1713
-0.0084 -0.0060 .0048 .0040 ,0246 ,0195 ,0503 ,0398 ,0320 .02 10 ,0134 ,0084 ,0805 ,0640 ,0514 ,0339 ,0219 ,0137 ,1049 i ,0830 1 ,0675 i ,0451 1 ,0295 1 ,0186
-8 -0.0314 -4 ,0028
0 ,0469 ,0990 ,1546
12 ,1904
-0.0001 ,0003 .nni 1 ,0022 ,0036 ,0048
-0.0089 - ,0077 -.0057 - ,0026
,0026 ,0103
-0.0031 -.0027 -.0019 - .0006
.OO 17 ,0053
-0.0658 -0.0480 -0.0365 -0.0193 -.0556 -.0406 -.0309 -.0164 -.0417 -.0304 -.0231 -.0122 -.0223 -.0160 -.0120 -.0061
,0076 ,0063 ,0052 ,0036 ,052 1 ,0396 ,0309 ,0183
-0.0009 - ,0008
- ,0006 - .0002
,0005 ,0014
~- 0.0003
.0001
0
0
- ,000 1
-.0001
,0086 12 ,1468
,0110 ,0092
0.0283 ,0122 ,0029
- ,0029 -.006l -.0072
~~~ ~.
0.0198 ,0086 ,0020
- .0020 -.0043 - ,005 1
00144 00110 0047 001 1
- 0015 - 0011
- 0031 - 0024 - 0037 - 0028 A ~-
0.0058 ,0025
,0006 - ,0006
-.0013 -.0015 -~
0.0027 ,0012 .0003
- ,0003 - ,0006 - ,0007
0.0009 .0004 ,0001
-.0001 - ,0002 -.0002
- 8
0043 4 - 0043 8
12 _ _
6 f = 25O 6f = 50'
0 0.00 15 1 ,00150 ,00149 ,00148 ,00147 .00145
-0.0000 1 .00009 ,00014 ,00021 .00029 ,00035
0.00151 ,00150 ,00149 ,00148 ,00146 ,00144
-8 -4
0 4 8
12
0.00003 .00011 .00018
.00025
.00033 ,00039
Cnp , deg-'
0.00338 ,00361 ,00382 ,00397 .00407 ,00412
CY,, deg-l
-8 -4
0
4 8
12 ___
-0.00184 -.00196 - ,00204 - ,00233 - ,00256 -.00272
-0.03136 I - 0.00 197 -.00216 - .00230 - ,00264 - ,00295 -.00317
-0.02852 0.00243 ,00267 .00290 ,00307 ,00320 ,00328 1
16

TABLE 11. Concluded
0.00122 ,00023
- ,00066 -.00146 -.00213 - ,00266
Cyp, rad-'
-0.0377 .0635 .1753 .2644 .3594 ,4327
-8 -4
0 4 8
12
0.01265 .01219 .01167 .01121 ,01028 ,00917
Clp, rad-'
- 0.5642 - .5649 -.5727 - .5944 -.6233 -.6556
-8 -4
0 4 8
12
a , deg
-8
-4 0
4 8
12 _ _ ~ ~
6f = 25'
6f = 25' 65 = 50'
Cyr, rad-' Cl,, rad-l Cn,. , rad-l Cyr, rad-' Clr, rad-l C,, , rad-'
0.6714 0.0983 -0.2383 0.7080 0.1873 -0.2893
.6734 ,1807 -.2421 ,7163 ,2736 - ,2960
.6926 .2619 -.2491 ,7423 ,3582 -.3085
.7229 .3507 - ,2547 ,7789 .44% -.3185
.7665 .4365 - .2667 ,8286 .5405 - ,3349
.8234 .4991 - .2788 ,8919 ,6097 -.3479
a , deg
-8 -4
0 4 8
12
0.00148 .00169 .00192 ,00207 .00222 ,00231
CYhr 3 deg-l C16,, deg-' Cns,, deg-'
-0.00536 0.00046 -0.00170 .00047 -.00170 ,00048 -.00170 .00050 -.00169 ,00051 -.00168 1 ,00051 -.00168
Cnp, rad-]
Cm,, rad-'
-41.882
1
0.0872 .0157
-.0518 - ,0477 - ,0947 -.1490
Cm,, rad-'
- 1 2 r
0.00325 ,00128
- ,00065 -.00249 - ,00426 - ,00596
Cyp, rad-'
0.0422 ,1438 ,2558 ,3420 .4356 .5088
6f = 50°
Czgal deg-'
0.02696 .02678 ,02645 ,02599 ,02540 ,02469
Cl,, rad-l
-0.5467 - .5489 - .5643 -.5917 - ,6260 - ,6647
Cmg, , deg-'
0.00302 ,00424 ,00501 ,00536 .00557 ,00540
Cnpr rad-'
0.0546 - .0084 -.0427 -.0423 -.0960 -.1554
17

+ 3 -e-
- N -
V w > m C m D
3 i
5 U
C m m m 3 n
V 0
V -
C 0 d
c1
. . m u u c
m w 3 > l . 0 w L u a U 8 m i
m u
s Y U c 3 m 3
m c a 0 3 - ern c m a i
E x i L v o 3 u
z z
5 2
2 % m a 8 0 o c c n w
V . O l . 0 3 0
Lr
Y
U Y u c w w a 6 x u
v l . 3
m .
a l g 2 c n m
a 6 .,E .:
N
3 c
> w 4
m
I
0 z
l. .3 0 . a -
r n w w m c 3 a 0 u 3 C U w . m
r ( v m . u w c w i v w u w w n c c w E m - c o s
u l . O w 0 i L t Y W e m o l . m 3 . 1 0 1
d C m Y w m 3 u B 3 D w m e m
o u 3 m n m u
X E > u L . 3 m m w >
c m r ( n o ~ n
n > m u e 0 3 n
V I a l l . L O
w m
m % . A
m w - u 3
0 m .r( d u m L l u m m a w a w c w w > m
E .+ o s - u u m
m u U C o o m 3 Y E
a
3%. a u w n
- e .
c ne
n u -
3
Tl w w - o w 3 3 O U Q L x m u 0)- c u d
w o c m rl U O > . m u m c < M 0 cl C C C . 3 rl 3 3 Y U 0 w 3 c K D V 3 W c O U Z W M - Y
u c o o o m c m
22;: e 1 0 3 m b 2 . 4 1
m u 0.0 E n
rl
W cl m <
w u u
3
E
2
m
C I m i m m u
m o w U L
i c a 0 0-3 m u a c
3
a -
w . Y C . Y O
x m - Y m i v m 2 2 % 3 % . A 0 w 3 a 3 3 c
m u C C Y Y O - 0 u 3 . -
i v w a c
3 m D 3 m m - r l d 0 d Y l . O C " * m c Y Y O c m u u
0
m 1
m
V
m i
3 3
.",
18

TABLE IV. TURBULENCE EFFECT RATING SCALE
Increase of pilot effort with turbulence
No significant increase
More effort required
Best efforts required
Deterioration of task performance with
turbulence Rating No significant A
No significant B deterioration
deterioration Minor C Moderate D Moderate E Major (but evaluation F
Large (some tasks cannot G
tasks can still be accomplished)
be performed)
19
Unable to perform tasks H

TABLE V. DYNAMIC STABILITY CHARACTERISTICS OF SIMULATED LARGE SUBSONIC TRANSPORT AIRPLANES IN APPROACH AND LANDING FLIGHT CONDITIONS
0.641 22.68 0.902 0.972
5.00
(a) Twin-fuselage cargo transport
Short-period mode 3.010 0.770 2.684
11.49 0.771 0.704 0.691 0.207 0.753 0.216 5.00 4.32
Longitudinal (aperiodic) mode
V,pp/6f = 142125 Ve/6f = 132150 SCAS SCAS Satisfactory Acceptable
Parameter Unaugmented (a) Unaugmented (a) criterion criterion
w s p , radlsec . . . . Psp , sec . . . . . . < s p . . . . . . . .
n/a, g unitslrad . . L a / w s p . . . . . .
See figs. 8(a), 15(a) See figs. 8(a), 15(a)
0.35 to 1.30 0.25 to 2.00
. . tg, sec . . . . . . > 6
Long-period mode Wph, radlsec . . . . 0.101 0.259 0.146 0.262 Pph, sec . . . . . . 62.20 43.12 < h . . . . . . . . 0.061 1.383 0.036 1.222 2 0.04 20
Roll-spiral mode TR or T R , ~ R , sec . . 0.93 ‘1.07 0.99 ‘1.13 5 1.4 5 3.0
Wrs, radlsec . . . . 2.788 2.753 <re . . . . . . . . 0.284 0.264 <rswrs, radlsec . . . 0.793 0.726 2 0.5 2 0.3 Prs, sec . . . . . . 2.35 2.37
ts2, sec . . . . . . 20.96 16.14 2 12 2 8
I Wd, radlsec . . . . 0.763 <d . . . . . . . . 0.221
P d , sec . . . . . . 8.44 ,$/p . . . . . . . 0.948
<dWd, radlsec . . . 0.169
Roll control parameters W+/Wd . . . . . . 0.963 0.997 0.961 0.996 0.80 to 1.15 0.65 to 1.35
<+ 1 <d . . . . . . . 1.264 1.007 1.326 0.994
Dutch roll mode 0.738 0.792 0.771 2 0.4 2 0.4 0.284 0.221 0.299 2 0.08 2 0.02 0.210 0.175 0.230 2 0.10 2 0.05
8.87 8.14 8.54 0.177 1.024 0.188
=Autothrottle on. ‘Value of ~ R , ~ f i .
20

TABLE V. Concluded
Parameter
(b) Reference transport
Vapp/6f = 135125 Vtl6f = 128140 SAS SAS Satisfactory Acceptable
Unaugmented (a) Unaugmented (a) criterion criterion
t 2 , sec . . . . . .
w s p r rad/sec . . . . Psp , sec . . . . . . csp . . . . . . . . L a / w s p . . . . . . nla, g units/rad . .
I -35.69 I I -35.82 I > 6
0.675 18.80 0.869 0.829 3.96
Wph, rad/sec . . . . 0.122 P p h , sec . . . . . . 51.39 <ph . . . . . . . . I 0.045 1
0.754 0.645 0.706 23.79 19.73 25.99 0.937 0.870 0.940 0.742 0.823 0.752 1 3.56 3.96 1 3.56
Longitudinal (aperiodic) mode
0.129 48.72 0.072 2 0.04
See figs. 8(a), 15(a)
T R , sec . . . . . . ts2, sec w r s , radlsec . . . .
<rswrs, radlsec . . . P r s , sec . . . . . .
. . . . . .
<rs . . . . . . . .
0.35 to 1.30 See figs. 8(b), 15(b) See figs. 8(a), 15(a)
1.75 2.31 1.79 3.35 5 1.4 5 3.0 10.75 - 28.20 10.37 - 3.41 2 12 2 8
2 0.5 2 0.3
See figs. 8(a), 15(a)
Wd, radlsec . . . . 0.579 0.432 0.553 <d . . . . . . . . 0.135 0.544 0.125
P d , sec . . . . . . 10.95 i7.33 i 1.44 <dwd, rad/sec . . . 0.078 0.235 0.069
+ / P . . . . . . . 1.053 0.850 1.187 ~-
0.25 to 2.00 See figs. 8(b), 15(b) See figs. 8(a), 15(a)
0.395 0.445 0.176 17.77 0.861
W+/Wd . . . . . . 0.824 1.148 0.857 <+/<d . . . . . . . 1.951 0.818 2.332
0.80 to 1.15 0.65 to 1.35 1.243 1.022
2 0.4 2 0.08 2 0.10
2 0.4 2 0.02 2 0.05
21

TABLE VI. CONTROL RESPONSE CHARACTERISTICS OF SIMULATED LARGE SUBSONIC CRUISE TRANSPORT AIRPLANES
Vapp f 6 r = 142165
SCAS Parameter Unaugmented (a)
emax, rad/sec2 . . - 0.111 - 0.142 e& . . . . . . . Aanf9, -- . .
deg/sec
t l , sec . . . . . . 0.05 0.01 At, sec . . . . . . 2.20 0.47 A O , I A ~ , . . . . . 0 0.037
Jmax, rad/sec2 . . 0.151 0.148 dmax, deglsec . . . 14.84 16.82 p 2 f p 1 . . . . . . . 0.785 1.000 4oscldav . . . . . 0.019 0.007 t+30, sec . . . . 3.28 3.24 t l , sec . . . . . . 0.01 0.04 At, sec . . . . . . 1.30 1.41
(a) Twin-fuselage cargo transport
Vg f 6 j = 132150
SCAS Satisfactory Acceptable criterion criterion Unaugmented (a)
Longitudinal - 0.097 - 0.124 - 0.142 b - 0.091
See fig. 17' See fig. 10'
0.05 0.01 5 0.200 5 0.283 1.92 0.54 '0.039 to 0.872 '0.014 to 2.811
0 0.059 5 0.30 5 0.60 Lateral
0.184 0.181 See fig. 25 See fig. 25 18.70 20.67 See fig. 26 0.996 1.000 2 0.60 2 0.25 0.018 0.008 See fig. 27(a) See fig. 27(a) '2.93 2.92 5 2.5 5 4.0 0.01 0.04 5 0.283 5 0.400 1.42 1.54
Parameter
emax, rad/sec2 . .
Aa,/e, .mz . .
t l , sec . . . . . .
A ~ , I A ~ , . . . . .
e less . . . . . . .
deg/sec
At, sec . . . . . .
"Autothrottle on. bMinimum demonstrated speed = l.06Vs. 'Landing configuration.
Acceptable Vtf6j = 128140 I Vapp f 6 j = 135125
SAS SAS Satisfactory Unaugmented (a) Unaugmented (a) criterion criterion
Longitudinal - 0.051 - 0.051 - 0.046 - 0.046 - 0.055 - 0.035
See fig. 17' See fig. 10'
0.05 0.03 0.05 0.03 5 0.200 5 0.283 '0.014 to 2.905 1.58 1.42 1.71 1.35 '0.041 to 0.901
0 0.14 0 0.18 5 0.30 5 0.60
(b) Reference transport
&ax, rad/sec2 . . &ax, degfsec . . . p 2 f p 1 . . . . . . . 4oscf4av . . . . . t4=30, sec . . . . t l , sec . . . . . . At, sec . . . . . .
0.121 0.120 15.56 17.25 0.865 0.854
3.6 3.6 0.15 0.15
2.90
Lateral 0.155 20.86 0.930
3.1 0.16
0.153 22.52 0.918
3.1 1 0.16 I 2.51
See fig. 25
2 0.60 See fig. 27(a)
5 2.5 5 0.283
See fig. 25 See fig. 26
2 0.25 See fig. 27(a)
5 4.0 5 0.400
_ _ _ ~~
22

TABLE VII. NORMAL ACCELERATION AT PILOT STATION PER STEADY-STATE ROLL RATE
-30
TR, sec 0.6
.6
.6
1.1 1.1 1.1
2.3 2 3 2.3
3.83
0 .049 .086
0 .041 .070
4.46 4.46 4.46
6.59 6.59 6.59
A n Z , p / P S S , g units/(deg/sec)
0 .019 .033
0 .011 .020
0 .006 .011
23
I I
f
0 0 F- In c
0
0 m ?
1 7 0 0
4 v)
24

I O I
25

100
80
60
Thrus t ,
percent
40
20
0 0 1 2 3 4 5 6 7 8 9 1 0 1 1 1 2 1 3 1 4
Time, sec
Figure 3. Typical engine thrust response characteristics used in simulations. (From ref. 1.)

L-75-7570 (a) Langley Visual/Motion Simulator.
r
L-78-7794
(b) VMS instrument panel.
Figure 4. Langley Visual/Motion Simulator and instrument panel display,
27

L-78-81
(a) TIFS airplane.
r E L E C T R O N I C COMPONENTS O F ,-
S A F E T V P I L O T S
T E S T E N G I N E E R S
S I D E FORCE S U R F I C E S
. U A T I O N P I
- C A W O P Y
I L O T S
(b) Layout of TIFS.
Figure 5. Photograph and layout diagram of USAF/AFWAL Total In-Flight Simulator (TIFS). (From ref.

(a) Overall view of TIFS cockpit.
(b) TIFS cockpit and instrument display.
Figure 6. TIFS cockpit and instrument display. L-78-82
29

v) c, L 0
v) E: a L c,
a
c, L 0 Q ln c a L c,
c, W ‘3
W m a 7
aJ VI 13 +-
I c 3 *r
c
-
-
-
-
I I 1 1 I I I I I I
c, E: aJ v) aJ L a
c, L 0 a v) E: a L c,
c, aJ ‘3
W V c aJ L aJ cc aJ a
0 cu
d
a i

00
v) c, L 0
t ' t I I , , 1 , , , I I , . , 1 I I 1 m - 0 0 h
cd e, : E 2
W &
El ctr 0
.A 8
G h e, Y
.A
h
W rd
31

I-- 0
t .I-
" V
Io
32
u aJ m In 0
0
II
s- Y
>, 5
aJ U
F
aJ E *r
_ -
I I I 1 I I I
co d 0 ul I t
(v - - pr) cu (v cu
n
-43

A Boeing 707 prototype
Q Reference transport 0 Twin-fuselage transport
2 Maximum pitch accei eration, .. 8 , deg/sec
Figure 10. Longitudinal control characteristics of simulated transport concepts relative to control requirements of refernce 8 and control characteristics of Boeing 707 prototype.
33

zos 0
4
3
$ y deg/sec 2
1
0
4
3
2 B Y
1
0
Time, sec
Figure 11. Lateral-directional response to a step wheel input on unaugmented twin-fuselage transport airplane.

(a) Longitudinal (pitch) control system.
Figure 12. Normal operational stability and control augmentation system (SCAS). SCAS gains are indicated in parentheses.
35

0.25 d e g l d e g + 1 5 O
0 SERVO MODEL W 1 ' - K6
(b) Lateral (roll) control system and switching logic.
Figure 12. Continued.
36

6 P
SERVO MODEL
(-14.0) +35O
~ 6 r
(c) Directional (yaw) control system.
Figure 12. Concluded.
37

=
Figure 13. Block diagram of autothrottle for twin-fuselage configuration
- = APLA KA KV . s+l
Gains are indicated in parentheses.
38

- 0
t -7
n
V W
V a, v)
N a N
II
re re
a a!
P
I
I I i I I I I I I I I I I \ \ \ \ \ \
V aJ v)
M
0
II
cc re
a a!
P
V aJ v)
0 ?
7
II
re re a! n
P
\ \
39

i n
u
00
1: f 5
' u
L
40

Large transports (augmented) of references 1 and 14 . _ . . . . . 0 Reference transport (augmented) 0 Twin-fuselage transport (augmented)
IO
5
w TO2 SP
I .o
.5
ti Class 111, level 1 0.70 0.28
Ciass 111, .i i i level 2 .40 .14
.I .5 I .o <SP
5
Figure 16. Proposed Category C flight phase requirements for short-term pitch response to pitch controller. Boundaries from reference 9.
4 1

\ 2 \
Ln 0 L n 0 0 m 0 m m N N c c

I 7 0
t .r
V W
(v .cD a
0 c, a L Y a aJ
c, c aJ v) Ts m L I-
.r
n
*C
0 4
43

I I I I I I I I
I I I
I
lI i
N 0 N I e
0, aJ U I
m
\ \ \ /\ \
I I
I I \
\
d N 0 0 0 0 co rD .- (u
d =1 fi 0
9 a Y
0 7 aJ 0 L
3 W
44
V a,
n l n

0 0 F
0 m 0 0
a U 0 N 0
0 m
In N
0 N
In c
0 7
In
0
m m
0 m In 0 (u N
0 7
In 0
45

0 P i l o t A 0 P i l o t B
Unacceptable ( l eve l 3)
Acceptable b u t unsa t i s f ac to ry
( l eve l 2 )
S a t i s f a c t o r y ( l e v e l 1)
1 I I 1 0 5 10 15 20 25 30
Steady 90' crosswind v e l o c i t y , knots
I I
Figure 21. Pilot ratings of handling qualities for approach and landing task in 90'crosswinds.
46

0 P i l o t A, approach on ly
P i l o t A , approach t o touchdown
A P i l o t C y approach o n l y
A P i l o t C, approach t o touchdown 0 Ground-based s imu la t ion (present study)
0 Ground-based s imu la t ion ( r e f . 1)
c , 1 1 I . ! 1
0 . 01 .02 .03 .04 .05 .06 .07 1
nz , p ’ P W g u n i t s / (deg/sec)
Figure 22. Average pilot rating relative to An,,p/pss for approach only and approach to touchdown based on in- flight simulation of twin-fuselage transport. V,, = 15 knots; Lateral runway offset = 200 ft. Flagged symbols indicate PIO’s (noticeable altitude changes due to roll control inputs). In-flight data from reference 11.
47

Average p i r a t i n g
6 -
5 -
4 -
3 -
2 -
1 -
i l o t
l o t
Average p i l o t r a t i n g
Average p r a t i n g
0 P i l o t A, approach o n l y
P i l o t A, approach t o touchdown
P i l o t C , approach o n l y
A P i l o t C, approach t o touchdown
0 Ground-based s i m u l a t i o n (p resen t s tudy )
Acceptable b u t u n s a t i s f a s t o r y
( l e v e l 2 )
S a t i s f a c t o r y - (Leve l 1 )
= 1.1 sec ( b a s e l i n e c o n f i g u r a t i o n ) R,e f f T
Acceptab le b u t u n s a t i s f a c t o r v
S a t i s f a c t o r y ( l e v e l 1 )
= 2 . 3 sec ‘R,eff
Y Y Acceptab le b u t
# u n s a t i s f a c t o r y ( l e v e l 2 )
& d
Sat i s f a c t o r y 1 (Leve l 1 ) Normal p i l o t l o c a t i o n
I 1 I I I I I I
- 2 0 0
L a t e r a l p i l o t l o c a t i o n f rom a i r c r a f t c e n t e r of g r a v i t y , ft
-60 -40
Figure 23. Effect of pilot location and effective roll mode time constant on pilot rating during approach and landing. Shaded areas based on test data containing predominantly normal acceleration cues.
48

- 0 L c, c 0 V
7 - 0 L
-0 aJ m a aJ L V C U
L n d r n C U . . . .
S- a c a5
1
o a vv
5 f n c,
-3-
ccccl 0-
m E h
0 I I I m cu I-- 0
0 0 0
7 7
0 - 0-l 0
co 0
h 0
a 0
L n 0
Kr 0
m 3
N 3
- 3
3
49

Roll power rad/ sec
4 Reference transport 0 Twin-fusel age t r anspor t
\
Unacceptable \ (level 3)
Unacceptable (level 3)
\
* 01 I I I I 1 1 1 1 I 1 1 1 I l I I . 10 1.0 10.0 Rol l mode t i m e constant , sec
Figure 25. Roll acceleration response boundaries for large aircraft. Boundaries from reference 16.

0
c, L 0 Q
c , v ) L S o m Q L
00
00
0 ‘ 0 n
n n U
E 0 h
0 m 0 d
0 ccr
51

Unacceptable (1 eve1 3)
.6
Posc’pav - 4
.2
0 Reference , t r a n s p o r t 0 Twin-fuse lage t r a n s p o r t
. -
*
I
- a
I 1 IA 1 1 1 1
0 -40 -80 -120 -160 -200 -240 -280 -320 -360 w O . deg
(a) Bank-angle oscillation limitations.
15
10
A O m a x l K . deg
5 -
O h
.8 T
- 0 Twin- fuse l age t r a n s p o r t
-
- /- #
1 0 A * I 1 1 1 1 ”
Unacceptable 0 Reference t r a n s p o r t ( l e v e l 3 ) 0 Twin-fuse lage t r a n s 2 o r t
52

. Report No. 12. Government Accession No. 13. Recipient's Catalog No.
NASA TP-2451 :. Title and Subtitle 5. Report Date
Ground-Based and In-Flight Simulator Studies of Flight Characteristics of a Twin-Fuselage Passenger Transport Airplane During Approach and Landing
William D. Grantham, Paul M. Smith, William R. Neely, Jr., Perry L. Deal, and Kenneth R. Yenni
NASA Langley Research Center Hampton, VA 23665
1 505-34-03-03 '. Author(s)
j. Performing Organization Name and Address
- ~ _ _ _ _ ~ _. .__-. ~ - 18 Ilistribution Statement Unclassified- Unlimit ed 7 I 1Jnclassificd 53 I A04
Subject Category 08 ~ ~-
20 Security <'I.usif ( o f i l i i s pige) 21 N o o f I'.Lw:. 22 Price
--
September 1985 6 . Performing Organization Code
8. Performing Organization Report No.
I L-15941
12. Sponsoring Agency Name and Address National Aeronautics and Space Administration Washington, DC 20546
13. Type of Report and Period Covered
Technical Paper
L5. Supplerrientary Notes William D. Grantham, Perry L. Deal, and Kenneth R. Yenni: Langley Research Center, Hampton, Virginia. Paul M. Smith: PRC Kentron, Inc., Hampton, Virginia. William R. Neely, Jr.: Air Force Systems Command Liaison Office, Langley Research Center, Hampton,
Virginia. 16. Abstract Six-degree-of-freedom ground-based and in-flight simulator studies were conducted to evaluate the low-speed flight characteristics of a twin-fuselage passenger transport airplane and to compare these characteristics with those of a large, single-fuselage (reference) transport configuration similar to the Lockheed C-5A airplane. The results of this study indicated that the twin-fuselage transport concept had acceptable but unsatisfactory longitudinal and lateral-directional low-speed flight characteristics, and that stability and control augmentation would be required in order to improve the handling qualities. Through the use of rate-commandlattitude-hold augmentation in the pitch and roll axes, and the use of several turn coordination features, the handling qualities of the simulated transport were improved appreciably. The in-flight test results showed excellent agreement with those of the six-degree-of-freedom ground-based simulator handling qualities tests. AS a result of the in-flight simulation study, a roll-control-induced normal-acceleration criterion was developed. This criterion states that the ratio of maximum incremental acceleration at the pilot station to the steady- state roll rate following a step lateral control input ( h n z I p / p s s , g unit/(deg/sec)) shall not be greater than 0.020, 0.048, and 0.069 for pilot rating levels 1 (satisfactory), 2 (acceptable but unsatisfactory), and 3 (unsatisfactory), respectively. The handling qualities of the augmented twin-fuselage passenger transport airplane exhibited an improvement over the handling characteristics of the reference (single- fuselage) transport.
The primary piloting task was the approach and landing task.
17 Key Words (Suggested by Authors(s)) Handling qualities Twin-fuselage airplanes Rate-command control systems Roll performance Ground-based simulation In-flight simulation Ride %ual;t;..
Unclassifird 19 Security < ' ]<byi f (o f t l i ih report)
~- _ _ _ ~ ~ ~
For sale by the National Techtiir;rl 1iiforiiiiit.ioli Service, Spriiigfield, Virginia 22161 NASA-Langley , 1985

National Aerbnautlcr and - < $ita Administration
Washington, D.C. 20546 Offkid BuJ#rr pllwtt~for Rhnte um,w
I I . - ,
POSTAGE &FmFAlD - NASA W-,DC
P m i f NO. G-27