i ao-a119 ensiieuins rmfa*tch profile analysis system
TRANSCRIPT

I AO-A119 44*9 COASTAL ENSIIEUINS RMfA*tCH CENTE FORT SELvOIN VA F/e 8/61 iBACH PROFILE ANALYSIS SYSTEM (SPAS$. VOLUME I1. SPAS USrR0S 6--ETC(U).AM 8 N V FLIOI1No, T J LAWLER
UNCLASSIFIED CERC-TR-U-1-VOL-3 NL
I,/hEillIlSESES
IIP'-41lg

TR 82-1 (TMI)
Beach Profile Analysis System (BPAS)
Volume TMT
BPAS User's Guide: Analysis Module SURVY1
by
Marilyn V. Fleming and Timothy J. Lawler
TECHNICAL REPORT NO. 82-1 (TE)
JUNE 1982
. oIPVS OF , .,
O ~ ~ ~ F 0P. "_ 60 + .. "
4 c-" ps,.' ' ' .4 -
Approved for public release;distribution unlimited.
4.4
U.S. ARMY, CORPS OF ENGINEERS
COASTAL ENGINEERING 4RESEARCH CENTER
Kingman Building
Fort Belvoir, Va. 22060I.A.
Reprint or republication of any of this materialshall give appropriate credit to the U.S. Army CoastalEngineering Research Center.
Limited free distribution within the United Statesof single copies of this publication has been made bythis Center. Additional copies are available from:
National Technical Information ServiceATTN: Operations Division5285 Port Royal RoadSpringfield, Virginia 22161
The findings in this report are not to be construedas an official Department of the Army position unless sodesignated by other authorized documents. )
~I
I4.
_ _III_. . . . ... .. . . - -

UNCLASSIFIEDSECURITy CLASSIFICATION OF THIS PAGE (When Data Eneered)
REPORT DOCUMENTATION PAGE BRED OTRUCIONSI. REPORT NUMBER TVT ACCESSION No. . RECIPIENT'S CTALOG NUMBER
TR82-1 (11) K & I _4. TITLE (id S.ubffte) S. TYPE OF REPOR PERIOD COVERED
BEACH PROFILE ANALYSIS SYSTEM (BPAS) Technical ReportVolume III. BPAS User's Guide: 6. PERFORMING ORG. REPORT NUMBER
Analysis Module SURVYL7. AUTOR(*) 6. CONTRACT OR GRANT NUMBER(e)
Marilyn V. FlemingTimothy J. Lawler
9. PERFORMING ORGANIZATION NAME AND ADDRESS 10. PROGRAM ELEMENT. PROJECT. TASKAREA & WORK UNIT NUMBERS
Department of the ArmyCoastal Engineering Research Center (CERRE-CS) C31194Kinaman Building. Fort Belvoir, Virginia 22060
it. CO rROLLING OFFICE NAME AND ADDRESS 12. REPORT DATE
Department of the Army June 1982Coastal Engineering Research Center 13. NUMBER OF PAGESKln~nn Bidln ForBelvoir. Viroinia 22060 46
MOTo C NAME ADORESS(It diflermt from Coanfolfnd Office) 1S. SECURITY CLASS. (of this report)
UNCLASSIFIED
15o. DECLASSI FI CATION/DOWNGRADINGSCHEDULE
IS. DISTRIBUTION STATEMENT (of thi Report)
Approved for public release; distribution unlimited.
17. DISTRIBUTION STATEMENT (of the abstract engered In Block 20, it different from Report)IIS. SUPPLEMENTARY NOTES
it. KEY WORDS (Cotinue on revese e ls if necessaynd Identify by block nshber)
Automated data processing Beach profile changesBeach evaluation program Computer programsBeach profile analysis system Survey data analysis
26L AMSTRACT' (Cthue m mwe aide N nfeem d identfW l by block amibe)
A package of computer programs for editing, analyzing, and displaying
beach profile survey data has been developed. The 4ight-volume package, namedthe Beach Profile Analysis System (BPAS), consists of an overview of theBPAS program, two editing programs, five analysis' programs, and supporting 4appendixes.
(continued)
DO , 103 MLTIOW OF I NOV6sOsET UNCLASSIFIED
SECUIY CLASSIICATtOff OF THIS PAGE (116m DuNA Entered)
UNCLASSIFIEDSECURITY CLASSIFICATION OF THIS PAGI(Wkn Doe Entere
The first editing program checks for missing or unreasonable data,surveying or note-reducing errors, and improper arrangement of data cards.The second editing program assumes that most errors have been corrected and,while it does some minor editing, its major function is to sort, reformat, andstore the data on the selected permanent storage media. It is also used toupdate or extract data from existing files and performs some preliminary dataanalysis.
The analysis programs compute changes in shoreline position, selectedcontour positions, sand level, sand volume, and statistical trends and cor-relations. The results are plotted in a number of ways for display purposes.Output can be specified for English or metric units and can be referenced toany horizontal or vertical datum. Contour positions, including the shorelineposition, are interpolated linearly between adjacent surveyed points on theprofile. If a survey does not cross the datum elevation, but does reach aspecified minimum elevation (e.g., +2 feet MSL), the shoreline position canbe extrapolated using the two seawardmost points. Before computing volumechanges, common bonds are established relative to the landward and seawsrdextent of the surveys on each profile line. The computed area under -chprofile is then expressed in terms of a "unit volume" for a shore-normal slicethat is one unit wide. Rates of change in shoreline position and unit volumeare computed by linear regression analysis.
The BPAS package has been designed for use primarily on the CDC 6600 com-puter, although much of the coding was done in standard FORTRAN for use onother systems.
IMI
Me T.,B
F Aecessi
on
~2
D__.9tribution /
Availability Codes
Avail and/or
Dist i Special
2 UNCLASSIFIED
SECURITY CLASSIFICATION OF THIS PAGE(tmim D4a 3tttr.d)

PREFACE
This report is published to provide coastal engineers with the documenta-tion of a package of computer programs for editing, analyzing, and displayingbeach profile survey data. This package, named the Beach Profile AnalysisSystem (BPAS), was needed for the analysis of a large data bank of field andlaboratory profile surveys. The work was carried out under the U.S. ArmyCoastal Engineering Research Center's (CERC) Beach Profile Studies work unit,Shore Protection and Restoration Program, Coastal Engineering Area of CivilWorks Research and Development.
This report (Vol. III), the third of eight volumes, contains user ihstruc-tions for the analysis module SURVY1, which produces comparative plots ofbeach profiles.
The report was prepared by Marilyn V. Fleming and Timothy J. Lawlr,Systems Analysts, under the supervision of P. Pierce, Chief, ADP Office,with the assistance of Allan E. DeWall, Geologist, under the supervision ofC.J. Galvin, formerly Chief, Coastal Processes Branch, and Mr. R.P. Savage,Chief, Research Division.
Instrumental insight concerning a previous version of the Beach ProfileAnalysis System was provided by B. Sims. Programing was accomplished byM. Fleming and T. Lawler with the assistance of D. French, J. Alquist,R. Hylton, and F. Wilson.
The authors acknowledge the helpful discussions and review comments ofDrs. C. Everts, C. Galvin, R. Hallermeier, and C. Vincent, and W. Birkemeier,M. Hemsley, A. DeWall, H.C. Miller, B. Sims, and P. Vitale. 1
Technical Director of CERC was Dr. Robert W. Whalin, P.E., upon publica-{1tion of this report.
Comments on this publication are invited.
Approved for publication in accordance with Public Law 166, 79th Congress,approved 31 July 1945, as supplemented by Public Law 172, 88th Congress,approved 7 November 1963.
' E.BIAlO- -A
Colonel, Corps of EngineersCommander and Director
•4 .

CONTENTS
Page
CONVERSION FACTORS, U.S. CUSTOMARY TO METRIC (SI) ............... 6
1 INTRODUCTION.................................................... 7
II PROGRAM DESCRIPTION... ...... . ......... ...................... 7
III HARDWARE AND SOFTWARE REQUIREMENTS .............................. 10
IV INPUT DATA ......................................... . .......... 10
V MODULE OUTPUTS ........ e........................ .. ............. 112. Table of Options Selected .... e........................... 132. Table of Specifications Selected .... o...... ............. 13
3. TABLE ............ .................................... 134. PLOT1 .................. o.... ............o............o....... 155. PLOT2 ............. o........o................ . ..... .. -o..... 156. PLOT3 ................ ...........*..............o............. 15
7. PLOT Statistics ..... ................... . . 15
VI JOB STRUCTURE ...... ... .......... ...................... 221. Program Identification Cardss .......................... 222. The Header Record ...... o ........... ......... ....... 223. The Option Cards ................. . ... . .......... . ... 244. Processing Specification Cards ........................... 295. Output Specification Cards.r............................. 30
VII SUM4MARY ...... o .............. ..... ..... .. . .. . .... ..... .... 32 }
APPENDIX SUr '"" RECORD LAYOUTS FOR OPTION AND OUTPUTSPECIFICATION CARDS ...... ........... ..... # ................. .. 33 -
TABLES
I Format of the header record .......... ....... .......... ... ........... . 11
2 Format of final data file-recorded on magnetic media.. ............... 12
3 Format of final data file-card image data ............................. 12
4 Program identification card......... . ............................ .o.. 24
5 SURVY1 analysis options and their defaults............................ 24
6 Option card I-input horizontal datum ................................ 25
7 Option card 2-display of time.. ....................... ............ .. 25
8 Option card 3-output vertical datum................................... 26
9 Option card 4-output horizontal datum ........ 0........ .............. 26
4c

I
CONTENTS
TABLES--ContinuedPage
10 Supplementary option cards 4A-distance to output horizontal datum,
user-supplied .................... * ... . ............ ........ * ...... 27
11 Option card 7-data description ...................................... 28
12 Option card 8-linear output units ...... i........................... 28
13 Option card 9-extrapolation to zero elevation ........................ 29
14 Option card 10-format of input data ................... T.............. 29
15 Format of TABLEt specification card ................................... 30
16 Plot specifications for SURVY1 plot output ............................ 31
FIGURES
1 Beach Profile Analysis System... .............. o ...................... 8
2 Analysis module SURVY1 .. . I ................................... 9
3 Sample SURVYl output--table of options selected ....................... 13
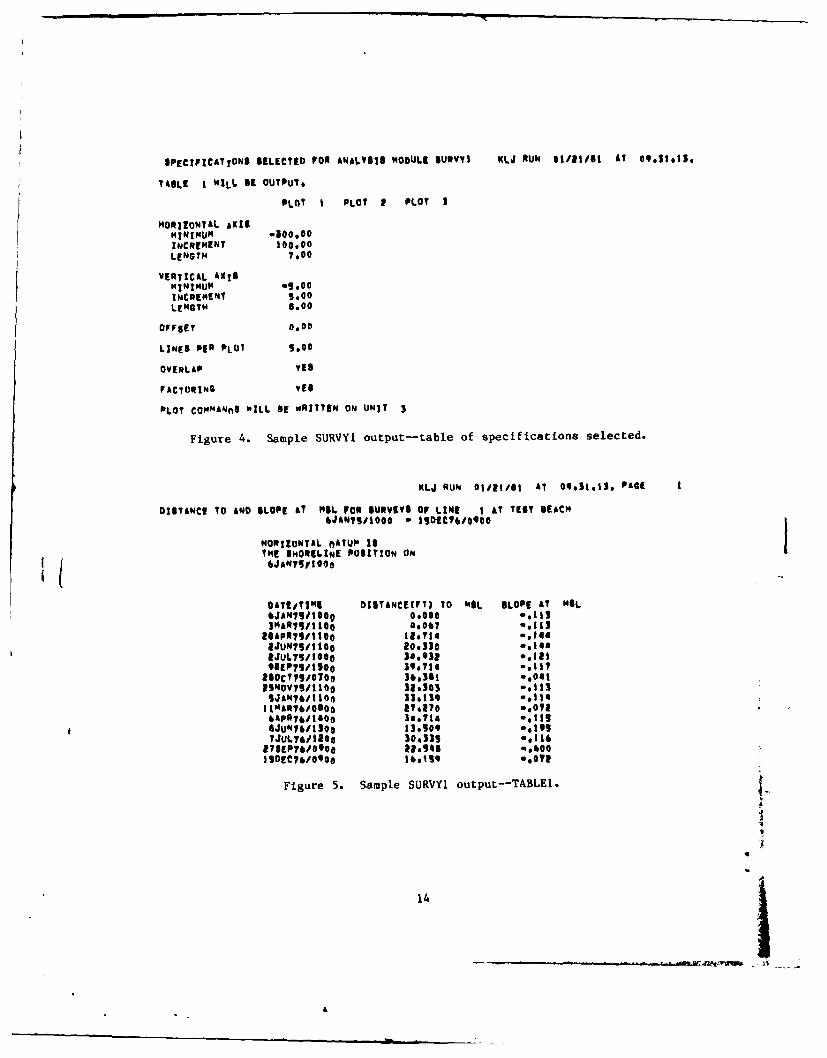
4 Sample SURVYl output--table of specifications selected............... 14
U 5 Sample SURVYI output--TABLE1......................................... 14( (
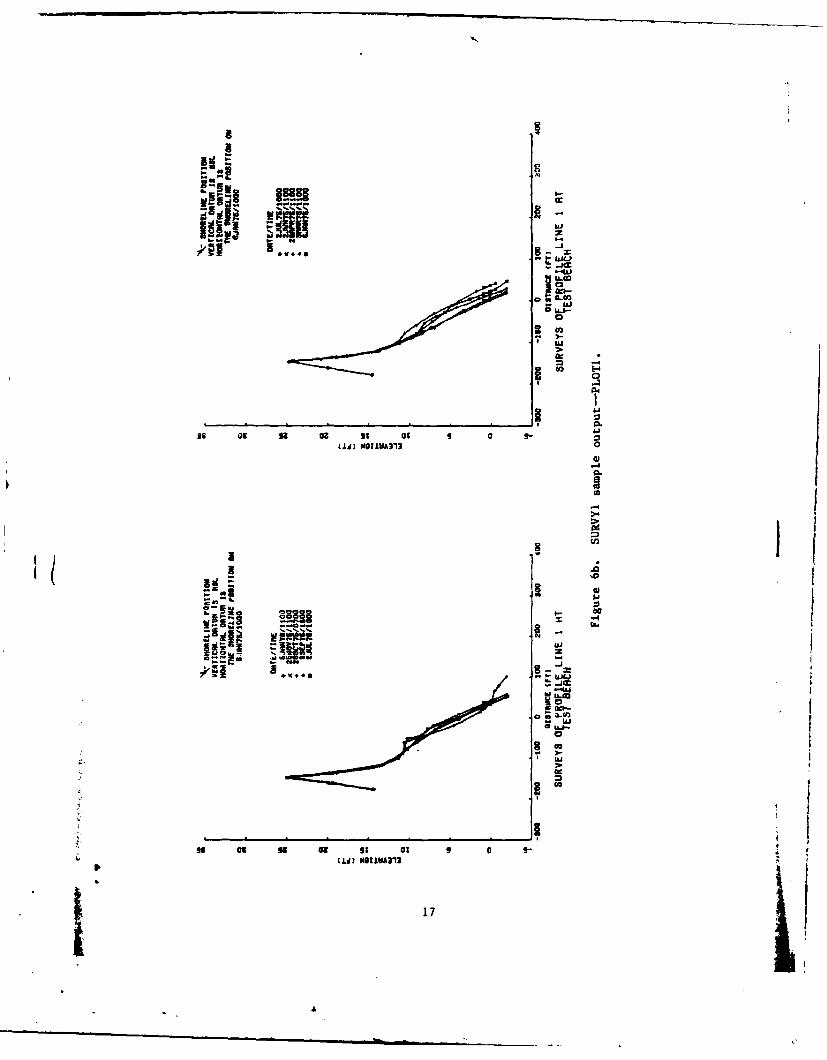
6 SURVY1 sample outputs a and b--PLOTI.................................. 16
7 SURVYL sample outputs a and b--PLOT2. ................................ 18
8 SURVYl sample outputs a and b--PLOT3.................................. 20
9 Sample SURVYI output plot statistics.................................. 22
100 Jobob tstru tc urere e......s..e....o ......e ....e ..a.a ..o ....e ..............e .......... o o 2
5I
5 l l

CONVERSION FACTORS, U.S. CUSTOMARY TO METRIC (SI) UNITS OF MEASUREMENT
U.S. customary units of measurement used in this report can be converted tometric (SI) units as follows:
Multiply by To obtain
inches 25.4 millimeters2.54 centimeters
square inches 6.452 square centimeterscubic inches 16.39 cubic centimeters
feet 30.48 centimeters0.3048 meters
square feet 0.0929 square meterscubic feet 0.0283 cubic meters
yards 0.9144 meterssquare yards 0.836 square meterscubic yards 0.7646 cubic meters
miles 1.6093 kilometerssquare miles 259.0 hectares
knots 1.852 kilometers per hour
acres 0.4047 hectares
foot-pounds 1.3558 newton meters imillibars 1.0197 x 10⁻³ kilograms per square centimeter
ounces 28.35 grams
pounds 453.6 grams0.4536 kilograms
ton, long 1.0160 metric tons
ton, short 0.9072 metric tons
degrees (angle) 0.01745 radians
Fahrenheit degrees 5/9 Celsius degrees or Kelvins1
ITo obtain Celsius (C) temperature readings from Fahrenheit (F) readings,
use formula: C - (5/9) (F -32).To obtain Kelvin (K) readings, use formula: K - (5/9) (F -32) + 273.15.
6
I -|

BEACH PROFILE ANALYSIS SYSTEM (BPAS)
Volume III. BPAS User's Guide: Analysis Module SURVYI
by
MariZyn V. Fleming and Timothy J. Lawter
I. INTRODUCTION
This report, the third of eight volumes, provides user instructions forprocessin~ . sis module SURVYI, a part of the Beach Profile Analysis System(BPAS)((Fig. 1)._'- The BPAS is a package of computer programs which edit andanalyze beach profile data. The objective of the analysis is to compute anddisplay changes in unit volume, shoreline position, and profile geometry.SURVYI displays beach profile changes, through time, at a locality by pro-viding plots of the actual profile cross sections. Also available is atabular listing of distance to, and slope of, the profile at the shorelineposition. ' ---a
Volumes I and VIII contain information concerning data collection,formatting and restrictions, and program computations, assumptions, and errormessages not repeated in this volume. It is recommended that Volumes I andVIII be used in conjunction with this volume. Volume II, which is a user'sguide for processing the editing routines, EDITI and EDIT2, containsguidelines for the initial preparation of survey data. These guidelines arenot repeated in this volume. Other volumes available in the series are:
(a) Volume IV, "BPAS User's Guide: Analysis Module SURVY2,"which produces plots and tables of contour positions.
(b) Volume V, "BPAS User's Guide: Analysis Module BEACH," whichproduces plots and tables of unit volume and shoreline position
( changes.
(c) Volume VI, "BPAS User's Guide: Analysis Module VOLCTR,"which produces tables and plots of change in unit volume betweenspecific contour segments.
(d) Volume VII, "BPAS User's Guide: Analysis Module ELVDIS,"which produces tables and plots of change and maximum and minimumelevations at specific distaaces.
Each of these volumes contains instructions for processing only the modulewith which it is concerned.
II. PROGRAM DESCRIPTION
The survey input data processed by program SURVYI (Fig. 2) are assumed tohave already been processed through the editing routines, EDITI and EDIT2.These edit routines perform a thorough edit and a partial analysis of thedata. The result of this preliminary analysis is contained on the firstrecord in the survey data input file, the header record. The informationon the header record, along with information specifying desired outputs andoptional data specifications, is used to determine whether the data willexceed the program capabilities. If capabilities will be exceeded or the jobhas been improperly set up, SURVYI will print an appropriate error message andstop execution after this initial test. Otherwise, the program will continue.
7i

Collect Data
FEncode Dato
Edit Dnta
EDITI & EDT2
Plot ProComputempShorellime
Module VOLCTR Module ELVOIS
FiurlotBac Profile Aalysie System
r-4 iCopue onou Cmpt Vlue omut Po8l

Calms Selecteds SNw60
Seeelectirl
Mired 5,.Rr twoa
Compote Dislae Is ton-
Sim. of 9o
Awe "Now"
Regime~~ Or fl-I .11
Fiue2Tnlaaedl UVl
TAL9
D o e i t l s e t " S w o

SURVY1 reads the input data, finds the shoreline position, and producesthe requested plots of profiles or a tabulation of shoreline positions andslopes. Records are read until all data for a single profile line have beenprocessed. As each record is read, the distance to the shoreline, if defined,is computed. If the shoreline position is not a surveyed point, it is inter-polated or optionally extrapolated and inserted in the record. The appro-priate adjustments are made to the data to orient the distances and elevationsto the specified output horizontal and vertical datums, and the data areconverted to the selected output units of measurement. Outputs pertaining toeach profile line are written after all data for the profile line have beenprocessed. The program then reads and processes the data for the next profileline. If the output horizonatal datum for any profile line cannot be computed(e.g., no shoreline position is defined on the selected reference survey),there will be no output for that profile line (a message will inform theuser).
Outputs for each survey are produced after all the data have been read.When these outputs are completed, plot statistics (number of each type of plotproduced) are written.
III. HARDWARE AND SOFTWARE REQUIREMENTS
SURVYL is written in extended FORTRAN IV and was designed to takeadvantage of processing features available on the Control Data Corporation6600, Cyber 176 or equivalent computer. Such features include the 10-character, 60-bit word size, the FORTRAN-callable sort routine (interfacingwith the NOS or NOS/BE operating system SORTMRG utility), and the utilitysubroutines and functions DATE, TIME, EOF (to check for end of data file),FLOAT, IFIX, ABS, MOD, and the maximum and minimum functions. I
General processing requirements include the 500 series CALCOMP plottinginstructions, block data subroutines, ENCODE, DECODE, variable dimensions insubroutines, 132-position line printer, a plotter, and 40,000 (decimal) wordsof core. Also required are the capabilities to process variable leagthrecords of up to 635 characters, to perform unformatted reads and writes, toaccess up to five unique units for input and output, and to use variableformats and variable input and output units in FORTRAN READ and WRITEstatements.
A single run producing all available outputs using the input data listedin Appendix G of Volume VIII, 15 surveys of 12 profile lines, required anaverage of 34,000 words of core and 70 seconds of processing time. There were30 pages of output and 117 plots. The job created about 15,600 plot cards.The program is dimensioned to process up to 150 surveys of 100 profile -ines,each defined with up to 60 coordinate pairs. Although these dimensions can bemodified to process a greater range of data, the procedure for implementingthese modifications is beyond the scope of this report.
IV. INPUT DATA
The input data consist of survey records which have been carefully editedand properly formatted by the EDITI and EDIT2 programs (see Vol. II). Thefirst record in the survey data file, the header record (Table 1), suppliesthe range of profile line numbers, survey numbers, and dates. It specifies in
10
I04

Table 1. Format of the header record.
Position No. Entry description FORTRAN format
1-2 00 A2
3-5 Lowest profile line number in data file 13
6-9 Lowest survey identification number in data 14file
10-12 Highest profile line number in data file 13
13-16 Highest survey identification number in data 14file
17-19 Maximum number coordinate pairs required to 13define any one survey
20 Number of places to the right of the decimal I1for distance coordinates
21 Number of places to the right of the decimal Iifor elevation coordinates
22-23 Two-character abbreviation for units of A2measurement in which data are recorded
24-27 Four-character acronym describing the A4vertical datum to which data are referenced
28-49 Range of dates, including time, covered 2(312,13,12)by data (yr(12), mon(12), d(12), hr(13),min(12))
50-80 Data description (31 characters) 31AI
what units of measurement the data are recorded, where the decimal should bein the distance and elevation coordinates, and to what vertical datum the dataare recorded. This record also contains a 31-character data description.This information is as supplied to or computed by the EDIT2 program. If theinformation on the header record indicates that the data will exceed any ofthe program dimensions, an error message is printed and program execution isstopped.
The survey data file, from magnetic media (Table 2) or card images (Table3), must be sorted by profile line number and then survey number. The moduleignores locality codes so all data on a single file should be from the samelocality.
V. MODULE OUTPUTS
SURVY1 will produce one tabular and three graphical displays, referred toas TABLEt, PLOT1, PLOT2, and PLOT3. Any or all of these may be producedduring a single run. In addition, tables of selected options and specifica-tions are produced by each run of each analysis module. The plot statisticsare produced by the analysis modules when plot output has been requested. Afootnote or plot legend, "X EXTRAPOLATED DATUM," will appear only if the userhas elected to allow extrapolation of the shoreline position. Sample outputsshown in the following figures have been photo-reduced.
k1

Table 2. Format of final data file, recorded on magnetic media.
Position No. Entry description FORTRAN format
1-2 Locality code A2
3-5 Profile line number 13
6-9 Survey identification number 14
10-15 Date of survey 312
16-20 Time of survey 13,12
21-23 Number of coordinate pairs in the record 13
24-28 Minimum elevation on the record 15
29-35 Blank 7X
36-end Distance and elevation coordinate pairs, 15
five positions per coordinate, no decimal
Table 3. Format of final data file--card image data.
Position No. Entry description FORTRAN format
First card in each record
1-2 Locality code A2
3-5 Profile line number 13
6-9 Survey identification number 14
10 Card number (1) Al
11-16 Date of survey 312
17-21 Time of survey 13,12
22-24 Number of coordinate pairs in the record 13
25-29 Minimum elevation this record 15
30-40 Blank
41-80 First four distance, elevation coordinate, 815five columns each coordinate, no decimals
1
Second and following cards in each record
1-9 Same as for first card
10 Card number (1-9, then A-Z) Al
11-80 Seven distance, elevation coordinate pairs, 1415
five positions each coordinate
1Position of decimal is defined on the header record (see Table 5).
NOTE.--If there are exactly four coordinate pairs (first card onlyneeded, filled to position 80), the second and the last card in therecord must be a blank card. d
12

1. Table of Options Selected (Fig. 3).
This table, produced after all option cards have been read by the program,
prints the value assigned to each variable which can be defined on an option
card. This table should be examined to ensure that the values assigned tothese variables a:c as anticipated.
O P T I 0 N I KLJ RUN 01/2l1S AT 09,31.13.
ANALYSIS "OnUL9 SELECTED-- SURVYt
USES SELECTED RUN ID-o- KLJ
LOCALITY DESCRIPTOR IS TEST 4EACH
EACM SURVEYED LINE WILL BE CALLED A PROFILE
INPUT DISTANCES ARE COMPUTED FROM THE SENC9MARK
INPUT DISTANCE$ TO FT X 10*O00 ELEVATION$ TO FT X 10**0I
VERTICAL DATUM IS "iL
A CORRECTION OF 0,000 FT WILL RE MAnE TO EACH VERTICAL CO-OROINATE.
TIME WILL APPEAR ON OUTPUT, 24-HOUr SYSTEM WILL SE USED@
MORIZONTAL nATUM 18
THE SmORELINE POSITION ONREFERENCE SARVEYTHERE ARE Nn MORE THAN 2 PROFILE LINES.THE INITIAL SURVEY OF EACH PROFILE LINE WILL BE THE REFERENCE SURVEY.
A ClvEnn,, FACTOR OF 1.00000 NILL BE USED To go FROM INPUT UNITS (FT) TO
OUTPUT UNITS (FT)
A CONVERSION FACTOR Or .03704 WILL BE USED TO 00 FROM SQUARE FT TO YD3T
EXTRAPOLATIoN WILL BE DONE TO MSL IF THE LAST SURVEYED POINT REACHES A MINIMUM
ELEVATION OF 2.000 FT
SURVEY INPUT DATA WILL BE READ FROM INIT Y IN THIS PURMAT..
Figure 3. Sample SURVYI output--table of options selected.
2. Table of Specifications Selected (Fig. 4).
This table is produced after all special processing and output selection
specifications have been read by the program. Anticipated processing speci-
fications and outputs should be compared with those actually selected.
4
3. TABLEI (Fig. 5).
TABLE1 displays the distance to and slope of the profile at the shoreline
position during each survey. There will be at least one page of output foreach profile line in the survey data file.
13
4
SPECIFICATIONS SELECTED FOR ANALYSIS MODULI IUVVYI KLJ RUN 01111191 AT 09,1,.|3,
TABLE I WILL OE OUTPUT*
PLOT I PLOT I PLOT I
HORIZONTAL AXISMINIMUM -300.00INCREMENT 100.00
LENGTH 700
VERTICAL AXlSMINIMUM .. 00INCREMENT .00
LENGTH 8,00
OFFSET 0.00
LINES PER
PLOT
5.00
OVERLAP YES
FACTORING YES
PLOT COMMANS WILL BE WRITTEN ON UNIT 3
Figure 4. Sample SURVYL output--table of specifications selected.
KLJ RUN 01ilet# AT 09.31.l1. PAGE I
DISTANCE TO AND SLOPE At NSL FOR SURVEYS Of LINE I AT TEST BEACH6JANIIlO00 * ISDECio000 i
HORIZONTAL oATUM ISTHE SHORELINE POSITION ON
DATETIME OISTANCE(FT) TO NIL SLOPE AT NIL6JAN73i1009 0.000 -. 1133MAR7511080 49067 -.1132SAPRV1llo 1114714 -. 144RJUNT$/I00 20.330 -. 14RJULTS/IO00 34,932 offl9SEPVtIIO0 39071a -117
26OCT?5/0700 56,3S1 -e001aSNOVS/110o0 32.303 -e113SJAN?6/1100 13.139 -611411MA?610900 27e.70 0,07860PRT6OiJ40 5.o714 sells*JUN?0/110 0 13.509 *.195IJULT6/1800 30.335 *11t
27SEP6.00900 22.59o ,6.00ISDEC7109100 10.19 '.011
Figure 5. Sample SURVYI output--TABLEL.
1
i
. . .... ... ... .. . lt 'm . .. ..

4. PLOTI (Fig. 6).
This plot displays profiles during surveys at a profile line. Up to 10surveys may be displayed on a single plot. The user may request that profilesbe vertically offset by a fixed amount or that the lines be superimposed. Ifthe lines are superimposed, unique symbols will be plotted on each line sothat surveys can be differentiated. The user may also specify overlapping ofplots when all surveys cannot be drawn on a single plot (e.g., the last linedrawn on each plot is the first drawn on the next). Figure 6 contains samplesof offset (a), superimposed (b), overlapped (b), and not overlapped (a) plots.A new axis is drawn each time the profile line number changes and there willbe at least one plot for each profile line in the survey data file.
5. PLOT2 (Fig. 7).
This plot displays profiles at different profile lines during a singlesurvey. There will be a new axis drawn each time the survey number changes;thus, there will be at least one plot for each survey in the input file.There may be up to 10 profiles, offset or superimposed, drawn on a singleplot. When the profiles are to be superimposed, each profile line will bedistinguished by a unique symbol. The plots may be overlapped when allprofile lines cannot be drawn on a single plot. Figure 7 provides ,.n exampleof plots which are offset (a), superimposed (b), overlapped (b), and notoverlapped (a).
6. PLOT3 (Fig. 8).
This plot emphasizes changes in proflies between surveys. Profiles duringtwo consecutive surveys at the profile lines are superimposed. There will bea minimum of one plot less than the number of surveys in the input data file.A new axis is drawn each time a different set of surveys is to be compared.Up to 10 superimposed pairs of surveys at the various profile lines may bedisplayed on a single axis. The plots may be overlapped so that the lastprofile line represented on one plot will be first drawn on the next. Annffset must always be specified. If a profile line is surveyed dtiring onlyone of the two surveys to be compared, only one profile of that line will beplotted. If a profile line is not surveyed during either survey, the profileline will not be represented on the plot. The earlier survey of the profileis drawn using a dashline; a solid line represents the later survey. Figure 8provides examples of plots which are overlapped (a) and not overlapped (b).
7. PLOT Statistics (Fig. 9).
At the end of each run for which PLOTI, PLOT2, or PLOT3 output was pro-duced, there is a printed table identifying how many sets of axes were drawnfor each type of plot. This information may be used to determine hrw manyplots to expect.
15

'a 0 10 0 1
o~L go~-~ - '
gga; L - ~ .,
ISC ~Ar30I
I I I I II~ I I I
0
o
aa
U41 ~ 9 1OLA1
811
-4L0.
U3W
U3.
3 03 St atM-' *s -A- - U
16.- .
aid a;:Unf 0 .-
a:
N* -
041
LoL
U.0
-4-
0.
as a 29 UWl MOLVA30
17S

- .4
W0
00
0.
* 0
91 9 31 1 B 9 3 018

00
mid U3
0 QO
.- U)
I--
* 0
_______________ 0.
IU I fIL1I AYI) 0
'-4
ot
I.. I U
atU
lot ~~~ EU) a 99
l5 I
1-9

cc
Nal. I LL.so.
A -
/ w I'-~~ (a-
/ F4
ILl
- i
UA-
L
bi
0-
IC -
fuI I N0li"O31 0. l
20U

w Wit
w u'
3 BLWS~
1 0 -to Cc U
- Li
Q:: 0.
* a 0~ */i I C3
* I I I W~
-L as 00a 6 0 t
oto
1 0
a OW
II
UAL
:0-o
zM .K I 2
CI Go 09 at
"alA10 at 0
21I I

THIS RUN 6ENERATED THE FOLLOWING GRAPHIC OUTPUT.
PLOT TYPE NUMBER OF PLOT$swe"Weess 6309009 we ones"
1 a
Figure 9. Sample SURVY1 output plot statistics.
VI. JOB STRUCTURE
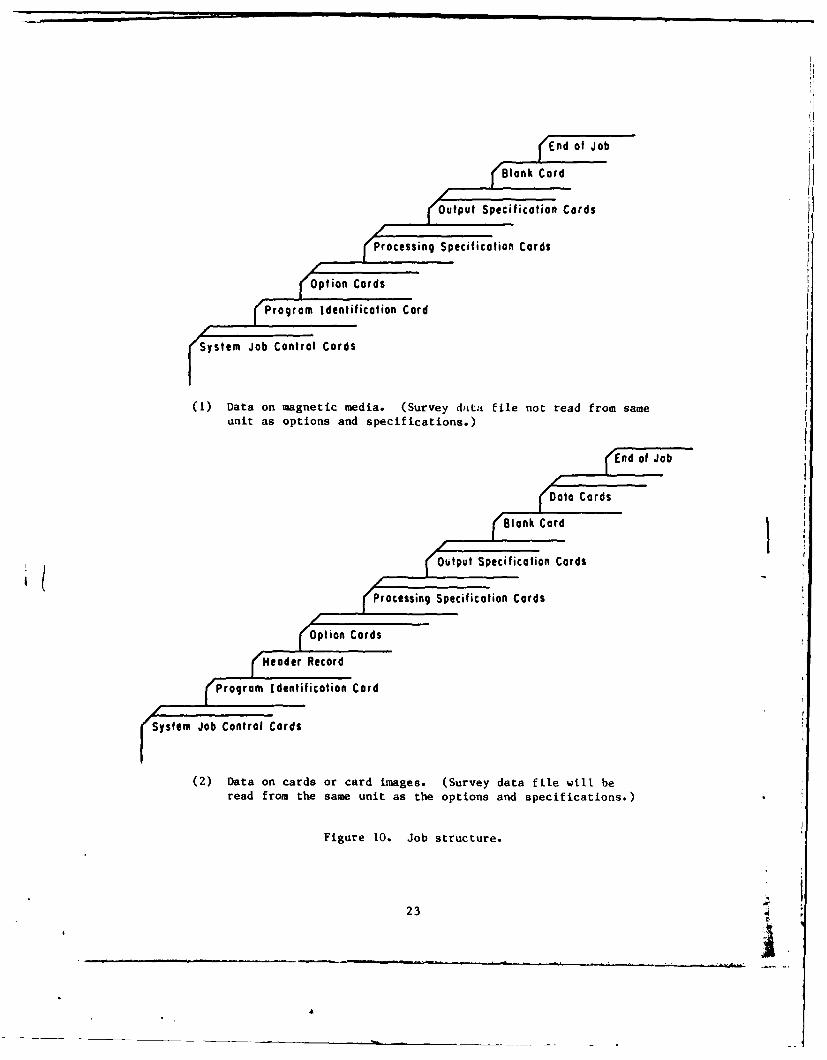
The job structure for each of the analysis modules is the same (Fig. 10).The only required system separators are those following the system job controlcards and signaling the end of the job. The Appendix contains record layoutsfor each of the option and output specification cards used by module SURVYI.If the option cards are absent, the module assigns default values. The outputspecification cards are required only to identify which outputs are desired;there is a default set of specifications for each SURVY1 output. The formatand defaults for the output specification cards are described in paragraph 5of this section. Note that the option and specification cards must be fol-lowed by a blank card to signal the end of the cards to be read.
The following contains formats for the records needed to run the module.It is recommended that data be right-justified; i.e., the rightmost characteror number always occupies the rightmost position in the field. This willensure that extra zeros are not added to the end of numeric entries when theyare read by the module.
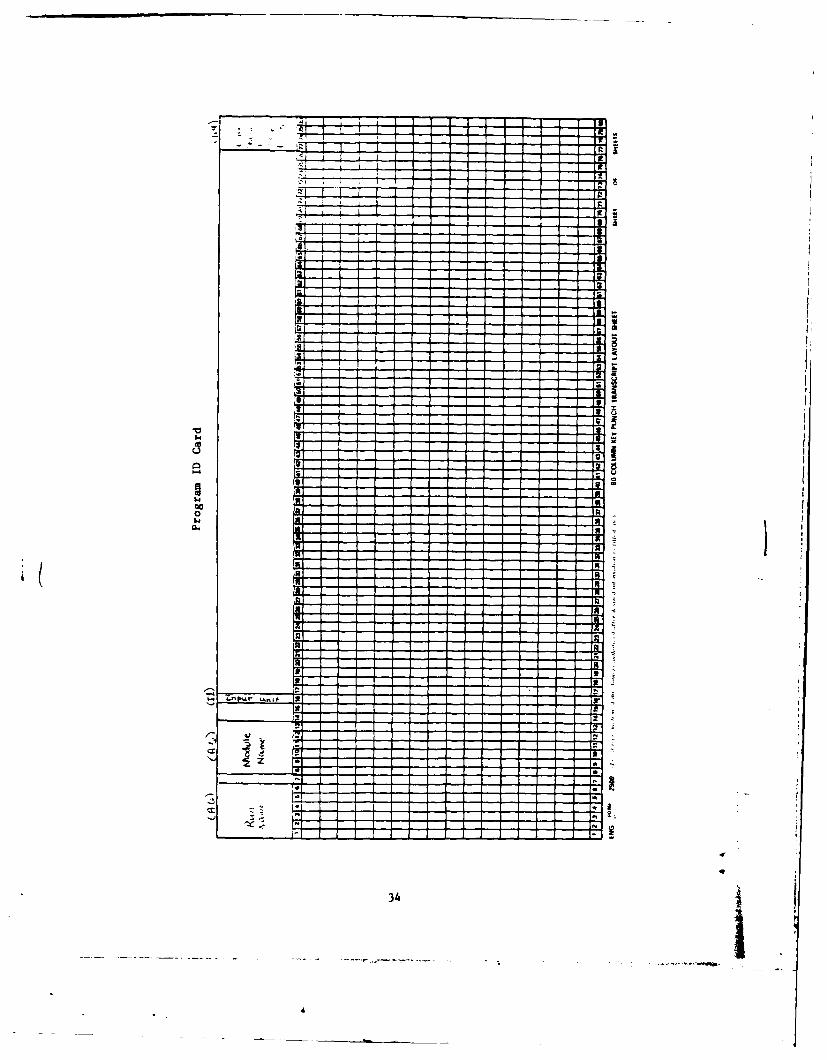
1. Program Identification Cards.
The program identification card (Table 4) is mandatory. It allows theuser to assign a name to each run, defines which analysis module is to beprocessed, and provides the option to halt execution after the table ofselected options and processing specifications has been printed.
It is recommended that a printout of selected options and specifications,with further execution suppressed, be the first run for each analysisattempted. To do this, prepare the job and submit it with NOGO in positions77 to 80 of the program identification card. The printed options (Fig. 3) andspecifications (Fig. 4) should be carefully examined to be sure they matchthose requested. When satisfied that the desired options, specifications, andselected outputs are correct, resubmit the job with positions 77 to 80 blank.
2. The Header Record.
The header record (Table 1) follows the program identification card whendata are read from cards or card images. If survey data are read in magneticmedia format, the header record is not a part of the deck setup. See SectionIV if more inforsation concerning the header record is desired.
22
E'nd of Job
SBlank Cord
(Output Specification Cards
uiaois ssing Specification Cords
Hption Cords
(Program Identification Cord
yste Jo ConrolCords
(1) Data on magnetic media. (Survey d at a file no w read from sameunit as options and specifications.)
FEnd of Job
'Data Cords
23o
r/Blank Cord 1output Specification Cords
i/.
Processing Specification Cords
opt ion Cords
/Header Record:
Prram Identification Cord
System Job Control Cords
(2) Data on cards or card images. (Survey data file will beread from the same unit as the options and specifications.)
Figure 10. Job structure.
23

Table 4. Program identification card.
Position Entry description Default FORTRANNo. value format
1-6 Run identification, usually initials of None A6individual submitting job.
8-13 Name of analysis module to be processed. None A6This entry is mandatory. Enter "SURVYI."
15-16 Unit from which survey data will be read. 7 (magnetic 12Enter a "5" in position 16 if data are media)to be read from cards or card images.
77-80 Enter "NOGO" to halt execution after Run will be A4printing of options and specifications, executedotherwise leave blank.
3. The Option Cards.
The option cards make it possible for the user to change some of thedata characteristics assumed by the programs. None of the option cards arerequired. Table 5 contains the values assigned when option cards are omitted.If any of the values are to be changed, only the option cards defining thevalue to be changed need be submitted and only the fields on the card per-taining to that value need be completed. A more detailed description of eachoption card follows.
Table 5. SURVY1 analysis options and their defaults.
Option card Option Default value
OPT CRD 1 Name of input horizontal datum Bench mark
Name of line surveyed Profile
OPT CRD 2 Format of time on outputs No time appears
OPT CRD 3 Abbreviation for new vertical datum Abbreviation is as readand required vertical correction from header record and
no correction is made
OPT CRD 4 Output horizontal datum Shoreline positionduring first survey ofeach profile line
OPT CR) 7 Description of the data, for use in As read from the headertitles record
OPT CR) 8 Linear units in which output is to As read from the headerappear record
Conversion factor to change input 1.0linear units to output linear units
OPT CRD 9 Minimum elevation from which extra- No extrapolation ispolation is considered valid (>0) performed
OPT CRD 10 Format in which the final data file As necessary to read datais to be read as formatted in Table 3
if input is on cards,otherwise as in Table 2
24
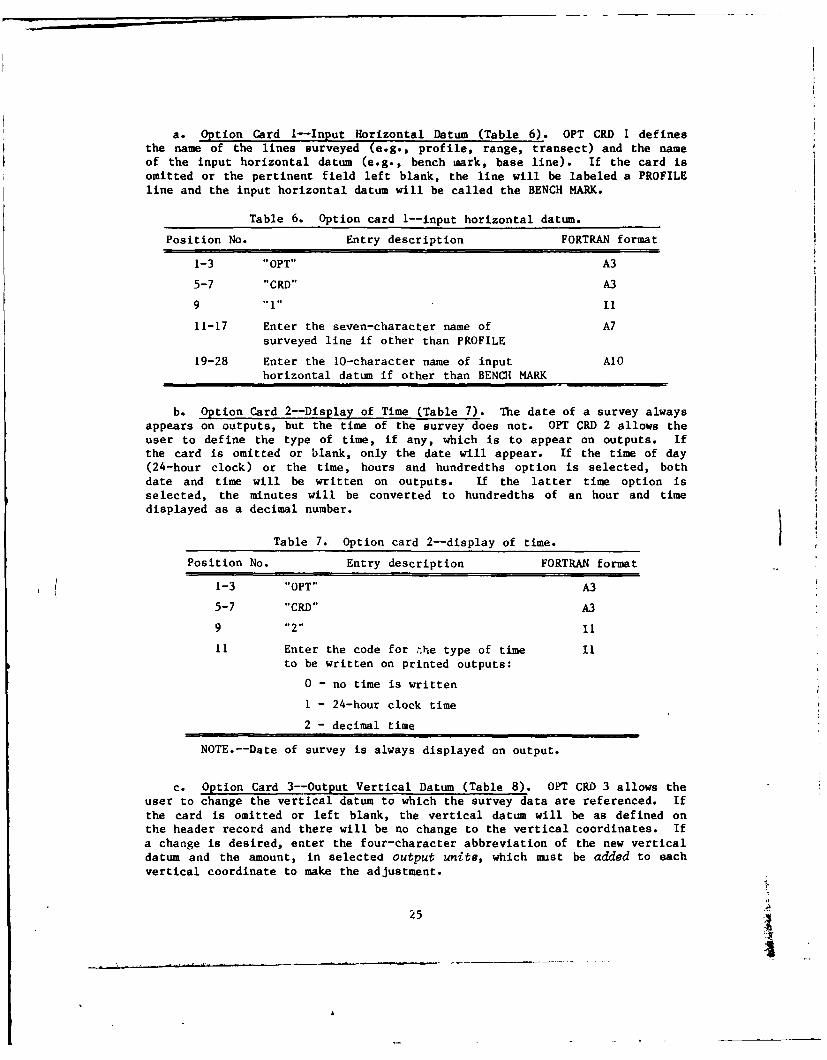
a. Option Card 1--Input Horizontal Datum (Table 6). OPT CRD I definesthe name of the lines surveyed (e.g., profile, range, transect) and the nameof the input horizontal datum (e.g., bench wark, base line). If the card isomitted or the pertinent field left blank, the line will be labeled a PROFILEline and the input horizontal datum will be called the BENCH MARK.
Table 6. Option card i--input horizontal datum.
Position No. Entry description FORTRAN format
1-3 "OPT" A3
5-7 "CRD" A3
9 ..1., 11
11-17 Enter the seven-character name of A7surveyed line if other than PROFILE
19-28 Enter the 10-character name of input A10horizontal datum if other than BENCH MARK
b. Option Card 2--Display of Time (Table 7). The date of a survey alwaysappears on outputs, but the time of the survey does not. OPT CRD 2 allows theuser to define the type of time, if any, which is to appear on outputs. Ifthe card is omitted or blank, only the date will appear. If the time of day(24 -hour clock) or the time, hours and hundredths option is selected, bothdate and time will be written on outputs. If the latter time option isselected, the minutes will be converted to hundredths of an hour and timedisplayed as a decimal number.
Table 7. Option card 2--display of time.
Position No. Entry description FORTRAN format
1-3 "OPT" A3
5-7 "CRD" A3
9 "2" II
11 Enter the code for the type of time 11
to be written on printed outputs:
0 - no time is written
I - 24-hour clock time
2 - decimal time
NOTE.--Date of survey is always displayed on output.
c. Option Card 3--Output Vertical Datum (Table 8). OPT CRD 3 allows theuser to change the vertical datum to which the survey data are referenced. Ifthe card is omitted or left blank, the vertical datum will be as defined onthe header record and there will be no change to the vertical coordinates. Ifa change is desired, enter the four-character abbreviation of the new verticaldatum and the amount, in selected output unite, which must be added to eachvertical coordinate to make the adjustment.
25

Table 8. Option card 3--output vertical datum.
Position No. Entry description FORTRAN format
1-3 "OPT" A3
5-7 "CRD" A3
9 "3" II
11-14 Enter the four-character abbrevia- A4tion for output vertical datum ifother than that on header record.
15-25 Enter the amount, in output units, FI0.3to be added to eact. verticalcoordinate.
d. Option Card 4--Output Horizontal Datum (Table 9). OPT CRD 4 allowsthe user to select the reference horizontal datum to which the output is tobe adjusted. If this card is omitted or left blank, the shoreline positionduring the first survey of each profile line is the output horizontal datum.The distance to the shoreline during the first survey at each profile iscomputed and this amount is subtracted from each distance coordinate. Other
choices f-'r the output horizontal datum are: (1) the shoreline position dur-
ing a survey other than the first, (2) the mean shoreline position, (3) the
input horizontal datum (i.e., bench mark--in this case the distance coordi-
nates are unaltered), and (4) a user-supplied correction. If the reference is
not user-supplied, use the OPT CRD 4, format I, shown in the Appendix; other-wise, use OPT CRD 4, format 2.
Table 9. Option card 4--output horizontal datum.
Position No. Entry description FORTRAN format
1-3 "OPT" A3
5-7 "CRD" A3
9 "4" 11
11-13 Enter the number of profile lines. Veed only &*en the 13output horiaontal datwn is to be ueer-supplied. If leftblank, the number of profile lines will be as defined onthe header record.' The program will expect to read anadjustment for the number of lines entered here.
15 (IXDTM) Enter the type of output horizontal datum selected: 11
I or blank - shoreline position during first or definedreference survey of each line.
3 - mean shoreline position.
4 - no adjustment to distance coordinates.
5 - user-supplied. Adjustments entered on SUP 4A cards.
16-19 (IXDTh - 1 only) Enter the reference survey number. If blank, program uses 14the first survey of each line, which may or may not be thesam for all profile lines. All profile lines not surveyedduring the selected reference are eliminated from processing.
16-38 (IXDTh - 5 only) Enter the first line of description of user-supplied 2AI0,A3horizontal datum.
39-67 (IXDTM - 5 only) Enter the second line of description of ua-r-supplied 2AIO,A9horizontal datum.
'The header record contains the largest and smallest profile line number. If there is not aprofile line associated with each number between, this field should nut be lelt bldnk.
26 5i

If the correction is supplied, the user must provide SUP 4A (Table 10)cards to define the amount, in output units, which is to be subtracted fromeach distance coordinate at each profile line. The SUP 4A cards must immedi-ately follow OPT CRD 4, be sequentially numbered, and cannot be included ifthe output horizontal datum adjustment is not user-supplied. While there neednot be an entry on the SUP 4A cards for every profile line in the data set,only those represented will be processed by SURVYI.
Table 10. Supplementary option cards 4A--distance to output horizontaldatum, user-supplied.
Position No. Entry description FORTRAN format
1-3 "SUP" A3
5-6 "4A" A2
7-9 Sequential card number 13
11-13 Profile line nuaber 13
14-23 Corresponding adjustment in output F10.3units, to be subtrated from
each distance coordinate
24-26 Profile line number 13
27-36 Corresponding adjustment F10.3
37-39 Profile line number 13
40-49 Corresponding adjustment F10.3
50-52 Profile line number 13
53-62 Corresponding adjustment F10.3
63-65 Profile line number 13
66-75 Corresponding adjustment F10.3
The output horizontal datum option has proven to be useful for plottingprofiles with horizontal datums well inland of the active beach, or forcomparing lines with datums at varying distances from the shoreline. Byadjusting the horizontal datum, profiles are effectively "lined up" at theshoreline, dune crest, or other selected reference distance. Care must betaken to ensure that the horizontal datum exists on the reference survey ofeach profile line. For example, under default conditions the reference surveyis the first survey of each profile line and the horizontal datum is thedistance to the zero elevation at the time of that survey. If this positionis not defined (i.e., the survey did not extend far enough seaward), theprofile line is eliminated from the data set and any output from thatparticular line is suppressed.
Care must also be taken to ensure that subsequent runs of the data filehave the same reference. When data are extracted from larger sets or new dataare added to existing sets, it is possible that the first survey of a linewill change; it is certain that the mean shoreline position will change.Under these circumstances, the user should record the distance to the hori-zontal datum for the original data se; and supply it on SUP 4A card duringsubsequent runs.
e. Option Card 7--Data Description (Table 1i). The description of thedata (e.g., locality or site name) contained on the header record will appearon each output. If the user wishes to change this description, OPT CRD 7 maybe used. If the card is omitte. or left blank, the data description will beas defined on the header record.
27 j

Table 11., Option card 7--data description.
Position No. Entry description FORTRAN format
1-3 "OPT" A3
5-7 "CRD" A3
9 "7" I1
11-41 Enter the 31-character data 3AI0,AIdescription which supersedes thedescription on the header record.
f. Option Card 8--Linear Output Units (Table 12). OPT CRD 8 is used todefine the linear output units. If the card is omitted or left blank, thelinear output units will be the same as the input. If output units are to bemeters or centimeters and the input is in feet, the conversion factor issupplied by the program; otherwise, the user must supply the requiredconversion factor. Each distance and elevation read from the input surveyfile will be multiplied by this factor.
Table 12. Option card 8--linear output units.
Position No. Entry description FORTRAN format
1-3 "OPT" A3
5-9 "CRD" A3
9 "8" II
11-12 Enter the abbreviation for linear output A2units of measurement. If blank, these Iwill be as defined on the header record.
13-22 Enter the conversion factor. Input units FI0.3are multiplied by this number to convert tooutput units. This field may be blank if:
(a) Input and output units are thesame (factor set to 1).
(b) Input units are FT, output unitsare M (factor set to 0.3048).
(c) Input units are FT, output unitsare CN (factor set to 30.48).
g. Option Card 9--Extrapolation to Zero Elevation (Table 13). Since theshoreline position is of major interest in the analysis of beach profile data,there may be cases when the user decides that extrapolating the distance tothe zero elevation is valid. In this case, OPT CRD 9 can be used to specifythe elevation, in output units relative to the output vertical datum, that thelast surveyed point must reach before the shoreline position can be extrapo-lated. If the card is omitted or left blank, no extrapolation occurs. Whenany computation is performed using data for which the shoreline positionwas extrapolated, output of the results of that computation is flagged. Noextrapolation will be performed for profiles where the last line segment isnot sloping seaward.
28

Table 13. Option card 9--extrapolation to zero elevation.
Positon No. Entry description FORTRAN format
1-3 "OPT" A3
5-7 "CRD" A3
9 9 " 1
11-20 Enter the maximum elevation above the out- FIO.3put vertical datum, in output units, whichthe last surveyed point must reach in orderthat the shoreline position be extrapolated.If this is blank or zero, the shorelineposition will not be extrapolated.
h. Option Card 10--Format of Input Data (Table 14). If the formatspecified for card image data (Table 3) or magnetic media data (Table 2) doesnot fit the format of the user's input data, an alternate format may bespecified using OPT CRD 10. Knowledge of FORTRAN format specifications isrequired to use this option effectively. All the data elements but thelocality code are used in the analysis computations. Thus, while this cardcan be used to change the field length, order, or format in which data ele-ments are read, all elements must be present. The expected order of thevariables is shown in Tables 2 and 3; the order in which the variables areread may be changed by using the FORTRAN tab or T format specification. The Tformat specification is described in most FORTRAN texts and reference manuals,e.g., Stuart (1970) 1.
Table 14. Option card 10--format of input data.
Position No. Entry description FORTRAN format
1-3 "OPT" A3
5-7 "CRD" A3
8-9 "10" 12
11-80 Enter the survey data format. If this card is 7A10blank or omitted, data will read as follows:
(a) Input unit is 5: (2X,13,14,1X,312,13,12,F5.0,I1X,8F5.0/(IOX,13F5.0)).
(b) Input unit is 7: (2X,13,14,312,I3,I2,I3,F5.0,7X,120F5.0).
4. Processing Specification Cards.
Some analysis modules allow the definition of special processing require-ments on processing specification cards. SURVYl does not require these cards;however, if cards prepared for processing other analysis modules are read,they will be ignored and will not affect processing.
'Stuart, F., FORTRAN Programming, John Wiley & Sons, Inc., 1970.
29

5. Output Specification Cards.
SURVYI will produce one tabular and three graphical displays: TABLEL,PLOTI, PLOT2, and PLOT3. These outputs are described in detail in SectionV. Any or all of the outputs may be produced during a single run. An outputand any required specifications for the output are selected by entering anoutput specification card. One, and only one, card must be entered for eachoutput selected.
a. Table Output. Table 15 describes the format of the output specifi-
cation card for TABLEI (Fig. 5). There are no specifications for the table.
Table 15. Format of TABLEI specification card.
Position Entry FORTRAN DefaultNo. description format value
1-5 "TABLE" A5 None
9 ..1. I1 None
b. Plot Output. Table 16 describes the format for the output specifi-cation cards for plot output (Figs. 6, 7, and 8) and defines the defaultswhich will be assigned if the card is not completed. A separate card must beprepared for each type of plot to be output. With the exception of the plotoutput unit, it is not necessary that each type of plot have the same specifi-cations when more than one type is output during a single run; format specifi-cations for each type of plot are read and processed separately.
(1) Output Unit for Plot Commands. The plot commands may be writteneither to unit 3 (normally signaling card output) or 8 (normally signalingoutput to magnetic tape). The user must ensure that data written to theseunits are handled properly in the job control stream.
(2) Default Plot Specification. If the defaults for values supplied
in positions 13 to 80 are acceptable and the selected output units of measure-ment are feet, positions 13 to 80 need not be completed. However, if any plotspecifications are to be supplied or output units are not feet, all fieldsmust be completed. (The unit onto which plot commands are to be written maybe changed without affecting other default specifications.)
(3) Lines Per Plot. Up to 10 profiles, or pairs of profiles, may bedrawn on a single plot.
(4) Offset. When more than one profile (or pairs of profiles) is
drawn on a single plot, the second and subsequent profiles may be offset.The offset will be added to vertical coordinates before additional lines are
plotted. The offset may be positive or negative; for plot types 1 and 2, itmay be zero. The profile line with the largest number is drawn first and theothers offset on plot types 2 and 3. On plot type 1, the profile with thesmallest survey number is drawn first.
30

Table 16. Plot specifications for SURVYI plot output.
Position Entry description FORTRAN DefaultNo. format value
1-4 "PLOT" A4 None
9 Plot type. Enter 1, 2, or 3 II None
11 Output unit for plot commands: 11 3
"3" - cards
"8" - magnetic tape
12 Use default specifications: II Yes
blank - yes (use only ifoutput units are feet)
"I" - no, remainder of cardwill be read
Horizontal axis:
13-20 origin F8.2 -600.00 (ft)
21-27 increment (units per inch F7.2 150.0 (ft/in)on plot)
28-31 length in inches F4.1 6.0 (in) IiVertical axis (distance):
33-40 origin F8.2 -10.0 (ft)
41-47 increment (units per inch F7.2 10.0 (ft/in)on plot)
48-51 length in inches F4.1 5.0 (in)
53-54 Lines per plot (maximum 10) 12 5
55-60 Offset F6.2 5.0 (ft)
62-67 Overlap: A6 No overlap
blanks - there will be nooverlap
"OVERLAP" - plots will be
overlapped
69 Factoring:
"0" - size of plot not altered II No factoring
"I" - size of plot altered
31,

(5) Overlap. For plot type 1, a new axis is automatically drawn whenall data collected at a single profile line have been processed. For plottypes 2 and 3, a new axis is drawn when all data collected during each surveyor pair of surveys have been processed. When the number of profiles drawn ona single plot (lines per plot) is greater than 1, the user may specify thatplots be overlapped. The last profile depicted on each plot will be the firstdrawn on the next until a change occurs in the profile line or survey number.The overlapped profile counts toward the number of lines per plot.
(6) Factoring. The factoring option is used to specify whether ornot the final plot size is to be altered before being output. The user has nocontrol over the factor used; this is determined by the length of the longeraxis. When plots are factored, the x-axis will be no longer than 5 inches andthe y-axis no longer than 6 inches. Plot size will be increased if both axesare shorter and decreased if either is longer.
(7) Defiaing Axis Length, Increment, and Origin. The maximum andminimum distance and elevation tabular outputs from program EDIT2 can be usedto define optimal axis length, origin, and increment. Allow an extra inch onboth the horizontal and vertical axes so that the plot legend will not inter-fere with the plotted data. When a large number of plots are to be produced,some test plots should be run and examined before the final production run issubmitted.
VII. SUMMARY
SURVYI produces one table and three graphical displays. The major func-tion of the module is to display profiles at a locality through time. Shore-line position is emphasized. The outputs have also proven to be useful infinding surveying or data reduction errors which have not been correctedduring the preliminary edit. The outputs have been designed so that they canbe used in reports without being redrafted.
32

APPENDIX
SURVY1 RECORD LAYOUTS FOR OPTION AND OUTPUT SPECIFICATION CARDS
33
_ ___ _ i
al I I
VJil'AS
34.

I 1 2
EI
it I i 11 1
[1
., II I
-4 ,S .
- Ia
35 - i1 -1 -* ]I-. i ' I'

I T
RIt
VI
36Z1
.4

iis
ro
0J
37 1; X

I-T
0 J
0-4 (B -4
qju
t- Q
38

37 I
its
.1 t"-
J1
_ to
39

I..
~JJJ
06 -AL
=2 11
4I V

If
I A
41 - - ii

Ia
it
10
03 tia0
0.
424

'II
'L z
44

II
-4 1
U I
04

li I I
UA
1z
3112I I W
=1 Is
V
0-J
E-45 91 1 LiA

.4E *q
p~ --
U a
-- 4
-4.
14
r In
ol I I
046

00 2- t 00
- - 44) 0C 4-1 -- C" '. w 0 .
4'A 0 0040- 00 -4 30
0
200 0 0r
4 i Z) 0. 0 = 03 1016 004 w4 0 0- 34 340 4 .
404'4 - 0 00 0 0-- -3 M>) 0 00.000 00 0)4 .404.. 0.0. r 0 440 404 *7
1 03043. 0~04 00 .0)40. 0 4 000 > 44-.040
0.4.04 m 0)4.00H.')0 > 0) .. 0 02 -0) 0030 0
.~41-0 .4 W > -7 0 .44
0. 0 o 00340 V0 - 3 0 - 0--
m -0 .03.304340.0 m.. 0 0-)44304t40.
0 *3- WW . (3- 4 44 00 *3- 'a, 3). 0 .
00043 )...).00.044 0 4 0044 -. 0 00 4-30 40 >0 110040) 00N0...4.) >0 I 004 ON0...ow
0 -. '=> 2 3 00 '400
m4'4 0 0 0 0
0440r 030 .0 * 04 04 00 .w. 4 u >0 0 '0 4 0 .0 0 0.0 4 0F , 4- E.0'>0 4 )0. 34 0.0'0 44 '
04C.. -0 W"- 0 440.3.4404.- 43 40..
> 00 u. 0 00 uI0 0m .0 0. 0 0
Z.40 >4 0.A" 0 U4 I.4.0 I. 0. *: Q 4a,2 .u-.V V 0 00 W-4000440 - =4, 0 0 . 400
34002~ 0 0 4 0r) 0w O O iO m 2~ ~ O
0.4~~~ 6- 4 0 4 4) .04- .. m W, 44 .o 4- Owe- 34m 0 444 . 0-
> 0oo 7 o, 0 .c) 00 '000 7 03 4 10 00 0 > 00 0 )0 '4)3 0 0 00 0) 0 C~
C04 4 4, 0 4 0 4 0- . 00 v0 I
U 0) 0 434000 x) 0 Q 43'44 u.0iv . W0 .. m0 2F0440m
... 4,000~~ -4 C6.. 0 2 . ) 4.. 0
0.0W4 L)0 v4 a 0 .0 a 00 00 d 0.- 09700) 1.- -W .03 owl .. 70 00.' - H

1ATE
Lm Ect