hypothesis testing sample means. hypothesis testing for sample means the goal of a hypothesis test...
TRANSCRIPT
Hypothesis Hypothesis TestingTesting
Sample MeansSample Means
Hypothesis Testing for Sample Hypothesis Testing for Sample MeansMeans
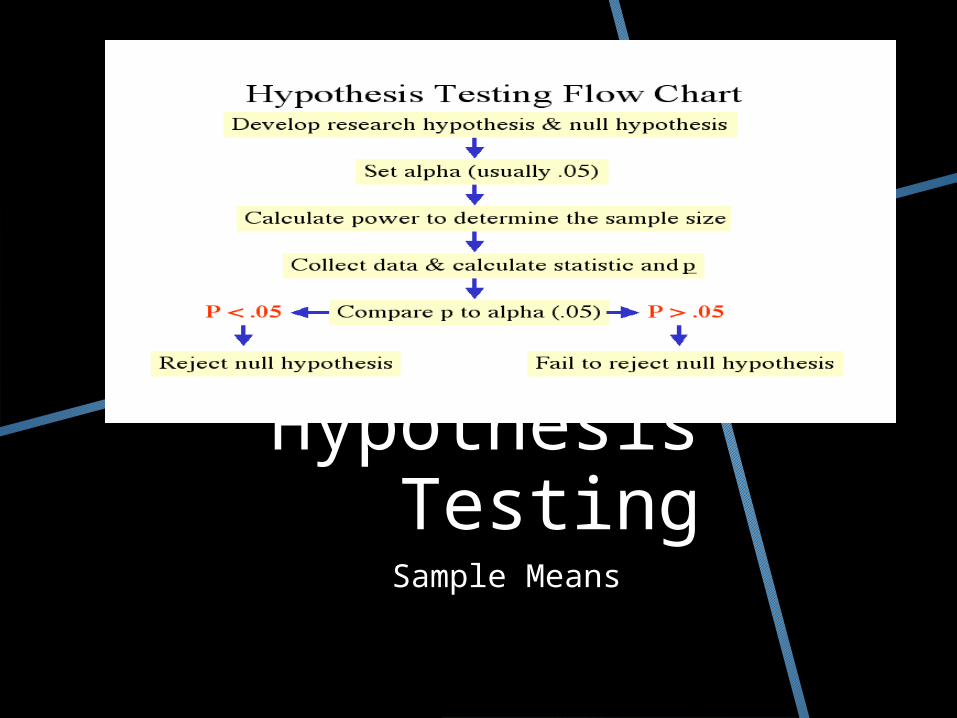
The goal of a hypothesis test is to make inferences The goal of a hypothesis test is to make inferences regarding unknown population parameter values regarding unknown population parameter values based on sample databased on sample data
Elements of a hypothesis test:Elements of a hypothesis test:Null hypothesis - Null hypothesis - Statement regarding the value of the Statement regarding the value of the unknown parameter. This hypothesis states that there is unknown parameter. This hypothesis states that there is NO RELATION between the explanatory and responsive NO RELATION between the explanatory and responsive variables. In symbolic form, these are ALWAYS EQUALITIES variables. In symbolic form, these are ALWAYS EQUALITIES (has an equal sign (=))(has an equal sign (=))
Alternative hypothesisAlternative hypothesis – This contradicts the above – This contradicts the above hypothesis and implies the variables ARE related. In hypothesis and implies the variables ARE related. In symbolic form, these are ALWAYS INEQUALITIES (has either symbolic form, these are ALWAYS INEQUALITIES (has either < or > )< or > )
Test statistic – Test statistic – Numerical value based on sample data Numerical value based on sample data that determines whether or not the null hypothesis is that determines whether or not the null hypothesis is rejected.rejected.
Rejection region -Rejection region - Values of the test statistic in which the Values of the test statistic in which the null hypothesis is rejected.null hypothesis is rejected.
Elements of a Hypothesis TestElements of a Hypothesis Test
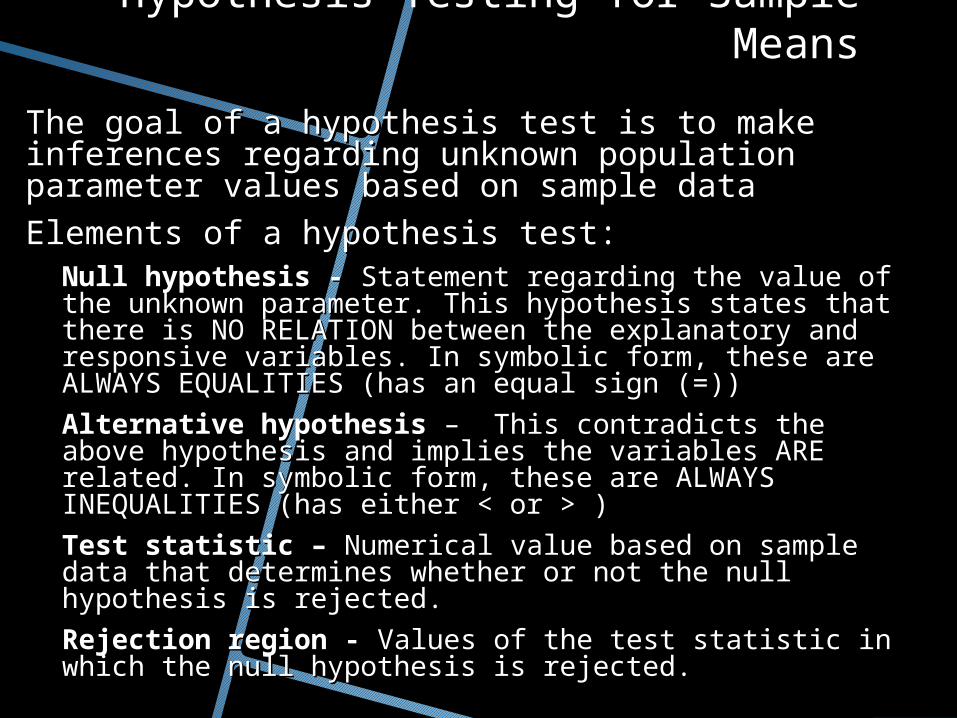
Test Statistic - Test Statistic - Difference between the Difference between the Sample Sample meansmeans, scaled to number of standard deviations from , scaled to number of standard deviations from the null difference of 0 for the the null difference of 0 for the Population meansPopulation means
n
xz
/
ns
xt
/
Used when the population standard deviation is known
Used when the population standard deviation is unknown
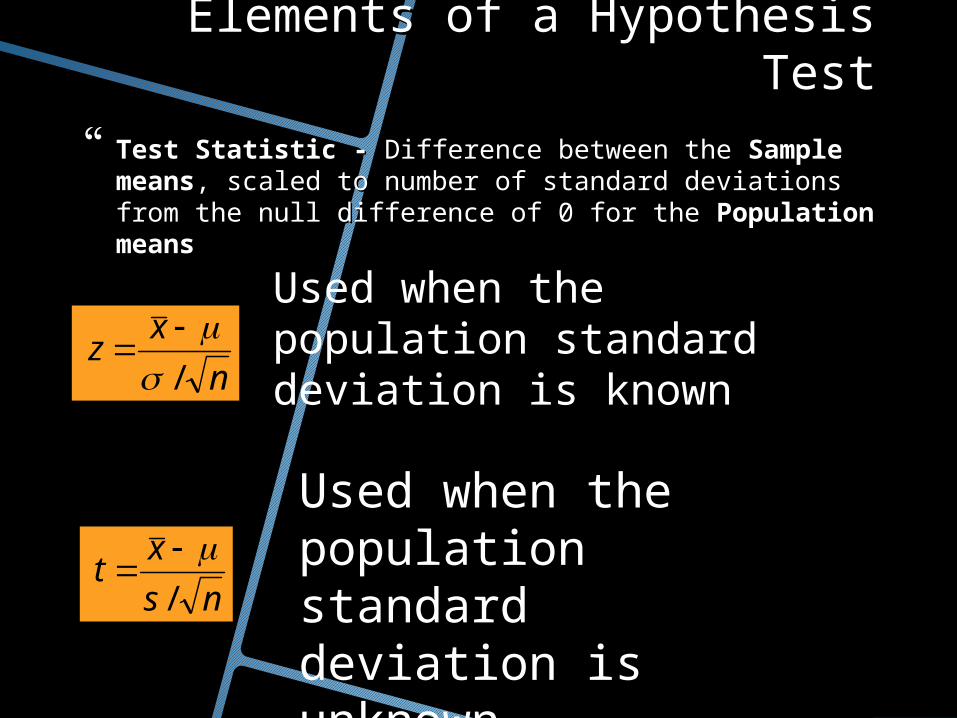
Rejection RegionsRejection Regions
For example, an alpha value of .05 in a two-sample z-test translates to a critical value of 1.96 and thus the critical values are ± 1.96. So if either z > 1.96 or z < -1.96 the null hypothesis is rejected. For t tests, the critical values can be found by using your calculators.1. Press [CATALOG] [F3] [9] [ENTER] for TIStat.inv_t.2. Enter the area of the left-hand tail or 1 minus the area of the right-hand tail3. Press the comma and enter the degrees of freedom.4. Press [)] [ENTER].
PP-value (aka Observed Significance -value (aka Observed Significance Level)Level)
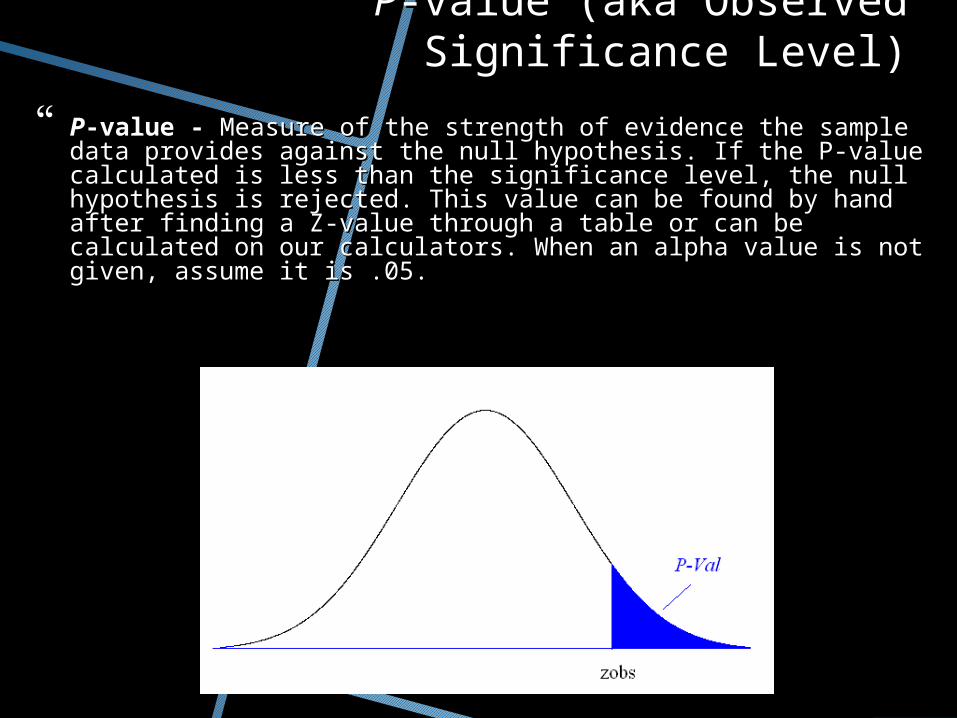
PP-value - -value - Measure of the strength of evidence the sample data Measure of the strength of evidence the sample data provides against the null hypothesis. If the P-value calculated is provides against the null hypothesis. If the P-value calculated is less than the significance level, the null hypothesis is rejected. less than the significance level, the null hypothesis is rejected. This value can be found by hand after finding a Z-value through This value can be found by hand after finding a Z-value through a table or can be calculated on our calculators. When an alpha a table or can be calculated on our calculators. When an alpha value is not given, assume it is .05.value is not given, assume it is .05.
)( zZPp

Key Words for Differentiating Between Z-Tests and T-Key Words for Differentiating Between Z-Tests and T-TestsTests
When working through problems relating to hypothesis testing, the first task will always be to read the short paragraphs for the statistics.
However, not only do you have to read for numbers but you must also look out for key adjectives or phrases that tell you whether or not the standard deviation of a population is known.
Usually this is easy to determine. If the words “known” and “population” are no where to be found, most likely you will be conducting a t-test. If you find them together, you are most likely conducting a z-test. It is not always so obvious though.
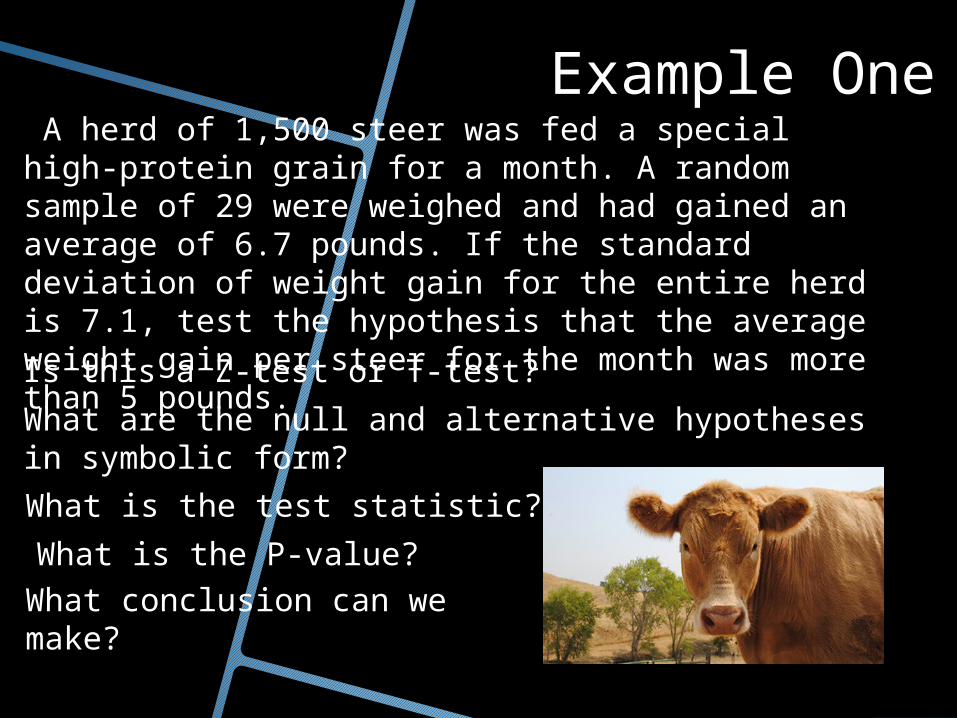
Example OneExample One A herd of 1,500 steer was fed a special high‐protein grain for a month. A random sample of 29 were weighed and had gained an average of 6.7 pounds. If the standard deviation of weight gain for the entire herd is 7.1, test the hypothesis that the average weight gain per steer for the month was more than 5 pounds.Is this a Z-test or T-test?
What are the null and alternative hypotheses in symbolic form?
What is the test statistic?
What is the P-value?What conclusion can we make?
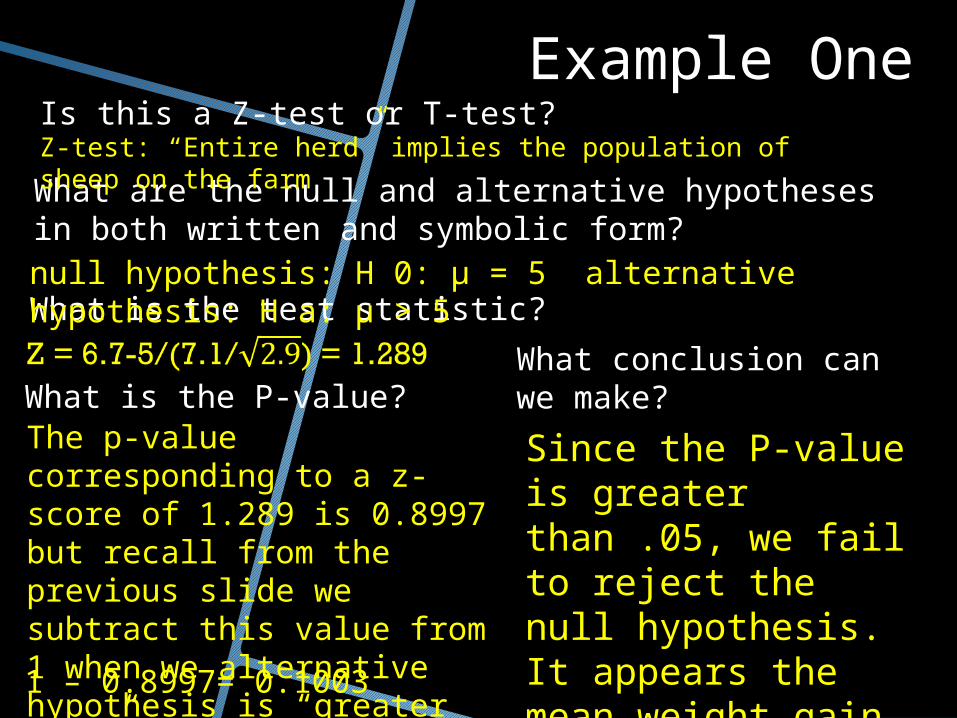
Example OneExample OneIs this a Z-test or T-test?
What are the null and alternative hypotheses in both written and symbolic form?
What is the test statistic?
What is the P-value?What conclusion can we make?
Z-test: “Entire herd” implies the population of sheep on the farm
null hypothesis: H 0: = 5μ alternative hypothesis: H a: > 5μ
1 – 0.8997= 0.1003
The p-value corresponding to a z-score of 1.289 is 0.8997 but recall from the previous slide we subtract this value from 1 when we alternative hypothesis is “greater than”.
Since the P-value is greater than .05, we fail to reject the null hypothesis. It appears the mean weight gain is 5 pounds.

Example TwoExample TwoA professor wants to know if her introductory statistics class has a good grasp of basic math. Six students are chosen at random from the class and given a math proficiency test. The professor wants the class to be able to score above 70 on the test. The six students get scores of 62, 92, 75, 68, 83, and 95. Test the claim that the mean is above 70 at the .10 significance level.Is this a Z-test or T-test?
What are the null and alternative hypotheses in symbolic form?
What is the test statistic?
What conclusion can we make?
What is the P-value?
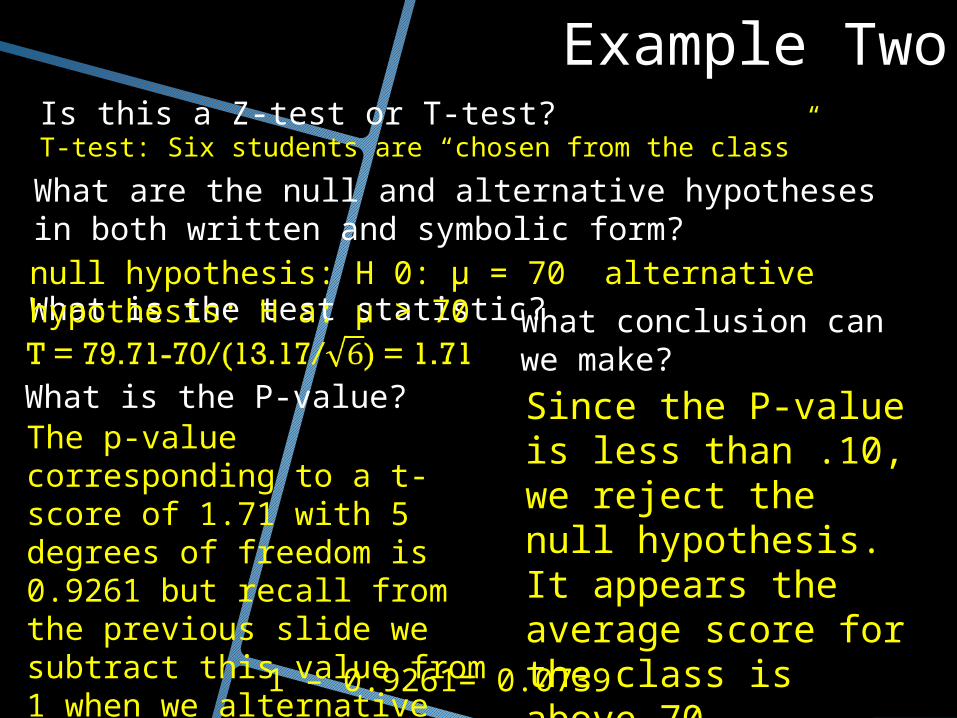
Example TwoExample TwoIs this a Z-test or T-test?
What are the null and alternative hypotheses in both written and symbolic form?
What is the test statistic?
What is the P-value?
What conclusion can we make?
T-test: Six students are “chosen from the class”
null hypothesis: H 0: = μ 70 alternative hypothesis: H a: > μ 70
The p-value corresponding to a t-score of 1.71 with 5 degrees of freedom is 0.9261 but recall from the previous slide we subtract this value from 1 when we alternative hypothesis is “greater than”.
Since the P-value is less than .10, we reject the null hypothesis. It appears the average score for the class is above 70.
1 – 0.9261= 0.0739