hyperpolarization-activated cyclic nucleotide-gated gene
TRANSCRIPT
© Translational Cancer Research. All rights reserved. Transl Cancer Res 2017;6(4):698-708 tcr.amegroups.com
Introduction
Cancer is the leading cause of death all over the globe in recent decades. According to WHO, there were 8.2 million people who died from cancer in the year 2012, and in the next two decades this figure will grow to around 22 million (1). Until now, only 30% of cancers could be prevented (1). Commonly, cancer patients would undergo surgery synergistically with chemotherapy and/or radiotherapy,
which is painful, and has high mortality rate. According to the U.S. National Cancer Institute, around 200 cancer drugs are commercialized in the market. Nevertheless, researchers in cancer field are still looking to develop new anti-cancer drugs with more specificity and high efficiency (2).
Hyperpolarization-activated cyclic nucleotide-gated (HCN) channel is one of hundreds of intra-membrane ion channels involved in ion transport. HCN channels are
Original Article
Hyperpolarization-activated cyclic nucleotide-gated gene signatures and poor clinical outcome of cancer patient
Nam Nhut Phan1, Tung Thanh Huynh1,2, Yen-Chang Lin1
1Graduate Institute of Biotechnology, Chinese Culture University, Taipei, Taiwan; 2NTT Institute of Hi-Technology, Nguyen Tat Thanh University,
Ho Chi Minh City, Vietnam
Contributions: (I) Conception and design: NN Phan, TT Huynh; (II) Administrative support: None; (III) Provision of study materials or patients: All
authors; (IV) Collection and assembly of data: NN Phan; (V) Data analysis and interpretation: All authors; (VI) Manuscript writing: All authors; (VII)
Final approval of manuscript: All authors.
Correspondence to: Dr. Yen-Chang Lin, PhD. Graduate Institute of Biotechnology, Chinese Culture University, Taipei, Taiwan. Email: [email protected];
Background: We investigated the mRNA expression of hyperpolarization-activated cyclic nucleotide-gated genes (HCN1-4) in multiple types and subtypes of cancers. Methods: We performed a meta-analysis of public microarray data from Oncomine and NextBio Research databases to discover the mRNA expression level of HCN1-4 in cancers. Survival analysis was also used to investigate the correlation between overexpression of HCN gene family with overall survival rate of cancer patients using Kaplan-Meier Plotter database and PROGgene V2 database. Results: HCN genes (HCN1-4) over-expression and under-expression in multiples types of cancers such as CNS and brain cancer, breast cancer, colorectal cancer, melanoma, and lymphoma were found. HCN1 was significantly correlated with low overall survival of breast cancer [hazard ratio (HR) =7.42, P=0.0019] and colorectal cancer (HR =1.66, P=0.0071) patients. The lower survival rates of lung cancer (HR =2.5, P=0.0107), kidney cancer (HR =1.1, P=0.004) and gastric cancer (HR =1.33, P=0.0037) patients were significantly correlated with the expression of HCN2. HCN3 was significantly correlated to lower survival rates of breast cancer (HR =1.65, P=0.0016), and kidney cancer (HR =1.17, P=0.0049). HCN4 was highly correlated with the lower survival rates of breast cancer of gastric cancer (HR =1.25, P=0.022), lung cancer (HR =5.37, P=0.0433) and ovarian cancer (HR =13.58, P=0.0426).Conclusions: These data suggested that HCN genes (HCN1-4) are likely to be potential candidates for cancer diagnosis and prognosis.
Keywords: Hyperpolarization-activated cyclic nucleotide-gated channel (HCN channel); cancers; Oncomine;
overall survival; diagnosis; prognosis
Submitted Mar 30, 2017. Accepted for publication Jul 10, 2017.
doi: 10.21037/tcr.2017.07.22
View this article at: http://dx.doi.org/10.21037/tcr.2017.07.22
708
699Translational Cancer Research, Vol 6, No 4 August 2017
© Translational Cancer Research. All rights reserved. Transl Cancer Res 2017;6(4):698-708 tcr.amegroups.com
encoded by four genes, namely HCN1, HCN2, HCN3 and HCN4 (3). These four genes are predominantly localized and expressed in the heart and the central nervous system (3,4). HCN channels are activated by hyperpolarization, and which permit Na+ and K+ to flow inward to the cell (5). HCN channels’ main physiological functions are in the heart (6) and the nervous system (4). HCN genes were found to play a role in arrhythmogenic disease and neurological disease (7). The pharmacological properties of these ion channels in cancer are relatively unknown.
Oncomine is a web-based database, which contains more than 700 independent datasets with an estimated 90,000 microarray trials (8,9). The use of Oncomine in several publications confirmed it is a reliable source of clinical datasets (10-16). Oncomine standardizes and organizes the datasets of public cancer microarray data into different cancer types and subtypes (8,9).
NextBio Research database (Illumina INC.) is a web-based platform containing microarray data of more than 20,000 published studies. This online database was introduced by Giovanni Coppola in his book in 2013 (17) and has been used in previous studies (18,19).
In this study, data mining of Oncomine and NextBio Research database was performed to conduct a meta-analysis of HCN gene expression across multiple types and subtypes of cancer. In addition, analysis of survival rate of cancer patients and HCN gene expression was conducted to investigate how these expressions affect the overall survival of cancer patients in the 3 and 5 years’ period.
Methods
Data mining
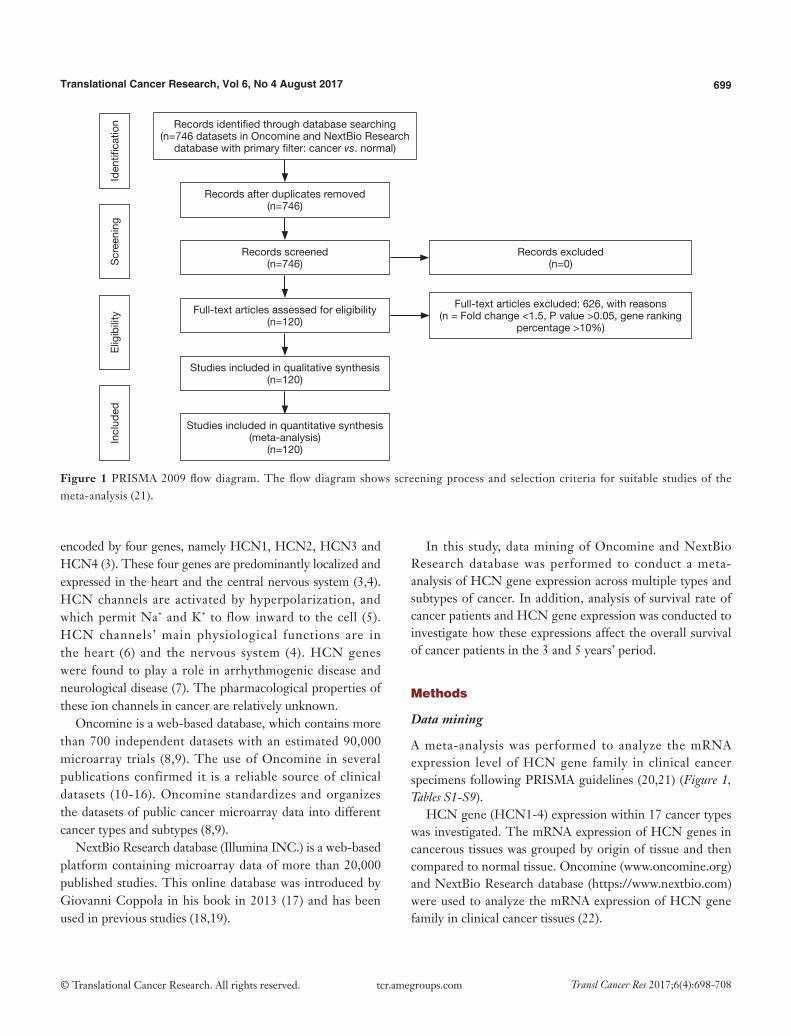
A meta-analysis was performed to analyze the mRNA expression level of HCN gene family in clinical cancer specimens following PRISMA guidelines (20,21) (Figure 1, Tables S1-S9).
HCN gene (HCN1-4) expression within 17 cancer types was investigated. The mRNA expression of HCN genes in cancerous tissues was grouped by origin of tissue and then compared to normal tissue. Oncomine (www.oncomine.org) and NextBio Research database (https://www.nextbio.com) were used to analyze the mRNA expression of HCN gene family in clinical cancer tissues (22).
Records identified through database searching(n=746 datasets in Oncomine and NextBio Research
database with primary filter: cancer vs. normal)
Records after duplicates removed(n=746)
Records screened(n=746)
Full-text articles assessed for eligibility(n=120)
Studies included in qualitative synthesis(n=120)
Studies included in quantitative synthesis (meta-analysis)
(n=120)
Records excluded(n=0)
Full-text articles excluded: 626, with reasons(n = Fold change <1.5, P value >0.05, gene ranking
percentage >10%)
Iden
tific
atio
nE
ligib
ility
Scr
eeni
ngIn
clud
ed
Figure 1 PRISMA 2009 flow diagram. The flow diagram shows screening process and selection criteria for suitable studies of the meta-analysis (21).
700 Phan et al. HCN channels and cancer
© Translational Cancer Research. All rights reserved. Transl Cancer Res 2017;6(4):698-708 tcr.amegroups.com
Database search strategy
In this study, the cancer vs. normal filter was chosen, which only displayed datasets examining HCN gene mRNA expression in the same origin of tissue. In order to be included in the study, all the data from Oncomine and NextBio research database must satisfy the following threshold: P<0.05, a fold change >1.5 and a gene rank percentile <10% (only applicable to data from Oncomine) (9) (Figure 1). Statistical analyses were conducted with Oncomine and NextBio Research default algorithms such as P values, two-tailed Student’s t-test, and multiple testing corrections. In total, there were 120 studies with 8,471 samples included in this study. All the searches were performed from December 2015 to December 2016.
Survival analysis
The correlation between HCN gene family and overall survival rate was analyzed using Kaplan-Meier plotter (http://kmplot.com/) (23) and PROGgeneV2 (24). Two groups of patients were used for the comparison on survival rates with high and low expression levels of HCN1, HCN2, HCN3 and HCN4 gene.
All the searches were performed from December 2015 to December 2016.
Results
Expression of HCN1 in multiple types and subtypes of cancer
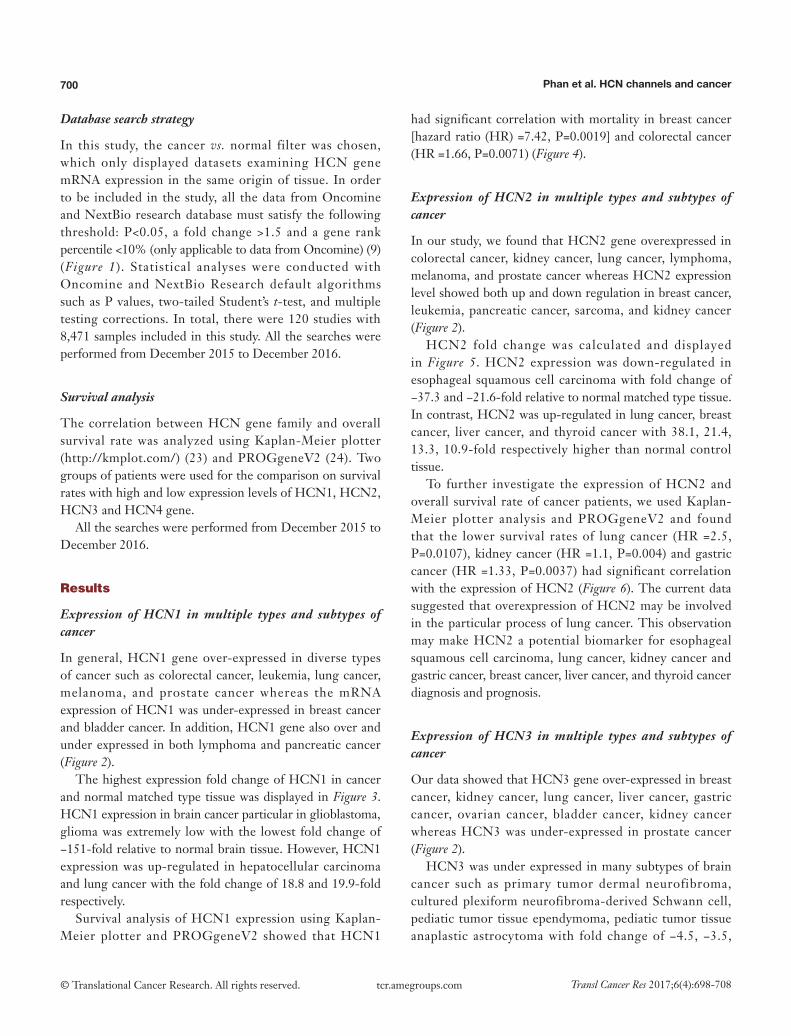
In general, HCN1 gene over-expressed in diverse types of cancer such as colorectal cancer, leukemia, lung cancer, melanoma, and prostate cancer whereas the mRNA expression of HCN1 was under-expressed in breast cancer and bladder cancer. In addition, HCN1 gene also over and under expressed in both lymphoma and pancreatic cancer (Figure 2).
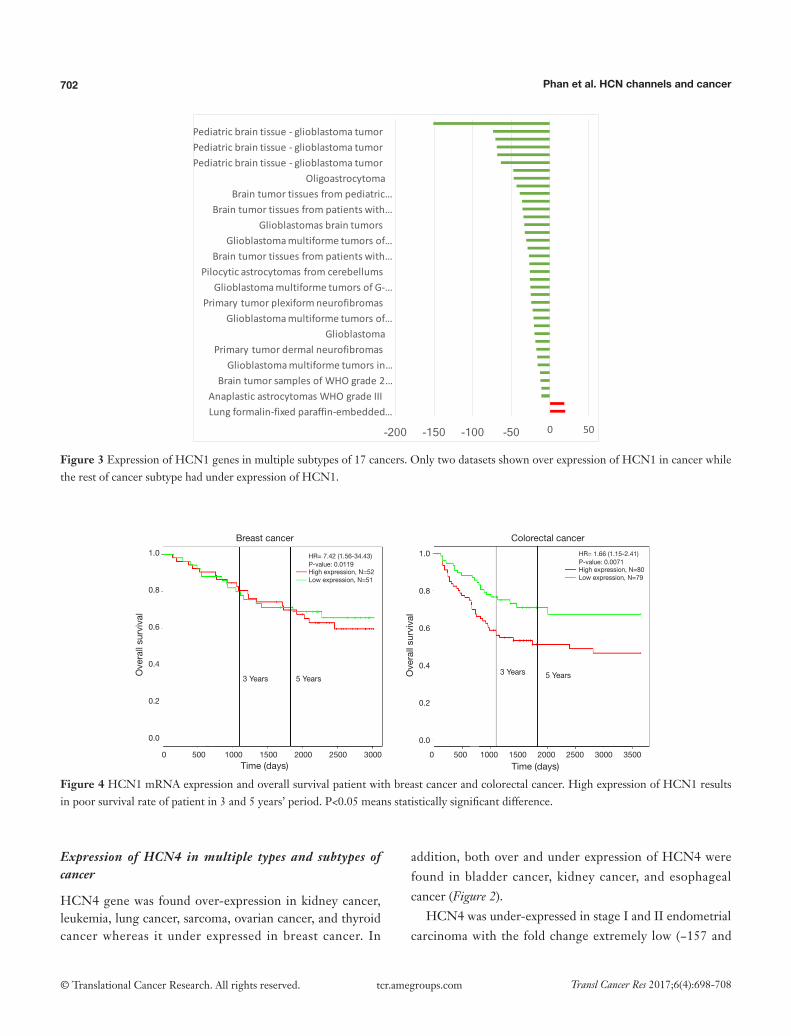
The highest expression fold change of HCN1 in cancer and normal matched type tissue was displayed in Figure 3. HCN1 expression in brain cancer particular in glioblastoma, glioma was extremely low with the lowest fold change of −151-fold relative to normal brain tissue. However, HCN1 expression was up-regulated in hepatocellular carcinoma and lung cancer with the fold change of 18.8 and 19.9-fold respectively.
Survival analysis of HCN1 expression using Kaplan-Meier plotter and PROGgeneV2 showed that HCN1
had significant correlation with mortality in breast cancer [hazard ratio (HR) =7.42, P=0.0019] and colorectal cancer (HR =1.66, P=0.0071) (Figure 4).
Expression of HCN2 in multiple types and subtypes of cancer
In our study, we found that HCN2 gene overexpressed in colorectal cancer, kidney cancer, lung cancer, lymphoma, melanoma, and prostate cancer whereas HCN2 expression level showed both up and down regulation in breast cancer, leukemia, pancreatic cancer, sarcoma, and kidney cancer (Figure 2).
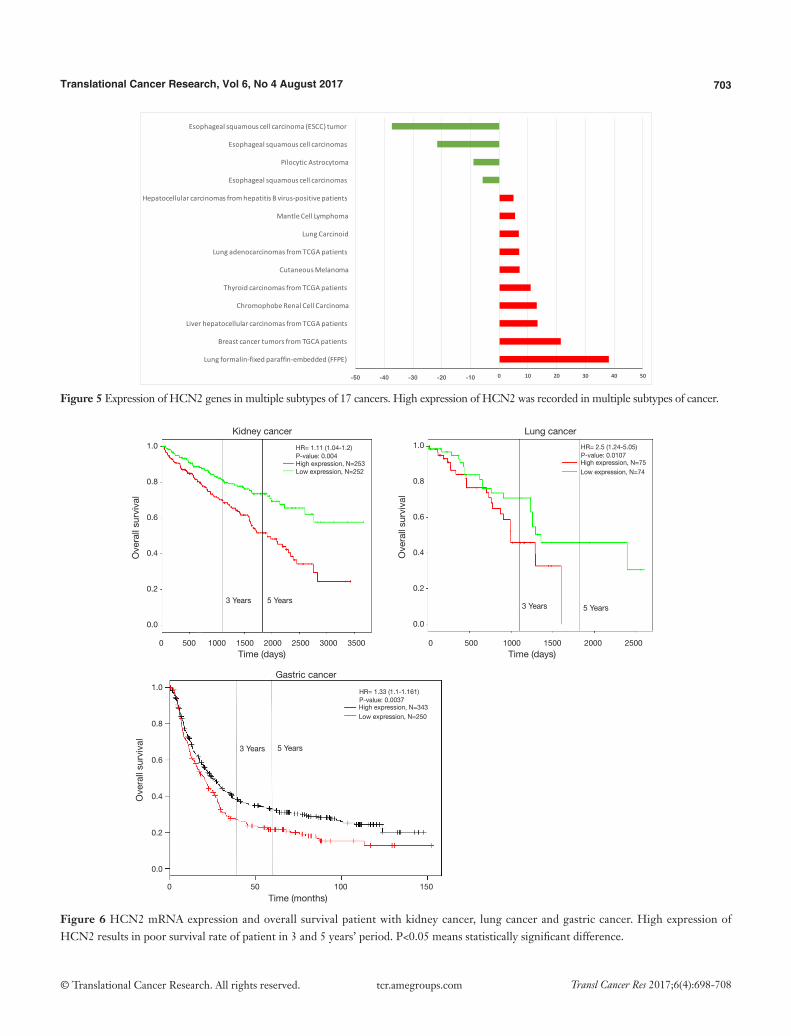
HCN2 fold change was calculated and displayed in Figure 5. HCN2 expression was down-regulated in esophageal squamous cell carcinoma with fold change of −37.3 and −21.6-fold relative to normal matched type tissue. In contrast, HCN2 was up-regulated in lung cancer, breast cancer, liver cancer, and thyroid cancer with 38.1, 21.4, 13.3, 10.9-fold respectively higher than normal control tissue.
To further investigate the expression of HCN2 and overall survival rate of cancer patients, we used Kaplan-Meier plotter analysis and PROGgeneV2 and found that the lower survival rates of lung cancer (HR =2.5, P=0.0107), kidney cancer (HR =1.1, P=0.004) and gastric cancer (HR =1.33, P=0.0037) had significant correlation with the expression of HCN2 (Figure 6). The current data suggested that overexpression of HCN2 may be involved in the particular process of lung cancer. This observation may make HCN2 a potential biomarker for esophageal squamous cell carcinoma, lung cancer, kidney cancer and gastric cancer, breast cancer, liver cancer, and thyroid cancer diagnosis and prognosis.
Expression of HCN3 in multiple types and subtypes of cancer
Our data showed that HCN3 gene over-expressed in breast cancer, kidney cancer, lung cancer, liver cancer, gastric cancer, ovarian cancer, bladder cancer, kidney cancer whereas HCN3 was under-expressed in prostate cancer (Figure 2).
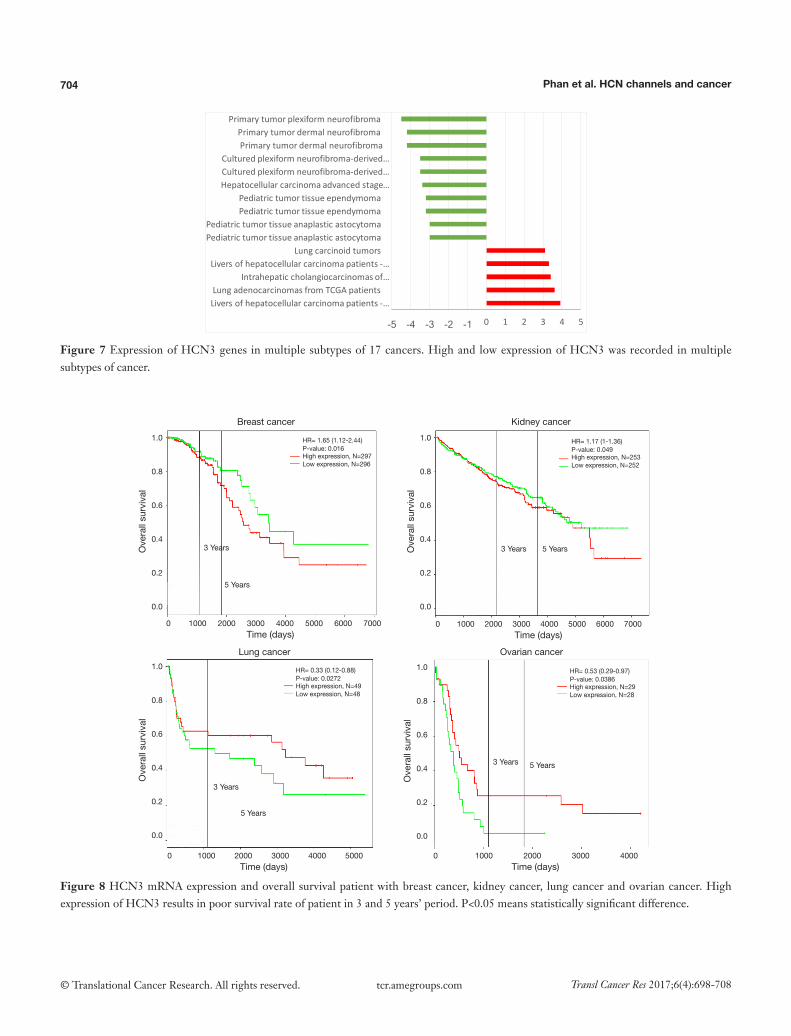
HCN3 was under expressed in many subtypes of brain cancer such as primary tumor dermal neurofibroma, cultured plexiform neurofibroma-derived Schwann cell, pediatic tumor tissue ependymoma, pediatic tumor tissue anaplastic astrocytoma with fold change of −4.5, −3.5,
701Translational Cancer Research, Vol 6, No 4 August 2017
© Translational Cancer Research. All rights reserved. Transl Cancer Res 2017;6(4):698-708 tcr.amegroups.com
−3.2, −3-fold respectively compared to normal matched type tissue (Figure 7). In contrast, HCN3 over-expressed in liver and lung cancer tissue with fold change of 3.9 and 3.6 respectively, relatively to normal matched type sample (Figure 7).
In addition, Kaplan-Meier plotter and PROGgeneV2 analysis showed overexpression of HCN3 in breast cancer was significantly correlated with lower survival rates
and poor prognosis value of breast cancer (HR =1.65, P=0.0016), kidney cancer (HR =1.17, P=0.0049) but higher survival rate and good prognosis value in lung cancer (HR =0.33, P=0.0272) and ovarian cancer (HR =0.53, P=0.0386) patients (Figure 8). This result may indicate HCN3 as a potential biomarker for diagnosis and prognosis of brain cancer, breast cancer, kidney cancer, lung cancer and ovarian cancer.
Figure 2 Expression of hyperpolarization-activated cyclic nucleotide-gated genes in multiple types of cancer. Expression of HCN genes in 17 types of cancers compared to normal matched type tissue controls. The color correlates with over and under expression of genes in specific cancer. Red color represents for over expression and blue color represents for under expression. The search criteria threshold was set at P<0.05 with fold change >1.5 and gene rank percentile <10% for screening microarray datasets of cancer versus normal cases. HCN, hyperpolarization-activated cyclic nucleotide-gated.
Genes
Cancer types
Breast cancer
Colorectal cancer
Kidney cancer
Lung cancer
Lymphoma
Melanoma
Pancreatic cancer
Postate cancer
Sarcoma
Liver
Gastric
Ovarian
Bladder
Kidney
Esophageal
Thyroid
Leukemia
HCN1 HCN2 HCN3 HCN4
702 Phan et al. HCN channels and cancer
© Translational Cancer Research. All rights reserved. Transl Cancer Res 2017;6(4):698-708 tcr.amegroups.com
Figure 3 Expression of HCN1 genes in multiple subtypes of 17 cancers. Only two datasets shown over expression of HCN1 in cancer while the rest of cancer subtype had under expression of HCN1.
Ove
rall
surv
ival
Ove
rall
surv
ival
Time (days) Time (days)
Breast cancer Colorectal cancer
High expression, N=52Low expression, N=51
High expression, N=80Low expression, N=79
HR= 7.42 (1.56-34.43)P-value: 0.0119
HR= 1.66 (1.15-2.41)P-value: 0.0071
3 Years3 Years
5 Years 5 Years
1.0
0.8
0.6
0.4
0.2
0.0
1.0
0.8
0.6
0.4
0.2
0.0
0 500 1000 1500 2000 2500 3000 0 500 1000 1500 2000 2500 3000 3500
Figure 4 HCN1 mRNA expression and overall survival patient with breast cancer and colorectal cancer. High expression of HCN1 results in poor survival rate of patient in 3 and 5 years’ period. P<0.05 means statistically significant difference.
Expression of HCN4 in multiple types and subtypes of cancer
HCN4 gene was found over-expression in kidney cancer, leukemia, lung cancer, sarcoma, ovarian cancer, and thyroid cancer whereas it under expressed in breast cancer. In
addition, both over and under expression of HCN4 were found in bladder cancer, kidney cancer, and esophageal cancer (Figure 2).
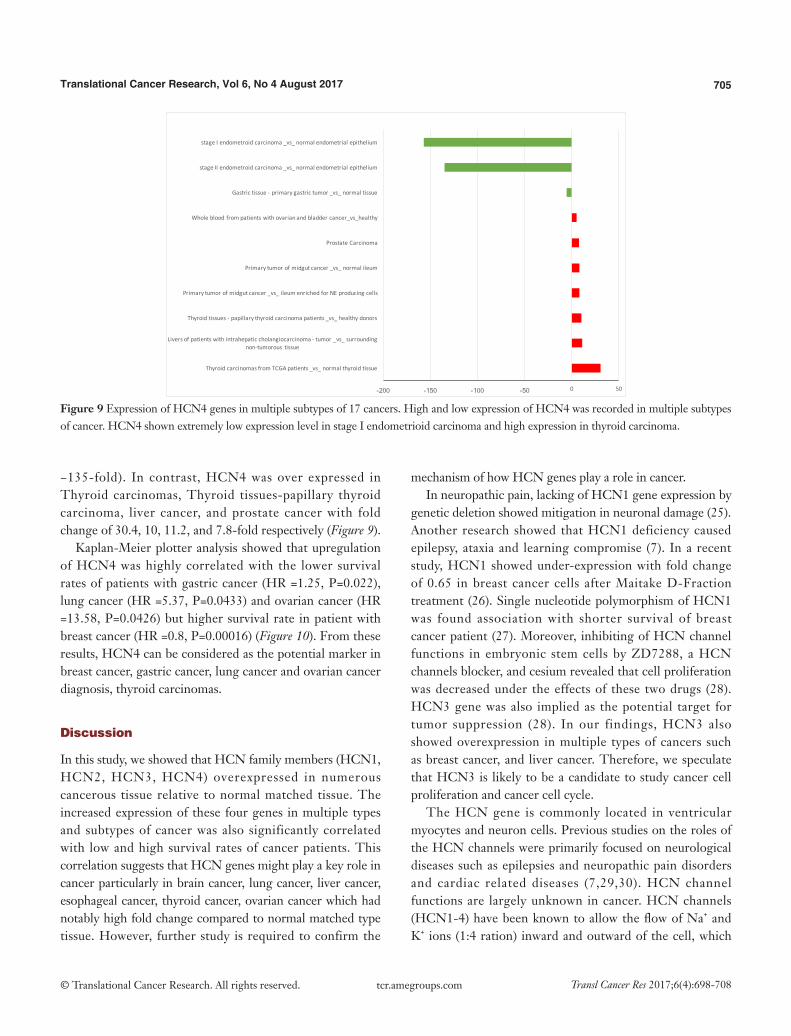
HCN4 was under-expressed in stage I and II endometrial carcinoma with the fold change extremely low (−157 and
-200 -150 -100 -50 0 50Lungformalin-fixedparaffin-embedded…AnaplasticastrocytomasWHOgradeIIIBraintumorsamplesofWHOgrade2…Glioblastomamultiformetumorsin…
PrimarytumordermalneurofibromasGlioblastoma
Glioblastomamultiformetumorsof…PrimarytumorplexiformneurofibromasGlioblastomamultiformetumorsofG-…
PilocyticastrocytomasfromcerebellumsBraintumortissuesfrompatientswith…Glioblastomamultiformetumorsof…
GlioblastomasbraintumorsBraintumortissuesfrompatientswith…
Braintumortissuesfrompediatric…Oligoastrocytoma
Pediatricbraintissue- glioblastomatumorPediatricbraintissue- glioblastomatumorPediatricbraintissue- glioblastomatumor
703Translational Cancer Research, Vol 6, No 4 August 2017
© Translational Cancer Research. All rights reserved. Transl Cancer Res 2017;6(4):698-708 tcr.amegroups.com
Figure 5 Expression of HCN2 genes in multiple subtypes of 17 cancers. High expression of HCN2 was recorded in multiple subtypes of cancer.
Ove
rall
surv
ival
Ove
rall
surv
ival
Ove
rall
surv
ival
Time (days) Time (days)
Time (months)
Kidney cancer Lung cancer
Gastric cancer
High expression, N=253Low expression, N=252
High expression, N=75Low expression, N=74
High expression, N=343Low expression, N=250
HR= 1.11 (1.04-1.2)P-value: 0.004
HR= 2.5 (1.24-5.05)P-value: 0.0107
HR= 1.33 (1.1-1.161)P-value: 0.0037
3 Years3 Years
3 Years
5 Years5 Years
5 Years
1.0
0.8
0.6
0.4
0.2
0.0
1.0
0.8
0.6
0.4
0.2
0.0
1.0
0.8
0.6
0.4
0.2
0.0
0 500 1000 1500 2000 2500 3000 3500 0 500 1000 1500 2000 2500
0 50 100 150
Figure 6 HCN2 mRNA expression and overall survival patient with kidney cancer, lung cancer and gastric cancer. High expression of HCN2 results in poor survival rate of patient in 3 and 5 years’ period. P<0.05 means statistically significant difference.
-50 -40 -30 -20 -10 0 10 20 30 40 50
Lungformalin-fixedparaffin-embedded(FFPE)
BreastcancertumorsfromTGCApatients
LiverhepatocellularcarcinomasfromTCGApatients
ChromophobeRenalCellCarcinoma
ThyroidcarcinomasfromTCGApatients
CutaneousMelanoma
LungadenocarcinomasfromTCGApatients
LungCarcinoid
MantleCellLymphoma
HepatocellularcarcinomasfromhepatitisBvirus-positivepatients
Esophagealsquamouscellcarcinomas
PilocyticAstrocytoma
Esophagealsquamouscellcarcinomas
Esophagealsquamouscellcarcinoma(ESCC)tumor
704 Phan et al. HCN channels and cancer
© Translational Cancer Research. All rights reserved. Transl Cancer Res 2017;6(4):698-708 tcr.amegroups.com
Ove
rall
surv
ival
Ove
rall
surv
ival
Ove
rall
surv
ival
Ove
rall
surv
ival
Time (days)
Time (days) Time (days)
Time (days)
Breast cancer Kidney cancer
Ovarian cancerLung cancer
High expression, N=297Low expression, N=296
High expression, N=253Low expression, N=252
High expression, N=29Low expression, N=28
High expression, N=49Low expression, N=48
HR= 1.65 (1.12-2.44)P-value: 0.016
HR= 1.17 (1-1.36)P-value: 0.049
HR= 0.53 (0.29-0.97)P-value: 0.0386
HR= 0.33 (0.12-0.88)P-value: 0.0272
3 Years 3 Years
3 Years
3 Years
5 Years
5 Years
5 Years
5 Years
1.0
0.8
0.6
0.4
0.2
0.0
1.0
0.8
0.6
0.4
0.2
0.0
1.0
0.8
0.6
0.4
0.2
0.0
1.0
0.8
0.6
0.4
0.2
0.0
0 1000 2000 3000 4000 5000
0 1000 2000 3000 4000 5000 6000 7000 0 1000 2000 3000 4000 5000 6000 7000
0 1000 2000 3000 4000
Figure 8 HCN3 mRNA expression and overall survival patient with breast cancer, kidney cancer, lung cancer and ovarian cancer. High expression of HCN3 results in poor survival rate of patient in 3 and 5 years’ period. P<0.05 means statistically significant difference.
Figure 7 Expression of HCN3 genes in multiple subtypes of 17 cancers. High and low expression of HCN3 was recorded in multiple subtypes of cancer.
-5 -4 -3 -2 -1 0 1 2 3 4 5
Liversofhepatocellularcarcinomapatients-…LungadenocarcinomasfromTCGApatients
Intrahepaticcholangiocarcinomasof…Liversofhepatocellularcarcinomapatients-…
LungcarcinoidtumorsPediatrictumortissueanaplasticastocytomaPediatrictumortissueanaplasticastocytoma
PediatrictumortissueependymomaPediatrictumortissueependymoma
Hepatocellularcarcinomaadvancedstage…Culturedplexiformneurofibroma-derived…Culturedplexiformneurofibroma-derived…
PrimarytumordermalneurofibromaPrimarytumordermalneurofibroma
Primarytumorplexiformneurofibroma
705Translational Cancer Research, Vol 6, No 4 August 2017
© Translational Cancer Research. All rights reserved. Transl Cancer Res 2017;6(4):698-708 tcr.amegroups.com
Figure 9 Expression of HCN4 genes in multiple subtypes of 17 cancers. High and low expression of HCN4 was recorded in multiple subtypes of cancer. HCN4 shown extremely low expression level in stage I endometrioid carcinoma and high expression in thyroid carcinoma.
−135-fold). In contrast, HCN4 was over expressed in Thyroid carcinomas, Thyroid tissues-papillary thyroid carcinoma, liver cancer, and prostate cancer with fold change of 30.4, 10, 11.2, and 7.8-fold respectively (Figure 9).
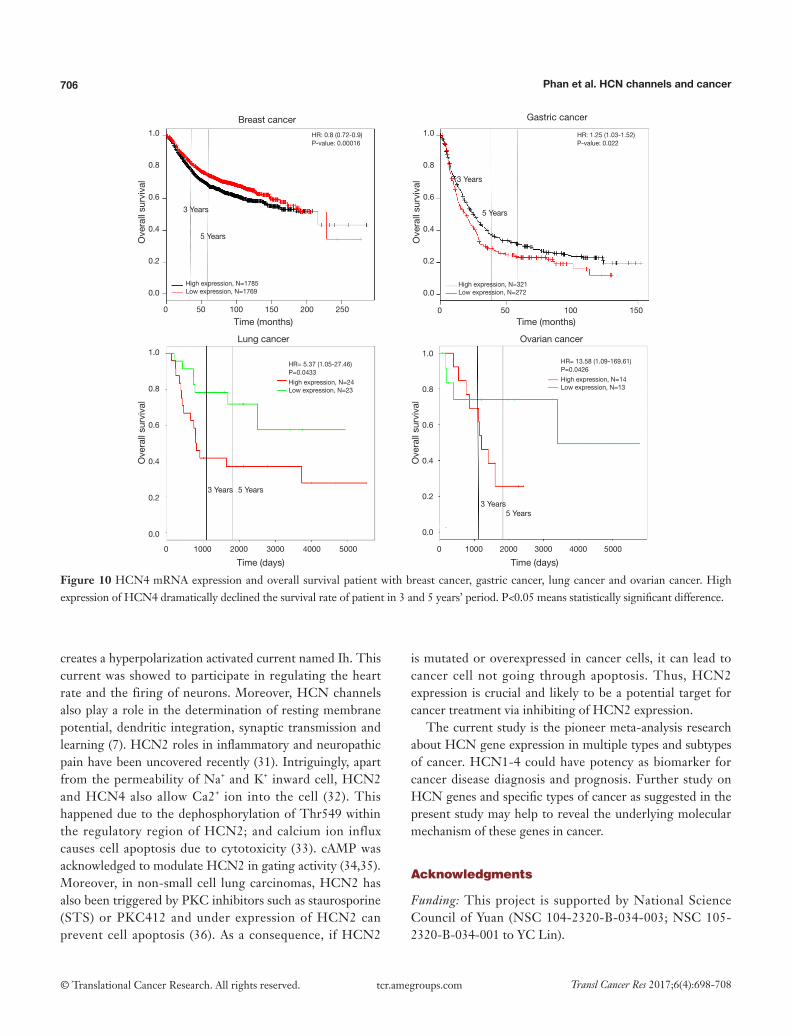
Kaplan-Meier plotter analysis showed that upregulation of HCN4 was highly correlated with the lower survival rates of patients with gastric cancer (HR =1.25, P=0.022), lung cancer (HR =5.37, P=0.0433) and ovarian cancer (HR =13.58, P=0.0426) but higher survival rate in patient with breast cancer (HR =0.8, P=0.00016) (Figure 10). From these results, HCN4 can be considered as the potential marker in breast cancer, gastric cancer, lung cancer and ovarian cancer diagnosis, thyroid carcinomas.
Discussion
In this study, we showed that HCN family members (HCN1, HCN2, HCN3, HCN4) overexpressed in numerous cancerous tissue relative to normal matched tissue. The increased expression of these four genes in multiple types and subtypes of cancer was also significantly correlated with low and high survival rates of cancer patients. This correlation suggests that HCN genes might play a key role in cancer particularly in brain cancer, lung cancer, liver cancer, esophageal cancer, thyroid cancer, ovarian cancer which had notably high fold change compared to normal matched type tissue. However, further study is required to confirm the
mechanism of how HCN genes play a role in cancer.In neuropathic pain, lacking of HCN1 gene expression by
genetic deletion showed mitigation in neuronal damage (25). Another research showed that HCN1 deficiency caused epilepsy, ataxia and learning compromise (7). In a recent study, HCN1 showed under-expression with fold change of 0.65 in breast cancer cells after Maitake D-Fraction treatment (26). Single nucleotide polymorphism of HCN1 was found association with shorter survival of breast cancer patient (27). Moreover, inhibiting of HCN channel functions in embryonic stem cells by ZD7288, a HCN channels blocker, and cesium revealed that cell proliferation was decreased under the effects of these two drugs (28). HCN3 gene was also implied as the potential target for tumor suppression (28). In our findings, HCN3 also showed overexpression in multiple types of cancers such as breast cancer, and liver cancer. Therefore, we speculate that HCN3 is likely to be a candidate to study cancer cell proliferation and cancer cell cycle.
The HCN gene is commonly located in ventricular myocytes and neuron cells. Previous studies on the roles of the HCN channels were primarily focused on neurological diseases such as epilepsies and neuropathic pain disorders and cardiac related diseases (7,29,30). HCN channel functions are largely unknown in cancer. HCN channels (HCN1-4) have been known to allow the flow of Na+ and K+ ions (1:4 ration) inward and outward of the cell, which
-200 -150 -100 -50 0 50
ThyroidcarcinomasfromTCGApatients_vs_normalthyroidtissue
Liversofpatientswithintrahepaticcholangiocarcinoma- tumor_vs_surroundingnon-tumorous tissue
Thyroidtissues- papillarythyroidcarcinomapatients_vs_healthydonors
Primarytumorofmidgutcancer_vs_ileumenrichedforNEproducingcells
Primarytumorofmidgutcancer_vs_normalileum
ProstateCarcinoma
Wholebloodfrompatientswithovarianandbladdercancer_vs_healthy
Gastrictissue- primarygastrictumor_vs_normaltissue
stageIIendometroidcarcinoma_vs_normalendometrialepithelium
stageIendometroidcarcinoma_vs_normalendometrialepithelium
706 Phan et al. HCN channels and cancer
© Translational Cancer Research. All rights reserved. Transl Cancer Res 2017;6(4):698-708 tcr.amegroups.com
Ove
rall
surv
ival
Ove
rall
surv
ival
Ove
rall
surv
ival
Ove
rall
surv
ival
Time (months)
Time (days) Time (days)
Time (months)
Breast cancer
Lung cancer Ovarian cancer
Gastric cancer
High expression, N=1785Low expression, N=1769
High expression, N=24Low expression, N=23
High expression, N=14Low expression, N=13
High expression, N=321Low expression, N=272
HR: 0.8 (0.72-0.9)P-value: 0.00016
HR= 5.37 (1.05-27.46)P=0.0433
HR= 13.58 (1.09-169.61)P=0.0426
HR: 1.25 (1.03-1.52)P-value: 0.022
3 Years
3 Years
3 Years
3 Years
5 Years
5 Years
5 Years
5 Years
1.0
0.8
0.6
0.4
0.2
0.0
1.0
0.8
0.6
0.4
0.2
0.0
1.0
0.8
0.6
0.4
0.2
0.0
1.0
0.8
0.6
0.4
0.2
0.0
0 50 100 150 200 250
0 1000 2000 3000 4000 5000 0 1000 2000 3000 4000 5000
0 50 100 150
Figure 10 HCN4 mRNA expression and overall survival patient with breast cancer, gastric cancer, lung cancer and ovarian cancer. High expression of HCN4 dramatically declined the survival rate of patient in 3 and 5 years’ period. P<0.05 means statistically significant difference.
creates a hyperpolarization activated current named Ih. This current was showed to participate in regulating the heart rate and the firing of neurons. Moreover, HCN channels also play a role in the determination of resting membrane potential, dendritic integration, synaptic transmission and learning (7). HCN2 roles in inflammatory and neuropathic pain have been uncovered recently (31). Intriguingly, apart from the permeability of Na+ and K+ inward cell, HCN2 and HCN4 also allow Ca2+ ion into the cell (32). This happened due to the dephosphorylation of Thr549 within the regulatory region of HCN2; and calcium ion influx causes cell apoptosis due to cytotoxicity (33). cAMP was acknowledged to modulate HCN2 in gating activity (34,35). Moreover, in non-small cell lung carcinomas, HCN2 has also been triggered by PKC inhibitors such as staurosporine (STS) or PKC412 and under expression of HCN2 can prevent cell apoptosis (36). As a consequence, if HCN2
is mutated or overexpressed in cancer cells, it can lead to cancer cell not going through apoptosis. Thus, HCN2 expression is crucial and likely to be a potential target for cancer treatment via inhibiting of HCN2 expression.
The current study is the pioneer meta-analysis research about HCN gene expression in multiple types and subtypes of cancer. HCN1-4 could have potency as biomarker for cancer disease diagnosis and prognosis. Further study on HCN genes and specific types of cancer as suggested in the present study may help to reveal the underlying molecular mechanism of these genes in cancer.
Acknowledgments
Funding: This project is supported by National Science Council of Yuan (NSC 104-2320-B-034-003; NSC 105-2320-B-034-001 to YC Lin).
707Translational Cancer Research, Vol 6, No 4 August 2017
© Translational Cancer Research. All rights reserved. Transl Cancer Res 2017;6(4):698-708 tcr.amegroups.com
Footnote
Conflicts of Interest: All authors have completed the ICMJE uniform disclosure form (available at http://dx.doi.org/10.21037/tcr.2017.07.22). The authors have no conflicts of interest to declare.
Ethical Statement: The authors are accountable for all aspects of the work in ensuring that questions related to the accuracy or integrity of any part of the work are appropriately investigated and resolved.
Open Access Statement: This is an Open Access article distributed in accordance with the Creative Commons Attribution-NonCommercial-NoDerivs 4.0 International License (CC BY-NC-ND 4.0), which permits the non-commercial replication and distribution of the article with the strict proviso that no changes or edits are made and the original work is properly cited (including links to both the formal publication through the relevant DOI and the license). See: https://creativecommons.org/licenses/by-nc-nd/4.0/.
References
1. Ferlay J, Soerjomataram I, Dikshit R, et al. Cancer incidence and mortality worldwide: sources, methods and major patterns in GLOBOCAN 2012. Int J Cancer 2015;136:E359-86.
2. Zugazagoitia J, Guedes C, Ponce S, et al. Current Challenges in Cancer Treatment. Clin Ther 2016;38:1551-66.
3. Kaupp UB, Seifert R. Molecular diversity of pacemaker ion channels. Annu Rev Physiol 2001;63:235-57.
4. Notomi T, Shigemoto R. Immunohistochemical localization of Ih channel subunits, HCN1-4, in the rat brain. J Comp Neurol 2004;471:241-76.
5. Bender RA, Baram TZ. Hyperpolarization activated cyclic-nucleotide gated (HCN) channels in developing neuronal networks. Prog Neurobiol 2008;86:129-40.
6. Larsson HP. How is the heart rate regulated in the sinoatrial node? Another piece to the puzzle. J Gen Physiol 2010;136:237-41.
7. Postea O, Biel M. Exploring HCN channels as novel drug targets. Nat Rev Drug Discov 2011;10:903-14.
8. Rhodes DR, Kalyana-Sundaram S, Mahavisno V, et al. Oncomine 3.0: genes, pathways, and networks in a collection of 18,000 cancer gene expression profiles. Neoplasia 2007;9:166-80.
9. Rhodes DR, Yu J, Shanker K, et al. ONCOMINE: a cancer microarray database and integrated data-mining platform. Neoplasia 2004;6:1-6.
10. MacDonald JW, Ghosh D. COPA--cancer outlier profile analysis. Bioinformatics 2006;22:2950-1.
11. Wilson BJ, Giguère V. Identification of novel pathway partners of p68 and p72 RNA helicases through Oncomine meta-analysis. BMC Genomics 2007;8:419.
12. Blonska M, Lin X. NF-κB signaling pathways regulated by CARMA family of scaffold proteins. Cell Res 2011;21:55-70.
13. McDaniel AS, Hovelson D, Cani A, et al. 187 Targeted genomic profiling of penile squamous cell carcinoma using the Oncomine cancer research panel. Eur J Cancer 2014;50:61.
14. Wang CY, Lai MD, Phan NN, et al. Meta-Analysis of Public Microarray Datasets Reveals Voltage-Gated Calcium Gene Signatures in Clinical Cancer Patients. PLoS One 2015;10:e0125766.
15. Phan NN, Wang CY, Chen CF, et al. Voltage-gated calcium channels: Novel targets for cancer therapy. Oncol Lett 2017;14:2059-74.
16. Wang CY, Shahi P, Huang JT, et al. Systematic analysis of the achaete-scute complex-like gene signature in clinical cancer patients. Mol Clin Oncol 2017;6:7-18.
17. Coppola G. editor. The OMICs: Applications in Neuroscience. Oxford: Oxford University Press, 2013.
18. Cohen T, Sundaresh S, Levine F. Antipsychotics activate the TGFβ pathway effector SMAD3. Mol Psychiatry 2013;18:347-57.
19. Kupershmidt I, Su QJ, Grewal A, et al. Ontology-based meta-analysis of global collections of high-throughput public data. PLoS One 2010;5(9).
20. Ewald JA, Downs TM, Cetnar JP, et al. Expression microarray meta-analysis identifies genes associated with Ras/MAPK and related pathways in progression of muscle-invasive bladder transition cell carcinoma. PLoS One 2013;8:e55414.
21. Moher D, Liberati A, Tetzlaff J, et al. Preferred reporting items for systematic reviews and meta-analyses: the PRISMA statement. PLoS Med 2009;6:e1000097.
22. Rhodes DR, Chinnaiyan AM. Integrative analysis of the cancer transcriptome. Nat Genet 2005;37 Suppl:S31-7.
23. Győrffy B, Surowiak P, Budczies J, et al. Online survival analysis software to assess the prognostic value of biomarkers using transcriptomic data in non-small-cell lung cancer. PLoS One 2013;8:e82241.
24. Goswami CP, Nakshatri H. PROGgeneV2: enhancements
708 Phan et al. HCN channels and cancer
© Translational Cancer Research. All rights reserved. Transl Cancer Res 2017;6(4):698-708 tcr.amegroups.com
on the existing database. BMC Cancer 2014;14:970. 25. Momin A, Cadiou H, Mason A, et al. Role of the
hyperpolarization-activated current Ih in somatosensory neurons. J Physiol 2008;586:5911-29.
26. Alonso EN, Orozco M, Eloy Nieto A, et al. Genes related to suppression of malignant phenotype induced by Maitake D-Fraction in breast cancer cells. J Med Food 2013;16:602-17.
27. Kuo SH, Yang SY, You SL, et al. Polymorphisms of ESR1, UGT1A1, HCN1, MAP3K1 and CYP2B6 are associated with the prognosis of hormone receptor-positive early breast cancer. Oncotarget 2017;8:20925-38.
28. Lau YT, Wong CK, Luo J, et al. Effects of hyperpolarization-activated cyclic nucleotide-gated (HCN) channel blockers on the proliferation and cell cycle progression of embryonic stem cells. Pflugers Arch 2011;461:191-202.
29. Poolos NP. The Yin and Yang of the H-Channel and Its Role in Epilepsy. Epilepsy Curr 2004;4:3-6.
30. Ueda K, Nakamura K, Hayashi T, et al. Functional characterization of a trafficking-defective HCN4 mutation, D553N, associated with cardiac arrhythmia. J Biol Chem 2004;279:27194-8.
31. Emery EC, Young GT, Berrocoso EM, et al. HCN2 ion channels play a central role in inflammatory and neuropathic pain. Science 2011;333:1462-6.
32. Yu X, Duan KL, Shang CF, et al. Calcium influx through hyperpolarization-activated cation channels (Ih channels) contributes to activity-evoked neuronal secretion. Proc Natl Acad Sci U S A 2004;101:1051-6.
33. Norberg E, Karlsson M, Korenovska O, et al. Critical role for hyperpolarization-activated cyclic nucleotide-gated channel 2 in the AIF-mediated apoptosis. EMBO J 2010;29:3869-78.
34. Ulens C, Tytgat J. Gi- and Gs-coupled receptors up-regulate the cAMP cascade to modulate HCN2, but not HCN1 pacemaker channels. Pflugers Arch 2001;442:928-42.
35. Wainger BJ, DeGennaro M, Santoro B, et al. Molecular mechanism of cAMP modulation of HCN pacemaker channels. Nature 2001;411:805-10.
36. Norberg E, Gogvadze V, Ott M, et al. An increase in intracellular Ca2+ is required for the activation of mitochondrial calpain to release AIF during cell death. Cell Death Differ 2008;15:1857-64.
Cite this article as: Phan NN, Huynh TT, Lin YC. Hyperpolarization-activated cyclic nucleotide-gated gene signatures and poor clinical outcome of cancer patient. Transl Cancer Res 2017;6(4):698-708. doi: 10.21037/tcr.2017.07.22
Supplementary
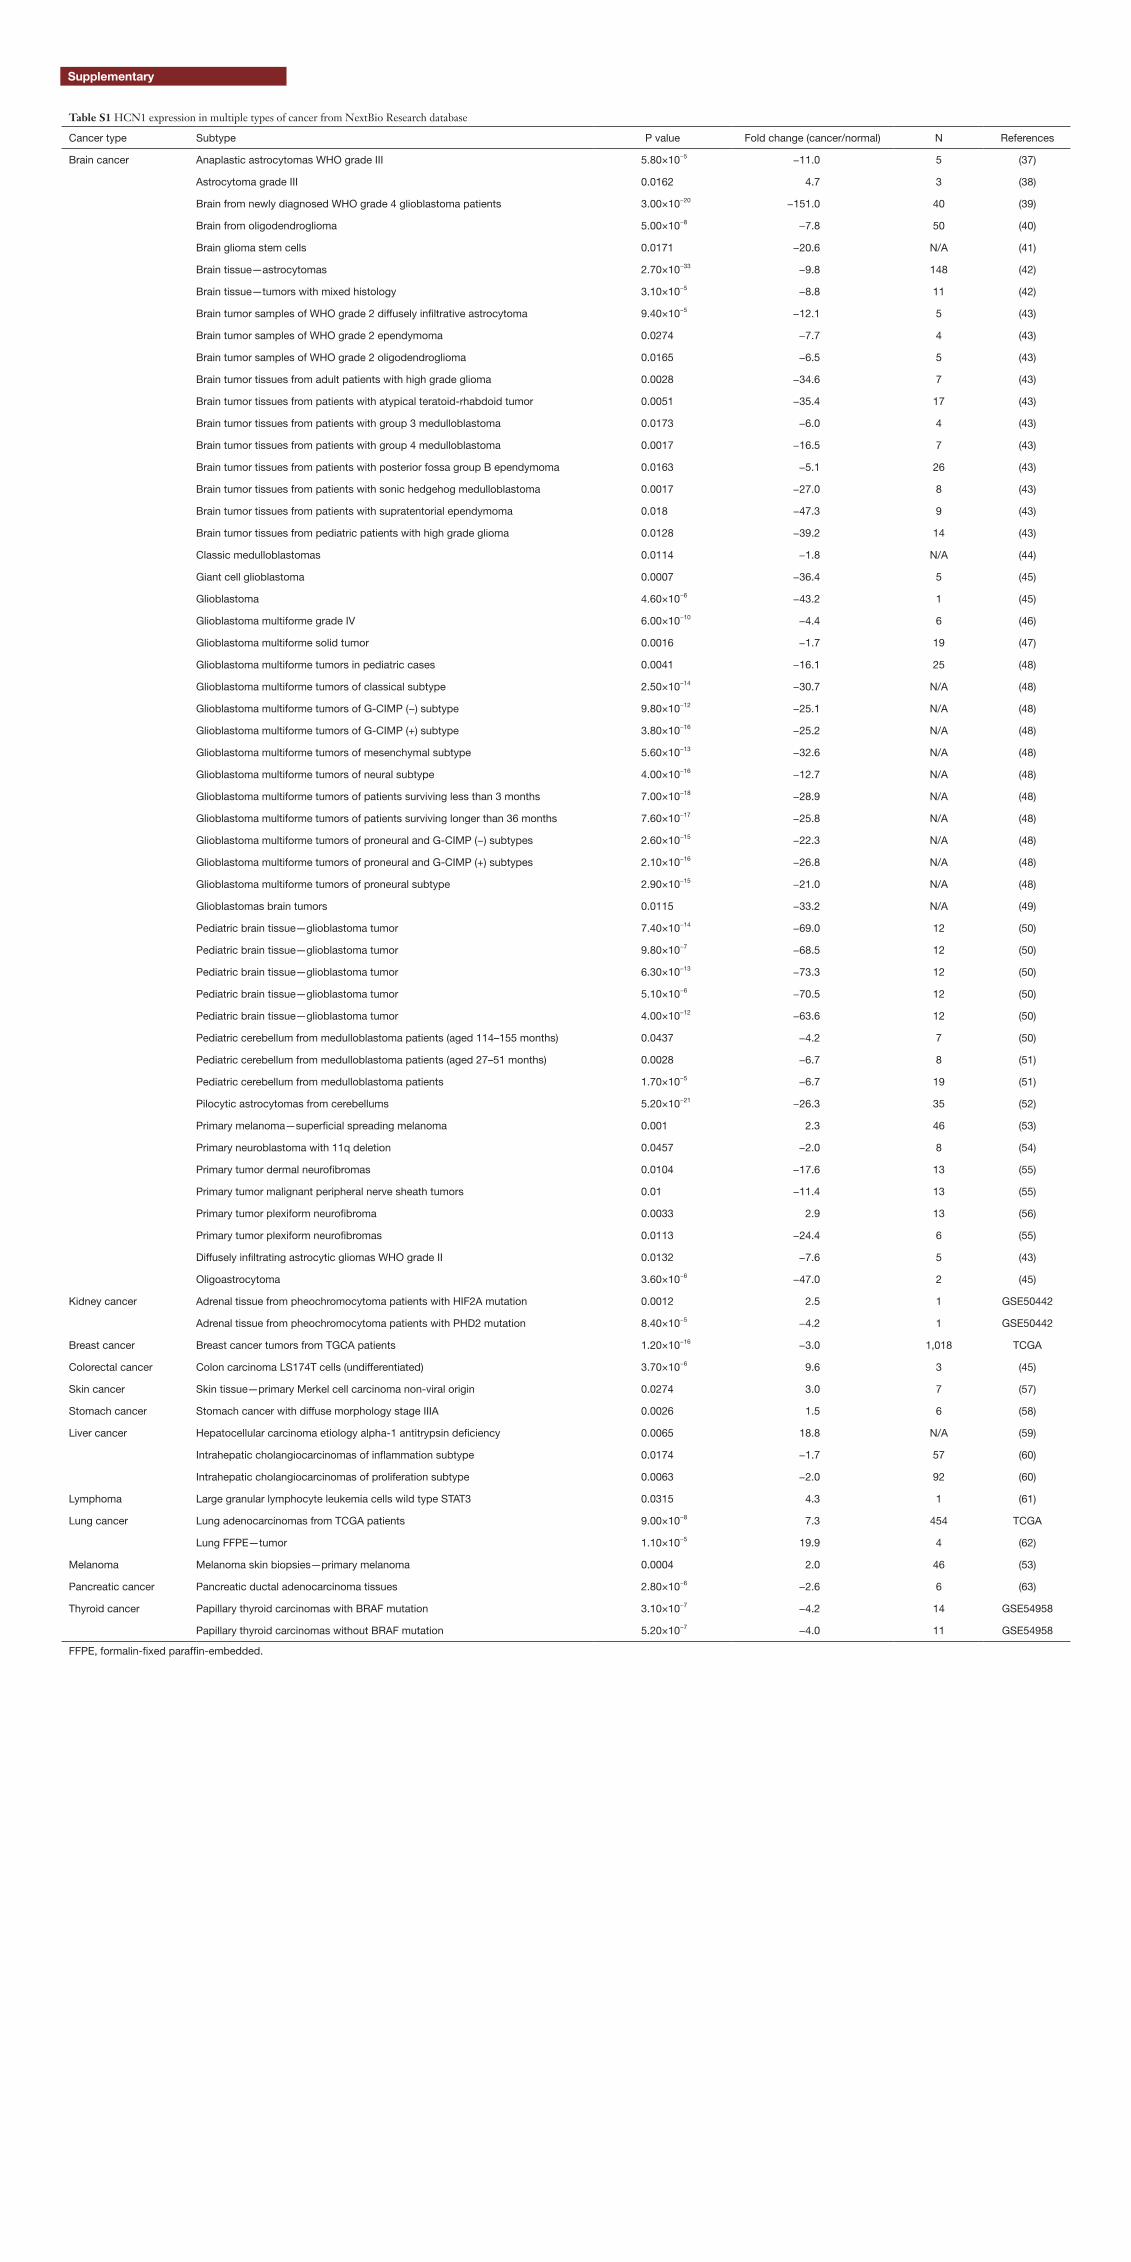
Table S1 HCN1 expression in multiple types of cancer from NextBio Research database
Cancer type Subtype P value Fold change (cancer/normal) N References
Brain cancer Anaplastic astrocytomas WHO grade III 5.80×10⁻⁵ −11.0 5 (37)
Astrocytoma grade III 0.0162 4.7 3 (38)
Brain from newly diagnosed WHO grade 4 glioblastoma patients 3.00×10⁻²⁰ −151.0 40 (39)
Brain from oligodendroglioma 5.00×10⁻⁸ −7.8 50 (40)
Brain glioma stem cells 0.0171 −20.6 N/A (41)
Brain tissue—astrocytomas 2.70×10⁻³³ −9.8 148 (42)
Brain tissue—tumors with mixed histology 3.10×10⁻⁵ −8.8 11 (42)
Brain tumor samples of WHO grade 2 diffusely infiltrative astrocytoma 9.40×10⁻⁵ −12.1 5 (43)
Brain tumor samples of WHO grade 2 ependymoma 0.0274 −7.7 4 (43)
Brain tumor samples of WHO grade 2 oligodendroglioma 0.0165 −6.5 5 (43)
Brain tumor tissues from adult patients with high grade glioma 0.0028 −34.6 7 (43)
Brain tumor tissues from patients with atypical teratoid-rhabdoid tumor 0.0051 −35.4 17 (43)
Brain tumor tissues from patients with group 3 medulloblastoma 0.0173 −6.0 4 (43)
Brain tumor tissues from patients with group 4 medulloblastoma 0.0017 −16.5 7 (43)
Brain tumor tissues from patients with posterior fossa group B ependymoma 0.0163 −5.1 26 (43)
Brain tumor tissues from patients with sonic hedgehog medulloblastoma 0.0017 −27.0 8 (43)
Brain tumor tissues from patients with supratentorial ependymoma 0.018 −47.3 9 (43)
Brain tumor tissues from pediatric patients with high grade glioma 0.0128 −39.2 14 (43)
Classic medulloblastomas 0.0114 −1.8 N/A (44)
Giant cell glioblastoma 0.0007 −36.4 5 (45)
Glioblastoma 4.60×10⁻⁶ −43.2 1 (45)
Glioblastoma multiforme grade IV 6.00×10⁻¹⁰ −4.4 6 (46)
Glioblastoma multiforme solid tumor 0.0016 −1.7 19 (47)
Glioblastoma multiforme tumors in pediatric cases 0.0041 −16.1 25 (48)
Glioblastoma multiforme tumors of classical subtype 2.50×10⁻¹⁴ −30.7 N/A (48)
Glioblastoma multiforme tumors of G-CIMP (−) subtype 9.80×10⁻¹² −25.1 N/A (48)
Glioblastoma multiforme tumors of G-CIMP (+) subtype 3.80×10⁻¹⁶ −25.2 N/A (48)
Glioblastoma multiforme tumors of mesenchymal subtype 5.60×10⁻¹³ −32.6 N/A (48)
Glioblastoma multiforme tumors of neural subtype 4.00×10⁻¹⁶ −12.7 N/A (48)
Glioblastoma multiforme tumors of patients surviving less than 3 months 7.00×10⁻¹⁸ −28.9 N/A (48)
Glioblastoma multiforme tumors of patients surviving longer than 36 months 7.60×10⁻¹⁷ −25.8 N/A (48)
Glioblastoma multiforme tumors of proneural and G-CIMP (−) subtypes 2.60×10⁻¹⁵ −22.3 N/A (48)
Glioblastoma multiforme tumors of proneural and G-CIMP (+) subtypes 2.10×10⁻¹⁶ −26.8 N/A (48)
Glioblastoma multiforme tumors of proneural subtype 2.90×10⁻¹⁵ −21.0 N/A (48)
Glioblastomas brain tumors 0.0115 −33.2 N/A (49)
Pediatric brain tissue—glioblastoma tumor 7.40×10⁻¹⁴ −69.0 12 (50)
Pediatric brain tissue—glioblastoma tumor 9.80×10⁻⁷ −68.5 12 (50)
Pediatric brain tissue—glioblastoma tumor 6.30×10⁻¹³ −73.3 12 (50)
Pediatric brain tissue—glioblastoma tumor 5.10×10⁻⁶ −70.5 12 (50)
Pediatric brain tissue—glioblastoma tumor 4.00×10⁻¹² −63.6 12 (50)
Pediatric cerebellum from medulloblastoma patients (aged 114–155 months) 0.0437 −4.2 7 (50)
Pediatric cerebellum from medulloblastoma patients (aged 27–51 months) 0.0028 −6.7 8 (51)
Pediatric cerebellum from medulloblastoma patients 1.70×10⁻⁵ −6.7 19 (51)
Pilocytic astrocytomas from cerebellums 5.20×10⁻²¹ −26.3 35 (52)
Primary melanoma—superficial spreading melanoma 0.001 2.3 46 (53)
Primary neuroblastoma with 11q deletion 0.0457 −2.0 8 (54)
Primary tumor dermal neurofibromas 0.0104 −17.6 13 (55)
Primary tumor malignant peripheral nerve sheath tumors 0.01 −11.4 13 (55)
Primary tumor plexiform neurofibroma 0.0033 2.9 13 (56)
Primary tumor plexiform neurofibromas 0.0113 −24.4 6 (55)
Diffusely infiltrating astrocytic gliomas WHO grade II 0.0132 −7.6 5 (43)
Oligoastrocytoma 3.60×10⁻⁶ −47.0 2 (45)
Kidney cancer Adrenal tissue from pheochromocytoma patients with HIF2A mutation 0.0012 2.5 1 GSE50442
Adrenal tissue from pheochromocytoma patients with PHD2 mutation 8.40×10⁻⁵ −4.2 1 GSE50442
Breast cancer Breast cancer tumors from TGCA patients 1.20×10⁻¹⁶ −3.0 1,018 TCGA
Colorectal cancer Colon carcinoma LS174T cells (undifferentiated) 3.70×10⁻⁶ 9.6 3 (45)
Skin cancer Skin tissue—primary Merkel cell carcinoma non-viral origin 0.0274 3.0 7 (57)
Stomach cancer Stomach cancer with diffuse morphology stage IIIA 0.0026 1.5 6 (58)
Liver cancer Hepatocellular carcinoma etiology alpha-1 antitrypsin deficiency 0.0065 18.8 N/A (59)
Intrahepatic cholangiocarcinomas of inflammation subtype 0.0174 −1.7 57 (60)
Intrahepatic cholangiocarcinomas of proliferation subtype 0.0063 −2.0 92 (60)
Lymphoma Large granular lymphocyte leukemia cells wild type STAT3 0.0315 4.3 1 (61)
Lung cancer Lung adenocarcinomas from TCGA patients 9.00×10⁻⁸ 7.3 454 TCGA
Lung FFPE—tumor 1.10×10⁻⁵ 19.9 4 (62)
Melanoma Melanoma skin biopsies—primary melanoma 0.0004 2.0 46 (53)
Pancreatic cancer Pancreatic ductal adenocarcinoma tissues 2.80×10⁻⁶ −2.6 6 (63)
Thyroid cancer Papillary thyroid carcinomas with BRAF mutation 3.10×10⁻⁷ −4.2 14 GSE54958
Papillary thyroid carcinomas without BRAF mutation 5.20×10⁻⁷ −4.0 11 GSE54958
FFPE, formalin-fixed paraffin-embedded.
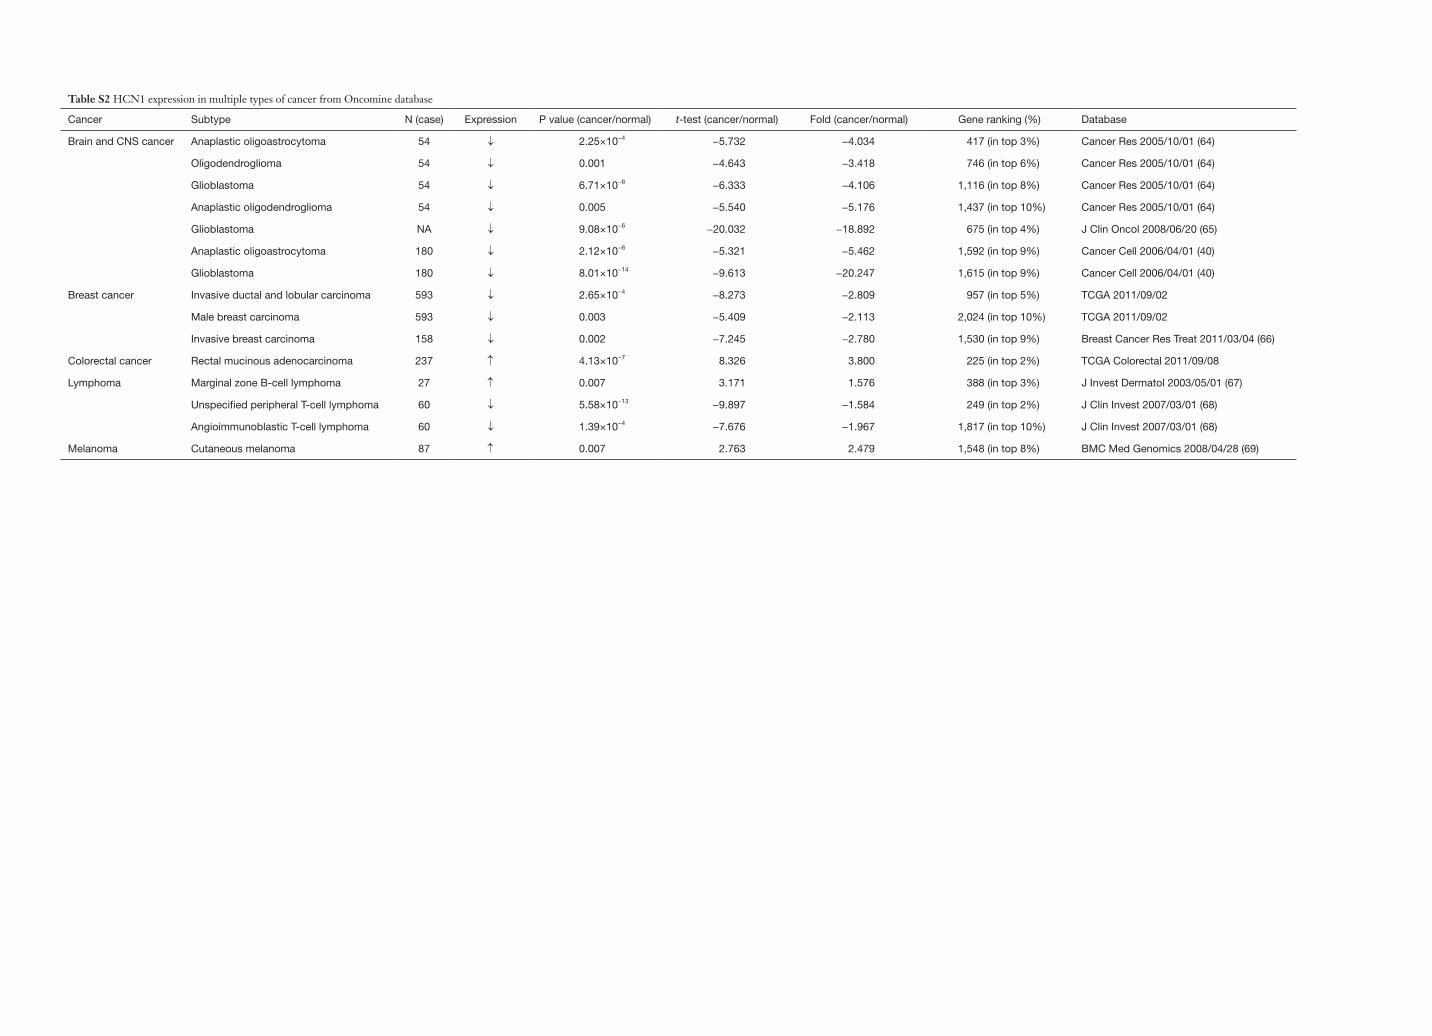
Table S2 HCN1 expression in multiple types of cancer from Oncomine database
Cancer Subtype N (case) Expression P value (cancer/normal) t-test (cancer/normal) Fold (cancer/normal) Gene ranking (%) Database
Brain and CNS cancer Anaplastic oligoastrocytoma 54 ↓ 2.25×10⁻⁴ −5.732 −4.034 417 (in top 3%) Cancer Res 2005/10/01 (64)
Oligodendroglioma 54 ↓ 0.001 −4.643 −3.418 746 (in top 6%) Cancer Res 2005/10/01 (64)
Glioblastoma 54 ↓ 6.71×10⁻⁶ −6.333 −4.106 1,116 (in top 8%) Cancer Res 2005/10/01 (64)
Anaplastic oligodendroglioma 54 ↓ 0.005 −5.540 −5.176 1,437 (in top 10%) Cancer Res 2005/10/01 (64)
Glioblastoma NA ↓ 9.08×10⁻⁶ −20.032 −18.892 675 (in top 4%) J Clin Oncol 2008/06/20 (65)
Anaplastic oligoastrocytoma 180 ↓ 2.12×10⁻⁶ −5.321 −5.462 1,592 (in top 9%) Cancer Cell 2006/04/01 (40)
Glioblastoma 180 ↓ 8.01×10⁻¹⁴ −9.613 −20.247 1,615 (in top 9%) Cancer Cell 2006/04/01 (40)
Breast cancer Invasive ductal and lobular carcinoma 593 ↓ 2.65×10⁻⁴ −8.273 −2.809 957 (in top 5%) TCGA 2011/09/02
Male breast carcinoma 593 ↓ 0.003 −5.409 −2.113 2,024 (in top 10%) TCGA 2011/09/02
Invasive breast carcinoma 158 ↓ 0.002 −7.245 −2.780 1,530 (in top 9%) Breast Cancer Res Treat 2011/03/04 (66)
Colorectal cancer Rectal mucinous adenocarcinoma 237 ↑ 4.13×10⁻⁷ 8.326 3.800 225 (in top 2%) TCGA Colorectal 2011/09/08
Lymphoma Marginal zone B-cell lymphoma 27 ↑ 0.007 3.171 1.576 388 (in top 3%) J Invest Dermatol 2003/05/01 (67)
Unspecified peripheral T-cell lymphoma 60 ↓ 5.58×10⁻¹³ −9.897 −1.584 249 (in top 2%) J Clin Invest 2007/03/01 (68)
Angioimmunoblastic T-cell lymphoma 60 ↓ 1.39×10⁻⁴ −7.676 −1.967 1,817 (in top 10%) J Clin Invest 2007/03/01 (68)
Melanoma Cutaneous melanoma 87 ↑ 0.007 2.763 2.479 1,548 (in top 8%) BMC Med Genomics 2008/04/28 (69)
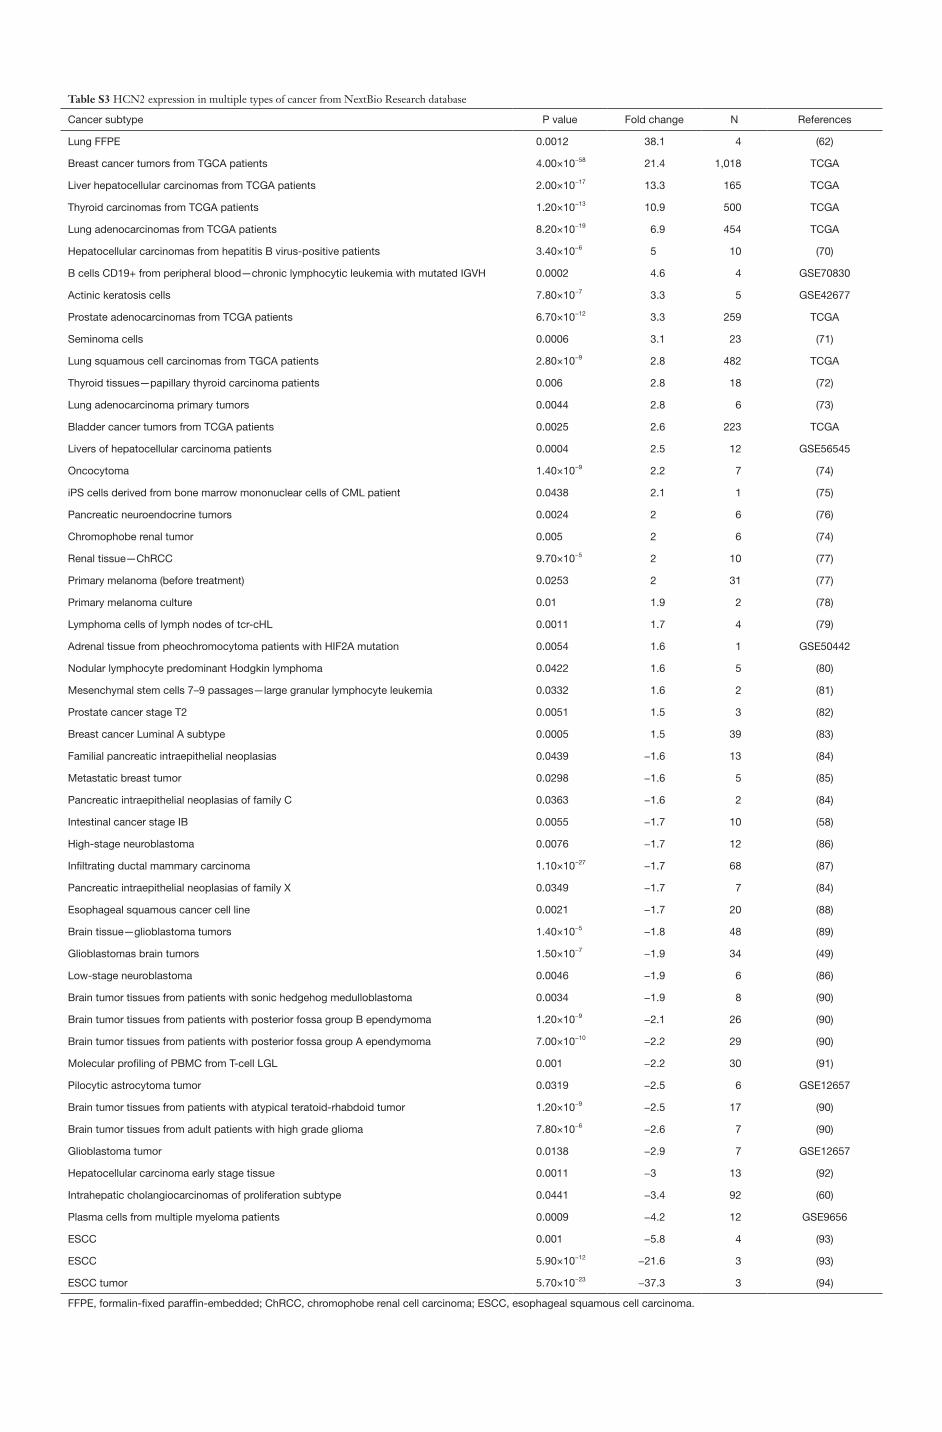
Table S3 HCN2 expression in multiple types of cancer from NextBio Research database
Cancer subtype P value Fold change N References
Lung FFPE 0.0012 38.1 4 (62)
Breast cancer tumors from TGCA patients 4.00×10−58 21.4 1,018 TCGA
Liver hepatocellular carcinomas from TCGA patients 2.00×10⁻¹⁷ 13.3 165 TCGA
Thyroid carcinomas from TCGA patients 1.20×10⁻¹³ 10.9 500 TCGA
Lung adenocarcinomas from TCGA patients 8.20×10⁻¹⁹ 6.9 454 TCGA
Hepatocellular carcinomas from hepatitis B virus-positive patients 3.40×10⁻⁶ 5 10 (70)
B cells CD19+ from peripheral blood—chronic lymphocytic leukemia with mutated IGVH 0.0002 4.6 4 GSE70830
Actinic keratosis cells 7.80×10⁻⁷ 3.3 5 GSE42677
Prostate adenocarcinomas from TCGA patients 6.70×10⁻¹² 3.3 259 TCGA
Seminoma cells 0.0006 3.1 23 (71)
Lung squamous cell carcinomas from TGCA patients 2.80×10⁻⁹ 2.8 482 TCGA
Thyroid tissues—papillary thyroid carcinoma patients 0.006 2.8 18 (72)
Lung adenocarcinoma primary tumors 0.0044 2.8 6 (73)
Bladder cancer tumors from TCGA patients 0.0025 2.6 223 TCGA
Livers of hepatocellular carcinoma patients 0.0004 2.5 12 GSE56545
Oncocytoma 1.40×10⁻⁹ 2.2 7 (74)
iPS cells derived from bone marrow mononuclear cells of CML patient 0.0438 2.1 1 (75)
Pancreatic neuroendocrine tumors 0.0024 2 6 (76)
Chromophobe renal tumor 0.005 2 6 (74)
Renal tissue—ChRCC 9.70×10⁻⁵ 2 10 (77)
Primary melanoma (before treatment) 0.0253 2 31 (77)
Primary melanoma culture 0.01 1.9 2 (78)
Lymphoma cells of lymph nodes of tcr-cHL 0.0011 1.7 4 (79)
Adrenal tissue from pheochromocytoma patients with HIF2A mutation 0.0054 1.6 1 GSE50442
Nodular lymphocyte predominant Hodgkin lymphoma 0.0422 1.6 5 (80)
Mesenchymal stem cells 7–9 passages—large granular lymphocyte leukemia 0.0332 1.6 2 (81)
Prostate cancer stage T2 0.0051 1.5 3 (82)
Breast cancer Luminal A subtype 0.0005 1.5 39 (83)
Familial pancreatic intraepithelial neoplasias 0.0439 −1.6 13 (84)
Metastatic breast tumor 0.0298 −1.6 5 (85)
Pancreatic intraepithelial neoplasias of family C 0.0363 −1.6 2 (84)
Intestinal cancer stage IB 0.0055 −1.7 10 (58)
High-stage neuroblastoma 0.0076 −1.7 12 (86)
Infiltrating ductal mammary carcinoma 1.10×10⁻²⁷ −1.7 68 (87)
Pancreatic intraepithelial neoplasias of family X 0.0349 −1.7 7 (84)
Esophageal squamous cancer cell line 0.0021 −1.7 20 (88)
Brain tissue—glioblastoma tumors 1.40×10⁻⁵ −1.8 48 (89)
Glioblastomas brain tumors 1.50×10⁻⁷ −1.9 34 (49)
Low-stage neuroblastoma 0.0046 −1.9 6 (86)
Brain tumor tissues from patients with sonic hedgehog medulloblastoma 0.0034 −1.9 8 (90)
Brain tumor tissues from patients with posterior fossa group B ependymoma 1.20×10⁻⁹ −2.1 26 (90)
Brain tumor tissues from patients with posterior fossa group A ependymoma 7.00×10⁻¹⁰ −2.2 29 (90)
Molecular profiling of PBMC from T-cell LGL 0.001 −2.2 30 (91)
Pilocytic astrocytoma tumor 0.0319 −2.5 6 GSE12657
Brain tumor tissues from patients with atypical teratoid-rhabdoid tumor 1.20×10⁻⁹ −2.5 17 (90)
Brain tumor tissues from adult patients with high grade glioma 7.80×10⁻⁶ −2.6 7 (90)
Glioblastoma tumor 0.0138 −2.9 7 GSE12657
Hepatocellular carcinoma early stage tissue 0.0011 −3 13 (92)
Intrahepatic cholangiocarcinomas of proliferation subtype 0.0441 −3.4 92 (60)
Plasma cells from multiple myeloma patients 0.0009 −4.2 12 GSE9656
ESCC 0.001 −5.8 4 (93)
ESCC 5.90×10⁻¹² −21.6 3 (93)
ESCC tumor 5.70×10⁻²³ −37.3 3 (94)
FFPE, formalin-fixed paraffin-embedded; ChRCC, chromophobe renal cell carcinoma; ESCC, esophageal squamous cell carcinoma.
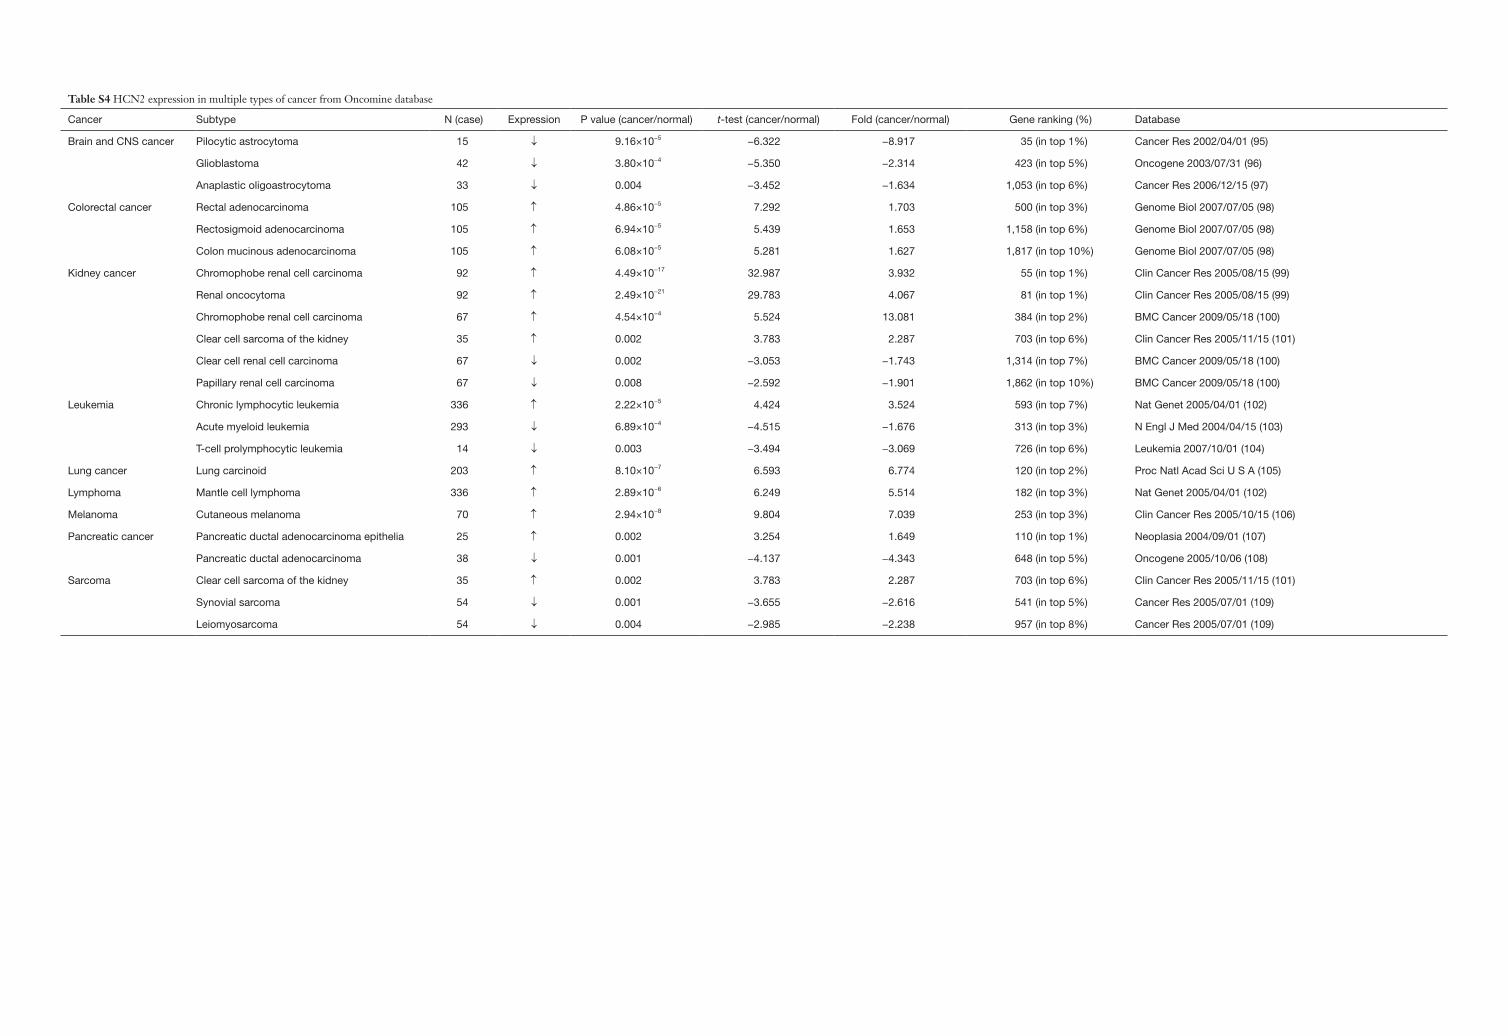
Table S4 HCN2 expression in multiple types of cancer from Oncomine database
Cancer Subtype N (case) Expression P value (cancer/normal) t-test (cancer/normal) Fold (cancer/normal) Gene ranking (%) Database
Brain and CNS cancer Pilocytic astrocytoma 15 ↓ 9.16×10⁻⁵ −6.322 −8.917 35 (in top 1%) Cancer Res 2002/04/01 (95)
Glioblastoma 42 ↓ 3.80×10⁻⁴ −5.350 −2.314 423 (in top 5%) Oncogene 2003/07/31 (96)
Anaplastic oligoastrocytoma 33 ↓ 0.004 −3.452 −1.634 1,053 (in top 6%) Cancer Res 2006/12/15 (97)
Colorectal cancer Rectal adenocarcinoma 105 ↑ 4.86×10⁻⁵ 7.292 1.703 500 (in top 3%) Genome Biol 2007/07/05 (98)
Rectosigmoid adenocarcinoma 105 ↑ 6.94×10⁻⁵ 5.439 1.653 1,158 (in top 6%) Genome Biol 2007/07/05 (98)
Colon mucinous adenocarcinoma 105 ↑ 6.08×10⁻⁵ 5.281 1.627 1,817 (in top 10%) Genome Biol 2007/07/05 (98)
Kidney cancer Chromophobe renal cell carcinoma 92 ↑ 4.49×10⁻¹⁷ 32.987 3.932 55 (in top 1%) Clin Cancer Res 2005/08/15 (99)
Renal oncocytoma 92 ↑ 2.49×10⁻²¹ 29.783 4.067 81 (in top 1%) Clin Cancer Res 2005/08/15 (99)
Chromophobe renal cell carcinoma 67 ↑ 4.54×10⁻⁴ 5.524 13.081 384 (in top 2%) BMC Cancer 2009/05/18 (100)
Clear cell sarcoma of the kidney 35 ↑ 0.002 3.783 2.287 703 (in top 6%) Clin Cancer Res 2005/11/15 (101)
Clear cell renal cell carcinoma 67 ↓ 0.002 −3.053 −1.743 1,314 (in top 7%) BMC Cancer 2009/05/18 (100)
Papillary renal cell carcinoma 67 ↓ 0.008 −2.592 −1.901 1,862 (in top 10%) BMC Cancer 2009/05/18 (100)
Leukemia Chronic lymphocytic leukemia 336 ↑ 2.22×10⁻⁵ 4.424 3.524 593 (in top 7%) Nat Genet 2005/04/01 (102)
Acute myeloid leukemia 293 ↓ 6.89×10⁻⁴ −4.515 −1.676 313 (in top 3%) N Engl J Med 2004/04/15 (103)
T-cell prolymphocytic leukemia 14 ↓ 0.003 −3.494 −3.069 726 (in top 6%) Leukemia 2007/10/01 (104)
Lung cancer Lung carcinoid 203 ↑ 8.10×10⁻⁷ 6.593 6.774 120 (in top 2%) Proc Natl Acad Sci U S A (105)
Lymphoma Mantle cell lymphoma 336 ↑ 2.89×10⁻⁶ 6.249 5.514 182 (in top 3%) Nat Genet 2005/04/01 (102)
Melanoma Cutaneous melanoma 70 ↑ 2.94×10⁻⁸ 9.804 7.039 253 (in top 3%) Clin Cancer Res 2005/10/15 (106)
Pancreatic cancer Pancreatic ductal adenocarcinoma epithelia 25 ↑ 0.002 3.254 1.649 110 (in top 1%) Neoplasia 2004/09/01 (107)
Pancreatic ductal adenocarcinoma 38 ↓ 0.001 −4.137 −4.343 648 (in top 5%) Oncogene 2005/10/06 (108)
Sarcoma Clear cell sarcoma of the kidney 35 ↑ 0.002 3.783 2.287 703 (in top 6%) Clin Cancer Res 2005/11/15 (101)
Synovial sarcoma 54 ↓ 0.001 −3.655 −2.616 541 (in top 5%) Cancer Res 2005/07/01 (109)
Leiomyosarcoma 54 ↓ 0.004 −2.985 −2.238 957 (in top 8%) Cancer Res 2005/07/01 (109)
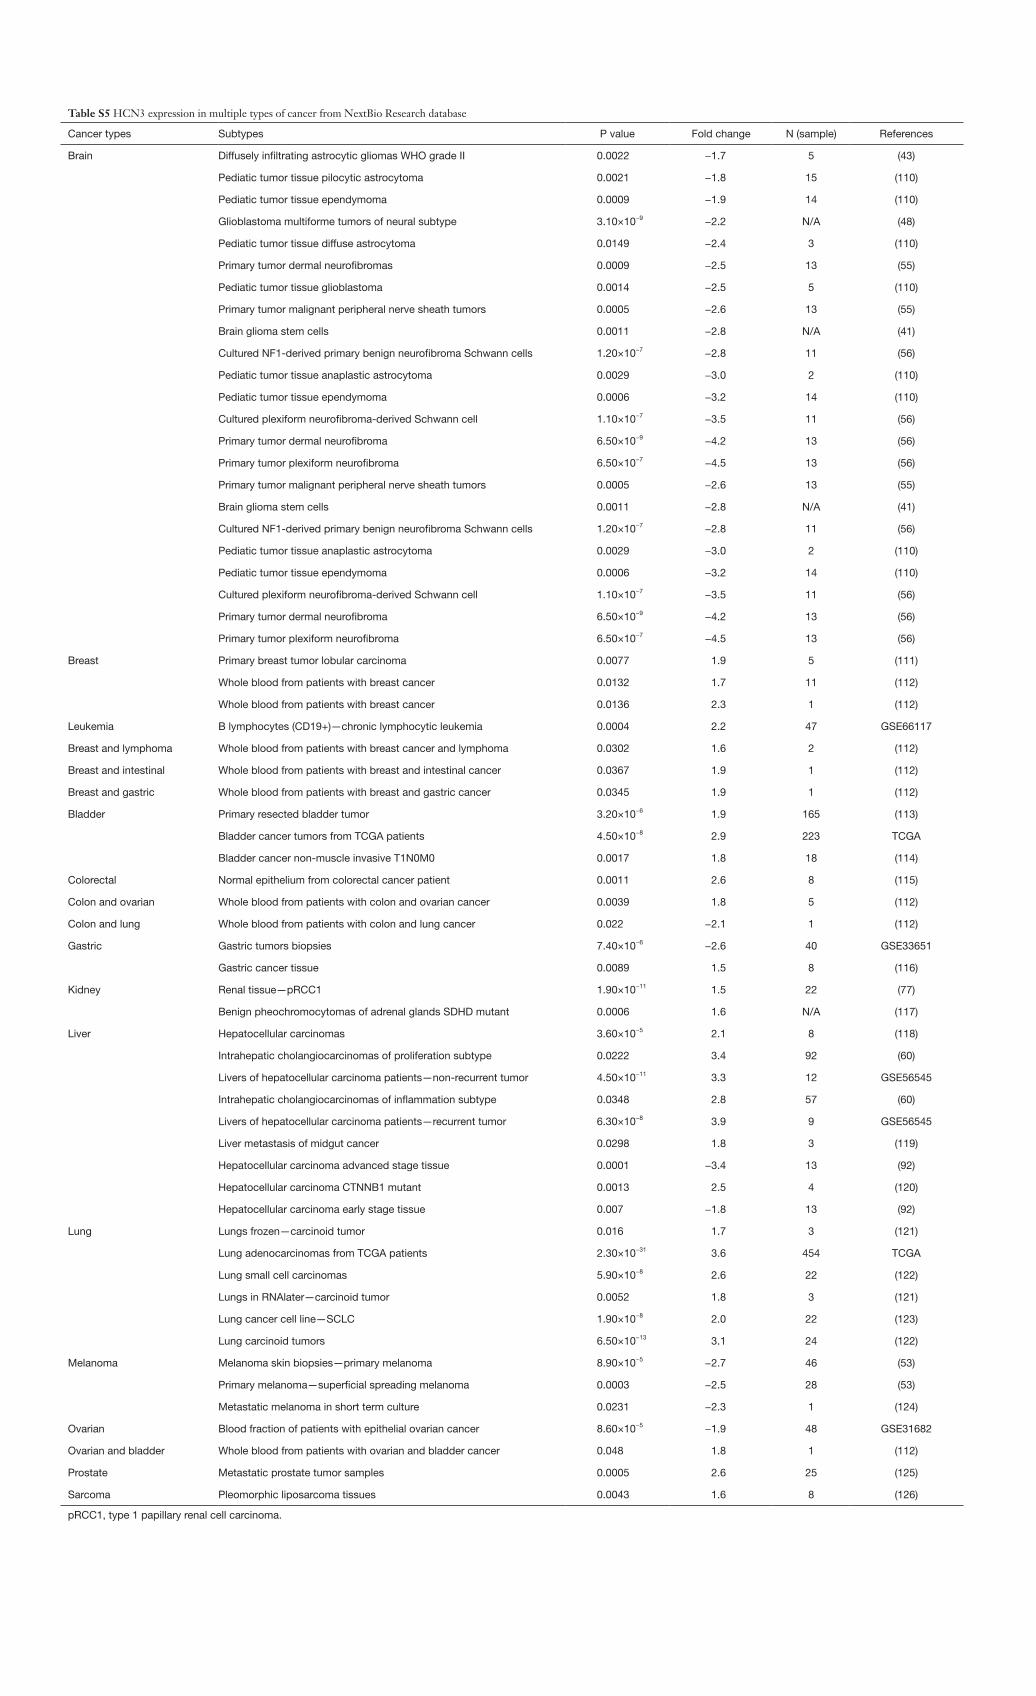
Table S5 HCN3 expression in multiple types of cancer from NextBio Research database
Cancer types Subtypes P value Fold change N (sample) References
Brain Diffusely infiltrating astrocytic gliomas WHO grade II 0.0022 −1.7 5 (43)
Pediatic tumor tissue pilocytic astrocytoma 0.0021 −1.8 15 (110)
Pediatic tumor tissue ependymoma 0.0009 −1.9 14 (110)
Glioblastoma multiforme tumors of neural subtype 3.10×10⁻⁹ −2.2 N/A (48)
Pediatic tumor tissue diffuse astrocytoma 0.0149 −2.4 3 (110)
Primary tumor dermal neurofibromas 0.0009 −2.5 13 (55)
Pediatic tumor tissue glioblastoma 0.0014 −2.5 5 (110)
Primary tumor malignant peripheral nerve sheath tumors 0.0005 −2.6 13 (55)
Brain glioma stem cells 0.0011 −2.8 N/A (41)
Cultured NF1-derived primary benign neurofibroma Schwann cells 1.20×10⁻⁷ −2.8 11 (56)
Pediatic tumor tissue anaplastic astrocytoma 0.0029 −3.0 2 (110)
Pediatic tumor tissue ependymoma 0.0006 −3.2 14 (110)
Cultured plexiform neurofibroma-derived Schwann cell 1.10×10⁻⁷ −3.5 11 (56)
Primary tumor dermal neurofibroma 6.50×10⁻⁹ −4.2 13 (56)
Primary tumor plexiform neurofibroma 6.50×10⁻⁷ −4.5 13 (56)
Breast Primary breast tumor lobular carcinoma 0.0077 1.9 5 (111)
Whole blood from patients with breast cancer 0.0132 1.7 11 (112)
Whole blood from patients with breast cancer 0.0136 2.3 1 (112)
Leukemia B lymphocytes (CD19+)—chronic lymphocytic leukemia 0.0004 2.2 47 GSE66117
Breast and lymphoma Whole blood from patients with breast cancer and lymphoma 0.0302 1.6 2 (112)
Breast and intestinal Whole blood from patients with breast and intestinal cancer 0.0367 1.9 1 (112)
Breast and gastric Whole blood from patients with breast and gastric cancer 0.0345 1.9 1 (112)
Bladder Primary resected bladder tumor 3.20×10⁻⁶ 1.9 165 (113)
Bladder cancer tumors from TCGA patients 4.50×10⁻⁸ 2.9 223 TCGA
Bladder cancer non-muscle invasive T1N0M0 0.0017 1.8 18 (114)
Colorectal Normal epithelium from colorectal cancer patient 0.0011 2.6 8 (115)
Colon and ovarian Whole blood from patients with colon and ovarian cancer 0.0039 1.8 5 (112)
Colon and lung Whole blood from patients with colon and lung cancer 0.022 −2.1 1 (112)
Gastric Gastric tumors biopsies 7.40×10⁻⁶ −2.6 40 GSE33651
Gastric cancer tissue 0.0089 1.5 8 (116)
Kidney Renal tissue—pRCC1 1.90×10⁻¹¹ 1.5 22 (77)
Benign pheochromocytomas of adrenal glands SDHD mutant 0.0006 1.6 N/A (117)
Liver Hepatocellular carcinomas 3.60×10⁻⁵ 2.1 8 (118)
Intrahepatic cholangiocarcinomas of proliferation subtype 0.0222 3.4 92 (60)
Livers of hepatocellular carcinoma patients—non-recurrent tumor 4.50×10⁻¹¹ 3.3 12 GSE56545
Intrahepatic cholangiocarcinomas of inflammation subtype 0.0348 2.8 57 (60)
Livers of hepatocellular carcinoma patients—recurrent tumor 6.30×10⁻⁸ 3.9 9 GSE56545
Liver metastasis of midgut cancer 0.0298 1.8 3 (119)
Hepatocellular carcinoma advanced stage tissue 0.0001 −3.4 13 (92)
Hepatocellular carcinoma CTNNB1 mutant 0.0013 2.5 4 (120)
Hepatocellular carcinoma early stage tissue 0.007 −1.8 13 (92)
Lung Lungs frozen—carcinoid tumor 0.016 1.7 3 (121)
Lung adenocarcinomas from TCGA patients 2.30×10⁻³¹ 3.6 454 TCGA
Lung small cell carcinomas 5.90×10⁻⁸ 2.6 22 (122)
Lungs in RNAlater—carcinoid tumor 0.0052 1.8 3 (121)
Lung cancer cell line—SCLC 1.90×10⁻⁸ 2.0 22 (123)
Lung carcinoid tumors 6.50×10⁻¹³ 3.1 24 (122)
Melanoma Melanoma skin biopsies—primary melanoma 8.90×10⁻⁵ −2.7 46 (53)
Primary melanoma—superficial spreading melanoma 0.0003 −2.5 28 (53)
Metastatic melanoma in short term culture 0.0231 −2.3 1 (124)
Ovarian Blood fraction of patients with epithelial ovarian cancer 8.60×10⁻⁵ −1.9 48 GSE31682
Ovarian and bladder Whole blood from patients with ovarian and bladder cancer 0.048 1.8 1 (112)
Prostate Metastatic prostate tumor samples 0.0005 2.6 25 (125)
Sarcoma Pleomorphic liposarcoma tissues 0.0043 1.6 8 (126)
pRCC1, type 1 papillary renal cell carcinoma.
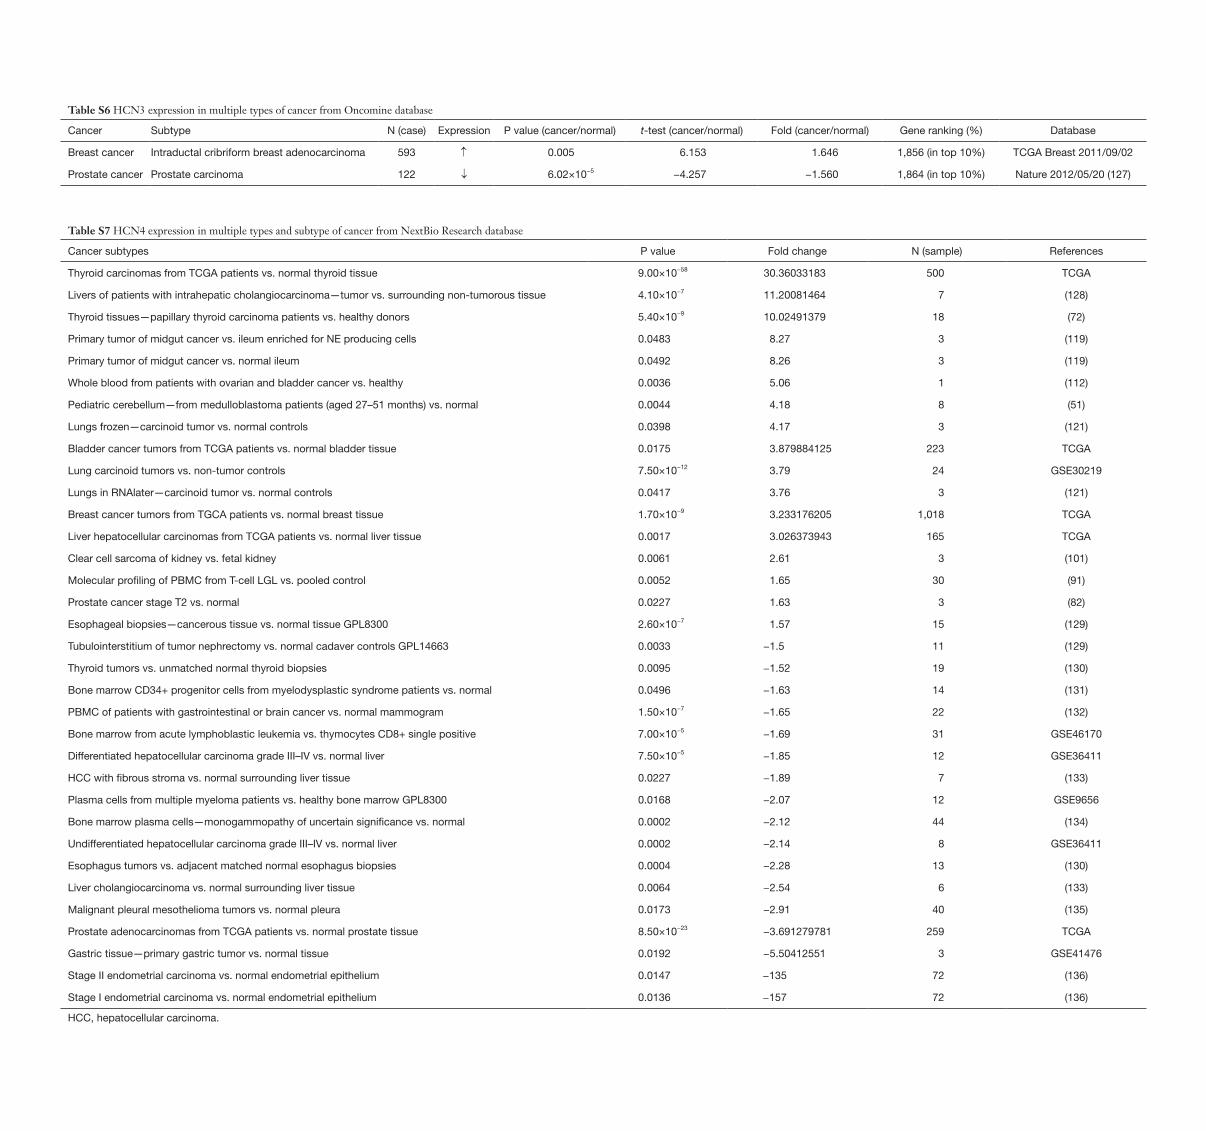
Table S6 HCN3 expression in multiple types of cancer from Oncomine database
Cancer Subtype N (case) Expression P value (cancer/normal) t-test (cancer/normal) Fold (cancer/normal) Gene ranking (%) Database
Breast cancer Intraductal cribriform breast adenocarcinoma 593 ↑ 0.005 6.153 1.646 1,856 (in top 10%) TCGA Breast 2011/09/02
Prostate cancer Prostate carcinoma 122 ↓ 6.02×10⁻⁵ −4.257 −1.560 1,864 (in top 10%) Nature 2012/05/20 (127)
Table S7 HCN4 expression in multiple types and subtype of cancer from NextBio Research database
Cancer subtypes P value Fold change N (sample) References
Thyroid carcinomas from TCGA patients vs. normal thyroid tissue 9.00×10−58 30.36033183 500 TCGA
Livers of patients with intrahepatic cholangiocarcinoma—tumor vs. surrounding non-tumorous tissue 4.10×10⁻⁷ 11.20081464 7 (128)
Thyroid tissues—papillary thyroid carcinoma patients vs. healthy donors 5.40×10⁻⁹ 10.02491379 18 (72)
Primary tumor of midgut cancer vs. ileum enriched for NE producing cells 0.0483 8.27 3 (119)
Primary tumor of midgut cancer vs. normal ileum 0.0492 8.26 3 (119)
Whole blood from patients with ovarian and bladder cancer vs. healthy 0.0036 5.06 1 (112)
Pediatric cerebellum—from medulloblastoma patients (aged 27–51 months) vs. normal 0.0044 4.18 8 (51)
Lungs frozen—carcinoid tumor vs. normal controls 0.0398 4.17 3 (121)
Bladder cancer tumors from TCGA patients vs. normal bladder tissue 0.0175 3.879884125 223 TCGA
Lung carcinoid tumors vs. non-tumor controls 7.50×10⁻¹² 3.79 24 GSE30219
Lungs in RNAlater—carcinoid tumor vs. normal controls 0.0417 3.76 3 (121)
Breast cancer tumors from TGCA patients vs. normal breast tissue 1.70×10⁻⁹ 3.233176205 1,018 TCGA
Liver hepatocellular carcinomas from TCGA patients vs. normal liver tissue 0.0017 3.026373943 165 TCGA
Clear cell sarcoma of kidney vs. fetal kidney 0.0061 2.61 3 (101)
Molecular profiling of PBMC from T-cell LGL vs. pooled control 0.0052 1.65 30 (91)
Prostate cancer stage T2 vs. normal 0.0227 1.63 3 (82)
Esophageal biopsies—cancerous tissue vs. normal tissue GPL8300 2.60×10⁻⁷ 1.57 15 (129)
Tubulointerstitium of tumor nephrectomy vs. normal cadaver controls GPL14663 0.0033 −1.5 11 (129)
Thyroid tumors vs. unmatched normal thyroid biopsies 0.0095 −1.52 19 (130)
Bone marrow CD34+ progenitor cells from myelodysplastic syndrome patients vs. normal 0.0496 −1.63 14 (131)
PBMC of patients with gastrointestinal or brain cancer vs. normal mammogram 1.50×10⁻⁷ −1.65 22 (132)
Bone marrow from acute lymphoblastic leukemia vs. thymocytes CD8+ single positive 7.00×10⁻⁵ −1.69 31 GSE46170
Differentiated hepatocellular carcinoma grade III–IV vs. normal liver 7.50×10⁻⁵ −1.85 12 GSE36411
HCC with fibrous stroma vs. normal surrounding liver tissue 0.0227 −1.89 7 (133)
Plasma cells from multiple myeloma patients vs. healthy bone marrow GPL8300 0.0168 −2.07 12 GSE9656
Bone marrow plasma cells—monogammopathy of uncertain significance vs. normal 0.0002 −2.12 44 (134)
Undifferentiated hepatocellular carcinoma grade III–IV vs. normal liver 0.0002 −2.14 8 GSE36411
Esophagus tumors vs. adjacent matched normal esophagus biopsies 0.0004 −2.28 13 (130)
Liver cholangiocarcinoma vs. normal surrounding liver tissue 0.0064 −2.54 6 (133)
Malignant pleural mesothelioma tumors vs. normal pleura 0.0173 −2.91 40 (135)
Prostate adenocarcinomas from TCGA patients vs. normal prostate tissue 8.50×10⁻²³ −3.691279781 259 TCGA
Gastric tissue—primary gastric tumor vs. normal tissue 0.0192 −5.50412551 3 GSE41476
Stage II endometrial carcinoma vs. normal endometrial epithelium 0.0147 −135 72 (136)
Stage I endometrial carcinoma vs. normal endometrial epithelium 0.0136 −157 72 (136)
HCC, hepatocellular carcinoma.
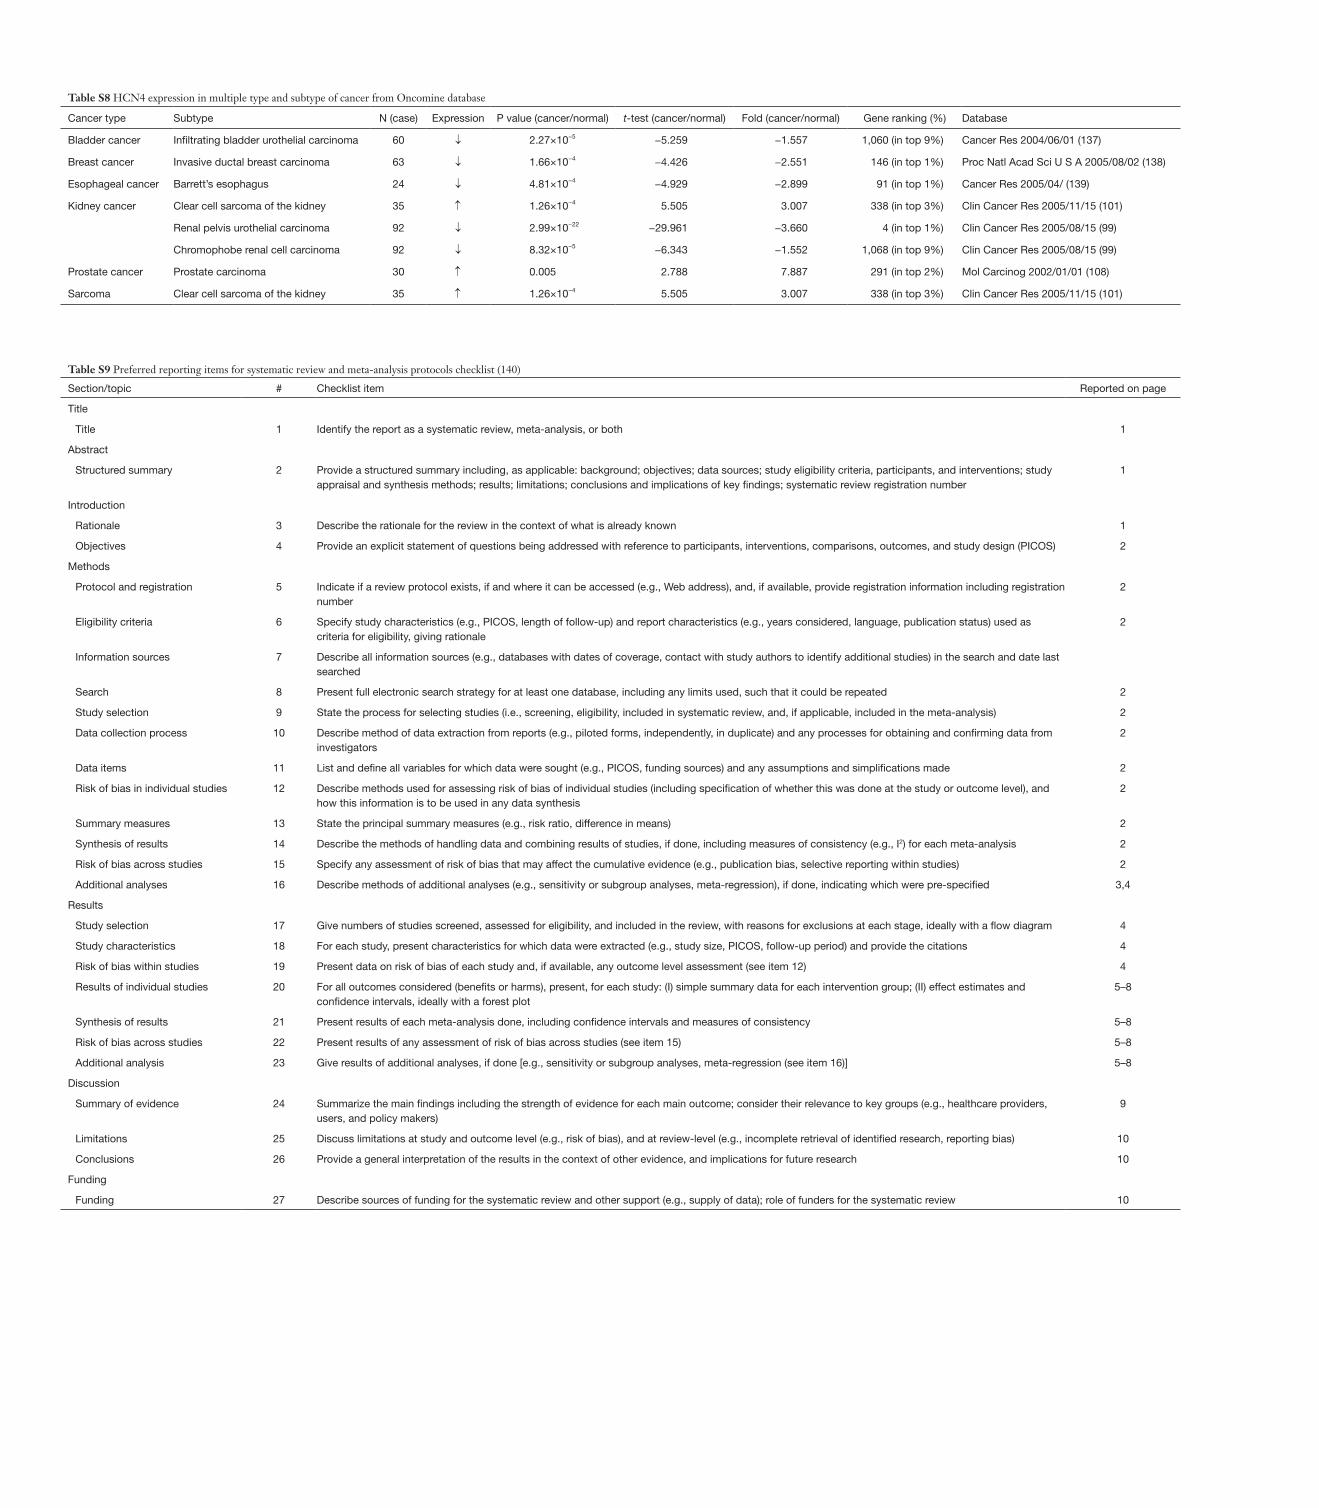
Table S8 HCN4 expression in multiple type and subtype of cancer from Oncomine database
Cancer type Subtype N (case) Expression P value (cancer/normal) t-test (cancer/normal) Fold (cancer/normal) Gene ranking (%) Database
Bladder cancer Infiltrating bladder urothelial carcinoma 60 ↓ 2.27×10⁻⁵ −5.259 −1.557 1,060 (in top 9%) Cancer Res 2004/06/01 (137)
Breast cancer Invasive ductal breast carcinoma 63 ↓ 1.66×10⁻⁴ −4.426 −2.551 146 (in top 1%) Proc Natl Acad Sci U S A 2005/08/02 (138)
Esophageal cancer Barrett’s esophagus 24 ↓ 4.81×10⁻⁴ −4.929 −2.899 91 (in top 1%) Cancer Res 2005/04/ (139)
Kidney cancer Clear cell sarcoma of the kidney 35 ↑ 1.26×10⁻⁴ 5.505 3.007 338 (in top 3%) Clin Cancer Res 2005/11/15 (101)
Renal pelvis urothelial carcinoma 92 ↓ 2.99×10⁻²² −29.961 −3.660 4 (in top 1%) Clin Cancer Res 2005/08/15 (99)
Chromophobe renal cell carcinoma 92 ↓ 8.32×10⁻⁵ −6.343 −1.552 1,068 (in top 9%) Clin Cancer Res 2005/08/15 (99)
Prostate cancer Prostate carcinoma 30 ↑ 0.005 2.788 7.887 291 (in top 2%) Mol Carcinog 2002/01/01 (108)
Sarcoma Clear cell sarcoma of the kidney 35 ↑ 1.26×10⁻⁴ 5.505 3.007 338 (in top 3%) Clin Cancer Res 2005/11/15 (101)
Table S9 Preferred reporting items for systematic review and meta-analysis protocols checklist (140)
Section/topic # Checklist item Reported on page
Title
Title 1 Identify the report as a systematic review, meta-analysis, or both 1
Abstract
Structured summary 2 Provide a structured summary including, as applicable: background; objectives; data sources; study eligibility criteria, participants, and interventions; study appraisal and synthesis methods; results; limitations; conclusions and implications of key findings; systematic review registration number
1
Introduction
Rationale 3 Describe the rationale for the review in the context of what is already known 1
Objectives 4 Provide an explicit statement of questions being addressed with reference to participants, interventions, comparisons, outcomes, and study design (PICOS) 2
Methods
Protocol and registration 5 Indicate if a review protocol exists, if and where it can be accessed (e.g., Web address), and, if available, provide registration information including registration number
2
Eligibility criteria 6 Specify study characteristics (e.g., PICOS, length of follow-up) and report characteristics (e.g., years considered, language, publication status) used as criteria for eligibility, giving rationale
2
Information sources 7 Describe all information sources (e.g., databases with dates of coverage, contact with study authors to identify additional studies) in the search and date last searched
Search 8 Present full electronic search strategy for at least one database, including any limits used, such that it could be repeated 2
Study selection 9 State the process for selecting studies (i.e., screening, eligibility, included in systematic review, and, if applicable, included in the meta-analysis) 2
Data collection process 10 Describe method of data extraction from reports (e.g., piloted forms, independently, in duplicate) and any processes for obtaining and confirming data from investigators
2
Data items 11 List and define all variables for which data were sought (e.g., PICOS, funding sources) and any assumptions and simplifications made 2
Risk of bias in individual studies 12 Describe methods used for assessing risk of bias of individual studies (including specification of whether this was done at the study or outcome level), and how this information is to be used in any data synthesis
2
Summary measures 13 State the principal summary measures (e.g., risk ratio, difference in means) 2
Synthesis of results 14 Describe the methods of handling data and combining results of studies, if done, including measures of consistency (e.g., I2) for each meta-analysis 2
Risk of bias across studies 15 Specify any assessment of risk of bias that may affect the cumulative evidence (e.g., publication bias, selective reporting within studies) 2
Additional analyses 16 Describe methods of additional analyses (e.g., sensitivity or subgroup analyses, meta-regression), if done, indicating which were pre-specified 3,4
Results
Study selection 17 Give numbers of studies screened, assessed for eligibility, and included in the review, with reasons for exclusions at each stage, ideally with a flow diagram 4
Study characteristics 18 For each study, present characteristics for which data were extracted (e.g., study size, PICOS, follow-up period) and provide the citations 4
Risk of bias within studies 19 Present data on risk of bias of each study and, if available, any outcome level assessment (see item 12) 4
Results of individual studies 20 For all outcomes considered (benefits or harms), present, for each study: (I) simple summary data for each intervention group; (II) effect estimates and confidence intervals, ideally with a forest plot
5–8
Synthesis of results 21 Present results of each meta-analysis done, including confidence intervals and measures of consistency 5–8
Risk of bias across studies 22 Present results of any assessment of risk of bias across studies (see item 15) 5–8
Additional analysis 23 Give results of additional analyses, if done [e.g., sensitivity or subgroup analyses, meta-regression (see item 16)] 5–8
Discussion
Summary of evidence 24 Summarize the main findings including the strength of evidence for each main outcome; consider their relevance to key groups (e.g., healthcare providers, users, and policy makers)
9
Limitations 25 Discuss limitations at study and outcome level (e.g., risk of bias), and at review-level (e.g., incomplete retrieval of identified research, reporting bias) 10
Conclusions 26 Provide a general interpretation of the results in the context of other evidence, and implications for future research 10
Funding
Funding 27 Describe sources of funding for the systematic review and other support (e.g., supply of data); role of funders for the systematic review 10
References
37. LiuZ,XieM,YaoZ,etal.Threemeta-analysesdefinea set of commonly overexpressed genes from microarray datasets on astrocytomas. Mol Neurobiol 2013;47:325-36.
38. Cai Y, Zhong X, Wang Y, et al. Screening feature genes of astrocytoma using a combined method of microarray gene expressionprofilingandbioinformaticsanalysis.IntJClinExp Med 2015;8:18004.
39. Etcheverry A, Aubry M, De Tayrac M, et al. DNA methylation in glioblastoma: impact on gene expression and clinical outcome. BMC Genomics 2010;11:701.
40. Sun L, Hui AM, Su Q, et al. Neuronal and glioma-derived stem cell factor induces angiogenesis within the brain. Cancer Cell 2006;9:287-300.
41. LiuS,YinF,ZhangJ,etal.RegulatoryrolesofmiRNAinthe human neural stem cell transformation to glioma stem cells.JCellBiochem2014;115:1368-80.
42. MadhavanS,ZenklusenJC,KotliarovY,etal.Rembrandt:helping personalized medicine become a reality through integrative translational research. Mol Cancer Res 2009;7:157-67.
43. LiuZ,YaoZ,LiC,etal.Geneexpressionprofilinginhuman high-grade astrocytomas. Comp Funct Genomics 2011;2011:245137.
44. Zhao X, Liu Z, Yu L, et al. Global gene expression profilingconfirmsthemolecularfidelityofprimarytumor-based orthotopic xenograft mouse models of medulloblastoma. Neuro Oncol 2012;14:574-83.
45. PollardSM,YoshikawaK,ClarkeID,etal.Gliomastemcelllinesexpandedinadherentculturehavetumor-specificphenotypes and are suitable for chemical and genetic screens. Cell stem cell 2009;4:568-80.
46. TayracMd,EtcheverryA,AubryM,etal.Integrativegenome-wide analysis reveals a robust genomic glioblastoma signature associated with copy number driving changes in gene expression. Genes Chromosomes Cancer 2009;48:55-68.
47. Liang Y, Diehn M, Watson N, et al. Gene expression profilingrevealsmolecularlyandclinicallydistinctsubtypes of glioblastoma multiforme. Proc Natl Acad Sci U S A 2005;102:5814-9.
48. McLendon R, Friedman A, Bigner D, et al. Comprehensive genomiccharacterizationdefineshumanglioblastomagenes and core pathways. Nature 2008;455:1061-8.
49. GriesingerAM,BirksDK,DonsonAM,etal.Characterization of distinct immunophenotypes across pediatricbraintumortypes.JImmunol2013;191:4880-8.
50. BirksDK,DonsonAM,PatelPR,etal.Pediatricrhabdoid
tumors of kidney and brain show many differences in gene expression but share dysregulation of cell cycle and epigenetic effector genes. Pediatr Blood Cancer 2013;60:1095-102.
51. Valdora F, Banelli B, Stigliani S, et al. Epigenetic silencingofDKK3inmedulloblastoma.IntJMolSci2013;14:7492-505.
52. Lambert SR, Witt H, Hovestadt V, et al. Differential expression and methylation of brain developmental genes definelocation-specificsubsetsofpilocyticastrocytoma.Acta Neuropathol 2013;126:291-301.
53. RaskinL,FullenDR,GiordanoTJ,etal.TranscriptomeprofilingidentifiesHMGA2asabiomarkerofmelanomaprogressionandprognosis.JInvestDermatol2013;133:2585-92.
54. ŁastowskaM,VipreyV,Santibanez-KorefM,etal.Identificationofcandidategenesinvolvedinneuroblastoma progression by combining genomic and expression microarrays with survival data. Oncogene 2007;26:7432-44.
55. JessenWJ,MillerSJ,JousmaE,etal.MEKinhibitionexhibitsefficacyinhumanandmouseneurofibromatosistumors.JClinInvest2013;123:340-7.
56. MillerSJ,JessenWJ,MehtaT,etal.IntegrativegenomicanalysesofneurofibromatosistumoursidentifySOX9as a biomarker and survival gene. EMBO Mol Med 2009;1:236-48.
57. Harms PW, Patel RM, Verhaegen ME, et al. Distinct gene expressionprofilesofviral-andnonviral-associatedmerkelcellcarcinomarevealedbytranscriptomeanalysis.JInvestDermatol 2013;133:936-45.
58. Chen X, Leung SY, Yuen ST, et al. Variation in gene expression patterns in human gastric cancers. Mol Biol Cell 2003;14:3208-15.
59. NeumannO,KesselmeierM,GeffersR,etal.MethylomeanalysisandintegrativeprofilingofhumanHCCsidentifynovel protumorigenic factors. Hepatology 2012;56:1817-27.
60. SiaD,HoshidaY,VillanuevaA,etal.Integrativemolecularanalysis of intrahepatic cholangiocarcinoma reveals 2 classes that have different outcomes. Gastroenterology 2013;144:829-40.
61. JerezA,ClementeMJ,MakishimaH,etal.STAT3mutations unify the pathogenesis of chronic lymphoproliferativedisordersofNKcellsandT-celllargegranular lymphocyte leukemia. Blood 2012;120:3048-57.
62. AprilC,KlotzleB,RoyceT,etal.Whole-genomegeneexpressionprofilingofformalin-fixed,paraffin-embeddedtissue samples. PLoS One 2009;4:e8162.
63. Frampton AE, Castellano L, Colombo T, et al.
MicroRNAs cooperatively inhibit a network of tumor suppressor genes to promote pancreatic tumor growth and progression. Gastroenterology 2014;146:268-77.e18.
64. BredelM,BredelC,JuricD,etal.Functionalnetworkanalysis reveals extended gliomagenesis pathway maps and three novel MYC-interacting genes in human gliomas. Cancer Res 2005;65:8679-89.
65. Murat A, Migliavacca E, Gorlia T, et al. Stem cell–related “self-renewal” signature and high epidermal growth factor receptor expression associated with resistance to concomitantchemoradiotherapyinglioblastoma.JClinOncol 2008;26:3015-24.
66. GlückS,RossJS,RoyceM,etal.TP53genomicspredict higher clinical and pathologic tumor response in operable early-stage breast cancer treated with docetaxel-capecitabine±trastuzumab. Breast Cancer Res Treat 2012;132:781-91.
67. StorzMN,vandeRijnM,KimYH,etal.GeneexpressionprofilesofcutaneousBcelllymphoma.JInvestDermatol2003;120:865-70.
68. Piccaluga PP, Agostinelli C, Califano A, et al. Gene expression analysis of peripheral T cell lymphoma, unspecified,revealsdistinctprofilesandnewpotentialtherapeutictargets.JClinInvest2007;117:823.
69. RikerAI,EnkemannSA,FodstadO,etal.Thegeneexpressionprofilesofprimaryandmetastaticmelanomayields a transition point of tumor progression and metastasis. BMC Med Genomics 2008;1:13.
70. Huang Q, Lin B, Liu H, et al. RNA-Seq analyses generate comprehensive transcriptomic landscape and reveal complex transcript patterns in hepatocellular carcinoma. PLoS One 2011;6:e26168.
71. SpergerJM,ChenX,DraperJS,etal.Geneexpressionpatterns in human embryonic stem cells and human pluripotent germ cell tumors. Proc Natl Acad Sci U S A 2003;100:13350-5.
72. Costa V, Esposito R, Ziviello C, et al. New somatic mutationsandWNK1-B4GALNT3genefusioninpapillary thyroid carcinoma. Oncotarget 2015;6:11242.
73. LiL,WeiY,ToC,etal.Integratedomicanalysisoflungcancer reveals metabolism proteome signatures with prognostic impact. Nat Commun 2014;5:5469.
74. KortEJ,FarberL,TretiakovaM,etal.TheE2F3-Oncomir-1 axis is activated in Wilms' tumor. Cancer Res 2008;68:4034-8.
75. HuK,YuJ,SuknunthaK,etal.Efficientgenerationoftransgene-free induced pluripotent stem cells from normal and neoplastic bone marrow and cord blood mononuclear cells. Blood 2011;117:e109-19.
76. ParkM,KimM,HwangD,etal.Characterizationofgene expression and activated signaling pathways in solid-pseudopapillary neoplasm of pancreas. Mod Pathol 2014;27:580-93.
77. OoiA,WongJC,PetilloD,etal.Anantioxidantresponsephenotype shared between hereditary and sporadic type 2 papillary renal cell carcinoma. Cancer Cell 2011;20:511-23.
78. HoekK,RimmDL,WilliamsKR,etal.Expressionprofilingrevealsnovelpathwaysinthetransformationofmelanocytes to melanomas. Cancer Res 2004;64:5270-82.
79. Eckerle S, Brune V, Döring C, et al. Gene expression profilingofisolatedtumourcellsfromanaplasticlargecelllymphomas: insights into its cellular origin, pathogenesis and relation to Hodgkin lymphoma. Leukemia 2009;23:2129-38.
80. BruneV,TiacciE,PfeilI,etal.Originandpathogenesisof nodular lymphocyte–predominant Hodgkin lymphoma asrevealedbyglobalgeneexpressionanalysis.JExpMed2008;205:2251-68.
81. Mailloux AW, Zhang L, Moscinski L, et al. Fibrosis and Subsequent Cytopenias Are Associated with Basic FibroblastGrowthFactor–DeficientPluripotentMesenchymal Stromal Cells in Large Granular LymphocyteLeukemia.JImmunol2013;191:3578-93.
82. LapointeJ,LiC,HigginsJP,etal.Geneexpressionprofilingidentifiesclinicallyrelevantsubtypesofprostatecancer. Proc Natl Acad Sci U S A 2004;101:811-6.
83. ParkerJS,MullinsM,CheangMC,etal.Supervisedriskpredictorofbreastcancerbasedonintrinsicsubtypes.JClin Oncol 2009;27:1160-7.
84. Crnogorac-JurcevicT,ChelalaC,BarryS,etal.Molecularanalysis of precursor lesions in familial pancreatic cancer. PLoS One 2013;8:e54830.
85. Hu Z, Fan C, Livasy C, et al. A compact VEGF signature associated with distant metastases and poor outcomes. BMC Med 2009;7:9.
86. DePreterK,VandesompeleJ,HeimannP,etal.Humanfetal neuroblast and neuroblastoma transcriptome analysis confirmsneuroblastoriginandhighlightsneuroblastomacandidate genes. Genome Biol 2006;7:R84.
87. UvaP,AurisicchioL,WattersJ,etal.Comparativeexpression pathway analysis of human and canine mammary tumors. BMC Genomics 2009;10:135.
88. ShimokuniT,TanimotoK,HiyamaK,etal.Chemosensitivity prediction in esophageal squamous cell carcinoma:novelmarkergenesandefficacy-predictionformulaeusingtheirexpressiondata.IntJOncol2006;28:1153-62.
89. JoyA,RameshA,SmirnovI,etal.AKTpathwaygenes
define5prognosticsubgroupsinglioblastoma.PLoSOne2014;9:e100827.
90. GriesingerAM,JosephsonRJ,DonsonAM,etal.Interleukin-6/STAT3pathwaysignalingdrivesaninflammatoryphenotypeinGroupAependymoma.CancerImmunolRes2015;3:1165-74.
91. ShahMV,ZhangR,IrbyR,etal.MolecularprofilingofLGL leukemia reveals role of sphingolipid signaling in survival of cytotoxic lymphocytes. Blood 2008;112:770-81.
92. YuanSX,WangJ,YangF,etal.LongnoncodingRNADANCR increases stemness features of hepatocellular carcinoma by derepression of CTNNB1. Hepatology 2016;63:499-511.
93. TongM,ChanKW,BaoJY,etal.Rab25isatumorsuppressor gene with antiangiogenic and anti-invasive activities in esophageal squamous cell carcinoma. Cancer Res 2012;72:6024-35.
94. WeiG,LuoH,SunY,etal.Transcriptomeprofilingof esophageal squamous cell carcinoma reveals a long noncoding RNA acting as a tumor suppressor. Oncotarget 2015;6:17065.
95. GutmannDH,HedrickNM,LiJ,etal.Comparativegeneexpressionprofileanalysisofneurofibromatosis1-associated and sporadic pilocytic astrocytomas. Cancer Res 2002;62:2085-91.
96. ShaiR,ShiT,KremenTJ,etal.Geneexpressionprofilingidentifiesmolecularsubtypesofgliomas.Oncogene2003;22:4918-23.
97. FrenchPJ,SwagemakersSM,NagelJH,etal.Geneexpressionprofilesassociatedwithtreatmentresponseinoligodendrogliomas. Cancer Res 2005;65:11335-44.
98. KaiserS,ParkYK,FranklinJL,etal.Transcriptionalrecapitulation and subversion of embryonic colon development by mouse colon tumor models and human colon cancer. Genome Biol 2007;8:R131.
99. JonesJ,OtuH,SpentzosD,etal.Genesignaturesofprogression and metastasis in renal cell cancer. Clin Cancer Res 2005;11:5730-9.
100.YusenkoMV,KuiperRP,BoetheT,etal.High-resolutionDNA copy number and gene expression analyses distinguish chromophobe renal cell carcinomas and renal oncocytomas. BMC Cancer 2009;9:152.
101.CutcliffeC,KerseyD,HuangCC,etal.Clearcellsarcoma of the kidney: up-regulation of neural markers with activation of the sonic hedgehog and Akt pathways. Clin Cancer Res 2005;11:7986-94.
102.BassoK,MargolinAA,StolovitzkyG,etal.Reverseengineering of regulatory networks in human B cells. Nat Genet 2005;37:382-90.
103.ValkPJ,VerhaakRG,BeijenMA,etal.Prognosticallyusefulgene-expressionprofilesinacutemyeloidleukemia.NEnglJMed2004;350:1617-28.
104.DürigJ,BugS,Klein-HitpassL,etal.Combinedsingle nucleotide polymorphism-based genomic mappingandglobalgeneexpressionprofilingidentifiesnovel chromosomal imbalances, mechanisms and candidate genes important in the pathogenesis of T-cell prolymphocytic leukemia with inv (14)(q11q32). Leukemia 2007;21:2153-63.
105.BhattacharjeeA,RichardsWG,StauntonJ,etal.ClassificationofhumanlungcarcinomasbymRNAexpressionprofilingrevealsdistinctadenocarcinomasubclasses. Proc Natl Acad Sci U S A 2001;98:13790-5.
106.TalantovD,MazumderA,JackXY,etal.Novelgenesassociated with malignant melanoma but not benign melanocytic lesions. Clin Cancer Res 2005;11:7234-42.
107. Grützmann R, Pilarsky C, Ammerpohl O, et al. Gene expressionprofilingofmicrodissectedpancreaticductalcarcinomas using high-density DNA microarrays. Neoplasia 2004;6:611-22.
108. Buchholz M, Braun M, Heidenblut A, et al. Transcriptome analysis of microdissected pancreatic intraepithelial neoplastic lesions. Oncogene 2005;24:6626-36.
109.DetwillerKY,FernandoNT,SegalNH,etal.Analysisofhypoxia-related gene expression in sarcomas and effect of hypoxia on RNA interference of vascular endothelial cell growth factor A. Cancer Res 2005;65:5881-9.
110. Henriquez NV, Forshew T, Tatevossian R, et al. Comparative expression analysis reveals lineage relationships between human and murine gliomas and a dominance of glial signatures during tumor propagation in vitro. Cancer Res 2013;73:5834-44.
111. Romero A, Martín M, Oliva B, et al. Glutathione S-transferase P1 c.313A > G polymorphism could be useful in the prediction of doxorubicin response in breast cancer patients. Ann Oncol 2012;23:1750-6.
112. Stathopoulos GP, Armakolas A. Differences in gene expression between individuals with multiple primary andsingleprimarymalignancies.IntJMolMed2009;24:613-22.
113.KimWJ,KimEJ,KimSK,etal.Predictivevalueofprogression-relatedgeneclassifierinprimarynon-muscleinvasive bladder cancer. Mol Cancer 2010;9:3.
114.KimYJ,YoonHY,KimJS,etal.HOXA9,ISL1andALDH1A3 methylation patterns as prognostic markers for nonmuscle invasive bladder cancer: Array-based DNAmethylationandexpressionprofiling.IntJCancer2013;133:1135-42.
115. Abba M, Laufs S, Aghajany M, et al. Look who’s talking: deregulated signaling in colorectal cancer. Cancer Genomics Proteomics 2012;9:15-25.
116.EmaA,WarayaM,YamashitaK,etal.IdentificationofEGFR expression status association with metastatic lymph node density (ND) by expression microarray analysis of advanced gastric cancer. Cancer Med 2015;4:90-100.
117. Yang C, Zhuang Z, Fliedner SM, et al. Germ-line PHD1 and PHD2 mutations detected in patients with pheochromocytoma/paraganglioma-polycythemia.JMolMed 2015;93:93-104.
118. Gao F, Liang H, Lu H, et al. Global analysis of DNA methylation in hepatocellular carcinoma by a liquid hybridizationcapture-basedbisulfitesequencingapproach.Clin Epigenetics 2015;7:86.
119.LejaJ,EssaghirA,EssandM,etal.Novelmarkersforenterochromaffincellsandgastrointestinalneuroendocrinecarcinomas. Mod Pathol 2009;22:261-72.
120. Ding X, Yang Y, Han B, et al. Transcriptomic characterization of hepatocellular carcinoma with CTNNB1 mutation. PLoS One 2014;9:e95307.
121.KadaraH,FujimotoJ,YooSY,etal.Transcriptomicarchitectureoftheadjacentairwayfieldcancerizationinnon–smallcelllungcancer.JNatlCancerInst2014;106:dju004.
122.RousseauxS,DebernardiA,JacquiauB,etal.Ectopicactivationofgermlineandplacentalgenesidentifiesaggressive metastasis-prone lung cancers. Sci Transl Med 2013;5:186ra66.
123. Lockwood WW, Chari R, Coe BP, et al. DNA amplificationisaubiquitousmechanismofoncogeneactivation in lung and other cancers. Oncogene 2008;27:4615-24.
124.SmithAP,HoekK,BeckerD.Whole-genomeexpressionprofilingofthemelanomaprogressionpathwayrevealsmarkedmoleculardifferencesbetweennevi/melanomain situ and advanced-stage melanomas. Cancer Biol Ther 2005;4:1018-29.
125. Chandran UR, Ma C, Dhir R, et al. Gene expression profilesofprostatecancerrevealinvolvementofmultiplemolecular pathways in the metastatic process. BMC Cancer 2007;7:64.
126.RennerM,WolfT,MeyerH,etal.IntegrativeDNAmethylation and gene expression analysis in high-grade soft tissue sarcomas. Genome Biol 2013;14:r137.
127. Grasso CS, Wu YM, Robinson DR, et al. The mutational landscape of lethal castration-resistant prostate cancer. Nature 2012;487:239-43.
128. Sia D, Losic B, Moeini A, et al. Massive parallel sequencing uncovers actionable FGFR2-PPHLN1 fusion
and ARAF mutations in intrahepatic cholangiocarcinoma. Nat Commun 2015;6:6087.
129.AoyagiK,MinashiK,IgakiH,etal.Artificiallyinducedepithelial-mesenchymal transition in surgical subjects: its implications in clinical and basic cancer research. PLoS One 2011;6:e18196.
130.YuK,GanesanK,TanLK,etal.Apreciselyregulatedgene expression cassette potently modulates metastasis and survival in multiple solid cancers. PLoS Genet 2008;4:e1000129.
131.SternbergA,KillickS,LittlewoodT,etal.Evidencefor reduced B-cell progenitors in early (low-risk) myelodysplastic syndrome. Blood 2005;106:2982-91.
132.LaBrecheHG,NevinsJR,HuangE.Integratingfactoranalysis and a transgenic mouse model to reveal a peripheral blood predictor of breast tumors. BMC Med Genomics 2011;4:61.
133.SeokJY,NaDC,WooHG,etal.Afibrousstromalcomponent in hepatocellular carcinoma reveals a cholangiocarcinoma-like gene expression trait and epithelial-mesenchymal transition. Hepatology 2012;55:1776-86.
134. Zhan F, Barlogie B, Arzoumanian V, et al. Gene-expression signature of benign monoclonal gammopathy evident in multiple myeloma is linked to good prognosis. Blood 2007;109:1692-700.
135.GordonGJ,RockwellGN,JensenRV,etal.Identificationof novel candidate oncogenes and tumor suppressors in malignant pleural mesothelioma using large-scale transcriptionalprofiling.AmJPathol2005;166:1827-40.
136.WuH,ChenY,LiangJ,etal.Hypomethylation-linkedactivation of PAX2 mediates tamoxifen-stimulated endometrial carcinogenesis. Nature 2005;438:981-7.
137.DyrskjøtL,KruhøfferM,ThykjaerT,etal.GeneExpression in the Urinary Bladder A Common Carcinoma in Situ Gene Expression Signature Exists DisregardingHistopathologicalClassification.CancerRes2004;64:4040-8.
138. Radvanyi L, Singh-Sandhu D, Gallichan S, et al. The gene associated with trichorhinophalangeal syndrome in humans is overexpressed in breast cancer. Proc Natl Acad Sci U S A 2005;102:11005-10.
139.KimchiET,PosnerMC,ParkJO,etal.ProgressionofBarrett's metaplasia to adenocarcinoma is associated with the suppression of the transcriptional programs of epidermal differentiation. Cancer Res 2005;65:3146-54.
140.MoherD,LiberatiA,TetzlaffJ,etal.Preferredreportingitems for systematic reviews and meta-analyses: the PRISMAstatement.JClinEpidemiol2009;62:1006-12.