hydrogen peroxide- review of its role as part of a mine drainage treatment strategy
DESCRIPTION
Jon Smoyer P.G., PA Department of Environmental Protection (DEP), “Hydrogen Peroxide- Review of its Role as Part of a Mine Drainage Treatment Strategy” Hydrogen Peroxide has been used to oxidize and remove ferrous iron from mine drainage for decades. It is a relatively inexpensive and effective oxidant that can be used to achieve rapid ferrous iron oxidation in many active and semi-passive mine drainage treatment systems. This presentation outlines the physical properties, concentrations, and available delivery options for hydrogen peroxide.TRANSCRIPT

Hydrogen Peroxide- Review of its Role as Part of a Mine Drainage Treatment
Strategy Jon Smoyer, PG August 9, 2013 Bureau of Abandoned Mine Reclamation
• What is Hydrogen Peroxide?• Chemically – H202 - only one atom of oxygen
different than water but….
• DO NOT BE FOOLED. HYDROGEN PEROXIDE IS A VERY POWERFUL OXIDANT AND IF NOT RESPECTED, CAN BE A VERY DANGEROUS CHEMICAL TO MOST LIVING ORGANISMS

Physical and chemical properties Hydrogen peroxide is a clear, colorless, non-flammable liquid. It has a slightly pungent odor. Hydrogen peroxide is a versatile chemical with a wide variety of applications. It is commercially available as aqueous solution in various concentrations and grades.
Parameter units H2O2 concentration
Content % by wt. 30 35 50 60 70 87Content g H2O2 100%/kg 300 350 500 600 700 870
Content g H2O2 100%/l 333 396 598 745 902 1197Content Mol % 18.5 22.2 34.6 44.3 55.3 78.0Active oxygen content % by wt. 14.1 16.5 23.5 28.2 32.9 40.9
Density at20 °C g/cm³ 1.111 1.132 1.196 1.241 1.288 1.376
Freezing point2) °C -26 -33 (-27F) -52 (-62F) -56 -40 -16
Boiling point(normal pressure)3) °C 106 108 114 119 125 139

• TYPICALLY AVAILABLE IN 35% OR 50% IN, DRUMS, TOTES OR IN BULK DELIVERY.
• BULK DELIVERY PREFERRED FOR ANY TYPE OF LONG TERM TREATMENT.
• 50% OBVIOUSLY MORE COST EFFECTIVE

HYDROGEN PEROXIDE WHEN REACTED BREAKS DOWN INTO WATER AND OXYGEN. NO BYPRODUCTS OR RESIDUES OTHER THAN THOSE LEFT BY THE REACTANT THAT WAS OXIDIZED.NO INCREASE IN TOTAL DISSOLVED SOLIDS.

• AMD REACTION WITH HYDROGEN PEROXIDE
• 2 Fe +2 + H2O2 + 4 OH-
2Fe (OH)3 (precip.)
Reaction consumes alkalinity (or liberates mineral acidity)
• Hydrogen Peroxide is a non-discriminant oxidizer. It will oxidize anything that happens to be in the AMD stream. However, in most cases, the iron is the first available reactive element that will precipitate in large quantities.
• Iron will continue to precipitate until the solubility point of the isotope of Fe is attained by the pH and/or Eh of the solution.

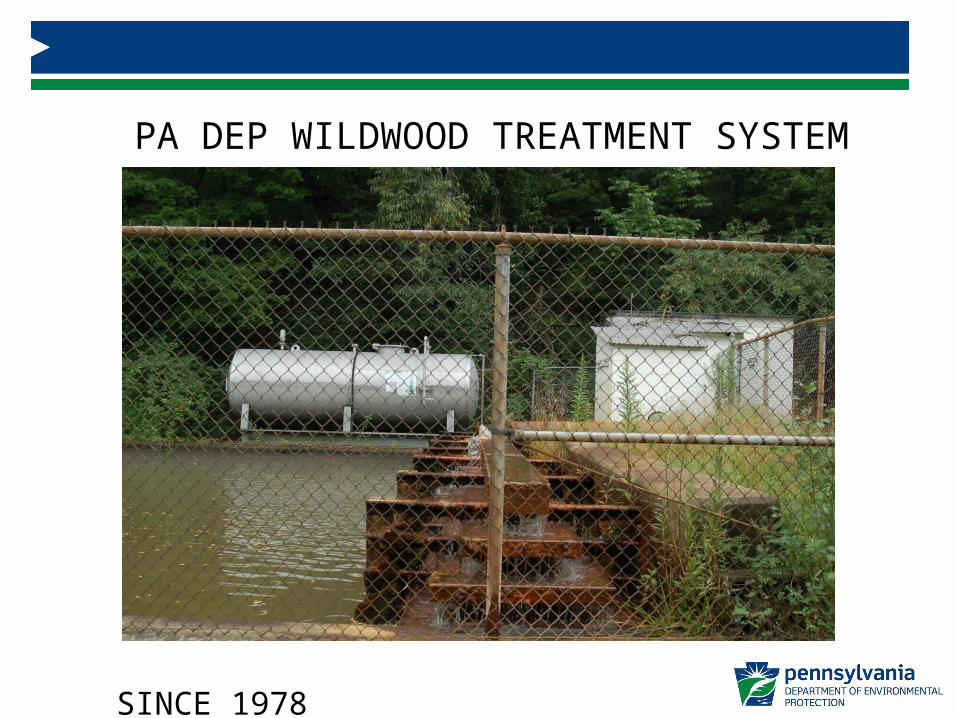
PA DEP WILDWOOD TREATMENT SYSTEM
SINCE 1978
• Why use hydrogen peroxide?…• Much more efficient than atmospheric aeration.
Oxidation with atmosphere is limited by the fact that air is only 20% oxygen and the exchange of this limited oxygen into water is slow and relatively inefficient.
• Can be more cost effective than adding alkaline material to AMD in order to adjust the solubility of the solution. Oxidize as raw, rather than adjust pH to bring the iron out of solution. This avoids the inefficiencies of lime dissolution and therefore makes less sludge.
• BENCH SCALE TESTS ON NEAR ALKALINE –IRON TYPE AMD (MEANS AND BEAM, 2011)
• BUCKET/ BENCH SCALE TESTS WERE PERFORMED ON DISCHARGES THAT WERE NEAR ALKALINE CONDITIONS (SOME WERE INFACT NET ACIDIC) THAT WERE OF LARGE VOLUME AND LIMITED SPACE SUCH THAT PURELY PASSIVE TREATMENT WOULD BE UNLIKELY
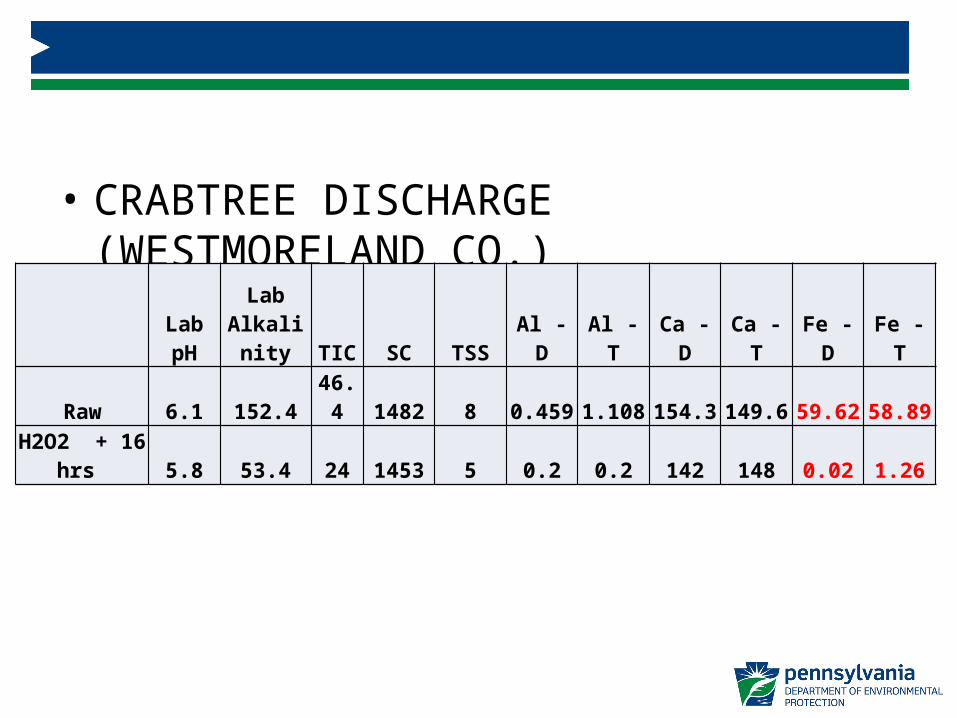
• CRABTREE DISCHARGE (WESTMORELAND CO.)
Lab pHLab
Alkalinity TIC SC TSS Al - D Al - T Ca - D Ca - T Fe - D Fe - T
Raw 6.1 152.4 46.4 1482 8 0.459 1.108 154.3 149.6 59.62 58.89
H2O2 + 16 hrs 5.8 53.4 24 1453 5 0.2 0.2 142 148 0.02 1.26

• CRABTREE DISCHARGE (WESTMORELAND CO.) CONT.
K - D K - T Mg - D Mg - T Mn - D Mn-T Na - D Na - T Si - D Si - T Zn - D Zn - T Nitrate SO4 Cl-Hot
Acidity
Raw 3.723 3.8 49.9 53.3 2.23 2.26 106.7 106.5 23.88 23.84 0.084 0.088 0.06 681.0 71.0 -24.4
H2O2 +16 HRS 4.211 4.3 48.6 51.3 2.14 2.23 95.8 98.8 18.68 20.65 0.087 0.088 0.07 627.4 70.5 -34

• HOFFMAN RUN DISCHARGE (SOMSERSET CO.)
Lab pH
Lab Alk SC TSS Al - D Al - T Ca - D Ca - T Fe - D Fe - T
Raw 5.9 66.2 910 6 0.2 0.2 92.6 93.6 47.5 48.5
H2O2 + 30 min 3.9 0 920 68 0.2 0.2 94.7 94.7 0.636 26.5
H2O2 + 16 hrs 3.9 0.6 876 5 0.2 0.2 88.6 91.3 0.288 1.93
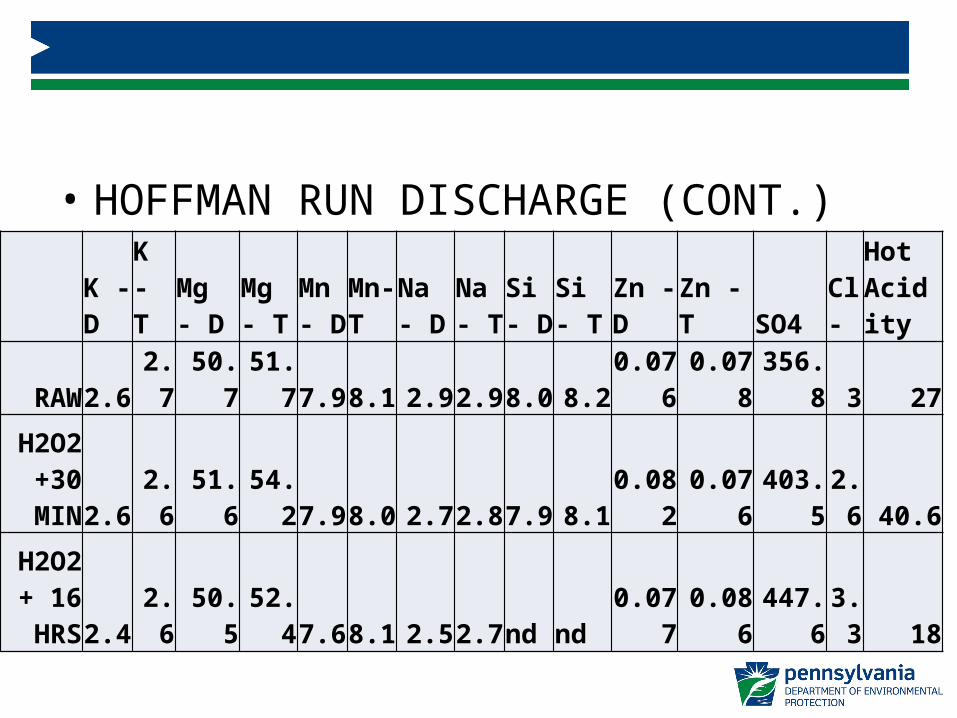
• HOFFMAN RUN DISCHARGE (CONT.)
K - D
K - T
Mg - D
Mg - T
Mn - D
Mn-T
Na - D
Na - T
Si - D Si - T Zn - DZn - T SO4 Cl-
Hot Acidity
RAW 2.6 2.7 50.7 51.7 7.9 8.1 2.9 2.9 8.0 8.2 0.076 0.078 356.8 3 27
H2O2 +30
MIN 2.6 2.6 51.6 54.2 7.9 8.0 2.7 2.8 7.9 8.1 0.082 0.076 403.52.6 40.6
H2O2 + 16 HRS 2.4 2.6 50.5 52.4 7.6 8.1 2.5 2.7nd nd 0.077 0.086 447.63.3 18

• ST. MICHAEL DISCHARGE (CAMBRIA CO.)
Lab pHLab Alk TIC SC
TDS @ 105 TSS Al - D Al - T
Ca - D Ca - T Fe - D Fe - T
Raw 5.8 46.6 31.8 1631 1704 14 1.56 2.81 203 205 132 133H2O2 + 10 MIN 3.0 0 31 1934 1484 252 2.5 2.24 207 213 47.8 137H2O2 + 5HRS 3.0 0 24.6 1925 1540 32 2.24 2.29 204 207 30.8 41.2

• GLADDEN DISCHARGE (ALLEGHENY CO.)
Lab pHLab Alk TIC SC
TDS @ 105 TSS Al - D Al - T Ca - DCa - T Fe - D Fe - T
Raw 6.2 151.8 79.5 1741 1348 5 0.2 0.243 86.3 89.5 86 89.5H2O2 + 3MIN 5.1 24.8 63.5 1725 1280 184 0.2 0.262 86.3 89.8 0.488 91.9H2O2 + 18 MIN 5.0 22 62 1722 1256 50 0.2 0.2 87.6 89.4 0.039 26.9H2O2 + 2HRS 18MIN 5.1 21.6 42.5 1726 1258 14 0.2 0.2 85.4 88.8 0.02 6.425
• LTV Banning and Mon-View Mathies -Recent financial market condition has affected trust revenue generation
• PADEP (Beam et. al.) with the assistance of OSM (Means) formed evaluation team to perform cost-reduction evaluations
• Evaluation team focused on reducing annual operation and chemical costs
LTV TREATMENT SYSTEM EVALUATIONS
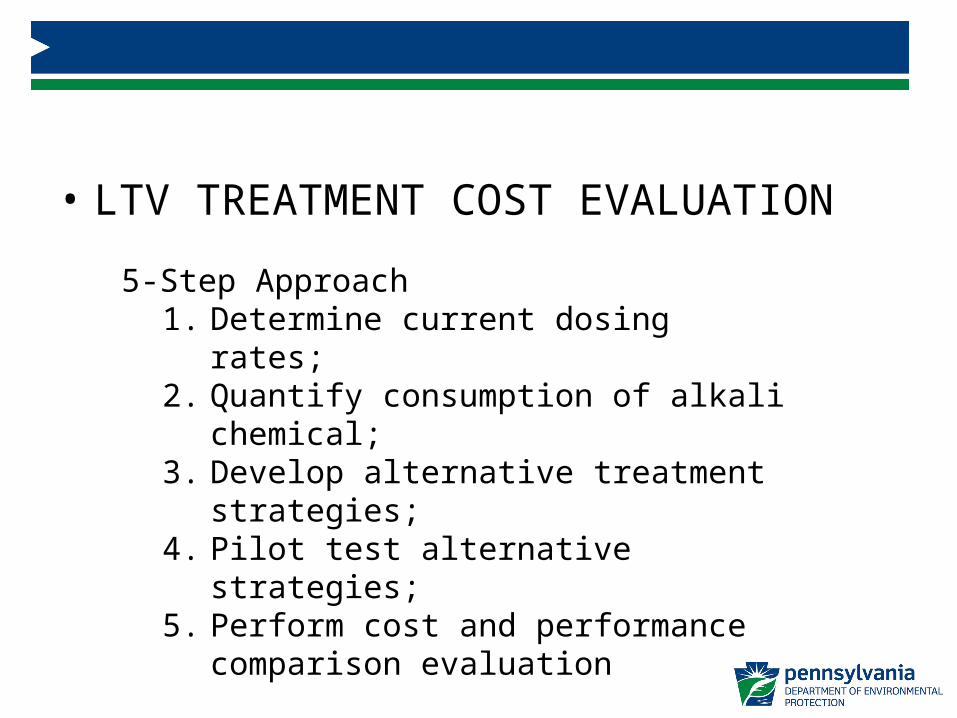
• LTV TREATMENT COST EVALUATION
5-Step Approach1. Determine current dosing rates;2. Quantify consumption of alkali chemical;3. Develop alternative treatment strategies;4. Pilot test alternative strategies;5. Perform cost and performance comparison
evaluation

Step 1: Quantify original Mon-View NaOH Costs
20% NaOH Dosing = 122 gal/day = $116/day = $42,340/yr
Sample LocationFlow
(gpm)Field
pHField
AlkalinityCa - D Ca - T Fe - D Fe - T Na - D Na - T
Reaction tank Influent 396 6.86 400 96.5 100 34.8 46.3 448 468Reaction tank Effl uent 396 7.22 385 95.5 102 4.306 46.2 475 515Final Effl uent 396 7.48 375 94.3 97.2 1.1 1.09 454 502All values in mg/L, Alkalinity = mg/L as CaCO3, D = Dissolved, T = Total
Mon-View: Results of Original 20% Sodium Hydroxide (w/w) Treatment Configuation
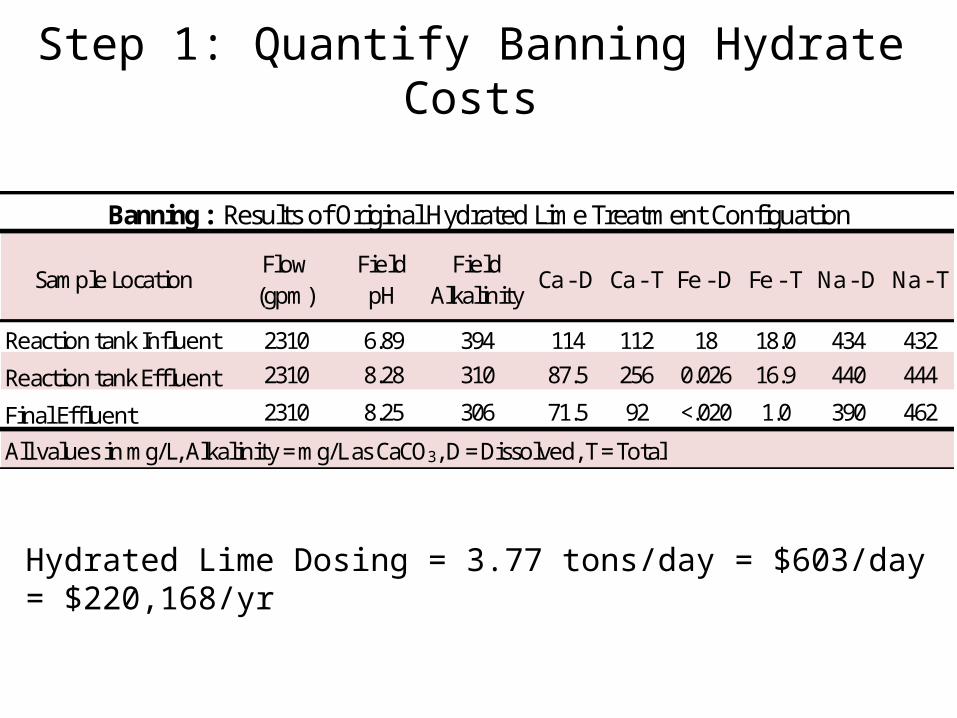
Step 1: Quantify Banning Hydrate Costs
Hydrated Lime Dosing = 3.77 tons/day = $603/day = $220,168/yr
Sample LocationFlow
(gpm)Field
pHField
AlkalinityCa - D Ca - T Fe - D Fe - T Na - D Na - T
Reaction tank Influent 2310 6.89 394 114 112 18 18.0 434 432
Reaction tank Effl uent 2310 8.28 310 87.5 256 0.026 16.9 440 444
Final Effl uent 2310 8.25 306 71.5 92 <.020 1.0 390 462
All values in mg/L, Alkalinity = mg/L as CaCO3, D = Dissolved, T = Total
Banning : Results of Original Hydrated Lime Treatment Configuation
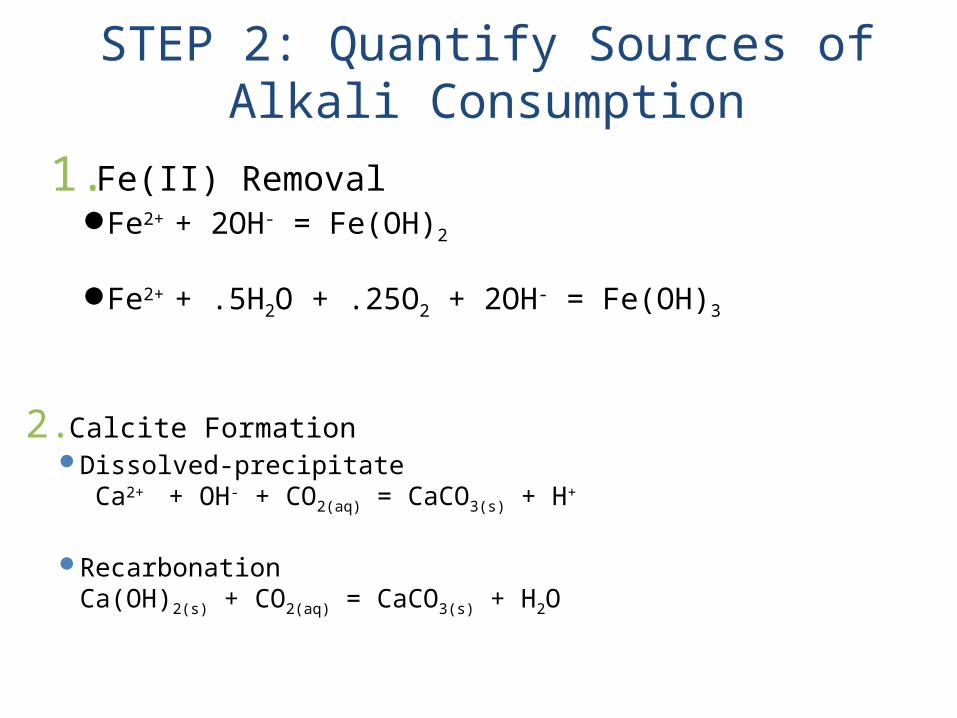
1. Fe(II) RemovalFe2+ + 2OH- = Fe(OH)2
Fe2+ + .5H2O + .25O2 + 2OH- = Fe(OH)3
STEP 2: Quantify Sources of Alkali Consumption
2. Calcite Formation Dissolved-precipitate
Ca2+ + OH- + CO2(aq) = CaCO3(s) + H+
RecarbonationCa(OH)2(s) + CO2(aq) = CaCO3(s) + H2O

Mechanism for Hydrate Consumption
Hydroxylation - Reaction with OH- ion with aqueous species to form H2O and other species
– Hydroxylation of anion HCO3
- + OH- = CO32- + H2O
– Hydroxylation of cationMg2+ + OH- = MgOH+
– Hydroxylation of Aqueous complexesCaHCO3
+ + OH- = CaCO3(aq) + H2O
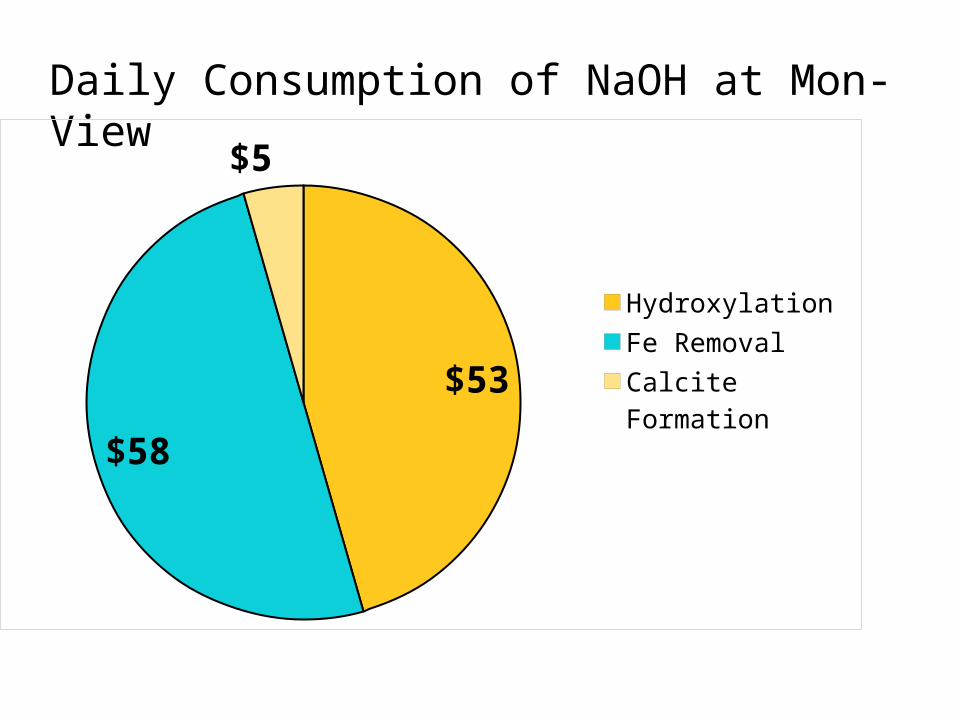
Daily Consumption of NaOH at Mon-View
$53
$58
$5
Hydroxylation
Fe Removal
Calcite For-mation
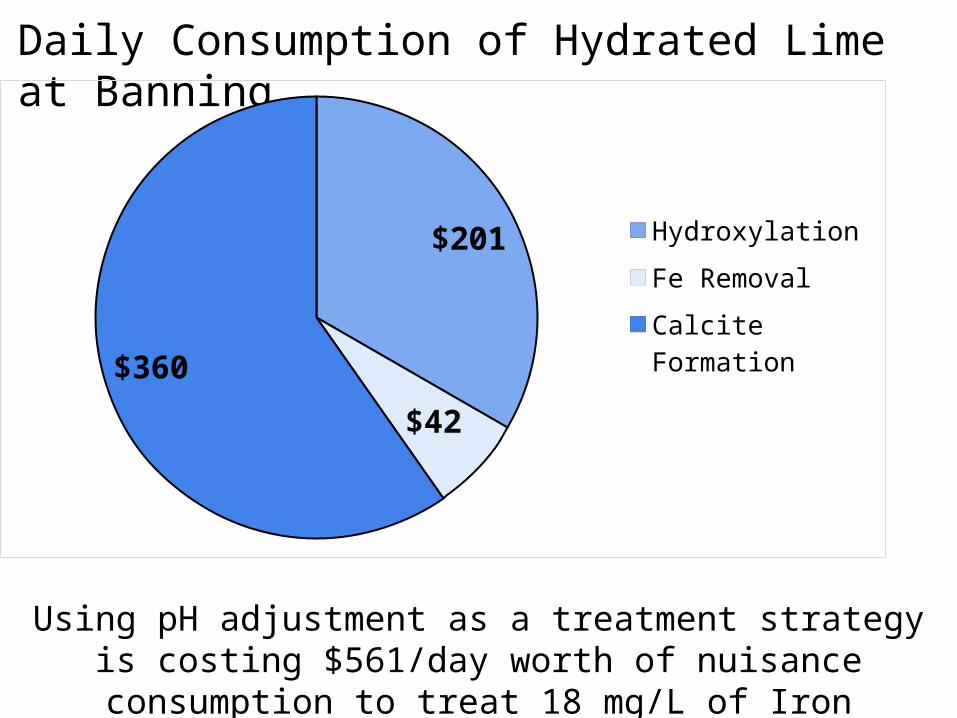
Using pH adjustment as a treatment strategy is costing $561/day worth of nuisance consumption to treat 18 mg/L of
Iron
Daily Consumption of Hydrated Lime at Banning
60%
$201
$42
$360
Hydroxylation
Fe Removal
Calcite For-mation

H2O
2
Lime
Step 3: Develop alternative Treatment Strategy to reduce Cost
Pilot Test 50% H2O2
– No pH adjustment
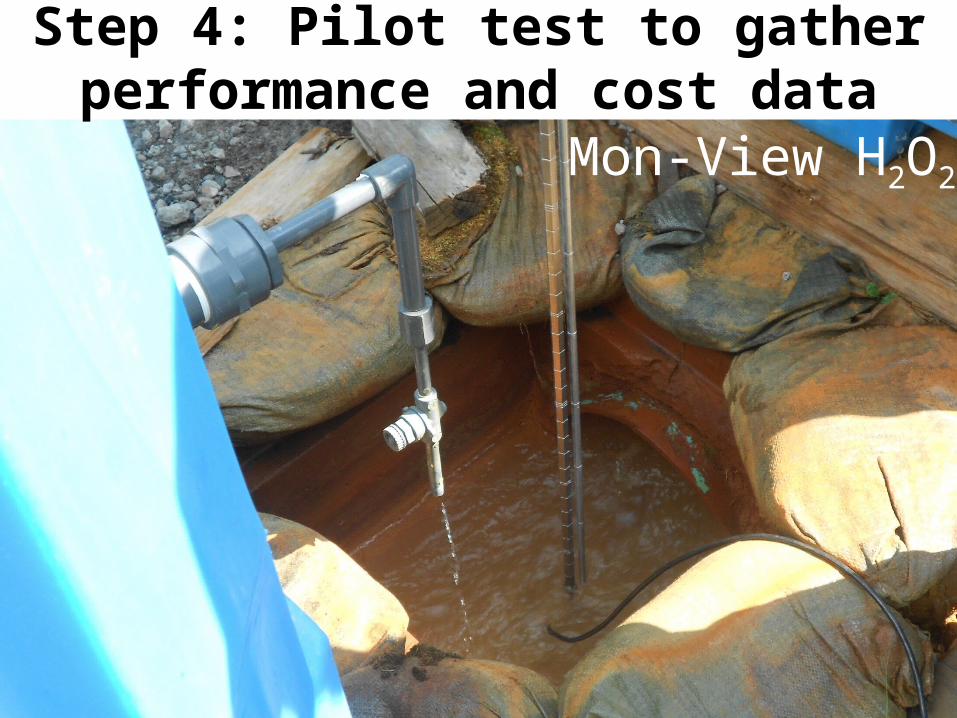
Mon-View H2O2
Step 4: Pilot test to gather performance and cost data
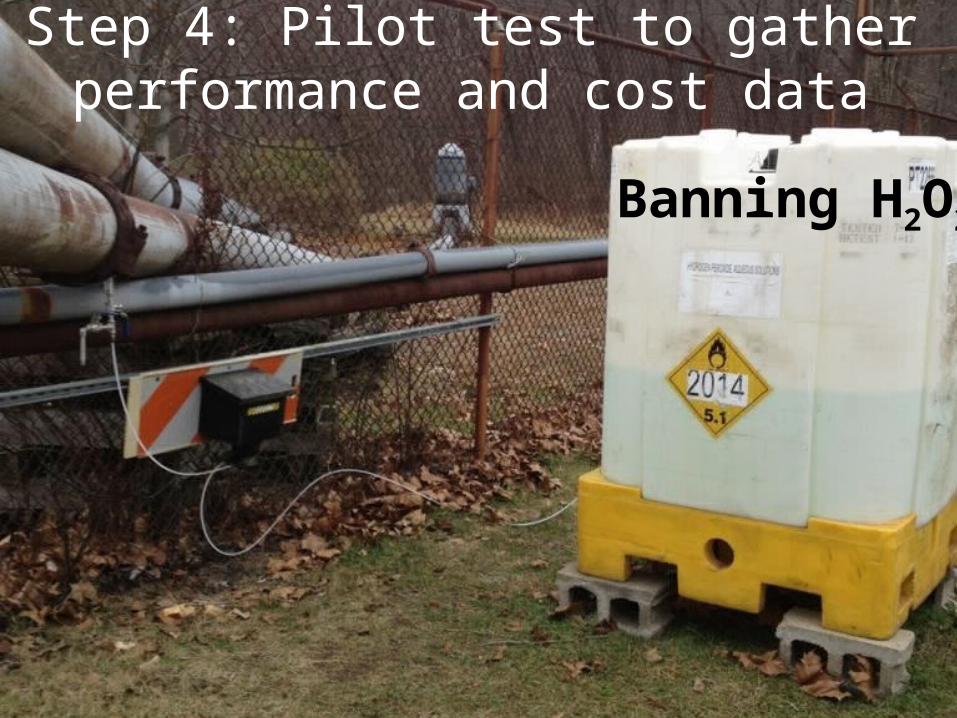
Step 4: Pilot test to gather performance and cost data
Banning H2O2
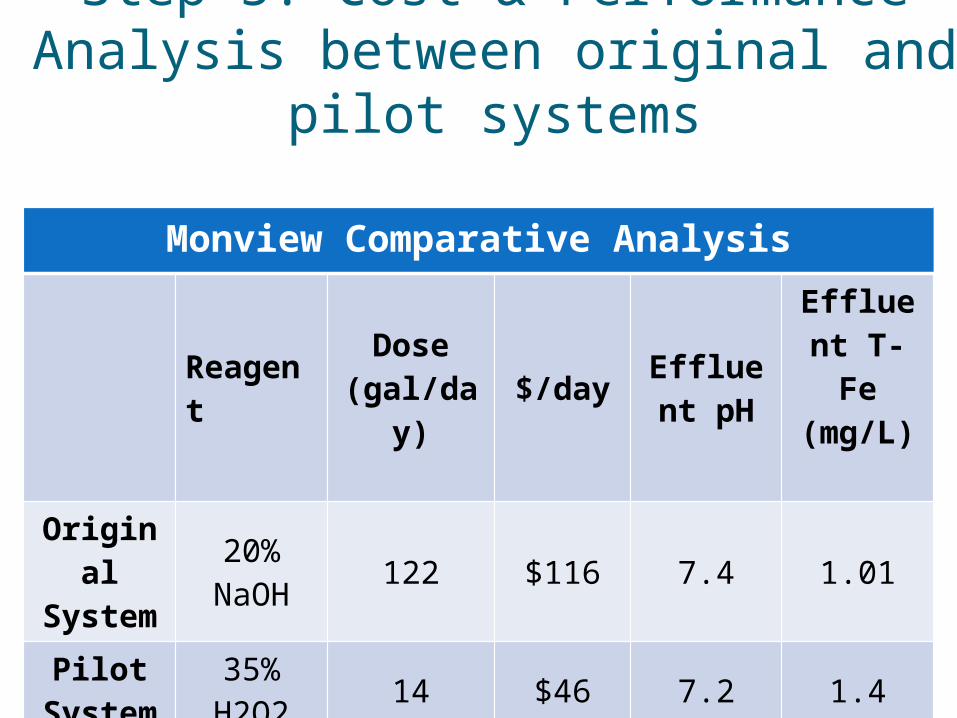
Step 5: Cost & Performance Analysis between original and pilot systems
Monview Comparative Analysis
Reagent Dose (gal/day) $/day Effluent
pH
Effluent T-Fe
(mg/L)
Original System
20% NaOH 122 $116 7.4 1.01
Pilot System
35% H2O2 14 $46 7.2 1.4
* NaOH = $.95/gal, H2O2 = $3.30/gal
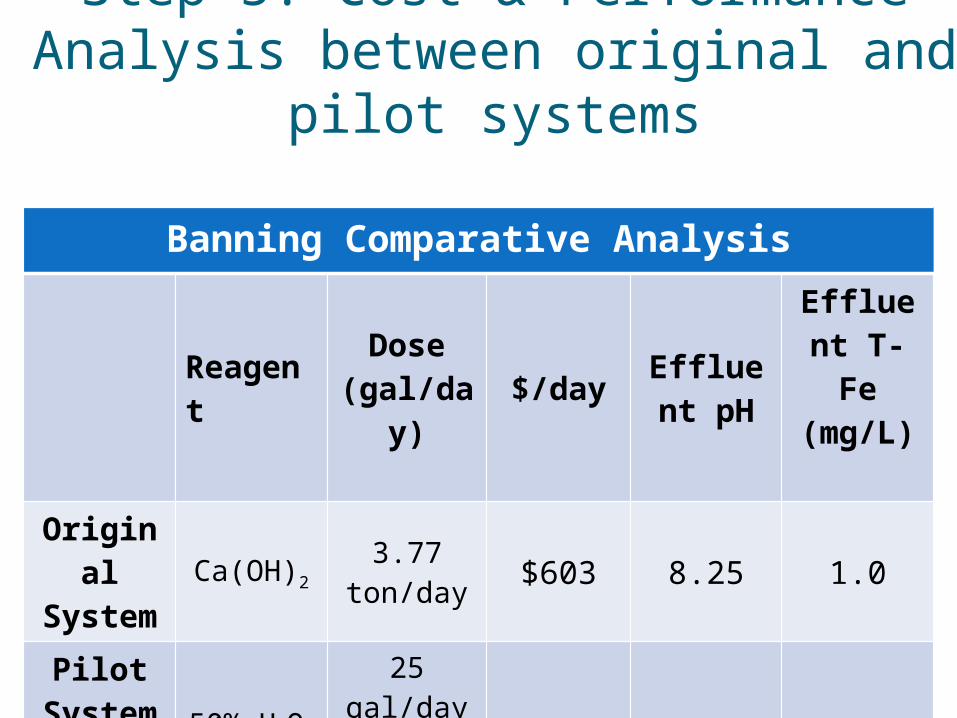
Step 5: Cost & Performance Analysis between original and pilot systems
Banning Comparative Analysis
Reagent Dose (gal/day) $/day Effluent
pH
Effluent T-Fe
(mg/L)
Original System Ca(OH)2
3.77 ton/day $603 8.25 1.0
Pilot System 50% H2O2
& Ca(OH)2
25 gal/day &
1.2 ton/day$275 7.5 1.0
* Ca(OH)2 = $160/ton, H2O2 = $3.30/gal

Brandy Camp Trial 2012
Acidity Alkalinity Iron Iron Total Total TDS
Unfiltrd Filtrd Total Net Total Net Total Dissld Total Dissld Sulfate Susp.at 105
C
Sample Flow pH Field Alk IronH2O2 Rate
Lab "Hot"
Calculated Lab
Calculated Fe Fe Mn Mn SO4
2- Solids
Date (gpm) (lab) (mg/L) (mg/L) (ml/min) (mg/l) (mg/l) (mg/l) (mg/l) (mg/l) (mg/l) (mg/l) (mg/l) (mg/l) (mg/l) (mg/l)5/1/2012 820.0 5.5 0.00 79.00 38.40 40.60 0.00 50.600 49.500 7.460 7.353 858.80 8.0 14085/8/2012 781.0 5.6 30.8 0.00 73.20 29.80 43.40 0.00 48.600 41.600 7.531 8.074 847.60 16.0 13665/9/2012 781.0 4.9 6.2 42.00 65.60 46.80 18.80 0.00 49.100 31.600 8.590 7.781 1703.1 44.0 1336
5/10/2012 781.0 3.8 0.0 42.00 73.00 73.00 0.00 0.00 53.540 17.200 8.059 7.690 820.00 88.0 1310
5/14/2012 781.0 3.8 0 80.00 80.00 80.00 0.00 0.00 53.480 15.620 8.097 8.003 842.70 8.0 1436
5/16/2012 781.0 3.9 0.0 80.00 81.00 81.00 0.00 0.00 52.000 16.300 7.465 7.588 828.20 82.0 1332
5/21/2012 781.0 3.7 0.0 1.6 80.00 71.80 71.80 0.00 0.00 51.500 13.000 8.091 7.614 761.70 86.0 1340
5/31/2012 692.0 3.6 0.0 1.1 75.00105.4
0 105.40 0.00 0.00 51.700 14.800 7.729 7.882 809.80 94.06/7/2012 649.0 4.3 0.0 15.9 70.00 76.20 68.60 7.60 0.00 53.000 21.300 7.773 8.052 795.00 70.0 1342
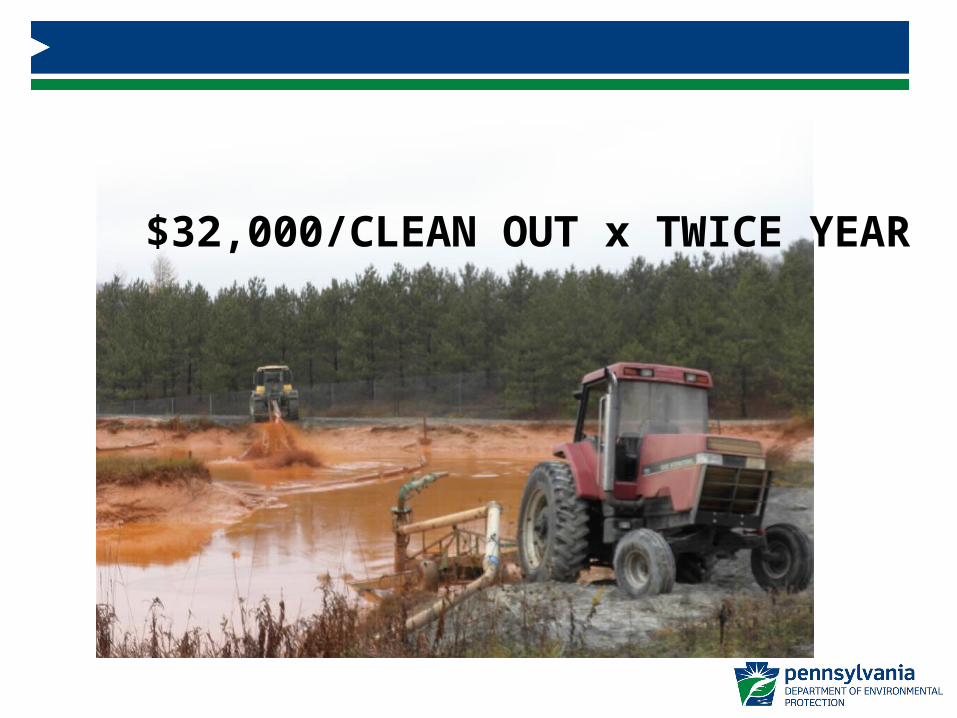
$32,000/CLEAN OUT x TWICE YEAR
• Portion of Safety Film on Stability, Reactivity, and Decomposition of H2O2
http://h2o2.evonik.com/product/h2o2/en/pages/h2o2-safety-training-video.aspx
• ALL OF THE PA DEP’S USE OR EVALUATION OF HYDROGEN PEROXIDE ARE FOR ACTIVE TREATMENT SYSTEMS WITH EXISTING, POWER AND SOME TYPE OF SECURE FACILITIES.
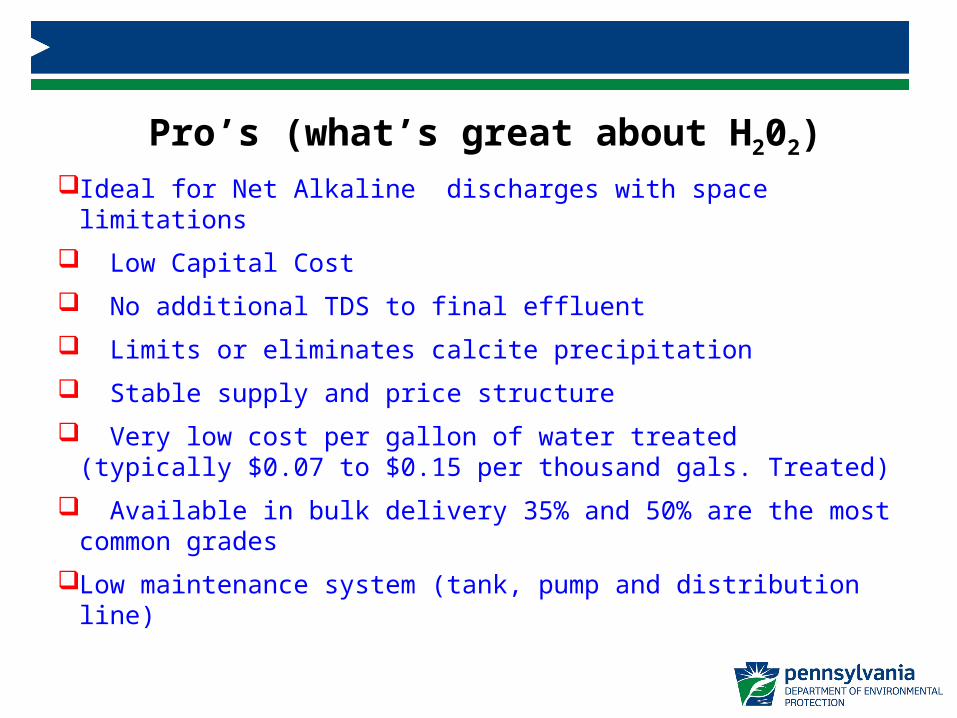
Ideal for Net Alkaline discharges with space limitations
Low Capital Cost
No additional TDS to final effluent
Limits or eliminates calcite precipitation
Stable supply and price structure
Very low cost per gallon of water treated (typically $0.07 to $0.15 per thousand gals. Treated)
Available in bulk delivery 35% and 50% are the most common grades
Low maintenance system (tank, pump and distribution line)
Pro’s (what’s great about H202)
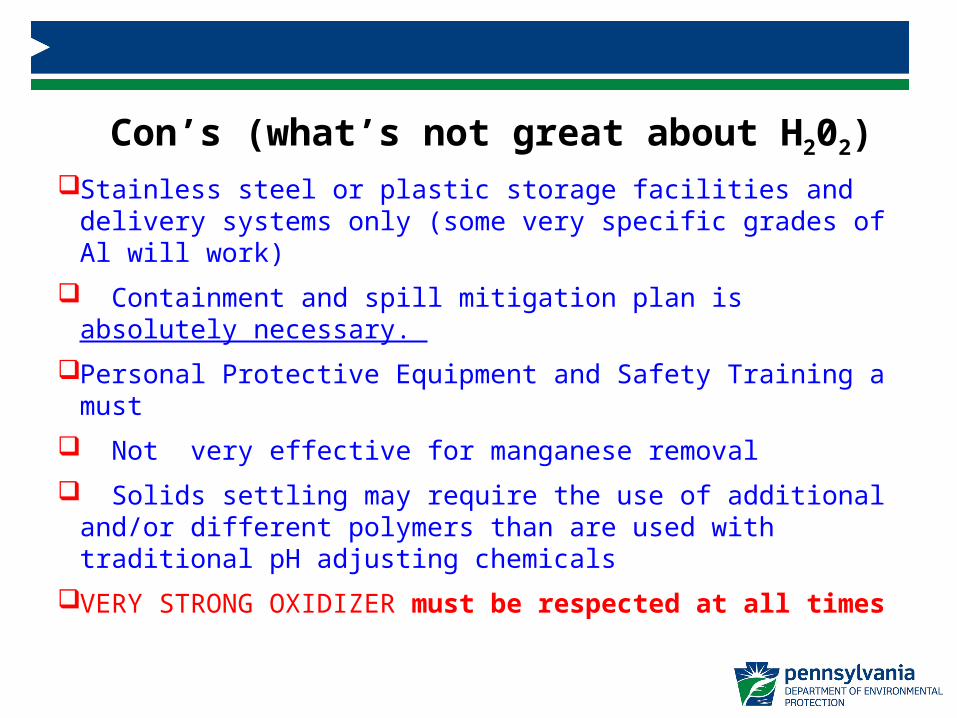
Stainless steel or plastic storage facilities and delivery systems only (some very specific grades of Al will work)
Containment and spill mitigation plan is absolutely necessary.
Personal Protective Equipment and Safety Training a must
Not very effective for manganese removal
Solids settling may require the use of additional and/or different polymers than are used with traditional pH adjusting chemicals
VERY STRONG OXIDIZER must be respected at all times
Con’s (what’s not great about H202)

• Is Peroxide right for you?Consider the site and staff availability. For most watershed associations with strictly volunteer labor and remote systems without power or safety facilities, it is not a good idea.
If you need enhanced treatment, more control on an effluent, or less sludge generation at an active treatment plant, it may be a very useful component to your treatment process.

• QUESTIONS AND ANSWERS