hydrogen-accretingcarbon-oxygen whitedwarfs of low mass: … · 2018-12-03 · hydrogen-burning...
TRANSCRIPT

arX
iv:a
stro
-ph/
0003
272v
1 1
8 M
ar 2
000
Hydrogen-Accreting Carbon-Oxygen White Dwarfs of Low Mass:
Thermal and Chemical Behavior of Burning Shells
Luciano Piersanti 1
Dipartimento di Fisica dell’Universita degli Studi di Napoli “Federico II”, Mostra
d’Oltremare, pad. 20, 80125, Napoli, Italy; [email protected]
Santi Cassisi
Osservatorio Astronomico di Teramo, Via M.Maggini 47, 64100 Teramo, Italy;
Icko Iben Jr.
Astronomy and Physics Departments, University of Illinois, 1002 W. Green Street, Urbana,
IL 61801;[email protected]
and
Amedeo Tornambe 2
Osservatorio Astronomico di Teramo, Via M.Maggini 47, 64100 Teramo, Italy;
1Osservatorio Astronomico di Teramo, Via M.Maggini 47, 64100 Teramo, Italy
2Dipartimento di Fisica, Universita de L’Aquila, Via Vetoio, 67100 L’Aquila, Italy
Received ; accepted

– 2 –
ABSTRACT
Numerical experiments have been performed to investigate the thermal behavior
of a cooled down white dwarf of initial mass MWD = 0.516M⊙ which accretes
hydrogen-rich matter with Z = 0.02 at the rate M = 10−8 M⊙ yr−1, typical
for a recurrent hydrogen shell flash regime. The evolution of the main physical
quantities of a model during a pulse cycle is examined in detail. From selected
models in the mass range MWD = 0.52 ÷ 0.68 M⊙, we derive the borders in
the MWD - M plane of the steady state accretion regime when hydrogen is
burned at a constant rate as rapidly as it is accreted. The physical properties
during a hydrogen shell flash in white dwarfs accreting hydrogen-rich matter
with metallicities Z = 0.001 and Z = 0.0001 are also studied. For a fixed
accretion rate, a decrease in the metallicity of the accreted matter leads to an
increase in the thickness of the hydrogen-rich layer at outburst and a decrease
in the hydrogen-burning shell efficiency. In the MWD-M plane, the borders of
the steady state accretion band are critically dependent on the metallicity of
the accreted matter: on decreasing the metallicity, the band is shifted to lower
accretion rates and its width in M is reduced.
Subject headings: stars: novae, cataclysmic variables - stars: accretion - supernovae:
general - white dwarfs

– 3 –
1. Introduction
The knowledge of the physical consequences of the accretion of hydrogen-rich matter onto
a white dwarf has played an important role in understanding the main properties of several
types of eruptive stars such as slow and fast novae and symbiotic stars (e.g., Starrfield
1971, Starrfield, Truran, & Sparks 1978, Sparks, Starrfield, & Truran 1978). In addition,
the scenario in which a red giant star transfers mass to its carbon-oxygen (CO) white
dwarf companion (Whelan & Iben 1973) is regarded by some as one of the most plausible
precursor candidates for Type Ia supernovae (e.g., Hachisu, Kato, & Nomoto 1996). Fairly
extensive surveys of the dependence of behavior on white dwarf mass and accretion rate
have been conducted (see, e.g., Iben & Tutukov 1996; Cassisi, Iben, & Tornambe 1998
[hereinafter CIT] and references therein). For a low mass CO white dwarf of typical mass in
the range 0.5÷ 0.8 M⊙, the consequences of the accretion of hydrogen-rich matter of solar
metallicity can be summarized as follows:
• for sufficiently large mass-accretion rates (say, 10−7 M⊙ yr−1 or larger, depending on
the white dwarf mass), the accreted layer adopts an expanded configuration similar
to that of the envelope of a red giant star;
• for intermediate mass-accretion rates (say, in the range 4 ÷ 10 × 10−8 M⊙ yr−1),
the accretor burns hydrogen in a steady state regime at the same rate as it accretes
hydrogen;
• for small mass-accretion rates (say, in the range 1 ÷ 4 × 10⁻⁸ M⊙ yr−1), the accretor
experiences recurrent mild flashes;
• for even smaller mass-accretion rates (say, smaller than 10−9 M⊙ yr−1), the accretor
experiences very strong nova-like hydrogen shell flashes.

– 4 –
Although considerable attention has been paid to models that experience recurrent
mild hydrogen-burning flashes (e.g., Paczynski & Zytkow 1978, Iben 1982; Jose, Hernanz,
& Isern 1993, CIT), a deep insight into the evolution of the main physical properties in
the accreting models over an outburst-cooling cycle is still missing. Analytical studies
of hydrogen-burning shells by Sugimoto & Fujimoto (1978) and by Fujimoto (1982a,b)
have established the general properties of the hydrogen-burning shell as a function of the
fundamental parameters of the accreting star, but have not provided profiles of structural
and chemical variables in the shell itself. Finally, the extant numerical experiments do not
explore systematically how the outcome of the accretion process depends on the abundances
of heavy elements in the accreted matter.
To investigate in detail the evolution of the main physical characteristics of the
hydrogen-burning shell during a flash episode, we have adopted as an initial model a white
dwarf of mass 0.516 M⊙which has accreted matter at the rate M = 10−8 M⊙ yr−1 for
7.6 × 10⁵ yr, at which point the interior has been cooled to a temperature of 8.6 × 10⁶ K
and the density at the center is 2.56× 10⁶ g cm−3. For the composition of accreted matter,
we have adopted a helium abundance by mass of Y = 0.28 and three different metallicities
(Z = 0.02, 0.001, and 0.0001).
In §2 we discuss the input physics and the assumptions. In §3, the thermal properties
of the hydrogen-burning shell are presented and discussed in detail for the Z=0.02 case. In
§4, analytical relations in the (MWD-M) plane are obtained for the case Z=0.02 and, in
§5, the dependence on metallicity of the evolutionary behavior of the accreting models is
analyzed. Conclusions and a brief discussion follow in §6.

– 5 –
2. Input Physics and Assumptions
The initial cold white dwarf model and the accretion experiments have been computed with
an updated version of the FRANEC code (Chieffi & Straniero 1989). A detailed discussion
of the main differences with respect to the original version of the code is given in CIT.
The initial model is the same as that used in CIT and a description of the pre-accretion
properties and the first pulse episode can be found in CIT. The main properties of this
model are listed in Table 1.
The accretion process is computed on the assumption that the accreted matter and
the white dwarf surface have the same specific entropy; that is, it is assumed that all of the
energy liberated by matter as it falls onto the surface of the white dwarf is radiated away.
The input physics differs from that used in CIT only in the low temperature opacities:
for Z = 0.02 and Z = 0.0001, we adopt the opacity tables provided by Cox & Stewart
(1970a,b) and by Cox & Tabor (1976); for Z = 0.001, the opacity values provided by
Alexander & Fergusson (1994) have been used. The initial distribution of heavy elements
adopted for models of metallicities Z=0.02 and Z=0.0001 is the solar one as given by Ross
& Aller (1976); for Z=0.001, the initial distribution is taken from Grevesse (1991).
EDITOR: PLACE TABLE 1 HERE.
3. A Typical Hydrogen-Flash-Driven Pulse Cycle
In this section, we analyze the thermal and nuclear evolution of the hydrogen-burning
shell of a model which has experienced enough (about 60) pulses that pulse properties
have reached a local asymptotic limit. The model accretes hydrogen-rich matter of solar
metallicity (Z=0.02) and its total mass at this point has grown to MWD ∼ 0.5236M⊙. We

– 6 –
assume that no mass is lost by the accreting star, despite the fact that a relatively nearby
companion is required to supply the hydrogen-rich matter to the white dwarf and that,
during evolution at high luminosity and low surface temperature, the surface of the star
in outburst, in the real analogue, extends in most instances beyond the Roche lobe of the
accretor and even beyond the donor star.
The most relevant structural properties of this model are reported in Table 1. The
well known evolution in the HR diagram during one complete pulse cycle is reported in
Figure 1. Several points of special interest are noted along the track: the positions where
flash-driven convection begins (IC) and where it disappears (EC); the positions where
maxima and minima of ΦH = LH/Ls and ΦHe = LHe/Ls occur. Here, LH, LHe, and Ls
are, respectively, the hydrogen-burning luminosity, the helium-burning luminosity, and the
surface luminosity. Several interior characteristics during two passages of the cycle are
shown in Figure 2 as a function of the total mass of the accretor.
EDITOR: PLACE FIGURE 1 HERE.
We begin our description at the upper right hand portion of the evolutionary track as
the model evolves from red to blue along the high luminosity plateau and ΦH ∼ 0.994. In
this phase, the release of gravothermal energy Φgr = Lgr/Ls is equal to ∼ 0.006, whereas
the Helium burning contributes negligibly to the surface luminosity (ΦHe << 1). Figure 2a
discloses that, along the plateau portion of the evolutionary track, the location in mass of
the hydrogen-burning shell (which we define as the point where the maximum rate of energy
production via hydrogen-burning is located) moves outwards much more quickly than the
total mass grows due to the accretion of fresh matter. In the next section, it will be shown
how, during the plateau phase, the relationship between the surface luminosity and the
mass of the hydrogen-exhausted core depends on the metallicity of the accreted matter.

– 7 –
EDITOR: PLACE FIGURE 2 HERE.
Once the mass of the layer between the hydrogen-burning shell and the surface
decreases below a critical value, energy production by hydrogen burning declines rapidly
(the reasons for this are discussed by Iben [1982] and the observational consequences are
discussed by Iben & Tutukov [1984]). The critical point in the HR diagram is the point of
maximum effective temperature labeled BP (for “blue point”) in Figure 1.
After reaching the blue point, the hydrogen-burning efficiency plumets and gravothermal
energy takes over as the main source of energy (Figure 2d). In the absence of mass accretion,
further evolution would be similar to that of a single star after leaving the AGB to become
the central star of a planetary nebula; i.e., apart from the onset of crystallization, evolution
would not have presented any additional curiosities. However, continuous mass accretion
leads to a quite different behavior for the outer layers of the white dwarf relative to that of
a non-accreting, cooling white dwarf. In particular, the combined action of the accretion
process (growth in mass of the hydrogen-rich envelope) and the contraction of the layers
above the hydrogen-burning shell (see Figs. 2e and 2c) relatively quickly brakes the rate of
decline of the temperature of the hydrogen-burning shell (Fig. 2b), and leads to a slowly,
but continuously, growing hydrogen-burning luminosity (Fig. 2d). In addition, it is worth
noticing that the accretion process induces an increase of the evolutionary lifetime in the
blue side of the HR loop from the bluest point to the faintest one. In particular along this
portion of the cycle the accreting model evolves in a 50% longer time-scale.
The energy delivered by hydrogen burning adds to the rate at which the local
temperature in the shell increases until eventually a new hydrogen shell flash occurs. The
increase in pressure related to the increase in temperature in the hydrogen-burning shell
leads to a rapid expansion of the layers above the shell (see the surface radius increase in
Fig. 2f and the decrease in density at the center of the shell in Fig. 2c). In the HR diagram,

– 8 –
the model evolves upward as energy diffuses from the burning shell to the surface, and the
increase in the surface radius eventually causes the model to evolve to the blue until the
plateau portion of the track is reached once again.
Thus, the accretion process modifies the thermal content of the hydrogen-rich layer,
producing the physical conditions suitable for a new hydrogen shell flash. An examination
of the evolution of the temperature profile in the outer layers of the model and of the
profile of the rate of nuclear energy generation in the hydrogen-rich layer shows how this
takes place. In Figure 1, circles, triangles, and squares indicate the locations of all models
for which profiles are given explicitly in Figures 3 and 4. All models marked by a given
symbol in Figure 1 are represented by profiles plotted in a specific panel in Figures 3 and
4. Models marked by solid disks in Figure 1 are represented by the temperature profiles in
Figure 3a and the energy-generation profiles in Figure 4a. Models marked by open triangles
in Figure 1 are represented by profiles in Figures 3b and 4b. This continues in a counter
clockwise fashion with, eventually, the models designated by open squares in Figure 1 being
represented by the profiles in Figures 3f and 4f.
EDITOR: PLACE FIGURE 3 HERE.
EDITOR: PLACE FIGURE 4 HERE.
The temperature profile in Figure 3a which has the narrowest “peak” (and acts as
a lower envelope of the ensemble of profiles) describes the model designated by the solid
disk at smallest surface temperature in Figure 1. Thus, as the model evolves in the HR
diagram along the plateau branch from red to blue, thermal energy in the model interior
flows inward in the form of a “thermal wave,” heating up hydrogen-free matter. At the
same time, thermal energy diffuses outward from the hydrogen-burning shell, which itself

– 9 –
propagates outward in mass toward the model surface; the temperature profile between the
shell and the surface steepens.
During the next portion of the evolution (the open triangles in Fig. 1 and the profiles in
Fig. 3b), thermal energy stored over a fairly large fraction of the outer layers of the model
(clearly beyond Mr ∼ 0.523 M⊙ in Fig. 3b) leaks outward and the drop in temperatures
in the hydrogen-burning shell is reflected in a decline in the hydrogen-burning luminosity.
Matter interior to Mr ∼ 0.522 M⊙ is still being heated from above. This behavior continues
for the next designated set of models (solid boxes in Fig. 1 and profiles in Fig. 3c), with
the “watershed” for thermal energy flow (the place from which energy flows both inward
and outward) moving inward. For the following set of models (open circles in Fig. 1 and
profiles in Fig. 3d), the energy-flow watershed has moved into interior regions not shown
and, until the last few models, when hydrogen burning is beginning to make itself evident
again (the bumps near the surface in the temperature profiles in Fig. 3d), cooling prevails
over the entire region above Mr ∼ 0.521 M⊙.
As the new hydrogen-burning shell flash gets underway (the last three open circles and
the closed triangles in Fig. 1), a large fraction of the nuclear energy which is released is
stored locally, since the time scale on which thermal energy can be transferred is greater
than the time scale on which nuclear energy is released. This is true even though matter
in the burning region is not degenerate. A convective shell is formed early on in the
development of the flash (the point labeled IC in Fig. 1). The mass of the convective
shell grows until the shell extends from the base of the burning shell up to photospheric
layers. Up to this moment, the evolution of the model has occurred on the nuclear burning
time scale. Thereafter, the convective shell (now, really, the convective envelope) cannot
accommodate a further increase in its thermal energy content, but must expand to giant
dimensions, using up local thermal energy to do the work of expansion against gravity. The
– 10 –
readjustment to a new, expanded configuration occurs on the thermal time scale of the
envelope. When the energy surplus has been dissipated, (excursion to higher luminosity and
lower effective temperature) and the envelope has readjusted to an expanded configuration,
the thermal wave begins to propagate inward again (see Fig. 3f). The model is now back
to where it began (the profile in Fig 3a with the narrowest peak) .
The profiles of the nuclear energy-generation rate ǫn in Figure 4 are also instructive.
As it is evident from Figure 4a, along the high luminosity plateau branch, the width in
mass of the nuclear energy-generating region increases slightly and the hydrogen-burning
luminosity drops as the burning shell works its way toward the surface. During most of
the plateau phase, the full CNO cycles are active. By the time the model has attained its
maximum effective temperature (Fig. 4b), hydrogen burning rapidly declines in importance
as temperatures in the shell (Fig. 3b) decrease. The decline continues along the next
portion of the cooling phase (Fig. 4c) as temperatures in the shell continue to decrease
(Fig. 3c). An interesting aspect of nuclear burning during the long cooling phase (Figs. 4b,
4c, and 4d) is that it takes place in two distinct regions: a left hand region where the CNO
cycles operate and a right hand spike where 12C in freshly accreted fuel is burned into 14N.
Along this phase the pp contribution to energy production plays a not negligible role (see
the broad secondary peak among the spikes in Fig. 4d).
Ultimately, thanks to the increase in density at the base of the hydrogen-rich layers,
heating replaces cooling in the hydrogen-burning layers (Figs. 3d and 4d) and both the
CNO cycles and pp-driven ǫn profiles begin to increase in height and in breadth. When
convection appears, the second ǫn peak is “swallowed” by the first (Fig 4d). After the
hydrogen-burning luminosity has attained its maximum value and convection begins to
recede (Fig. 4e), the mass-width of the region undergoing the strongest hydrogen burning
decreases, attaining its minimum width (Fig. 4f) at the same time the model reaches in the

– 11 –
HR diagram the minimum effective temperature.
4. Steady-State Regime for Small White Dwarf Masses
The evolution described in the previous section illustrates the well known result that, for
accretion rates smaller than a critical value which depends on white dwarf mass, accreting
white dwarfs can be viewed as evolving alternatively in two stable states (a low state and a
high state, in the nomenclature of Fujimoto [1982b]), separated by short lived transitional
phases. The low state is the cooling phase, when the gravothermal energy source supplies
essentially the entire surface luminosity, with hydrogen burning being almost extinguished.
The high (or “excited”) state is the high luminosity plateau phase during which the
hydrogen-burning shell is the main energy source, and the contribution of gravothermal
energy is minor.
The hydrogen shell flash acts as the excitation mechanism which induces the transition
from the low to the high state. The trigger for the transition is that, when the mass of
the accreted layer exceeds a critical value which depends on the accretion rate, the rate of
local heating by the hydrogen-burning shell exceeds the rate at which heat can diffuse out,
initiating a thermonuclear runaway
The “strength” of a flash (the maximum hydrogen-burning luminosity) and the
maximum extension to the red of the evolutionary track during the excited state depend on
the accretion rate, in the sense of being greater, the smaller the accretion rate, but the final
plateau luminosity during the evolution from red to blue depends only on the mass of the
white dwarf. Since the amount of mass accreted between flashes is a quite small fraction of
the total mass, the white dwarf mass may be thought of as constant over a large number
of cycles; to a very good approximation, the structure of the envelope during the plateau

– 12 –
phase does not “remember” the accretion rate preceding the flash which produced it, being
sensitive only to the mass of the underlying white dwarf.
The transition from the excited to the low state sets in at the blue point along the
evolutionary track in the HR diagram (point BP in Fig. 1). The sudden drop in ΦH that is
shown in Figure 2d is initiated at the blue point. The reason for this second transition can
be understood in terms of the dependence on accretion rate of the mass of the hydrogen-rich
layer ∆MH in static models which are forced to burn hydrogen at the same rate as they
accrete it (Iben 1982). The blue point in the HR diagram of the locus formed by a sequence
of static models of fixed mass but different accretion rate is a bifurcation point (see Fig.
2 in Iben 1982), such that models of successively higher luminosity and lower surface
temperature than at the blue point have larger ∆MH, whereas models with successively
lower luminosity and surface temperature also have larger ∆MH. If one imagines turning
off the accretion rate in any particular model on the upper branch and letting this model
evolve statically, ∆MH in that model would decrease because of nuclear burning and the
model would evolve stably to the blue along the sequence, arriving at positions occupied by
static steady state models of the same (successively smaller) ∆MH.
If, however, mass accretion were switched off in a model along the lower branch and
this model were allowed to evolve statically, the model would evolve upward until it reached
the bifurcation point, at which position it would be faced with a quandary. It could not
evolve statically in either direction from the bifurcation point.
The implication of these thought experiments is that a real star evolving from red to
blue along the plateau branch can do so in a roughly static fashion, with ΦH ∼ 1 until,
on reaching the bifurcation point, hydrogen burning can no longer control the course of
evolution. The static approximation is no longer valid, ΦH plumets until hydrogen burning
is no longer of significance and gravothermal energy has taken over as the prime source of

– 13 –
surface luminosity.
These considerations allow us to make use of the properties of accreting models in the
quasistatic approximation to estimate, for small white dwarf masses, the lower boundary of
the region in the MWD-M plane where steady state accretion can occur. In Figure 5, the
rate ǫH of energy generation at the center of the hydrogen-burning shell (panel a) and the
rate MH at which the hydrogen-burning shell processes matter (panel b) in a model of mass
0.5236 M⊙ accreting Z = 0.02 matter at the rate 10−8 M⊙ yr−1 are shown. The position at
the maximum surface temperature occurs along the curves in both panels corresponds to
the bluest point in the HR diagram of Figure 1, and, there, log MH = −7.554
EDITOR: PLACE FIGURE 5 HERE.
In the MWD-MH−sh plane of Figure 6 are shown curves formed by four additional sets
of models for larger white dwarf masses but for the same accretion rate of 10−8 M⊙ yr−1.
The values of MH at the blue points for these model tracks and for several others are given
in Table 2, where ΦH, log Te and log(L/L⊙) at the blue points are also given.
EDITOR: PLACE FIGURE 6 HERE.
EDITOR: PLACE TABLE 2 HERE.
A linear fit to the properties of models at the bluest points in the HR diagram gives:
log Mlow(M⊙yr−1) = 2.073MWD
M⊙− 8.639, (1)
as the lower boundary of the region in which steady state accretion solutions exist over the
mass range 0.52 ≤ MWD/M⊙ ≤ 0.68.

– 14 –
An approximation to the upper boundary of the region where steady state solutions
exist can also be derived from the information in Figure 6. The “kink” in each curve near
the red end of each curve for the three largest white dwarf masses in Figure 6 actually
defines the point beyond which static solutions are of the red giant variety, with the
accretion rate being larger than the rate at which nuclear burning consumes fuel (Fujimoto
1982 a,b). In Table 3, the values of MH−sh for several models is shown, along with the
values of ΦH, log Te and log(L/L⊙) at the kink. A linear fit between the maximum allowed
accretion rate and the WD mass at the kinks provides
log Mhigh(M⊙yr−1) = 1.512MWD
M⊙− 7.800. (2)
This line defines the upper boundary of the region in which steady state accretion can occur
over the white dwarf mass range 0.52 ≤ MWD/M⊙ ≤ 0.68.
EDITOR: PLACE TABLE 3 HERE.
The method adopted here to estimate the boundaries of the steady burning zone was
introduced by Fujimoto (1982 a,b), who studied the properties of the hydrogen-burning
shell in accreting models using an analytical solution for the envelope. He found (see Fig.
4 in Fujimoto 1982b) the border lines to be parallel for white dwarf masses over the range
0.5-1.5 M⊙, while our border lines have different slopes. It is probable that our results
differ because of the approximations used in the analytical solution. The fact that our lower
border in the MWD-MH plane is steeper than the upper border is consistent with other
estimates in the literature (see, e.g. Fig. 7 in Iben & Tutukov 1996 and Fig. 10 in CIT).

– 15 –
5. The Thermal Behavior of the Hydrogen-Burning Shell as a Function of
Metallicity
To investigate the dependence on metallicity of the behavior of accreting white dwarfs, we
have computed two additional sets of models in which hydrogen-rich matter characterized,
respectively, by Z = 0.001 and Z = 0.0001 is accreted onto the same initial model of mass
0.516M⊙ at the same rate M = 10−8 M⊙ yr−1. To make more meaningful the comparison
between models accreting mass with different metallicities, we have adopted for all sets of
models the same helium abundance: Y = 0.28.
In the HR diagram of Figure 7 are shown the paths during one pulse cycle of models
of the three different metallicities. In all three cases, the total mass of the model is
M ∼ 0.5236M⊙. Several characteristics of the models are given in Table 4. The dependence
on the metallicity of various path characteristics can be understood relatively simply. At
the very lowest luminosities, all paths converge because the models adopt the essentially
metal-independent radius of a cold white dwarf. Because of smaller CNO abundances, the
temperatures and densities at the base of the accreted layer (see Table 4) must be larger in
models of lower metallicity in order for a CNO cycle thermonuclear runaway to be initiated:
in order to achieve larger densities and temperatures, more mass must be accumulated
by the lower metallicity models. This is why the time between pulses is larger, the lower
the metallicity. During the transition between the low and high states, the radius of the
expanding envelope is larger, the larger the mass of the envelope, and this explains why,
at any given luminosity, the lower the metallicity, the redder the model. The fact that the
reddest point along a path is bluer, the lower the metallicity, can be accounted for as an
envelope-opacity effect. Finally, during the plateau phase and during the cooling phase, the
fact that, at any luminosity, the model of lower metallicity is redder, is again ascribable
to the larger mass of the hydrogen-rich envelope and the consequent larger radius of the

– 16 –
envelope.
EDITOR: PLACE TABLE 4 HERE.
EDITOR: PLACE FIGURE 7 HERE.
EDITOR: PLACE FIGURE 8 HERE.
In Figure 8 we have reported for comparison the evolution of the main physical
quantities for the hydrogen-burning shell for the cases with Z = 0.001 and Z = 0.0001. The
evolution of ΦH in panel (d) of this figure demonstrates graphically how the durations of both
the high state (plateau phase) and the low state (cooling phase) increase with decreasing
metallicity. As we have argued, the plateau phase lasts longer, the lower the metallicity,
because the duration of the cooling phase and therefore the mass of hydrogen-rich material
accreted between thermonuclear runaways increases with decreasing metallicity. That the
amount of mass accreted during the low phase increases with decreasing metallicity is also
evident by analyzing panel (a) which show that, the smaller the metallicity, the greater is
the amount of fuel burned during the plateau phase. Figure 9 emphasizes this point once
again.
EDITOR: PLACE FIGURE 9 HERE.
It is evident from Figure 7, and the discussion in §4, that the band in the MWD − M
plane where steady state burning solutions exist drops to lower M as metallicity decreases.
The semianalytical relations obtained in §4 suggest that a ∼ 0.52 M⊙white dwarf accreting

– 17 –
hydrogen-rich matter with Z = 0.02 at 8 × 10⁻⁸ M⊙ yr−1 settles into a steady state
configuration, while, for an accretion rate of 2 × 10⁻⁸ M⊙ yr−1, it experiences recurrent
mild flashes. To explore quickly the effect of the choice of metallicity on the location
of the steady state band, we have calculated models of initial mass MWD = 0.516M⊙
and accretion rates 2 × 10⁻⁸ and 8 × 10⁻⁸ M⊙ yr−1, for metallicities of Z = 0.001 and
Z = 0.0001. The model accreting hydrogen at 8 × 10⁻⁸ M⊙ yr−1 settles into a red giant
configuration after only one pulse, while the model accreting at M = 2 × 10⁻⁸ M⊙ yr−1
settles into a steady state accretion configuration after one pulse.
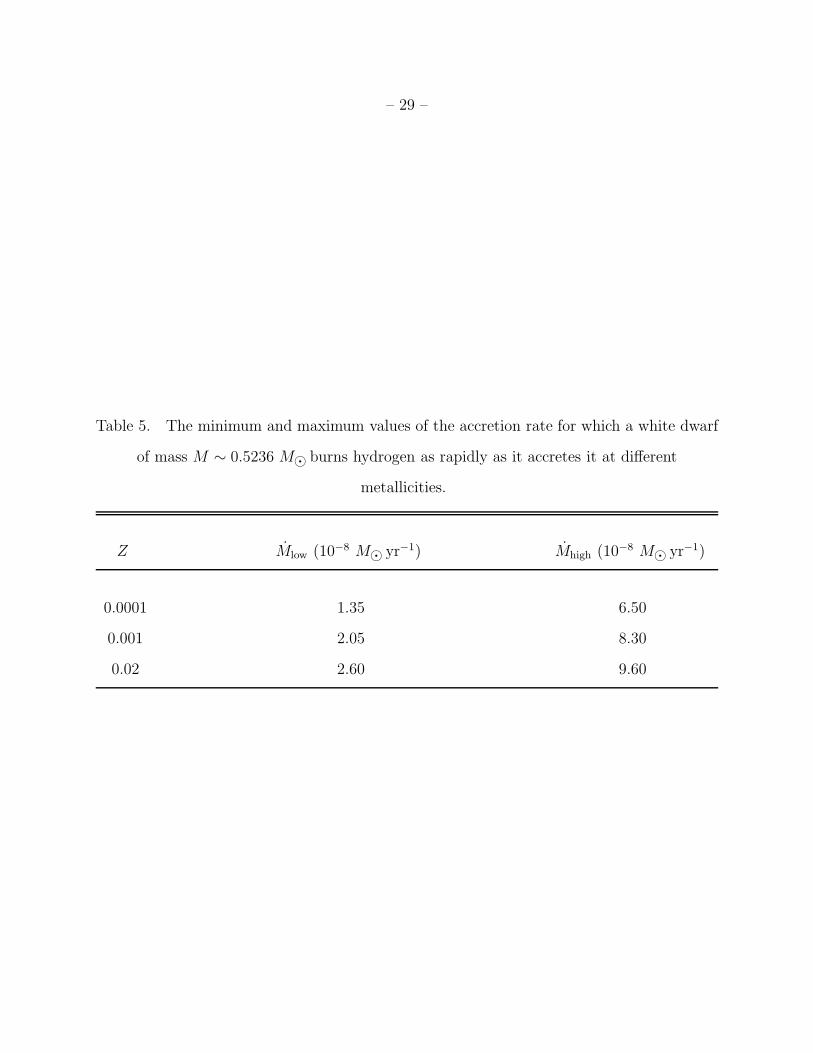
Adopting the method outlined in §4, we have estimated the limits of the steady burning
band for the three metallicities when MWD ≃ 0.5236 M⊙, obtaining the values listed in
Table 5.
EDITOR: PLACE TABLE 5 HERE.
We have followed the long term evolution of the low Z models, and from the results
(which will be described in detail elsewhere), we have estimated the upper and lower bounds
of the steady state band (see Tables 6 and 7, respectively).
EDITOR: PLACE TABLE 6 HERE.
EDITOR: PLACE TABLE 7 HERE.
The upper boundary may be approximated by
log(Mhigh(M⊙yr−1)) = 2.235 MWD/M⊙ − 8.350 Z = 0.0001 (3)
log(Mhigh(M⊙yr−1)) = 1.832 MWD/M⊙ − 8.043 Z = 0.001 (4)

– 18 –
and the lower boundary can be approximated by
log(Mlow(M⊙yr−1)) = 3.847 MWD/M⊙ − 9.874 Z = 0.0001 (5)
log(Mlow(M⊙yr−1)) = 2.969 MWD/M⊙ − 9.236 Z = 0.001 (6)
6. Summary and Conclusions
We have investigated and discussed in detail the evolutionary behaviour of a white dwarf
accreting hydrogen-rich matter of three different metallicities: Z = 0.02, 0.001, and 0.0001.
An analysis of the evolutionary behavior of several physical characteristics of the
models has shown that, for fixed values of MWD and M , lowering the metallicity causes the
recurrence period to become longer because, in order to achieve the larger temperatures
and densities necessary to offset the reduction of CNO catalysts in the accreted matter, the
thickness of the hydrogen-rich accreted layer must increase.
For the steady-state burning regime, we have been able to derive borders in the
MWD-M plane as they depend on the metal content of the accreted matter. In agreement
with earlier estimates, we find that the area of the region in this plane in which steady-state
burning takes place becomes narrower as the white dwarf mass is increased. In addition, the
location and the extension of the steady-state burning regime have been found to depend
critically on the metallicity of the accreted matter, as shown clearly in Figure 10, where
the topology of the steady-state region in the MWD − M plane is provided for the three
metallicities considered. Reducing the metallicity, the steady-state burning region drops to
smaller accretion rates and its extension is drastically decreased.
The consequences of our results for the final behavior of real low metallicity accretors
are not easy to predict. On the one hand, as metallicity is decreased, the hydrogen-burning

– 19 –
shell becomes hotter. This means that the underlying helium-burning layer is hotter and
less degenerate when a helium-burning thermonuclear runaway is initiated. On the other
hand, the fact that, for fixed core mass and accretion rate, the power of hydrogen-burning
flash decreases as the metallicity is reduced suggests that low metallicity accretors may
experience relatively mild helium shell flashes for a range of helium layer masses more
extended than in the solar metallicity case.
However, as extensively discussed in Piersanti et al.(1999), in the mild pulse regime,
there is a parameter region in which the effects of the hydrogen-burning shell on the helium
layer are negligible, and a model with characteristics in theis region behaves as if pure
helium is accreted. These models lead to a sub-Chandrasekhar explosion if the initial mass
of the white dwarf and the accretion rate are within a given range (see Fig. 1 in Tornambe
et al. 1998 for the solar metallicity case). Therefore, over the long term evolution, once
the helium-burning layer becomes thermally decoupled from the hydrogen-burning shell,
the accreted layer behaves in a way that depends only on the accretion rate and not on the
metallicity.
Due to the prohibitively long computing time required, we have only partially studied
the long term evolution of models accreting hydrogen-rich matter of metallicities Z = 0.001
and Z = 0.0001 at the mass-accretion rate of M = 10−8 M⊙ yr−1. Both models show that
the helium layer and the hydrogen-rich layer become decoupled as in the case of accretion
of hydrogen-rich matter of solar metallicity (Piersanti et al. 1999). Such models will likely
experience similar outcomes independent of the metallicity of the hydrogen-rich accreted
matter.
On the basis of the results obtained so far, we suggest that, on lowering the metallicity,
the area in the MWD − M plane suitable for sub-Chandrasekhar dynamical outcomes is
shifted toward slightly lower values of M , remaining almost unchanged in extention, as

– 20 –
indicated in Tornambe et al. (1998) for the solar metallicity. It has to be finally considered
that metallicity could even affect other parameters of the binary system (as, for instance,
initial white dwarf masses, accretion rates, etc) with the consequence that in the real world,
this scenario could be also significantly changed.

– 21 –
REFERENCES
Alexander, D. R. & Ferguson, J. W. 1994, ApJ, 437, 879
Cassisi, S., Iben, I. Jr. & Tornambe, A., 1998, ApJ, 496, 376 [CIT]
Chieffi, A. & Straniero, O. 1989, ApJS, 71, 47
Cox, A.N. & Stewart, J. 1970a, ApJS, 19, 243
Cox, A.N. & Stewart, J. 1970b, ApJS, 19, 261
Cox, A.N. & Tabor, J.E. 1976, ApJS, 31, 271
Fujimoto, M.Y., 1982a, ApJ, 257, 767
——, 1982b, ApJ, 257, 752
Grevesse, N. 1991, Evolution of Stars: The Photospheric Abundance Connection, in Proc.
IAU Symp. 145, Michaud, G. & Tutukov A. Eds., Kluwer Academic Publishers,
Dordrecht, p.63
Hachisu, I., Kato, M., & Nomoto, K. 1996, ApJ, 470, L97
Iben, I. Jr., 1982, ApJ, 259, 244
Iben, I. Jr. & Tutukov. A. V. 1984, ApJ, 282, 615
Iben, I. Jr. & Tutukov. A. V. 1996, ApJS, 105, 145
Jose, J., Hernanz, M. & Isern, J. 1993, A&A, 269, 291
Paczynski, B. & Zytkow, A.N. 1978, ApJ, 222, 604
Piersanti, L., Cassisi, S., Iben, I.Jr. & Tornambe, A., 1999, ApJ Lett., 521, L59

– 22 –
Ross, J.E. & Aller,L.H., 1976, Science, 191, 1223
Sparks, W. M., Starrfield, S., & Truran, J. W. 1978, ApJ, 220, 1063
Starrfield, S. 1971, MNRAS, 155, 129
Starrfield, S., Truran, J. W., & Sparks, W. M. 1978, ApJ, 225, 186
Tornambe, A., Iben, I. Jr., Piersanti, L., & Cassisi, S. 2000, in Future Directions of
Supernovae Research: Progenitors to Remnant, S. Cassisi & P. Mazzali Eds.,
Mem.S.A.It., in press
Sugimoto, D. & Fujimoto, M.Y., 1978, PASJ, 30, 467
Whelan, J.C. & Iben, I.Jr. 1973, ApJ, 186, 1007
This manuscript was prepared with the AAS LATEX macros v4.0.

– 23 –
Fig. 1.— The track in the HR diagram of a white dwarf of mass ∼ 0.5236M⊙ accreting
hydrogen-rich matter of composition Y = 0.28, Z = 0.02 at the rate M = 10−8 M⊙ yr−1.
Evolution progresses in a counter clockwise fashion along the track from the reddest point
(RP) to the bluest point (BP) and so on. The labels IC and EC indicate, respectively,
the onset and offset of shell convection driven by a hydrogen shell flash. ΦH = LH/Ls
and ΦHe = LHe/Ls where LH, LHe, and Ls are respectively, the hydrogen-burning, helium-
burning, and surface luminosities. In the plot we have also indicated selected specific models
for which thermal and nuclear burning characteristics are displayed in Figs. 3 and 4 (see
text).
Fig. 2.— The evolution during two successive pulse cycles of several characteristics of the
model shown in Fig. 1. In panel (a), the dashed line gives the total mass of the model and
the solid line gives the mass in the hydrogen-burning shell where the rate of nuclear energy
generation ǫH is at a maximum. Panels (b) and (c) give, respectively, the temperature and
density at the point where ǫH is at a maximum. In panel (d), Φgr = Lgr/Ls, Lgr is the rate
of release of gravothermal energy, and Ls and ΦH are defined in the caption of Fig. 1. Panel
(e) gives the radius of the point where ǫH is at a maximum and panel (f) gives the radius of
the surface.
Fig. 3.— The evolution of temperature profiles over the outer part of the accreting white
dwarf which follows the track in the HR diagram given in Fig. 1. Every curve corresponds
to one of the models indicated in Fig. 1 (see text).
Fig. 4.— The evolution of the profiles of the H-burning efficiency (ǫn) over the outer part of
the accreting white dwarf which follows the track in the HR diagram given in Fig. 1. Every
curve corresponds to one of the models indicated in Fig. 1, as described in the text.
Fig. 5.— The rate of energy generation at its maximum in the hydrogen-burning shell (panel

– 24 –
a) and the rate at which the center of the hydrogen-burning shell processes mass (panel b)
along the high luminosity branch for the model with M ∼ 0.5236 M⊙ and M = 10−8
M⊙ yr−1 for the solar metallicity case.
Fig. 6.— The rate at which the hydrogen-burning shell processes matter along the high
luminosity branch for four different white dwarf masses as labelled. Hydrogen-rich matter
with Y = 0.28 and Z = 0.02 is accreted at the rate 10−8 M⊙ yr−1.
Fig. 7.— Evolution in the HR diagram during one hydrogen-pulse cycle for white dwarf
models accreting hydrogen-rich matter with three different metallicities: Z = 0.02, 0.001
and 0.0001. The three models have almost the same mass (M ∼ 0.523M⊙).
Fig. 8.— The same as in Figure 2, but for the cases Z=0.001 (solid line) and Z=0.0001
(heavy dashed line) (see text).
Fig. 9.— Evolution of the mass coordinate of the center of the hydrogen-burning shell (where
the rate of energy generation is at a maximum) in models which accrete hydrogen-rich matter
with metallicities of Z = 0.02, 0.001, and 0.0001 at the rate M = 10−8 M⊙ yr−1.
Fig. 10.— The steady burning zone in the MWD−M plane for the three metallicity (Z=0.02,
Z=0.001 and Z=0.0001), as obtained in the present work.

– 25 –
Table 1. Selected evolutionary and structural properties of the initial model and of the
structure after it has experienced about 60 H-pulses.
Initial model Model after 60 H-pulses1)
Age (108 yr) 1.4488 1.4740
M (M⊙ ) 0.5168 0.5235
log(L/L⊙) -3.770 3.421
log(Te) 3.7479 5.324
log(R/R⊙) -1.858 -1.416
MH−sh (M⊙ ) 0.5163 0.5232
MHe−sh (M⊙ ) 0.4793 0.4793
log(TH−sh) 6.5666 7.7300
log(ρH−sh) 3.8968 1.5815
log(THe−sh) 6.5823 7,7600
log(ρHe−sh) 5.2824 3.4481
log(Tc) 6.6017 6.9355
log(ρc) 6.3700 6.4091
1)The listed quantities refer to the model at the bluest point along the loop in the HR
diagram.

– 26 –
Table 2. Minimum accretion rate for steady burning accretion as a function of white
dwarf mass. The chemical composition of the accreted matter is: Y = 0.28, Z = 0.02. The
location in the HR diagram of the bluest point along the track (log Te, logL/L⊙) and
ΦH = LH/L⊙ are also reported.
MWD(M⊙) log(M)(M⊙ yr−1) ΦH log Te log(L/L⊙)
0.520 -7.585 0.939 5.325 3.421
0.540 -7.520 0.952 5.334 3.562
0.560 -7.493 0.938 5.358 3.519
0.581 -7.428 0.942 5.380 3.583
0.600 -7.378 0.938 5.401 3.634
0.620 -7.345 0.930 5.423 3.671
0.640 -7.336 0.914 5.444 3.688
0.660 -7.255 0.942 5.460 3.755
0.680 -7.236 0.935 5.479 3.777

– 27 –
Table 3. Maximum accretion rate for steady state burning and position in HR diagram as
a function of white dwarf mass. Composition of accreted matter is the same as in Table 1.
The discontinuity in log Te at MWD > 0.6 M⊙ is due to a different approach in the
treatment of atmospheric layers adopted to prevent a huge expansion of the envelope.
MWD (M⊙) log(M) (M⊙ yr−1) ΦH log Te log(L/L⊙)
0.520 -7.018 1.042 4.474 3.949
0.540 -6.988 1.044 4.544 3.978
0.560 -6.958 1.024 4.434 4.014
0.580 -6.917 1.031 4.340 4.055
0.600 -6.894 1.005 4.236 4.088
0.620 -6.859 1.004 4.642 4.124
0.640 -6.821 1.005 4.583 4.161
0.660 -6.807 1.006 4.896 4.174
0.680 -6.779 1.006 4.923 4.203

– 28 –
Table 4. The principal characteristics of the helium- and hydrogen-burning shells as a
function of metallicity Z for models of mass M ∼ 0.5236 M⊙ accreting hydrogen-rich
matter at the rate M = 10−8 M⊙ yr−1.
Z = 0.02 Z = 0.001 Z = 0.0001
Perioda) 1.24 2.39 3.27
LH,maxb) 13.80 8.62 2.61
LH,minc) 0.394 0.650 1.450
LHe,maxd) 1.75 4.70 56.20
∆MH,maxe) 1.76 3.45 5.04
∆MH,minf) 5.70 12.70 23.20
log(TH,min)g) 7.385 7.436 7.496
log(TH,max)h) 7.953 7.990 8.005
log(ρH,min)i) 1.214 1.337 1.559
log(ρH,max)j) 2.734 2.956 3.067
a)Time between two successive H-flash (104yr).
b)Maximum luminosity of H-shell (105L⊙).
c)Minimum luminosity of H-shell (L⊙).
d)Maximum luminosity of He-shell (10−6L⊙).
e)Thickness in mass of H-shell at LH,max (10−4M⊙).
f)Thickness in mass of H-shell at LH,min (10−5M⊙).
g)Temperature of H-shell at LH,min
h)Temperature of H-shell at LH,max
i)Density of H-shell at LH,min
j)Density of H-shell at LH,max
– 29 –
Table 5. The minimum and maximum values of the accretion rate for which a white dwarf
of mass M ∼ 0.5236 M⊙ burns hydrogen as rapidly as it accretes it at different
metallicities.
Z Mlow (10−8 M⊙ yr−1) Mhigh (10−8 M⊙ yr−1)
0.0001 1.35 6.50
0.001 2.05 8.30
0.02 2.60 9.60

– 30 –
Table 6. Maximum accretion rate for steady state burning and position in the HR
diagram as a function of white dwarf mass. The chemical composition of accreted matter is
Y = 0.28 and Z = 0.0001 or Z = 0.001.
MWD(M⊙) log(M)(M⊙ yr−1) ΦH log Te log(L/L⊙)
Z = 0.0001
0.520 -7.187 1.083 4.835 3.762
0.540 -7.142 1.125 4.890 3.791
0.560 -7.100 1.122 4.899 3.834
0.580 -7.058 1.062 4.863 3.900
0.591 -7.025 1.101 4.886 3.918
0.600 -7.005 1.104 4.892 3.937
Z = 0.001
0.520 -7.084 1.099 4.706 3.859
0.540 -7.060 1.073 4.704 3.894
0.560 -7.022 1.086 4.751 3.927
0.580 -6.978 1.084 4.731 3.971
0.590 -6.960 1.089 4.707 3.987

– 31 –
Table 7. Minimum accretion rate for steady state burning and position in the HR
diagram as a function of white dwarf mass for two different assumptions on the
metallicities of the accreted matter and the same He content.
MWD(M⊙) log(M)(M⊙ yr−1) ΦH log Te log(L/L⊙)
Z = 0.0001
0.520 -7.870 0.967 5.206 3.142
0.540 -7.795 0.966 5.235 3.204
0.560 -7.721 0.964 5.259 3.279
0.580 -7.639 0.963 5.284 3.362
0.591 -7.598 0.963 5.295 3.402
0.600 -7.519 0.968 5.304 3.479
Z = 0.001
0.520 -7.691 0.964 5.268 3.310
0.540 -7.631 0.965 5.279 3.369
0.560 -7.583 0.961 5.302 3.418
0.580 -7.510 0.961 5.325 3.491
0.590 -7.482 0.960 5.338 3.520