hydrogel-forming microneedle arrays: potential for use … · eyman eltayiba,b, aaron j. bradya,...
TRANSCRIPT

Hydrogel-forming microneedle arrays: Potential for use in minimally-invasive lithium monitoring
Eltayib, E., Brady, A. J., Caffarel-Salvador, E., Gonzalez Vazquez, P., Zaid Alkilani, A., McCarthy, H. O., ...Donnelly, R. F. (2016). Hydrogel-forming microneedle arrays: Potential for use in minimally-invasive lithiummonitoring. European Journal of Pharmaceutics and Biopharmaceutics, 102, 123-131. DOI:10.1016/j.ejpb.2016.03.009
Published in:European Journal of Pharmaceutics and Biopharmaceutics
Document Version:Publisher's PDF, also known as Version of record
Queen's University Belfast - Research Portal:Link to publication record in Queen's University Belfast Research Portal
Publisher rights© 2016 The AuthorsThis is an open access article published under a Creative Commons Attribution License (https://creativecommons.org/licenses/by/4.0/),which permits unrestricted use, distribution and reproduction in any medium, provided the author and source are cited.
General rightsCopyright for the publications made accessible via the Queen's University Belfast Research Portal is retained by the author(s) and / or othercopyright owners and it is a condition of accessing these publications that users recognise and abide by the legal requirements associatedwith these rights.
Take down policyThe Research Portal is Queen's institutional repository that provides access to Queen's research output. Every effort has been made toensure that content in the Research Portal does not infringe any person's rights, or applicable UK laws. If you discover content in theResearch Portal that you believe breaches copyright or violates any law, please contact [email protected].
Download date:24. Sep. 2018

European Journal of Pharmaceutics and Biopharmaceutics 102 (2016) 123–131
Contents lists available at ScienceDirect
European Journal of Pharmaceutics and Biopharmaceutics
journal homepage: www.elsevier .com/locate /e jpb
Research paper
Hydrogel-forming microneedle arrays: Potential for usein minimally-invasive lithium monitoring
http://dx.doi.org/10.1016/j.ejpb.2016.03.0090939-6411/� 2016 The Authors. Published by Elsevier B.V.This is an open access article under the CC BY license (http://creativecommons.org/licenses/by/4.0/).
Abbreviations:MN, microneedle (s); ISF, interstitial fluid; TDM, therapeutic drugmonitoring; PMVE/MA (Gantrez� AN-139), poly(methylvinylether-co-maelic anhy-dride); PEG, poly(ethyleneglycol); N, Newtons; OCT, optical coherence tomography;PBS, phosphate buffered saline; FAAS, flame atomic absorption spectrometry; SD,Sprague–Dawley; RI, reverse iontophoresis.⇑ Corresponding author at: Chair in Pharmaceutical Technology, School of
Pharmacy, Queen’s University Belfast, Medical Biology Centre, 97 Lisburn Road,Belfast BT97BL, UK.
E-mail address: [email protected] (R.F. Donnelly).
Eyman Eltayib a,b, Aaron J. Brady a, Ester Caffarel-Salvador a, Patricia Gonzalez-Vazquez a,Ahlam Zaid Alkilani a,c, Helen O. McCarthy a, James C. McElnay a, Ryan F. Donnelly a,⇑a School of Pharmacy, Queen’s University Belfast, 97 Lisburn Road, Belfast BT97BL, UKb School of Pharmacy, Ahfad University for Women, Arda Street, Omdurman 167, Sudanc School of Pharmacy, Zarqa University, Zarqa 132222, Jordan
a r t i c l e i n f o
Article history:Received 18 December 2015Revised 26 February 2016Accepted in revised form 7 March 2016Available online 9 March 2016
Keywords:MicroneedlesLithiumTherapeutic drug monitoring
a b s t r a c t
We describe, for the first time, hydrogel-forming microneedle (s) (MN) arrays for minimally-invasiveextraction and quantification of lithium in vitro and in vivo. MN arrays, prepared from aqueous blendsof hydrolysed poly(methyl-vinylether-co-maleic anhydride) and crosslinked by poly(ethyleneglycol),imbibed interstitial fluid (ISF) upon skin insertion. Such MN were always removed intact. In vitro, meandetected lithium concentrations showed no significant difference following 30 min MN application toexcised neonatal porcine skin for lithium citrate concentrations of 0.9 and 2 mmol/l. However, after1 h application, the mean lithium concentrations extracted were significantly different, being appropri-ately concentration-dependent. In vivo, rats were orally dosed with lithium citrate equivalent to15 mg/kg and 30 mg/kg lithium carbonate, respectively. MN arrays were applied 1 h after dosing andremoved 1 h later. The two groups, having received different doses, showed no significant differencebetween lithium concentrations in serum or MN. However, the higher dosed rats demonstrated a lithiumconcentration extracted from MN arrays equivalent to a mean increase of 22.5% compared to rats whichreceived the lower dose. Hydrogel-forming MN clearly have potential as a minimally-invasive tool forlithium monitoring in outpatient settings. We will now focus on correlation between serum and MNlithium concentrations.� 2016 The Authors. Published by Elsevier B.V. This is an open access articleunder the CCBY license (http://
creativecommons.org/licenses/by/4.0/).
1. Introduction
Despite the introduction of a wide range of mood stabilizingagents, lithium is still considered the ‘gold standard’ treatmentfor bipolar (BP) disorder [1,2]. As a pharmacological agent, lithiumis a cornerstone of neuropsychopharmacology, primarily used totreat BP affective disorder, where it can improve both manic anddepressive symptoms [3]. In addition, it also has many off-labeluses, including treatment of alcoholism, hyperthyroidism, person-ality disorders, traumatic brain injury, tardive dyskinesia and
postpartum affective psychosis [4]. Lithium, like all alkali metals,is highly reactive [5]. Therefore, it readily forms, and can be admin-istered as, salts such as citrate, sulphate, chloride and, most com-monly, carbonate. These salts are available in several differentdosage forms, such as syrup and both conventional and sustainedrelease tablets and capsules [4,6].
Early studies reported the effects of lithium on many neuro-transmitter and neuromodulatory systems such as the cholinergic,monoaminergic and gamma-aminobutyric acid (GABA) systems[7]. Many theories speculate on the mechanism of lithium’s moodstabilizing action. The initial accepted mechanism of action (MOA)of lithium in BP disorder suggested that lithium interfered withneuronal sodium–potassium electrogenic pumps and, in doing so,altered synaptic transmission [6,7]. However, recent evidence hasindicated that lithium may have several MOA, including a directeffect on glutamatergic neural transmission, notably via neuronalexcitability at hippocampal cornu ammonis (CA) 1 synapses,thereby improving the excitatory postsynaptic potentials [7].

Movable aluminium probe
MN array
Aluminium block
Fig. 2. Texture Analyser set-up for application of compressional forces to MN array.
124 E. Eltayib et al. / European Journal of Pharmaceutics and Biopharmaceutics 102 (2016) 123–131
Following oral administration, lithium is rapidly absorbed fromthe gastrointestinal tract (GIT) with a peak plasma concentration(Cpmax) achieved after 1–5 h, and a half-life (t½) of approximately22 h [8]. In addition, lithium does not bind to plasma proteins,has a large volume of distribution (Vd) and can accumulate inmany tissues [9]. Depending on its formulation, it has an80–100% oral bioavailability and steady state concentration (Cpss)in blood is typically achieved within 4–5 days of starting treatment[8–10]. More than 95% of lithium is excreted unchanged throughthe kidneys. Over 80% of filtered lithium is reabsorbed in the prox-imal tubules and at Cpss, lithium clearance is directly proportionalto the glomerular filtration rate (GFR) [9–11]. The clinically effec-tive plasma concentration of lithium in human typically rangesfrom 0.4 to 1.2 mmol/l. This narrow therapeutic window can pre-dispose patients to lithium toxicity with even minor changes inhealth status or co-prescribed medications. As such, continuedlithium therapy requires regular therapeutic drug monitoring(TDM) to ensure optimum clinical benefits without the risk of tox-icity [6]. Lithium toxicity in humans is a life threatening conditionand typically occurs when serum concentrations exceed 1.5 mmol/l. Adverse effects include muscle weakness, coarse tremor, slurredspeech, seizures and irreversible renal damage. Adverse effects oflithium on the kidney and thyroid gland have also been observedduring long term use, even when a serum concentration is main-tained within the recommended therapeutic window [12]. More-over, the combination of a reduced Vd and reduced renalclearance of lithium in the elderly frequently leads to a lower tol-erability with increasing age and, therefore, neurotoxicity mayoccur in the elderly at concentrations considered therapeutic inhealthy adult populations [13]. Therefore, accurate, precise andregular TDM of lithium is crucial to ensure safe and beneficialtreatment of patients. Typical regimes suggest that, upon com-mencement of lithium therapy, TDM should be performed on aweekly basis. However, once the patient is established on theirrequired therapeutic dose, TDM is typically only performedmonthly [14] (see Figs. 1 and 2).
Clinical laboratories employ several methods for themeasurement of lithium in serum. These include flame atomicabsorption spectrometry (FAAS), flame emission spectrometry(FES), inductively-coupled plasma mass spectrometry (MS) and
Centrifugation: 3,500 rpm
Dr
A B
Fig. 1. Diagrammatic representation of steps involved in the preparation of polymeric M3500 rpm for 15 min. Upon drying for 48 h (C) and heating for 24 h at 80 �C (D) to induce cpolymeric MN array (E) and side walls removed using a hot scalpel blade (F).
ion-selective electrodes (ISE) [15,16]. Colorimetric, photometricand enzymatic methods have also been used for TDM purposes[16]. Of these methods, FAAS is the most commonly used tech-nique, due to its sensitivity and simplicity [15–17]. Despite thevaluable clinical data provided by TDM, its practical applicationin clinical settings can be greatly limited by the high cost andtime-consuming nature of analytical procedures, as TDM requiresrepetitive withdrawal of blood samples by nursing or medically-trained personnel using hypodermic needles [18]. Sampling is,therefore, invasive and often painful, especially in patients withdifficult venous access [19,20]. In addition to the need for trainedpersonnel, the use of conventional needles is often associated witha risk of infection or transmission of blood-borne diseases, due toaccidental needle-stick injuries and/or improper needle disposal[20]. Notably, previous attempts to monitor lithium using eithersaliva or urine, as alternatives to TDM using blood, have not provento be successful [20,21]. Therefore, developing a minimally-invasive method would be a major advance in lithium TDM, allow-ing non-medically trained personnel, or the patient themselves, tomonitor their lithium levels, thus ensuring patients are receivingthe optimum dose.
ISF has previously been proposed as a viable alternative toplasma or serum as a source for TDM [22]. The composition of
ying for 48h Room Temp
H2O H2O H2O
Crosslinking:24h 80 °C
Conventional ovenC
D
E F
N. (A) Polymer matrix was transferred to the silicone mould and (B) centrifuged atrosslinking via esterification, the silicone mould was carefully peeled away from the

E. Eltayib et al. / European Journal of Pharmaceutics and Biopharmaceutics 102 (2016) 123–131 125
ISF closely resembles that of plasma, but without the plasma pro-teins. Sampling ISF is a potentially non-invasive and painless pro-cedure. In addition, sample preparation and analysis of ISF can besimpler than those of blood, as it contains smaller quantities ofcells and proteins [22]. Reverse iontophoresis (RI) has previouslybeen proposed as a viable non-invasive sampling method forlithium TDM, using ISF as an alternative TDM sampling reservoir[19]. However, RI has several problematic issues. These includethe need for relatively complicated technology, a ‘warm-up’ timeof 2–3 h and the need for preliminary calibration [19,23,24]. Theseissues present obvious practical problems which could potentiallypreclude their use by non-trained personnel. Furthermore, indeveloping countries, where access to the appropriate technologymay be limited, the cost of suitable RI equipment may beprohibitive.
MN arrays have recently been proposed by our Group as analternative approach for sampling ISF [20]. MN arrays are com-posed of tiny projections (50–900 lm in height) attached to a basesupport, as previously described [25]. Upon insertion into the skin,MN bypass the stratum corneum, the skin’s outermost barrier layer,and extract ISF without causing pain or bleeding [20,23]. AlthoughMN arrays have been fabricated from a range of materials, includ-ing metal, silicon and biodegradable polymers [26] our Group hasfocused on MN prepared from hydrogel-forming polymers [27].Such systems consist of a cross-linked polymer network that, uponcontact with an aqueous solution, swell to several times their orig-inal volume whilst remaining insoluble, therefore maintainingtheir structural integrity [28]. In their dry state, hydrogel-forming MN possess sufficient mechanical strength to pierce thestratum corneum. However, once in situ they rapidly uptake ISFand, in doing so, can obtain a sample of the analyte of interest.The MN can then be removed intact, allowing subsequent extrac-tion and analysis of the analyte of interest.
Here we describe, for the first time, the use of our hydrogel-forming MN to detect lithium via ISF in vivo. This study aims toevaluate the potential of hydrogel-forming MN as a minimally-invasive tool for in vivo transdermal lithium monitoring.
2. Material and methods
All animal experiments throughout this study were approvedby the Ethics Committee of the QUB Biological Services Unit andconducted according to the policy of the Federation of EuropeanLaboratory Animal Science Associations (FELASA) and The Euro-pean Convention for the protection of Vertebrate Animals usedfor Experimental and Other Scientific Purposes, with implementa-tion of the principle of the 3Rs (replacement, reduction, refine-ment). Any animals with 20% weight loss during the study wereto be removed for euthanasia, but this did not occur. No skin reac-tions to MN occurred either. At the end of the experiment, eutha-nasia was by carbon dioxide.
2.1. Chemicals
Poly(methylvinylether-co-maelic anhydride) (PMVE/MA) (Gan-trez� AN-139) was a gift from Ashland (Kidderminster, UK). Poly(ethyleneglycol) (PEG) 10,000 daltons and lithium citrate hydratewere obtained from Sigma–Aldrich, Poole, Dorset, UK. Isoflurane(Isoflo�) was obtained from Abbott Laboratories, Illinois, USA.Reference-grade lithium analytical solution (1000 mg/l) wasobtained from J.T. Baker, Radnor, USA. Syringe filters (0.2 lm cellu-lose acetate) were obtained from Chromacol, Herts, UK. All otherchemicals were of analytical reagent grade. Millipore HPLC-gradewater was used throughout the study.
2.2. Preparation of hydrogel-forming MN
Aqueous blends containing hydrolysed PMVE/MA (11.1%) andPEG 10,000 (5.6%) were used to fabricate MN arrays (19 � 19arrays, 600 lm in height, with a base width of 300 lm and inter-spacing of 50 lm) by using laser-engineered silicone micromouldtemplates [27,29]. MN were crosslinked (esterification reaction)[30] by heating at 80 �C for 24 h and sidewalls removed using aheated blade [27,29]. Formulation and mechanical properties ofsuch hydrogel-forming MN have previously been reported [31].
2.3. Mechanical analysis
A TA.XT-plus Texture Analyser (Stable Microsystem, Haslemere,UK) was employed in compression mode, as previously described[31], to investigate the application of varying axial compressionloads on the fabricated hydrogel-forming MN arrays. MN wereexamined under a light microscope (GXMGE-5 digital microscope,Laboratory Analysis Ltd., Devon, UK) before and after application ofthe compression load to assess the percentage height reduction.Compression forces of 0.18 and 0.7 Newtons (N) per needle wereapplied, values which are approximately double and tenfold theaverage manual application force of 30 N (0.083 N/needle), as pre-viously reported [32].
2.4. Optical coherence tomography
Optical coherence tomography (OCT) was used to evaluate theMN penetration characteristics into full thickness neonatal porcineskin (1.0 mm), a good model for human skin [33], obtained fromstill-born piglets, in vitro. Hydrogel-forming MN arrays wereinserted into porcine skin using manual force (thumb pressure)for 60 s, after which adhesive tape was applied to keep them inplace. OCT imaging was used to visualize in situ MN penetrationas previously described [34]. Images obtained were analysed usingImage J� software (National Institutes of Health, Bethesda, MD,USA). Depth and the pore diameter created by MN arrays weremeasured using Ability Photopaint� Version 4.1.4 (Ability PlusSoftware Ltd., Crawley, UK) which added additional colour, therebyenhancing the contrast between the skin layer and MN arrays.
2.5. In skin-swelling study
The in-skin swelling characteristics of hydrogel-forming MNarrays were investigated using full-thickness neonatal porcineskin. Prior to testing, the height and base width of 10 MN arrayswere measured using a digital light microscope (GXMGE-5 digitalmicroscope, Laboratory Analysis Ltd., Devon, UK). Skin sampleswere gently shaved and equilibrated in phosphate buffered saline(PBS, pH 7.4) for 15 min. A circular specimen of skin was then driedand mounted on a modified Franz diffusion cell (15 mm orificediameter, synchronous stirring at 600 rpm and thermostated at37 ± 1 �C, Crown Glass Co. Inc., Sommerville, NJ, USA) usingcynoacrylate adhesive (Loctite Ltd., Dublin, Ireland), with the stra-tum corneum accessed as previously described [34]. MN were keptin the skin for 1 h before careful removal and visualization usingdigital microscopy, which measured both height and width ofMN tested. Skin barrier integrity was confirmed as maintained,post-shaving, by using trans-epidermal water loss (TEWL) mea-surements from a Delfin Vapometer (Delfin Technologies, Surrey,UK).
2.6. Preliminary drug uptake and ability to release study
Preliminary investigations into drug uptake and release werecarried out by swelling hydrogel-forming MN arrays for 30 min

126 E. Eltayib et al. / European Journal of Pharmaceutics and Biopharmaceutics 102 (2016) 123–131
in weighing boats containing 20 ml of lithium citrate in PBS solu-tion. Concentrations equivalent to 0.9 and 2 mmol/l lithium car-bonate were chosen to replicate therapeutic and toxicconcentrations in humans, respectively [35]. After 30 min, MNarrays were removed from the weighing boats, surface PBSremoved using filter paper and the MN placed into glass vials.The lithium taken up by the MN was extracted using three differ-ent release media: (A) deionized water, (B) 2% v/v hydrochloricacid (HCl, pH = 0.85) and (C) 0.1% w/v potassium chloride (KCl).Three ml of each medium was added separately to each vial con-taining a swollen MN, and the contents allowed to settle for onemin. Each vial was subsequently vortexed for 1 min and all freefluid in each vial collected, filtered and analysed using FAAS at awavelength of 670.8 nm.
2.7. Lithium recovery from MN
To confirm reproducable recovery of lithium from MN anddemonstrate an acceptable extraction efficiency using KCl as anextraction medium, 15 ll of a lithium carbonate standard solution(1000 lg/ml) was spiked onto a MN array. Extraction of spikedlithium from each MN was then performed by placing the spikedMN array into a sterile glass vial containing 2 ml of a 0.1% w/vKCl solution as the extraction medium. As described previously,the glass vial was allowed to settle for one min and vortexed forone min and the remaining free solution was filtered using a0.2 lm cellulose acetate syringe filter. The filtrate was then aspi-rated into a FAAS machine for analysis. The percentage recovery(extraction efficiency) was calculated according to Eq. (1):
Extraction efficiency ¼ the measured lithium concentration in the extraction mediumthe expected lithium concentration after full recovery
x 100 ð1Þ
2.8. In vitro lithium uptake
In vitro MN-mediated lithium monitoring was conducted acrossdermatomed neonatal porcine skin (300–400 lm thickness), previ-ously demonstrated as a suitable skin model to predict MN perfor-mance in vivo [36]. The neonatal porcine skin was mounted on amodified Franz-cell set-up, as previously described [34] and MNarrays were applied under thumb pressure and held for 60 s. Thein vitro uptake study was carried out using Franz-cell receptorchambers thermostated at 37 ± 1 �C, containing two different con-centrations of lithium citrate equivalent to 0.9 and 2 mmol/llithium carbonate. MN arrays were removed at 30 min and 1 h,and lithium was extracted, as outlined above.
2.9. In vivo MN lithium monitoring
Six healthy male SD rats, aged 11–14 weeks and weighing300–400 g, were divided into two groups (1 and 2), with three ratsin each group. Groups 1 and 2 were administered lithium citrate,via oral gavage, equivalent to 15 and 30 mg/kg body weight,respectively. Lithium was dosed in the form of the citrate saltrather than lithium carbonate due to lithium citrate’s higher watersolubility at room temperature (74.5 g/100 g) compared to that oflithium carbonate (1.29 g/100 g) [37]. One h after gavage, four MNarrays were applied to the shaved, hairless back of each SD rat andleft in place for 1 h. TEWL measurements were again used to con-firm maintenance of skin barrier function. An adhesive patch wasthen applied to further secure the MN arrays, whilst an occlusivedressing was applied to cover the surrounding area to prevent
the rats from removing the MN arrays [38]. Following MN removal,blood samples were collected via cardiac puncture.
2.10. Serum preparation method
For assay method development, fresh rat blood was obtainedfrom healthy SD rats. Serum was separated by incubating tubescontaining blood at room temperature for one h to allow clottingto occur. The tubes were then centrifuged at 1500 Relative Cen-trifugal Force (RCF) for 15 min and 200 ll of the supernatant wastransferred to disposable glass culture vials. Following this,200 ll of 20% w/v trichloroacetic acid (TCA) was added to 200 llserum in the glass vials to precipitate proteins. This was followedby addition of 1600 ll of a 0.1% w/v KCl solution as a diluting med-ium. The glass tube was then placed on ice for 30 min followed bycentrifugation at room temperature for 10 min at 6000 rpm. Thesupernatant was placed in a fresh glass culture tube and again cen-trifuged for 5 min at 6000 rpm. The resulting supernatant was thendirectly aspirated into the FAAS machine for analysis.
2.11. Analytical technique
A flame atomic absorption spectrophotometer (Shimadzu, AA-6300, Tokyo, Japan) was used for determination of lithium ion con-centration in all samples. Determination of lithium ions concentra-tion was made at 670.8 nm and a burner height of 7 mm using apre-mixed air-acetylene flame. The device was operated in theabsorption mode, using an SR-lithium hollow cathode lamp (SIM-LabHut Ltd., Gloucestershire, UK) at a current of 8 mA. Least square
linear regression and correlation analysis were carried out on thecalibration curves obtained to determine equation of the line, coef-ficient of determination and residual sum of squares (RSS). Stan-dard lithium solutions of 5 lmol/l in KCl (0.1% w/v solution) and0.1 mmol/l in serum were used to determine the lower limit ofquantification (LLoQ). Five replicates were used and precisionand accuracy determined for each concentration. Linearity, preci-sion, accuracy and recovery analysis were conducted according toInternational Conference on Harmonisation (ICH) guidelines [39].The accuracy and precision of the method were determined fromanalysis of samples at three concentrations, representing the low,medium and high sections of the standard curves (LQC, MQC andHQC respectively) [39]. Specifically, concentrations of 0.03, 0.07and 0.15 mmol/l in KCl 0.1% w/v and of 0.7, 1.2 and 1.8 mmol/lin serum were used as LQC, MQC and HQC, respectively.
2.12. Statistical analysis
Statistical comparisons were conducted where appropriateusing a t-test or one or two-way analysis of variance (ANOVA). Inall analyses, a p value < 0.05 denoted statistical significance. Thestatistical analysis was performed using Graph Pad� Prism soft-ware Version 5.03, CA, USA.
3. Results and discussion
MN technology represents a new and exciting approach forminimally-invasive TDM and diagnosis [26], allowing sampling of

0.18 N
/needle
0.7 N
/needle
0
10
20
30
40
50
Compressional Force
% R
educ
tion
in M
N h
eigh
t
Fig. 3. Percentage reduction in height of needle MN arrays following the applica-tion of different compressional forces (Means ± SD, n = 3).
E. Eltayib et al. / European Journal of Pharmaceutics and Biopharmaceutics 102 (2016) 123–131 127
drug molecules from skin ISF without causing pain or bleeding. OurGroup has focused on hydrogel-forming MN, which are hard whendry but, upon insertion into skin, imbibe ISF from skin and turninto discrete in situ hydrogel bulbs (Fig. 4b), which can then beremoved intact. Upon removal, an offsite analysis is currently usedto detect the target analyte [20]. However, future work in MN tech-nology could exploit Internet-based off-site analysis, or potentiallyincorporate sensors in situ (‘lab on a chip’ technology) to monitorthe drug of interest [40]. In addition, hydrogel-forming MN offerfurther advantages over hypodermic needles, including elimina-tion of pain, erythema, needle-stick injuries and risk of infections[18,41].
3.1. Mechanical analysis
As shown in Fig. 3, results obtained from the compression testsdemonstrate that the reduction in MN height increased with anincrease in application force (p < 0.05). The minimum force applied
Fig. 4a. OCT visualization of dry MN array immediately following insertion intoexcised neonatal porcine skin in vitro.
was 0.18 N/needle, equal to 64.98 N/array, greater than double theaverage achievable manual force and close to the maximum man-ual force value. The maximum force applied was 0.7 N/needlewhich equals ten times the average manual force, as described pre-viously [32]. As shown in Fig. 5b and c, despite application of highcompressional forces, MN arrays did not break when pressedagainst the aluminium plate.
3.2. OCT analysis
OCT has the ability to visualize MN penetration into the skinand observe subsequent dissolving or swelling patterns. In addi-tion, previous studies have demonstrated its potential as a toolto study MN penetration depth across the stratum corneum [34].As shown in Fig. 4a, MN arrays were able to penetrate full thick-ness neonatal porcine skin upon application, with an insertiondepth and pore size diameter of 229.4 ± 17.7 and 195.58 ± 19 lm,respectively. As shown in Fig. 4b, following 1 h insertion, MNarrays had swollen considerably and, in doing so, lost their sharp-ness, as is apparent in Fig. 4a. Crucially, however, they remainedintact, allowing complete removal. This confirms that swellingdoes not result in ejection of MN from the skin and highlightsthe safety of our hydrogel-forming MN technology as a tool forTDM without risk of infection caused by accidental needle-stickinjuries, an issue of concern highlighted as a drawback for MN pre-pared from other materials [41].
3.3. In-skin swelling
The swelling of MN arrays following insertion into the skin wasinvestigated in vitro over 1 h. Individual needles on the arrayexhibited an increase in height and width of 9.2 ± 2.9% and19.13 ± 2.9%, respectively. Notably, these hydrogel MN arraysimbibed PBS fluid and were swollen, but crucially, remainedin situ and again were removed intact.
3.4. Drug uptake and extraction media
As shown in Table 1, extraction of lithium from hydrogel-forming MN bathed in PBS solutions containing different
Fig. 4b. OCT visualization of MN array, swollen with lithium solution, after onehour insertion into excised neonatal porcine skin in vitro.

Table 1Lithium extracted (lmol) using different extraction media (Mean ± SD, n = 4).
Extracting media Concentration extractedfrom MN bathed in0.9 mmol/l solution
Concentration extractedfrom MN bathed in2 mmol/l solution
Deionized water 4.5 ± 2.6 318.1 ± 12.7HCl 2% v/v 87.7 ± 5.3 131.3 ± 12.1KCL 0.1% w/v 83.7 ± 5.9 123.5 ± 8.3
Table 3Recovery of lithium from spiked MN (Mean recovery ± SD, n = 10).
Li+ concentration spikedonto MN (mmol/l)
Extractedconcentration (mmol/l)
% Recovery
1.08 0.95 ± 0.08 88.68 ± 7.8
128 E. Eltayib et al. / European Journal of Pharmaceutics and Biopharmaceutics 102 (2016) 123–131
concentrations (0.9 and 2 mmol/l) of lithium citrate, and subse-quently analysed by FAAS, increased with the increased lithiumconcentration in the bathing solution. This was the case for allextraction media. However, extraction of lithium using HCl 2% v/v (pH = 0.85) was significantly more efficient when compared todeionized water as an extraction medium (p < 0.05). This maypotentially be due to the associated increased concentration ofprotons (H+) in the acidic HCl solution. As protons possess a highercharge density than lithium ions, and carboxylate ions showgreater affinity to such cations, it is possible that protons are sub-stituted for the lithium ions of the carboxylate group in the MNmatrix [42]. Similarly, KCl 0.1% w/v solution was studied as apotential medium for lithium extraction. Statistically, there wasno difference between the extraction efficiency of HCl 2% v/v solu-tion when compared to 0.1% w/v KCl solution (p < 0.05). Based onthese findings, KCl 0.1% solution was chosen as the extraction med-ium for the remainder of the study due to its lower potential fortoxicity and greater safety when handling.
3.5. Validation of analytical method using KCl as extraction media
FAAS was used for quantification of lithium in both serum andKCl solutions. All data were validated according to ICH guidelines[39]. The slope, R2 and limits of quantification are summarized inTable 2.
The drug uptake and release findings in combination show theKCl solution to be a suitable extraction medium for lithium. Fur-thermore, the presence of potassium potentially suppresses theionization of other easily ionized cations, such as sodium, and min-imizes chemical interference [43,44]. Chemical interference intransdermal ion analysis has been attributed to small, mobilecations, such as sodium and potassium, which are present in con-stant concentrations and can be transported across the skin in asimilar way to lithium [21] and, therefore, could be simultaneouslyextracted. Potassium ions in solution do not interfere in the lithiumquantification as they were present at a constant concentration inall extractions.
Fig. 5. Digital microscope images of hydrogel-forming MN following application ofcompressional forces (0.18 and 0.7 N/needle) (Means ± SD, n = 3). (a) 19 � 19 MNarray before application of compressional force. (b) 19 � 19 MN array afterapplication of compressional force equal to 0.18 N/needle. (c) 19 � 19 MN arrayafter application of compressional force equal to 0.7 N/needle.
3.6. Lithium recovery from MN
As shown in Table 3, lithium extraction efficiency from spikedMN was 88.68 ± 7.8%.
This percentage recovery indicates that extraction of lithiumfrom hydrogel-forming MN using the method developed is highlyefficient. Significantly, the percentage recovery in this study fallswithin recommended guidelines which accept deviation of±0.3 mmol/l (or 20%) as acceptable error limits based on UnitedStates Food and Drug Administration (FDA) guidelines [45].
Table 2Calibration curve properties for lithium in serum and KCl 0.1% w/v solution (n = 5).
Slope y-Intercept R2 LoQ (mmole/l)
Serum 0.0161 0.0004 0.99 0.1KCl 0.1530 0.0006 0.99 0.005
3.7. In vitro lithium uptake
As shown in Fig. 6, a significant increase (p < 0.05) in extractedlithium concentration was observed when MN insertion time wasincreased from 30 min to 1 h. Notably, this effect was observed forboth lithium concentrations (0.9 and 2 mmol/l). Although no sig-nificant difference (p > 0.05) was observed between extractedlithium values following in vitro MN application after 30 min, ahighly significant difference (p < 0.01) was observed in lithium
0.5 10.0
0.1
0.2
0.3
0.4
0.50.9 mmol/l
2 mmol/l
MN application time (h)
Ext
ract
ed L
i+ conc
entr
atio
nby
MN
(mm
ol/l)
Modified Franz cell lithium concentration
Fig. 6. Concentration of lithium extracted from hydrogel-forming MN afterinsertion into neonatal porcine skin mounted on modified Franz cells and bathedon the underside by 0.9 and 2 mmol/l lithium citrate in PBS (Means ± SD, n = 4).( = significant, = highly significant.)
Table 4Pharmacokinetic parameters of lithium in humans (Mean ± SD) and rats [46].
Half-life (h) Volume ofdistribution (L/kg)
Clearance (ml/minute)
Rat 6.07 1.13 2.15Human 28.9 ± 7.9 0.79 ± 0.34 24.4 ± 8.0
E. Eltayib et al. / European Journal of Pharmaceutics and Biopharmaceutics 102 (2016) 123–131 129
concentrations extracted from MN following one h application.Crucially, these results demonstrate that hydrogel-forming MNhave the ability to definitively differentiate between therapeuticand toxic ISF lithium concentrations following an application timeof only 1 h. This time frame confers a substantial practical advan-tage when compared with other proposed transdermal TDMmeth-ods, such as RI, which may require an application time of up to 5 h[21]. Following application of MN arrays, diffusion along the con-centration gradient is the main driving force for solute movementinto the MN polymeric matrix. It is, therefore, reasonable toassume that diffusion of lithium into the MN matrix is directlyrelated to its concentration in the Franz cells. In this study, theapplication time of 1 h appears to reflect the minimum timerequired for a sufficient volume of fluid to enter the MN arrayand, subsequently, allow differentiation between a therapeuticand toxic concentration of the analyte of interest. This, therefore,may be the limiting factor in a minimum application time of 1 husing hydrogel-forming MN. In addition, although lithium
Group1
Group 2
0
5
10
15
Li+ c
once
ntra
tion
ext
ract
ed b
y M
N (µ
mol
/l)
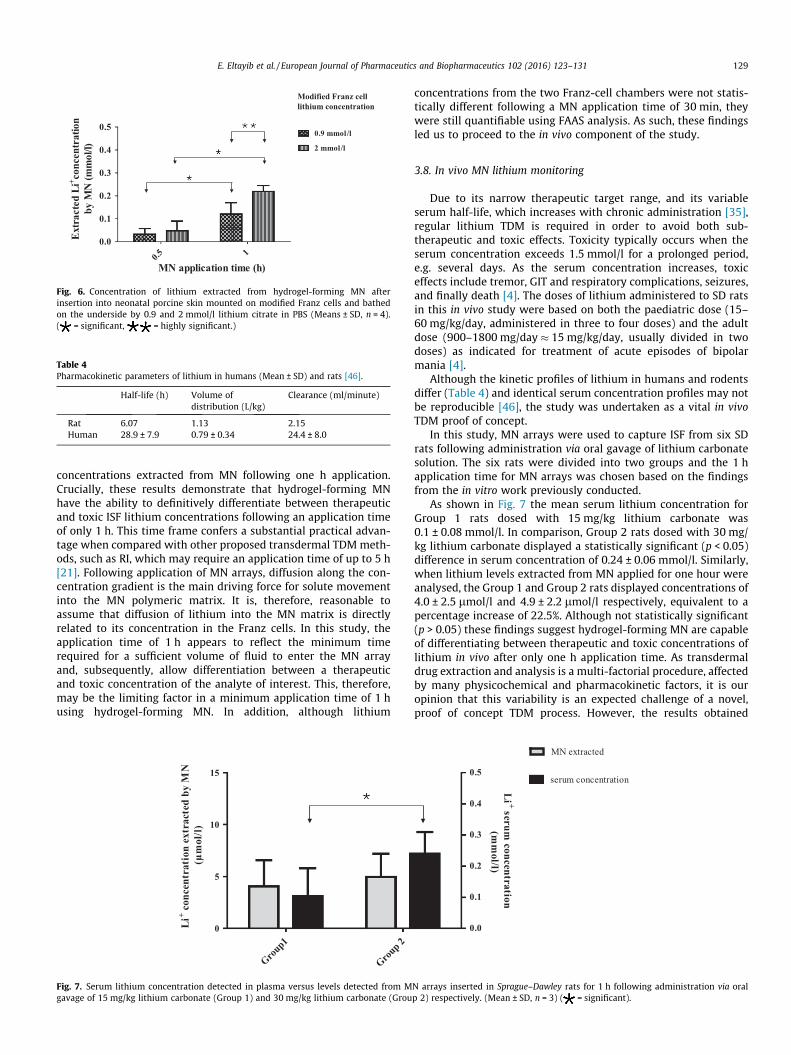
Fig. 7. Serum lithium concentration detected in plasma versus levels detected from Mgavage of 15 mg/kg lithium carbonate (Group 1) and 30 mg/kg lithium carbonate (Grou
concentrations from the two Franz-cell chambers were not statis-tically different following a MN application time of 30 min, theywere still quantifiable using FAAS analysis. As such, these findingsled us to proceed to the in vivo component of the study.
3.8. In vivo MN lithium monitoring
Due to its narrow therapeutic target range, and its variableserum half-life, which increases with chronic administration [35],regular lithium TDM is required in order to avoid both sub-therapeutic and toxic effects. Toxicity typically occurs when theserum concentration exceeds 1.5 mmol/l for a prolonged period,e.g. several days. As the serum concentration increases, toxiceffects include tremor, GIT and respiratory complications, seizures,and finally death [4]. The doses of lithium administered to SD ratsin this in vivo study were based on both the paediatric dose (15–60 mg/kg/day, administered in three to four doses) and the adultdose (900–1800 mg/day � 15 mg/kg/day, usually divided in twodoses) as indicated for treatment of acute episodes of bipolarmania [4].
Although the kinetic profiles of lithium in humans and rodentsdiffer (Table 4) and identical serum concentration profiles may notbe reproducible [46], the study was undertaken as a vital in vivoTDM proof of concept.
In this study, MN arrays were used to capture ISF from six SDrats following administration via oral gavage of lithium carbonatesolution. The six rats were divided into two groups and the 1 happlication time for MN arrays was chosen based on the findingsfrom the in vitro work previously conducted.
As shown in Fig. 7 the mean serum lithium concentration forGroup 1 rats dosed with 15 mg/kg lithium carbonate was0.1 ± 0.08 mmol/l. In comparison, Group 2 rats dosed with 30 mg/kg lithium carbonate displayed a statistically significant (p < 0.05)difference in serum concentration of 0.24 ± 0.06 mmol/l. Similarly,when lithium levels extracted from MN applied for one hour wereanalysed, the Group 1 and Group 2 rats displayed concentrations of4.0 ± 2.5 lmol/l and 4.9 ± 2.2 lmol/l respectively, equivalent to apercentage increase of 22.5%. Although not statistically significant(p > 0.05) these findings suggest hydrogel-forming MN are capableof differentiating between therapeutic and toxic concentrations oflithium in vivo after only one h application time. As transdermaldrug extraction and analysis is a multi-factorial procedure, affectedby many physicochemical and pharmacokinetic factors, it is ouropinion that this variability is an expected challenge of a novel,proof of concept TDM process. However, the results obtained
0.0
0.1
0.2
0.3
0.4
0.5
MN extracted
serum concentration
Li + serum concentration
(mm
ol/l)
N arrays inserted in Sprague–Dawley rats for 1 h following administration via oralp 2) respectively. (Mean ± SD, n = 3) ( = significant).

130 E. Eltayib et al. / European Journal of Pharmaceutics and Biopharmaceutics 102 (2016) 123–131
demonstrate that MN can capture a quantifiable amount of lithiumfrom ISF following a period of only 1 h application in vivo. Notably,lithium ISF concentration is not instantaneously related to serumconcentration [21] and, accordingly, no lithium was detected fromMN arrays inserted into the rats’ backs for 1 h prior to dosing. Thisserved as an informative negative control. This strongly suggeststhat the swelling of MN was due to uptake of ISF containinglithium, rather than any lithium potentially present in rat perspira-tion. In addition, our polymeric MN systems were removed macro-scopically intact after skin insertion, leaving no detectable polymerbehind.
Toxic lithium concentration in serum appears one or two daysbefore toxicity symptoms due to a well-established latency effect[6]. Therefore, clinical presentation of lithium toxicity may not besupported by blood level and vice versa [6]. The concept of outpa-tients using hydrogel-forming MN for lithium TDM would be a sig-nificant breakthrough both in routine TDM and in anticipatingoccurrence of toxic symptoms, facilitating early interventionbefore serious side effects occur. This could, in turn, save timeand costs to the health system, not to mention the obvious patientbenefit. As therapeutic lithium levels are based on the serum sam-ples taken in the morning, usually 12 h following the last adminis-tered dose [10], patients could apply the MN for one hour in themorning, and then send them to the nominated laboratory foranalysis. Lithium from these MN would then be extracted andanalysed and the results could potentially be sent to the patientswithin 24 h, allowing rapid optimization of dose. The current studyhas the limitations of being carried out in small number of animals.However, as a proof of concept, the obtained animal data are,nonetheless, exiting. Furthermore, the current study was con-ducted using therapeutic lithium doses, as administration of toxicdoses was not ethically acceptable. Nevertheless, the agreementbetween the extraction of lithium from MN and lithium serumconcentration in the two groups of rats suggests real potentialfor using MN as a therapeutic monitoring tool for lithium.
4. Conclusion
This study demonstrates, for the first time, the potential ofhydrogel-forming MN as a means of transdermal lithium TDMusing ISF as a sampling reservoir. We have successfully demon-strated hydrogel-forming MN have the potential as a means ofminimally-invasive lithium TDM. The findings of this studystrongly suggest that hydrogel-forming MN offer an exciting,newmeans of lithium TDM. Future work will focus on optimizationof MN application time, with respect to ensuring precise quantifi-cation of lithium concentration, potentially including ‘lab-on-a-chip’ or MN sensor technology to deliver an concentration easilyinterpreted by both clinicians and patients.
It is expected that hydrogel-forming MN will likely focus onminimally-invasive home-based monitoring, ensuring complianceand preventing toxicity. For home sampling, a short training ses-sion may not even be necessary. The patient may learn the tech-nique from an instruction leaflet or an associated website.Regarding sample extraction and analysis, there are currently noportable devices for analysis to be used by a patient. This concepthas enormous potential, especially if an analytical device with adisplay screen or colour change indicator is developed. This wouldsimply provide the clinician and patient with a ‘Yes/No-High/Low’feedback, allowing them to make simple pre-ordained decisionswithout involvement of health care professionals. Improved ratesof lithium TDM will undoubtedly minimize the chances of adverseevents. The existing gap between the standard and current practiceof biochemical monitoring of lithium treatment [47] might bereplaced with a system such as our hydrogel-forming MN system
that can offer frequent, simple and minimally-invasive monitoringin conjunction with fast analysis and feedback. Finally, althoughthis study focussed on the quantification of lithium, it couldequally be implemented in detection and quantification of otheranalytes of interest, such as potassium and sodium. These are oftenderanged in cardiac and renal disorders and as they are also phys-iological cations, they should be readily detectable using our novelhydrogel-forming MN technology.
Acknowledgements
This work was supported by EPSRC Grant EP/H021647/1 andAction Medical Research Grant number GN2024 through the HenrySmith Charity and also the School of Pharmacy, AHFAD Universityfor Women. Additional support was provided by Queen’s Univer-sity Belfast’s Proof of Principle Fund and The Northern PharmaciesTrust.
References
[1] J. Hirschowitz, A. Kolevzon, A. Garakani, Harvard Rev. Psychiat. 18 (2010) 266.[2] G.S. Malhi, C. McAulay, P. Das, K. Fritz, Evid Based. Ment. Health 18 (2015) 1.[3] K.P. Chen, W.W. Shen, M.L. Lu, Psychiatry Clin. Neurosci. 58 (2004) 25.[4] J.E. Murphy, Clinical Pharmacokinetics, American Society of Health-System
Pharmacists, United States, 2011.[5] T. Jackson, Elements: Lithium, Benchmark Books (NY), US, 2007.[6] R. Oruch, M.A. Elderbi, H.A. Khattab, I.F. Pryme, A. Lund, Eur. J. Pharmacol. 740
(2014) 464.[7] R.J. Schloesser, K. Martinowich, H.K. Manji, Trends Neurosci. 35 (2012) 36.[8] E.M. Grandjean, J.M. Aubry, CNS Drugs 23 (2009) 331.[9] D. Turck, G. Heinzel, G. Luik, Br. J. Clin. Pharmacol. 50 (2000) 197.[10] R.D. Schoenwald, Pharmacokinetics in Drug Discovery and Development, CRC
Press, US, 2002.[11] N.D. Kapusta, N. Mossaheb, E. Etzersdorfer, G. Hlavin, K. Thau, M. Willeit, N.
Praschak-Rieder, G. Sonneck, K. Leithner-Dziubas, Br. J. Psychiatry 198 (2011)346.
[12] C. Paton, T.R. Barnes, A. Shingleton-Smith, R.H. McAllister-Williams, J.Kirkbride, P.B. Jones, S. McIntyre, POMH-UK project team, J.Psychopharmacol. 24 (2010) 1739.
[13] B.A. Sproule, B.G. Hardy, K.I. Shulman, Drugs Aging 16 (2000) 165.[14] B. Leboulanger, J.M. Aubry, G. Bondolfi, R.H. Guy, M.B. Delgado-Charro, Clin.
Chem. 50 (2004) 2091.[15] M. Aliasgharpour, H. Hagani, N. Am. J. Med. Sci. 1 (2009) 244.[16] A. Dasgupta, J.L. Sepulveda, Accurate Results in the Clinical Laboratory,
ELSEVIER, United States, 2013.[17] H.C. Caldwell, W.J. Westlake, S.M. Connor, T. Flanagan, J. Clin. Pharmacol. New
Drugs 11 (1971) 349.[18] J.G. Hamilton, J. Fam. Pract. 41 (1995) 169.[19] B. Leboulanger, R.H. Guy, M.B. Delgado-Charro, Physiol. Meas. 25 (2004) R35.[20] R.F. Donnelly, K. Mooney, E. Caffarel-Salvador, B.M. Torrisi, E. Eltayib, J.C.
McElnay, Ther. Drug Monit. 36 (2014) 10.[21] B. Leboulanger, M. Fathi, R.H. Guy, M.B. Delgado-Charro, Pharm. Res. 21 (2004)
1214.[22] T.K. Kiang, V. Schmitt, M.H. Ensom, B. Chua, U.O. Hafeli, J. Pharm. Sci. 101
(2012) 4642.[23] A. Tura, A. Maran, G. Pacini, Diabetes Res. Clin. Pract. 77 (2007) 16.[24] A. El-Laboudi, N.S. Oliver, A. Cass, D. Johnston, Diabetes Technol. Ther. 15
(2013) 101.[25] R.F. Donnelly, T.R. Raj Singh, A.D. Woolfson, Drug Deliv. 17 (2010) 187.[26] Y.C. Kim, J.H. Park, M.R. Prausnitz, Adv. Drug Deliv. Rev. 64 (2012) 1547.[27] R.F. Donnelly, M.T. McCrudden, A. Zaid Alkilani, E. Larraneta, E. McAlister, A.J.
Courtenay, M.C. Kearney, T.R. Singh, H.O. McCarthy, V.L. Kett, E. Caffarel-Salvador, S. Al-Zahrani, A.D. Woolfson, PLoS ONE 9 (2014). e111547.
[28] M. Kim, B. Jung, J.H. Park, Biomaterials 33 (2012) 668.[29] R.F. Donnelly, T.R. Singh, M.J. Garland, K. Migalska, R. Majithiya, C.M.
McCrudden, P.L. Kole, T.M. Mahmood, H.O. McCarthy, A.D. Woolfson, Adv.Funct. Mater. 22 (2012) 4879.
[30] P.A. McCarron, A.D. Woolfson, R.F. Donnelly, G.P. Andrews, A. Zawislak, J.H.Price, J. Appl. Polym. Sci. 91 (2004) 1576.
[31] R.F. Donnelly, R. Majithiya, T.R. Singh, D.I. Morrow, M.J. Garland, Y.K. Demir, K.Migalska, E. Ryan, D. Gillen, C.J. Scott, A.D. Woolfson, Pharm. Res. 28 (2011) 41.
[32] E. Larraneta, J. Moore, E.M. Vicente-Perez, P. Gonzalez-Vazquez, R. Lutton, A.D.Woolfson, R.F. Donnelly, Int. J. Pharm. 472 (2014) 65.
[33] A. Fourtanier, C. Berrebi, Photochem. Photobiol. 50 (1989) 771.[34] R.F. Donnelly, M.J. Garland, D.I. Morrow, K. Migalska, T.R. Singh, R. Majithiya, A.
D. Woolfson, J. Control. Release 147 (2010) 333.[35] R.T. Timmer, J.M. Sands, J. Am. Soc. Nephrol. 10 (1999) 666.[36] M.J. Garland, K. Migalska, T.M. Tuan-Mahmood, T. Raghu Raj Singh, R.
Majithija, E. Caffarel-Salvador, C.M. McCrudden, H.O. McCarthy, A. DavidWoolfson, R.F. Donnelly, Int. J. Pharm. 434 (2012) 80.

E. Eltayib et al. / European Journal of Pharmaceutics and Biopharmaceutics 102 (2016) 123–131 131
[37] D.L. Perry, Handbook of Inorganic Compounds, CRC Press, United States, 2011.[38] M.T. McCrudden, A.Z. Alkilani, C.M. McCrudden, E. McAlister, H.O. McCarthy, A.
D. Woolfson, R.F. Donnelly, J. Control. Release 180 (2014) 71.[39] ICH Expert Working Group., presented at <br /> INTERNATIONAL CONFERENCE
ON HARMONISATION OF TECHNICAL REQUIREMENTS FOR REGISTRATION OFPHARMACEUTICALS FOR HUMAN USE, 2005.
[40] R.F. Donnelly, K. Mooney, M.T. McCrudden, E.M. Vicente-Perez, L. Belaid, P.Gonzalez-Vazquez, J.C. McElnay, A.D. Woolfson, J. Pharm. Sci. 103 (2014) 1478.
[41] E.L. Giudice, J.D. Campbell, Adv. Drug Deliv. Rev. 58 (2006) 68.[42] R.A. Hernandez, J.M. Martinez, Ind. Eng. Chem. Process Des. Dev. 20 (1981)
698.
[43] X. Wen, P. Ma, G. Zhu, Z. Wu, 25 (2006) 309.[44] Chemwiki, Atomic Absorption Spectroscopy, <http://chemwiki.ucdavis.edu/
Analytical_Chemistry/Analytical_Chemistry_2.0/10_Spectroscopic_Methods/10D%3A_Atomic_Absorption_Spectroscopy> (accessed 16.11.15).
[45] United States Food and Drug Administration, Clinical Laboratory ImprovementAmendments, <http://www.fda.gov/MedicalDevices/DeviceRegulationandGuidance/IVDRegulatoryAssistance/ucm124105.htm> (accessed 10.12.15).
[46] A.J. Wood, G.M. Goodwin, R. De Souza, A.R. Green, Neuropharmacology 25(1986) 1285.
[47] M.J. Garland, E. Caffarel-Salvador, K. Migalska, A.D. Woolfson, R.F. Donnelly, J.Control. Release 159 (2012) 52.