hydrodynamics of fluidization
TRANSCRIPT
HYDRODYNAMICS OF FLUIDIZATION
IN AN ANNULAR SPACE
by
L.M. Wanicka
A dissertation submitted in partial fulfilment of the requirements for the degree
Master of Engineering in Chemical Engineering
Department of Chemical Engineering
Faculty of Engineering, Built Environment and Information Technology
University of Pretoria
Pretoria
South Africa
December 2015
Supervisor: Professor M.D. Heydenrych
CVD 800
© University of Pretoria

i
DECLARATION
I, Lucja Michalina Wanicka, hereby declare that this Master’s dissertation is my own
original work. I have not copied from any other student’s work or from any other
sources except where due reference or acknowledgement is made explicitly in the
text, nor has any part been written for me by another person.
It is the intention that this Masters dissertation be submitted for the degree of Master
of Engineering in Chemical Engineering at the University of Pretoria. Therefore I
further declare that this dissertation has not been submitted to any other educational
institution for any examination, diploma, degree or other form of qualification.
______________________ 8 December 2015
Lucja M Wanicka
© University of Pretoria
ii
PUBLICATIONS AND PRESENTATIONS
Some of the results presented in this dissertation have been published in:
Wanicka, LM and Heydenrych, MD (2014) “Hydrodynamics of fluidization in an
annular space”, South African Journal of Chemical Engineering, 19(3), 82 – 89.
Wanicka, LM and Heydenrych, MD (2014) “Hydrodynamics of fluidization in an
annular space”, a paper published in the conference proceedings of IFSA 2014:
Industrial Fluidization South Africa, 19 – 20 November 2014, Johannesburg, South
Africa.
Wanicka, LM, Airaga, EM and Heydenrych, MD (2015) “Hydrodynamics of
Fluidization in an Annular Space: A comparative study using various bed materials
and gas distributor designs”, a paper published in Proceedings of 44th The IIER
International Conference, 1 November 2015, Cape Town, South Africa, 8 – 12.
And presented at:
The 5th Conference on Industrial Fluidization, South Africa, IFSA 2014.
© University of Pretoria
iii
HYDRODYNAMICS OF FLUIDIZATION
IN AN ANNULAR SPACE
SYNOPSIS
The present investigation was aimed at studying the hydrodynamic behaviour of
fluidization in an unconventional fluidized bed geometry consisting of a vertically
orientated annular space. It was hypothesized that by using multiple gas injectors,
orientated tangentially to the annulus walls, induced rotating fluid bed behaviour
would occur in the annulus. Annular fluidized beds with induced rotating fluid bed
behaviour would ensure complete lateral mixing of solids and gas-solids, and offer
the additional advantage that the feed inlet to the fluidized bed can be positioned at
a single location.
A physical model, constructed of two Perspex tubes, was used to study the behaviour
of a fluidized bed in an annulus with various bed materials and gas distributor
designs. In order to study the hydrodynamics of the annular fluidized bed in more
detail, representative 2-dimensional computational fluid dynamic (CFD) models
were also simulated.
In experiments conducted with multiple tangential air injectors, induced rotating
fluid bed behaviour was not observed throughout the entire range of superficial gas
velocities tested with any bed material in the annulus. Induced rotating fluid bed
behaviour was not observed even after a reduction in the air injector diameter and
the addition of a secondary blower. It was concluded that the centrifugal forces were
significantly less than initially anticipated with this air distributor design. In addition,
it was also concluded that regions of stationary bed material located directly behind
© University of Pretoria
iv
the air injectors significantly impeded the momentum transfer between the moving
air and bed material, preventing any bed rotation in the annulus.
In the experiments conducted using the overlapping metal leaves air distributor
design, stationary regions of bed material were also observed on top of the
overlapping metal leaves. These regions were significantly smaller than the regions
observed directly behind the tangential air injectors. Unfortunately, induced rotating
fluid bed behaviour was not observed with any of the bed materials throughout the
entire range of superficial gas velocities tested. It was therefore concluded that the
vertical and tangential components (𝑣𝑠𝑖𝑛𝜃 and 𝑣𝑐𝑜𝑠𝜃) of the air velocity flowing
through the overlapping metal leaves were insufficient to result in uniform
fluidization or the desired induced rotating bed behaviour in the annulus.
In order to overcome the problems experienced with the overlapping metal leaves
air distributor design, a new air distributor was designed and printed 3-dimensionally
to have double the number of slits for the fluidizing air to flow out of. Although
induced rotating fluid bed behaviour was once again not observed, uniform bubbling
fluidization was apparent during experiments conducted with river sand and poppy
seeds as the bed material in the annulus. This observation implied that the vertical
component (𝑣𝑠𝑖𝑛𝜃) of the air velocity flowing through the slits was sufficient to
achieve uniform fluidization in the annulus, significantly increasing the mixing
effects of the bed material. However, the tangential component (𝑣𝑐𝑜𝑠𝜃) of the
velocity was still insufficient to induce any rotation of the fluid bed.
Based on the sensitivity studies performed, a minimum percentage open area of
1.6% was recommended to ensure uniform fluidization of the bed material in the
annulus. It was hypothesized that once uniform fluidization is achieved, induced
rotating fluid bed behaviour is likely to occur with sufficient fluidizing air flowing in
the tangential direction, since a uniformly fluidized bed experiences little resistance
to flow and/or movement. In order to test this hypothesis, it was recommended that
© University of Pretoria
v
future experiments should be conducted using slit (or hole) angles below 45° and
with blowers able to achieve higher superficial gas velocities (> 1 m/s) in the
annulus.
The Euler-Euler Model – Laminar Flow Interface in COMSOL Multiphysics®
software was used to study the hydrodynamic behaviour of the annular fluidized bed
in more detail. The simulation results proved beneficial since the CFD models could
illustrate several hydrodynamic properties not visibly obvious in the experiments
conducted with the Perspex model. However, it is recommended that more accurate
CFD models of the annular fluidized bed should be developed that model the
dispersed phase as a particle size distribution and model the annulus in 3D, and that
a turbulent CFD model, capable of simulating high Reynolds numbers, be used. Such
a CFD model can then be used to test porous plate-type distributors and variations
in slit or hole angles with high superficial gas velocities in the annulus, as previously
recommended.
If induced rotating fluid bed behaviour is successfully modelled using CFD, the
model can then be used to check whether sufficient contact time is available for the
pyrolysis reactions to occur at the recommended higher superficial gas velocities. If
not, the design concept of having an induced rotating fluid bed in the annular
pyrolysis chamber of the new fluidized bed fast pyrolyser could be impractical, and
in such an event, a rotating gas distributor plate should be considered instead.
KEYWORDS: hydrodynamic, fluidization, annulus, computational fluid dynamics
© University of Pretoria

vi
ACKNOWLEDGEMENTS
I would like to thank everyone who contributed in some way to the work described
in this dissertation. First and foremost, I would like to thank my academic
supervisor, Professor Mike Heydenrych, for his thoughtful guidance and useful
suggestions. I would also like thank the Paper Manufacturers Association of South
Africa (PAMSA) and Sappi Southern Africa Ltd for their support and funding of
this research project. Lastly, and most importantly, special thanks to my family,
friends and colleagues who have continually supported and encouraged me
throughout the duration of my studies.
© University of Pretoria
vii
TABLE OF CONTENTS
Declaration ...................................................................................................... i
Publications and Presentations ...................................................................... ii
Synopsis ......................................................................................................... iii
Acknowledgements ........................................................................................vi
List of Figures ................................................................................................ x
List of Tables ............................................................................................... xiii
List of Abbreviations .................................................................................... xiv
Nomenclature ............................................................................................... xv
Chapter 1: Introduction ................................................................................ 1-1
1.1 Background ............................................................................................................. 1-1
1.2 Objective of Investigation ..................................................................................... 1-1
1.3 Method ..................................................................................................................... 1-1
1.4 Application of Research ........................................................................................ 1-2
1.5 Structure of Dissertation ....................................................................................... 1-2
1.6 Reference ................................................................................................................. 1-3
Chapter 2: Literature Review ....................................................................... 2-1
2.1 Fundamentals of Fluidization ............................................................................... 2-1
2.1.1 Classification of Particles ................................................................................ 2-4
2.1.2 Elutriation and Entrainment .......................................................................... 2-5
2.1.3 Attrition ............................................................................................................. 2-6
2.2 Experimental Measurement Techniques ............................................................ 2-6
2.3 Designing of Fluidized Bed Systems ................................................................... 2-7
2.4 Unconventional Fluidized Beds ........................................................................ 2-11
© University of Pretoria
viii
2.5 Fluidized Bed Modelling .................................................................................... 2-13
2.6 References ............................................................................................................. 2-15
Chapter 3: Materials & Methods .................................................................. 3-1
3.1 River Sand ................................................................................................................ 3-1
3.2 Additional Materials ............................................................................................... 3-3
3.3 Pressure Drop Measurements .............................................................................. 3-6
Chapter 4: Tangential Injectors ................................................................... 4-1
4.1 Design Concept ...................................................................................................... 4-1
4.2 Construction ............................................................................................................ 4-2
4.3 Initial Experiments ................................................................................................. 4-3
4.4 Results and Discussion .......................................................................................... 4-6
4.5 Alterations ............................................................................................................... 4-8
4.5.1 Reducing the Air Injector Diameter ............................................................. 4-9
4.5.2 Installing an Additional Blower .................................................................. 4-10
4.5.3 Testing of Additional Materials .................................................................. 4-11
4.6 Conclusions and Recommendations ................................................................ 4-15
Chapter 5: Angled Blades ............................................................................. 5-1
5.1 Design Concept ...................................................................................................... 5-1
5.2 Construction ............................................................................................................ 5-1
5.3 Initial Experiments ................................................................................................. 5-3
5.4 Results and Discussion .......................................................................................... 5-5
5.5 Alterations ............................................................................................................... 5-8
5.5.1 Increasing the Number of Slits ...................................................................... 5-8
5.5.2 Independent Research.................................................................................. 5-11
5.5.3 Dimensional Analysis ................................................................................... 5-13
5.6 Conclusions and Recommendations ................................................................ 5-17
5.7 Reference .............................................................................................................. 5-19
© University of Pretoria
ix
Chapter 6: CFD Simulations ........................................................................ 6-1
6.1 The Euler-Euler Model ......................................................................................... 6-1
6.2 Tangential Injectors ................................................................................................ 6-2
6.2.1 River Sand ......................................................................................................... 6-4
6.2.2 Additional Materials ........................................................................................ 6-7
6.3 Angled Blades.......................................................................................................... 6-9
6.3.1 River Sand ......................................................................................................... 6-9
6.3.2 Poppy Seeds ................................................................................................... 6-12
6.4 Limitations of CFD Results ............................................................................... 6-13
6.5 Conclusions and Recommendations ................................................................ 6-14
6.6 Reference .............................................................................................................. 6-15
Chapter 7: Conclusions & Recommendations ............................................. 7-1
7.1 Perspex Model Conclusions ................................................................................. 7-1
7.1.1 Tangential Injectors ......................................................................................... 7-1
7.1.2 Angled Blades ................................................................................................... 7-2
7.2 Conclusions of CFD Simulations ........................................................................ 7-3
7.3 Recommendations for Future Work ................................................................... 7-4
© University of Pretoria
x
LIST OF FIGURES
Figure 2-1: Gas-solid fluidization regimes (adapted from Kunii and Levenspiel
(1991: 2)) ..................................................................................................... 2-2
Figure 2-2: Geldart’s powder classification diagram (Geldart, 1973) ..................... 2-4
Figure 2-3: Zones in a fluidized bed (Rhodes, 2008: 184) ....................................... 2-5
Figure 2-4: Schematic diagram of fluidized bed system development (adapted
from Jiang et al. (2003: 326)) ................................................................. 2-10
Figure 2-5: TORBED reactor (Torftech, sa) ........................................................... 2-13
Figure 2-6: Fixed angled blades used as the distributor in the TORBED reactor
(Sreenivasan & Raghavan, 2002) .......................................................... 2-13
Figure 3-1: Particle size distribution of river sand ..................................................... 3-2
Figure 3-2: SEM images of river sand ......................................................................... 3-2
Figure 3-3: Particle size distribution of the ilmenite and the ilmenite-sand mixture
...................................................................................................................... 3-3
Figure 3-4: SEM images of ilmenite-sand mixture .................................................... 3-4
Figure 3-5: SEM images of mustard seeds .................................................................. 3-5
Figure 3-6: SEM images of poppy seeds ..................................................................... 3-5
Figure 3-7: Schematic diagram of air flow from double-stage side-channel blower
to tapped holes in rolled stainless steel pipe ......................................... 3-6
Figure 3-8: Detailed diagram of designed orifice plate (measurements not to scale)
...................................................................................................................... 3-7
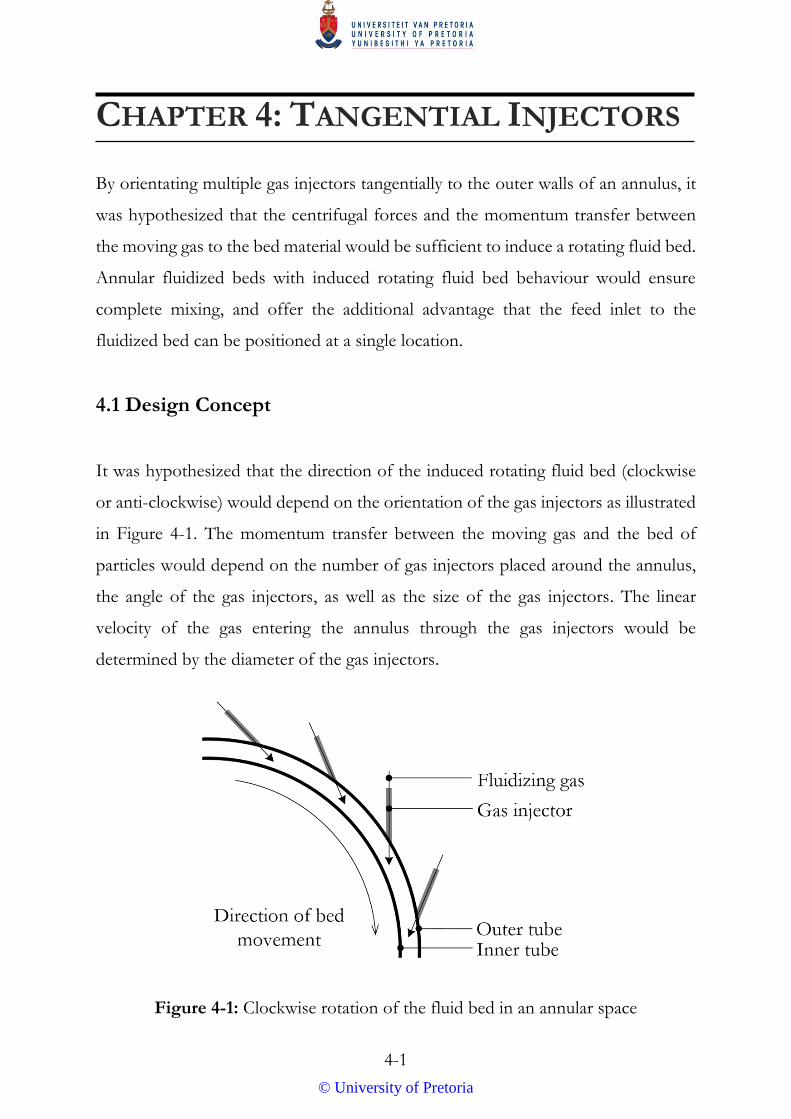
Figure 4-1: Clockwise rotation of the fluid bed in an annular space ...................... 4-1
Figure 4-2: Detailed diagram of the air injector housings with copper pipes ....... 4-2
Figure 4-3: Photograph of the assembled Perspex model ....................................... 4-3
© University of Pretoria
xi
Figure 4-4: (Left) Bed material removed at several air injectors (2.0 kg river sand);
(right) accumulation of bed material at other air injectors (2.0 kg river
sand) ............................................................................................................ 4-4
Figure 4-5: Pressure along the length of the rolled pipe as a function of the
volumetric flow rate of the air ................................................................. 4-5
Figure 4-6: Comparison of bed expansion of river sand from static bed height as a
function of superficial gas velocity ......................................................... 4-6
Figure 4-7: Instantaneous snapshots of jet formation (3.5 kg river sand) ............. 4-8
Figure 4-8: (Left) Depletion of bed material at several air injectors (3.0 kg ilmenite-
sand mixture); (right)turbulent fluidization(4.0 kg ilmenite-sand
mixture) .................................................................................................... 4-11
Figure 4-9: Spouted fluidized bed behaviour (1.5 kg mustard seeds) .................. 4-12
Figure 4-10: Comparison of bed expansion of poppy seeds from static bed height
as a function of superficial gas velocity .............................................. 4-13
Figure 4-11: (Top) Jet formation (1.0 kg poppy seeds); (bottom) turbulent
fluidization (2.0 kg poppy seeds) ......................................................... 4-15
Figure 5-1: Detailed diagram of metal air distributor with overlapping metal leaves
and adjustable screws ................................................................................ 5-2
Figure 5-2: Photograph of the metal air distributor .................................................. 5-3
Figure 5-3: Seepage of fluidizing air along the inner walls of the Perspex tubes
(0.5 kg mustard seeds) .............................................................................. 5-5
Figure 5-4: Turbulent fluidization behaviour (0.5 kg poppy seeds) ........................ 5-7
Figure 5-5: Detailed diagram of 3D printed PLA air distributor ............................ 5-9
Figure 5-6: Bubbling fluidization behaviour (0.5 kg poppy seeds) ...................... 5-10
Figure 5-7: Viscosity for various bed materials as a function of superficial gas
velocity (adapted from Airaga, 2015) .................................................. 5-12
© University of Pretoria
xii
Figure 5-8: Superficial gas velocity in annulus required to achieve uniform
bubbling fluidization as a function of the slit angle (slit dimensions:
13 mm x 0.5 mm, 64 slits) ..................................................................... 5-16
Figure 6-1: Geometry of the CFD models of the tangential injectors ................... 6-3
Figure 6-2: Instantaneous snapshots of simulation results (2.5 kg river sand;
6.5 mm tangential injectors) .................................................................... 6-5
Figure 6-3: Dynamic viscosity of dispersed phase – encircled areas indicate areas
of high dynamic viscosity (2.5 kg river sand; 6.5 mm tangential
injectors) ..................................................................................................... 6-6
Figure 6-4: Instantaneous snapshots of simulation results (1.0 kg poppy seeds;
5 mm tangential air injectors) .................................................................. 6-8
Figure 6-5: Instantaneous snapshots of simulation results (2.5 kg river sand;
overlapping metal leaves) ...................................................................... 6-10
Figure 6-6: Velocity profile of continuous phase represented by proportional
vectors at 1.5 seconds (2.5 kg river sand; overlapping metal leaves)
................................................................................................................... 6-11
Figure 6-7: Instantaneous snapshot of simulation results (1.0 kg poppy seeds; 3D
printed air distributor with 45° slits) ................................................... 6-13
© University of Pretoria
xiii
LIST OF TABLES
Table 2-1: Summary of key hydrodynamic characteristics of the various gas-solid
fluidization regimes (adapted from Paudel, 2011) .................................. 2-3
Table 2-2: Non-intrusive measurement techniques (adapted from Silva et al.,
2012: 42) ....................................................................................................... 2-8
Table 2-3: Intrusive measurement techniques (adapted from Silva et al., 2012: 43) 2-9
Table 3-1: Summary of characteristics of materials used in experiments ................. 3-7
Table 4-1: Dimensions and specifications of parts used in the Perspex model setup
........................................................................................................................ 4-3
Table 4-2: Summary of river sand experimental results .............................................. 4-7
Table 4-3: Influence of the air injector diameter on the momentum transfer at a
constant superficial gas velocity of 0.5 m/s in the annulus ................ 4-10
Table 4-4: Summary of poppy seed experimental results ......................................... 4-14
Table 5-1: Dimensions and specifications of the metal air distributor ..................... 5-2
Table 5-2: Comparison of cross-sectional areas using various air injectors at a
constant superficial gas velocity of 0.5 m/s in the annulus .................. 5-4
Table 5-3: Comparison of slit and hole dimensions and numbers to achieve a
percentage open area of at least 1.6% .................................................... 5-14
Table 6-1: Parameters for the CFD models of the tangential injectors .................... 6-4
Table 6-2: Material-specific parameters used in the 2.5 kg river sand loading
simulation ..................................................................................................... 6-4
Table 6-3: Summary of models suitable for turbulent CFD modelling (adapted from
Silva, Jiménez & Salazar, 2012: 45) ......................................................... 6-16
© University of Pretoria
xiv
LIST OF ABBREVIATIONS
CFD Computational fluid dynamics
CTD Contact time distribution
IMT Intrusive measurement techniques
NMT Non-intrusive measurement techniques
PLA Polylactic acid
RTD Residence time distribution
SEM Scanning electron microscope
TDH Transport disengagement height
© University of Pretoria
xv
NOMENCLATURE
Roman symbols
𝐶𝑑𝑟𝑎𝑔 Drag coefficient for a single dispersed particle
𝑑 Dispersed phase particle diameter m
𝑑𝑠𝑣 Mean particle size µm
Dv10 Particle size below which 10% of the volume particles exist µm
Dv50 Particle size below which 50% of the volume particles exist;
volume average particle size µm
Dv90 Particle size below which 90% of the volume particles exist µm
F Interphase momentum transfer N/m3
g Acceleration due to gravity 9.8 m/s2
𝐿𝑓 Bed height at bubbling fluidization m
𝐿𝑚 Static bed height m
𝐿𝑚𝑓 Bed height at minimum fluidization m
𝑝𝑠 Solid pressure Pa
𝑞 Dynamic pressure Pa
𝒖 Velocity of phase m/s
𝑢𝑓 Bubbling fluidization velocity m/s
𝑢𝑚𝑓 Minimum fluidization velocity m/s
𝑢𝑡𝑟𝑎𝑛𝑠𝑝𝑜𝑟𝑡 Fluidization velocity where transport of bed material occurs m/s
𝑣 Velocity of fluidizing medium m/s
Greek symbols
𝛽 Drag force coefficient
𝜀𝑚𝑓 Porosity at minimum fluidization
© University of Pretoria
xvi
𝜑 Phase volume fraction
∅ Sphericity of a particle
𝜌 Density of fluidizing medium kg/m3
𝜌𝑏 Bulk density of particles kg/m3
𝜌𝑠 Density of particle kg/m3
𝜇 Dynamic viscosity Pa·s
Subscripts
c Quantities relating to the continuous phase
d Quantities relating to the dispersed phase
© University of Pretoria
1-1
CHAPTER 1: INTRODUCTION
1.1 Background
In recent years, researchers have been experimenting with unconventional fluidized
bed geometries in order to overcome typical problems experienced in conventional
fluidized beds such as inadequate lateral mixing of solids and gas-solids, attrition and
bed material loss from elutriation and entrainment (Yang, 2003: 562). In order to
overcome these shortcomings, conventional fluidized beds used in industrial
applications were modified, resulting in unconventional fluidized beds.
1.2 Objective of Investigation
The present investigation was aimed at studying the hydrodynamic behaviour of
fluidization in an unconventional fluidized bed geometry consisting of a vertically
orientated annular space. It was hypothesized that by using multiple gas injectors
orientated tangentially to the annulus walls, induced rotating fluid bed behaviour
would occur in the annulus. Annular fluidized beds with induced rotating fluid bed
behaviour would ensure complete lateral mixing of solids and gas-solids, and offer
the additional advantage that the feed inlet to the fluidized bed can be positioned at
a single location.
1.3 Method
A physical model, constructed of two Perspex tubes, was used to study the behaviour
of a fluidized bed in an annulus with various bed materials and gas distributor
designs. In order to study the hydrodynamics of the annular fluidized bed in more
© University of Pretoria
1-2
detail, representative 2-dimensional computational fluid dynamic (CFD) models
were also simulated in commercially available software (COMSOL Multiphysics®).
1.4 Application of Research
A new fluidized bed fast pyrolyser is being developed at the Pyrolysis Laboratory at
the Department of Chemical Engineering of the University of Pretoria. The
pyrolyser is annular in design, with the pyrolysis chamber being a narrow annulus
located on the outer circumference of the combustion chamber. The present
investigation was carried out to check the validity of the design concept, in which
the fluidized bed in the pyrolysis chamber experiences induced rotating fluid bed
behaviour.
1.5 Structure of Dissertation
The present dissertation is structured according to the following chapters:
Chapter 2 – reviews the literature, including the fundamentals of fluidization,
designing of fluidized bed systems, unconventional fluidized beds as well as
fluidization bed modelling.
Chapter 3 – describes the characteristics of the various bed materials tested,
illustrates how the fluidizing air flows into the annulus and how the pressure
drop measurements were obtained.
Chapter 4 – describes the design, construction and experiments conducted
using multiple air injectors orientated tangentially to the outer walls of the
annulus.
Chapter 5 – describes the design, construction and experiments conducted
using two different air distributor designs – one being a metal air distributor
constructed of multiple overlapping metal leaves, and the other being a 3D
printed air distributor with multiple angled slits.
© University of Pretoria
1-3
Chapter 6 – discusses and illustrates the CFD simulation results.
Chapter 7 – summarises the conclusions and recommendations drawn up in
Chapters 4, 5 and 6.
1.6 Reference
Yang, W (2003) Other Nonconventional Fluidized Beds, In Yang, W (ed) Handbook of
Fluidization and Fluid-Particle Systems, Marcel Dekker Inc, United States of America.
© University of Pretoria
2-1
CHAPTER 2: LITERATURE REVIEW
Fluidized bed technology has been applied to a large variety of processes, including
drying, the combustion of coal and fluid catalytic cracking and reforming (Pell,
Dunson & Knowlton, 2007: 17-2). Fluidized beds are preferred to fixed bed reactors
as they offer good particle mixing, good temperature control and adaptability to
high-pressure and high-temperature operations (Jiang, Wei & Fan, 2003: 326). In
addition, fluidized beds are also suitable for large-scale operations due to their simple
geometric designs (Jiang et al., 2003: 326).
2.1 Fundamentals of Fluidization
Fluidization occurs when a packed bed of solid particles is transformed into a fluid-
like state by means of suspension by a gas or liquid. The suspended bed of particles
behaves similarly to a fluid – seeking its own level and causing large, heavy objects
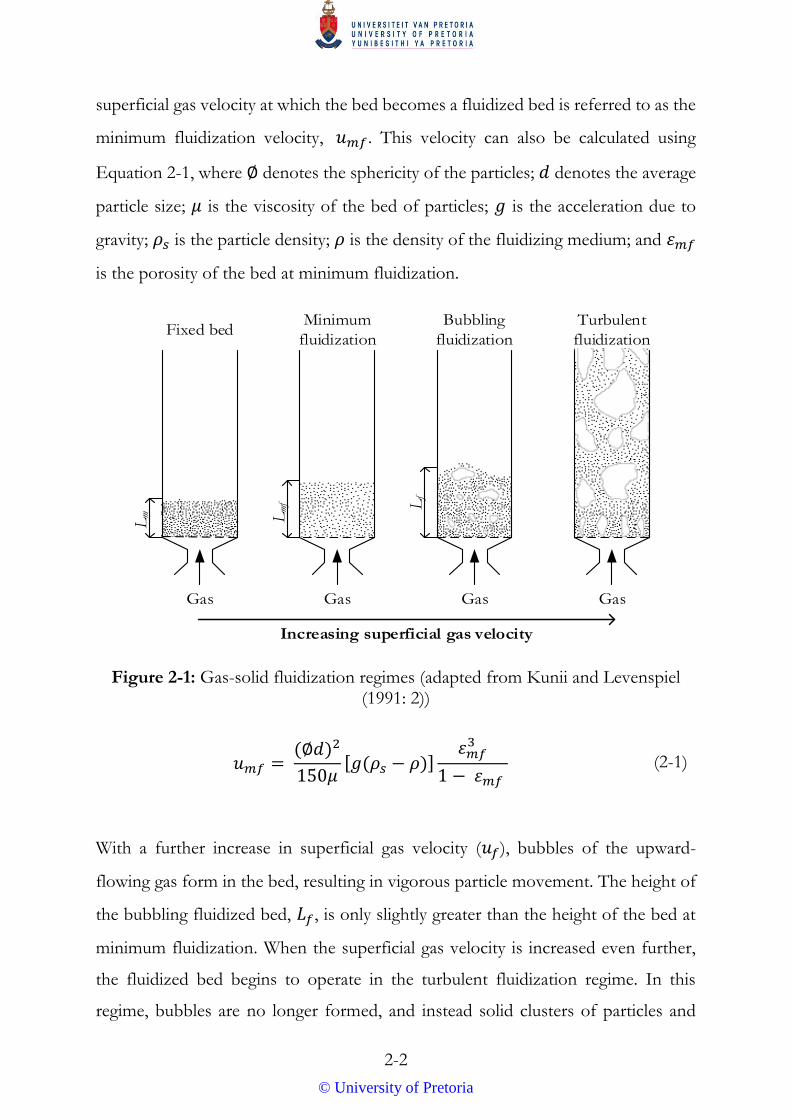
to sink (Pell et al., 2007: 17-2). Depending on the superficial gas velocity passed
through the bed of particles, a fluidized bed can operate in various regimes, as
illustrated in Figure 2-1. In the fixed bed regime, the superficial gas velocity is
sufficiently low that it only percolates through the void spaces between the particles
(Kunii & Levenspiel, 1991: 1). The height of the bed remains constant at the static
bed height, 𝐿𝑚.
As the superficial gas velocity increases, the particles become suspended in the
upward-flowing gas, and the height of the bed increases to the bed height at
minimum fluidization, 𝐿𝑚𝑓. At minimum fluidization, the frictional force between
the particles and gas is sufficient to counter-balance the mass of the bed of particles
and the bed is said to be “just fluidized” (Kunii & Levenspiel, 1991: 1). The
© University of Pretoria
2-2
superficial gas velocity at which the bed becomes a fluidized bed is referred to as the
minimum fluidization velocity, 𝑢𝑚𝑓. This velocity can also be calculated using
Equation 2-1, where ∅ denotes the sphericity of the particles; 𝑑 denotes the average
particle size; 𝜇 is the viscosity of the bed of particles; 𝑔 is the acceleration due to
gravity; 𝜌𝑠 is the particle density; 𝜌 is the density of the fluidizing medium; and 𝜀𝑚𝑓
is the porosity of the bed at minimum fluidization.
Lm L
mf L
f
Gas Gas Gas
Fixed bedMinimum
fluidization
Bubbling
fluidization
Gas
Turbulent
fluidization
Increasing superficial gas velocity
Figure 2-1: Gas-solid fluidization regimes (adapted from Kunii and Levenspiel
(1991: 2))
With a further increase in superficial gas velocity (𝑢𝑓), bubbles of the upward-
flowing gas form in the bed, resulting in vigorous particle movement. The height of
the bubbling fluidized bed, 𝐿𝑓, is only slightly greater than the height of the bed at
minimum fluidization. When the superficial gas velocity is increased even further,
the fluidized bed begins to operate in the turbulent fluidization regime. In this
regime, bubbles are no longer formed, and instead solid clusters of particles and
𝑢𝑚𝑓 = (∅𝑑)2
150𝜇[𝑔(𝜌𝑠 − 𝜌)]
𝜀𝑚𝑓3
1 − 𝜀𝑚𝑓 (2-1)
© University of Pretoria
2-3
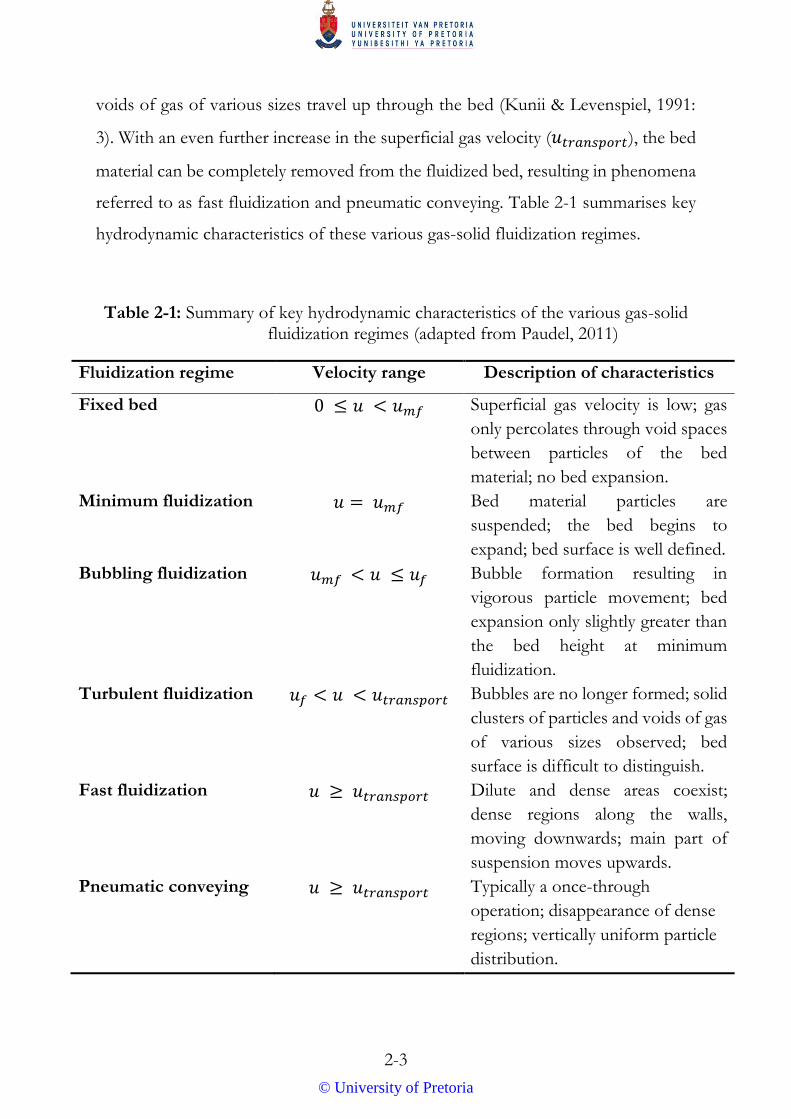
voids of gas of various sizes travel up through the bed (Kunii & Levenspiel, 1991:
3). With an even further increase in the superficial gas velocity (𝑢𝑡𝑟𝑎𝑛𝑠𝑝𝑜𝑟𝑡), the bed
material can be completely removed from the fluidized bed, resulting in phenomena
referred to as fast fluidization and pneumatic conveying. Table 2-1 summarises key
hydrodynamic characteristics of these various gas-solid fluidization regimes.
Table 2-1: Summary of key hydrodynamic characteristics of the various gas-solid fluidization regimes (adapted from Paudel, 2011)
Fluidization regime Velocity range Description of characteristics
Fixed bed 0 ≤ 𝑢 < 𝑢𝑚𝑓 Superficial gas velocity is low; gas
only percolates through void spaces
between particles of the bed
material; no bed expansion.
Minimum fluidization 𝑢 = 𝑢𝑚𝑓 Bed material particles are
suspended; the bed begins to
expand; bed surface is well defined.
Bubbling fluidization 𝑢𝑚𝑓 < 𝑢 ≤ 𝑢𝑓 Bubble formation resulting in
vigorous particle movement; bed
expansion only slightly greater than
the bed height at minimum
fluidization.
Turbulent fluidization 𝑢𝑓 < 𝑢 < 𝑢𝑡𝑟𝑎𝑛𝑠𝑝𝑜𝑟𝑡 Bubbles are no longer formed; solid
clusters of particles and voids of gas
of various sizes observed; bed
surface is difficult to distinguish.
Fast fluidization 𝑢 ≥ 𝑢𝑡𝑟𝑎𝑛𝑠𝑝𝑜𝑟𝑡 Dilute and dense areas coexist;
dense regions along the walls,
moving downwards; main part of
suspension moves upwards.
Pneumatic conveying 𝑢 ≥ 𝑢𝑡𝑟𝑎𝑛𝑠𝑝𝑜𝑟𝑡 Typically a once-through
operation; disappearance of dense
regions; vertically uniform particle
distribution.
© University of Pretoria
2-4
2.1.1 Classification of Particles
The ease with which particles can be fluidized by a gas is dependent on the intrinsic
properties of the particles such as their size, shape, density and morphology.
Generally, fine low-density particles are fluidized more evenly than large dense ones,
on condition that the particles are not so small that the London-van der Waals
attractive forces cause the particles to stick together (Richardson, Harker &
Backhurst, 2002: 317). Powders that contain a large size distribution will usually
fluidize more evenly than those of a uniform size since the fine particles coat the
larger ones with a “lubricating layer” (Richardson et al., 2002: 317). The sphericity of
the particles (∅), defined as the degree to which the particles resemble a sphere, also
affects the ease of fluidization of the powder as spherical particles tend to fluidize
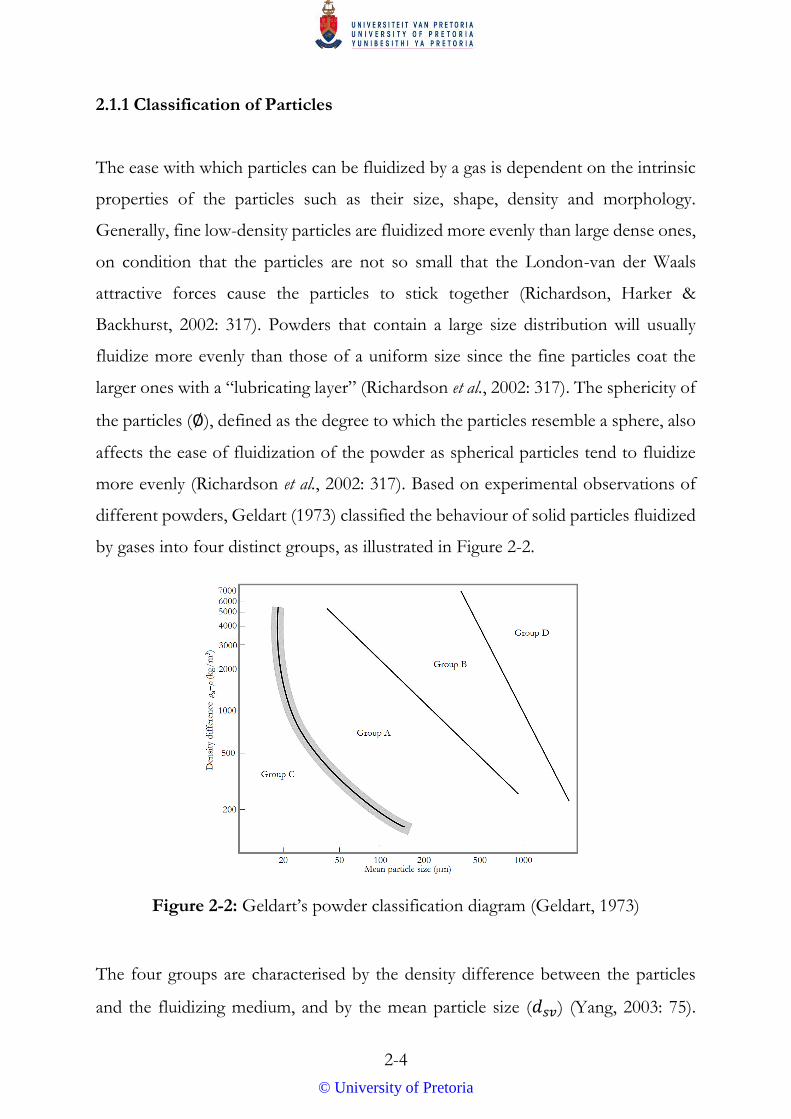
more evenly (Richardson et al., 2002: 317). Based on experimental observations of
different powders, Geldart (1973) classified the behaviour of solid particles fluidized
by gases into four distinct groups, as illustrated in Figure 2-2.
Figure 2-2: Geldart’s powder classification diagram (Geldart, 1973)
The four groups are characterised by the density difference between the particles
and the fluidizing medium, and by the mean particle size (𝑑𝑠𝑣) (Yang, 2003: 75).
© University of Pretoria
2-5
Although other researchers in the field have systematized the various types of gas
fluidization, Geldart’s powder classification remains the standard most frequently
used in industry.
2.1.2 Elutriation and Entrainment
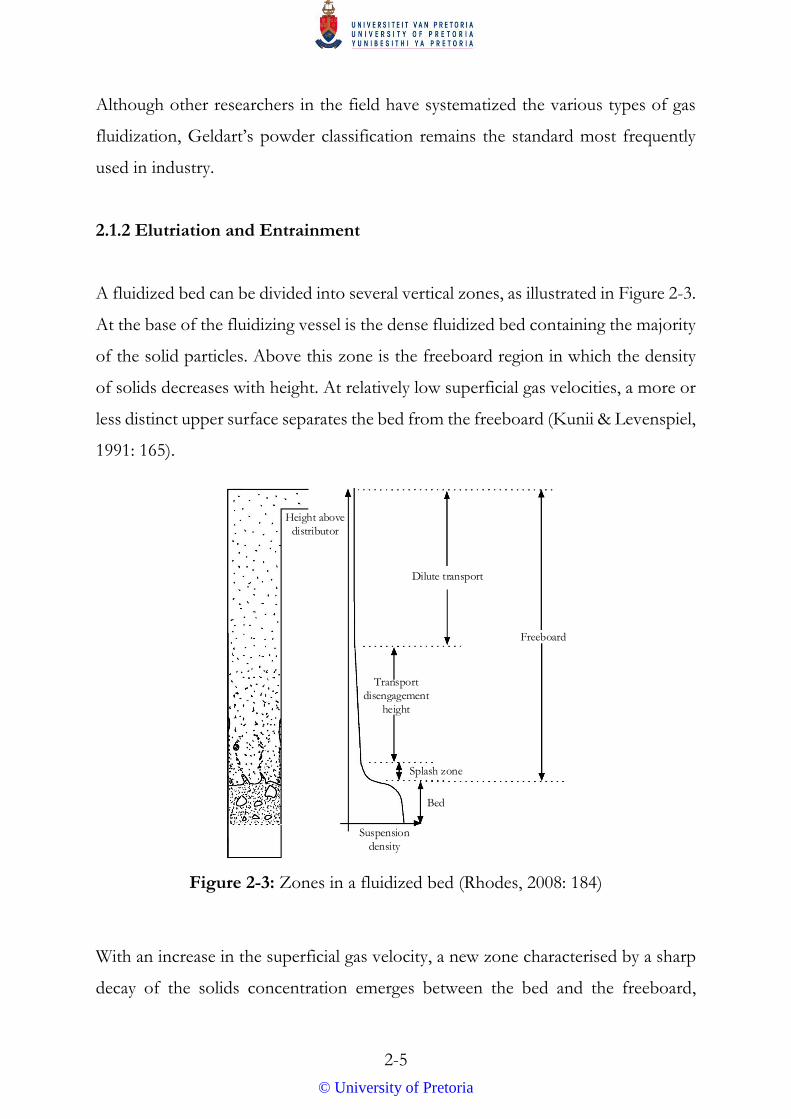
A fluidized bed can be divided into several vertical zones, as illustrated in Figure 2-3.
At the base of the fluidizing vessel is the dense fluidized bed containing the majority
of the solid particles. Above this zone is the freeboard region in which the density
of solids decreases with height. At relatively low superficial gas velocities, a more or
less distinct upper surface separates the bed from the freeboard (Kunii & Levenspiel,
1991: 165).
Height above
distributor
Dilute transport
Freeboard
Transport
disengagement
height
Splash zone
Bed
Suspension
density
Figure 2-3: Zones in a fluidized bed (Rhodes, 2008: 184)
With an increase in the superficial gas velocity, a new zone characterised by a sharp
decay of the solids concentration emerges between the bed and the freeboard,
© University of Pretoria
2-6
referred to as the splash zone (Werther & Hartge, 2003: 134). In this zone, the
distinct surface separating the bed and freeboard starts to fluctuate and increasing
amounts of solids are carried out from the bed (Werther & Hartge, 2003: 134).
Above the splash zone, the solids concentration gradually decays until it becomes
nearly constant. The distance between the splash zone and the point at which the
solids concentration becomes constant is referred to as the transport disengagement
height (TDH). Above the TDH, dilute transportation of solids occurs. The flux of
solids carried out of the fluidized bed by the fluidizing medium is referred to as
entrainment, whereas the separation or removal of fine solids contained in the bed
material is referred to as elutriation (Kunii & Levenspiel, 1991: 166).
2.1.3 Attrition
The vigorous motion experienced by the bed material in a fluidized bed causes inter-
particle collisions and bed-to-wall impacts, resulting in the gradual degradation of
the individual bed particles (Werther & Rappenhagen, 2003: 221). This unwanted
phenomenon is referred to as attrition and, depending on its severity, it may affect
the performance of the fluidizing bed. Attrition alters the bed particle size
distribution due to the generation of fine solids which cannot be kept inside the
system. As these fine solids are removed from the fluidized bed, they can burden
filtration and collection systems downstream (Werther & Rappenhagen, 2003: 221).
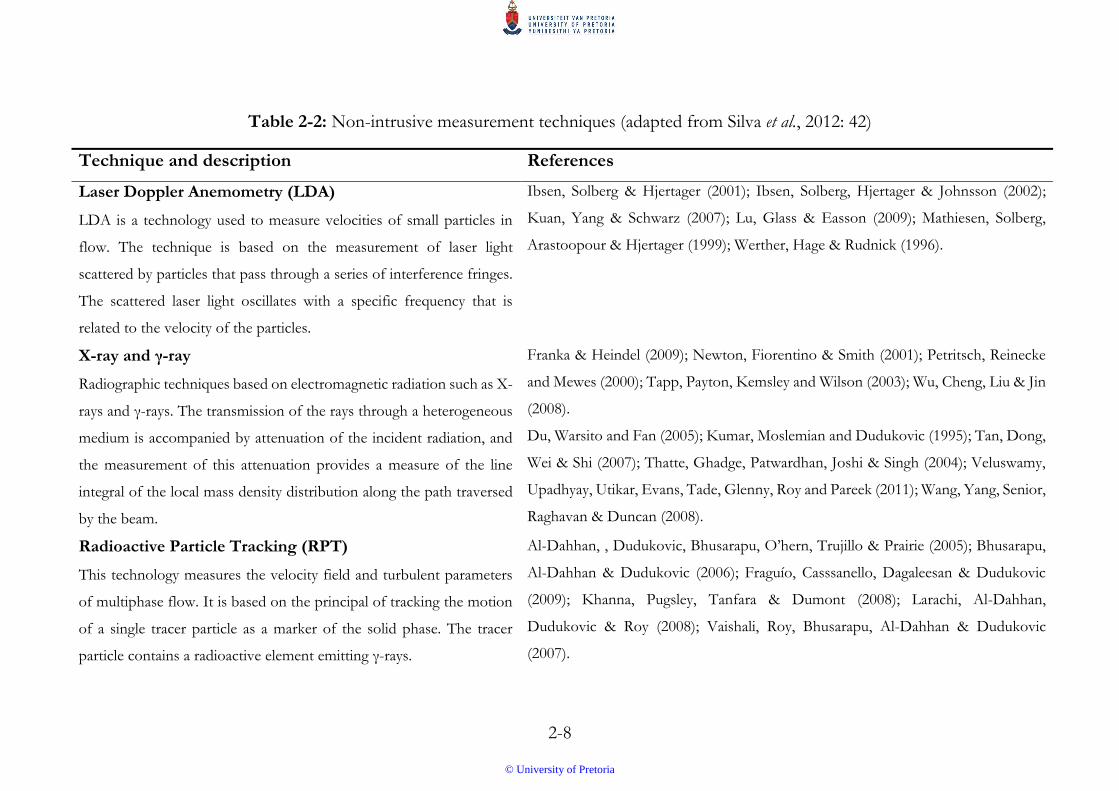
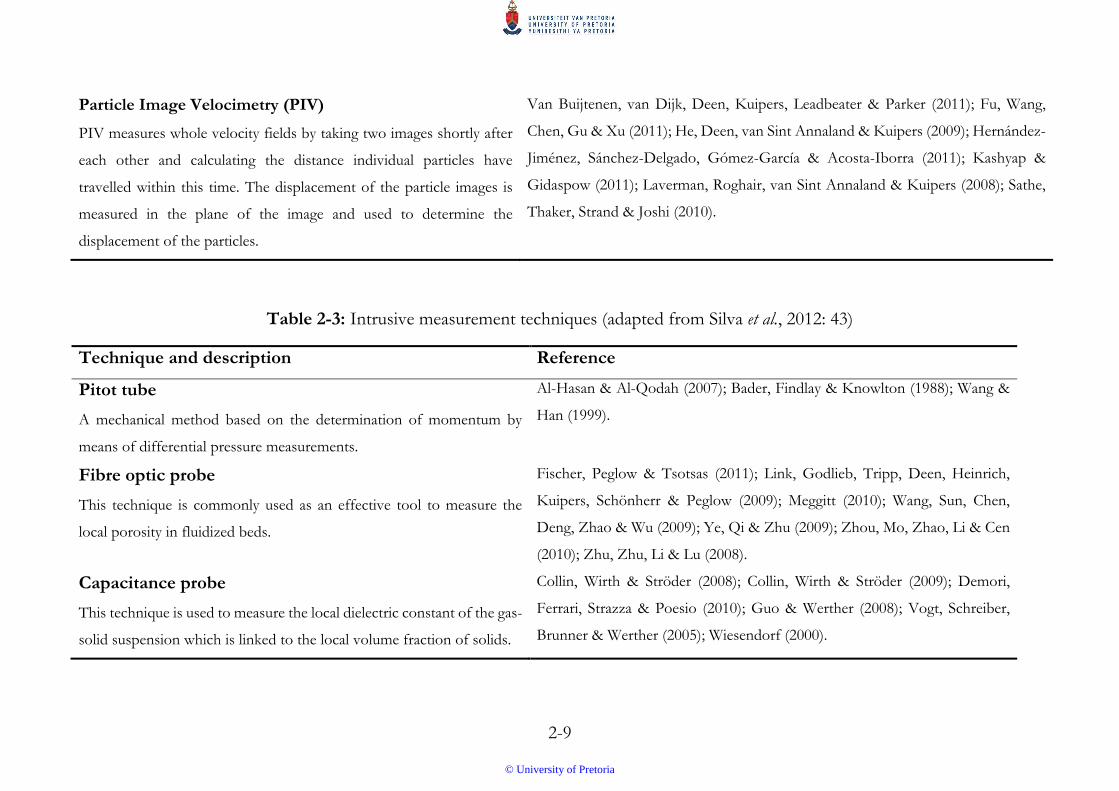
2.2 Experimental Measurement Techniques
In order to better understand the hydrodynamics of fluidized beds, researchers have
developed several measurement techniques able to analyse experimental data. These
experimental measurement techniques are classified as either non-intrusive
measurement techniques (NMT) (Table 2-2) or intrusive measurement techniques
(IMT) (Table 2-3). According to Silva, Jiménez and Salazar (2012: 41), NMTs are
© University of Pretoria
2-7
more desirable as they characterise the flow within a fluidized bed and do not disturb
the flow behaviour. In contrast, IMTs are generally probes used to study local basic
flow phenomena and typically used only as research instruments (Silva et al., 2012:
41).
2.3 Designing of Fluidized Bed Systems
According to Jiang et al. (2003: 330), many factors can affect the optimum
performance of a fluidized bed system, including hydrodynamics, heat and mass
transfer of inter- and intra-particles, as well as the complexities of any reaction
kinetics. The design of the components, such as the fluidizing vessel, the gas
distributor, cyclones, heat exchangers, the expanded section and the baffles, will also
influence the performance of the fluidized bed system. A typical fluidized bed system
requires a gas distributor to ensure even distribution of the fluidizing medium and
support for the particles in the bed. The gas distributor should also be able to operate
for extended periods of time without plugging or breaking. Many configurations of
gas distributors are employed in industry; however, the only fundamental difference
between the designs is the direction of the gas entry: upwards, laterally or
downwards. Cyclones are usually also included in fluidized bed systems to capture
and separate solid particles from the outlet gas exiting the fluidized bed. The
separated solid particles are then fed back into the fluidized bed by means of a dipleg.
A heat generator can also be included, which either removes generated heat or adds
required heat to the fluidized bed. It can either be immersed in the bed material,
placed between the bed and the freeboard, or placed along the wall as in fluidized
bed coal combustors (Jiang et al., 2003: 328). Expanded sections on top of fluidized
beds are generally used to reduce the linear gas velocity in the freeboard region,
reducing any entrainment. These sections are not always necessary and will depend
on the design of the gas-solid separator and the operating conditions (Jiang et al.,
2003: 328).
© University of Pretoria
2-8
Table 2-2: Non-intrusive measurement techniques (adapted from Silva et al., 2012: 42)
Technique and description References
Laser Doppler Anemometry (LDA)
LDA is a technology used to measure velocities of small particles in
flow. The technique is based on the measurement of laser light
scattered by particles that pass through a series of interference fringes.
The scattered laser light oscillates with a specific frequency that is
related to the velocity of the particles.
Ibsen, Solberg & Hjertager (2001); Ibsen, Solberg, Hjertager & Johnsson (2002);
Kuan, Yang & Schwarz (2007); Lu, Glass & Easson (2009); Mathiesen, Solberg,
Arastoopour & Hjertager (1999); Werther, Hage & Rudnick (1996).
X-ray and γ-ray
Radiographic techniques based on electromagnetic radiation such as X-
rays and γ-rays. The transmission of the rays through a heterogeneous
medium is accompanied by attenuation of the incident radiation, and
the measurement of this attenuation provides a measure of the line
integral of the local mass density distribution along the path traversed
by the beam.
Franka & Heindel (2009); Newton, Fiorentino & Smith (2001); Petritsch, Reinecke
and Mewes (2000); Tapp, Payton, Kemsley and Wilson (2003); Wu, Cheng, Liu & Jin
(2008).
Du, Warsito and Fan (2005); Kumar, Moslemian and Dudukovic (1995); Tan, Dong,
Wei & Shi (2007); Thatte, Ghadge, Patwardhan, Joshi & Singh (2004); Veluswamy,
Upadhyay, Utikar, Evans, Tade, Glenny, Roy and Pareek (2011); Wang, Yang, Senior,
Raghavan & Duncan (2008).
Radioactive Particle Tracking (RPT)
This technology measures the velocity field and turbulent parameters
of multiphase flow. It is based on the principal of tracking the motion
of a single tracer particle as a marker of the solid phase. The tracer
particle contains a radioactive element emitting γ-rays.
Al-Dahhan, , Dudukovic, Bhusarapu, O’hern, Trujillo & Prairie (2005); Bhusarapu,
Al-Dahhan & Dudukovic (2006); Fraguío, Casssanello, Dagaleesan & Dudukovic
(2009); Khanna, Pugsley, Tanfara & Dumont (2008); Larachi, Al-Dahhan,
Dudukovic & Roy (2008); Vaishali, Roy, Bhusarapu, Al-Dahhan & Dudukovic
(2007).
© University of Pretoria
2-9
Particle Image Velocimetry (PIV)
PIV measures whole velocity fields by taking two images shortly after
each other and calculating the distance individual particles have
travelled within this time. The displacement of the particle images is
measured in the plane of the image and used to determine the
displacement of the particles.
Van Buijtenen, van Dijk, Deen, Kuipers, Leadbeater & Parker (2011); Fu, Wang,
Chen, Gu & Xu (2011); He, Deen, van Sint Annaland & Kuipers (2009); Hernández-
Jiménez, Sánchez-Delgado, Gómez-García & Acosta-Iborra (2011); Kashyap &
Gidaspow (2011); Laverman, Roghair, van Sint Annaland & Kuipers (2008); Sathe,
Thaker, Strand & Joshi (2010).
Table 2-3: Intrusive measurement techniques (adapted from Silva et al., 2012: 43)
Technique and description Reference
Pitot tube
A mechanical method based on the determination of momentum by
means of differential pressure measurements.
Al-Hasan & Al-Qodah (2007); Bader, Findlay & Knowlton (1988); Wang &
Han (1999).
Fibre optic probe
This technique is commonly used as an effective tool to measure the
local porosity in fluidized beds.
Fischer, Peglow & Tsotsas (2011); Link, Godlieb, Tripp, Deen, Heinrich,
Kuipers, Schönherr & Peglow (2009); Meggitt (2010); Wang, Sun, Chen,
Deng, Zhao & Wu (2009); Ye, Qi & Zhu (2009); Zhou, Mo, Zhao, Li & Cen
(2010); Zhu, Zhu, Li & Lu (2008).
Capacitance probe
This technique is used to measure the local dielectric constant of the gas-
solid suspension which is linked to the local volume fraction of solids.
Collin, Wirth & Ströder (2008); Collin, Wirth & Ströder (2009); Demori,
Ferrari, Strazza & Poesio (2010); Guo & Werther (2008); Vogt, Schreiber,
Brunner & Werther (2005); Wiesendorf (2000).
© University of Pretoria
2-10
Baffles and other internal structures are usually used in fluidized beds to enhance
the breakup of bubbles, promoting gas-solid contact and reducing particle
entrainment (Jiang et al., 2003: 328). According to Jiang et al. (2003: 328), the benefits
of baffles are more distinct for Geldart Group B and D type powders because the
bubbles formed are larger in comparison to those formed in Geldart Group A type
powders (refer to Figure 2-2 for Geldart’s powder classification diagram).
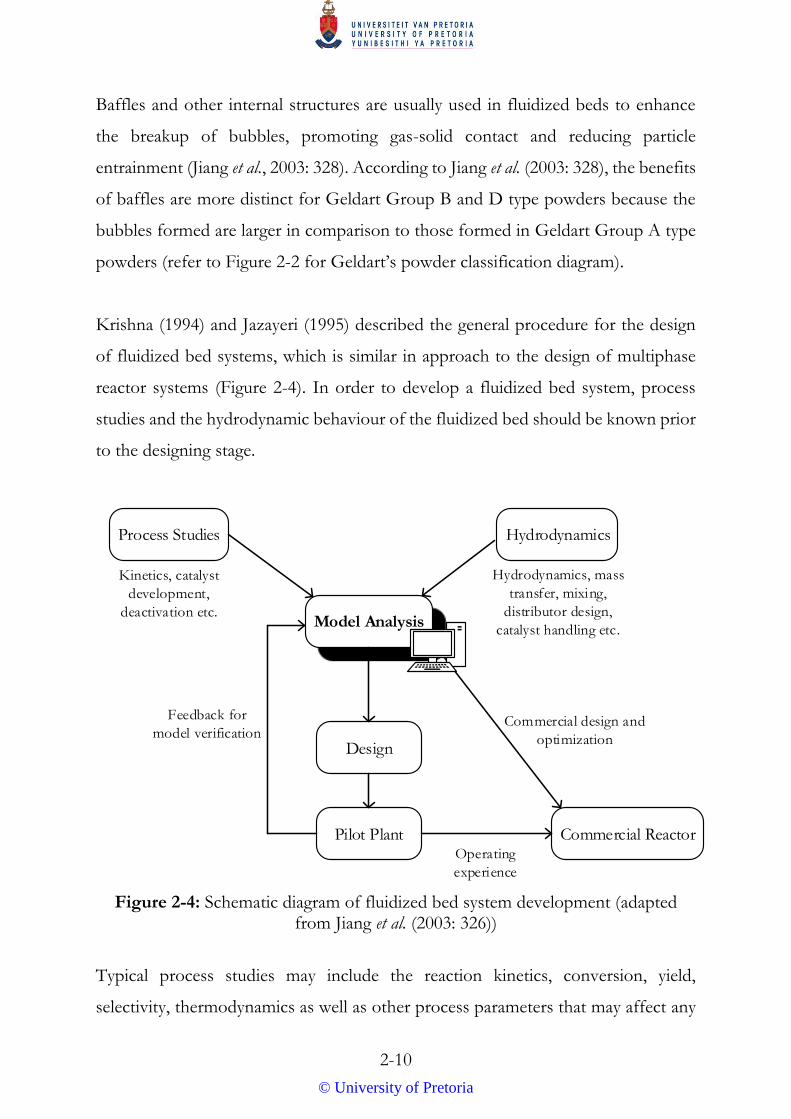
Krishna (1994) and Jazayeri (1995) described the general procedure for the design
of fluidized bed systems, which is similar in approach to the design of multiphase
reactor systems (Figure 2-4). In order to develop a fluidized bed system, process
studies and the hydrodynamic behaviour of the fluidized bed should be known prior
to the designing stage.
Model Analysis
Process Studies Hydrodynamics
Design
Pilot Plant Commercial Reactor
Kinetics, catalyst
development,
deactivation etc.
Hydrodynamics, mass
transfer, mixing,
distributor design,
catalyst handling etc.
Feedback for
model verification
Operating
experience
Commercial design and
optimization
Figure 2-4: Schematic diagram of fluidized bed system development (adapted from Jiang et al. (2003: 326))
Typical process studies may include the reaction kinetics, conversion, yield,
selectivity, thermodynamics as well as other process parameters that may affect any
© University of Pretoria
2-11
reactions occurring inside the fluidized bed (Jiang et al., 2003: 330). Hydrodynamic
studies, on the other hand, can provide information on the basic flow patterns,
particle attrition behaviour as well as mass and heat transfer of the fluidizing bed
(Jiang et al., 2003: 330).
In order to accurately predict the behaviour of a newly designed fluidized bed, it is
essential that the process studies and the hydrodynamic behaviour of the fluidized
bed be studied under operating conditions similar to those intended for commercial
reactors. Based on the information obtained by the process studies and studies of
the hydrodynamic behaviour of the fluidized bed, a model of the system can be
developed and preliminary designs drawn up. A pilot unit can then be constructed
to integrate the reactor with all the process-related components, including those
downstream from the fluidized bed. To ensure that the gas-solid contact time and
mixing patterns are similar, the pilot unit should operate in the same flow regime as
the commercial unit (Jiang et al., 2003: 331). The model of the system developed
earlier should then be verified and modified, if necessary, to best simulate the results
obtained from the pilot unit. Once the optimized design of the fluidized bed system
is completed, a commercial reactor can then be developed.
2.4 Unconventional Fluidized Beds
In recent years, researchers have been experimenting with unconventional fluidized
bed geometries in order to overcome inadequate lateral mixing of solids and gas-
solids experienced in conventional fluidized beds. In addition to inadequate lateral
mixing, conventional fluidized beds also experience attrition of bed material and bed
material loss from elutriation and entrainment. In an attempt to mitigate these
drawbacks, industrial fluidized beds are often modified, resulting in the use of
unconventional fluidized beds (Yang, 2003: 562). Unconventional fluidized beds
© University of Pretoria
2-12
include spouted beds, recirculating fluidized beds with draft tubes, jetting fluidized
beds as well as centrifugal fluidized beds (Yang, 2003: 562).
Spouted beds, for example, are usually cylindrical vessels with fluid supplied only
through a central jet nozzle located at the bottom of a conical base. Given a
sufficiently high fluid velocity, the fluid stream will burst through the bed material
as a spout, entraining solid particles at the spout-annulus interface (Yang, 2003: 563).
Recirculating fluidized beds with draft tubes, on the other hand, appear similar to
spouted beds, but because of the addition of a tubular insert (a draft tube), the
operational and design characteristics are quite different. Recirculating fluidized beds
with draft tubes are referred to as fluid-lift solids re-circulators, spouted fluid beds
with draft tubes, internally circulating fluidized beds, or simply as circulating
fluidized beds (Yang, 2003: 567). In the event that jet formation is the dominating
effect in a spouted bed, this type of fluidization bed is more suitably referred to as a
“jetting fluidized bed”. In such beds, the jet does not penetrate through the bed as
a spouted bed, and therefore the hydrodynamic behaviour is unique (Yang, 2003:
573).
Centrifugal fluidized beds are an interesting example of unconventional fluidized
beds. These fluidized beds operate on the principal that the pressure drop of the gas
flowing radially inward to the bed counterbalances the centrifugal weight of the
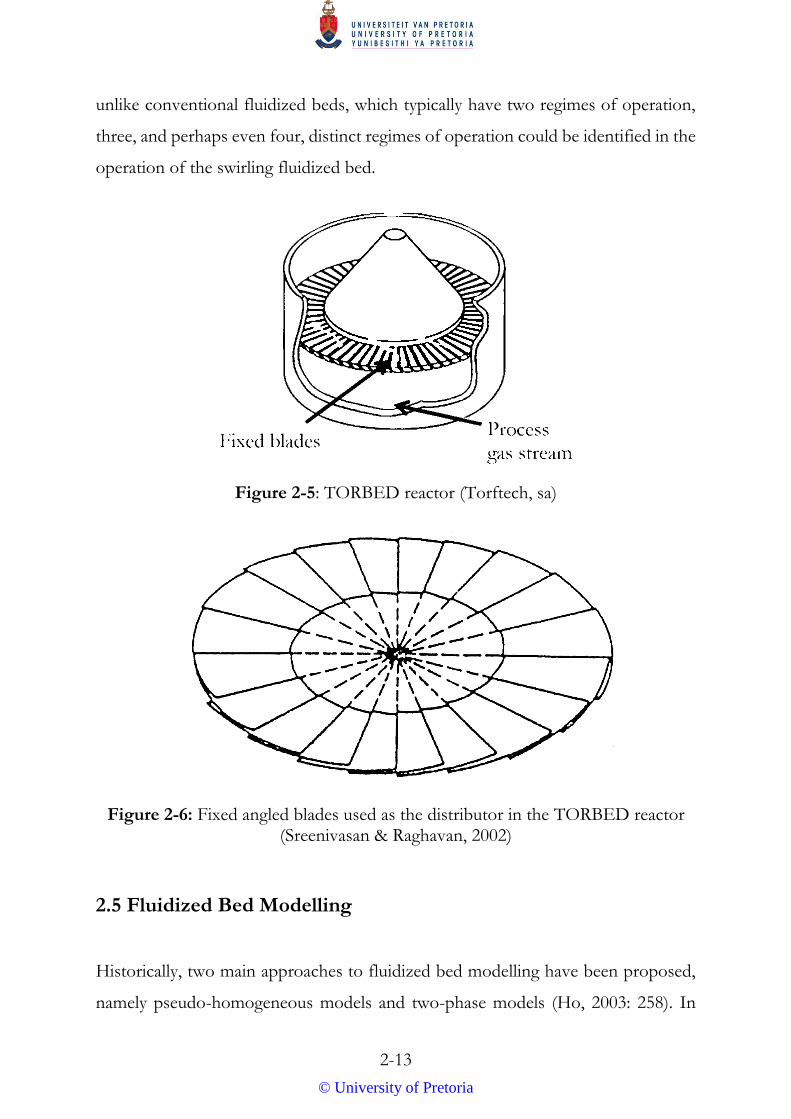
particles (Sreenivasan & Raghavan, 2002). This concept has already been applied to
commercially available industrial equipment such as the “TORBED” reactor, as
illustrated in Figure 2-5.
The TORBED reactor produces a toroidal mixing motion of the fluidized bed
particles by injecting the fluidizing medium at the base of the reactor with the use of
fixed angled blades producing a swirling motion, as illustrated in Figure 2-6
(Sreenivasan & Raghavan, 2002). Sreenivasan and Raghavan (2002) proved that
© University of Pretoria
2-13
unlike conventional fluidized beds, which typically have two regimes of operation,
three, and perhaps even four, distinct regimes of operation could be identified in the
operation of the swirling fluidized bed.
Figure 2-5: TORBED reactor (Torftech, sa)
Figure 2-6: Fixed angled blades used as the distributor in the TORBED reactor (Sreenivasan & Raghavan, 2002)
2.5 Fluidized Bed Modelling
Historically, two main approaches to fluidized bed modelling have been proposed,
namely pseudo-homogeneous models and two-phase models (Ho, 2003: 258). In
© University of Pretoria
2-14
pseudo-homogeneous models, the existence of more than one phase is not
considered. Pseudo-homogeneous models of fluidized bed reactors assume that the
reactor can be modelled similarly to ideal flow models, dispersion models, residence
time distribution (RTD) models or contact time distribution (CTD) models (Ho,
2003: 258).
Conversely, two-phase models assume that the fluidized bed reactor consists of at
least two distinct and separate phases. Two-phase models employ a separate
governing equation for each phase, which takes into account the mass interchange
between the two phases (Ho, 2003: 258). Unfortunately, modelling fluidized beds
using either the pseudo-homogeneous approach or the two-phase approach remains
problematic – models that work for certain reactors may not work for others (Ho,
2003: 271).
In recent years, due to the advancement of computational power, computational
fluid dynamics (CFD) modelling of fluidized beds has gained popularity amongst
researchers. CFD modelling offers several unique advantages over empirical and
phenomenological modelling, including the ability to study the fluidized bed up to
and beyond expected operational limits, as well as having access to the large level of
detail generated by the results (Versteeg & Malalasekera, 2007: 31). Two main
approaches can be used to model fluidized beds – a Eulerian framework or
Lagrangian particle tracking (Pugsley, McKeen & das Sharma, 2005). The Eulerian
method is used to simulate the flow of two distinct, continuous and fully
interpenetrating phases. In contrast, the Lagrangian method models the system by
simulating an equation of motion of each individual particle in the system (Pugsley
et al., 2005). For large and complex systems, the Eulerian framework is usually more
convenient to use, particularly when gases are involved. The focus is then on
simulating the physical state at fixed points in space and not following the state of
individual material particles.
© University of Pretoria
2-15
2.6 References
Al-Dahhan, MH, Dudukovic, MP, Bhusarapu, S, O’hern, T, Trujillo, S and Prairie,
MR (2005) “Flow Mapping in a Gas-Solid Riser via Computer Automated
Radioactive Particle Tracking (CARPT)”,
http://www.osti.gov/energycitations/servlets/purl/881590-Kfq80v/.
Al-Hasan, M and Al-Qodah, Z (2007) “Characteristics of gas-solid flow in vertical
tube”, paper presented at the 9th International Symposium on Fluid Control Measurement
and Visualization, FLUCOME 2007, 1, 264-271.
Bader, R, Findlay, J and Knowlton, TM (1988) “Gas/Solid Flow Patterns in a 30.5-
cm-Diameter Circulating Fluidized Bed”, paper presented at Circulating Fluidized Bed
Technology II, Proceedings of the Second International Conference on Circulating Fluidized Beds,
14 – 18 March 1988, Compiègne, France.
Bhusarapu, S, Al-Dahhan, MH and Dudukovic, MP (2006) “Solids flow mapping
in a gas-solid riser: Mean holdup and velocity fields”, Powder Technology, 163(1-2), 98
– 123.
Collin, A, Wirth, KE and Ströder, M (2008) “Experimental characterization of the
flow pattern in an annular fluidized bed”, The Canadian Journal of Chemical Engineering,
86(3), 536 – 542.
Collin, A, Wirth, KE and Ströder, M (2009) “Characterization of an annular fluidized
bed”, Powder Technology, 190(1-2), 31 – 35.
© University of Pretoria
2-16
Demori, M, Ferrari, V, Strazza, D and Poesio, P (2010) “A capacitive sensor system
for the analysis of two-phase flows of oil and conductive water”, Sensors and Actuators:
A: Physical, 163(1), 172 – 179.
Du, B, Warsito, W, Fan, LS (2005) “ECT Studies of Gas-Solid Fluidized Beds of
Different Diameters”, Industrial & Engineering Chemistry Research, 44(14), 5020 –
5030.
Fischer, C, Peglow, M and Tsotsas, E (2011) “Restoration of particle size
distributions from fibre-optic in-line measurements in fluidized bed processes”,
Chemical Engineering Science, 66(12), 2842 – 2852.
Fraguío, MS, Cassanello, MC, Degaleesan, S and Dudukovic, MP (2009) “Flow
regime diagnosis in bubble columns via pressure fluctuations and computer-
assisted radioactive particle tracking measurements”, Industrial and Engineering
Chemistry Research, 48(3), 1072 – 1080.
Franka, NP and Heindel, TJ (2009) “Local time-averaged gas holdup in a fluidized
bed with side air injection using X-ray computed tomography”, Powder Technology,
193(1), 69 – 78.
Fu, Y, Wang, T, Chen, JC, Gu, CG and Xu, F (2011) “Experimental investigation
of jet influence on gas-solid the two-phase crossflow in a confined domain”, Shiyan
Liuti Lixue/Journal of Experiments in Fluid Mechanics, 25(1), 48 – 53, 64.
Geldart, D (1973) “Types of fluidization”, Powder Technology, 7, 285 – 292.
© University of Pretoria
2-17
Guo, Q and Werther, J (2008) “Influence of a gas maldistribution of distributor
design on the hydrodynamics of a CFB riser”, Chemical Engineering and Processing:
Process Intensification, 47(2), 237 – 244.
He, Y, Deen, NG, van Sint Annaland, M and Kuipers, JAM (2009) “Gas-solid
turbulent flow in a circulating fluidized bed riser: experimental and numerical study
of monodisperse particle systems”, Industrial & Engineering Chemistry Research,
48(17), 8091 – 8097.
Hernández-Jiménez, F, Sánchez-Delgado, S, Gómez-García, A and Acosta-Iborra,
A (2011) “Comparison between two-fluid model simulations and particle image
analysis & velocimetry (PIV) results for a two-dimensional gas-solid fluidized bed”,
Chemical Engineering Science, 66(17), 3753 – 3772.
Ho, TC (2003) Modeling, In Yang, W (ed) Handbook of Fluidization and Fluid-Particle
Systems, Marcel Dekker, Inc, United States of America.
Ibsen, CH, Solberg, T and Hjertager, BH (2001) “Evaluation of a three-
dimensional numerical method of a scaled circulating fluidized bed”, Industrial and
Engineering Chemistry Research, 40(23), 5081 – 5086.
Ibsen, CH, Solberg, T, Hjertager, BH and Johnsson, F (2002) “Laser Doppler
anemometry measurements in a circulating fluidized bed of metal particles”,
Experimental Thermal and Fluid Science, 26(6-7), 851 – 859.
Jazayeri, B (1995) “Successful scale up catalytic gas-fluidized beds”, Chem Eng Prog,
91(4), 26 – 31.
© University of Pretoria
2-18
Jiang, P, Wei, F and Fan, L (2003) General Approaches to Reactor Design, In Yang, W
(ed) Handbook of Fluidization and Fluid-Particle Systems, Marcel Dekker, Inc, United
States of America.
Kashyap, M and Gidaspow, D (2011) “Measurements of dispersion coefficients for
FCC particles in a free board” Industrial & Engineering Chemistry Research, 50(12),
7549 – 7565.
Khanna, P, Pugsley, T, Tanfara, H and Dumont, H (2008) “Radioactive particle
tracking in a lab-scale conical fluidized bed dryer containing pharmaceutical
granule”, The Canadian Journal of Chemical Engineering, 86(3), 563 – 570.
Krishna, R (1994) “A systems approach to multiphase reactor selection”, Advances
Chem Eng, 19, 201 – 249.
Kuan, B, Yang, W and Schwarz, MP (2007) “Dilute gas-solid two-phase flows in a
curved 90° duct bend: CFD simulation with experimental validation” Chemical
Engineering Science, 62(7), 2068 – 2088.
Kumar, SB, Moslemian, D and Dudukovic, MP (1995) “A [gamma]-ray
tomographic scanner for imaging voidage distribution in two-phase flow systems”,
Flow Measurement and Instrumentation, 6(1), 61 – 73.
Kunii, D and Levenspiel, O (1991) Fluidization Engineering, 2nd Edition,
Butterworth-Heinemann Series in Chemical Engineering, Stoneham, MA.
Larachi, F, Al-Dahhan, MH, Dudukovic, MP and Roy, S (2008) “Optimal design
of radioactive particle tracking experiments for flow mapping in opaque
© University of Pretoria
2-19
multiphase reactors”, Applied Radiation and Isotopes Including Data Instrumentation and
Methods for Use in Agricultural Industry and Medicine, 56(3), 485 – 503.
Laverman, JA, Roghair, I, van Sint Annaland, M and Kuipers, H (2008)
“Investigation into the hydrodynamics of gas-solid fluidized beds using particle
image velocimetry coupled with digital image analysis”, The Canadian Journal of
Chemical Engineering, 86(3), 523 – 535.
Link, JM, Godlieb, W, Tripp, P, Deen, NG, Heinrich, S, Kuipers, JAM, Schönherr,
M and Peglow, M (2009) “Comparison of fibre optical measurements and discrete
element simulations for the study of granulation in a spout fluidized bed”, Powder
Technology, 189(2), 202 – 217.
Lu, Y, Glass, DH and Easson, WJ (2009) “An investigation of particle behaviour
in gas-solid horizontal pipe flow by an extended LDA technique”, Fuel, 88(12),
2520 – 2531.
Mathiesen, V, Solberg, T, Arastoopour, H and Hjertager, BH (1999)
“Experimental and computational study of multiphase gas/particle flow in a CFB
riser”, AIChE Journal, 45(12), 2503 – 2518.
Meggitt, BT (2010) Fibre Optics in Sensor Instrumentation, In Instrumentation Reference
Book, Fourth Edition, 191 – 216, Butterworth-Heinemann, Boston.
Newton, D, Fiorentino, M and Smith, GB (2001) “The application of X-ray
imaging to the developments of fluidized bed processes”, Powder Technology, 120(1-
2), 70 – 75.
© University of Pretoria
2-20
Paudel, BE (2011) Experimental study on fluidization of biomass, inert particles and
biomass/sand mixtures, MSc Thesis, Department of Mechanical and Energy
Engineering, University of North Texas.
Pell, W, Dunson, JB and Knowlton, TM (2007) Gas-solid operations and equipment, In
Green, DW and Perry, RH (eds) Perry’s Chemical Engineers’ Handbook, 8th Edition,
McGraw-Hill.
Petritsch, G, Reinecke, N and Mewes, D (2000) Visualization techniques in process
engineering, In Ullmann’s Encyclopaedia of Industrial Chemistry, Wiley-VCH Verlag
GmbH & Co KGaA.
Pugsley, T, McKeen, T and das Sharma, S (2005) “Application of CFD to simulate
the hydrodynamics of fluidized beds containing fine powders”, a paper presented
at the Industrial Fluidization South Africa Conference, 16 – 17 November, 2005,
Johannesburg, South Africa.
Rhodes, M (2008) Introduction to Particle Technology, 2nd Edition, John Wiley & Sons
Ltd, England.
Richardson, JF, Harker, JH and Backhurst, JR (2002) Coulson and Richardson’s
Chemical Engineering, Volume 2: Particle Technology and Separation Processes, 5th Edition,
Butterworth-Heinemann, Oxford.
Sathe, MJ, Thaker, IH, Stand, TE and Joshi, JB (2010) “Advanced PIV/LIF and
shadowgraphy system to visualize flow structure in two-phase bubbly flows”,
Chemical Engineering Science, 65(8), 2431 – 2442.
© University of Pretoria
2-21
Silva, GG, Jiménez, NP and Salazar, OF (2012) Fluid dynamics of gas-solid fluidized
beds, In Oh, HW (ed) Advanced Fluid Dynamics, InTech.
Sreenivasan, B and Raghavan, VR (2002) “Hydrodynamics of a swirling fluidized
bed”, Chemical Engineering and Processing, 41, 99 – 106.
Tan, HT, Dong, GG, Wei, YD and Shi, MX (2007) “Application of γ-ray
attenuation technology in measurement of solid concentration of gas-solid two-
phase flow in a FCC riser”, Guocheng Gongcheng Xuebao/Chinese Journal of Process
Engineering, 7(5), 895 – 899.
Tapp, HS, Peyton, AJ, Kemsley, EK and Wilson (2003) “Chemical engineering
applications of electrical process tomography”, Sensors and Actuators, B: Chemical,
92(1-2), 17 – 24.
Thatte, AR, Ghadge, RS, Patwardhan, AW, Joshi, JB and Singh, G (2004) “Local
gas holdup measurement in sparged and aerated tanks by γ-ray attenuation
technique”, Industrial & Engineering Chemistry Research, 43(17), 5389 – 5399.
Torftech (sa) “TORBED Compact Bed Reactor (‘CBR’)”,
http://www.torftech.com/technologies/compact_bed_reactor.html [Accessed 8
October 2014].
Vaishali, S, Roy, S, Bhusarapu, S, Al-Dahhan, MH and Dudukovic, MP (2007)
“Numerical simulation of gas-solid dynamics in a circulating fluidized-bed riser
with Geldart group B particles”, Industrial and Engineering Chemistry Research, 46(25),
8620 – 8628.
© University of Pretoria
2-22
Van Buijtenen, MS, van Dijk, WJ, Deen, NG, Kuipers, JAM, Leadbeater, T and
Parker, DJ (2011) “Numerical and experimental study on multiple-spout fluidized
beds”, Chemical Engineering Science, 66(11), 2368 – 2376.
Veluswamy, GK, Upadhyay, RK, Utikar, RP, Evans, GM, Tade, MO, Glenny, ME,
Roy, S and Pareek, VK (2011) “Hydrodynamics of a fluid catalytic cracking
stripper using γ-ray densitometry” Industrial & Engineering Chemistry Research, 50(10),
5933 – 5941.
Versteeg, HK and Malalasekera, W (2007) An introduction to computational fluid
dynamics: the finite volume method, 2nd Edition, Pearson Education Limited, Essex.
Vogt, C, Schreiber, R, Brunner, G and Werther, J (2005) “Fluid dynamics of the
supercritical fluidized bed”, Powder Technology, 158(1-3), 102 – 114.
Wang, HG, Yang, WQ, Senior, P, Raghavan, RS and Duncan, SR (2008)
“Investigation of batch fluidized-bed drying by mathematical modelling, CFD
simulation and ECT measurement”, AIChE Journal, 54(2), 427 – 444.
Wang, RC and Han, YC (1999) “Momentum dissipation of jet dispersion in a gas-
solid fluidized bed”, Journal of the Chinese Institute of Chemical Engineers, 30(3), 263 –
271.
Wang, Z, Sun, S, Chen, H, Deng, Q, Zhao, G and Wu, S (2009) “Experimental
investigation on flow asymmetry in solid entrance region of a square circulating
fluidized bed”, Particuology, 7(6), 483 – 490.
© University of Pretoria
2-23
Werther, J and Hartge, E (2003) Elutriation and entrainment, In Yang, W (ed)
Handbook of fluidization and fluid-particle systems, Marcel Dekker, Inc, United States of
America.
Werther, J and Reppenhagen, J (2003) Attrition, In Yang, W (ed) Handbook of
fluidization and fluid-particle systems, Marcel Dekker, Inc, United States of America.
Werther, J, Hage, B and Rudnick, C (1996) “A comparison of laser Doppler and
single-fibre reflection probes for the measurement of the velocity of solids in a gas-
solid circulating fluidized bed”, Chemical Engineering and Processing: Process
Intensification, 35(5), 381 – 391.
Wiesendorf, V (2000) The capacitance probe: a tool for flow investigations in gas-solids
fluidization systems, Shaker Verlag GmbH, Germany.
Wu, C, Cheng, Y, Liu, M and Jin, Y (2008) “Measurement of axisymmetric two-
phase flows by an improved X-ray-computed tomography technique”, Industrial and
Engineering Chemistry Research, 47(6), 2063 – 2074.
Yang, W (2003) Other Nonconventional Fluidized Beds, In Yang, W (ed) Handbook of
fluidization and fluid-particle systems, Marcel Dekker, Inc, United States of America.
Ye, S, Qi, X and Zhu, J (2009) “Direct measurements of instantaneous solid flux in
a CFB riser using a novel multifunctional optical fiber probe”, Chemical Engineering
& Technology, 32(4), 580 – 589.
Zhou, H, Mo, G, Zhao, J, Li, J and Cen, K (2010) “Experimental investigations on
the performance of a coal pipe splitter for a 1 000 MW utility boiler: influence of the
vertical pipe length” Energy & Fuels, 24(9), 4893 – 4903.
© University of Pretoria
2-24
Zhu, H, Zhu, J, Li, G and Lu, F (2008) “Detailed measurements of flow structure
inside a dense gas-solids fluidized bed”, Powder Technology, 180(3), 339 – 349.
© University of Pretoria
3-1
CHAPTER 3: MATERIALS & METHODS
Before starting experimental work, the hydrodynamic behaviour of any fluidized bed
can be predicted, provided that several characteristics of the bed of particles, and
those of the individual particles themselves, are known. These characteristics include
the mean particle size, the individual particle density as well as the particle sphericity.
River sand was selected as the primary material tested in the annular fluidized bed as
it would also be the bed material used in the pyrolysis chamber of the new fluidized
bed fast pyrolyser. In order to compare the behaviour of the annular fluidized bed
using materials of varying particle sizes and bulk densities, additional materials,
namely ilmenite, an ilmenite-sand mixture, mustard seeds and poppy seeds, were also
tested.
The particle size distribution of the various materials tested was determined using
laser diffraction in a Malvern Mastersizer 3000, and a scanning electron microscope
(Phenom ProX desktop SEM) was used to study the individual particles in more
detail. A summary of the findings can be found at the end of this Chapter (Table 3-1).
A brief discussion on the flow of air and how the pressure drop measurements were
obtained is also described in this Chapter.
3.1 River Sand
The river sand obtained for the experiments was initially sieved through a 2 mm
mesh screen in order to remove large, unwanted particles. Thereafter, the particle
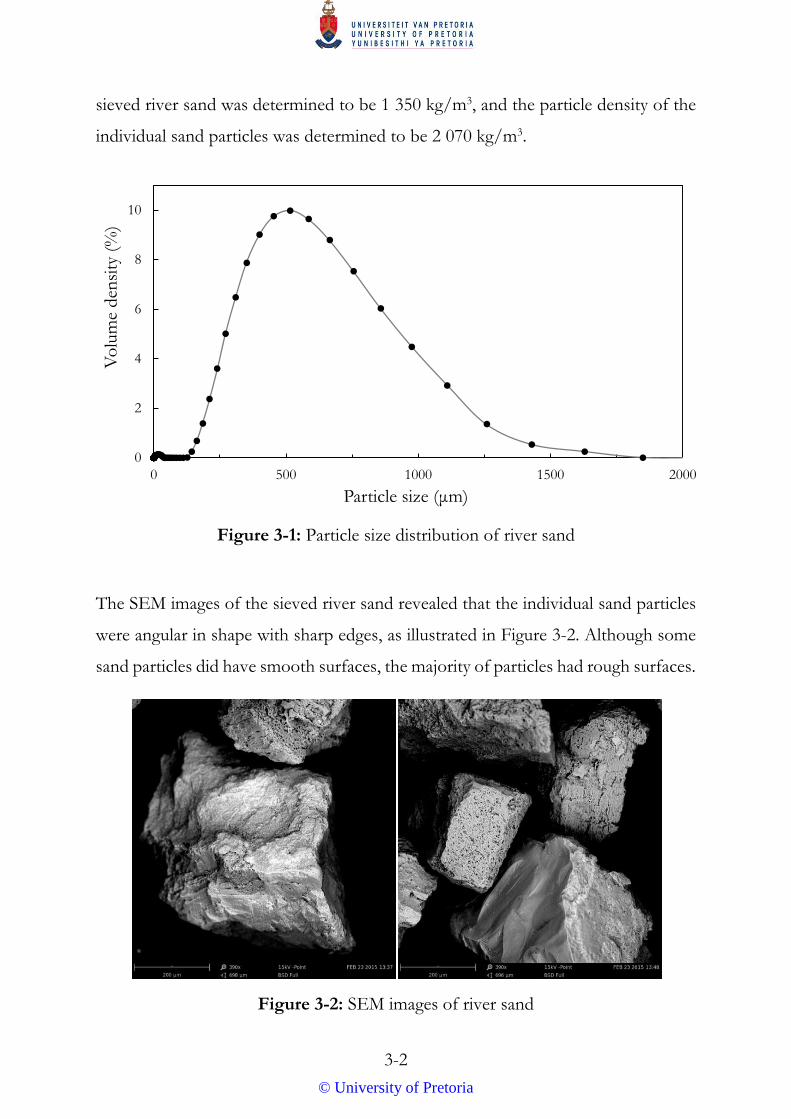
size distribution (Figure 3-1), as well as the particle density, was determined. Based
on Figure 3-1, it is evident that the sieved river sand sample had a large particle size
distribution, with a volume average particle size of 528 μm. The bulk density of the
© University of Pretoria
3-2
sieved river sand was determined to be 1 350 kg/m3, and the particle density of the
individual sand particles was determined to be 2 070 kg/m3.
Figure 3-1: Particle size distribution of river sand
The SEM images of the sieved river sand revealed that the individual sand particles
were angular in shape with sharp edges, as illustrated in Figure 3-2. Although some
sand particles did have smooth surfaces, the majority of particles had rough surfaces.
Figure 3-2: SEM images of river sand
0
2
4
6
8
10
0 500 1000 1500 2000
Vo
lum
e d
ensi
ty (
%)
Particle size (μm)
© University of Pretoria
3-3
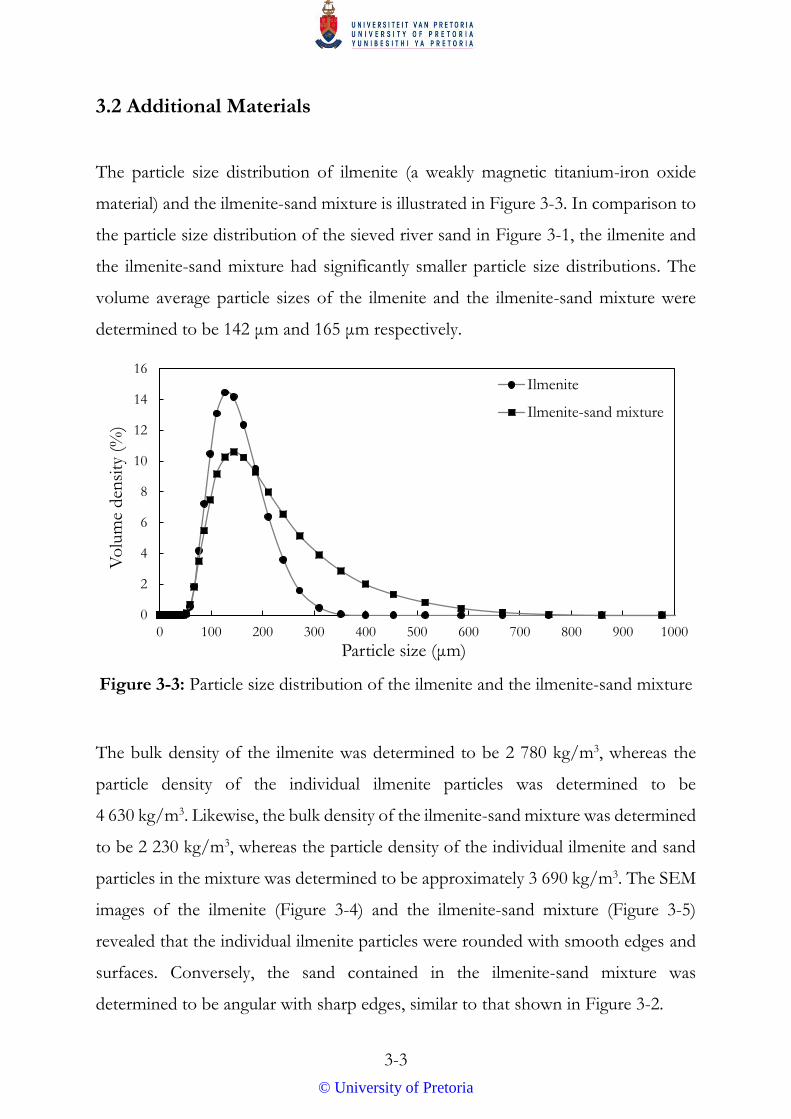
3.2 Additional Materials
The particle size distribution of ilmenite (a weakly magnetic titanium-iron oxide
material) and the ilmenite-sand mixture is illustrated in Figure 3-3. In comparison to
the particle size distribution of the sieved river sand in Figure 3-1, the ilmenite and
the ilmenite-sand mixture had significantly smaller particle size distributions. The
volume average particle sizes of the ilmenite and the ilmenite-sand mixture were
determined to be 142 μm and 165 μm respectively.
Figure 3-3: Particle size distribution of the ilmenite and the ilmenite-sand mixture
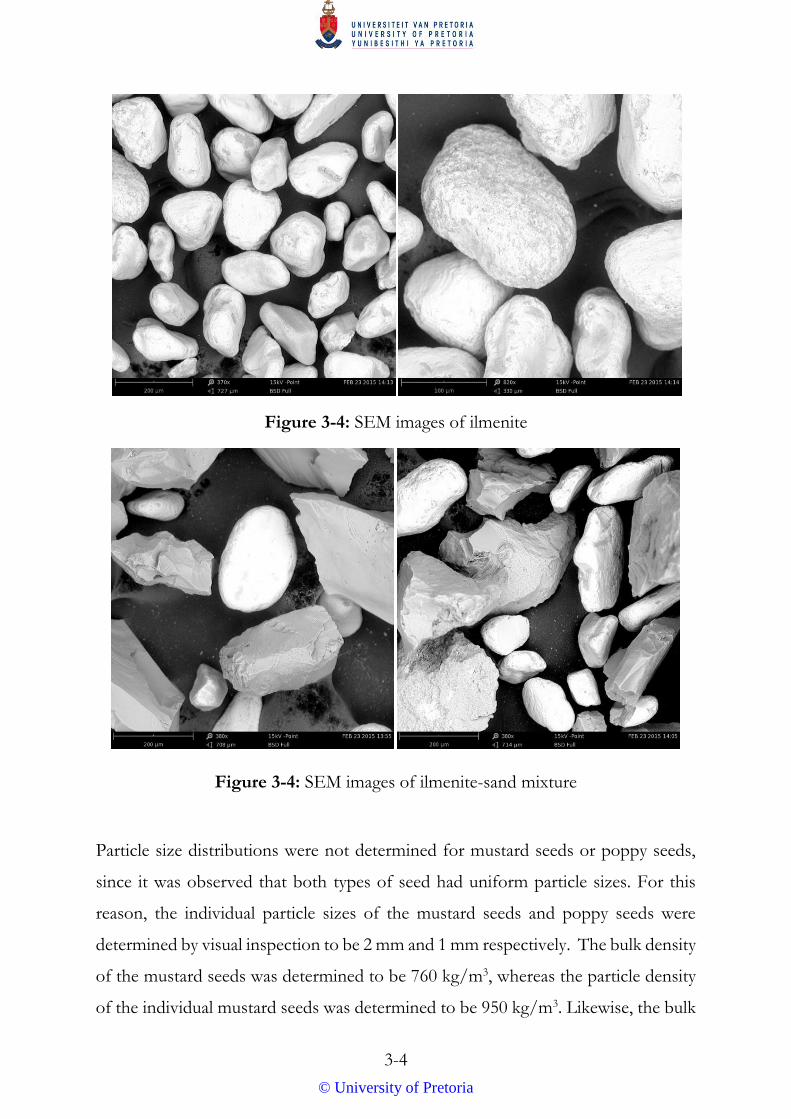
The bulk density of the ilmenite was determined to be 2 780 kg/m3, whereas the
particle density of the individual ilmenite particles was determined to be
4 630 kg/m3. Likewise, the bulk density of the ilmenite-sand mixture was determined
to be 2 230 kg/m3, whereas the particle density of the individual ilmenite and sand
particles in the mixture was determined to be approximately 3 690 kg/m3. The SEM
images of the ilmenite (Figure 3-4) and the ilmenite-sand mixture (Figure 3-5)
revealed that the individual ilmenite particles were rounded with smooth edges and
surfaces. Conversely, the sand contained in the ilmenite-sand mixture was
determined to be angular with sharp edges, similar to that shown in Figure 3-2.
0
2
4
6
8
10
12
14
16
0 100 200 300 400 500 600 700 800 900 1000
Vo
lum
e d
ensi
ty (
%)
Particle size (μm)
Ilmenite
Ilmenite-sand mixture
© University of Pretoria
3-4
Figure 3-4: SEM images of ilmenite
Figure 3-4: SEM images of ilmenite-sand mixture
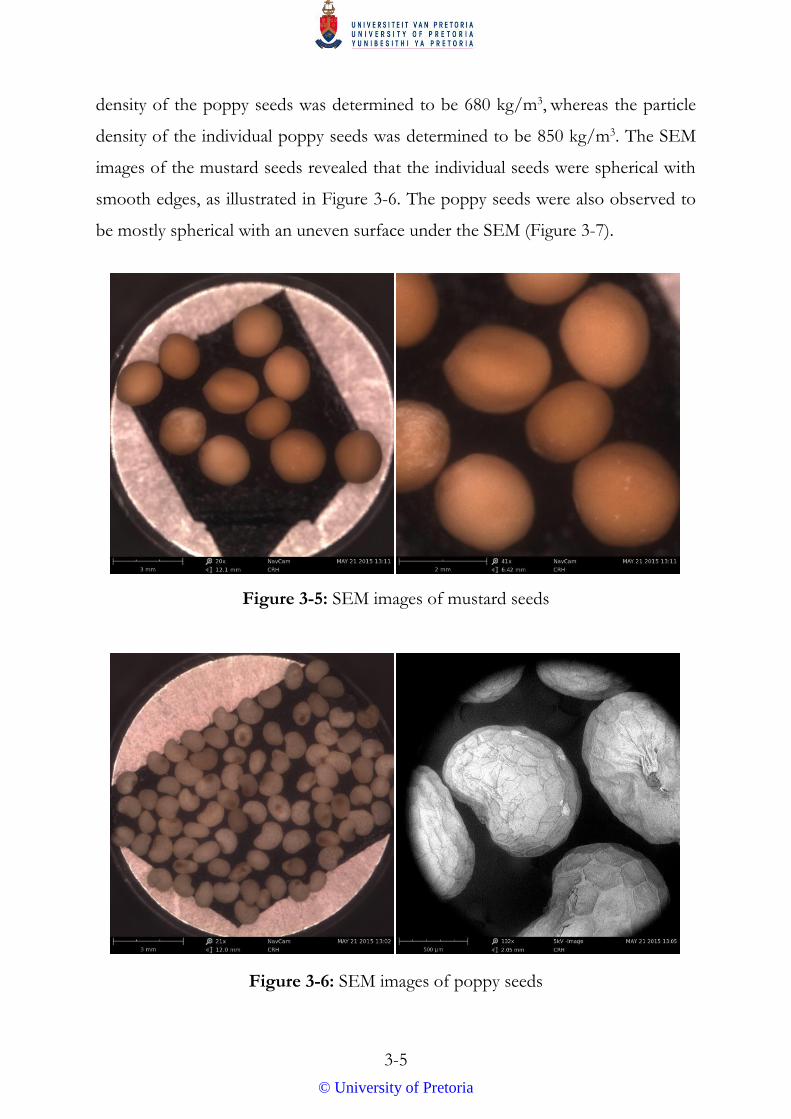
Particle size distributions were not determined for mustard seeds or poppy seeds,
since it was observed that both types of seed had uniform particle sizes. For this
reason, the individual particle sizes of the mustard seeds and poppy seeds were
determined by visual inspection to be 2 mm and 1 mm respectively. The bulk density
of the mustard seeds was determined to be 760 kg/m3, whereas the particle density
of the individual mustard seeds was determined to be 950 kg/m3. Likewise, the bulk
© University of Pretoria
3-5
density of the poppy seeds was determined to be 680 kg/m3, whereas the particle
density of the individual poppy seeds was determined to be 850 kg/m3. The SEM
images of the mustard seeds revealed that the individual seeds were spherical with
smooth edges, as illustrated in Figure 3-6. The poppy seeds were also observed to
be mostly spherical with an uneven surface under the SEM (Figure 3-7).
Figure 3-5: SEM images of mustard seeds
Figure 3-6: SEM images of poppy seeds
© University of Pretoria
3-6
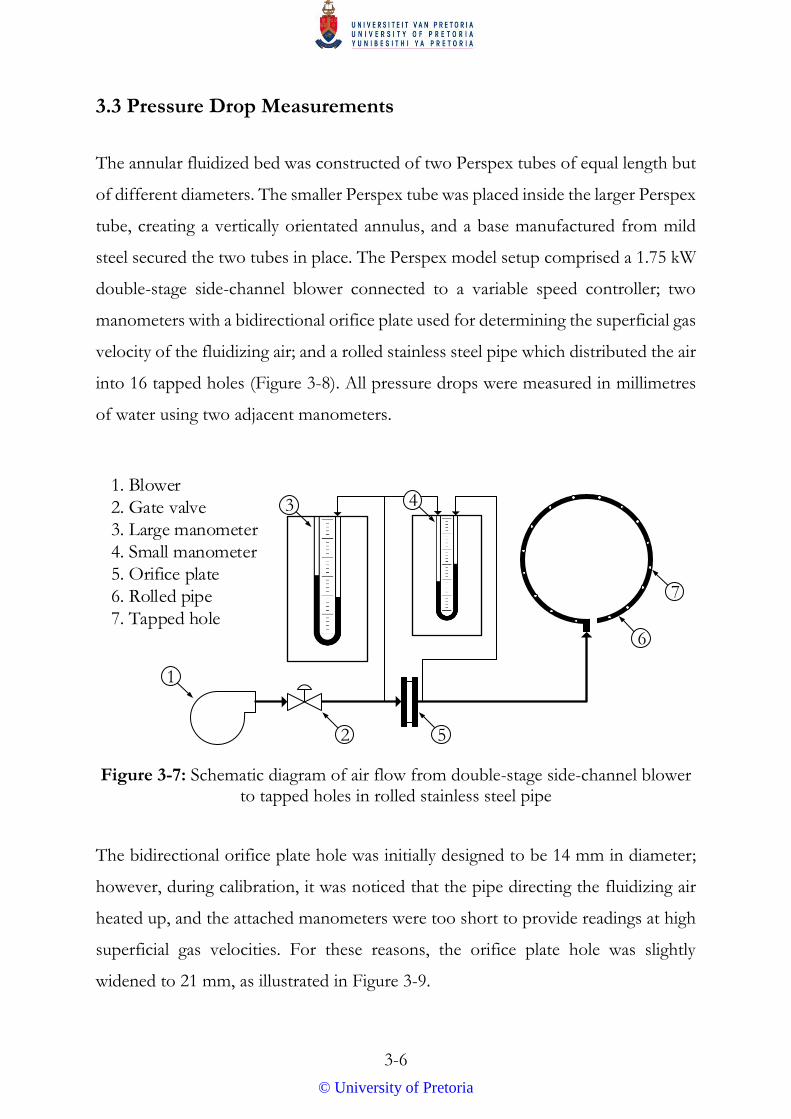
3.3 Pressure Drop Measurements
The annular fluidized bed was constructed of two Perspex tubes of equal length but
of different diameters. The smaller Perspex tube was placed inside the larger Perspex
tube, creating a vertically orientated annulus, and a base manufactured from mild
steel secured the two tubes in place. The Perspex model setup comprised a 1.75 kW
double-stage side-channel blower connected to a variable speed controller; two
manometers with a bidirectional orifice plate used for determining the superficial gas
velocity of the fluidizing air; and a rolled stainless steel pipe which distributed the air
into 16 tapped holes (Figure 3-8). All pressure drops were measured in millimetres
of water using two adjacent manometers.
1
2
3 4
5
6
7
1. Blower
2. Gate valve
3. Large manometer
4. Small manometer
5. Orifice plate
6. Rolled pipe
7. Tapped hole
Figure 3-7: Schematic diagram of air flow from double-stage side-channel blower to tapped holes in rolled stainless steel pipe
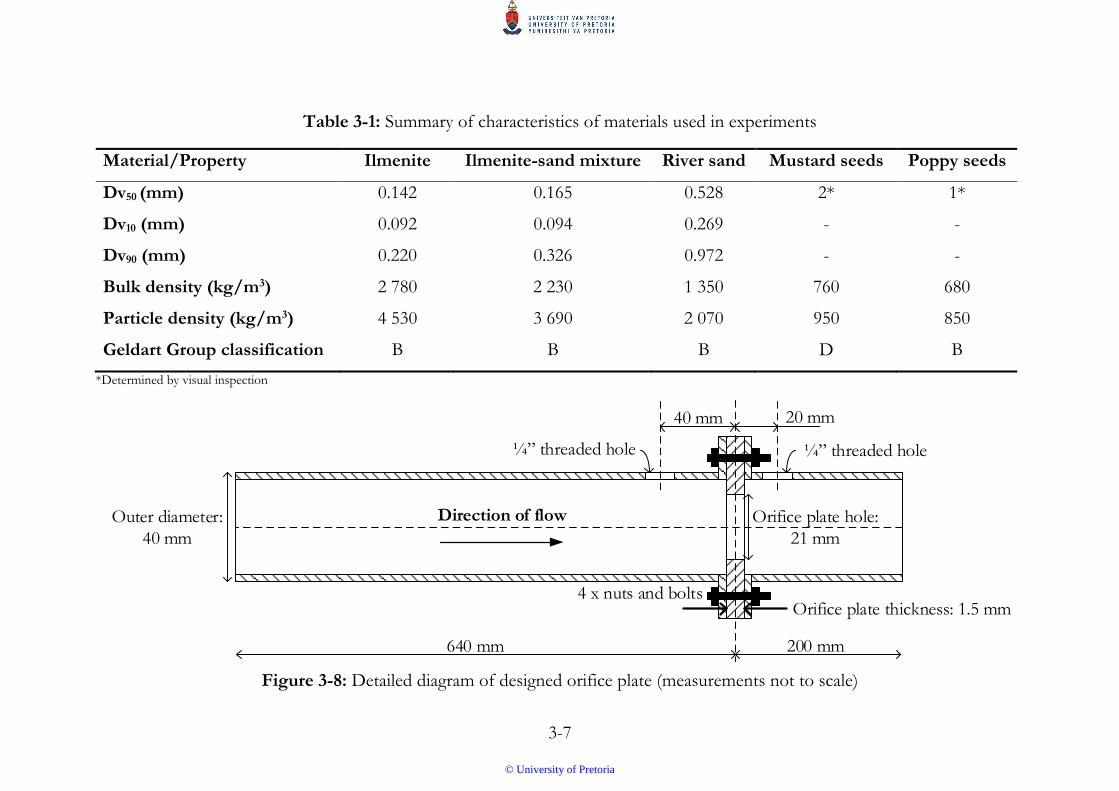
The bidirectional orifice plate hole was initially designed to be 14 mm in diameter;
however, during calibration, it was noticed that the pipe directing the fluidizing air
heated up, and the attached manometers were too short to provide readings at high
superficial gas velocities. For these reasons, the orifice plate hole was slightly
widened to 21 mm, as illustrated in Figure 3-9.
© University of Pretoria
3-7
Table 3-1: Summary of characteristics of materials used in experiments
Material/Property Ilmenite Ilmenite-sand mixture River sand Mustard seeds Poppy seeds
Dv50 (mm) 0.142 0.165 0.528 2* 1*
Dv10 (mm) 0.092 0.094 0.269 - -
Dv90 (mm) 0.220 0.326 0.972 - -
Bulk density (kg/m3) 2 780 2 230 1 350 760 680
Particle density (kg/m3) 4 530 3 690 2 070 950 850
Geldart Group classification B B B D B
*Determined by visual inspection
40 mm 20 mm
Orifice plate thickness: 1.5 mm
Orifice plate hole:
21 mm
200 mm640 mm
Outer diameter:
40 mm
¼ threaded hole
4 x nuts and bolts
¼ threaded hole
Direction of flow
Figure 3-8: Detailed diagram of designed orifice plate (measurements not to scale)
© University of Pretoria
4-1
CHAPTER 4: TANGENTIAL INJECTORS
By orientating multiple gas injectors tangentially to the outer walls of an annulus, it
was hypothesized that the centrifugal forces and the momentum transfer between
the moving gas to the bed material would be sufficient to induce a rotating fluid bed.
Annular fluidized beds with induced rotating fluid bed behaviour would ensure
complete mixing, and offer the additional advantage that the feed inlet to the
fluidized bed can be positioned at a single location.
4.1 Design Concept
It was hypothesized that the direction of the induced rotating fluid bed (clockwise
or anti-clockwise) would depend on the orientation of the gas injectors as illustrated
in Figure 4-1. The momentum transfer between the moving gas and the bed of
particles would depend on the number of gas injectors placed around the annulus,
the angle of the gas injectors, as well as the size of the gas injectors. The linear
velocity of the gas entering the annulus through the gas injectors would be
determined by the diameter of the gas injectors.
Figure 4-1: Clockwise rotation of the fluid bed in an annular space
© University of Pretoria
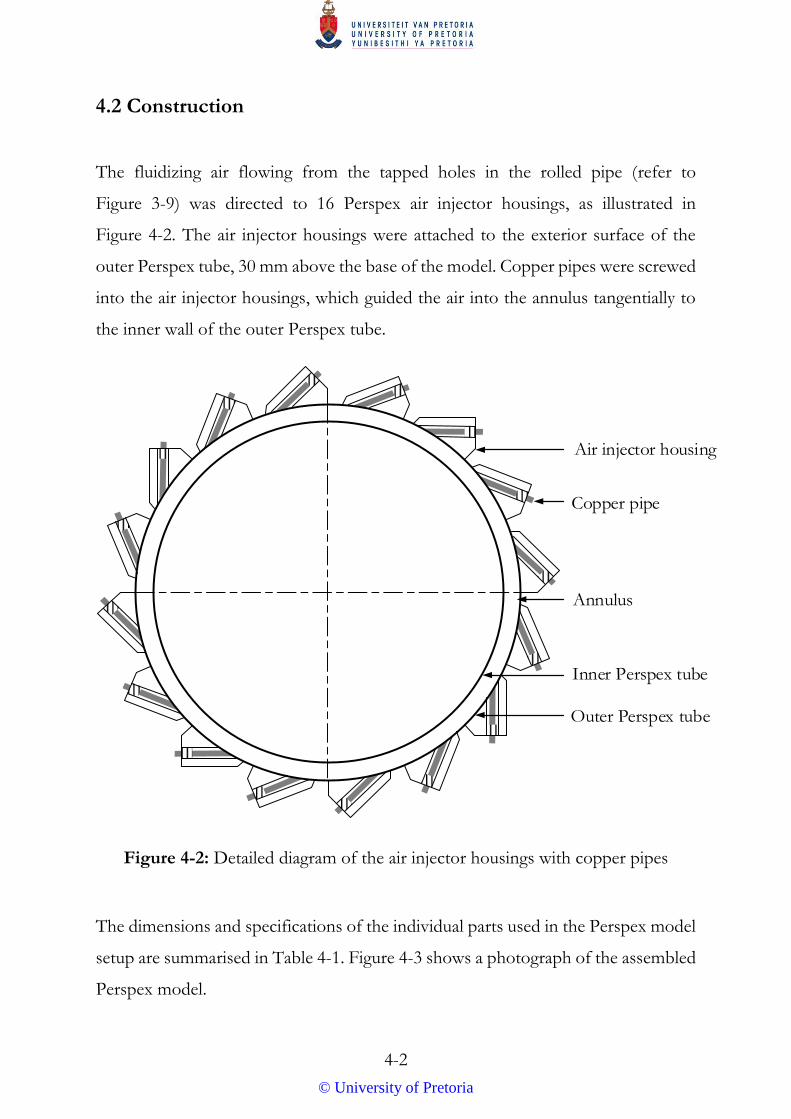
4-2
4.2 Construction
The fluidizing air flowing from the tapped holes in the rolled pipe (refer to
Figure 3-9) was directed to 16 Perspex air injector housings, as illustrated in
Figure 4-2. The air injector housings were attached to the exterior surface of the
outer Perspex tube, 30 mm above the base of the model. Copper pipes were screwed
into the air injector housings, which guided the air into the annulus tangentially to
the inner wall of the outer Perspex tube.
Annulus
Air injector housing
Copper pipe
Inner Perspex tube
Outer Perspex tube
Figure 4-2: Detailed diagram of the air injector housings with copper pipes
The dimensions and specifications of the individual parts used in the Perspex model
setup are summarised in Table 4-1. Figure 4-3 shows a photograph of the assembled
Perspex model.
© University of Pretoria
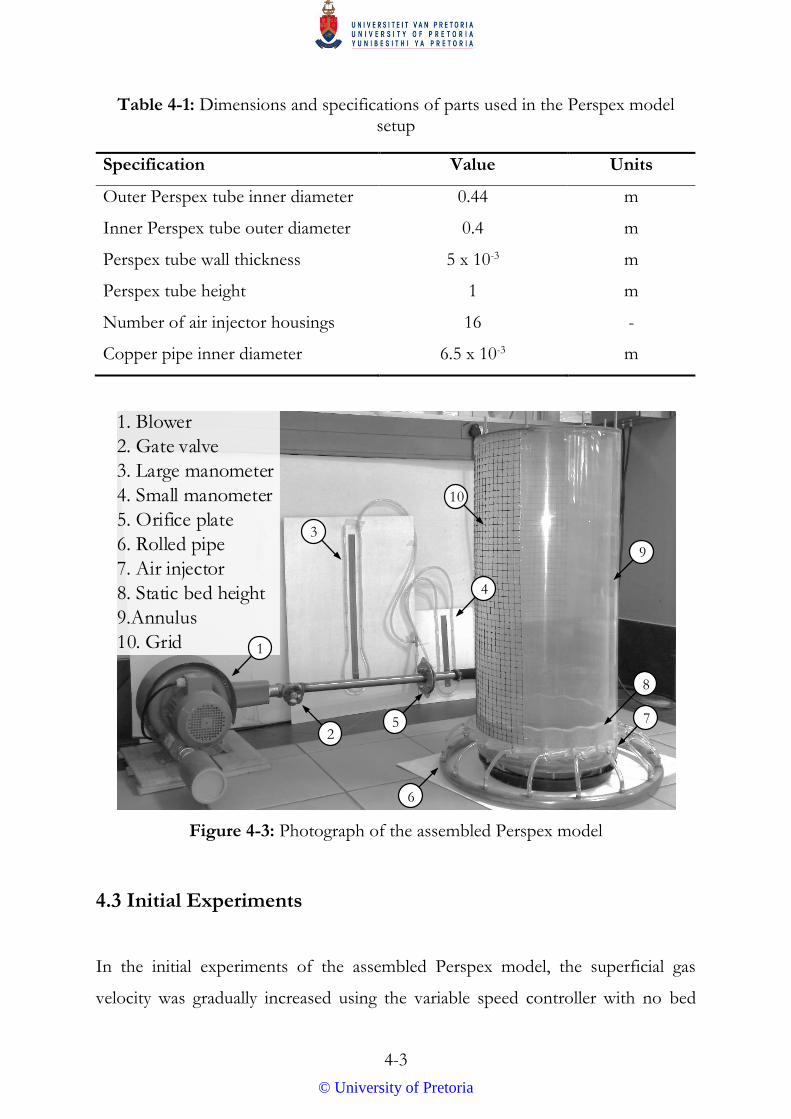
4-3
Table 4-1: Dimensions and specifications of parts used in the Perspex model setup
Specification Value Units
Outer Perspex tube inner diameter 0.44 m
Inner Perspex tube outer diameter 0.4 m
Perspex tube wall thickness 5 x 10⁻³ m
Perspex tube height 1 m
Number of air injector housings 16 -
Copper pipe inner diameter 6.5 x 10⁻³ m
1. Blower
2. Gate valve
3. Large manometer
4. Small manometer
5. Orifice plate
6. Rolled pipe
7. Air injector
8. Static bed height
9.Annulus
10. Grid 1
2
3
4
5
6
7
8
9
10
Figure 4-3: Photograph of the assembled Perspex model
4.3 Initial Experiments
In the initial experiments of the assembled Perspex model, the superficial gas
velocity was gradually increased using the variable speed controller with no bed
© University of Pretoria
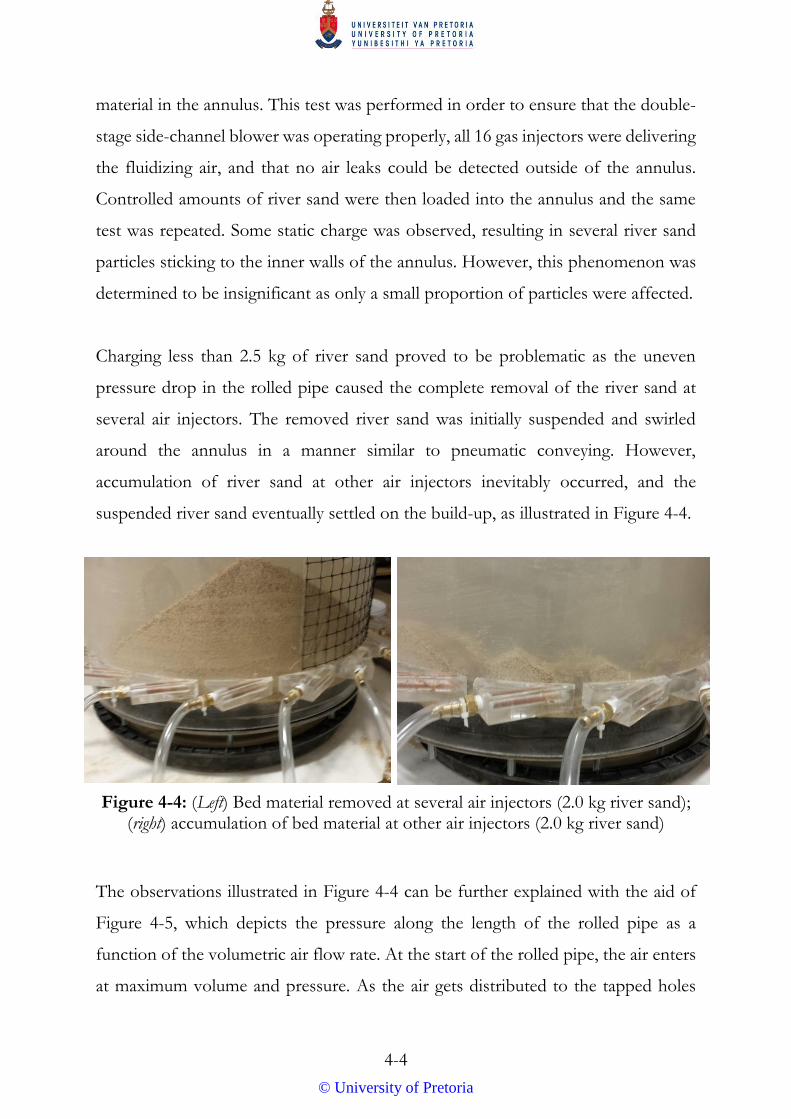
4-4
material in the annulus. This test was performed in order to ensure that the double-
stage side-channel blower was operating properly, all 16 gas injectors were delivering
the fluidizing air, and that no air leaks could be detected outside of the annulus.
Controlled amounts of river sand were then loaded into the annulus and the same
test was repeated. Some static charge was observed, resulting in several river sand
particles sticking to the inner walls of the annulus. However, this phenomenon was
determined to be insignificant as only a small proportion of particles were affected.
Charging less than 2.5 kg of river sand proved to be problematic as the uneven
pressure drop in the rolled pipe caused the complete removal of the river sand at
several air injectors. The removed river sand was initially suspended and swirled
around the annulus in a manner similar to pneumatic conveying. However,
accumulation of river sand at other air injectors inevitably occurred, and the
suspended river sand eventually settled on the build-up, as illustrated in Figure 4-4.
Figure 4-4: (Left) Bed material removed at several air injectors (2.0 kg river sand); (right) accumulation of bed material at other air injectors (2.0 kg river sand)
The observations illustrated in Figure 4-4 can be further explained with the aid of
Figure 4-5, which depicts the pressure along the length of the rolled pipe as a
function of the volumetric air flow rate. At the start of the rolled pipe, the air enters
at maximum volume and pressure. As the air gets distributed to the tapped holes
© University of Pretoria
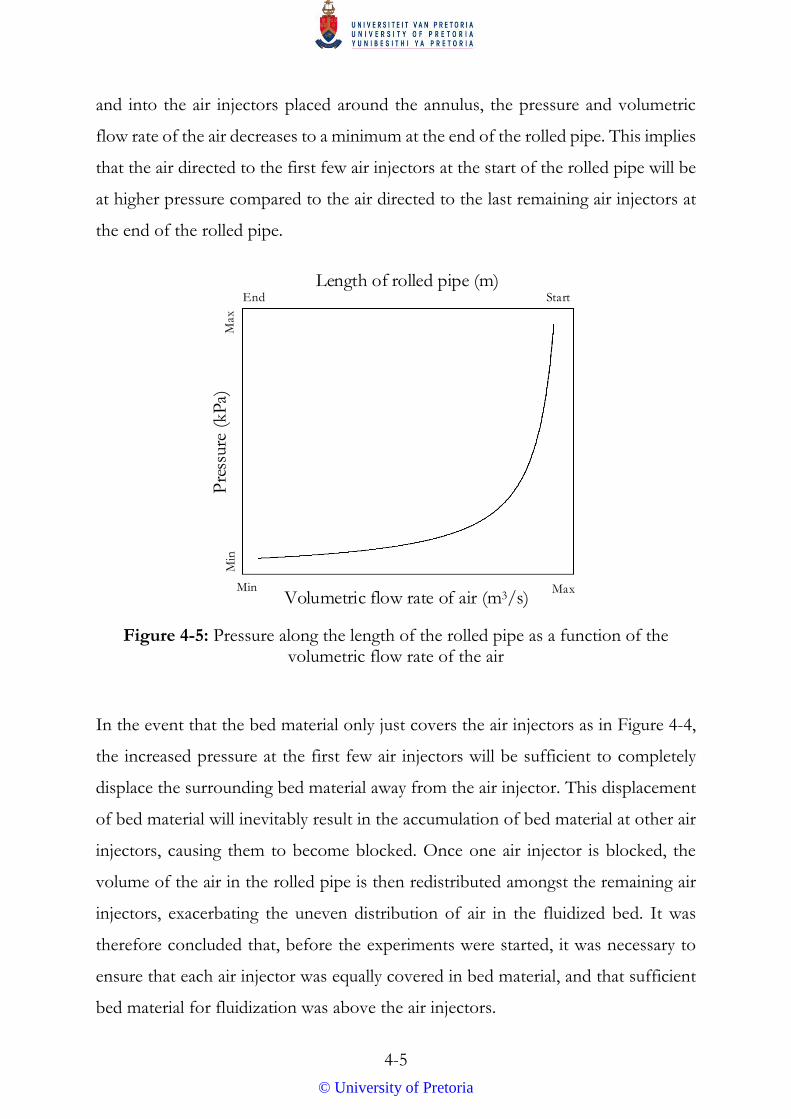
4-5
and into the air injectors placed around the annulus, the pressure and volumetric
flow rate of the air decreases to a minimum at the end of the rolled pipe. This implies
that the air directed to the first few air injectors at the start of the rolled pipe will be
at higher pressure compared to the air directed to the last remaining air injectors at
the end of the rolled pipe.
Volumetric flow rate of air (m3/s)
Pre
ssure
(kP
a)
Length of rolled pipe (m)
Max
Max
Min
Min
End Start
Figure 4-5: Pressure along the length of the rolled pipe as a function of the volumetric flow rate of the air
In the event that the bed material only just covers the air injectors as in Figure 4-4,
the increased pressure at the first few air injectors will be sufficient to completely
displace the surrounding bed material away from the air injector. This displacement
of bed material will inevitably result in the accumulation of bed material at other air
injectors, causing them to become blocked. Once one air injector is blocked, the
volume of the air in the rolled pipe is then redistributed amongst the remaining air
injectors, exacerbating the uneven distribution of air in the fluidized bed. It was
therefore concluded that, before the experiments were started, it was necessary to
ensure that each air injector was equally covered in bed material, and that sufficient
bed material for fluidization was above the air injectors.
© University of Pretoria
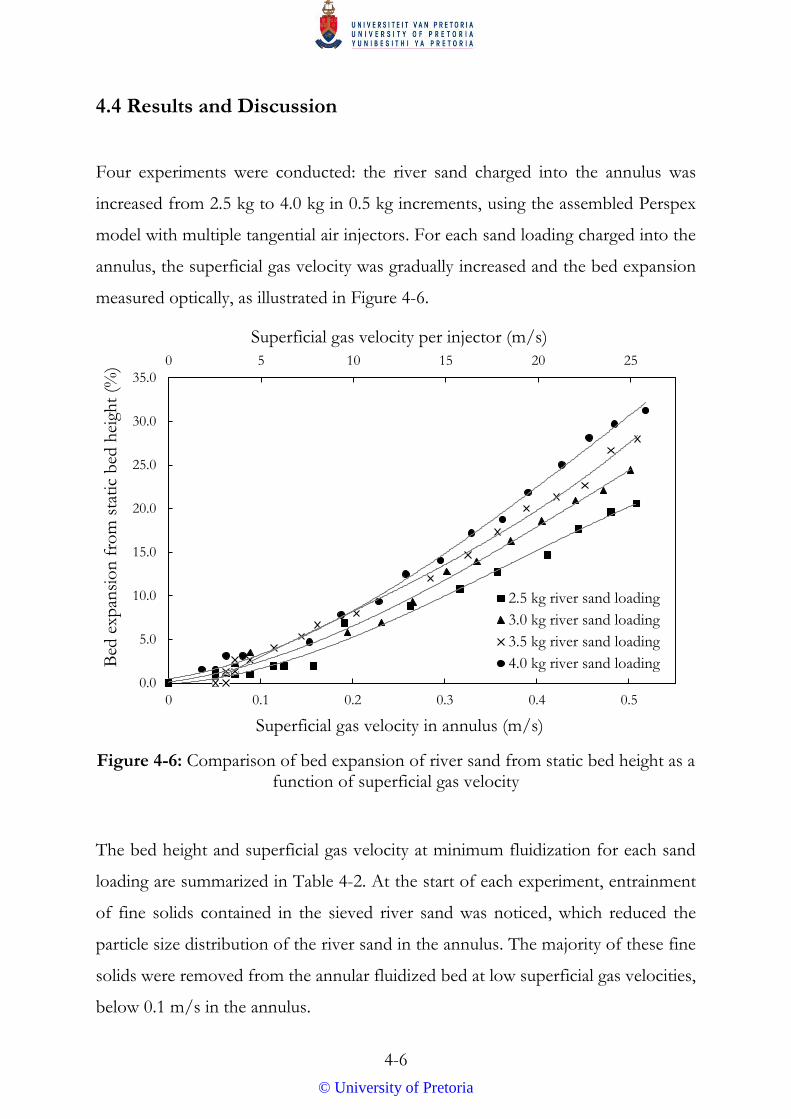
4-6
4.4 Results and Discussion
Four experiments were conducted: the river sand charged into the annulus was
increased from 2.5 kg to 4.0 kg in 0.5 kg increments, using the assembled Perspex
model with multiple tangential air injectors. For each sand loading charged into the
annulus, the superficial gas velocity was gradually increased and the bed expansion
measured optically, as illustrated in Figure 4-6.
Figure 4-6: Comparison of bed expansion of river sand from static bed height as a function of superficial gas velocity
The bed height and superficial gas velocity at minimum fluidization for each sand
loading are summarized in Table 4-2. At the start of each experiment, entrainment
of fine solids contained in the sieved river sand was noticed, which reduced the
particle size distribution of the river sand in the annulus. The majority of these fine
solids were removed from the annular fluidized bed at low superficial gas velocities,
below 0.1 m/s in the annulus.
0 5 10 15 20 25
0.0
5.0
10.0
15.0
20.0
25.0
30.0
35.0
0 0.1 0.2 0.3 0.4 0.5
Superficial gas velocity per injector (m/s)
Bed
exp
ansi
on
fro
m s
tati
c b
ed h
eigh
t (%
)
Superficial gas velocity in annulus (m/s)
2.5 kg river sand loading
3.0 kg river sand loading
3.5 kg river sand loading
4.0 kg river sand loading
© University of Pretoria
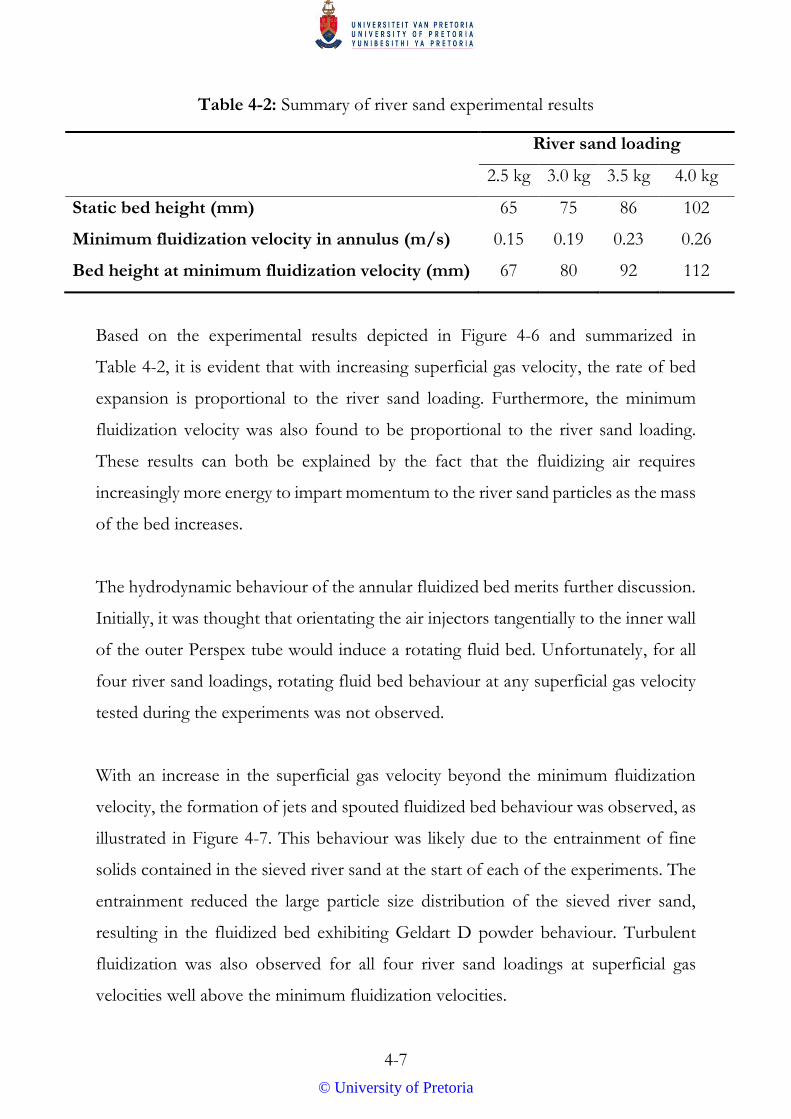
4-7
Table 4-2: Summary of river sand experimental results
River sand loading
2.5 kg 3.0 kg 3.5 kg 4.0 kg
Static bed height (mm) 65 75 86 102
Minimum fluidization velocity in annulus (m/s) 0.15 0.19 0.23 0.26
Bed height at minimum fluidization velocity (mm) 67 80 92 112
Based on the experimental results depicted in Figure 4-6 and summarized in
Table 4-2, it is evident that with increasing superficial gas velocity, the rate of bed
expansion is proportional to the river sand loading. Furthermore, the minimum
fluidization velocity was also found to be proportional to the river sand loading.
These results can both be explained by the fact that the fluidizing air requires
increasingly more energy to impart momentum to the river sand particles as the mass
of the bed increases.
The hydrodynamic behaviour of the annular fluidized bed merits further discussion.
Initially, it was thought that orientating the air injectors tangentially to the inner wall
of the outer Perspex tube would induce a rotating fluid bed. Unfortunately, for all
four river sand loadings, rotating fluid bed behaviour at any superficial gas velocity
tested during the experiments was not observed.
With an increase in the superficial gas velocity beyond the minimum fluidization
velocity, the formation of jets and spouted fluidized bed behaviour was observed, as
illustrated in Figure 4-7. This behaviour was likely due to the entrainment of fine
solids contained in the sieved river sand at the start of each of the experiments. The
entrainment reduced the large particle size distribution of the sieved river sand,
resulting in the fluidized bed exhibiting Geldart D powder behaviour. Turbulent
fluidization was also observed for all four river sand loadings at superficial gas
velocities well above the minimum fluidization velocities.
© University of Pretoria

4-8
Figure 4-7: Instantaneous snapshots of jet formation (3.5 kg river sand)
It was also observed that throughout the entire range of superficial gas velocities
tested, there were regions of stationary river sand. These regions were located
directly behind the air injectors, and remained relatively the same size throughout
the experiments. All these observations imply that the centrifugal forces were
significantly less than initially anticipated, and these regions of stationary bed
material, causing non-uniform fluidization in the annulus, impede the momentum
transfer between the moving air and river sand.
4.5 Alterations
In order to overcome the problems discussed in the previous section, and to achieve
the desired induced rotating fluid bed behaviour in the annulus, several alternations
to the assembled Perspex model were considered, namely:
© University of Pretoria
4-9
Increasing the velocity of the air by reducing the diameters of the air injectors;
Delivering more air, either by installing an additional blower or a more
powerful blower;
Testing different materials of varying particle sizes and densities; and
Considering a completely different air distribution system for the annulus.
4.5.1 Reducing the Air Injector Diameter
It was hypothesized that a reduction in the air injector diameter could increase the
momentum transfer between the moving air and river sand, potentially inducing the
desired rotating fluid bed. Smaller diameter air injectors would deliver the fluidizing
air at an increased velocity.
Based on the assumption that the momentum transfer of the moving air and river
sand can be related to the dynamic pressure of the system, a relationship between
the air injector diameter and momentum transfer could be established. Dynamic
pressure (𝑞), defined as the kinetic energy per unit volume of a fluid particle, is
calculated by multiplying its density (𝜌) by the square of its velocity (𝑣), and by a
factor of 0.5 (Equation 4-1).
𝑞 = 1
2 ∙ 𝜌 ∙ 𝑣2 (4-1)
Based on Equation 4-1, it is evident that the dynamic pressure, and therefore the
momentum transfer, is proportional to the square of the air velocity. Since the
velocity of the air is a function of the air injector dimensions, a minor reduction in
the diameter could cause a significant increase in the momentum transfer between
the moving air and river sand, as illustrated in Table 4-3.
© University of Pretoria
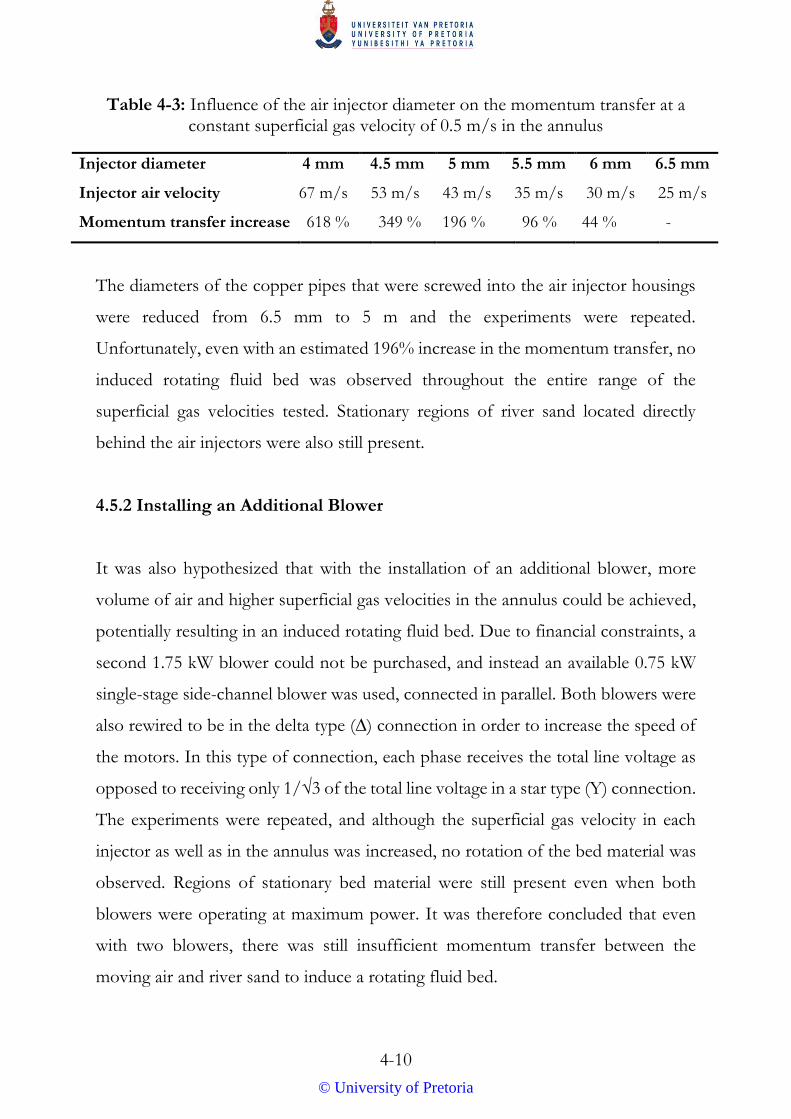
4-10
Table 4-3: Influence of the air injector diameter on the momentum transfer at a constant superficial gas velocity of 0.5 m/s in the annulus
Injector diameter 4 mm 4.5 mm 5 mm 5.5 mm 6 mm 6.5 mm
Injector air velocity 67 m/s 53 m/s 43 m/s 35 m/s 30 m/s 25 m/s
Momentum transfer increase 618 % 349 % 196 % 96 % 44 % -
The diameters of the copper pipes that were screwed into the air injector housings
were reduced from 6.5 mm to 5 m and the experiments were repeated.
Unfortunately, even with an estimated 196% increase in the momentum transfer, no
induced rotating fluid bed was observed throughout the entire range of the
superficial gas velocities tested. Stationary regions of river sand located directly
behind the air injectors were also still present.
4.5.2 Installing an Additional Blower
It was also hypothesized that with the installation of an additional blower, more
volume of air and higher superficial gas velocities in the annulus could be achieved,
potentially resulting in an induced rotating fluid bed. Due to financial constraints, a
second 1.75 kW blower could not be purchased, and instead an available 0.75 kW
single-stage side-channel blower was used, connected in parallel. Both blowers were
also rewired to be in the delta type (∆) connection in order to increase the speed of
the motors. In this type of connection, each phase receives the total line voltage as
opposed to receiving only 1/√3 of the total line voltage in a star type (Y) connection.
The experiments were repeated, and although the superficial gas velocity in each
injector as well as in the annulus was increased, no rotation of the bed material was
observed. Regions of stationary bed material were still present even when both
blowers were operating at maximum power. It was therefore concluded that even
with two blowers, there was still insufficient momentum transfer between the
moving air and river sand to induce a rotating fluid bed.
© University of Pretoria
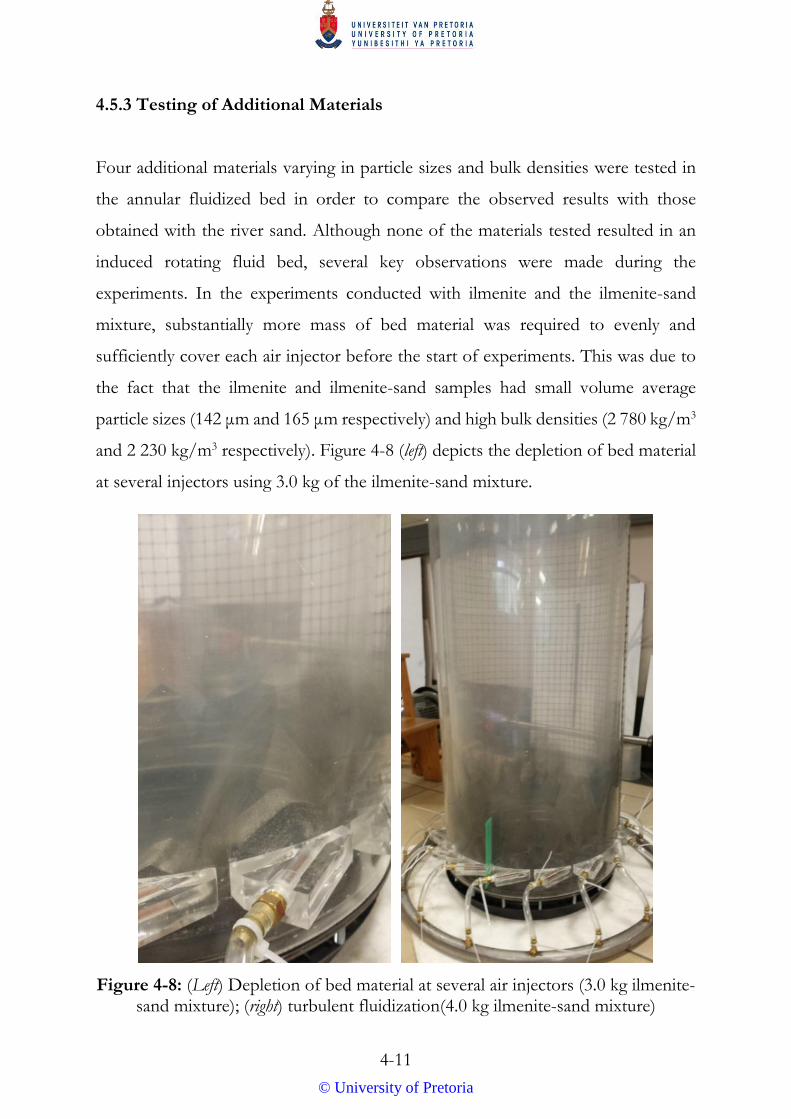
4-11
4.5.3 Testing of Additional Materials
Four additional materials varying in particle sizes and bulk densities were tested in
the annular fluidized bed in order to compare the observed results with those
obtained with the river sand. Although none of the materials tested resulted in an
induced rotating fluid bed, several key observations were made during the
experiments. In the experiments conducted with ilmenite and the ilmenite-sand
mixture, substantially more mass of bed material was required to evenly and
sufficiently cover each air injector before the start of experiments. This was due to
the fact that the ilmenite and ilmenite-sand samples had small volume average
particle sizes (142 μm and 165 μm respectively) and high bulk densities (2 780 kg/m3
and 2 230 kg/m3 respectively). Figure 4-8 (left) depicts the depletion of bed material
at several injectors using 3.0 kg of the ilmenite-sand mixture.
Figure 4-8: (Left) Depletion of bed material at several air injectors (3.0 kg ilmenite-sand mixture); (right) turbulent fluidization(4.0 kg ilmenite-sand mixture)
© University of Pretoria
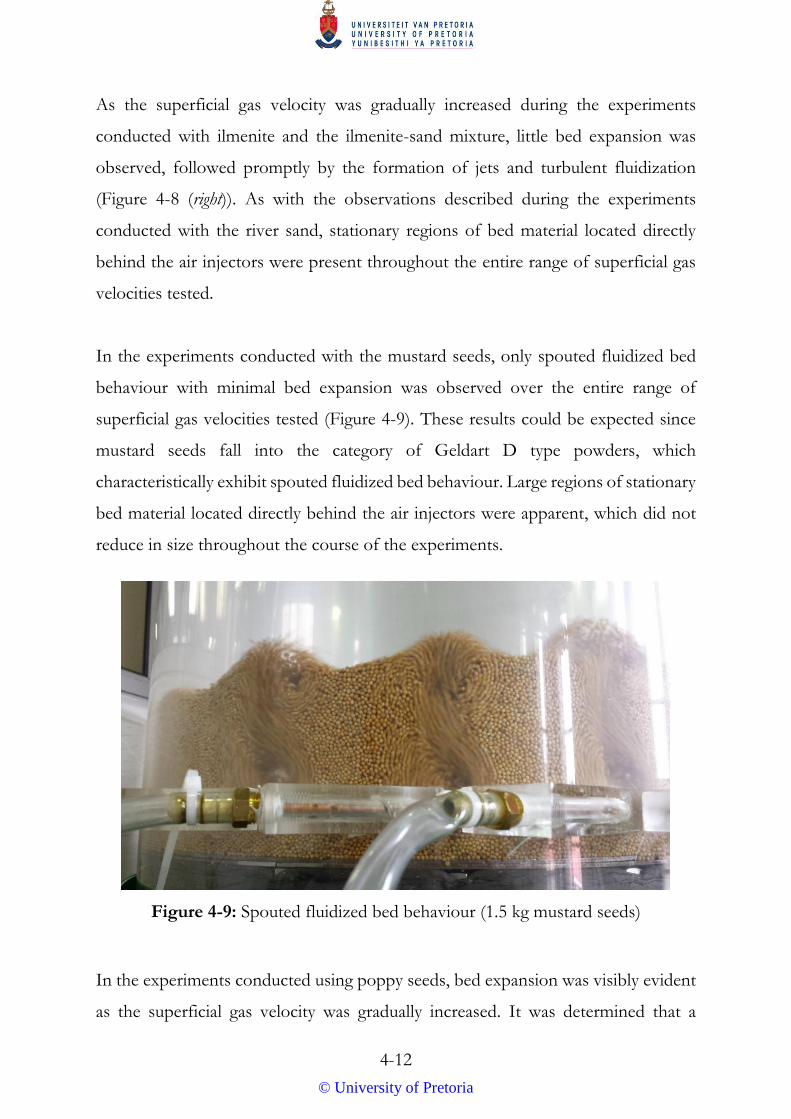
4-12
As the superficial gas velocity was gradually increased during the experiments
conducted with ilmenite and the ilmenite-sand mixture, little bed expansion was
observed, followed promptly by the formation of jets and turbulent fluidization
(Figure 4-8 (right)). As with the observations described during the experiments
conducted with the river sand, stationary regions of bed material located directly
behind the air injectors were present throughout the entire range of superficial gas
velocities tested.
In the experiments conducted with the mustard seeds, only spouted fluidized bed
behaviour with minimal bed expansion was observed over the entire range of
superficial gas velocities tested (Figure 4-9). These results could be expected since
mustard seeds fall into the category of Geldart D type powders, which
characteristically exhibit spouted fluidized bed behaviour. Large regions of stationary
bed material located directly behind the air injectors were apparent, which did not
reduce in size throughout the course of the experiments.
Figure 4-9: Spouted fluidized bed behaviour (1.5 kg mustard seeds)
In the experiments conducted using poppy seeds, bed expansion was visibly evident
as the superficial gas velocity was gradually increased. It was determined that a
© University of Pretoria
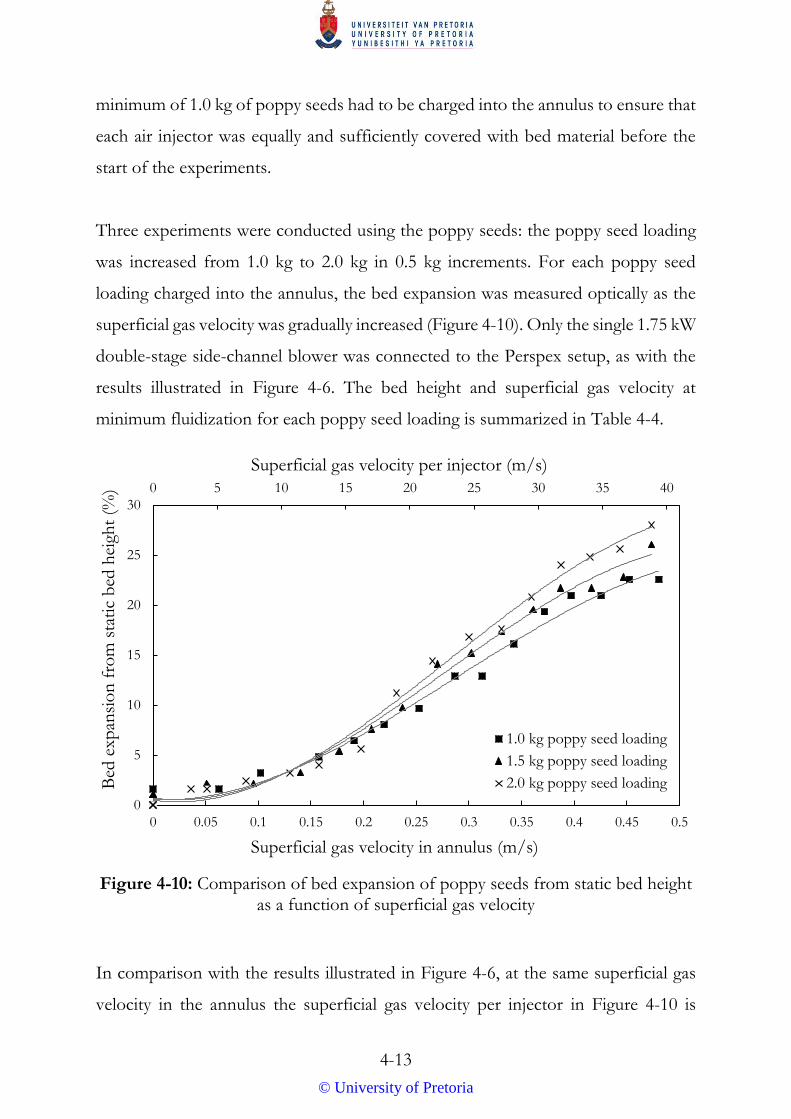
4-13
minimum of 1.0 kg of poppy seeds had to be charged into the annulus to ensure that
each air injector was equally and sufficiently covered with bed material before the
start of the experiments.
Three experiments were conducted using the poppy seeds: the poppy seed loading
was increased from 1.0 kg to 2.0 kg in 0.5 kg increments. For each poppy seed
loading charged into the annulus, the bed expansion was measured optically as the
superficial gas velocity was gradually increased (Figure 4-10). Only the single 1.75 kW
double-stage side-channel blower was connected to the Perspex setup, as with the
results illustrated in Figure 4-6. The bed height and superficial gas velocity at
minimum fluidization for each poppy seed loading is summarized in Table 4-4.
Figure 4-10: Comparison of bed expansion of poppy seeds from static bed height as a function of superficial gas velocity
In comparison with the results illustrated in Figure 4-6, at the same superficial gas
velocity in the annulus the superficial gas velocity per injector in Figure 4-10 is
0 5 10 15 20 25 30 35 40
0
5
10
15
20
25
30
0 0.05 0.1 0.15 0.2 0.25 0.3 0.35 0.4 0.45 0.5
Superficial gas velocity per injector (m/s)
Bed
exp
ansi
on
fro
m s
tati
c b
ed h
eigh
t (%
)
Superficial gas velocity in annulus (m/s)
1.0 kg poppy seed loading
1.5 kg poppy seed loading
2.0 kg poppy seed loading
© University of Pretoria
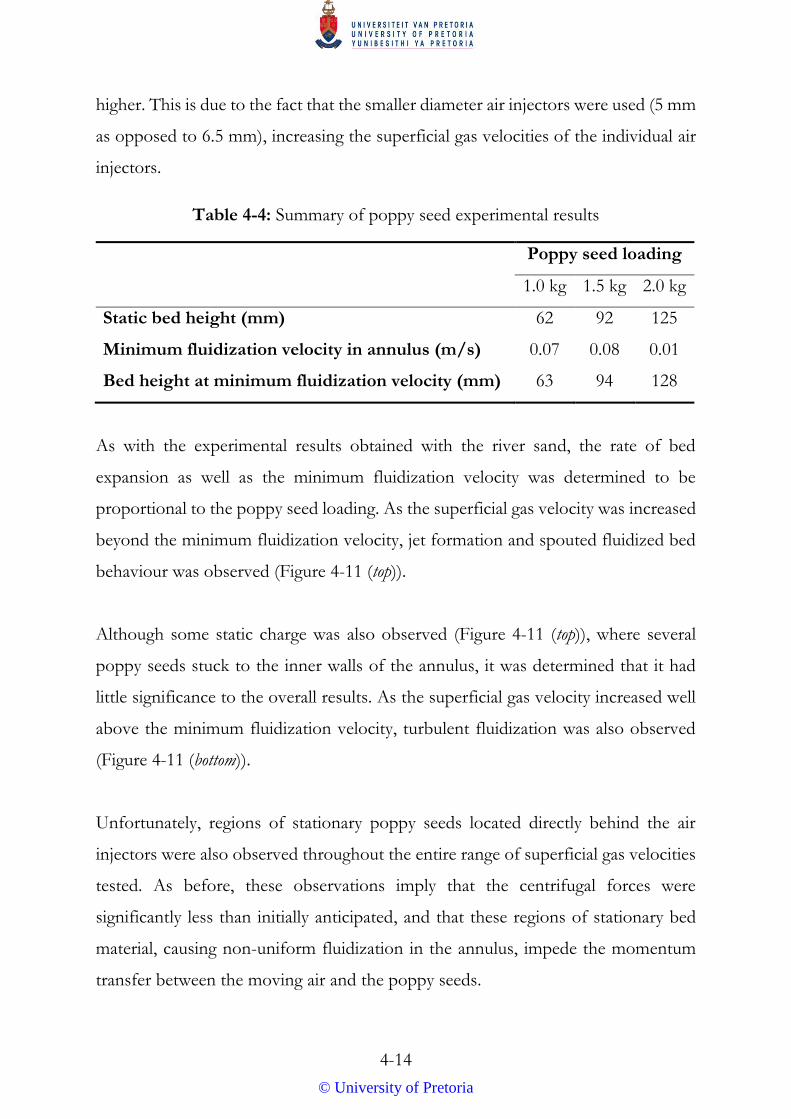
4-14
higher. This is due to the fact that the smaller diameter air injectors were used (5 mm
as opposed to 6.5 mm), increasing the superficial gas velocities of the individual air
injectors.
Table 4-4: Summary of poppy seed experimental results
Poppy seed loading
1.0 kg 1.5 kg 2.0 kg
Static bed height (mm) 62 92 125
Minimum fluidization velocity in annulus (m/s) 0.07 0.08 0.01
Bed height at minimum fluidization velocity (mm) 63 94 128
As with the experimental results obtained with the river sand, the rate of bed
expansion as well as the minimum fluidization velocity was determined to be
proportional to the poppy seed loading. As the superficial gas velocity was increased
beyond the minimum fluidization velocity, jet formation and spouted fluidized bed
behaviour was observed (Figure 4-11 (top)).
Although some static charge was also observed (Figure 4-11 (top)), where several
poppy seeds stuck to the inner walls of the annulus, it was determined that it had
little significance to the overall results. As the superficial gas velocity increased well
above the minimum fluidization velocity, turbulent fluidization was also observed
(Figure 4-11 (bottom)).
Unfortunately, regions of stationary poppy seeds located directly behind the air
injectors were also observed throughout the entire range of superficial gas velocities
tested. As before, these observations imply that the centrifugal forces were
significantly less than initially anticipated, and that these regions of stationary bed
material, causing non-uniform fluidization in the annulus, impede the momentum
transfer between the moving air and the poppy seeds.
© University of Pretoria
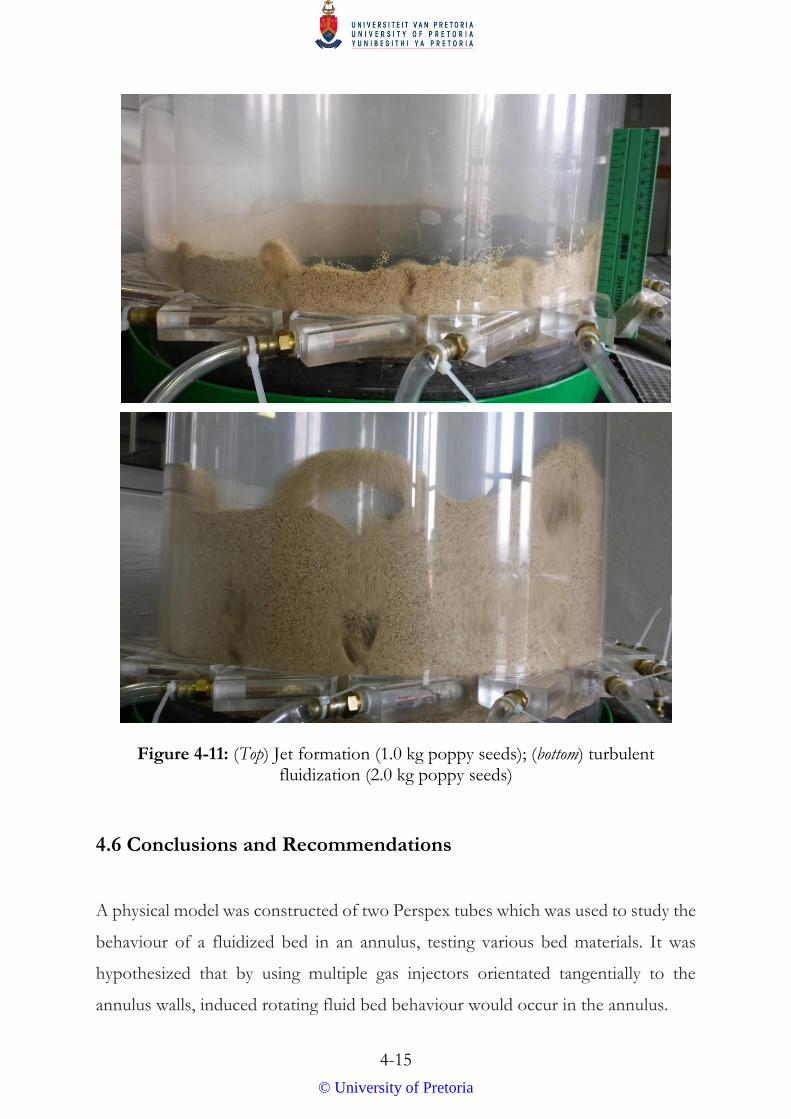
4-15
Figure 4-11: (Top) Jet formation (1.0 kg poppy seeds); (bottom) turbulent fluidization (2.0 kg poppy seeds)
4.6 Conclusions and Recommendations
A physical model was constructed of two Perspex tubes which was used to study the
behaviour of a fluidized bed in an annulus, testing various bed materials. It was
hypothesized that by using multiple gas injectors orientated tangentially to the
annulus walls, induced rotating fluid bed behaviour would occur in the annulus.
© University of Pretoria
4-16
Unfortunately, even after a reduction in the air injector diameter and with the
addition of a second blower, induced rotating fluid bed behaviour was not observed
throughout the entire range of superficial gas velocities tested. Instead, as the
superficial gas velocity increased beyond minimum fluidization, the formation of jets
and spouted fluidized bed behaviour was observed, followed by turbulent
fluidization. In experiments conducted with river sand and poppy seeds, it was found
that with increasing superficial gas velocity, the rate of bed expansion was
proportional to the bed material loading. Furthermore, the minimum fluidization
velocity was also found to be proportional to the bed material loading. Regions of
stationary bed material located directly behind the air injectors were also observed
to be present for all materials tested.
Based on the above-mentioned observations, it was concluded that the centrifugal
forces were significantly less than initially anticipated. Furthermore, it was concluded
that the regions of stationary bed material cause non-uniform fluidization in the
annulus. These regions impede the momentum transfer between the moving air and
the bed material, preventing the possibility of any bed material rotation.
The consequence of these observations and the above-mentioned conclusions is that
the design concept of using multiple air injectors orientated tangentially to the walls
of the annular pyrolysis chamber will have to be modified to achieve uniform
fluidization in the annulus. Should such a design be used in the new fluidized bed
fast pyrolyser, multiple feed inlets would have to be located in close proximity to the
gas injectors in order to ensure complete mixing and ensure sufficient time for
reactions.
It is therefore recommended that a completely different air distributing system be
designed for the annulus in order to overcome the difficulties experienced with the
multiple tangential air injectors. Fixed angled blades, similar to the gas distributor
© University of Pretoria

4-17
used in the TORBED reactor, is a promising design which is able to produce a
swirling fluidized bed. Alternatively, a porous plate-type air distributor could be
considered, which may possibly induce the desired rotating fluid bed behaviour by
ensuring complete uniform fluidization in the annulus.
It is also recommended that a more detailed study, such as a dimensional analysis,
should be performed in order to determine why these regions of stationary bed
material occur and what impedes the momentum transfer. Ideally, after performing
such an analysis, the parameters that have to be met in order to induce a rotating
fluid bed behaviour in an annular fluidized bed could be established. Such
information will be particularly useful in the event that the annular fluidized bed is
scaled up.
© University of Pretoria
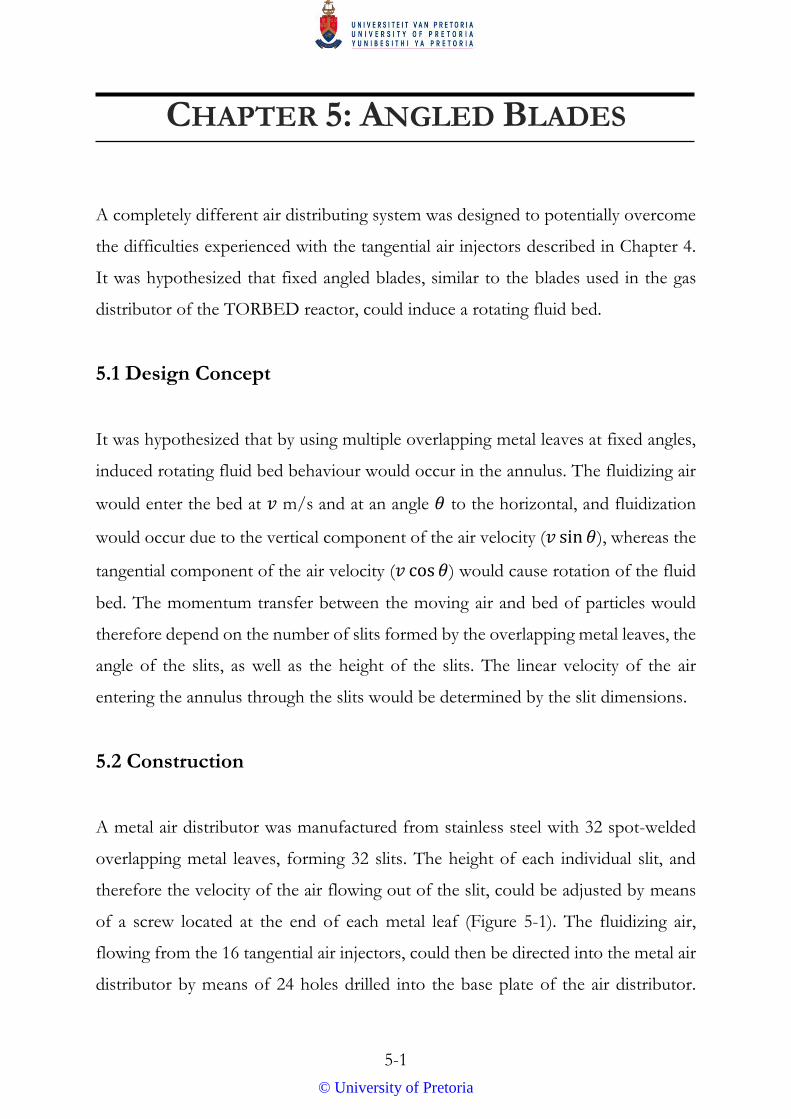
5-1
CHAPTER 5: ANGLED BLADES
A completely different air distributing system was designed to potentially overcome
the difficulties experienced with the tangential air injectors described in Chapter 4.
It was hypothesized that fixed angled blades, similar to the blades used in the gas
distributor of the TORBED reactor, could induce a rotating fluid bed.
5.1 Design Concept
It was hypothesized that by using multiple overlapping metal leaves at fixed angles,
induced rotating fluid bed behaviour would occur in the annulus. The fluidizing air
would enter the bed at 𝑣 m/s and at an angle 𝜃 to the horizontal, and fluidization
would occur due to the vertical component of the air velocity (𝑣 sin 𝜃), whereas the
tangential component of the air velocity (𝑣 cos 𝜃) would cause rotation of the fluid
bed. The momentum transfer between the moving air and bed of particles would
therefore depend on the number of slits formed by the overlapping metal leaves, the
angle of the slits, as well as the height of the slits. The linear velocity of the air
entering the annulus through the slits would be determined by the slit dimensions.
5.2 Construction
A metal air distributor was manufactured from stainless steel with 32 spot-welded
overlapping metal leaves, forming 32 slits. The height of each individual slit, and
therefore the velocity of the air flowing out of the slit, could be adjusted by means
of a screw located at the end of each metal leaf (Figure 5-1). The fluidizing air,
flowing from the 16 tangential air injectors, could then be directed into the metal air
distributor by means of 24 holes drilled into the base plate of the air distributor.
© University of Pretoria
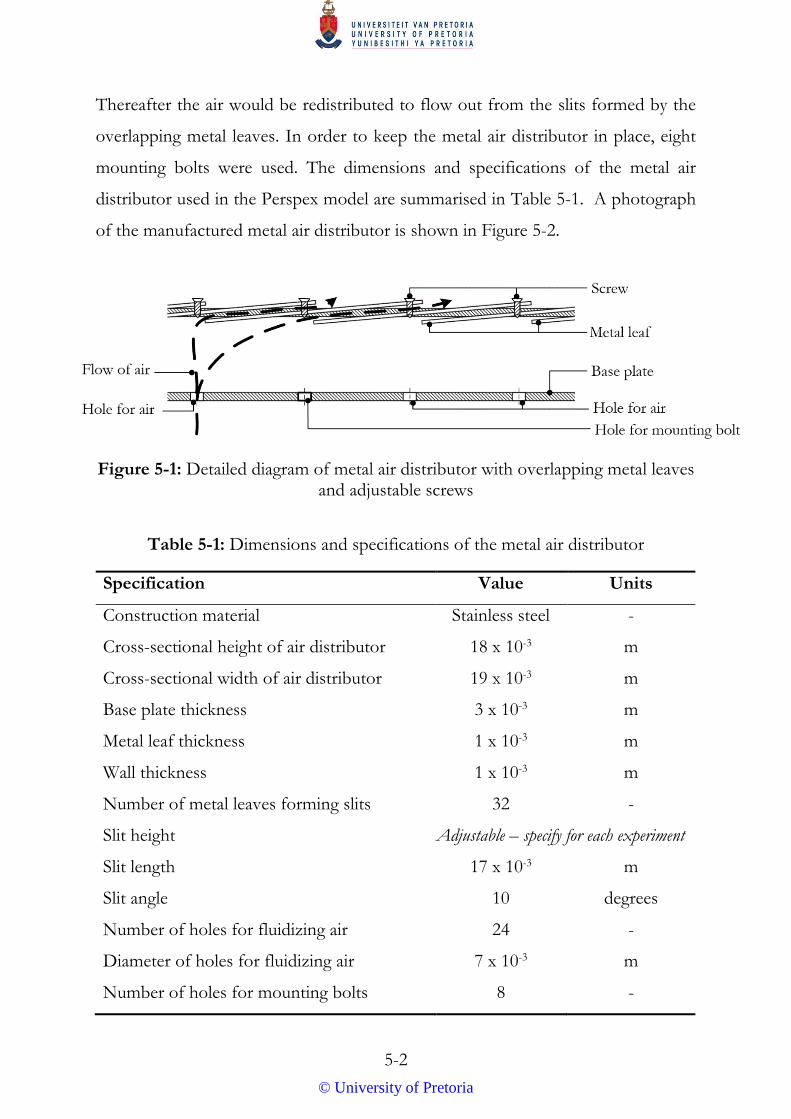
5-2
Thereafter the air would be redistributed to flow out from the slits formed by the
overlapping metal leaves. In order to keep the metal air distributor in place, eight
mounting bolts were used. The dimensions and specifications of the metal air
distributor used in the Perspex model are summarised in Table 5-1. A photograph
of the manufactured metal air distributor is shown in Figure 5-2.
Figure 5-1: Detailed diagram of metal air distributor with overlapping metal leaves and adjustable screws
Table 5-1: Dimensions and specifications of the metal air distributor
Specification Value Units
Construction material Stainless steel -
Cross-sectional height of air distributor 18 x 10-3 m
Cross-sectional width of air distributor 19 x 10-3 m
Base plate thickness 3 x 10⁻³ m
Metal leaf thickness 1 x 10⁻³ m
Wall thickness 1 x 10⁻³ m
Number of metal leaves forming slits 32 -
Slit height Adjustable – specify for each experiment
Slit length 17 x 10-3 m
Slit angle 10 degrees
Number of holes for fluidizing air 24 -
Diameter of holes for fluidizing air 7 x 10⁻³ m
Number of holes for mounting bolts 8 -
© University of Pretoria
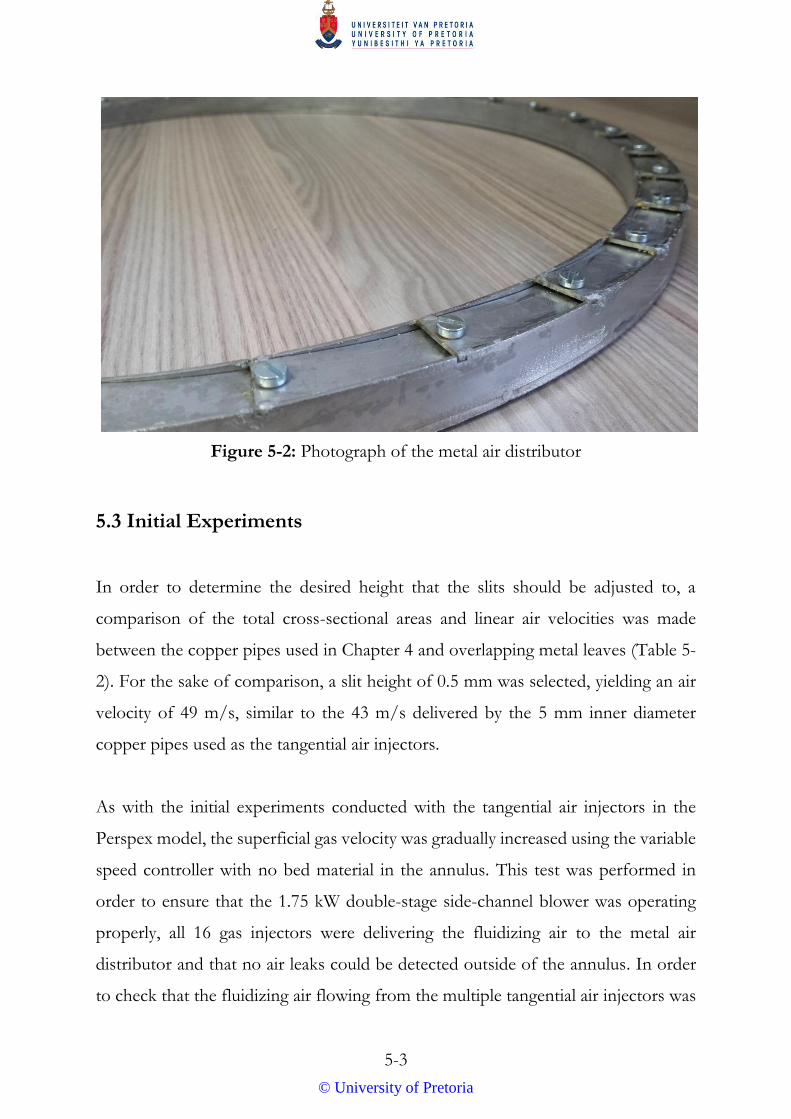
5-3
Figure 5-2: Photograph of the metal air distributor
5.3 Initial Experiments
In order to determine the desired height that the slits should be adjusted to, a
comparison of the total cross-sectional areas and linear air velocities was made
between the copper pipes used in Chapter 4 and overlapping metal leaves (Table 5-
2). For the sake of comparison, a slit height of 0.5 mm was selected, yielding an air
velocity of 49 m/s, similar to the 43 m/s delivered by the 5 mm inner diameter
copper pipes used as the tangential air injectors.
As with the initial experiments conducted with the tangential air injectors in the
Perspex model, the superficial gas velocity was gradually increased using the variable
speed controller with no bed material in the annulus. This test was performed in
order to ensure that the 1.75 kW double-stage side-channel blower was operating
properly, all 16 gas injectors were delivering the fluidizing air to the metal air
distributor and that no air leaks could be detected outside of the annulus. In order
to check that the fluidizing air flowing from the multiple tangential air injectors was
© University of Pretoria
5-4
indeed directed into the holes drilled into the base plate and out from the slits of the
metal air distributor, 0.5 kg of mustard seeds were loaded into the annulus. Mustard
seeds were selected as the preferred material for this test as the particle size of the
individual seeds was significantly greater than the slit height of 0.5 mm, which
guaranteed that no seeds could obstruct the slits and possibly impede the flow of air.
Table 5-2: Comparison of cross-sectional areas using various air injectors at a constant superficial gas velocity of 0.5 m/s in the annulus
Cross-sectional
area per
injector/leaf (m2)
Total cross-
sectional area
(m2)
Injector/leaf
air velocity
(m/s)
16 copper pipes
Inner diameter of 6.5 mm 3.32 x 10⁻⁵ 5.31 x 10⁻⁴ 25
Inner diameter of 5 mm 1.96 x 10⁻⁵ 3.14 x 10⁻⁴ 43
32 overlapping metal leaves
Slit height of 2 mm 3.4 x 10⁻⁵ 1.09 x 10⁻³ 12
Slit height of 1 mm 1.7 x 10⁻⁵ 5.44 x 10⁻⁴ 25
Slit height of 0.5 mm 8.5 x 10⁻⁶ 2.72 x 10⁻⁴ 49
Slit height of 0.3 mm 5.1 x10⁻⁶ 1.63 x 10⁻⁴ 82
Slit height of 0.1 mm 1.7 x 10⁻⁶ 5.44 x 10⁻⁵ 246
Due to the fact that the two Perspex tubes were not completely concentric, seepage
of the fluidizing air along the inner walls of the annulus, as opposed to the air flowing
through the overlapping metal leaves, was observed (Figure 5-3). In addition, since
the overlapping metal leaves were not welded to the walls of the metal air distributor,
poor fluidization was anticipated for future experiments. In order to overcome these
problems, all the gaps from which the fluidizing air could escape were sealed with
latex gum, and the outer walls of the metal air distributor were ground down to a
smooth finish and lined with tape to ensure an airtight fit in the annulus.
© University of Pretoria
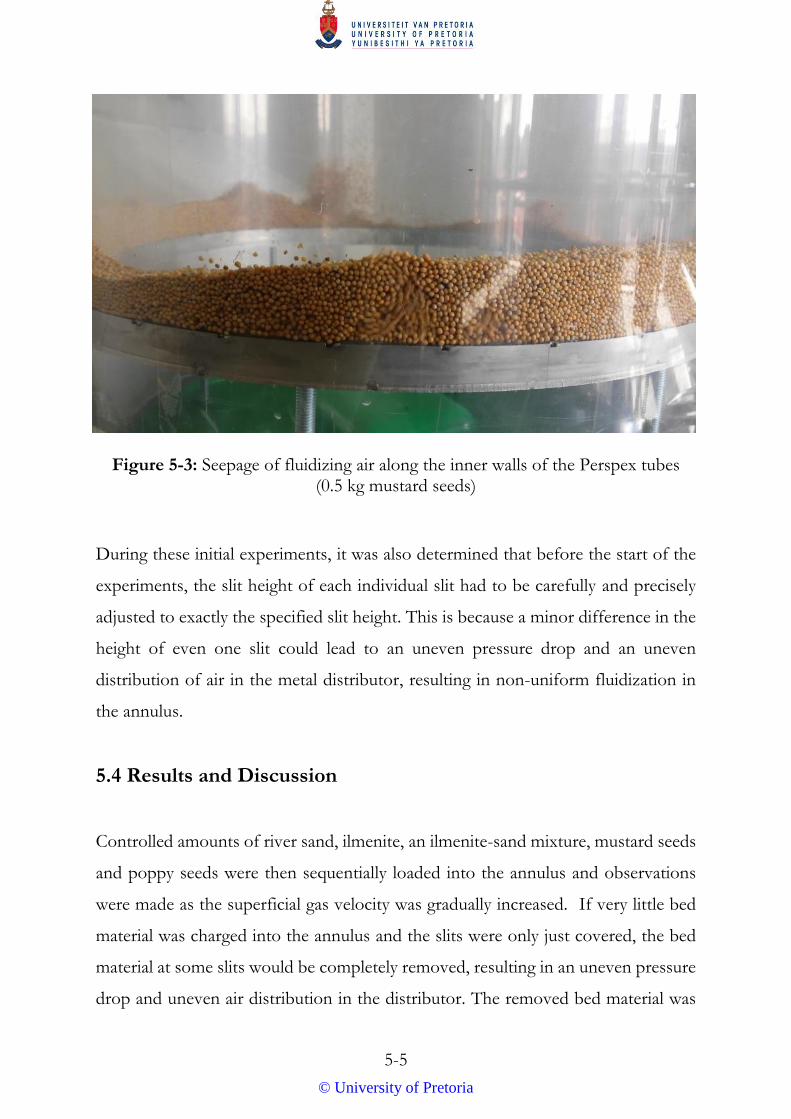
5-5
Figure 5-3: Seepage of fluidizing air along the inner walls of the Perspex tubes
(0.5 kg mustard seeds)
During these initial experiments, it was also determined that before the start of the
experiments, the slit height of each individual slit had to be carefully and precisely
adjusted to exactly the specified slit height. This is because a minor difference in the
height of even one slit could lead to an uneven pressure drop and an uneven
distribution of air in the metal distributor, resulting in non-uniform fluidization in
the annulus.
5.4 Results and Discussion
Controlled amounts of river sand, ilmenite, an ilmenite-sand mixture, mustard seeds
and poppy seeds were then sequentially loaded into the annulus and observations
were made as the superficial gas velocity was gradually increased. If very little bed
material was charged into the annulus and the slits were only just covered, the bed
material at some slits would be completely removed, resulting in an uneven pressure
drop and uneven air distribution in the distributor. The removed bed material was
© University of Pretoria
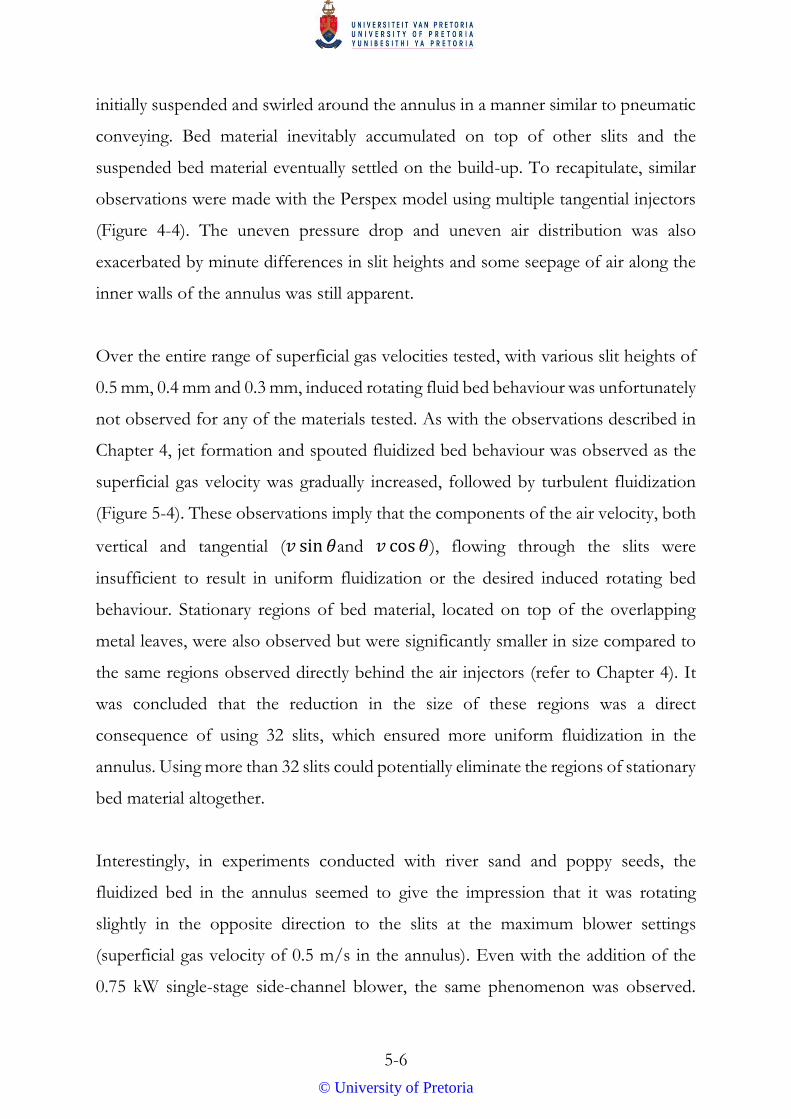
5-6
initially suspended and swirled around the annulus in a manner similar to pneumatic
conveying. Bed material inevitably accumulated on top of other slits and the
suspended bed material eventually settled on the build-up. To recapitulate, similar
observations were made with the Perspex model using multiple tangential injectors
(Figure 4-4). The uneven pressure drop and uneven air distribution was also
exacerbated by minute differences in slit heights and some seepage of air along the
inner walls of the annulus was still apparent.
Over the entire range of superficial gas velocities tested, with various slit heights of
0.5 mm, 0.4 mm and 0.3 mm, induced rotating fluid bed behaviour was unfortunately
not observed for any of the materials tested. As with the observations described in
Chapter 4, jet formation and spouted fluidized bed behaviour was observed as the
superficial gas velocity was gradually increased, followed by turbulent fluidization
(Figure 5-4). These observations imply that the components of the air velocity, both
vertical and tangential (𝑣 sin 𝜃and 𝑣 cos 𝜃), flowing through the slits were
insufficient to result in uniform fluidization or the desired induced rotating bed
behaviour. Stationary regions of bed material, located on top of the overlapping
metal leaves, were also observed but were significantly smaller in size compared to
the same regions observed directly behind the air injectors (refer to Chapter 4). It
was concluded that the reduction in the size of these regions was a direct
consequence of using 32 slits, which ensured more uniform fluidization in the
annulus. Using more than 32 slits could potentially eliminate the regions of stationary
bed material altogether.
Interestingly, in experiments conducted with river sand and poppy seeds, the
fluidized bed in the annulus seemed to give the impression that it was rotating
slightly in the opposite direction to the slits at the maximum blower settings
(superficial gas velocity of 0.5 m/s in the annulus). Even with the addition of the
0.75 kW single-stage side-channel blower, the same phenomenon was observed.
© University of Pretoria
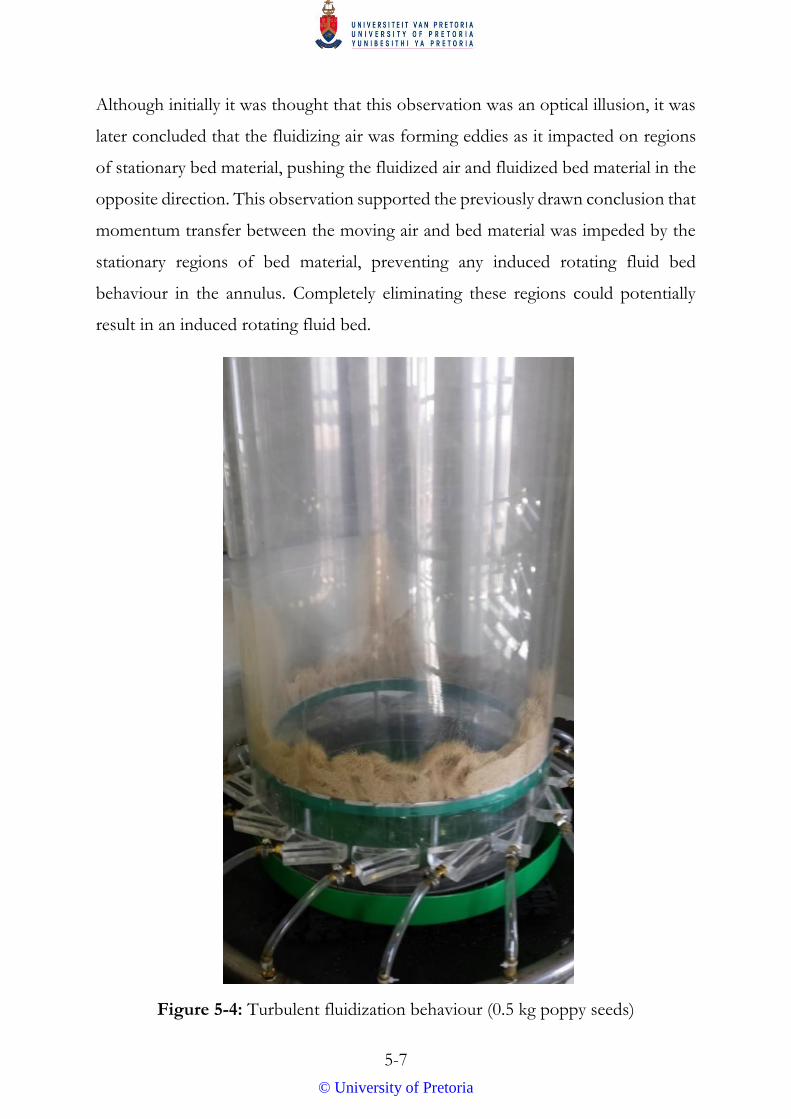
5-7
Although initially it was thought that this observation was an optical illusion, it was
later concluded that the fluidizing air was forming eddies as it impacted on regions
of stationary bed material, pushing the fluidized air and fluidized bed material in the
opposite direction. This observation supported the previously drawn conclusion that
momentum transfer between the moving air and bed material was impeded by the
stationary regions of bed material, preventing any induced rotating fluid bed
behaviour in the annulus. Completely eliminating these regions could potentially
result in an induced rotating fluid bed.
Figure 5-4: Turbulent fluidization behaviour (0.5 kg poppy seeds)
© University of Pretoria
5-8
5.5 Alterations
In order to overcome the problems discussed in the previous section, and in order
to achieve the desired induced rotating fluid bed behaviour in the annulus, several
alterations were considered, namely:
Manufacturing a more airtight air distributor;
Increasing the number of slits to achieve uniform fluidization;
Considering a porous plate-type air distributor; and
Conducting a dimensional analysis to determine the parameters that should
be met in order to induce rotating fluid bed behaviour in the annulus.
5.5.1 Increasing the Number of Slits
The regions of stationary bed material located on top of the overlapping leaves could
potentially be completely eliminated by using more slits (>32 slits). With the addition
of more slits, the floor of the annulus would be more uniformly fluidized, possibly
resulting in induced rotating fluid bed behaviour. It was hypothesized that doubling
the number of slits from 32 to 64 would suffice as the additional slits would be
located at the centre of the regions of stationary bed material. However, as the
overlapping metal leaves in the metal air distributor had been spot-welded into
position, a new air distributor would have had to be designed and manufactured.
That being said, a metal air distributor with 64 height-adjustable overlapping metal
leaves was deemed physically unrealisable to manufacture from stainless steel due to
the difficulty of achieving the close tolerances required to ensure an airtight fit in the
annulus and the necessity to adjust precise slit heights.
For the above-mentioned reasons, it was decided that the new air distributor should
be 3-dimensionally printed using polylactic acid (PLA). Although the 3D printed air
distributor would not have height-adjustable slits, it was anticipated that the accuracy
© University of Pretoria
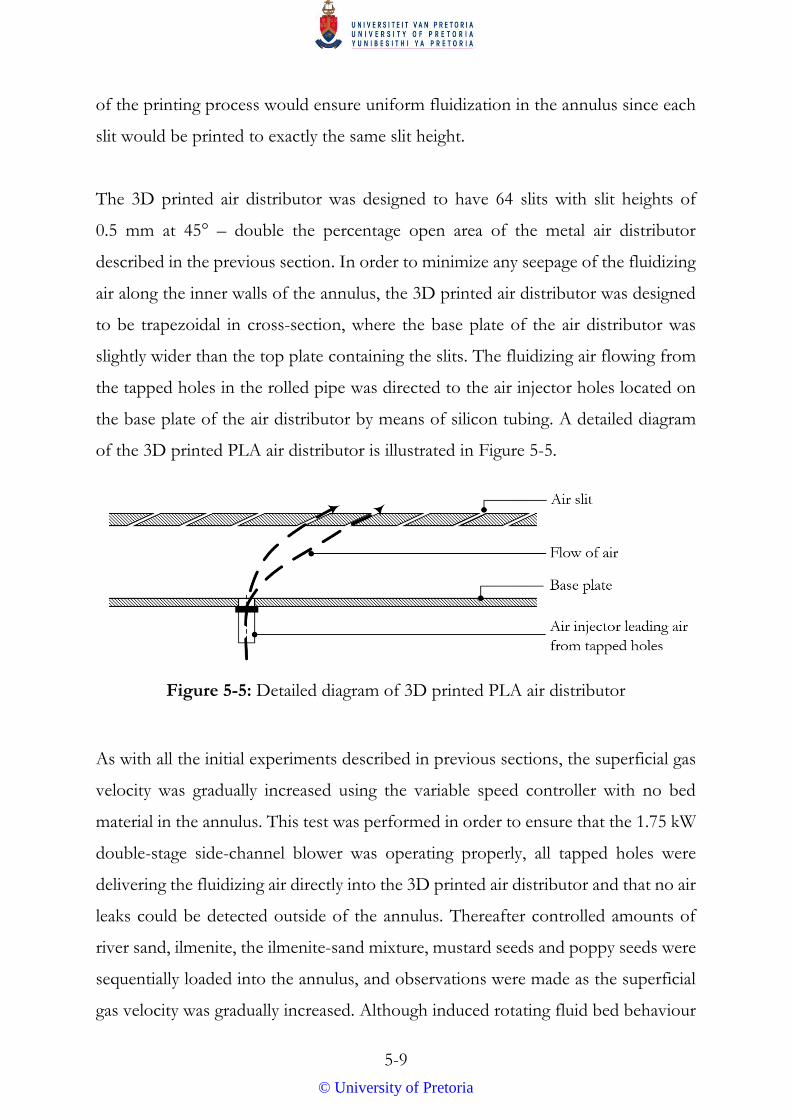
5-9
of the printing process would ensure uniform fluidization in the annulus since each
slit would be printed to exactly the same slit height.
The 3D printed air distributor was designed to have 64 slits with slit heights of
0.5 mm at 45° – double the percentage open area of the metal air distributor
described in the previous section. In order to minimize any seepage of the fluidizing
air along the inner walls of the annulus, the 3D printed air distributor was designed
to be trapezoidal in cross-section, where the base plate of the air distributor was
slightly wider than the top plate containing the slits. The fluidizing air flowing from
the tapped holes in the rolled pipe was directed to the air injector holes located on
the base plate of the air distributor by means of silicon tubing. A detailed diagram
of the 3D printed PLA air distributor is illustrated in Figure 5-5.
Figure 5-5: Detailed diagram of 3D printed PLA air distributor
As with all the initial experiments described in previous sections, the superficial gas
velocity was gradually increased using the variable speed controller with no bed
material in the annulus. This test was performed in order to ensure that the 1.75 kW
double-stage side-channel blower was operating properly, all tapped holes were
delivering the fluidizing air directly into the 3D printed air distributor and that no air
leaks could be detected outside of the annulus. Thereafter controlled amounts of
river sand, ilmenite, the ilmenite-sand mixture, mustard seeds and poppy seeds were
sequentially loaded into the annulus, and observations were made as the superficial
gas velocity was gradually increased. Although induced rotating fluid bed behaviour
© University of Pretoria
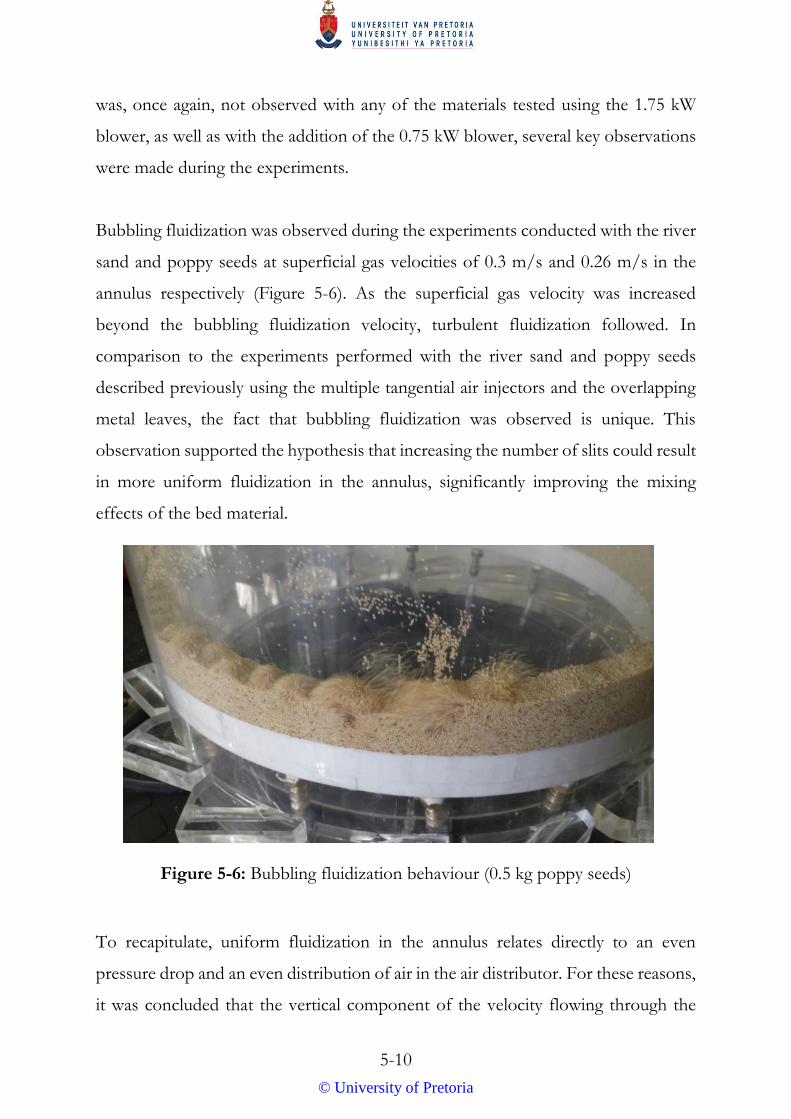
5-10
was, once again, not observed with any of the materials tested using the 1.75 kW
blower, as well as with the addition of the 0.75 kW blower, several key observations
were made during the experiments.
Bubbling fluidization was observed during the experiments conducted with the river
sand and poppy seeds at superficial gas velocities of 0.3 m/s and 0.26 m/s in the
annulus respectively (Figure 5-6). As the superficial gas velocity was increased
beyond the bubbling fluidization velocity, turbulent fluidization followed. In
comparison to the experiments performed with the river sand and poppy seeds
described previously using the multiple tangential air injectors and the overlapping
metal leaves, the fact that bubbling fluidization was observed is unique. This
observation supported the hypothesis that increasing the number of slits could result
in more uniform fluidization in the annulus, significantly improving the mixing
effects of the bed material.
Figure 5-6: Bubbling fluidization behaviour (0.5 kg poppy seeds)
To recapitulate, uniform fluidization in the annulus relates directly to an even
pressure drop and an even distribution of air in the air distributor. For these reasons,
it was concluded that the vertical component of the velocity flowing through the
© University of Pretoria
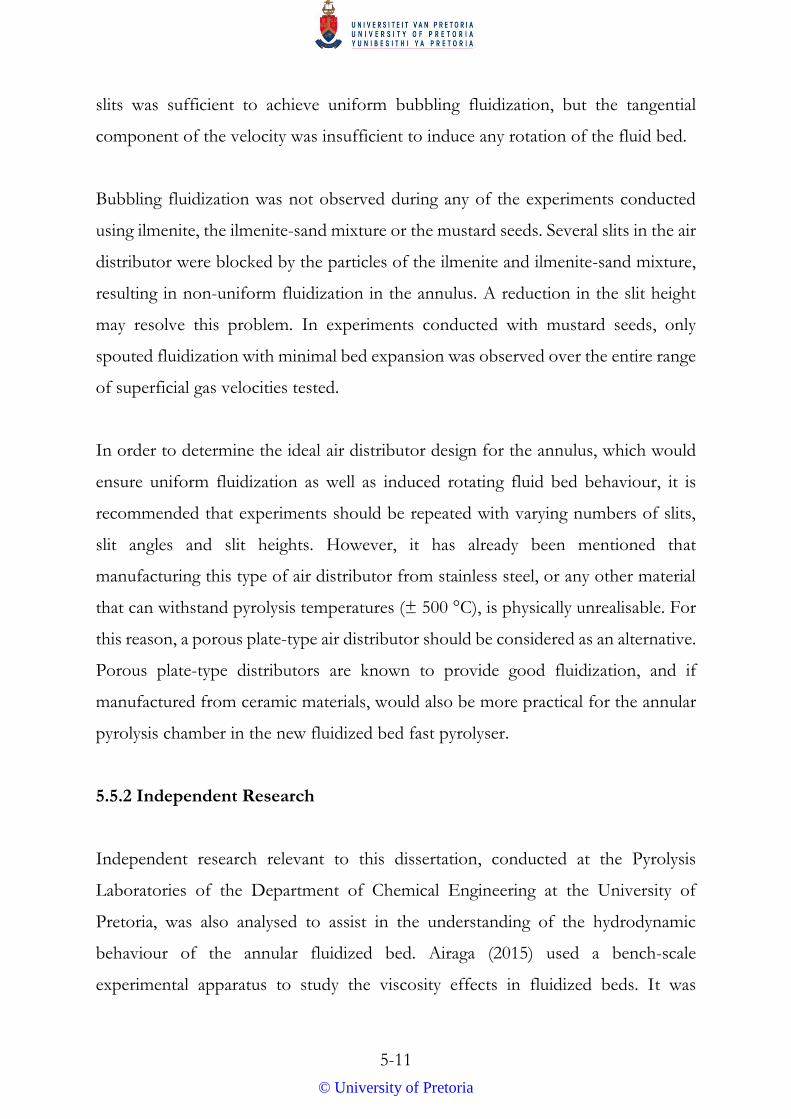
5-11
slits was sufficient to achieve uniform bubbling fluidization, but the tangential
component of the velocity was insufficient to induce any rotation of the fluid bed.
Bubbling fluidization was not observed during any of the experiments conducted
using ilmenite, the ilmenite-sand mixture or the mustard seeds. Several slits in the air
distributor were blocked by the particles of the ilmenite and ilmenite-sand mixture,
resulting in non-uniform fluidization in the annulus. A reduction in the slit height
may resolve this problem. In experiments conducted with mustard seeds, only
spouted fluidization with minimal bed expansion was observed over the entire range
of superficial gas velocities tested.
In order to determine the ideal air distributor design for the annulus, which would
ensure uniform fluidization as well as induced rotating fluid bed behaviour, it is
recommended that experiments should be repeated with varying numbers of slits,
slit angles and slit heights. However, it has already been mentioned that
manufacturing this type of air distributor from stainless steel, or any other material
that can withstand pyrolysis temperatures (± 500 °C), is physically unrealisable. For
this reason, a porous plate-type air distributor should be considered as an alternative.
Porous plate-type distributors are known to provide good fluidization, and if
manufactured from ceramic materials, would also be more practical for the annular
pyrolysis chamber in the new fluidized bed fast pyrolyser.
5.5.2 Independent Research
Independent research relevant to this dissertation, conducted at the Pyrolysis
Laboratories of the Department of Chemical Engineering at the University of
Pretoria, was also analysed to assist in the understanding of the hydrodynamic
behaviour of the annular fluidized bed. Airaga (2015) used a bench-scale
experimental apparatus to study the viscosity effects in fluidized beds. It was
© University of Pretoria
5-12
demonstrated that the viscosity of the bed material in a fluidized bed decreased as
the superficial gas velocity increased (Airaga, 2015). In addition, Airaga (2015) also
demonstrated that the viscosity of the bed material remained constant at superficial
gas velocities above 0.7 m/s, as illustrated in Figure 5-7.
Figure 5-7: Viscosity for various bed materials as a function of superficial gas velocity (adapted from Airaga, 2015)
It can therefore be concluded from Figure 5-7 that the viscosity of the bed material
and the superficial gas velocity and are inversely proportional up until 0.7 m/s. Since
the viscosity of any material relates to the resistance to flow and/or movement, the
results in Figure 5-7 indicate that at low superficial gas velocities, the resistance to
flow and/or movement of the bed material is high. Conversely, the resistance to
flow and/or movement of the bed material is low at high superficial gas velocities.
These results are justified because as increasing amounts of fluidizing gas percolate
through the void spaces between the particles of the bed material, the bulk density
of the bed decreases, which in turn reduces the resistance to flow and/or movement.
Relating the above-mentioned results to the research presented in this dissertation,
it can be concluded that the regions of stationary bed material previously described
had a high viscosity and therefore a high resistance to flow and/or movement. These
regions of high viscosity forced the moving air vertically upwards, where the
0
2
4
6
8
10
12
0 0.2 0.4 0.6 0.8 1
Vis
cosi
ty (
kg/
m∙s
)
Superficial gas velocity (m/s)
Ilmenite
Mustard seeds
Poppy seeds
© University of Pretoria
5-13
viscosity was low, resulting in the formation of jets and spouted fluidized bed
behaviour. It was therefore concluded that uniformly fluidizing the bed material in
the annulus will ensure the same viscosity throughout the bed material with minimal
resistance to flow and/or movement.
It is therefore recommended that since high superficial gas velocities are required
for all the bed material to reach a minimum viscosity, a more powerful blower, able
to reach higher than 0.7 m/s in the annulus, should be tested as it may result in an
induced rotating fluid bed. It is then also recommended that a study should be
performed in order to check whether sufficient contact time is available for the
pyrolysis reactions to occur at such high superficial gas velocities. If not, the design
concept of an induced rotating fluid bed in the annular pyrolysis chamber of the new
fluidized bed fast pyrolyser could be impractical. In such an event, a rotating gas
distributor plate should be considered instead.
5.5.3 Dimensional Analysis
In order to determine the parameters that should be met in order to induce a rotating
fluid bed in the annulus, a dimensional analysis was performed using Microsoft
Excel®. Based on the fact that the slit-type air distributor described in this chapter
presented the most promising results, sensitivity studies were performed on designs
of this type of air distributor.
In order to determine what other air distributor configurations could result in
uniform fluidization, a sensitivity study was performed where the dimensions of the
slits, or alternatively holes, in the floor of the air distributor varied. Since uniform
fluidization was observed with the 3D printed air distributor, which had slit widths
of 13 mm and slit heights of 0.5 mm, the percentage open area of this air distributor
design of 1.6% was chosen as the basis. Theoretically, a percentage open area of
© University of Pretoria

5-14
1.6% can be achieved using a variety of configurations, which are illustrated in
Table 5-3.
Table 5-3: Comparison of slit and hole dimensions and numbers to achieve a percentage open area of at least 1.6%
Rectangular slits widths of 13 mm in a slit-type air distributor
Slit height Slit area Number of slits
0.1 mm 1.3 mm2 321
0.2 mm 2.6 mm2 160
0.3 mm 3.9 mm2 107
0.4 mm 5.2 mm2 80
0.5 mm 6.5 mm2 64
0.6 mm 7.8 mm2 53
0.7 mm 9.1 mm2 46
0.8 mm 10.4 mm2 40
0.9 mm 11.7 mm2 36
1.0 mm 13 mm2 32
Circular holes in a porous plate-type air distributor
Hole diameter Hole area Number of holes
0.1 mm 0.00785 mm2 53 115
0.2 mm 0.0314 mm2 13 279
0.3 mm 0.07065 mm2 5 902
0.4 mm 0.1256 mm2 3 320
0.5 mm 0.19625 mm2 2 125
0.6 mm 0.2826 mm2 1 475
0.7 mm 0.38465 mm2 1 084
0.8 mm 0.5024 mm2 830
0.9 mm 0.63585 mm2 656
1.0 mm 0.785 mm2 531
© University of Pretoria
5-15
Based on the results in Table 5-3, it is evident that with smaller slit heights and
smaller hole diameters, the number of slits and holes required to achieve the
minimum percentage open area increases. Although a percentage free area of 1.6%
for all rectangular slits and circular holes in Table 5-3 is attained, the rectangular slits
with slit heights larger than 0.6 mm are not recommended for future air distributor
designs because of the possibility of regions of stationary bed material. Conversely,
very small slit heights and hole diameters are also not recommended as
manufacturing these types of air distributors for the annular pyrolysis chamber could
be problematic. As previously mentioned, manufacturing a slit-type air distributor
from stainless steel, or any other material that can withstand pyrolysis temperatures
(± 500 °C), is physically unrealisable. Therefore it is recommended that future
experiments should rather test porous plate-type air distributors with varying
numbers of holes, hole angles and hole diameters.
A second sensitivity study investigated the effect of the slit angle on the superficial
gas velocity required for uniform fluidization in the annulus. It was previously
concluded that the vertical component of the velocity flowing through the slits of
the 3D printed air distributor was sufficient to achieve uniform fluidization in
experiments conducted using river sand and poppy seeds. At a superficial gas
velocity of 0.3 m/s in the annulus, the velocity of the fluidizing air flowing out of
each slit was calculated to be approximately 19 m/s, and at a slit angle of 45°, the
vertical and tangential components were calculated to both be 13.5 m/s. Based on
the assumption that uniform fluidization can be achieved if the vertical component
of the fluidizing air flowing out of each slit is at least 13.5 m/s, a comparison of the
minimum superficial gas velocity required to achieve uniform fluidization in the
annulus as a function of the slit angle was made (Figure 5-8).
As the slit angle reduces from 90° (perpendicular to the horizontal) to 0° (parallel to
the horizontal), the superficial gas velocity in the annulus required to achieve
© University of Pretoria

5-16
uniform bubbling fluidization increases exponentially. In addition, since the vertical
component of the velocity flowing out of the slit is constant at 13.5 m/s, the
tangential component of the velocity flowing out of each slit also increases
exponentially as the slit angle approaches 0°.
Figure 5-8: Superficial gas velocity in annulus required to achieve uniform bubbling fluidization as a function of the slit angle (slit dimensions: 13 mm x
0.5 mm, 64 slits)
It was now hypothesized that once uniform fluidization is achieved, induced rotating
fluid bed behaviour is likely to occur with sufficient fluidizing air flowing in the
tangential direction since the bed material experiences little resistance to flow and/or
movement. In order to test this hypothesis, it is recommended that future
experiments should be conducted using slit (or hole) angles below 45° and with
blowers able to achieve higher superficial gas velocities in the annulus (>1 m/s).
However, it has already been mentioned that in such an event, it is then also
recommended that a study should be performed in order to check whether sufficient
contact time is available for the pyrolysis reactions to occur at such high superficial
gas velocities. If not, the design concept of an induced rotating fluid bed in the
0
20
40
60
80
100
120
140
160
180
0
0.5
1
1.5
2
2.5
3
0 10 20 30 40 50 60 70 80 90
Sup
erfi
cial
gas
vel
oci
ty p
er s
lit(
m/s)
Sup
erfi
cial
gas
vel
oci
ty in
an
nulu
s (m
/s)
Slit angle (degrees)
© University of Pretoria
5-17
annular pyrolysis chamber of the new fluidized bed fast pyrolyser could be
impractical. In such an event, a rotating gas distributor plate should be considered
instead.
5.6 Conclusions and Recommendations
A completely different air distributing system was designed to potentially overcome
the difficulties experienced with the multiple tangential air injectors described in
Chapter 4. It was hypothesized that fixed angled blades, similar to the blades used in
the gas distributor of the TORBED reactor, could induce rotating fluid bed
behaviour.
A metal air distributor was designed and manufactured from stainless steel to have
32 overlapping metal leaves. The height of each individual slit could be adjusted by
means of a screw located at the end of each metal leaf. Unfortunately, over the entire
range of superficial gas velocities tested and with various slit heights, induced
rotating fluid bed behaviour was not observed for any of the bed materials tested.
As with the observations described in Chapter 4, jet formation and spouted fluidized
bed behaviour was observed as the superficial gas velocity was gradually increased,
followed by turbulent fluidization. Stationary regions of bed material, located on top
of the overlapping metal leaves, were also observed but were significantly smaller in
size compared to the regions observed directly behind the tangential air injectors.
Based on these observations, it was concluded that the vertical and tangential
components (𝑣 𝑠𝑖𝑛𝜃 and 𝑣 𝑐𝑜𝑠𝜃) of the air velocity flowing through the
overlapping metal leaves were insufficient to result in uniform fluidization or the
desired induced rotating bed behaviour.
In order to overcome the problems experienced with the metal air distributor, a new
3D printed air distributor was designed and manufactured from polylactic acid
© University of Pretoria
5-18
(PLA). The 3D printed air distributor was designed to have 64 slits with fixed slit
heights of 0.5 mm at 45° angles. Although induced rotating fluid bed behaviour was
once again not observed with any of the materials at any of the superficial gas
velocities tested, uniform bubbling fluidization was observed during experiments
conducted using river sand and poppy seeds. This observation indicated that the
vertical component (𝑣 𝑠𝑖𝑛𝜃) of the velocity flowing through the slits was sufficient
to achieve uniform fluidization in the annulus which significantly increased the
mixing effects of the bed material. However, the tangential component (𝑣 𝑐𝑜𝑠𝜃) of
the velocity was still insufficient to induce any rotation of the fluid bed.
From independent research conducted at the Pyrolysis Laboratories in the
Department of Chemical Engineering at the University of Pretoria, it was concluded
that the regions of stationary bed material previously described had a high viscosity
and therefore a high resistance to flow and/or movement. As the fluidizing air
impacted on these regions of high viscosity, the moving air was forced vertically
upwards, resulting in the formation of jets and spouted fluidized bed behaviour. It
was therefore concluded that for induced rotating fluid bed behaviour to occur, it is
essential that the entire floor of the annulus first be uniformly fluidized, ensuring the
same viscosity throughout the bed material with minimal resistance to flow and/or
movement.
Based on the sensitivity studies performed, a minimum percentage open area of
1.6% was recommended to ensure uniform fluidization of the bed material in the
annulus. Since manufacturing slit-type air distributors with many slits and precise slit
heights was deemed physically unrealisable, future experiments should rather test
porous plate-type air distributors. Porous plate-type distributors are known to
provide good fluidization, and if manufactured from ceramic materials, would also
be more practical for the annular pyrolysis chamber in the new fluidized bed fast
pyrolyser.
© University of Pretoria
5-19
It was also hypothesized that once uniform fluidization is achieved, induced rotating
fluid bed behaviour is likely to occur with sufficient fluidizing air flowing in the
tangential direction since the bed material experiences little resistance to flow and/or
movement. In order to test this hypothesis, it is recommended that future
experiments should be conducted using slit (or hole) angles below 45° and with
blowers able to achieve higher superficial gas velocities in the annulus (>1 m/s).
If more powerful blowers are tested in future experiments, it is also recommended
that a study should be done to check whether sufficient contact time is available for
the pyrolysis reactions to occur at such high superficial gas velocities. If not, the
design concept of an induced rotating fluid bed in the annular pyrolysis chamber of
the new fluidized bed fast pyrolyser could be impractical. In such an event, a rotating
gas distributor plate should be considered instead.
5.7 Reference
Airaga, EM (2015) “Viscosity effects in fluidized beds”, CSC 411 Report,
Department of Chemical Engineering, University of Pretoria, South Africa.
© University of Pretoria
6-1
CHAPTER 6: CFD SIMULATIONS
In order to study the hydrodynamic behaviour of the annular fluidized bed in more
detail, representative 2-dimensional CFD models were simulated using the Euler-
Euler Model – Laminar Flow Interface in COMSOL Multiphysics® software. The
Euler-Euler Model – Laminar Flow Interface is suitable to simulate the flow of two
continuous and fully interpenetrating incompressible phases at low to moderate
Reynolds numbers. This model can handle large differences in density between
phases, making it ideal to simulate solid particles in gas and in liquid, as well as the
transportation of liquid droplets or bubbles in a liquid.
6.1 The Euler-Euler Model
In order to calculate the velocity field for each phase, the model solves two sets of
Navier-Stokes equations. The interphase momentum transfer, 𝑭, between the
continuous phase and the dispersed phase is described by Equation 6-1. The
subscript 𝑐 denotes quantities relating to the continuous phase (air), whereas the
subscript 𝑑 denotes quantities relating to the dispersed phase (bed material). Based
on the assumption that the interphase momentum transfer is dominated by the drag
force, the drag acting on each phase can be further described by a drag force
coefficient, 𝛽. The slip velocity, 𝒖𝑠𝑙𝑖𝑝, is defined by Equation 6-2, where 𝒖 is the
velocity of each phase.
𝑭𝑑𝑟𝑎𝑔,𝑐 = −𝑭𝑑𝑟𝑎𝑔,𝑑 = 𝛽𝒖𝑠𝑙𝑖𝑝
(6-1)
𝒖𝑠𝑙𝑖𝑝 = 𝒖𝑑 − 𝒖𝑐 (6-2)
© University of Pretoria
6-2
In all the simulations, the Gidaspow drag model was used (Equation 6-3), where 𝜑
denotes the phase volume fraction, 𝜌 is the density, 𝐶𝑑𝑟𝑎𝑔 is the drag coefficient for
a single dispersed particle, 𝑑 is the dispersed phase particle diameter and 𝜇 is the
dynamic viscosity.
𝛽 = 3𝜑𝑐𝜑𝑑𝜌𝑐𝐶𝑑𝑟𝑎𝑔
4𝑑𝑑[𝒖𝑠𝑙𝑖𝑝]𝜑𝑐
−2.65 for 𝜑𝑐 > 0.8
𝛽 = 150𝜇𝑐𝜑𝑑
2
𝜑𝑐𝑑𝑑2 + 1.75
𝜑𝑑𝜌𝑐
𝑑𝑑[𝒖𝑠𝑙𝑖𝑝] for 𝜑𝑐 < 0.8
(6-3)
A solid pressure model, 𝑝𝑠, is also required to model the particle-particle interactions
and collisions as well as the friction experienced between two particles. In all the
simulations, the Gidaspow-Ettehadieh model was used, as described in
Equation 6-4.
∇𝑝𝑠 = −10−8.76𝜑𝑐+5.43∇𝜑𝑐 (6-4)
Along the wall boundaries, a slip condition for the dispersed phase, and a non-slip
condition for the continuous phase, were applied. Physics-controlled meshes were
generated for each individual simulation, ensuring a finer meshing sequence along
the boundaries and inlets, resulting in more accurate solutions. Although induced
rotating fluid bed behaviour was unfortunately not observed during any of the
simulations, the results still proved beneficial as they could illustrate several
hydrodynamic properties not visibly obvious in the experiments conducted with the
Perspex model.
6.2 Tangential Injectors
In order to reduce the computational time, only a section of the annulus was
modelled on a 2D surface, as illustrated in Figure 6-1. Five square injector inlets
© University of Pretoria
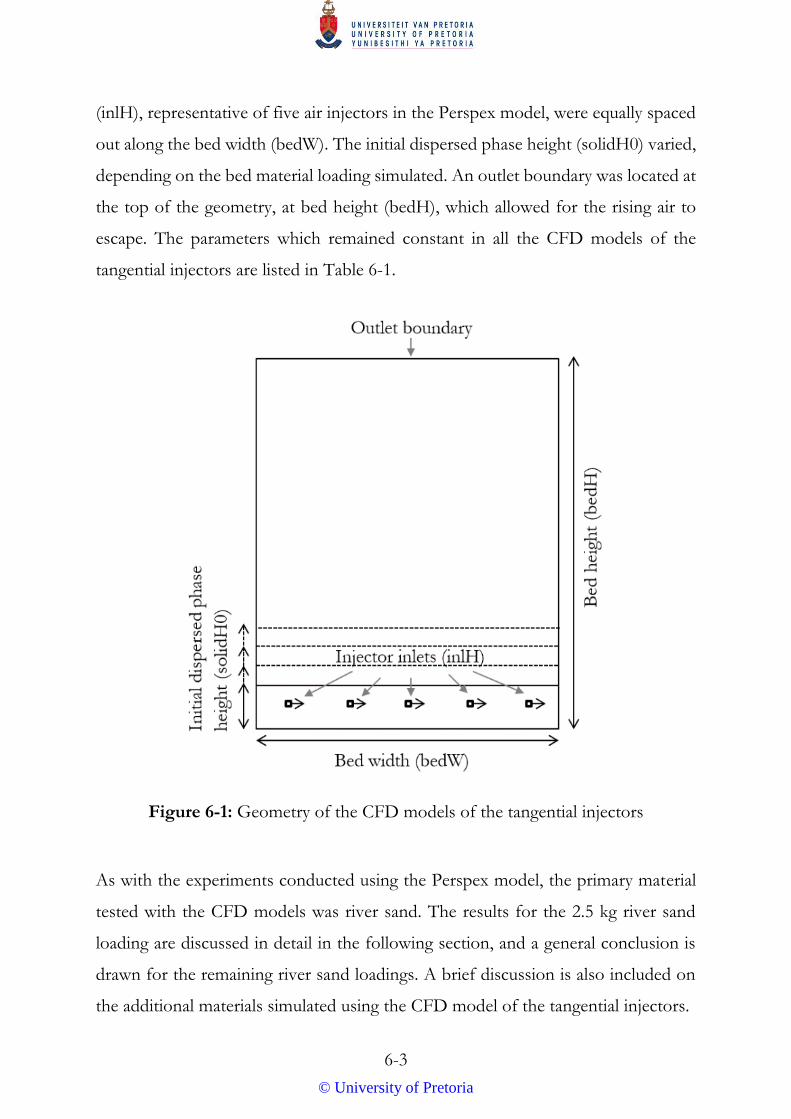
6-3
(inlH), representative of five air injectors in the Perspex model, were equally spaced
out along the bed width (bedW). The initial dispersed phase height (solidH0) varied,
depending on the bed material loading simulated. An outlet boundary was located at
the top of the geometry, at bed height (bedH), which allowed for the rising air to
escape. The parameters which remained constant in all the CFD models of the
tangential injectors are listed in Table 6-1.
Figure 6-1: Geometry of the CFD models of the tangential injectors
As with the experiments conducted using the Perspex model, the primary material
tested with the CFD models was river sand. The results for the 2.5 kg river sand
loading are discussed in detail in the following section, and a general conclusion is
drawn for the remaining river sand loadings. A brief discussion is also included on
the additional materials simulated using the CFD model of the tangential injectors.
© University of Pretoria

6-4
Table 6-1: Parameters for the CFD models of the tangential injectors
Parameter Description Value Units
bedH Fluidized bed height 0.5 m
bedW Fluidized bed width 0.44 m
diam Particle size of dispersed phase Specify for each material
inlH Injector size 6.5 x 10⁻³ m
muc Dynamic viscosity of continuous phase 1.8 x 10⁻⁵ Pa·s
phid0 Initial dispersed phase volume fraction Specify for each material
rhoc Continuous phase density 1.2 kg/m3
rhod Dispersed phase density Specify for each material
solidH0 Initial dispersed phase height Specify for each material
6.2.1 River Sand
The material-specific parameters used in the 2.5 kg river sand loading simulation are
listed in Table 6-2. The physics-controlled mesh generated for the geometry used in
the simulation comprised 25 415 triangular elements and 924 quadrilateral elements.
Table 6-2: Material-specific parameters used in the 2.5 kg river sand loading simulation
Parameter Description Value Units
diam Particle size of dispersed phase 5 x 10⁻⁴ m
phid0 Initial dispersed phase volume fraction 0.65
rhod Dispersed phase density 2070 kg/m3
solidH0 Initial dispersed phase height 6.5 x 10⁻² m
The simulation was studied over a period of 5 seconds, ensuring sufficient time for
the CFD model to reach a pseudo-steady state. The results from the simulation,
depicting how the dispersed phase volume fraction changes over time, are illustrated
© University of Pretoria
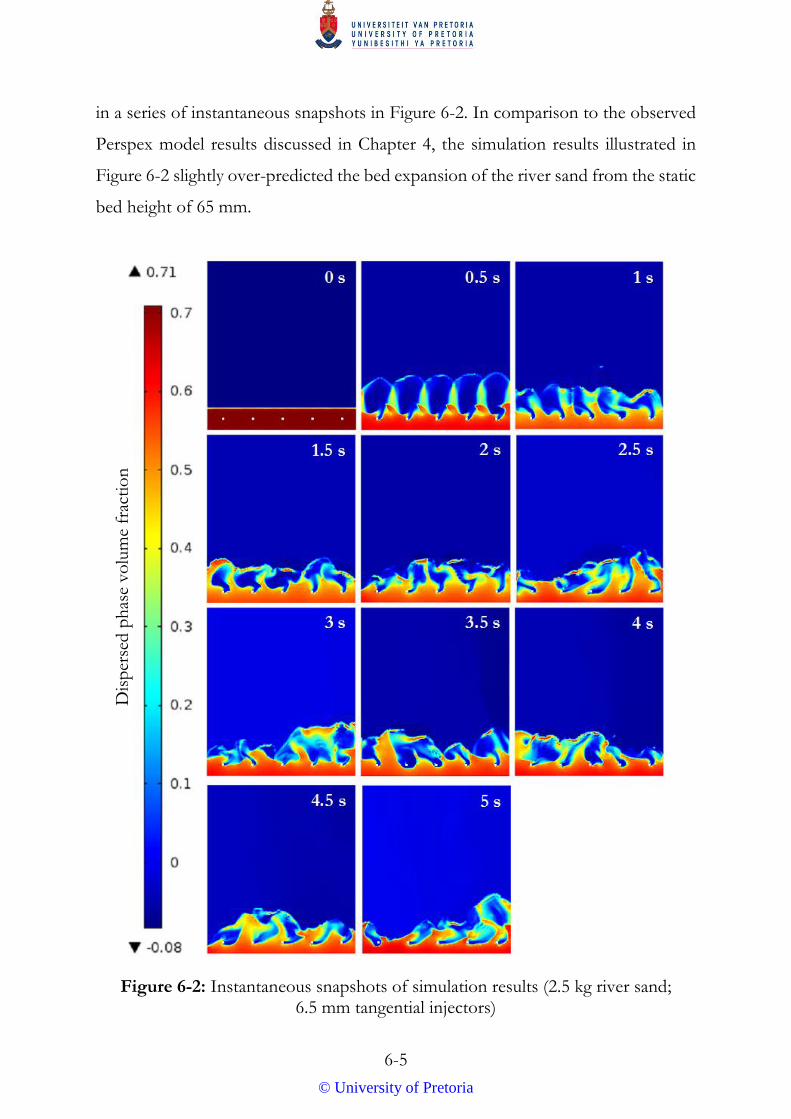
6-5
in a series of instantaneous snapshots in Figure 6-2. In comparison to the observed
Perspex model results discussed in Chapter 4, the simulation results illustrated in
Figure 6-2 slightly over-predicted the bed expansion of the river sand from the static
bed height of 65 mm.
Figure 6-2: Instantaneous snapshots of simulation results (2.5 kg river sand; 6.5 mm tangential injectors)
Dis
per
sed p
has
e vo
lum
e fr
acti
on
© University of Pretoria
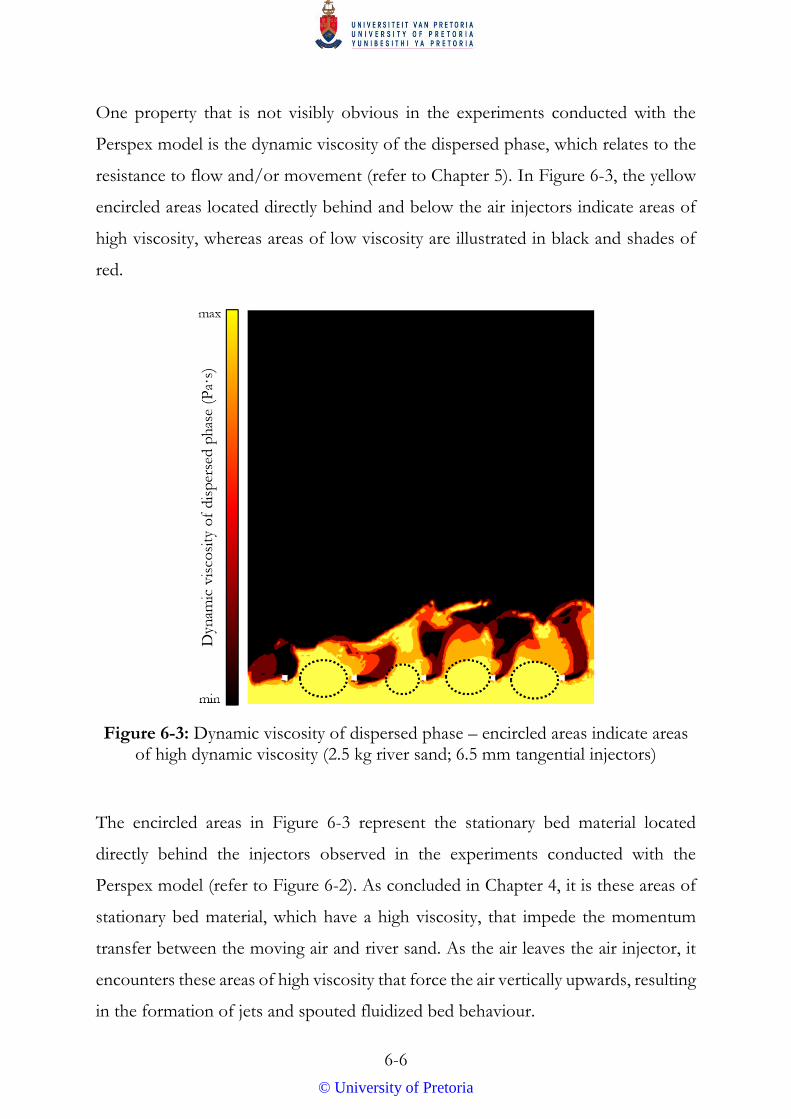
6-6
One property that is not visibly obvious in the experiments conducted with the
Perspex model is the dynamic viscosity of the dispersed phase, which relates to the
resistance to flow and/or movement (refer to Chapter 5). In Figure 6-3, the yellow
encircled areas located directly behind and below the air injectors indicate areas of
high viscosity, whereas areas of low viscosity are illustrated in black and shades of
red.
Figure 6-3: Dynamic viscosity of dispersed phase – encircled areas indicate areas of high dynamic viscosity (2.5 kg river sand; 6.5 mm tangential injectors)
The encircled areas in Figure 6-3 represent the stationary bed material located
directly behind the injectors observed in the experiments conducted with the
Perspex model (refer to Figure 6-2). As concluded in Chapter 4, it is these areas of
stationary bed material, which have a high viscosity, that impede the momentum
transfer between the moving air and river sand. As the air leaves the air injector, it
encounters these areas of high viscosity that force the air vertically upwards, resulting
in the formation of jets and spouted fluidized bed behaviour.
© University of Pretoria
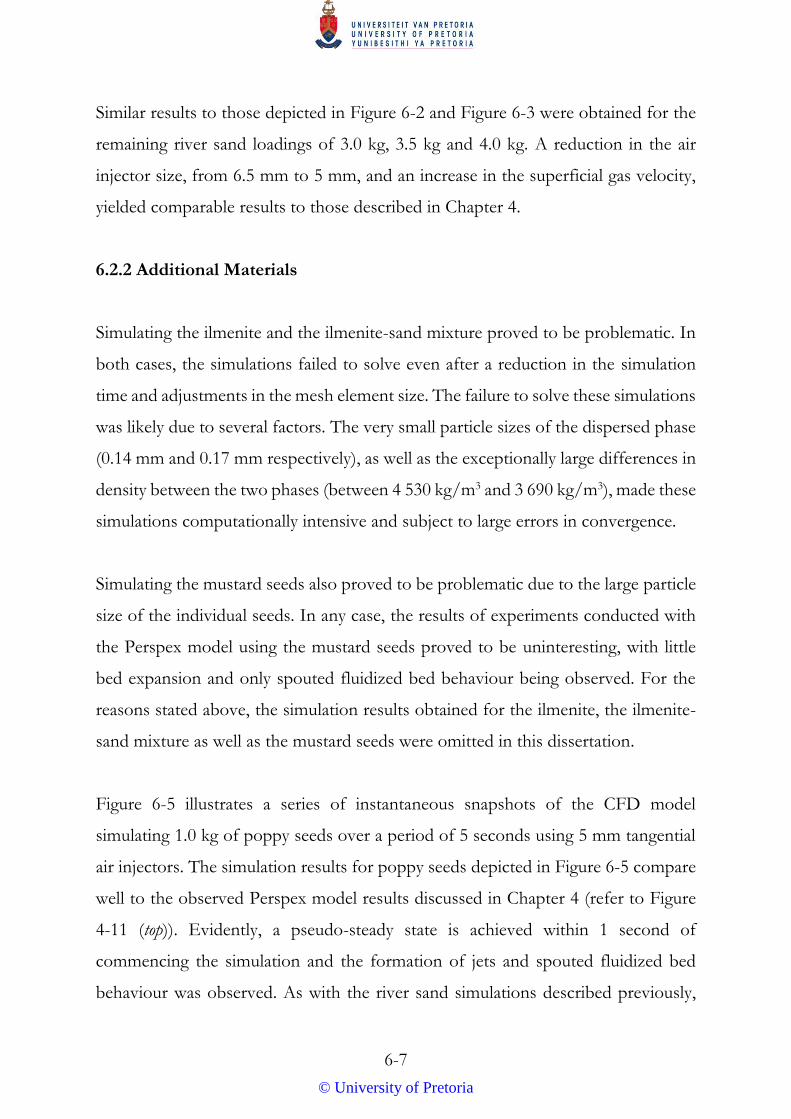
6-7
Similar results to those depicted in Figure 6-2 and Figure 6-3 were obtained for the
remaining river sand loadings of 3.0 kg, 3.5 kg and 4.0 kg. A reduction in the air
injector size, from 6.5 mm to 5 mm, and an increase in the superficial gas velocity,
yielded comparable results to those described in Chapter 4.
6.2.2 Additional Materials
Simulating the ilmenite and the ilmenite-sand mixture proved to be problematic. In
both cases, the simulations failed to solve even after a reduction in the simulation
time and adjustments in the mesh element size. The failure to solve these simulations
was likely due to several factors. The very small particle sizes of the dispersed phase
(0.14 mm and 0.17 mm respectively), as well as the exceptionally large differences in
density between the two phases (between 4 530 kg/m3 and 3 690 kg/m3), made these
simulations computationally intensive and subject to large errors in convergence.
Simulating the mustard seeds also proved to be problematic due to the large particle
size of the individual seeds. In any case, the results of experiments conducted with
the Perspex model using the mustard seeds proved to be uninteresting, with little
bed expansion and only spouted fluidized bed behaviour being observed. For the
reasons stated above, the simulation results obtained for the ilmenite, the ilmenite-
sand mixture as well as the mustard seeds were omitted in this dissertation.
Figure 6-5 illustrates a series of instantaneous snapshots of the CFD model
simulating 1.0 kg of poppy seeds over a period of 5 seconds using 5 mm tangential
air injectors. The simulation results for poppy seeds depicted in Figure 6-5 compare
well to the observed Perspex model results discussed in Chapter 4 (refer to Figure
4-11 (top)). Evidently, a pseudo-steady state is achieved within 1 second of
commencing the simulation and the formation of jets and spouted fluidized bed
behaviour was observed. As with the river sand simulations described previously,
© University of Pretoria
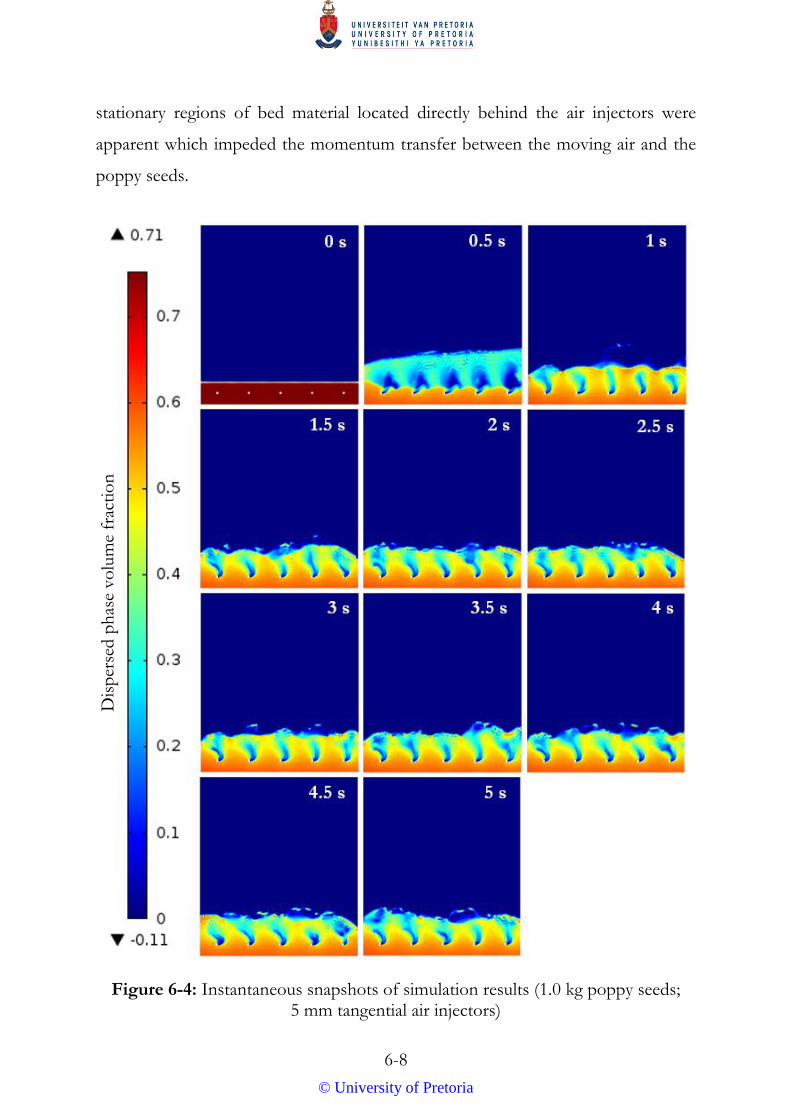
6-8
stationary regions of bed material located directly behind the air injectors were
apparent which impeded the momentum transfer between the moving air and the
poppy seeds.
Figure 6-4: Instantaneous snapshots of simulation results (1.0 kg poppy seeds; 5 mm tangential air injectors)
Dis
per
sed p
has
e vo
lum
e fr
acti
on
© University of Pretoria
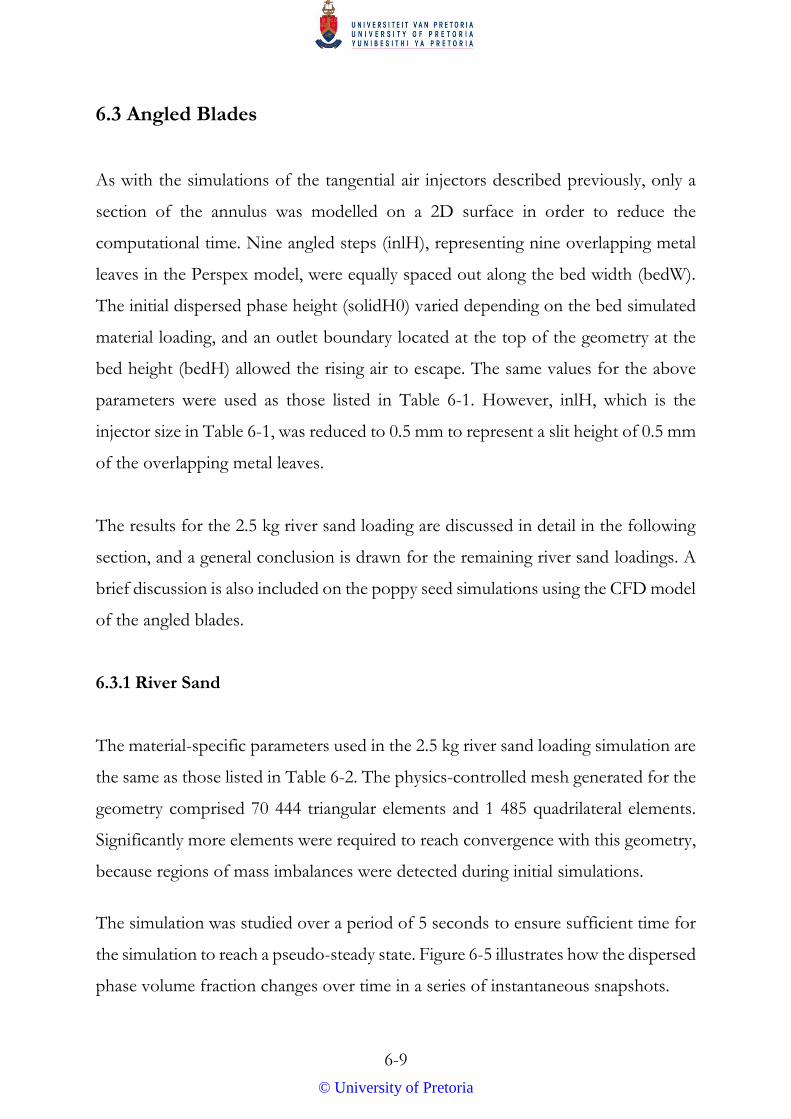
6-9
6.3 Angled Blades
As with the simulations of the tangential air injectors described previously, only a
section of the annulus was modelled on a 2D surface in order to reduce the
computational time. Nine angled steps (inlH), representing nine overlapping metal
leaves in the Perspex model, were equally spaced out along the bed width (bedW).
The initial dispersed phase height (solidH0) varied depending on the bed simulated
material loading, and an outlet boundary located at the top of the geometry at the
bed height (bedH) allowed the rising air to escape. The same values for the above
parameters were used as those listed in Table 6-1. However, inlH, which is the
injector size in Table 6-1, was reduced to 0.5 mm to represent a slit height of 0.5 mm
of the overlapping metal leaves.
The results for the 2.5 kg river sand loading are discussed in detail in the following
section, and a general conclusion is drawn for the remaining river sand loadings. A
brief discussion is also included on the poppy seed simulations using the CFD model
of the angled blades.
6.3.1 River Sand
The material-specific parameters used in the 2.5 kg river sand loading simulation are
the same as those listed in Table 6-2. The physics-controlled mesh generated for the
geometry comprised 70 444 triangular elements and 1 485 quadrilateral elements.
Significantly more elements were required to reach convergence with this geometry,
because regions of mass imbalances were detected during initial simulations.
The simulation was studied over a period of 5 seconds to ensure sufficient time for
the simulation to reach a pseudo-steady state. Figure 6-5 illustrates how the dispersed
phase volume fraction changes over time in a series of instantaneous snapshots.
© University of Pretoria
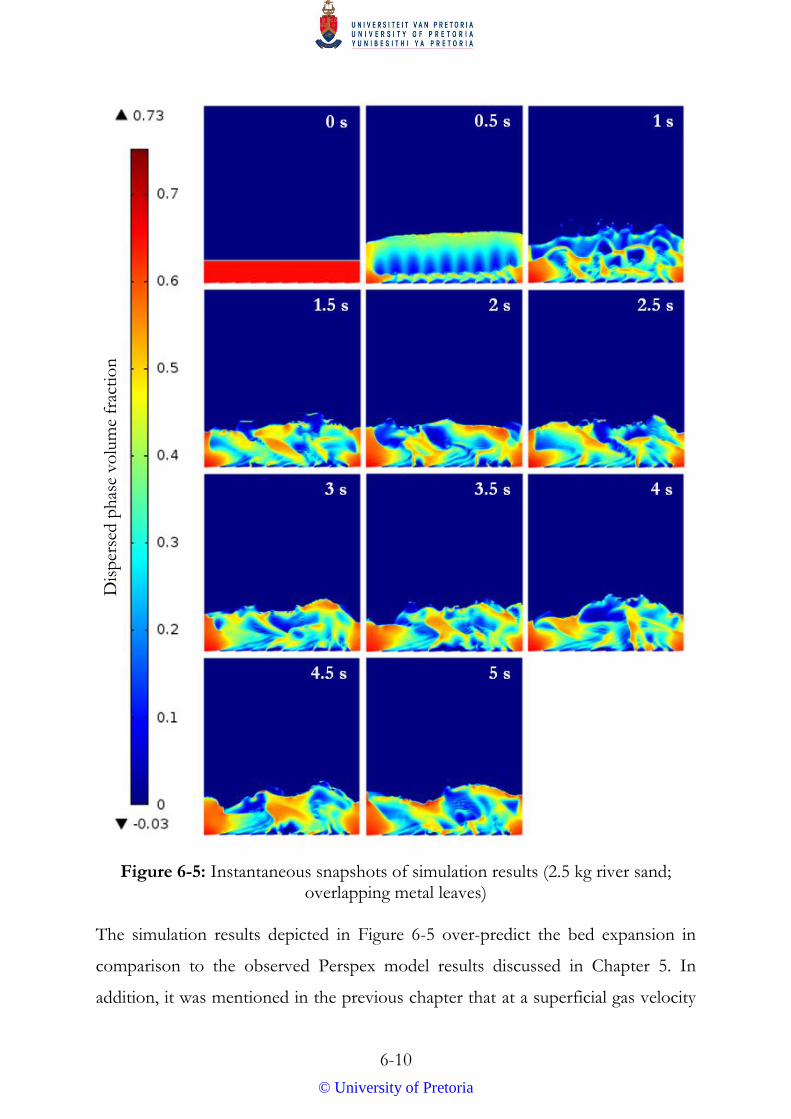
6-10
Figure 6-5: Instantaneous snapshots of simulation results (2.5 kg river sand; overlapping metal leaves)
The simulation results depicted in Figure 6-5 over-predict the bed expansion in
comparison to the observed Perspex model results discussed in Chapter 5. In
addition, it was mentioned in the previous chapter that at a superficial gas velocity
Dis
per
sed p
has
e vo
lum
e fr
acti
on
© University of Pretoria
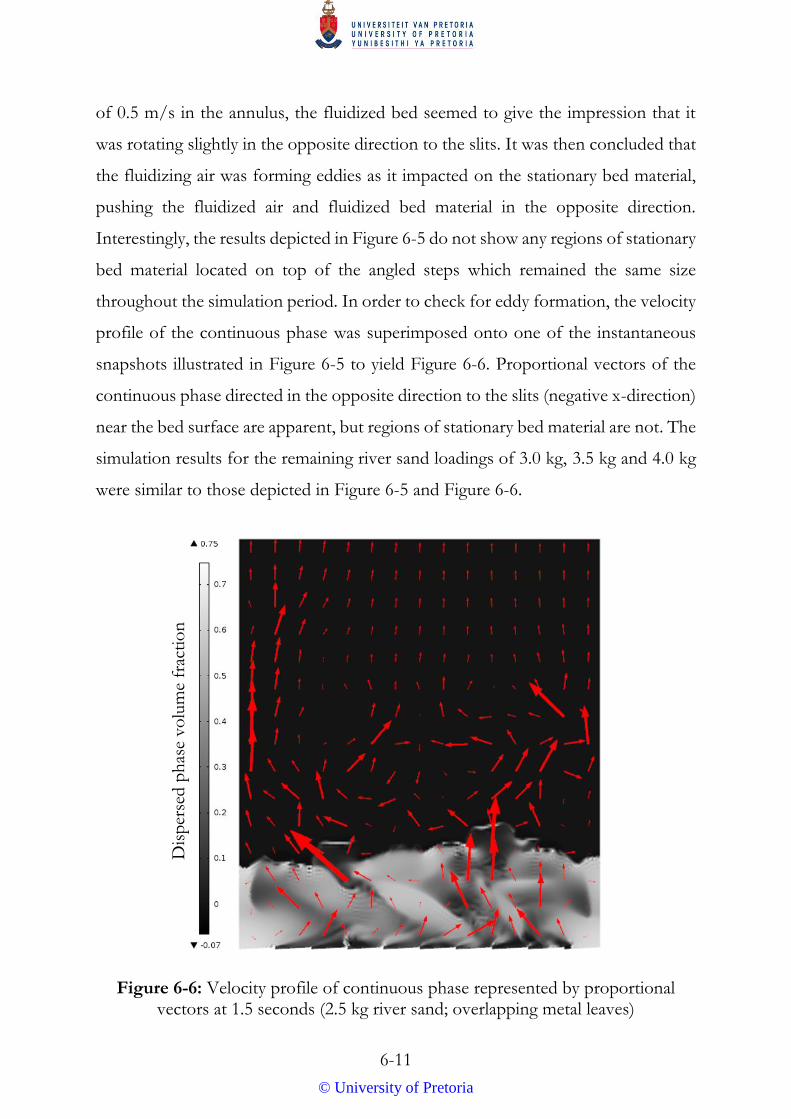
6-11
of 0.5 m/s in the annulus, the fluidized bed seemed to give the impression that it
was rotating slightly in the opposite direction to the slits. It was then concluded that
the fluidizing air was forming eddies as it impacted on the stationary bed material,
pushing the fluidized air and fluidized bed material in the opposite direction.
Interestingly, the results depicted in Figure 6-5 do not show any regions of stationary
bed material located on top of the angled steps which remained the same size
throughout the simulation period. In order to check for eddy formation, the velocity
profile of the continuous phase was superimposed onto one of the instantaneous
snapshots illustrated in Figure 6-5 to yield Figure 6-6. Proportional vectors of the
continuous phase directed in the opposite direction to the slits (negative x-direction)
near the bed surface are apparent, but regions of stationary bed material are not. The
simulation results for the remaining river sand loadings of 3.0 kg, 3.5 kg and 4.0 kg
were similar to those depicted in Figure 6-5 and Figure 6-6.
Figure 6-6: Velocity profile of continuous phase represented by proportional vectors at 1.5 seconds (2.5 kg river sand; overlapping metal leaves)
Dis
per
sed
ph
ase
vo
lum
e fr
acti
on
© University of Pretoria

6-12
Simulating the 3D printed air distributor proved problematic and the simulation
results were not comparable to those observed with the Perspex model. For all river
sand loadings, the bed expansion was significantly over-predicted and large mass
imbalances were observed. Even with a reduction in the simulation time and
adjustments in the mesh element sizes and geometry, the simulations either failed to
solve or resulted in large errors in convergence. It was therefore concluded that
although it is possible to accurately duplicate the geometry of the physical Perspex
model in a CFD model, small details in an overall large geometry, such as the slits in
the 3D printed air distributor, are impractical to simulate and can lead to poor
convergence.
6.3.2 Poppy Seeds
The simulation results of the angled blades using poppy seeds as the bed material in
the annulus were not comparable with those observed with the Perspex model. As
with the simulation results of the angled blades using river sand, no regions of
stationary bed material on top of the angled blades were observed. In addition, the
formation of jets and spouted fluidized bed behaviour was also not observed.
Instead, over the course of the simulation time, the bed of poppy seeds appeared to
behave as a single expanding solid unit, significantly over-predicting the bed
expansion. This observation was likely due to the fact that the particle size of the
poppy seeds was larger than the mesh elements, resulting in many inaccuracies in
the simulation and poor convergence.
Simulating the poppy seeds with the 3D printed air distributor also proved
problematic due to large mass imbalances and the bed of poppy seeds behaving as a
single expanding solid unit, as illustrated in Figure 6-7. Even with a reduction in the
simulation time and adjustments in the mesh element sizes as well as geometry, the
simulations failed to solve. Once again, the small details in an overall large geometry
© University of Pretoria
6-13
were concluded to be impractical to simulate, ultimately leading to poor
convergence.
Figure 6-7: Instantaneous snapshot of simulation results (1.0 kg poppy seeds; 3D printed air distributor with 45° slits)
6.4 Limitations of CFD Results
Although CFD modelling offers many advantages over carrying out physical
experiments, certain drawbacks are limiting to the applicability of the simulated
results. Currently most CFD models, including the Euler-Euler Model used for the
simulations in this chapter, model the dispersed phase as a single particle size. More
accurate solutions could be achieved if the dispersed phase were modelled as a
particle size distribution. Furthermore, 3-dimensional modelling of the annulus
could also result in more accurate solutions. Finally, in Chapter 5 it was hypothesised
Dis
per
sed p
has
e vo
lum
e fr
acti
on
© University of Pretoria
6-14
that once uniform fluidization is achieved in the annulus, induced rotating fluid bed
behaviour is likely to occur with sufficient fluidizing air flowing in the tangential
direction. In order to test this hypothesis, it is recommended that the annulus should
be modelled at high Reynolds numbers in the turbulent regime. Several models are
available for turbulent CFD modelling (Table 6-3); however, they are not currently
available in COMSOL Multiphysics®. It is therefore recommended that more
accurate solutions could be achieved if the dispersed phase is modelled as a particle
size distribution, the annulus is modelled in three dimensions and a turbulent CFD
model, capable of simulating high Reynolds numbers, is used.
6.5 Conclusions and Recommendations
The Euler-Euler Model – Laminar Flow Interface in COMSOL Multiphysics® was
used to study the hydrodynamic behaviour of the annular fluidized bed in more
detail. Although induced rotating fluid bed behaviour was not observed during any
of the simulations, the results still proved beneficial since the CFD models could
illustrate several hydrodynamic properties not visibly obvious in the experiments
conducted with the Perspex model. The simulation results obtained for the ilmenite,
the ilmenite-sand mixture and the mustard seeds were omitted in this dissertation
due to failure to solve and large errors in convergence.
The simulation results of the tangential injectors with river sand and poppy seeds
compared well to the observed Perspex model results, although over-prediction of
bed expansion was observed. The simulation results supported the previously drawn
conclusion that the areas of stationary bed material, which have a high viscosity,
impede the momentum transfer, resulting in the formation of jets and spouted
fluidized behaviour. The simulation results of the angled blades with river sand and
poppy seeds, on the other hand, did not yield comparable results to those observed
with the Perspex model as no stationary regions of bed material were observed on
© University of Pretoria
6-15
top of the angled steps. It was concluded that although it is possible to create the
geometry of the CFD model to very accurately represent the physical Perspex model,
small details in an overall large geometry, such as the angled steps and slits, are
impractical to simulate and can lead to poor convergence.
It is recommended that more accurate solutions could be achieved if the dispersed
phase were modelled as a particle size distribution and the annulus were modelled in
three dimensions. In addition, the annular fluidized bed should also be modelled
using a turbulent CFD model capable of simulating high Reynolds numbers. Once
the above suggestions have been implemented, the CFD models could then be used
to test the recommendations suggested in Chapter 5, including porous plate-type
distributors and variations in slit or hole angles with high superficial gas velocities in
the annulus. If induced rotating fluid bed behaviour is successfully simulated, the
CFD model could then be used to check whether sufficient contact time were
available for the pyrolysis reactions to occur at those superficial gas velocities.
6.6 Reference
Silva, GG, Jiménez, NP and Salazar, OF (2012) Fluid Dynamics of Gas-Solid Fluidized
Beds, In Oh, HW (ed) Advanced Fluid Dynamics, InTech.
© University of Pretoria
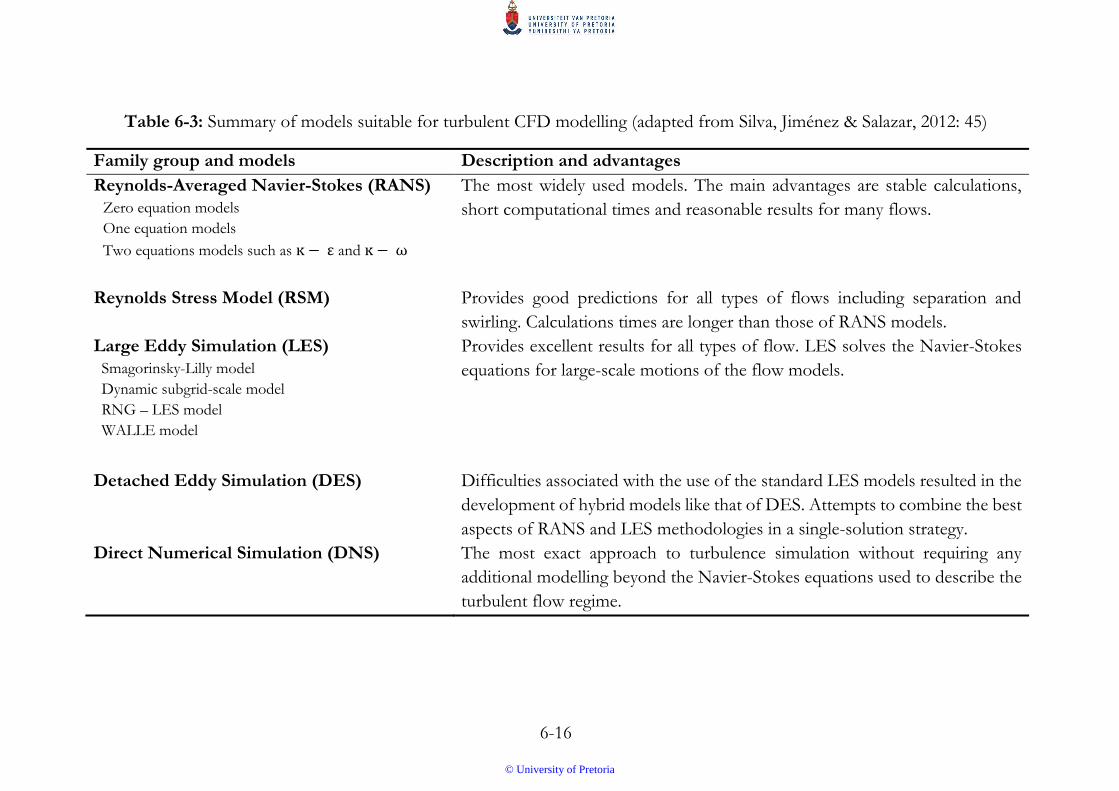
6-16
Table 6-3: Summary of models suitable for turbulent CFD modelling (adapted from Silva, Jiménez & Salazar, 2012: 45)
Family group and models Description and advantages
Reynolds-Averaged Navier-Stokes (RANS)
Zero equation models
One equation models
Two equations models such as ĸ − ε and ĸ − ω
The most widely used models. The main advantages are stable calculations,
short computational times and reasonable results for many flows.
Reynolds Stress Model (RSM) Provides good predictions for all types of flows including separation and
swirling. Calculations times are longer than those of RANS models.
Large Eddy Simulation (LES)
Smagorinsky-Lilly model
Dynamic subgrid-scale model
RNG – LES model
WALLE model
Provides excellent results for all types of flow. LES solves the Navier-Stokes
equations for large-scale motions of the flow models.
Detached Eddy Simulation (DES) Difficulties associated with the use of the standard LES models resulted in the
development of hybrid models like that of DES. Attempts to combine the best
aspects of RANS and LES methodologies in a single-solution strategy.
Direct Numerical Simulation (DNS) The most exact approach to turbulence simulation without requiring any
additional modelling beyond the Navier-Stokes equations used to describe the
turbulent flow regime.
© University of Pretoria
7-1
CHAPTER 7: CONCLUSIONS &
RECOMMENDATIONS
A physical model was constructed using two Perspex tubes to study the behaviour
of a fluidized bed in an annulus, testing various bed materials. In order to study the
hydrodynamics of the annular fluidized bed in more detail, representative
2-dimensional CFD models were simulated in COMSOL Multiphysics® software.
The conclusions and recommendations in Chapters 4, 5 and 6 are summarized
below.
7.1 Perspex Model Conclusions
7.1.1 Tangential Injectors
It was hypothesized that by using multiple gas injectors orientated tangentially to the
annulus walls, induced rotating fluid bed behaviour would occur in the annulus.
Unfortunately, even after a reduction in the air injector diameter and the addition of
a secondary blower, induced rotating fluid bed behaviour was not observed
throughout the entire range of superficial gas velocities tested. Instead, as the
superficial gas velocity increased beyond minimum fluidization, the formation of jets
and spouted fluidized bed behaviour was observed, followed by turbulent
fluidization. Regions of stationary bed material located directly behind the air
injectors were also present for all materials tested. Based on these observations, it
was concluded that the centrifugal forces were significantly lower than initially
anticipated. Furthermore, it was concluded that the regions of stationary bed
material, causing non-uniform fluidization, impede the momentum transfer between
the moving air and bed material, preventing the possibility of any rotation of the bed
material in the annulus.
© University of Pretoria
7-2
7.1.2 Angled Blades
A completely different air distributing system was designed which may possibly have
overcome the difficulties experienced with the multiple tangential air injectors. It
was hypothesized that fixed angled blades, similar to the blades used in the gas
distributor of the TORBED reactor, could induce a rotating fluid bed in an annulus.
A metal air distributor was designed and manufactured from stainless steel with 32
overlapping metal leaves. Unfortunately, over the entire range of superficial gas
velocities tested, and with various slit heights, induced rotating fluid bed behaviour
was not observed for any of the materials tested. Jet formation and spouted fluidized
bed behaviour was again observed as the superficial gas velocity was gradually
increased, followed by turbulent fluidization. Stationary regions of bed material,
located on top of the overlapping metal leaves, were also observed but were
significantly smaller in size compared to the regions observed directly behind the
tangential air injectors. Based on these observations, it was concluded that the
vertical and tangential components (𝑣 𝑠𝑖𝑛𝜃 and 𝑣 𝑐𝑜𝑠𝜃) of the air velocity flowing
through the overlapping metal leaves were insufficient to result in uniform
fluidization or the desired induced rotating bed behaviour in the annulus.
In order to overcome the problems experienced with the metal air distributor, a new
3D printed air distributor was designed to have 64 slits with fixed slit heights of
0.5 mm at an angle of 45°. Although induced rotating fluid bed behaviour was once
again not observed with any of the materials tested at any superficial gas velocity,
uniform bubbling fluidization was observed during experiments conducted with
river sand and poppy seeds. This observation implied that the vertical component
(𝑣 𝑠𝑖𝑛𝜃) of the velocity flowing through the slits was sufficient to achieve uniform
fluidization in the annulus, significantly increasing the mixing effects of the bed
material. However, the tangential component (𝑣 𝑐𝑜𝑠𝜃) of the velocity was still
insufficient to induce any rotation of the fluid bed in the annulus.
© University of Pretoria
7-3
From independent research conducted at the Pyrolysis Laboratories in the
Department of Chemical Engineering at the University of Pretoria, it was concluded
that the regions of stationary bed material previously described had a high viscosity
and therefore a high resistance to flow and/or movement. As the fluidizing air
impacted on these regions of high viscosity, the moving air was forced vertically
upwards, resulting in the formation of jets and spouted fluidized bed behaviour.
7.2 Conclusions of CFD Simulations
The Euler-Euler Model – Laminar Flow Interface in COMSOL Multiphysics®
software was used to study the hydrodynamic behaviour of the annular fluidized bed
in more detail. Although induced rotating fluid bed behaviour was not observed
during any of the simulations, the results still proved beneficial since the CFD
models could illustrate several hydrodynamic properties not visibly obvious in the
experiments conducted with the Perspex model.
The simulation results of the tangential injectors with river sand and poppy seeds
compared well to the observed Perspex model results, although slight over-
prediction of bed expansion was apparent. The simulation results supported the
previously drawn conclusion that the areas of stationary bed material, which had a
high viscosity, impeded the momentum transfer and resulted in the formation of jets
and spouted fluidized behaviour. The simulation results of the angled blades with
river sand and poppy seeds on the other hand, did not yield comparable results to
those observed with the Perspex model as no stationary regions of bed material were
observed, and neither was uniform bubbling fluidization. It was therefore concluded
that although it is possible to create the geometry of the CFD model to very
accurately represent the physical Perspex model, small details in an overall large
geometry, such as the angled steps and slits, are impractical to simulate and can lead
to poor convergence.
© University of Pretoria
7-4
7.3 Recommendations for Future Work
After the analysis of all the experimental work performed, it was hypothesized that
once uniform fluidization is achieved, induced rotating fluid bed behaviour is likely
to occur with sufficient fluidizing air flowing in the tangential direction since a
uniformly fluidized bed offers little resistance to flow and/or movement. It is
recommended that future experiments should be conducted using slit (or hole)
angles below 45° and with blowers able to achieve higher superficial gas velocities
in the annulus (>1 m/s). Future experiments should also test porous plate-type air
distributors which, if manufactured from ceramic materials, would also be more
practical for the annular pyrolysis chamber in the new fluidized bed fast pyrolyser.
In the event that more accurate CFD models of the annular fluidized bed were
developed, it is recommended that the dispersed phase should be modelled as a
particle size distribution and the annulus modelled 3-dimensionally. In addition, the
annular fluidized bed should also be modelled using a turbulent CFD model capable
of simulating high Reynolds numbers. If induced rotating fluid bed behaviour were
successfully modelled using CFD, the model could then be used to check whether
sufficient contact time were available for the pyrolysis reactions to occur at those
superficial gas velocities. If not, the design concept of an induced rotating fluid bed
in the annular pyrolysis chamber of the new fluidized bed fast pyrolyser would be
impractical. In such an event, a rotating gas distributor plate should be considered
instead.
© University of Pretoria