hydrodesulfurization of dibenzothiophene compounds using fluorinated nimo/al2o3 catalysts
TRANSCRIPT

Applied Catalysis B: Environmental 44 (2003) 287–299
Hydrodesulfurization of dibenzothiophene compoundsusing fluorinated NiMo/Al2O3 catalysts
Heeyeon Kim, Jung Joon Lee, Sang Heup Moon∗School of Chemical Engineering, Institute of Chemical Processes, Seoul National University, San 56-1,
Shillim-dong, Gwanak-gu, Seoul 151-744, South Korea
Received 9 December 2002; received in revised form 14 February 2003; accepted 17 February 2003
Abstract
A series of fluorinated NiMo/Al2O3 catalysts containing different amounts of fluorine were prepared and their activity withrespect to the hydrodesulfurization (HDS) of dibenzothiophene (DBT) and 4,6-dimethyldibenzothiophene (4,6-DMDBT) wascompared with that of fluorinated CoMo/Al2O3 catalysts. Fluorine modifies two properties of NiMo/Al2O3 catalysts: metaldispersion and catalyst acidity. In the HDS of DBT, the catalytic activity is enhanced up to 0.5 wt.% added fluorine due toincreased dispersion of the metal, and lowered by further fluorine addition because the catalysts lose a significant amountof initial surface area. The hydrogenation of the DBT aromatic ring is enhanced to a greater extent than the hydrogenolysisof the C–S bond due to the fluorine addition. In the HDS of 4,6-DMDBT, however, the catalytic activity is enhanced inproportion to the fluorine content up to 5.0 wt.% added fluorine. The hydrogenolysis of the C–S bond is enhanced to a greaterextent than the hydrogenation of aromatic rings, in contrast to the trend observed in the HDS of DBT. A facilitated migrationof methyl groups in the aromatic ring of 4,6-DMDBT due to an increase in the amounts of acidic sites of the catalysts isresponsible for the enhanced hydrogenolysis of the C–S bond. The optimum fluorine content to yield the maximum amountsof either the direct desulfurization (DDS) or ring-hydrogenated (HYD) products is different depending on the reactants, DBTor 4,6-DMDBT, as well as the catalysts, NiMo/Al2O3 or CoMo/Al2O3. The characteristic reaction results obtained in thisstudy can be explained by considering the relative contributions of the rates of ring hydrogenation and methyl-group migrationto product distribution for different cases of reactants and fluorinated catalysts.© 2003 Elsevier Science B.V. All rights reserved.
Keywords:Hydrodesulfurization (HDS); Fluorine; NiMo; CoMo; Dibenzothiophene (DBT); 4,6-Dimethyldibenzothiophene (4,6-DMDBT)
1. Introduction
In recent years, many countries have legislated di-minished levels of sulfur in gas oil as the result of thegrowing concern about air pollution by auto-exhaustgas. For example, the European Union has requestedrefiners to reduce the sulfur content of gas oil from
∗ Corresponding author. Tel.:+82-2-880-7409;fax: +82-2-875-6697.E-mail address:[email protected] (S.H. Moon).
0.035 wt.% in 2000 to 0.005 wt.% in 2005[1,2].Therefore, it is necessary to develop catalysts withan improved performance particularly with respect tothe hydrodesulfurization (HDS) of synthetic fuels andgas oil products[3].
NiMo catalysts show a hydrogenation activity su-perior to that of CoMo, hence it is often preferred forthe deep HDS of heavy feedstock, which contains rel-atively large amounts of aromatic compounds[4–6].
In deep HDS, it is important to remove sulfurfrom refractory compounds, which contain alkyl
0926-3373/$ – see front matter © 2003 Elsevier Science B.V. All rights reserved.doi:10.1016/S0926-3373(03)00077-8

288 H. Kim et al. / Applied Catalysis B: Environmental 44 (2003) 287–299
substituents that are bound to aromatic rings atpositions close to the sulfur atom. For example,4-methyldibenzothiophene (4-MDBT) and 4,6-dime-thyldibenzothiophene (4,6-DMDBT) are relativelydifficult to desulfurize because the alkyl substituentssterically hinder the access of the C–S–C bond to thecatalyst surface[7–10] or the access of hydrogen tothe C–S–C bond on the catalyst surface[11]. Accord-ingly, refractory compounds are preferentially con-verted into hydrogenated intermediates before theyare decomposed, with the eventual liberation of sulfur.
Many studies have been directed at improving theactivity of NiMo catalysts for deep HDS. The addi-tion of fluorine to the catalysts is one of the meth-ods used for attaining this goal. For example, Fierroet al. [12] used fluorinated NiMo/Al2O3 in the HDSof gas oil and the isomerization of cyclohexane, andreported that fluorine addition decreased the surfacearea of the catalyst but simultaneously increased theacidity of the catalyst, such that the intrinsic ratesof HDS and isomerization were enhanced. As a re-sult, NiMo/Al2O3 showed a maximum activity when2.5 wt.% of fluorine was added. In the HDS of thio-phene, NiMo/Al2O3 showed a maximum activity at afluorine content of 1 wt.%[13]. Similar results wereobtained with fluorine-added CoMo/Al2O3 catalysts,i.e. the surface area was decreased and metal disper-sion was increased as a result of fluorine addition andthe HDS activity showed a maximum at a specific flu-orine content[14–16]. The effect of fluorine on theperformance of NiMo and CoMo catalysts varied ac-cording to the promoter metal, the amount of addedfluorine and the sequence of fluorine addition[17–19].
Thus far, most studies on fluorinated NiMo/Al2O3catalysts have used relatively simple model com-pounds, such as thiophene[13,20,21], or an industrialfeedstock[12]. However, a study using specific re-fractory compounds, e.g. 4-MDBT or 4,6-DMDBT,is important because the compounds offer a majorresistance to deep HDS[7–11,22].
This study has two objectives. One is to observethe performance of fluorinated NiMo/Al2O3 catalystsin the HDS of refractory sulfur compounds, usingdibenzothiophene (DBT) and 4,6-DMDBT as modelreactants, and to compare the results with thoseof fluorinated CoMo/Al2O3 catalysts. The secondobjective is to correlate the results with the surfaceproperties of the fluorinated NiMo/Al2O3 catalysts,
the latter being investigated by BET surface area mea-surements, NO chemisorption, pyridine FTIR, tem-perature-programmed reduction (TPR), temperature-programmed sulfidation (TPS), and X-ray photoelec-tron spectroscopy (XPS).
2. Experimental
2.1. Materials
DBT (99% purity) and 4,6-DMDBT (95% purity)were obtained from Acros. The catalysts preparedin this study contained 17 wt.% MoO3, 4 wt.% NiO,and various amounts of fluorine. The catalysts aredesignated as FNiMoX, with X denoting the nominalamount of fluorine initially added to the catalysts asNH4F in 0.1 wt.% units. Each catalyst was preparedusing �-Al2O3 (CONDEA, 214 m2 g−1 surface areaand 0.7 cm3 g−1 pore volume) as a support, which wassequentially impregnated with aqueous solutions ofNH4F, (NH4)6Mo7O24·4H2O, and Ni(NO3)2·6H2O.Between the impregnation steps, the catalysts weredried in air at 383 K for 12 h and then calcined inair at 723 K for 4 h. We also prepared fluorinatedCoMo/Al2O3 catalysts, following the same proce-dure as was used for the NiMo catalysts and usingCo(NO3)2·6H2O as a Co precursor, to compare theirHDS activity with that of the NiMo catalysts.
2.2. Catalytic activity
Prior to the activity tests, all catalysts in the ox-ide phase were pre-sulfided in a stream of 12.9%hydrogen sulfide/hydrogen at 673 K for 2 h as de-scribed in our previous reports[23]. Reaction testswere carried out in a 100 cm3 stirred slurry-tank re-actor, which was charged with 0.03–0.5 g of reactantdissolved in 30 cm3 of solvent, and operated in a batchmode at 593 K under a hydrogen pressure of 4.0 MPafor (1/3)–2 h.n-Pentadecane was used as a solvent inthe HDS of DBT and the hydrogenation of BP, anddodecane in the HDS of 4,6-DMDBT and the isomer-ization of 2,2′-DMBP.
Reaction periods were varied to obtain nearly thesame extent of conversion of different reactants underidentical reaction conditions, e.g. 1/3 h for DBT and1 h for 4,6-DMDBT. In the reaction run, the reactor

H. Kim et al. / Applied Catalysis B: Environmental 44 (2003) 287–299 289
solution was sampled through a 0.3175 in. diametertube and analyzed by gas chromatography (GC) us-ing a capillary column (HP1; 30 m× 0.53 mm) and aflame ionization detector. The reaction products werealso analyzed by GC–MS to identify individual com-pounds.
2.3. Characterization
XPS were obtained using an ESCALAB 220i-XLinstrument equipped with an aluminum anode (AlK� = 1486.8 eV). The catalyst powder, in the oxidephase, was pressed into a thin wafer and the waferwas mounted on a double-sided adhesive tape for theXPS measurements. The binding energy (BE) of thesample was obtained with reference to the BE of Al2p line at 74.6 eV.
The BET surface area and pore volume of the cat-alysts, pretreated in a vacuum (10−5 Torr) at 383 Kfor the removal of impurities, were measured usingASAP2010 (Micromeritics).
The amounts of nitric oxide chemisorbed to thecatalysts were measured by a dynamic method, whichwas previously described in detail[14,24]. BeforeNO chemisorption, each catalyst was pre-sulfided ina 12.9% hydrogen sulfide/hydrogen stream at 673 Kfor 2 h, cooled to room temperature, and exposed to ahelium flow for 1 h. Pulses of the adsorption mixture(5 vol.% NO/Ar) were injected into the helium stream,while the amount of NO eluted after each injectionwas monitored until three successive pulses gave theoutlet signals with a change in intensity of less than1%. The total uptake of NO was obtained from accu-mulated differences between the inlet and outlet NOsignals. The catalyst was then flushed with heliumat 373 K for 1 h, to remove physically adsorbed NOfrom the catalyst surface, and the NO injection proce-dure was repeated. The difference in the NO uptakebetween the first and the second adsorption cyclesgave the amount of chemisorbed NO[25,26].
The TPR and TPS apparatuses consisted of a massspectrometer connected to a mass flow control sys-tem and a temperature-programmed heating unit. ForTPR measurements, a catalyst sample in the oxidephase was placed in a quartz reactor and reducedin the stream of 5% hydrogen in argon, flowingat 30 cm3 min−1, while the reduction temperaturewas raised from 293 to 1400 K at a heating rate of
10 K min−1. The TPS apparatus was the same as theTPR unit except for the gas stream, which contained2.4% H2S, 14.3% H2, and 83.3% He.
The vacuum cell used in the infrared spectroscopicinvestigation has been described previously by Moonet al. [27]. The catalyst sample was made in the formof a self-supporting thin wafer, placed at the center ofthe cell vertical to the IR beam, and the spectrum wasthen scanned with a Midac infrared spectrometer. Forthe IR observation of pyridine adsorbed to the cata-lyst, the cell containing the catalyst wafer was evac-uated to below 10−5 Torr at 673 K for 2 h, pyridinewas then introduced into the cell at 2 Torr and roomtemperature. The cell was evacuated again while be-ing heated from room temperature to 423 K, for theremoval of the physisorbed pyridine from the catalystsurface, and finally the IR spectrum of the catalystcontaining chemisorbed pyridine was obtained.
3. Results
3.1. F contents and their effect on pore structure
We obtained the XPS spectra of FNiMoX catalystsin the oxide state to measure the electronic effect ofadded fluorine and the fluorine content of each cata-lyst. The binding energy values for Mo 3d and F 1slevels in all fluorine-containing catalysts are almostconstant and independent of the fluorine content, i.e.228.4 eV for Mo 3d5/2, 231.7 eV for Mo 3d3/2, and685.7 eV for F 1s, respectively, which are close topreviously reported values[28]. Accordingly, fluorineaddition has a negligible effect on the electronic prop-erty of either Mo or F. Within the concentration rangeof this study, the production of AlF3 by reactions be-tween fluorine ions and Al2O3 were negligible becausethe binding energy of F 1s (685.7 eV) observed in theXPS is different from that of AlF3 (687.5 eV)[24–29].Consequently, it can be concluded that added fluorineis simply dispersed on�-Al2O3 replacing the surfacehydroxyl groups of the alumina. We estimated the rel-ative amounts of fluorine remaining in the catalystsafter the calcination steps based on the atomic ratio ofF 1s/Al 2p obtained from XPS spectra. InFig. 1, theF/Al ratio on the FNiMoX catalyst increases almostlinearly with the nominal amount of fluorine addition,except for minor deviations at small F contents.

290 H. Kim et al. / Applied Catalysis B: Environmental 44 (2003) 287–299
Fig. 1. Peak intensity of F 1s of the FNiMoX/Al2O3 catalysts withdifferent amount of fluorine addition.
It has been reported previously[12,24,30,31]thatfluorine modifies the surface structure of the catalyst,which eventually affects the catalytic activity.Table 1shows that the surface area of fluorinated Al2O3 re-mains almost unchanged until fluorine is added up to1.0 wt.% but is then dramatically reduced when flu-orine is added in larger amounts. These results aredifferent from those reported in our previous stud-ies [32–34], which showed that the surface area ofAl2O3 remained nearly constant and was independentof the fluorine content. The discrepancy between thetwo cases is believed to originate from the differenttypes of alumina used, which were obtained from dif-ferent sources. The surface area is reduced becausethin walls between micropores of Al2O3 are dissolved
Table 1BET surface areas of fluorinated Al2O3 catalysts
Catalyst BET surface area (m2 g−1)
F00/Al2O3a 206.1
F05/Al2O3 210.8F10/Al2O3 209.6F25/Al2O3 194.0F50/Al2O3 179.0
a FX/Al2O3: X denoting the amount of fluorine added in0.1 wt.% units.
Table 2HDS of DBT on the FNiMoX and FCoMoX catalystsa
Catalyst Conversion Amount of product(relative amount) (×10−5 mol cm−3)
BP CHB + DCH
FNiMo00 0.48 (1.00) 2.25 (1.00) 0.36 (1.00)FNiMo05 0.53 (1.10) 2.45 (1.09) 0.44 (1.22)FNiMo10 0.51 (1.06) 2.30 (1.02) 0.47 (1.31)FNiMo25 0.44 (0.92) 1.90 (0.84) 0.45 (1.25)
FCoMo00 0.37 (1.00) 1.83 (1.00) 0.16 (1.00)FCoMo05 0.40 (1.08) 1.94 (1.06) 0.21 (1.31)FCoMo10 0.35 (0.95) 1.72 (0.94) 0.16 (1.00)FCoMo25 0.28 (0.76) 1.35 (0.74) 0.14 (0.88)
a Error range of conversions and product amounts is±2%.
in the acidic solution, eventually leading to the forma-tion of larger pores[24].
3.2. HDS of DBT
3.2.1. HDS reactionsConversions and product distributions obtained in
DBT HDS using either NiMo or CoMo catalysts withdifferent fluorine contents are shown inTable 2. Therelative values of conversions and amounts of productare also given in parentheses compared with data ob-tained for catalysts containing no fluorine. The DBTconversion reaches a maximum when 0.5 wt.% of flu-orine is added to the catalysts, and then decreasesat higher fluorine contents. These results are similarto those reported in previous studies of fluorinatedNiMo catalysts[12–14], which also showed a maxi-mum HDS activity when the catalysts contained a spe-cific amount of fluorine. For example, Papadopoulouet al.[13] reported that the addition of 1 wt.% fluorineto NiMo/Al2O3 catalysts enhanced the catalytic activ-ity in thiophene HDS but that the activity decreased athigher fluorine contents. They attributed the increasein activity to the enhanced acidity of Al2O3 and thedecrease to a diminution of catalyst surface area.
In Table 2, the changes in the activity of theFCoMoX catalysts are similar to those of the FNiMoXcatalysts, showing a maximum activity at a fluorinecontent of 0.5 wt.%. The activity is decreased to alarger extent for the FCoMoX catalysts than for theFNiMoX catalysts when excess amounts of fluorineare added, i.e. the relative activity of FCoMo25 is0.76 while that of FNiMo25 is 0.92.

H. Kim et al. / Applied Catalysis B: Environmental 44 (2003) 287–299 291
Three major products of DBT HDS are biphenyl(BP), produced by direct desulfurization (DDS), andcyclohexylbenzene (CHB) and dicyclohexane (DCH),produced by a combination of the hydrogenation of anaromatic ring and desulfurization.Table 2shows that,for the FNiMoX catalysts, the amounts of BP are five-to sevenfold larger than those of CHB+ DCH. Theamounts of BP show a maximum when 0.5 wt.% offluorine is added and then decrease at higher fluorinecontents, which is the same trend as that observed forthe conversion. In the case of hydrogenated products,CHB+ DCH, the trend is the same but the maximumamounts are obtained at a fluorine content of 1.0 wt.%.It is noteworthy that the amounts of CHB+DCH areincreased to larger extents than those of BP by fluorineaddition.
The FCoMoX catalysts show a change in productdistribution similar to the FNiMo catalysts with an in-crease in the fluorine content, although in the formercase hydrogenated products are produced in smalleramounts than in the latter case. The amounts of bothBP and CHB+ DCH reach a maximum at a fluorinecontent of 0.5 wt.%. The reason for why the maximumamounts of CHB+ DCH are obtained at different flu-orine contents for FNiMoX and FCoMoX is becausethe former catalyst is more active with respect to hy-drogenation than the latter and consequently fractionalamounts of BP are further hydrogenated to CHB andDCH on the former catalyst[35].
3.2.2. Hydrogenation of BPThe hydrogenation of BP, which has the same struc-
ture as DBT except for the C–S–C bridge, was per-formed using the same catalyst samples, and the in-trinsic hydrogenation activity of the two catalysts wascompared based on the results.Table 3 shows that26.1% of BP is converted to hydrogenated products,CHB and DCH, on the FNiMo00 catalyst, while only5.0% is converted on the FCoMo00 catalyst. The re-sults agree with the well-known fact that Ni is a moreeffective promoter of hydrogenation than Co, and alsowith the previous reports that, in DBT HDS, CHB islargely produced via the direct hydrogenation of DBTon CoMo catalysts[32] while it is additionally pro-duced by the hydrogenation of BP on NiMo catalysts[35].
The hydrogenation of BP is enhanced by fluo-rine addition. In the case of the FNiMoX catalysts,
Table 3Hydrogenation of BP on the FNiMoX and FCoMoX catalystsa
Catalyst Conversion(%)
CHB(×10−6 mol cm−3)
DCH(×10−6 mol cm−3)
FNiMo00 26.1 (1.00) 13.0 (1.00) 0.6 (1.00)FNiMo05 28.3 (1.08) 14.1 (1.08) 0.7 (1.17)FNiMo10 29.8 (1.14) 15.0 (1.15) 0.9 (1.50)FNiMo25 30.5 (1.17) 14.0 (1.08) 1.3 (2.17)FNiMo50 29.3 (1.12) 13.6 (1.05) 1.5 (2.50)
FCoMo00 5.0 (1.00) 2.4 (1.00) 0.2 (1.00)FCoMo05 5.4 (1.08) 2.6 (1.08) 0.2 (1.00)FCoMo10 4.3 (0.86) 2.1 (0.88) 0.1 (0.50)FCoMo25 3.6 (0.72) 1.7 (0.71) 0.1 (0.50)FCoMo50 3.3 (0.66) 1.6 (0.67) 0.1 (0.50)
a Error range of conversions and product amounts is±2%.
the amounts of hydrogenated products increase upto 2.5 wt.% of added fluorine and then decrease athigher fluorine contents. The hydrogenation activityof the FCoMoX catalysts is much lower than that ofFNiMoX, and changes in a different manner with thefluorine content. That is, the conversion increases upto 0.5 wt.% of added fluorine, but rapidly decreasesat higher fluorine contents.
The amounts of CHB, obtained by the partial hydro-genation of BP, change with fluorine content, which isa similar trend to that for the conversion. To the con-trary, the amounts of DCH, obtained by the full hydro-genation of BP, change with fluorine content showinga trend different from that observed for the conversionand, furthermore, the trend is different depending onthe catalysts. That is, the amounts of DCH obtained onthe FNiMoX catalysts increase up to fluorine contentsas high as 5.0 wt.%, but the amounts on the FCoMoXcatalysts decrease when the fluorine content exceeds0.5 wt.%. Accordingly, fluorine promotes the hydro-genation activity of the FNiMoX catalysts, particularlyfor the additional hydrogenation of CHB to DCH. Inthis respect, we propose that the reason for why themaximum amount of CHB is obtained at lower flu-orine content, on FNiMo10, than one for the maxi-mum conversion, obtained on FNiMo25, is becausea portion of CHB produced by BP hydrogenation isadditionally hydrogenated to DCH on the fluorinatedNiMo catalysts. In the case of the FCoMoX catalysts,the extent of additional hydrogenation is not as signif-icant and therefore the conversion and the amounts ofhydrogenated products change with the fluorine con-

292 H. Kim et al. / Applied Catalysis B: Environmental 44 (2003) 287–299
Table 4HDS of 4,6-DMDBT on the FNiMoX and FCoMoX catalystsa
Catalyst Conversion Amount of product(relative amount) (×10−6 mol cm−3)
DMBP MCHT + DMDCH
FNiMo00 0.52 (1.00) 0.67 (1.00) 1.63 (1.00)FNiMo05 0.54 (1.04) 0.93 (1.39) 1.77 (1.09)FNiMo10 0.58 (1.12) 0.97 (1.45) 1.83 (1.12)FNiMo25 0.62 (1.19) 0.90 (1.34) 2.00 (1.23)FNiMo50 0.63 (1.21) 0.90 (1.34) 2.03 (1.25)
FCoMo00 0.31 (1.00) 0.56 (1.00) 0.88 (1.00)FCoMo05 0.32 (1.03) 0.58 (1.04) 0.91 (1.03)FCoMo10 0.33 (1.06) 0.60 (1.07) 0.95 (1.08)FCoMo25 0.36 (1.16) 0.66 (1.18) 1.02 (1.16)FCoMo50 0.36 (1.16) 0.69 (1.23) 0.99 (1.13)
a Error range of conversions and product amounts is±2%.
tent following the same trend, i.e. they show maximumvalues for an identical catalyst, FCoMo05.
3.3. HDS of 4,6-DMDBT
3.3.1. HDS reactionsTable 4shows that the conversion of 4,6-DMDBT
increases up to 2.5 wt.% of added fluorine, viz. FN-iMo25, and then levels off or slightly increases in thecase of FNiMo50. A similar trend is observed in thecase of the FCoMoX catalysts. However, the productdistribution changes with the fluorine content in dif-ferent manners for the two catalysts. On the FNiMoXcatalysts, DMBP is produced in a maximum amountwhen 1.0 wt.% of fluorine is added and this amountdecreases at higher fluorine contents. On the FCoMoXcatalysts, however, the amount of DMBP increases upto 5.0 wt.% of added fluorine. Hydrogenated products,MCHT+DMDCH, are obtained in larger amounts onNiMo than on CoMo catalysts, which obviously is dueto the high hydrogenation activity of Ni[4,36]. Theamounts of hydrogenated products continuously in-crease with an increase in fluorine content on the FN-iMoX catalysts, but reach a maximum on FCoMo25and then decrease on FCoMo50.
For both types of catalysts, FCoMoX and FNiMoX,fluorine promotes the production of DMBP, obtainedby direct desulfurization of 4,6-DMDBT, to larger ex-tents than that of hydrogenated products, MCHT+DMDCH. The extent of DMBP promotion is alsogreater on FNiMoX than on FCoMoX catalysts. Thereason for this is that the hydrogenation activity of
NiMo catalysts is higher than that of CoMo catalysts,which will be confirmed by our 2,2′-DMBP isomer-ization results inSection 3.3.2, and therefore the sterichindrance exerted by methyl substituents is relativelyeasily alleviated on the former catalysts.
3.3.2. Isomerization of 2,2′-DMBPIn an effort to estimate the extent of migration
of methyl groups in 4,6-DMDBT on acidic sites ofthe catalysts[13], we tested the fluorinated cata-lysts, FNiMoX and FCoMoX, for the conversion of2,2′-DMBP under reaction conditions identical tothat used for the HDS of 4,6-DMDBT. 2,2′-DMBP,instead of 3,3′-DMBP, has been selected as a modelreactant because it has methyl groups closer to eachother than 3,3′-DMBP. In these tests, DMBP iso-mers, which have methyl groups attached to positionsother than the 2,2′-positions, were obtained in smallquantities, and partially hydrogenated MCHT andfully hydrogenated DMDCH were observed as ma-jor products.Table 5shows the overall conversionsof 2,2′-DMBP obtained on different catalysts, whichrepresent the isomerization as well as the hydrogena-tion of 2,2′-DMBP. The conversions increase with theamounts of fluorine added to the catalysts, and theextent of increased conversion is much greater than inthe case of BP hydrogenation, shown inTable 3. As-suming that an enhancement in the rate of 2,2′-DMBPhydrogenation by fluorine addition has been achievedto the same relative extent as that in the case of BPhydrogenation, we may conclude that fluorine alsoenhances the isomerization rate of 2,2′-DMBP, whichis represented by the difference in the conversions of2,2′-DMBP and BP. Accordingly, the data inTable 5
Table 5Conversion of 2,2′-DMBP on the FNiMoX and FCoMoX catalystsa
Catalyst Conversion (%)
FNiMo00 6.5 (1.00)FNiMo05 7.6 (1.17)FNiMo10 9.3 (1.43)FNiMo25 10.0 (1.54)FNiMo50 12.1 (1.86)
FCoMo00 2.3 (1.00)FCoMo05 2.5 (1.09)FCoMo10 3.1 (1.35)FCoMo25 3.7 (1.61)FCoMo50 4.3 (1.89)
a Error range of conversions and product amounts is±2%.

H. Kim et al. / Applied Catalysis B: Environmental 44 (2003) 287–299 293
Fig. 2. Nitric oxide uptake by the FNiMoX/Al2O3 catalysts withdifferent amount of fluorine addition.
indirectly suggest that fluorine promotes the migrationof methyl groups in the ring structure of 4,6-DMDBT,as reported previously[32].
3.4. Characterization
3.4.1. NO chemisorptionFig. 2 shows the amounts of nitric oxide (NO)
chemisorbed to FNiMoX containing different amountsof fluorine. The amount of chemisorbed NO increasesup to 0.5 wt.% of added fluorine, then decreases dra-matically at higher fluorine contents. This trend issimilar to that observed for the HDS of DBT, whichalso shows a maximum conversion when 0.5 wt.% offluorine is added.
NO is known to be adsorbed to the edge or cornersites of MoS2 and to Ni or Co atoms located at theedge sites of MoS2-like structures[37], all of whichare known to be active sites for HDS. A good correla-tion was observed between the number of Ni atoms lo-cated at the edge or corner sites of MoS2 and Ni–Mo–Sstructures claimed to be responsible for the HDS ac-tivity [37]. A correlation was also found between theamount of NO uptake and the extent of metal disper-sion, as confirmed by XPS analysis[38].
The present results indicate that even a smallamount of fluorine brings about an increase in the dis-persion of metal on the catalyst surface, which is theresult of the substitution of surface hydroxyl groupsof Al2O3 by fluoride ions[39,40] and subsequent an-choring of the tetrahedrally coordinated monomericMo species to the surface of Al2O3 [24,41]. On thecontrary, when excess fluorine is added to the cata-lyst, the metal dispersion is significantly decreaseddue to a reduction in the catalyst surface area.
3.4.2. TPRThe TPR pattern of MoO3/Al2O3 (curve (a) in
Fig. 3) shows two major peaks at 600–850 K (peakI) and 1050–1300 K (peak II). Peak I is assigned tothe reduction of octahedrally coordinated, multilayerMo species, while peak II is assigned to the reduc-tion of monolayer Mo species either tetrahedrally oroctahedrally coordinated with Al2O3 [42]. When Niis added to MoO3/Al2O3, both peaks are shifted tolower temperatures, which occurs because added Nicombines with and facilitates the reduction of the Mospecies[43,44].
Fig. 3. TPR patterns of: (a) MoO3/Al2O3; (b) FNiMo00/Al2O3;(c) FNiMo05/Al2O3; (d) FNiMo10/Al2O3; (e) FNiMo25/Al2O3;and (f) FNiMo50/Al2O3.
294 H. Kim et al. / Applied Catalysis B: Environmental 44 (2003) 287–299
When fluorine is added to NiMo/Al2O3, twochanges are observed in the TPR pattern, i.e. thepeak position and the peak area. When the fluorinecontent is increased to 1.0 wt.%, both peaks I andII are shifted to lower temperatures, indicating thatthe reduction of Mo species is facilitated by fluorineaddition. This result also suggests that fluorine hasincreased the dispersion of Mo species on the catalystsuch that the combination of Ni with Mo is promotedand, accordingly, Ni–Mo–O species, which are re-duced at relatively low temperatures, are producedin larger amounts. A similar effect of fluorine wasobserved with Ni-promoted WO3 catalysts[43,45].
When the nominal amount of added fluorine ex-ceeds 2.5 wt.%, the TPR results show a trend differ-ent from the case where smaller amounts of fluorineare added. That is, peak I is shifted back to highertemperatures while peak II continues to be shifted tolower temperatures. This result can be explained asfollows. Peak II, which represents the reduction of themonolayer Mo species, is shifted to lower tempera-tures because fluorine facilitates the formation of theNi–Mo–O species. On the other hand, peak I, whichrepresents the multilayer Mo species, is shifted tohigher temperatures because the surface area of Al2O3is reduced by the addition of an excess of fluorine and,consequently, the particle size of the multilayer Mospecies is increased. As the particle size of the Mospecies increases, it becomes more difficult for hydro-gen atoms to penetrate into the Mo particles and, as aresult, peak I is shifted to higher temperatures.
Another distinctive feature inFig. 3 is the variationin the peak area with fluorine content, viz. the area ofpeak I increases but that of peak II decreases whenthe fluorine content exceeds 2.5 wt.%. As mentionedabove, alumina loses initial surface area by the addi-tion of excessive amounts of fluorine and this makesthe dispersion of the multilayer Mo species very poor.According to the results shown inFig. 3, the tetrahe-drally coordinated Mo species, which are representedby peak II and are responsible for the high HDS activ-ity of the Mo catalysts, appear to be transformed to theoctahedrally coordinated Mo species, which are repre-sented by peak I and are less active for HDS[24,41],at higher fluorine contents. In other words, the Mo dis-persion is increased by fluorine addition up to a levelof 0.5 wt.%, which enhances the extent of reductionand the HDS activity of the Mo species, but is de-
creased when fluorine is added in amounts larger than2.5 wt.% because the multilayer Mo species, whichare reduced to a relatively small extent and have a lowHDS activity, are formed.
Zingg et al.[46] reported that the ratio of octahe-dral to tetrahedral Mo species was increased whenthe MoO3 content was increased, i.e. tetrahedralspecies were preferentially formed at low loadings,below 4 wt.% MoO3, and polymeric molybdates atoctahedral sites were formed at 8 wt.% MoO3. Above20 wt.% MoO3, Al2(MoO4)3 and bulk MoO3 wereproduced. Although the catalyst preparation methodemployed in their study[46] was different from oneused in this study, the trend showing an increase inthe octahedrally coordinated multilayer Mo specieswith a decrease in the Mo dispersion is the same forthe two studies.
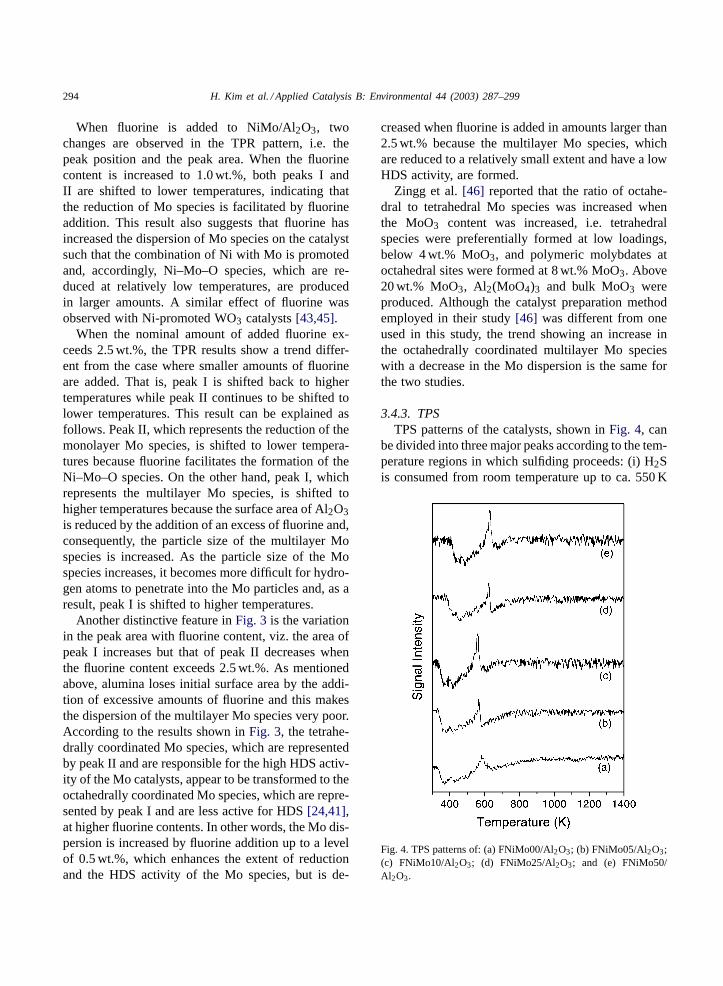
3.4.3. TPSTPS patterns of the catalysts, shown inFig. 4, can
be divided into three major peaks according to the tem-perature regions in which sulfiding proceeds: (i) H2Sis consumed from room temperature up to ca. 550 K
Fig. 4. TPS patterns of: (a) FNiMo00/Al2O3; (b) FNiMo05/Al2O3;(c) FNiMo10/Al2O3; (d) FNiMo25/Al2O3; and (e) FNiMo50/Al2O3.

H. Kim et al. / Applied Catalysis B: Environmental 44 (2003) 287–299 295
due to the sulfidation of the Mo and the Ni species byan O–S exchange reaction (peak I); (ii) H2S is pro-duced at ca. 550 K due to the hydrogenation of sur-face sulfur atoms which are created by the reductionof molybdenum oxysulfides (peak II); and (iii) H2S isconsumed in a broad pattern from 550 up to ca. 900 Kby further sulfidation of the Mo species (peak III). Abroad and weak peak representing H2S consumptionby reaction with NiAl2O4, which was observed at ca.1000 K in a previous study[32], was not observed inthis study. In the sulfidation process, MoO3 is first re-duced to MoO2 and subsequently sulfided to MoS2[47]. According to the TPS mechanism of Mo/Al2O3proposed by Wei et al.[48], the capping oxygen issulfided first and the bridging oxygen in Mo–O–Al isthen replaced by sulfur in the case of a molybdenummonolayer, while, in the case of molybdenum mul-tilayers, oxygen atoms are sulfided following the or-der of capping oxygen in Mo=O, bridging oxygen inMo–O–Mo, and finally bridging oxygen in Mo–O–Al.
When fluorine is added to the catalyst, the TPSpeaks are initially shifted to lower temperatures fol-lowed by a shift to higher temperatures, similar to the
Fig. 5. FTIR spectra of pyridine adsorbed on: (a) Al2O3; (b)FNiMo00/Al2O3; (c) FNiMo05/Al2O3; (d) FNiMo10/Al2O3; (e)FNiMo25/Al2O3; and (f) FNiMo50/Al2O3.
case of the TPR peaks. The sulfidation temperaturebecomes the lowest for FNiMo05. It was suggested ina previous study[32] that fluorine enhances the dis-persion of Mo particles on the catalyst due to a re-duced interaction between Mo and the support, whichfacilitates the sulfidation of the dispersed Mo particles.Arnoldy et al.[49], in their TPS study of MoO3 andCoO supported on Al2O3, proposed that the sulfidationof catalysts with a low metal dispersion is relativelyslow because the rate is limited to a large extent bythe diffusion of sulfur-containing molecules through asulfide layer, which is formed around an oxidic coreof the dispersed particles. On the contrary, in the caseof well dispersed catalysts, the diffusion limitation issmall and sulfidation is largely determined by the in-teraction between Mo and the support. A relation be-tween the sulfidability and HDS activity of Mo-basedcatalysts has been proposed in several previous studies[32,50]. A significant enhancement in HDS activity isobserved with an increase in the sulfidability of theMo–O or Ni–Mo–O phase, which is caused by a re-duced interaction between the Mo-containing phasesand the support.
3.4.4. Pyridine FTIRTypical infrared spectra of pyridine adsorbed on
FNiMoX catalysts are shown inFig. 5. The peak at1540 cm−1 represents Brönsted acid sites and the otherpeaks including the 1450 cm−1 peak are assigned toLewis acid sites[51]. Fig. 5 shows that the numberof Brönsted acid sites is increased by fluorine addi-tion, while the amounts of Lewis acid sites remainnearly constant. This occurs because portions of thesurface hydroxyl groups of Al2O3 are replaced by flu-oride ions, which increases the electronegativity of thesurface and consequently the acidity of the remain-ing hydroxyl groups[39,52–54]. The isomerizationof methyl groups in 4,6-DMDBT is enhanced by thepresence of Brönsted acid sites[55].
4. Discussion
4.1. Reaction mechanism of HDS and the effect offluorine addition
4.1.1. HDS mechanismThe HDS of DBT and 4,6-DMDBT proceeds
via two main pathways (Fig. 6). One is a ‘direct

296 H. Kim et al. / Applied Catalysis B: Environmental 44 (2003) 287–299
Fig. 6. HDS mechanism of DBT and 4,6-DMDBT.
desulfurization’ pathway, in which BP or DMBP isproduced by the hydrogenolysis of the C–S bond. Theother is a ‘hydrogenation (HYD)’ pathway, in whicharomatic rings of DBT compounds are preferentiallyhydrogenated to 4H- or 6H-DBT intermediates andare subsequently desulfurized to CHB or MCHTthrough the hydrogenolysis of the C–S bond[56–58].While the HDS of DBT generally proceeds via DDSroute, that of 4,6-DMDBT mainly proceeds via theHYD route due to the steric hindrance exerted bymethyl groups attached to aromatic rings[7–11].
The rate for the additional conversion of BP orDMBP to CHB or MCHT is usually very slow onCoMo catalysts but becomes significant on NiMo cat-alysts, which have a relatively high hydrogenation ac-tivity [56,59]. This difference in the hydrogenationactivity of two types of catalysts can be verified bycomparing the results of BP hydrogenation on FN-iMo00 and FCoMo00, as shown inTable 3. That is,the conversions on NiMo catalysts are more than five-fold higher than those on CoMo catalysts.
Previous studies have suggested that HYD largelyproceeds at the corner sites of MoS2 species, which aresubject to high unsaturation, whereas DDS proceedsat the edge sites, which are subject to smaller extents
of unsaturation[60–63]. When the dispersion of theMoS2 species in the catalysts increases, corner sitesare produced in larger amounts than edge sites and,consequently, the HYD rates are enhanced to a greaterextent than the DDS rates.
4.1.2. Effect of fluorine additionThe addition of a specific amount of fluorine to
Mo-based catalysts, e.g. 0.5 wt.%, enhances the dis-persion of MoS2 species in the catalysts, as indicatedby the NO chemisorption data (Fig. 2), which leadsto an increase in catalytic activity, particularly for theHYD pathway (Table 2). An increase in the disper-sion of MoS2 species also facilitates the reduction andsulfidation of the metal components, as evidenced bythe TPR and TPS results, which offers an additionalreason for the activity enhancement. However, the ac-tivity is decreased when fluorine is added in excessamounts, e.g. greater than 1.0 wt.%, because Al2O3loses surface area and, accordingly, metal dispersionis decreased[24]. A reduction in the metal dispersionand consequently in the reducibility and sulfidabilityof metal components at high fluorine contents is alsoshown in this study by the results of NO chemisorp-tion, TPR, and TPS.

H. Kim et al. / Applied Catalysis B: Environmental 44 (2003) 287–299 297
In DBT HDS, metal dispersion is the major fac-tor affecting HDS activity but, in the HDS of 4,6-DMDBT, the activity is additionally affected by cata-lyst acidity, which promotes the migration of methylgroups in the ring structure and consequently reducesthe steric hindrance exerted by the substituents. Asa result, fluorine addition increases the amounts ofDDS product, DMBP, to a greater extent than thoseof HYD products, MCHT+ DMDCH, in the HDS of4,6-DMDBT, which is contrary to the case of DBTHDS. Increased amounts of Brönsted acid sites andthe migration of methyl groups on fluorinated cata-lysts have been verified in this study, as evidenced bypyridine IR and 2,2′-DMBP isomerization.
4.2. Comparison of NiMo and CoMo catalysts
4.2.1. HDS of DBTIn the HDS of DBT, the activity changes with flu-
orine content showing a maximum at 0.5 wt.% forboth FNiMoX and FCoMoX, but the product distribu-tion changes showing different trends with the fluorinecontent depending on the catalysts. In the case of theNiMo catalysts, the maximum amount of BP is ob-tained at 0.5 wt.% fluorine but that of CHB+ DCH isobtained at 1.0 wt.% fluorine. These results are in con-trast to those obtained for CoMo catalysts, which showthe maximum amounts of both BP and CHB at a fluo-rine content of 0.5 wt.%. The different trends betweentwo types of catalysts are caused by the high hydro-genation activity of NiMo catalysts, which promotesthe additional hydrogenation of BP to CHB+ DCH[56,59]. On the other hand, CoMo catalysts have a rel-atively low hydrogenation activity and consequentlythe amounts of BP additionally converted to CHB areinsignificant.
The effect of different hydrogenation activities ofthe NiMo and CoMo catalysts on product distribu-tion is also observed in BP hydrogenation (Table 3).On NiMo catalysts, CHB is produced in a maximumamount at a fluorine content of 1.0 wt.% but theamount of DCH is continuously increased even whenthe amount of fluorine is greater than 1.0 wt.%. Theseresults are in contrast to those obtained for CoMocatalysts, in which both products are obtained inmaximum amounts at a fluorine content of 0.5 wt.%.The result showing that the hydrogenation activity ofNiMo catalysts is enhanced even when the catalyst
surface area is lowered at fluorine contents higher than1.0 wt.% can be attributed to the increased acidity ofthe catalysts[64]. In other words, acidic sites gener-ated in the catalysts by fluorine addition promote thehydrogenation of BP to CHB, which is followed bythe further hydrogenation of CHB to DCH, particu-larly on NiMo catalysts, even when the dispersion ofMoS2 on alumina is decreased.
4.2.2. HDS of 4,6-DMDBTIn the HDS of 4,6-DMDBT, the activity of FNiMoX
and FCoMoX increases up to 2.5 wt.% of added flu-orine and levels off at larger fluorine contents. Theconversion is higher for FNiMoX than for FCoMoXbecause the former has a higher hydrogenation ac-tivity. The amounts of both DMBP and MCHT+DMDCH are increased until fluorine is added to opti-mum levels because fluorine enhances the migration ofmethyl groups, eventually enhancing the DDS route,as well as the hydrogenation activity which promotesHYD products, as explained above.
It is noteworthy, however, that DMBP is obtainedin maximum amounts at a fluorine content of 1.0 wt.%for the NiMo catalysts, i.e. on FNiMo10, while it is ob-tained at 5.0 wt.% for CoMo catalysts, on FCoMo50.These results are in contrast to the case of the HYDproducts, MCHT+ DMDCH, which are obtained inmaximum amounts on FNiMo50 and FCoMo25, re-spectively. The reason for why fluorine contents toyield the maximum amounts of either the DDS orHYD products are different depending on the catalystscan be explained as follows.
The DDS route is enhanced by fluorine addition toa greater extent on CoMo catalysts than on NiMo cat-alysts, which is verified by comparing the conversionsof BP (Table 3) and 2,2′-DMBP (Table 5) obtained onthe two types of catalysts. On FNiMo50, the BP con-version, which is achieved by the hydrogenation ofBP and therefore represents the HYD activity of thecatalyst, is increased by 12% while the 2,2′-DMBPconversion, which is achieved by the combined hydro-genation and isomerization of 2,2′-DMBP and there-fore represents the combined activity for the HYD andDDS routes, is increased by 86%. Accordingly, the netincrease in DDS activity by the addition of 5.0 wt.%fluorine to the NiMo catalyst corresponds to 74%.
On the other hand, on FCoMo50, the BP conversionis decreased by 34% while the 2,2′-DMBP conversion

298 H. Kim et al. / Applied Catalysis B: Environmental 44 (2003) 287–299
is increased by 89%, indicating that the net increasein the DDS activity corresponds to 123%. Althoughit can be argued that the difference in the conversionsof BP and 2,2′-DMBP obtained in this study does notexactly represent the extent of the DDS enhancement,the above results demonstrate that the DDS activity isincreased by fluorine addition to a greater extent onthe FCoMoX than the FNiMoX catalysts.
As a result, the amounts of DMBP obtained onCoMo catalysts increase with an increase in fluorinecontent, up to as large as 5.0 wt.%, in spite of the factthat the catalyst surface and, accordingly, the extentof MoS2 dispersion, is significantly decreased at largefluorine contents. In the case of FNiMoX, the amountof DMBP changes showing a maximum at a fluorinecontent of 1.0 wt.% because an increase in DDS ac-tivity by fluorine addition is cancelled by a decreasein the MoS2 dispersion and eventually the latter be-comes a major determinant for the amounts of DMBPproduced on NiMo catalysts at fluorine contents largerthan 1.0 wt.%.
It has been explained above that fluorine enhancesthe HYD activity of NiMo catalysts to a greater extentthan that of CoMo catalysts. Accordingly, this explainsthe reason for why the amounts of HYD products in-crease on NiMo catalysts up to 5.0 wt.% of added flu-orine while the amounts decrease on CoMo catalystsfor fluorine contents larger than 2.5 wt.%.
5. Conclusion
Fluorine addition to NiMo/Al2O3 modifies two ma-jor properties of the catalysts: metal dispersion andcatalyst acidity. In the HDS of DBT, the catalytic ac-tivity is enhanced due to an increase in metal disper-sion, which facilitates the reduction and sulfidation ofthe Mo species, up to 0.5 wt.% of added fluorine, andis lowered by further fluorine addition because the cat-alyst significantly loses initial surface area under thiscondition. In the HDS of 4,6-DMDBT, the catalyticactivity is enhanced in parallel with added fluorine upto a content of 5.0 wt.% because the facilitated mi-gration of methyl groups in the ring structure due toan increase in the amounts of acidic sites becomes amajor determinant in the overall HDS rates.
Optimum fluorine contents for yielding the max-imum amounts of either the hydrogenated or the
direct-desulfurized products are different depend-ing on the reactants, DBT or 4,6-DMDBT, and thecatalysts, NiMo/Al2O3 or CoMo/Al2O3. The charac-teristic changes in the product distribution with thefluorine contents of the catalysts can be explainedby considering relative contributions of two majorpathways of HDS, HYD and DDS, to the productdistribution for different combined cases of reactantsand catalysts.
The HDS of DBT is affected to a greater ex-tent by the HYD activity than by the DDS activity,while an opposite trend is observed with the HDS of4,6-DMDBT. In addition, NiMo/Al2O3 has a higherHYD activity and is less affected by methyl-groupmigration in the DBT ring structure, which enhancesDDS activity, over that of CoMo/Al2O3.
Acknowledgements
This work was supported by R&D ManagementCenter for Energy and Resources, Brain Korea 21project, and National Research Laboratory program.
References
[1] K.G. Knudsen, B.H. Cooper, H. Topsøe, Appl. Catal. A 189(1999) 205.
[2] W. Min, Korean J. Chem. Eng. 19 (2002) 601.[3] D.W. Kim, D.K. Lee, S.K. Ihm, Korean J. Chem. Eng. 19
(2002) 587.[4] R. Shafi, G.J. Hutchings, Catal. Today 59 (2000) 423.[5] Q. Zhang, A. Ishihara, T. Kabe, J. Jpn. Pet. Inst. 39 (1996)
410.[6] X. Ma, K. Sakanishi, T. Isoda, I. Mochida, Hydrotreating
Technology for Pollution Control, Marcel Dekker, New York,1996.
[7] X. Ma, K. Sakanishi, I. Mochida, Ind. Eng. Chem. Res. 33(1994) 218.
[8] V. Meille, E. Schulz, M. Lemaire, M. Vrinat, Appl. Catal. A131 (1995) 143.
[9] V. Meille, E. Schulz, M. Lemaire, M. Vrinat, J. Catal. 170(1997) 29.
[10] M. Houalla, D.H. Broderick, A.V. Sapre, N.K. Nag, V.H.J.de Beer, B.C. Gates, H. Kwart, J. Catal. 61 (1980) 523.
[11] F. Bataille, J.L. Lemberton, P. Michaud, G. Pérot, M. Vrinat,M. Lemaire, E. Schulz, M. Breysse, S. Kasztelan, J. Catal.191 (2000) 409.
[12] J.L.G. Fierro, R. Cuevas, J. Ramirez, A.L. Agudo, Bull. Soc.Chim. Belg. 100 (1991) 945.
[13] C. Papadopoulou, C. Kordulis, A. Lycourghiotis, React. Kinet.Catal. Lett. 33 (1987) 259.

H. Kim et al. / Applied Catalysis B: Environmental 44 (2003) 287–299 299
[14] C. Papadopoulou, A. Lycourghiotis, P. Grange, B. Delmon,Appl. Catal. 38 (1988) 255.
[15] Z. Sarbak, S.L.T. Andersson, Appl. Catal. 69 (1991) 235.[16] H.K. Matralis, A. Lycourghiotis, P. Grange, B. Delmon, Appl.
Catal. 38 (1988) 273.[17] M. Ternan, Can. J. Chem. Eng. 61 (1983) 133.[18] C. Muralidhar, F.E. Massoth, J. Shabtai, J. Catal. 85 (1984)
44.[19] P.M. Boorman, J.F. Kriz, Z.R. Brown, M. Ternan, in:
Proceedings of the Eighth International Congress on Catalysis,vol. II, Verlag Chemie, Berlin, 1984, 281 pp.
[20] J.M. Lewis, R.A. Kydd, P.M. Boorman, J. Catal. 120 (1989)413.
[21] P.M. Boorman, K. Chong, R.A. Kydd, J.M. Lewis, J. Catal.128 (1991) 537.
[22] B.C. Gates, H. Topsøe, Polyhedron 16 (1997) 3213.[23] C. Kwak, J.J. Lee, J.S. Bae, S.H. Moon, Appl. Catal. B 35
(2001) 59.[24] H. Matralis, C. Papadopoulou, A. Lycourghiotis, Appl. Catal.
A 116 (1994) 221.[25] N.Y. Topsøe, H. Topsøe, J. Catal. 75 (1982) 354.[26] T.A. Bordero, C.H. Bartholomew, J. Catal. 84 (1983) 143.[27] S.H. Moon, M. Windawi, J.R. Katzer, Ind. Eng. Chem.
Fundam. 20 (1981) 396.[28] R.I. Declerk-Grimee, P. Canneson, R.M. Friedman, J.J.
Fripiat, J. Phys. Chem. 82 (1978) 885.[29] F.P.J.M. Kerkhof, H.J. Reitsma, J.A. Moulijn, React. Kinet.
Catal. Lett. 7 (1977) 15.[30] P.M. Boorman, R.A. Kydd, T.S. Sorensen, K. Chong, J.M.
Lewis, W.S. Bell, Fuel 71 (1992) 87.[31] F.M. Mulcahy, M. Houalla, D.M. Hercules, J. Catal. 139
(1993) 72.[32] C. Kwak, J.J. Lee, J.S. Bae, K. Choi, S.H. Moon, Appl. Catal.
A 200 (2000) 233.[33] C.J. Song, C. Kwak, S.H. Moon, Catal. Today 74 (2002)
193.[34] C. Kwak, S.H. Moon, Korean J. Chem. Eng. 16 (5) (1999)
608.[35] K. Sakanishi, T. Nagamatsu, I. Mochida, D.D. Whitehurst, J.
Mol. Catal. A 155 (2000) 101.[36] J. Ramirez, R. Cuevas, A.L. Agudo, S. Mendioroz, J.L.G.
Fierro, Appl. Catal. 57 (1990) 223.[37] N.Y. Topsøe, H. Topsøe, J. Catal. 84 (1983) 386.[38] L. Portela, P. Grange, B. Delmon, Catal. Rev. Sci. Eng. 37
(1995) 699.
[39] P.M. Boorman, R.A. Kydd, Z. Sarbak, A. Somogyvari, J.Catal. 96 (1985) 115.
[40] A. Corma, V. Fornes, E. Ortega, J. Catal. 92 (1985) 284.[41] J. Ramirez, R. Cuevas, L. Gasque, M. Vrinat, M. Breysse, J.
Catal. 71 (1991) 351.[42] P. Arnoldy, M.C. Franken, B. Scheffer, J.A. Moulijn, J. Catal.
96 (1985) 381.[43] B. Scheffer, P. Molhoek, J.A. Moulijn, Appl. Catal. 46 (1989)
11.[44] J.L. Brito, J. Laine, J. Catal. 139 (1993) 540.[45] C.H. Kim, W.L. Yoon, I.C. Lee, S.I. Woo, Appl. Catal. A
144 (1996) 159.[46] D.S. Zingg, L.E. Makovsky, R.E. Tischer, F.R. Brown, D.M.
Hercules, J. Phys. Chem. 84 (1980) 2898.[47] B. Scheffer, P.J. Mangnus, J.A. Moulijn, J. Catal. 121 (1990)
18.[48] Z. Wei, Q. Xin, G. Xiong, Catal. Lett. 15 (1992) 255.[49] P. Arnoldy, J.A.M. Van Den Heijkant, G.D. De Bok, J.A.
Moulijn, J. Catal. 92 (1985) 35.[50] B. Scheffer, P. Arnoldy, J.A. Moulijn, J. Catal. 112 (1988)
516.[51] Z. Sarbak, Appl. Catal. A 164 (1997) 13.[52] P.O. Scokart, S.A. Selim, J.P. Damon, P.G. Rouxhet, J. Colloid
Interface Chem. 70 (1979) 209.[53] J.R. Peri, J. Phys. Chem. 69 (1965) 211.[54] A. Corma, V. Fornes, F. Melo, Appl. Catal. 61 (1990) 175.[55] B.C. Gates, J.R. Katzer, G.C.A. Schuit (Eds.), Chemistry of
Catalytic Processes, McGraw-Hill, New York, 1979.[56] H. Farag, D.D. Whitehurst, K. Sakanishi, I. Mochida, Catal.
Today 50 (1999) 49.[57] M.L. Vrinat, Appl. Catal. 6 (1983) 137.[58] M. Houalla, N.K. Nag, A.V. Sapre, D.H. Broderick, B.C.
Gates, AIChE J. 24 (1978) 1015.[59] D.D. Whitehurst, H. Farag, T. Nagamatsu, K. Sakanishi, I.
Mochida, Catal. Today 45 (1998) 299.[60] H. Topsøe, B.S. Clausen, F.E. Massoth, in: J.R. Anderson,
M. Boudart (Eds.), Catalysis Science and Technology, vol.11, Springer-Verlag, Berlin, 1996.
[61] J.V. Lauritsen, S. Helveg, E. Lægsgaard, B.S. Clausen, H.Topsøe, F. Besenbacher, J. Catal. 197 (2001) 1.
[62] M. Daage, R.R. Chianelli, J. Catal. 149 (1994) 414.[63] S. Kasztelan, H. Toulhoat, J. Grimblot, J.P. Bonnelle, Appl.
Catal. 13 (1984) 127.[64] M. Breysse, M. Cattenot, V. Kougionas, J.C. Lavalley, F.
Mauge, J.L. Portefax, J.L. Zotin, J. Catal. 168 (1997) 143.