hydrocarbon occurrences in the cooper and eromanga … (1990) suggested episodic reactivation of the...
TRANSCRIPT
Geological Society 0/ MalaYJia - Circum-Pacific CoU//C/i lor Energy and Jfi.neral &Jourcu T (Ctonic Framework and Energy &iourc(J 0/ tbe We"tern Margin of tbe Pacific lJa.Jin November 27 - December 2, 1992, Kuala Lumpur, Malay"ia
Hydrocarbon occurrences in the Cooper and Eromanga basins in central Australia
J.PARAN
Sagasco Resources Limited 60 Hindmarsh Square
GPO Box 2576 Adalaide South Australia 5001
Abstract: The Cooper and Eromanga basins comprise the largest and most prolific onshore hydrocarbon province in Australia with hydrocarbons occurring in almost all stratigraphic levels and in a variety of structural and stratigraphic traps.
The stratigraphy and differing tectonic models proposed to explain the structural setting of these basins and the principal geological controls which effect the trapping and distribution of oil and gas are reviewed.
Hydrocarbon discoveries made to date total some 5 trillion cubic feet of gas in about 100 gas fields and 300 million barrels of recoverable oil in about 110 oil fields. New and advanced exploration technologies are being applied in an effort to overcome production decline.
The variety of play types, proven productivity within a thick geologic succession from the prePermian to Cretaceous and the unusual complexity of hydrocarbon migration pathways within these basins beckon the creative explorationist who will, no doubt, continue to discover more oil and gas.
INTRODUCTION
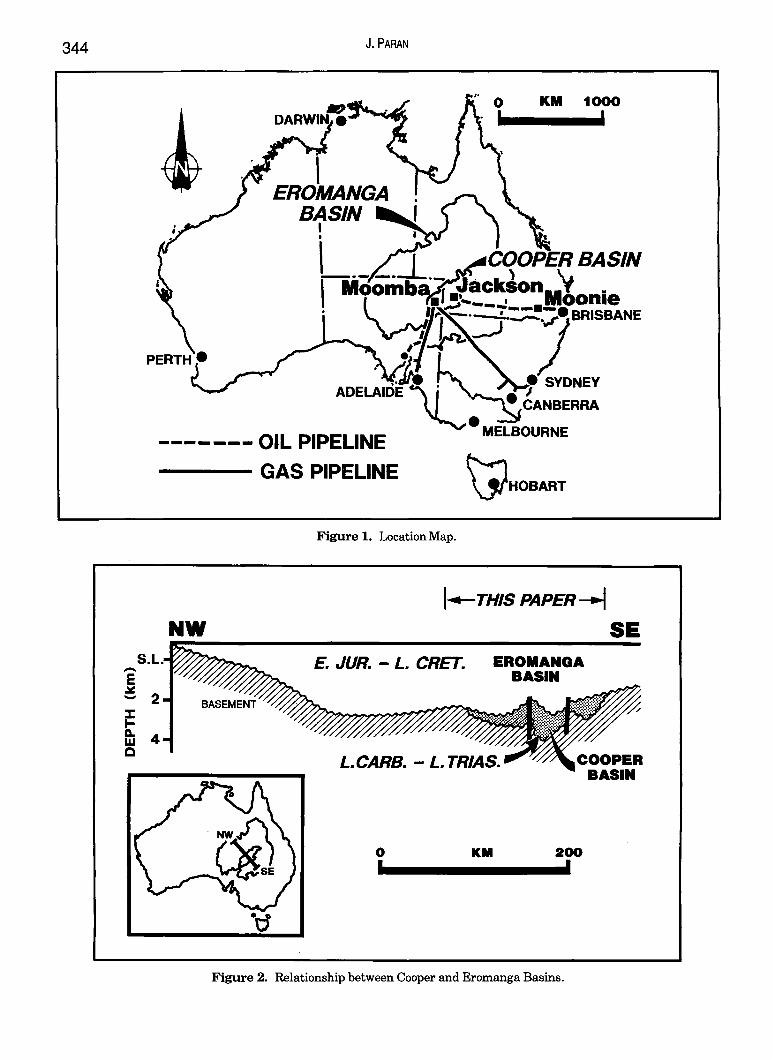
The Cooper and Eromanga basins are located in central Australia and cover some 130,000 km2
and 1,000,000 km2 respectively (Fig. 1). The area has been actively explored since 1954 when the company SANTOS Limited fIrst acquired an oil exploration licence. Significant milestones in the exploration history of these basins include the fIrst commercial Cooper Basin gas discovery in 1963, the first major Cooper Basin oil discovery in 1969 and the first major Eromanga Basin oil discovery in 1978.
To date recoverable reserves of about 5.5 trillion cubic feet of gas and 300 million barrels of oil have been proven to exist in 120 gas fields and 110 oil fIelds, including the largest onshore gas and oil fIelds in Australia. These basins currently produce about 170 BCF (billion cubic feet) of sales gas and 18 million barrels of oil and condensate and 490,000 tonnes of liquefied petroleum gas per annum.
The Cooper and Eromanga basins have proven to be the most prospective onshore basins in Australia, with development investment exceeding A$4 billion dollars (in 1988 dollars) over the last twenty years. Major developments in South Australia include the construction of the Moomba Gas and Liquids Plant and pipelines to Sydney and Adelaide and the Port Bonython liquids plant to handle crude oil and condensate.
Geol. Soc. MaLaYJia, BuLLetin 33, November 1993; pp. 343-356
The discovery of the Jackson oil field in Queensland led to development of the Jackson oil facility and the construction of a pipeline to Brisbane. The prolific Permian gas fields in the southwest Queensland portion of the Cooper Basin will be the centre of further development involving the construction of another gas processing facility at Ballera, and a pipeline to Moomba in South Australia.
Exploration and development activity in the area is expected to continue for many more years as these basins continue to supplement the energy demands of the country, particularly the States of South Australia and Queensland.
This paper reviews the geology of the Cooper and Eromanga basins and highlights the principal geological controls which effect the trapping and distribution of oil and gas.
GEOLOGICAL SETTING
The Cooper Basin is an infra-basin below the Eromanga Basin and includes sediments ranging from Late Carboniferous to Late Triassic in age (Fig. 2). The Eromanga Basin is part of the larger Great Artesian Basin and consists of sediments from Early Jurassic to Late Cretaceous in age. Cambro-Ordovician sediments sub crop the Cooper Basin and, in its absence, the Eromanga Basin, and is generally regarded as the economic basement
344 J.PARAN
,..,. 0 KM 1000 ,
, EROMANGA
BASIN I • I ,
L. __ .~~CqOPER BASIN , Moomb -, .~aCksonM':i . L ~ • .-: .... --~ oonle . ~j;':J'~)BRISBANE
ADELAlDf'\(-N 1 SYDNEY • CANBERRA
• _______ OIL PIPELINE MELBOURNE
NW
GAS PIPELINE M \JIHOBART
Figure 1. Location Map.
1..-THIS PAPER-.j
SE E. JUR. - L. CRET. EROMANGA
L. CARB. - L. TRIAS.
o , KM
BASIN
200 ,
Figure 2. Relationship between Cooper and Eromanga Basins.
HYDROCARBON OCCURRENCES IN THE COOPER AND EROMANGA BASINS IN CENTRAL AUSTRALIA 345
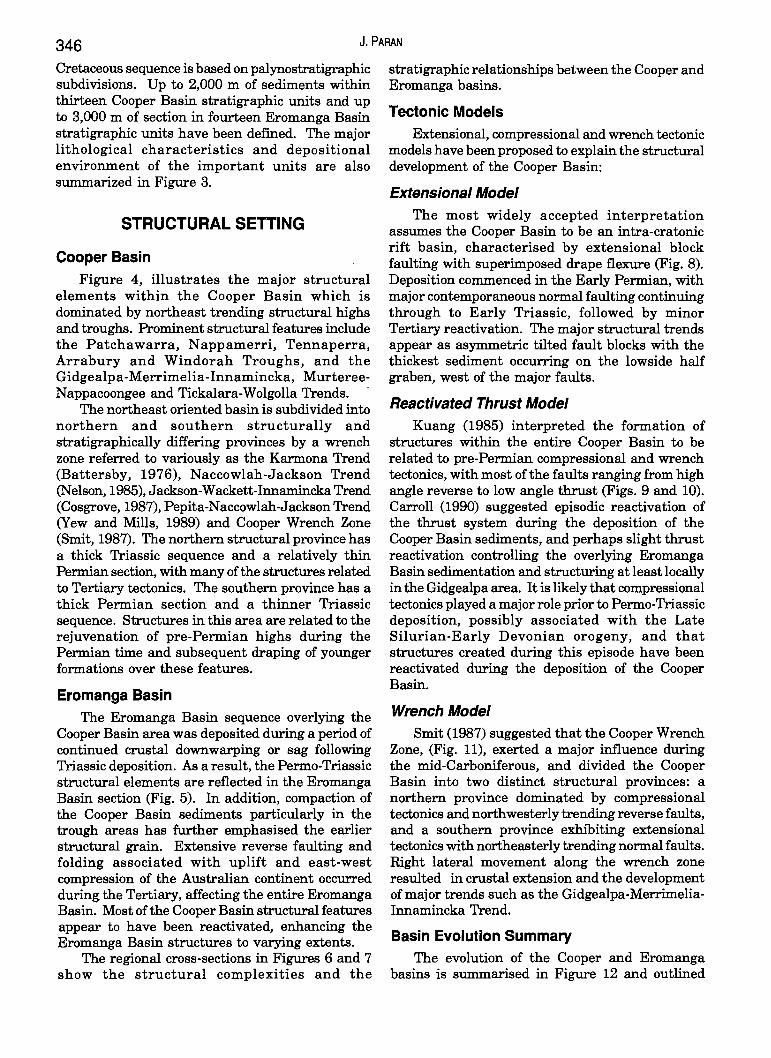
Stratigraphy even though significant oil and gas flows have been recorded from fractured reservoirs. This paper only deals with the Cooper Basin and that portion of the Eromanga Basin directly overlying the Cooper Basin, due to the close structural and prospectivity inter-relationships.
The stratigraphy of the Cooper and Eromanga basins, summarized in Figure 3, is well documented (Battersby, 1976; Thornton, 1979). The stratigraphic framework of the Permian to
&ASIN GEOLOGICAL LITH SONIC AGE STRAnGRAPHY
G.R. LATE
" ...... : I~ ~ WINTON FM
1M 1M ~ MACKUNDA FM .. -::..--:.....: "( OODNADATTA FM
" CRETACEOUS •••• 0 ss·
EARLY 1M 1M
< Z 1M BULLDOG SHALE '1- :::: .. \ 1M 1M \ CADNA OWIE FM
IE ---.. {. MURTA MBR 0 ••• 0, MOOGA
LATE .... •• 0 ••
FM NAMUR SST II: .... · '" ...
JURASSIC · .. III -3~ .. ~ { BIRKHEAD FM MIDDLE - 1M
C··· { HUTTON SST EARLY ~ -= POOLOWANNA FM
LATE .{~-=-..... TRIASSIC MIDDLE ~ NAPPAMERRI
~ GROUP EARLY --
.~ .. ;-;
LATE ~ ~ TOOLACHEE FM ~ -~ DARALINGIE BEDS
II: R~ ROSENEATH FM I~····· III .. ~.:;..
c:::: EPSILON FM ~ A. ~-- MURTEREE SHALE 0 ~--
PERMIAN : :ft.:: 0 EARLY ...!
... () --
----- PATCHAWARRA
..... .... FM -
'0 •• -•• '0.
PRE- · .. w,.
PERMIAN ..... ..... TIRRAWARRA SST
\ .....
.. S- i lII~R~I]lELJA F~. ~
., BA"§EMENT
t:::-:::·.>.ISANDSTONE 0 SILTSTONE ~ COAL
E=---~J SHALE _ MAINLY METASEDIMENTS
DEPOSITIONAL HYDRG-
ENYIRONMENT CARBON OCCUR.
FLUVIO-LACUSTRINE
PARALIC
OPEN MARINE STRANDLINE 3;f
SHALLOW MARINE
DELTAIC • LACUSTRINE •
• 3;f FLUVIO-
LACUSTRINE • ~
BRAIDED FLUVIAL • ~
FLUVIAL • ~
FLUVIO-LACUSTRINE • 3;f
FLUVIAL • ~ FLUVIAL ~
LACUSTRINE
FLUVIO-"* DELTAIC
LACUSTRINE
FLUVIAL • * FLUVIAL • * GLACIAL
MINOR MAJOR • • OIL
~ * GAS
Figure 3. Stratigraphy of Cooper and Eromanga Basins.
346 J.PARAN
Cretaceous sequence is based on palynostratigraphic subdivisions. Up to 2,000 m of sediments within thirteen Cooper Basin stratigraphic units and up to 3,000 m of section in fourteen Eromanga Basin stratigraphic units have been defined. The major lithological characteristics and depositional environment of the important units are also summarized in Figure 3.
STRUCTURAL SETTING
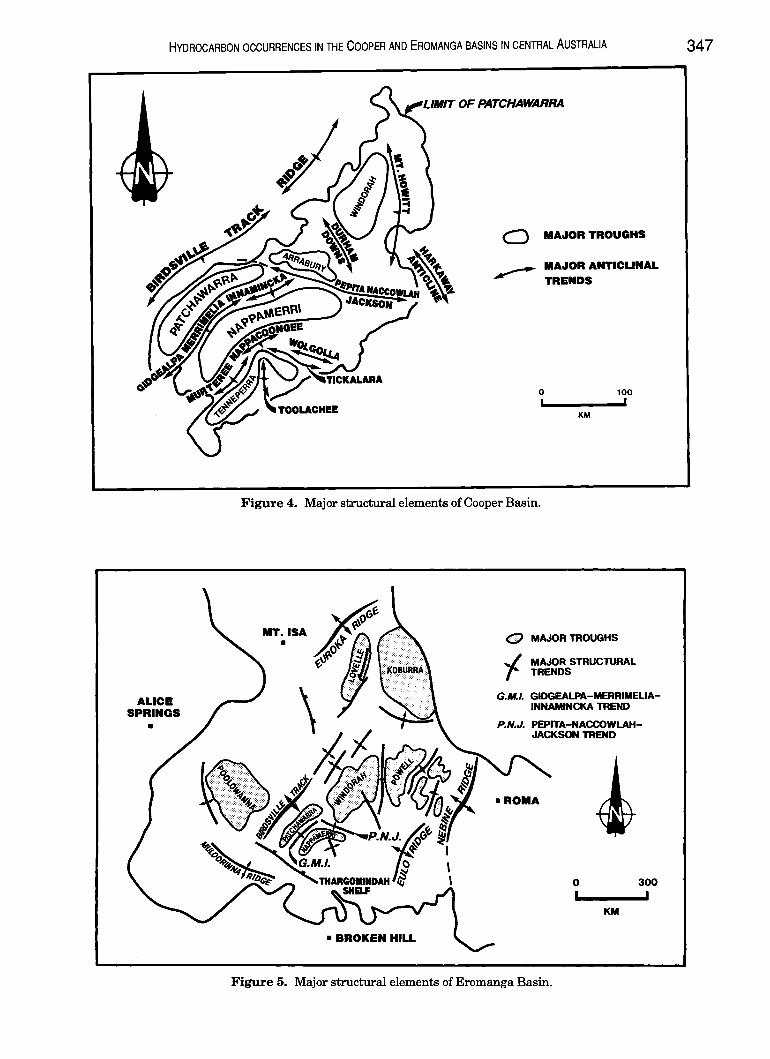
Cooper Basin Figure 4, illustrates the major structural
elements within the Cooper Basin which is dominated by northeast trending structural highs and troughs. Prominent structural features include the Patchawarra, Nappamerri, Tennaperra, Arrabury and Windorah Troughs, and the Gidgeal pa -Merrimelia -Innamincka, M urtereeNappacoongee and Tickalara-Wolgolla Trends. .
The northeast oriented basin is subdivided into northern and southern structurally and stratigraphically differing provinces by a wrench zone referred to variously as the Karmona Trend (Battersby, 1976), Naccowlah-Jackson Trend (Nelson, 1985), Jackson-Wackett-Innamincka Trend (Cosgrove, 1987), Pepita-Naccowlah-Jackson Trend (Yew and Mills, 1989) and Cooper Wrench Zone (Smit, 1987). The northern structural province has a thick Triassic sequence and a relatively thin Permian section, with many ofthe structures related to Tertiary tectonics. The southern province has a thick Permian section and a thinner Triassic sequence. Structures in this area are related to the rejuvenation of pre-Permian highs during the Permian time and subsequent draping of younger formations over these features.
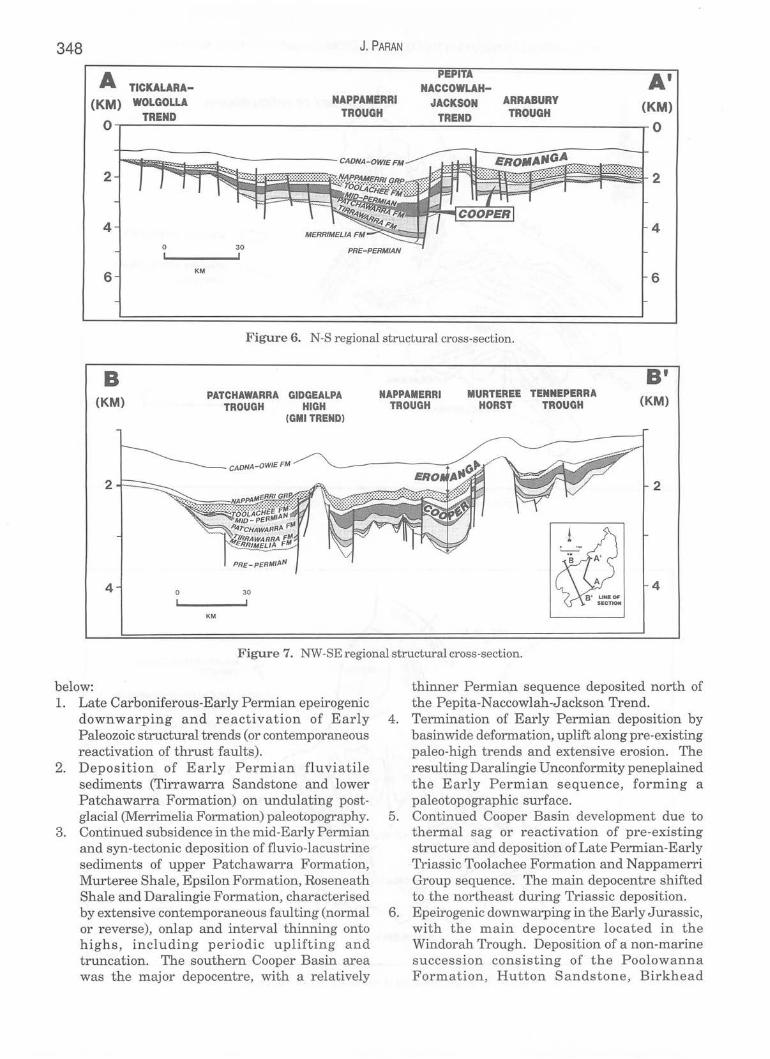
Eromanga Basin The Eromanga Basin sequence overlying the
Cooper Basin area was deposited during a period of continued crustal downwarping or sag following Triassic deposition. As a result, the Permo-Triassic structural elements are reflected in the Eromanga Basin section (Fig. 5). In addition, compaction of the Cooper Basin sediments particularly in the trough areas has further emphasised the earlier structural grain. Extensive reverse faulting and folding associated with uplift and east-west compression of the Australian continent occurred during the Tertiary, affecting the entire Eromanga Basin. Most of the Cooper Basin structural features appear to have been reactivated, enhancing the Eromanga Basin structures to varying extents.
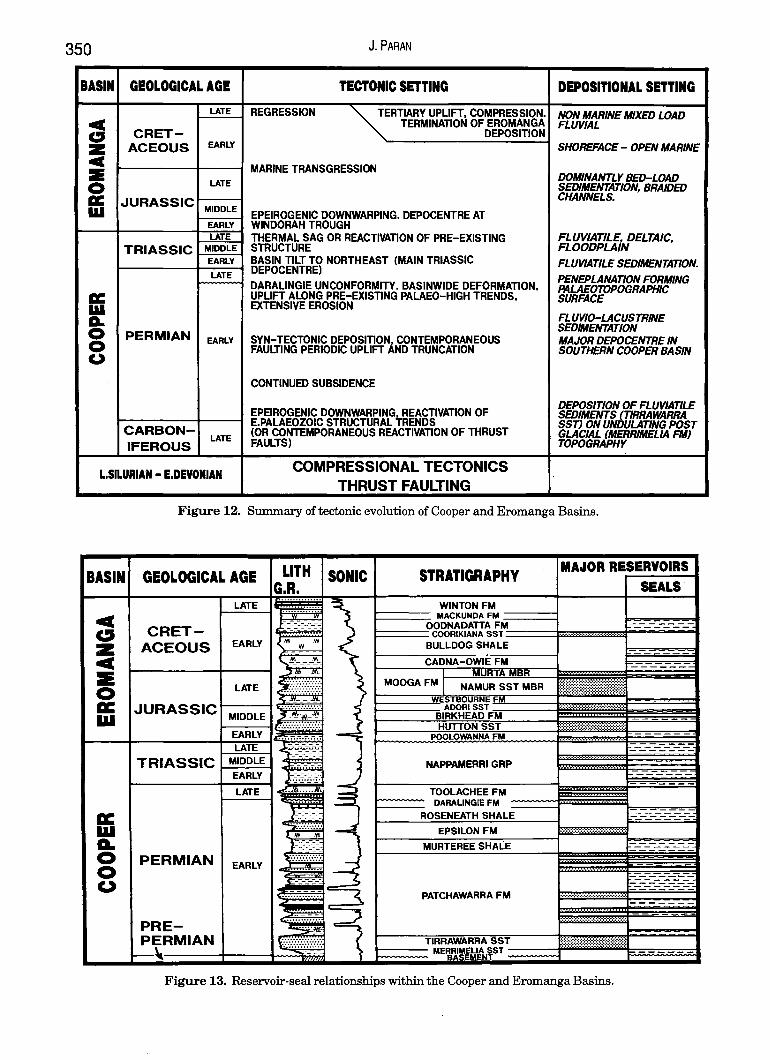
The regional cross-sections in Figures 6 and 7 show the structural complexities and the
stratigraphic relationships between the Cooper and Eromanga basins.
Tectonic Models Extensional, compressional and wrench tectonic
models have been proposed to explain the structural development of the Cooper Basin:
Extensional Model
The most widely accepted interpretation assumes the Cooper Basin to be an intra-cratonic rift basin, characterised by extensional block faulting with superimposed drape flexure (Fig. 8). Deposition commenced in the Early Permian, with major contemporaneous normal faulting continuing through to Early Triassic, followed by minor Tertiary reactivation. The major structural trends appear as asymmetric tilted fault blocks with the thickest sediment occurring on the lowside half graben, west of the major faults.
Reactivated Thrust Model
Kuang (1985) interpreted the formation of structures within the entire Cooper Basin to be related to pre-Permian compressional and wrench tectonics, with most of the faults ranging from high angle reverse to low angle thrust (Figs. 9 and 10). Carroll (1990) suggested episodic reactivation of the thrust system during the deposition of the Cooper Basin sediments, and perhaps slight thrust reactivation controlling the overlying Eromanga Basin sedimentation and structuring at least locally in the Gidgealpa area. It is likely that compressional tectonics played a major role prior to Permo-Triassic deposition, possibly associated with the Late Silurian-Early Devonian orogeny, and that structures created during this episode have been reactivated during the deposition of the Cooper Basin.
Wrench Model
Smit (1987) suggested that the Cooper Wrench Zone, (Fig. 11), exerted a major influence during the mid-Carboniferous, and divided the Cooper Basin into two distinct structural provinces: a northern province dominated by compressional tectonics and northwesterly trending reverse faults, and a southern province exhibiting extensional tectonics with northeasterly trending normal faults. Right lateral movement along the wrench zone resulted in crustal extension and the development of major trends such as the Gidgealpa-MerrimeliaInnamincka Trend.
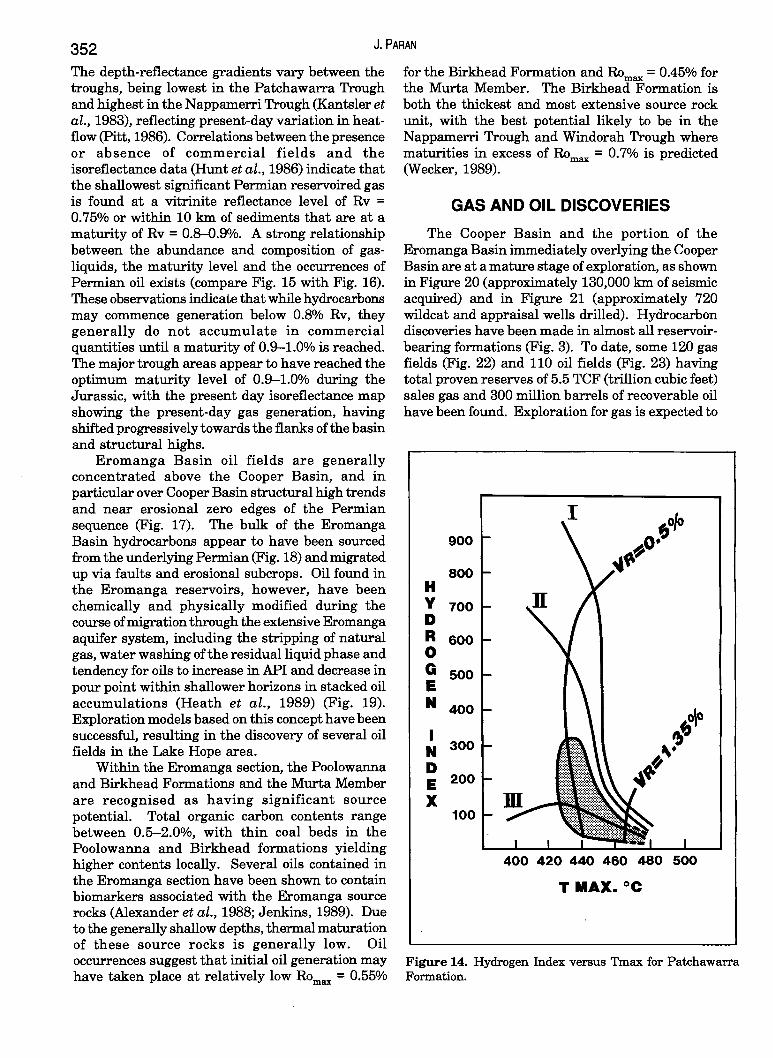
Basin Evolution Summary The evolution of the Cooper and Eromanga
basins is summarised in Figure 12 and outlined
HYDROCARBON OCCURRENCES IN THE COOPER AND EROMANGA BASINS IN CENTRAL AUSTRALIA
ALICE SPRINGS
-
LIM" OF PATCHAWARRA
o MAJOR TROUGHS
~ MAJOR ANTICLINAL TRENDS
o
Figure 4. Major structural elements of Cooper Basin.
KM
100 ,
o MAJOR TROUGHS
J MAJOR STRUCTURAL r TRENDS
G.M.I. GIDGEALPA-MERRIMEUAINNAMINCKA TREND
P.N.J. PEPITA-NACCOWlAHJACKSON TREND
-ROMA
o 300
KM
Figure 5. Major structural elements of Eromanga Basin.
347
348 J. PARAN
A PEPITA A' TICKALARA- NACCOWLAH-
(KM) WOLGOLLA NAPPAMERRI JACKSON ARRABURY (KM) TREND TROUGH TREND TROUGH
0 0
---- --- CADNA - OWIEFM
2
4 4 o I
30 I
PRE- PERMIAN
6 KM
6
Figure 6. N-S regional structural cross-section.
a (KM)
PATCHAWARRA GIDGEALPA TROUGH HIGH
(GMI TREND)
CADNA-DWIE FM
PRE_PERMIAN
4 o 30
KM
NAPPAMERRI TROUGH
MURTEREE TENNEPERRA HORST TROUGH
a l
(KM)
2
4
Figure 7. NW -SE regional structural cross-section.
below: 1. Late Carboniferous-Early Permian epeirogenic
downwarping and reactivation of Early Paleozoic structural trends (or contemporaneous reactivation of thrust faults) .
2. Deposition of Early Permian fluviatile sediments (Tirrawarra Sandstone and lower Patchawarra Formation) on undulating postglacial (Merrimelia Formation) paleotopography.
3. Continued subsidence in the mid-Early Permian and syn-tectonic deposition of fluvio-Iacustrine sediments of upper Patchawarra Formation, Murteree Shale, Epsilon Formation, Roseneath Shale and Daralingie Formation, characterised by extensive contemporaneous faulting (normal or reverse), onlap and interval thinning onto highs, including periodic uplifting and truncation. The southern Cooper Basin area was the major depocentre, with a relatively
thinner Permian sequence deposited north of the Pepita-Naccowlah-Jackson Trend.
4. Termination of Early Permian deposition by basinwide deformation, uplift along pre-existing paleo-high trends and extensive erosion. The resulting Daralingie Unconformity peneplained the Early Permian sequence, forming a paleotopographic surface.
5. Continued Cooper Basin development due to thermal sag or reactivation of pre-existing structure and deposition of Late Permian-Early Triassic Toolachee Formation and Nappamerri Group sequence. The main depocentre shifted to the northeast during Triassic deposition.
6. Epeirogenic downwarping in the Early Jurassic, with the main depocentre located in the Windorah Trough. Deposition of a non-marine succession consisting of the Poolowanna Formation, Hutton Sandstone, Birkhead

NW PATCHAWARRA GMI NAPPAIIERRI TROUGH
AUUNOA NAPPACOONOEE TENNAPERRA SE TROUGH TREND TROUGH MURTEREE TROUGH
TREND
(KM)
O.---------------------------------------------~
5
10
GIDGEALPA HIGH
KM
EROMANGA BASIN
MOOMBA FIELD
3. I
Figure 8. Extensional tectonics model.
••••• MAJOR THRUST FAULTS
--- WRENCH FAULTS
- THRUST DIRECTION
o 100 , I
KM
MODIFIED FROM KUANG (I9B5J
Figure 9. Reactivated thrust model of Cooper Basin showing tectonic elements.
NW PATCHAWARRA GMI TROUGH TREND
(KM)
NAPPAMERRI TROUGH
ALLUNGA NAPPACOONGEE TENHAPERRA SE TROUGH IIURTEREE TROUGH
TREND
O.-----------------------------------------------~
5
10
GIDGEALPA HIGH
KM
EROMANGA BASIN
MOOMBA FIELD
3. ,
Figure 10. Cross-section showing reactivated thrust model.
COOPER WRENCH ZONE
(EXTENSIONAL RIGHT LATERAL MOVEMENT
WITH DRAG)
\..
NORTHERN COOPER BASIN
PROVINCE
SOUTHERN COOPER BASIN
PROVINCE
o KM 100 , ,
SMIT(1987)
Figure 11. Wrench tectonics model of Cooper Basin showing tectonic elements.
:::r:: ~ :0 o ~ :0 ID o Z o (") (") C :0 :0 m Z (") m en Z -I :r: m
b' o "'0 m :0 » Z o m ~ ~ Z Gl »
~ Z en Z (") m Z -I
~ ,.... » c ~ :0 » ,.... s;:
350 J.PARAN
BASIN GEOLOGICAL AGE TECTONIC SETTING DEPOSITIONAL SmlNG
LATE REGRESSION ~ERTIARY UPLIFT, COMPRESSION. NON MARINE MIXED LOAD C TERMINATION OF EROMANGA FLUVIAL c:J CRET- DEPOSITION
:z ACEOUS EARLY SHOREFACE - OPEN MARINE
C MARINE TRANSGRESSION :& DOMINANTLY BED-LOAD 0 LATE SEDIMENTATION, BRAIDED lie JURASSIC CHANNELS.
UI MIDDLE EPEIROGENIC DOWNWARPING. DEPOCENTRE AT
EARLY WINDORAH TROUGH LATE THERMAL SAG OR REACTIVATION OF PRE-EXISTING FLUVIATILE, DELTAIC,
TRIASSIC MIDDLE SmUCTURE FLOODPLAIN EARLY BASIN TILT TO NORTHEAST (MAIN TRIASSIC FLUVIATILE SEDIMENT AnON. LATE DEPOCENTRE)
PENEPLANATION FORMING DARALINGIE UNCONFORMITY. BASINWIDE DEFORMATION, PALAEOTOPOGRAPHIC lie UPLIFT ALONG PRE-EXISTING PALAEO-HIGH TRENDS, SURFACE UI EXTENSIVE EROSION
A. FLUVIO-LACUSTRINE SEDIMENTATION 0 PERMIAN EARLY SYN-TECTONIC DEPOSITION, CONTEMPORANEOUS MAJOR DEPOCENTRE IN 0 FAULTING PERIODIC UPLIFT AND TRUNCATION SOUTHERN COOPER BASIN
(.)
CONTINUED SUBSIDENCE
EPEIROGENIC DOWNWARPING, REACTIVATION OF DEPOSITION OF FLUVIATILE SEDIMENTS (TIRRAWARRA
CARBON-E.PALAEOZOIC smUCTURAL TRENDS SST) ON UNDULATING POST
LATE (OR CONTEMPORANEOUS REACTIVATION OF THRUST GLACIAL (MERRIMELIA FM)
IFEROUS FAULTS) TOPOGRAPHY
L.SILURIAN - E.DEVONIAN COMPRESSIONAL TECTONICS
BASIN
c c:J Z C :IE o II: III
II: III A. o o (,)
THRUST FAULTING
Figure 12. Summary of tectonic evolution of Cooper and Eromanga Basins.
GEOLOGICAL AGE LITH SONIC ~
STRATIGRAPHY MA.tOR I.v.n~
SEALS LATE WINTON FM
CRETACEOUS
::-:~::::::
EARLY l'" ~ '"
MACKUNDA F~~~'~~~~~~::::::m::::::m::::::m~§~~~ ;'"n.1 In , FM L-_--:. - ':;-""';;10ii .... , SST
BULLDOG SHALE
" -"'~--------+---~ ~~
LATE ::::::::}:.
'-"-JURASSIC ~MI-D-DL-E-t !l-iI\\-'~
1------1(2 c;.:,,:.;,:,:.:,:.:,:." EARLY
TRIASSIC LA~ ~:_:_:_: MID~
EARLY
LATE
PERMIAN EARLY
(,AnNA .• nwn: FM MURTA MBR
MOOG A FM NAMUR SST MBR
NAPPAMERRI GRP
TOOLACHEE FM I--~- DARAUNGIE FM
"''''''''.I'':ATH SHALE
~DC:II n"l FM
MURTEREE SHALE
PATCHAWARRA FM
Figure 13. Reservoir-seal relationships within the Cooper and Eromanga Basins.
-----
L-_-_- ,..--,..-----
L:::-= __
l:-_-=-=-=-=~=-: ~--

HYDROCARBON OCCURRENCES IN THE COOPER AND EROMANGA BASINS IN CENTRAL AUSTRALIA 351
Formation, Adori Sandstone, Westbourne Formation, Namur Sandstone and Murta Member.
7. Marine transgression in Late Jurassic-Early Cretaceous, and deposition of Cadna-owie Formation to Mackunda Formation succession.
8. Late Cretaceous regression and deposition of non-marine Winton Formation.
9. Tertiary uplift, compression and subsequent erosion, terminating Eromanga Basin deposition.
PROSPECTIVITY ELEMENTS
Reservoir The Cooper and Eromanga stratigraphic
successions contain abundant fluvial sandstones of variable reservoir quality. Formations having reservoirs with significant production are shown in Figure 13. The prospectivity of these reservoirs is largely influenced by diagenetic processes and regional porosity and permeability trends have been used as a guide to focus on areas for exploration (Heath, 1989).
In the Cooper Basin, the Patchawarra and Nappamerri Trough areas generally have lower porosities with higher values recorded over depositional and structural highs. Gas production rates in excess of 10 MMCFD (million cubic feet per day) are common within the Patchawarra Formation at depths of up to 2,500 meters. Porosity decrease is strongly depth-related and the regional porosity distribution indicates preserved primary porosity. Detailed facies analysis and mapping of sand trends have been attempted (Taylor et al, 1991; Fairburn, 1992) to minimise the reservoir risk. Economic deliverability, a function of the permeability of the gas reservoirs, is another important criteria used to define areas of high prospectivity. High deliverability wet gas fields, with high economic return, are located at shallower depths towards the basin margin (for example Daralingie and Toolachee Fields).
In the Eromanga Basin, the widespread braided fluvial deposits of the Hutton and Namur Sandstones exhibit excellent reservoir characteristics. Porosities up to 30 per cent and permeabilities up to 10 darcies have been reported from the Hutton Sandstone, which has recorded oil flow rates in excess of 3,700 BPD (barrels per day) (Wecker, 1989). Porosity reduction due to diagenetic silicification occurs with increasing depth, and average porosities are generally lower in the major trough areas. Sandstones of the Poolowanna, Birkhead, Westbourne and Cadna-owie Formations and the Murta Member are productive, though
affected by higher clay content. Shoreline sandstones of the Murta Member have recorded high flow rates, as in the Dullingari Field where a 1 meter thick Murta sand with permeabilities of up to 3 darcies flowed at more than 2,000 BOPD (barrels of oil per day) (Mount, 1982).
Seal The cyclic nature of fluvial sedimentation
throughout the Cooper and Eromanga basins has resulted in the deposition of several regional lacustrine shales associated with the transgressive episodes. Of these, the Murteree Shale, the Roseneath Shale, the Callamurra Member, the Birkhead Formation and the Murta Member are the most important, providing the top-seal for major reservoirs of the Patchawarra Formation, Epsilon Formation, Toolachee Formation, Hutton Sandstone and the Namur Sandstone respectively (Fig. 13). Within the Nappamerri Group the shaly Tinchoo Formation provides the seal for reservoirs of the Wimma Sandstone Member. Hydrocarbons found within the Eromanga Basin reservoirs are considered also to have been sourced by Permian source rocks at depth, migrating into the overlying Eromanga near erosional subcrops of the PermoTriassic seals (Heath, 1989). This is particularly evident from the location of many of the Eromanga discoveries near the erosional edges of the Cooper Basin and the major faulted (and possibly fractured) structural trends. The limits of the major Permian seals are therefore considered to be important in determining the prospectivity of the overlying Eromanga Basin reservoirs.
Source The Patchawarra and Toolachee formations,
containing abundant dispersed organic matter (up to 6%) and coals are considered to be the principle source of hydrocarbons reservoired in both the Cooper and Eromanga basins (Brooks et al., 1971; Battersby, 1976; Cook and Struckmeyer, 1986; Heath et al., 1989; Hunt et al., 1989; Jenkins, 1989). The coals are typically rich in inertinite and vitrinite with minor exinite comprising mostly sporinite and lesser cutinite. The dispersed organic matter is generally dominated by vitrinite and inertinite with some exinite. Rock-Eval pyrolysis data identifies the source rock as Type II/III kerogen with potential for both oil and gas generation (Fig. 14).
The widespread Murteree Shale and Roseneath Shale are generally lean in organic matter and therefore appear to have little source potential.
An isoreflectance map at the top of the Patchawarra Formation (Fig. 15) shows increasing maturity with depth, particularly in the Patchawarra, Nappamerri and Windorah Troughs.
352 J.PARAN
The depth-reflectance gradients vary between the troughs, being lowest in the Patchawarra Trough and highest in the N appamerri Trough (Kantsler et al., 1983), reflecting present-day variation in heatflow (Pitt, 1986). Con-elations between the presence or absence of commercial fields and the isoreflectance data (Hunt et al., 1986) indicate that the shallowest significant Permian reservoired gas is found at a vitrinite reflectance level of Rv = 0.75% or within 10 kIn of sediments that are at a maturity of Rv = 0.~.9%. A strong relationship between the abundance and composition of gasliquids, the maturity level and the OCCUITences of Permian oil exists (compare Fig. 15 with Fig. 16). These observations indicate that while hydrocarbons may commence generation below 0.8% Rv, they generally do not accumulate in commercial quantities until a maturity of 0.9-1.0% is reached. The major trough areas appear to have reached the optimum maturity level of 0.9-1.0% during the Jurassic, with the present day isoreflectance map showing the present-day gas generation, having shifted progressively towards the flanks of the basin and structural highs.
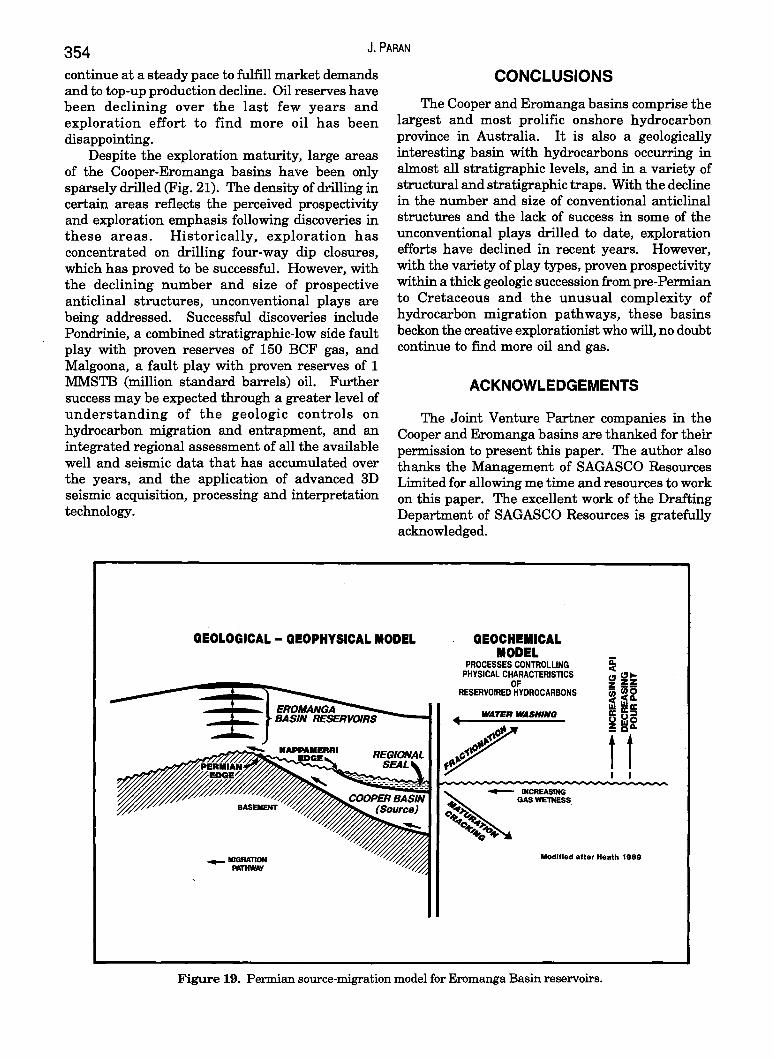
Eromanga Basin oil fields are generally concentrated above the Cooper Basin, and in particular over Cooper Basin structural high trends and near erosional zero edges of the Permian sequence (Fig. 17). The bulk of the Eromanga Basin hydrocarbons appear to have been sourced from the underlying Permian (Fig. 18) and migrated up via faults and erosional subcrops. Oil found in the Eromanga reservoirs, however, have been chemically and physically modified during the course of migration through the extensive Eromanga aquifer system, including the stripping of natural gas, water washing of the residual liquid phase and tendency for oils to increase in API and decrease in pour point within shallower horizons in stacked oil accumulations (Heath et al., 1989) (Fig. 19). Exploration models based on this concept have been successful, resulting in the discovery of several oil fields in the Lake Hope area.
Within the Eromanga section, the Poolowanna and Birkhead Formations and the Murta Member are recognised as having significant source potential. Total organic carbon contents range between 0.5-2.00/0, with thin coal beds in the Poolowanna and Birkhead formations yielding higher contents locally. Several oils contained in the Eromanga section have been shown to contain biomarkers associated with the Eromanga source rocks (Alexander et al., 1988; Jenkins, 1989). Due to the generally shallow depths, thermal maturation of these source rocks is generally low. Oil occurrences suggest that initial oil generation may have taken place at relatively low Romax = 0.55%
for the Birkhead Formation and Romax = 0.45% for the Murta Member. The Birkhead Formation is both the thickest and most extensive source rock unit, with the best potential likely to be in the Nappamerri Trough and Windorah Trough where maturities in excess of Romax = 0.7% is predicted (Wecker, 1989).
GAS AND OIL DISCOVERIES
The Cooper Basin and the portion of the Eromanga Basin immediately overlying the Cooper Basin are at a mature stage of exploration, as shown in Figure 20 (approximately 130,000 kIn of seismic acquired) and in Figure 21 (approximately 720 wildcat and appraisal wells drilled). Hydrocarbon discoveries have been made in almost all reservoirbearing formations (Fig. 3). To date, some 120 gas fields (Fig. 22) and 110 oil fields (Fig. 23) having total proven reserves of 5.5 TCF (trillion cubic feet) sales gas and 300 million barrels of recoverable oil have been found. Exploration for gas is expected to
I 900
800 H Y 700 D R 600 0 G E
500
N 400
I N 300
D E 200
X 100
400 420 440 460 480 500
T MAX. °c
Figure 14. Hydrogen Index versus Tmax for Patchawarra Formation.

Figure 15. Isoreflectance map (% Vr) at top Patchawarra Formation.
'0 PERMIAN OIL FIELDS
OIL RECOVERY FROM TEST
I@j AREA OF HIGH WET GAS
MOO AFTER YEW A MILLS. ,psg
Figure 16.Contour map of gas wetness (%[C2-C4l![CI-C4]) of Patchawarra Formation showing Permian oil occurrences.
BASIN
cr e» z cr :::E 0 a: W
a: W 111. 0 0 (.)
FAULT + ANTICUNE OR TREND + SYNCLINE OR TROUGH
OIL
* GAS
* OIL & GAS
:/
'\ ......
.... D I
KM 100 I
TROUGH •••••••••
/ ....... ....
Figure 17. Occurrences of Eromanga Basin hydrocarbons.
GEOLOGICAL AGE
LATE
CRET-ACEOUS EARLY
LATE
JURASSIC MIDDLE
EARLY LATE
TRIASSIC MIDDLE
EARLY
LATE
PERMIAN EARLY
PRE-PERMIAN
\t
SONIC STRATIGRAPHY
WINTON FM
I===:::;-OOMDA;:~~~:~M
POT SOURCE
ROC.
COORIKIANA SST==='J-_--l BULLDOG SHALE
CADNA-OWIE FM MURTA MBR
NAMUR SST MBA
POOR
p
• OIL SOURCE
MIGRATION OIL GAS
~ GAS SOURCE
Figure 18. Hydrocarbon migration within Cooper-Eromanga Basins.
:r: -< o :0 o o » :0 OJ o z o o o C :0 :0 m Z o m (J)
Z -I I m o o o "lJ m :0 » z o m :0 o ;::: » z Gl » OJ » (J)
Z (J)
Z o m z -I :0 » , » c (J) -I :0 » , 5>
354 J.PARAN
continue at a steady pace to fulfill market demands and to top-up production decline. Oil reserves have been declining over the last few years and exploration effort to find more oil has been disappointing.
Despite the exploration maturity, large areas of the Cooper-Eromanga basins have been only sparsely drilled (Fig. 21). The density of drilling in certain areas reflects the perceived prospectivity and exploration emphasis following discoveries in these areas. Historically, exploration has concentrated on drilling four-way dip closures, which has proved to be successful. However, with the declining number and size of prospective anticlinal structures, unconventional plays are being addressed. Successful discoveries include Pondrinie, a combined stratigraphic-low side fault play with proven reserves of 150 BCF gas, and Malgoona, a fault play with proven reserves of 1 MMSTB (million standard barrels) oil. Further success may be expected through a greater level of understanding of the geologic controls on hydrocarbon migration and entrapment, and an integrated regional assessment of all the available well and seismic data that has accumulated over the years, and the application of advanced 3D seismic acquisition, processing and interpretation technology.
CONCLUSIONS
The Cooper and Eromanga basins comprise the largest and most prolific onshore hydrocarbon province in Australia. It is also a geologically interesting basin with hydrocarbons occurring in almost all stratigraphic levels, and in a variety of structural and stratigraphic traps. With the decline in the number and size of conventional anticlinal structures and the lack of success in some of the unconventional plays drilled to date, exploration efforts have declined in recent years. However, with the variety of play types, proven prospectivity within a thick geologic succession from pre-Permian to Cretaceous and the unusual complexity of hydrocarbon migration pathways, these basins beckon the creative explorationist who will, no doubt continue to fmd more oil and gas.
ACKNOWLEDGEMENTS
The Joint Venture Partner companies in the Cooper and Eromanga basins are thanked for their permission to present this paper. The author also thanks the Management of SAGAS CO Resources Limited for allowing me time and resources to work on this paper. The excellent work of the Drafting Department of SAGAS CO Resources is gratefully acknowledged.
GEOLOGICAL - GEOPHYSICAL MODEL GEOCHEMICAL MODEL
PROCESSES CONTROLLING PHYSICAL CHARACTERISTICS
OF RESERVOIRED HYDROCARBONS
WATER WASHING
Modlflad aftar Haath 1989
Figure 19. Permian source-migration model for Eromanga Basin reservoirs.

Figure 20, Seismic density within Cooper-Eromanga Basins.
, ........ " , I \ I , .... I I \ I \ \ -" \ ,.,
~ \ -\
..... , , ....
\ \ , .
, ,r--"'
I ~ I • , I ,./ \J ,
',--' ,. '. , " , --' , ..... _,'. ".",,"
'-, .- ,/ ,~ I
I , 1. , ,
,. .... -,_ .... -:.... " .... 1
./.. •. -.t I
.,'. • : -. ~ #I • - •••• /. ,.:.'. .fI.,., ~.... ' ",-,\)" "Ill. ~ I. ." .-,.,. • ~ .,
I ,t('.~r'·. .. '.\.. ~\ I by ... W:':: • { -.- -#.. ... .. . ''\ .1·
I • " '. .:. • \
\' - "'.. '" ." .,' " ••• ~ .. .(I ,., .......... " I ,.f. ",' .' '!"-~.. ..... • ,_..:-...,.,. ""': ... "".. ,V-:t ~ .... ,. '.f.. (' ~ ... " ~. . ........ \ "" .,-, -\ \ ,-, -,.
I ~ .~.', ............ ~ .,." \ 1-=", \ ,.~ • ... ,:v:..... .-1.-';"'\ \1 .... , .. __ ....... ,- ._ • ..,'/ _1 ... ,
...... r ....... .!'" 's I " , ,
,--{ ,_ ........... '
.'
o KM 100 I '
Figure 21. Drilling density within Cooper-Eromanga Basins.
.. -/ .. / ....•... /./ ... , •... \.,/.
.. , ,
BAllERA/, . --., .. •
I
--I ,./ "- ~ -" ...
f. .?: ... . f . ~.. • ":: ..• ':" MOOMB~' ,tt ':'It \ ~ .. .... ... '.
-;:~; .. ;J~:l>"~i·,;;/': \f"::" wo
) .:::)
Figure 22. Gas fields within Cooper-Eromanga Basins.
~ . '
.r .... ··)/ ................
<:.;~::~: .. .:. ,;//
....
. :'
JACKS'ON"t ; ..... . ~.~ :~.::: .:.: .... ~ .. :,.}
", ~T~RRAWARRA . .... \ OJ
. .'::.
":'<:";;.:)
" • .'
" i/i '~ .... \\j ""\'" : .. ..
...... .~ ..... :;.:-:';;, .. . ': ......
<; .. o KM 75
.. '
Figure 23, Oil fields within Cooper-Eromanga Basins.
I -< o :D o o » :D OJ o z o o o C :D :D m Z o m (J)
Z -1 I m o o o -0 m :D » z o m :D o ;;: » z Gl » OJ » (J)
Z (J)
Z o m Z -1 :D » r » c ~ :D » r :;;:
W 01 01
356 J.PARAN
The views contained in this paper are those of the author and not necessarily those of SAGASCO Resources Limited or of the Cooper-Eromanga basin Joint Venture Partners.
REFERENCES
ALEXANDER, R, LARCHER, AV., KAGI, RI. AND PRICE, P.L., 1988. The use of plant-derived biomarkers for correlation of oils with source rocks in the CooperjEromanga Basin system, Australia. APEA Journal 28(1), 310-24.
BATIERSBY, D.G., 1976. Cooper Basin gas and oil fields. In: Leslie, RB., Evans, H.J., and Knight, CL., (Eds.), Economic Geology of Australia and Papua New Guinea. 3. Petroleum. Australian Institute of Mining and Metallurgy, Monograph 7,321-68.
BROOKS, J.K, HESP, W.R, AND RIGBY, D., 1971. The natural conversion of oil to gas in sediments in the Cooper Basin. APEA Journal 11(1).
CARROLL, P.G., 1990. Pre-Permian structure and prospectivity at Gidgealpa, South Australia. Unpublished MSc Thesis. NCPGG, University of Adelaide.
COOK, AC AND STRUCKMEYER, H., 1986. The role of coals as a source rock for oil: In: Glenie, RC (Ed.), Second SouthEastern Australia Oil Exploration Symposium. Petroleum Exploration Society of Australia, Melbourne.
COSGROVE, J.L., 1987. South-west Queensland Gas - a resource for the future. APEA Journal 27(1),246-63.
FAIRBURN, W.A, 1992. Geometry of reservoir trends in the Epsilon Formation sands, southern Cooper Basin, South Australia. APEA Journal 32(1), 339-58.
HEATH, RS., 1989. Exploration in the Cooper Basin. APEA Journal 29(1), 366-78.
HEATH, RS., MCINTYRE, S., AND GIBBINS, N., 1989. A Permian origin for Jurassic reservoired oil in the Eromanga Basin. In: O'Neil, B. (Ed.), The Cooper and Eromanga Basins, Australia. Proceedings of the Petroleum Exploration Society of Australia, Society of Petroleum Engineers, Australian Society of Exploration Geophysicists (SA Branches), Adelaide.
HUNT, J.W., HEATH, RS., AND McKENZIE, P.J., 1989. Thermal maturity and geological controls on the distribution and composition of Cooper Basin Hydrocarbons. In: O'Neil, B. (Ed.), The Cooper and Eromanga Basins, Australia. Proceedings of the Petroleum Exploration Society of Australia, Society of Petroleum Engineers, Australian Society of
Exploration Geophysicists (SA Branches), Adelaide. JENKINS, C C, 1989. Organic geochemical correlation of source
rocks and crude oils in the Cooper and Eromanga Basins. In: O'Neil, B. (Ed.), The Cooper and Eromanga Basins, Australia. Proceedings of the Petroleum Exploration Society of Australia, Society of Petroleum Engineers, Australian Society of Exploration Geophysicists (SA Branches), Adelaide.
KAmsLER, AI., PRUDENCE, T.J.C, COOK, AC, AND ZWIGULIS, M., 1983. Hydrocarbon habitat of the CooperjEromanga Basin, Australia. APEA Journal 23(1), 75-92.
KUANG, KS., 1985. History and style of Cooper-Eromanga basin structures. Bulletin of the Australian Society of Exploration Geophysicists. 16, 245-48.
MOUNT, T.I., 1982. Geology of the Dullingari Murta oilfield: In: Moore, P.S., and Mount, T.J., (compilers), Eromanga Basin Symposium: Summary Papers. Geological Society of Australia and Petroleum Society of Australia, Adelaide, 356-74.
NELSON, A W., 1985. Tectonics of the J ackson-N accowlah area Cooper-Eromanga basins, Southwest Queensland and their implications for hydrocarbon accumulation. APEA Journal 25(1).
Pm, G.M., 1986. Geothermal gradients, geothermal histories and the timing of thermal maturation in the EromangaCooper Basins. In: Gravestock, D.I., Moore, P.S., and Pitt, G.M., (Eds.), Contributions to the geology and hydrocarbon potential of the Eromanga Basin. Geological Society of Australia Special Publication 12, 323-52.
SMIT, R, 1987. Hydrocarbon prospectivity of southwest Queensland. Unpublished internalSAGASCO Resources Limited report.
TAYLOR, S., SoLOMON, G., TUPPER, N., EVANOCHKO, J., HORTON, G., WALDECK, R, AND PHILLIPS, S., 1991. Flank plays and faulted basement: new directions for the Cooper Basin. APEA Journal 31(1), 56-74.
THORNTON, RCN., 1979. Regional stratigraphic analysis of the Gidgealpa Group, southern Cooper Basin, Australia. Geological Survey of South Australia Bulletin 49.
WECKER, H.RB., 1989 . Prospectivity inPerspective: Eromanga Basin. APEA Journal 29(1), 379-97.
YEW, CC, AND MiLLS, AA, 1989. The occurrence and search for Perrnianoilin the Cooper Basin, Australia. In: O'Neil, B. (Ed.), The Cooper and Erornanga Basins, Australia. Proceedings of the Petroleum Exploration Society of Australia, Society of Petroleum Engineers, Australian Society of Exploration Geophysicists (SA Branches), Adelaide.
----------.•. -~-+.~ .. ---------Manuscript received 30 November 1992