hydration of na+, ni2+, and sm3+ in the interlayer of … · · 2018-03-22hectorite: a...
TRANSCRIPT

HAL Id: insu-00413847https://hal-insu.archives-ouvertes.fr/insu-00413847
Submitted on 9 Sep 2009
HAL is a multi-disciplinary open accessarchive for the deposit and dissemination of sci-entific research documents, whether they are pub-lished or not. The documents may come fromteaching and research institutions in France orabroad, or from public or private research centers.
L’archive ouverte pluridisciplinaire HAL, estdestinée au dépôt et à la diffusion de documentsscientifiques de niveau recherche, publiés ou non,émanant des établissements d’enseignement et derecherche français ou étrangers, des laboratoirespublics ou privés.
Hydration of Na+, Ni2+, and Sm3+ in the Interlayer ofHectorite: A Quasielastic Neutron Scattering Study
Oleg S. Sobolev, Lydie Le Forestier, Miguel A. Gonzales, Laurent Charlet
To cite this version:Oleg S. Sobolev, Lydie Le Forestier, Miguel A. Gonzales, Laurent Charlet. Hydration of Na+, Ni2+,and Sm3+ in the Interlayer of Hectorite: A Quasielastic Neutron Scattering Study. The Journal ofPhysical Chemistry C, ACS American Chemical Society - Publications, 2009, 113, pp.13801-13812.<10.1021/jp903179g>. <insu-00413847>

1
Hydration of Na+, Ni2+, and Sm3+ in the interlayer of hectorite: a
quasielastic neutron scattering study
Oleg Sobolev1*, Lydie Le Forestier2, Miguel A. Gonzalez3, Margarita Russina4, Ewout
Kemner4, Gabriel J. Cuello3, and Laurent Charlet1
1LGIT, University of Grenoble and CNRS, BP53, 38041 Grenoble, France
2Université d'Orléans, CNRS/INSU, Université de Tours, Institut des Sciences de la Terre
d’Orléans, 1A rue de la Férollerie, 45071 Orléans Cedex 2, France
3Institut Laue Langevin, 6 rue Jules Horowitz, BP 156, 38042 Grenoble Cedex 9, France
4Helmut-Zentrum Berlin für Materialien und Energie, Glienicker Strasse 100, D-14109
Berlin, Germany
*Corresponding author. E-mail: [email protected]
Abstract
Quasielastic neutron scattering experiments were performed with Na-hectorite, Ni-hectorite,
and Sm-hectorite samples in order to find out whether Sm3+ is present in the clay interlayer as
a fully hydrated cation (outer-sphere complex), or, as it follows from neutron diffraction data
analysis, it is dehydrated and bound to the clay surface (inner-sphere complex). The results
obtained for the Sm-hectorite were compared with other interlayer cations: strongly hydrated
Ni2+ and relatively weakly hydrated Na+. It was found that water mobility in the Sm-hectorite
sample is very close to the water mobility in Ni-hectorite. This is only possible if the Sm3+ ion
is fully hydrated. It was shown that water molecules hydrating Ni2+ and Sm3+ exhibit diffusion

2
mobility measurable with backscattering spectrometers. The diffusion coefficients of the
exchangeable cations were found using the slow exchange approximations DNi = (0.05 – 0.14)
x 10-9 m2/s and DSm = (0.04 – 0.18) x 10-9 m2/s.
1. Introduction
Smectite clay minerals are layer-type aluminosilicates, which are ubiquitous on our
planet in geologic deposits, terrestrial weathering environments, and marine sediments. They
consist of negatively charged silicate layers held together by cations to give a stacked
(crystalline) structure. Under humid conditions, the cations in the interlayer and the internal
clay surfaces are hydrated. Due to their hydration ability and charged layers, smectites possess
important properties such as swelling ability, low hydraulic conductivity, good plasticity, and
both high cation-exchange and adsorption capacities - all of which make them very useful for
several applications. For instance, clay minerals are widely used in the various industries as a
viscous gelling or a clarifying agent. Smectites are intensively used in environmental contexts
including their applications in waste confinement barriers. Furthermore, clay minerals have
been selected as the most suitable buffer material for high-level radioactive waste repositories.
The buffer material is expected to retard the migration of the radionucleides in the case of
corrosion of the waste package material.
Cation adsorption complexes can be classified as either inner-sphere or outer-sphere.
An inner-sphere surface complex has no water molecule interposed between the clay surface
and the cation, whereas an outer-sphere surface complex has at least one such interposed
water molecule. Outer-sphere surface complexes thus comprise fully hydrated cations [1].
Among the radionucleides that could be potentially released from radioactive waste
repositories and then migrate through the clay barrier, the trivalent cations represent an
important part. The lanthanides are of interest because they are often taken as a chemical
analog for trivalent actinides [2]. The results for Nd3+- and Yb3+- exchanged Wyoming
montmorillonite obtained by means of neutron diffraction with isotopic substitution were
reported in ref 3. It was found that Nd3+ and Yb3+ are only partially hydrated and are bound to
the clay surface probably as a result of heat treatment at 100oC during sample preparation. It
was supposed that this treatment was sufficient to cause the lanthanide ions to dehydrate and
to bind irreversibly to the clay surface oxygen atoms.

3
In a previous experiment [4,5], we studied by means of neutron diffraction with
isotopic substitution the structural parameters of the coordination of Sm3+, adsorbed in the
interlayer space of the montmorillonite. It was found that the number of hydrogen atoms, NH
= 5.5 ± 2.0, in the first coordination shell of Sm3+ is equal or even slightly smaller than those
of oxygen atoms, NO = 7.5 ± 1.0. This means that not all these oxygen atoms belong to water
molecules. It was supposed that the Sm3+ ion binds to the clay surface via oxygen siloxane
atoms (forms an inner-sphere complex), and it is probably partially hydrolyzed. This result is
very close to those obtained earlier for Yb3+ and Nd3+, although the sample preparation
methods and sample mineralogy differ for the two studies. Recently we performed a neutron
diffraction experiment with the hydrated Sm – synthetic hectorite samples [6], and obtained
the numbers: NO = 7.5 ± 1 and NH = 8.5 ± 2. Though the NH value obtained for Sm – synthetic
hectorite is slightly higher than in montmorillonite, again, it is much smaller than the value
expected for the fully hydrated cation.
On the other hand, results obtained by other spectroscopic methods do not support the
hypothesis that the lanthanide cations form inner-sphere complexes with the clay surface:
those cations were found to be localized at the middle of the clay interlayer, fully hydrated,
indicating outer-sphere complexation [3,7,8].
The aim of the present work was to carry out a quasielastic neutron scattering (QENS)
experiment with hydrated Sm-smectite and to compare QENS results obtained for Sm3+ with
other interlayer cations: strongly hydrated Ni2+ and relatively weakly hydrated Na+.
In this type of study, the Na-smectite and Ni-smectite systems are very well studied,
and they can be used as “reference” samples. It is known from the neutron diffraction
experiments that the hydration structure of the Ni2+ ion in clay interlayer is very close to that
in aqueous solution. Like in aqueous solution, the number of water molecules in the first
coordination shell of interlayer Ni2+ cation is equal to 6 [9]. The hydration enthalpy of Ni2+ in
solutions is ΔH°hyd = -2105 kJ mol-1 [10]. According to QENS data, the Ni2+-water binding
time is τ > 10-9 s [11] in aqueous solution, whereas the NMR gives τ ~ 10-6 s [12]. This time is
very long in comparison with the observation time for the QENS experiment and, therefore,
the QENS spectra for the hydrated Ni-smectite should contain two distinct components: one
corresponding to the water molecules hydrating Ni2+ cation (bound water) and another one
for the other water molecules (“free” water). The term “free” is hardly applicable to the water
molecules in the clay interlayer, but we will use it just for brevity’s sake.
The Na+-water interaction is much weaker (ΔH°hyd = -409 kJ mol-1 [10]) and, the
estimation for the binding time τ is 10 to 20 ps [13,14]. Thus the molecules in the hydration

4
shell should be in a fast exchange regime (see section 2.3) with other molecules (one can say
the same on the molecules hydrating the clay surface), and QENS can be considered in the
single component approximation. The QENS experiments reveal diffusion coefficient of
water molecules in Na-montmorillonite to be D ~ 10-9 m2 s-1 [15,16] which is comparable to
that of bulk water (2.3 x 10⁻⁹ m2 s-1).
Thus in the case of a dehydrated Sm3+ cation bound to the clay surface, the result
should be similar to that of Na-smectite. In the case of fully hydrated Sm3+ cation (ΔH°hyd = -
3449 kJ mol-1 [10]), the scattering pattern should be close (at least qualitatively) to that of Ni-
smectite.
Since the maximal amount of cations that can be adsorbed in the clay interlayer is in
inverse proportion to their charge, and assuming that the cations to be fully hydrated like in
solution (hydration numbers 6 for Ni2+ and 9 for Sm3+), the number of water molecules
interacting with interlayer cations should be roughly the same in clay samples fully saturated
with either Sm or Ni (NSm x NH20hyd ~ 1/3 x 9 = 3; NNi x NH20
hyd ~ ½ x 6 = 3).
For our experiment, we used synthetic hectorite, in which the structural OH groups
were replaced by F atoms. This opens the new great possibilities for the QENS study of water
dynamics in clay, making it possible to explore subtle effects of hydration that, in the case of
natural clays, are hidden under the strong elastic peak originated from the clay structural
hydrogen atoms. This material has also other advantages in comparison with natural clays;
namely very well-defined structure and charge distribution on the clay layers, leading to a
highly regular swelling [17], in contrast to its natural counterparts.
In Section 2 of this paper, the general description of the QENS is given, and the
problems of the QENS data analysis for hydrated clay samples are discussed. In this section,
we also consider the fast and slow exchange limits of the QENS that are very important for
the systems containing different classes of diffusing particles. Section 3 describes samples
preparation, chemical analysis and QENS experiments. The experimental results are
examined in Section 4. First we start with a preliminary analysis using the simplest models,
then in the second part of Section 4 we analyze the data obtained for Ni-hectorite and Sm-
hectorite samples in more detail using the slow exchange limit approximation. In Section 5
we summarize the conclusions.
2. Models and Methods
2.1. Basics
5
The scattering law S(Q,ω) measured in an inelastic neutron experiment is the
distribution of neutrons that have undergone an energy exchange hω = Ei - Ef, and a wave
vector transfer, fi kkQrrr
−= , after scattering by the sample. Scattering from water is
dominated by the scattering cross-section for hydrogen, which is over 98% incoherent. In the
incoherent approximation S(Q,ω) is connected with the Van Hove self-correlation function
),( trGsr via a double Fourier transform in space and time [18,19]:
( )∫∫ −= dtrdtrQitrGQS srrrrr
)(exp),(21),( ωπ
ω (1)
In the classical limit ),( trGsr is defined as the probability of finding a particle at a position rr
at a time t when the same particle was at the origin at time t = 0.
For the modeling of S(Q,ω), it is often convenient to use the intermediate scattering
function I(Q,t):
( ) ))(exp()0(exp)exp(),(),( trQirQirdrQtrGtQI jjsrrrrrrrr
−== ∫ , (2)
where angular brackets denote ensemble average, and r(0) and r(t) are, respectively, the
coordinate of a particle at time 0 and the coordinate of the same particle at time t.
Thus the scattering law S(Q,ω) can be expressed by the following expression:
∫ −= dttitQIQS )exp(),(21),( ωπ
ωrr
(3)
In the case of liquid sample, at infinite time, the scattering particle can access any
coordinate in space, independently of its initial position, and I(Q,t) tends to zero at t →∞. If
the motion of the particle is well located in space (atoms in the crystal), or restricted to a
particular volume (diffusion in confined space, molecular reorientations) I(Q,t) tends to a
nonvanishing value I(Q,∞). Therefore, in the most general case, I(Q,t) can split into its
asymptotic value in the long-time limit I(Q,∞) and the time-dependent part Iinel(Q,t) according
to
I(Q,t) = I(Q,∞) + Iinel(Q,t), (4a)
and the scattering law can be expressed [18,19]:
∫ −+∞= dttitQIQIQS inel )exp(),(21)(),(),( ωπ
ωδωrrr
(4b)
The delta function δ(ω) in this expression represents elastic scattering; it is absent in
the case of liquid sample because of long-range translational diffusion of the molecules. In
our particular case of a clay sample, elastic scattering arises from clay atoms that, in the long

6
time limit, can be considered as immobile. The second term is inelastic scattering
corresponding to any kind of molecular motions.
It is generally assumed that different kinds of motions are uncorrelated and the
incoherent intermediate scattering function in the long time limit corresponding to QENS has
the form:
( )WtQItQItQItQI rtrelqinel 2exp),(),(),(),( .. −=≈ (5)
where the exponent is the Debye-Waller factor, Itr(Q,t) and Ir(Q,t) represent the contributions
from the translational and the low-frequency rotational motions respectively. This supposition
is not always correct, nevertheless, it is widely used in order to have a tractable analytical
model for the data analysis.
Itr(Q,t) tends to zero at t →∞, whereas the reorientation function Ir(Q,t) is a sum of its
asymptotic value in the long-time limit Ir(Q,∞) and the time-dependent part Irqel(Q,t):
Ir(Q,t) = Ir(Q,∞) + Irqel(Q,t)
and the quasielastic scattering law can be expressed as [18,19]:
( ) )2exp(),(),(),()(),( WQSQSQSQEISFQS rqeltrtrqel −⊗+= ωωωω (6)
where the sign ⊗ denotes the convolution operation, Str(Q,ω) and Srqel(Q,ω) are Fourier
transforms of Itr(Q,t) and Irqel(Q,t) correspondingly. EISF(Q) = Ir(Q,∞) is the elastic
incoherent structure factor characterizing the geometry of the rotation [18,19].
The simplest models for the diffusion motion predict an exponential form for the
translation diffusion function:
( )tQtQItr )(exp),( Γ−= (7a)
that corresponds to the Lorentzian form of the scattering law S(Q,ω):
22 )()(1),(ωπ
ω+Γ
Γ=
QQQS
r, (7b)
where Γ(Q) is the half-width at half maximum of the quasielastic peak. At low Q values, Γ(Q)
tends to the limit, corresponding to the simple diffusion (Fick’s law): 2)( DQQ =Γ (8)
At higher Q, different models [18,19] predict deviation from the Fick’s law and suppose a
jumping mechanism of diffusion.
The models for rotation motion describe generally Irqel(Q,t) by the infinite series of
exponential functions, but in practice, depending on Q range, the three (or less) first terms of
the expansion are quite enough for the data analysis. The characteristic times of these

7
exponents, in contrast to Itr(Q,t), do not depend on Q [18,19]. The Sears’ model describes the
isotropic rotational diffusion:
221
02
020 ))1((
)1(1)()12()()(
),()()(),(
ωπωδ
ωωδω
+++
⋅++⋅
=+⋅=
∑∞
= r
r
rqelrot
DD
QRjQRj
QSQEISFQS
ll
lll
ll
, (9)
Here R0 is the radius of rotation, Dr is the rotation diffusion constant, jl are the spherical
Bessel functions.
Thus, in the framework of the “traditional” approach, the quasielastic spectra are
usually approximated by a sum of a few Lorentzian functions corresponding to the
translational and rotational motions. The Lorentzian shape of the quasielastic components
S(Q,ω) is defined by the simple exponential decay of the corresponding I(Q,t) functions.
It was found, however, for supercooled liquids, glasses, polymers, proteins, and some
other substances that diffusive and reorientational relaxation processes in these systems
deviate from the exponential form and can be described by the stretched exponent
(Kohlrausch-Williams-Watt function (KWW)) [20,22]:
))/(exp()( βτ wttKWW −= (10)
The reasons for such a behavior can be different for different systems. Two limiting
scenarios are invoked to explain KWW functional form: “homogeneous” and
“heterogeneous” scenarios [20,21]. According to the “heterogeneous” scenario, the KWW
function is a superposition of different simple exponential relaxations weighted by a broad
distribution of relaxation times. The “homogeneous” scenario supposes that all of the particles
in the system relax nonexponentially. In the case of “homogeneous” non-exponential
behavior, the shape parameter β is considered as an indicator of the degree of correlation or
cooperativity of the relaxation process.
2.2. Water diffusion in clays. Methods of QENS analysis.
In spite of previous extensive studies of water microscopic dynamics in the interlayer
of montmorillonite [15,16,23,24] and vermiculite [25-28] by QENS, there is no full
agreement about the method to be used for data analysis. Both methods, supposing Lorentzian
shape of the S(Q,ω) (exponential decay of I(Q,t)) and based on the KWW form of I(Q,t),
have been used for the analysis of water mobility in the clay interlayer space.
There is experimental evidence that water diffusion mobility is a complex dynamical
process that cannot be described with the use of a single characteristic time. The diffusion
coefficients and residence times of water molecules measured with high resolution (neutron
8
spin-echo (NSE), backscattering) and low resolution (time-of-flight (TOF) spectroscopy)
show a significant difference [15,23,25-28]. For example, Swenson et al. [25-28] investigated
the dynamics of confined water in a fully hydrated Na-vermiculite clay using the NSE and the
TOF technique. It was found that the diffusion constant obtained using the NSE is about 40
times lower than the result of the TOF experiment. They also reported the very stretched
behavior of the I(Q,t) function, supposing that this behavior can be interpreted as evidence for
a broad distribution of relaxation times, probably because the water molecules have widely
different local environments. Malikova et al. [15] reported an evident difference between NSE
and TOF results obtained for Na- and Cs-montmorillonite samples. On the other hand, the
same research team reported a good agreement in the relaxation times of water mobility in a
synthetic Na-hectorite extracted with the NSE and TOF techniques using monoexponential
approximation for I(Q,t) function [17].
Water mobility in clay interlayer is strongly anisotropic; it is suppressed in the
direction perpendicular to the clay platelets. In the case of a nonoriented powder sample, the
experimental QENS reflects the two-dimensional water diffusion averaged over all possible
directions of the clay particles. Supposing that water diffusion can be described by the
diffusion coefficient parallel to the clay layers D|| (low Q limit, eq. 8), and I(Q,t) is
exponential (eq. 7), the powder average can be written as follows [17]:
∫ −=π
θθθθ
0
22||2 sin))(sinexp(
21),( dtQDtQI d
r (11)
where θ is the angle between the wavevector Qr
and the direction perpendicular to the clay
layers. It was shown that this powder average affects the shape of the QENS signal, resulting
in the deviation of the experimental I(Q,t) from the exponential form. Moreover, it was found
[17] that the analysis of the data in an isotropic approximation underestimated the diffusion
coefficient of the interlayer water molecules by 25 %. Strictly speaking, eq. 11 is only valid
for low water content (monolayer). In the case of higher water content (double layer and
higher), one should take into account the diffusion coefficient D┴ in the direction
perpendicular to the clay layers. This leads to a more complicated expression for the
experimental I(Q,t) and S(Q,ω) [29]. However, the use of that expression for fitting the data
obtained for a powder sample is problematic because of the strong correlation between D|| and
D┴ parameters.
2.3 Fast and slow exchange limits of QENS

9
For a proper analysis of QENS results, one should take into account the fact that the
clay interlayer contains different types of water molecules: water molecules hydrating the
exchangeable cations, and water molecules interacting only with other water molecules and
clay surface. The water molecules can undergo transitions between these types. If this
exchange is slow, the QENS spectra contain distinct components with different characteristic
times (widths) corresponding to different types of water molecules (slow exchange limit). In
the case of the fast exchange, only a single population of water molecules with averaged
diffusion mobility can be observed in the experiment.
Salmon [30] considered the system containing two classes of molecules with the mean
lifetime τi and molecular fraction ni in class i (=1,2). The diffusion of the particles was
described by the diffusion coefficients Di, corresponding to the low Q limit of the neutron
scattering experiment (eq. 8). It was found that the fast exchange limit takes place when τi <<
1/DiQ2. In this case, S(Q,ω) is a single Lorentzian. In the slow exchange limit, that is, when τi
>> 1/DiQ2 , the exchange between classes is relatively slow, and the scattering law is the sum
of two weighted Lorentzian functions.
The formulas, analogous to those presented in ref 30, can be derived assuming that
Ii(Q,t) can be approximated by the exponential ( )tQtQI ii )(exp),( Γ−≈ (see Supporting
Information). Again, if n2τ1 << 1/Γ1(Q), 1/Γ2(Q), the scattering law S(Q,ω) is the single
Lorentzian
22)(
)(1),(ωπ
ω+Γ
Γ=
Q
QQS , where )()()( 2211 QnQnQ Γ+Γ=Γ (12a)
In the slow exchange limit, when n2τ1 >> 1/Γ1(Q), 1/Γ2(Q), the S(Q,ω) is the sum of
two weighted Lorentzian functions:
⎟⎟⎠
⎞⎜⎜⎝
⎛
+ΓΓ
++Γ
Γ= 22
2
2222
1
11
)()(
)()(1),(
ωωπω
QQn
QQn
QS (12b)
Expressions 12a and 12b are more universal because they do not suppose any explicit form of
Γi(Q), thus they can be used for higher Q values, where Γi(Q) deviates from the simple
diffusion law (eq. 8).
However, this approach is applicable for more general cases as well, although exact
mathematical expressions can be obtained for the simplest cases only. The argument for the
most general case is the following: The I(Q,t) function of the system that contains two classes
of molecules can be presented as
),(~),(~),( 2211 tQIntQIntQI += (13)

10
where ),(~ tQI i corresponds to the particles that are in the ith class at the moment t = 0:
1)0,()0,(~ ==== tQItQI ii , Ii(Q,t) describes the scattering from the particles of the ith class
[30]. The molecules can change their class, and in general case, )0,()0,(~ ≠≠≠ tQItQI ii , so
that the function ),(~ tQI i describes the motions of the molecule in a mixed state. Because of
diffusion of the particles, the functions I(Q,t) describing QENS decay to 0 at t → ∞. We can
introduce the decay time τiD of ),(~ tQI i as the time when )0,(~),(~ QIQI iDii <<τ , and the
integral (eq. 3) can be approximated as
∫−
−
−≈Di
Di
dttitQIQSτ
τ
ωπ
ω )exp(),(21),(
rr (14)
If τi << τiD the system is in the fast exchange limit, and then no matter where the
molecule was at the moment t = 0, ),(~),(~21 tQItQI ≈ . If the transitions are rare, τi >> τiD,
),(),(~11 tQItQI ≈ and ),(),(~
22 tQItQI ≈ . The decay time τD can be roughly estimated as τD ~
1/Γ(Q).
Thus in a QENS experiment, the ability to see the difference between different types
of particles, such as water molecules hydrating cations and other molecules, depends on the
mobility of these molecules. However, in a real experiment, the behavior of the I(Q,t)
function cannot be observed at the time t longer than the observation time τobs defined by the
instrumental resolution τobs ~ 1/Δres, Δres is the full width at half-maximum (fwhm) of the
resolution function of the spectrometer. Therefore the sufficient condition for the slow
exchange limit can be written as τi >> τobs.
3. Experiment
3.1 Sample preparation and characterization
A fluorated hectorite used for all sample preparations was firstly synthesized at the
University of Orleans, by using the procedure [31] adapted from the conventional gelling
method of Hamilton and Henderson [32]. The chemical formulas of the synthetic hectorite is
Na0.8(Mg5.2Li0.8)Si8O20F4.nH2O per unit cell. Concerning the gel preparation, all chemicals
had 99% minimum grade purity. At first, Li2CO3 and Na2CO3, dried at 105°C, were added to
a Mg(NO3)2.6H2O solution (titration of 102.5 mg MgO/g) with a few drops of nitric acid, to

11
complete the dissolution of the carbonates (pH=2). A similar volume of ethanol used as
solvent was poured into this aqueous solution, and tetraethylorthosilicate (TEOS) was added
as the silicon source. A precipitate was obtained by neutralizing the resulting solution by
addition of NH4OH. After the complete hydrolysis (16 h), this gel was dried and progressively
heated to 600°C to remove water, organic matter, NO2, and CO2, and to obtain a Na-Mg-Li-Si
oxide gel. An appropriate quantity of dried MgF2 was added, and the resulting gel was finally
ground in an agate mortar. Experimental charges were placed into gold capsules, which were
after that closed by arc-welding. Hydrothermal syntheses were carried out in Tuttle-type,
externally heated, cold-seal pressure vessels, using argon as the pressure medium at 350°C
and 50 MPa, for a run duration of 28 days. All capsules were checked for leakage before the
experiment (test with oil), and after by reweighing.
For the preparation of the Sm-hectorite sample we used the isotope 154Sm in order to
reduce the neutron adsorption, which is very high for natural Sm. The Na-hectorite was
suspended in 0.05M solution of Sm3+ at pH = 4 and left with stirring. After 2 days of
equilibration the suspension was filtered and dried at room temperature. The Sm content in
the filtered solution was analyzed using ICP-OES. It was found that 97% of Sm was adsorbed
in the clay, and the concentration of Sm in the dry clay (taking into account the water content
in the sample) was 0.356 mmol/g. This value corresponds to the charge of 0.84e per unit cell,
which is slightly higher than the nominal value 0.8e.
The Ni-hectorite sample was prepared by suspending the Na-hectorite in 0.05M NiCl2
solution at pH = 4 and then left with stirring for 24 h. The clay was separated from the
solution by centrifugation, and the procedure was repeated three times. Finally the suspension
was filtered and washed with distilled water in order to remove the excess salt.
The dry powder Na-hectorite, Ni-hectorite, and Sm-hectorite samples were kept in a
humid atmosphere at relative humidity (RH) = 85% fixed by saturated KCl solution for 3
weeks. For the water content analysis, 200mg portions of the samples were dried in the oven
at 150 oC for 3 days. The water contents for all three samples were found to be almost the
same and equal to MH2O/Mdryclay ≈ 0.21 ± 0.01. This value corresponds to 9.2 water molecules
per unit cell (two-layer hydrate). The nominal composition of the three samples is given then
by the following unit cell formulas:
Na0.8(Mg5.2Li0.8)Si8O20F4 – 9.2 H2O (15a)
Ni0.4(Mg5.2Li0.8)Si8O20F4 – 9.2 H2O (15b)
Sm0.28 (Mg5.2Li0.8)Si8O20F4 – 9.2 H2O (15c)

12
Formula 15c shows the total concentration of Sm adsorbed in the clay mineral.
However, for a proper QENS data analysis, it is important to know the number of cations that
interact with water molecules. This number can be less than the total amount of adsorbed Sm
due to concurrent chemical reactions in the sample, such as precipitation. At pH = 4 the
dominant samarium species in aqueous solution is Sm3+, and cationic exchange is the main
mechanism of adsorption in the clay mineral at this pH value [2]. However, this acidity was
measured for the bulk clay suspension, and it could be changed during preparation of the
powder sample for the experiment: drying and equilibration with a humid atmosphere.
A cationic exchange analysis was done with the Sm-hectorite and Ni-hectorite samples
after the neutron scattering experiments. The aim of this analysis was to find how much of
adsorbed Sm and Ni is readily exchangeable and therefore persists in the clay interlayer in the
cationic form. The Sm-hectorite and Ni-hectorite samples were placed into concentrated CsCl
solution at pH = 4 for several hours. After centrifugation, the solution was changed, and the
old solution was kept for analysis in a separate tube. The procedure was repeated four times.
At the end for each sample, we had four tubes with the solutions containing Ni2+ or Sm3+ that
were replaced by Cs+ in the clay mineral. The concentrations of Sm3+ and Ni2+ in these
solutions were analyzed by ICP-OES, and the results are shown in Figure 1. The amount of
the cations released from the samples in the solution decreased very rapidly with the number
of the solution replacement procedures (i.e., tube number). Thus, nearly all exchangeable
cations were substituted by Cs+ and released in the solution during the first washing cycle. In
the case of the Ni-hectorite sample, the concentration of the exchangeable Ni2+ cations (0.486
mmol/g) is in very good agreement with the nominal value defined by the layers charge
(0.8e). The result for the Sm-hectorite sample is different: the concentration of the
exchangeable cations (0.242 mmol/g) was found to be less by 32% than that absorbed by the
hectorite (0.365 mmol/g).
13
Figure 1. Total amount of Sm3+ (top) and Ni2+ (bottom) as a function of the tube number (see text for
details). The calculated concentrations of exchangeable cations in hectorite (Sm3+/hectorite,
Ni2+/hectorite) are indicated in the figure.
3.2 Neutron Scattering Experiments
Previous QENS experiments on hydrated clays have shown that water diffusion
mobility is probably a complex dynamical process that cannot be described with the use of a
single characteristic time. This is especially true for samples with strongly hydrated interlayer
cations like Ni2+, where we expect to find two kinds of water molecules (slow exchange
limit): the water molecules hydrating the cation (bound water) and other molecules (“free”
water). The diffusion mobility of the bound water molecules is much slower than the mobility
of “free” water. This means that we need to perform our measurements with different energy
resolutions, which is equivalent to different observation times: with higher resolution we can
observe slower mobility of the bound water, whereas the faster mobility of “free” molecules is
more visible at lower resolution.
The low-resolution experiment was performed with the TOF spectrometer NEAT at
the Berlin Neutron Scattering Center (Helmholtz-Zentrum Berlin). The incident neutron
wavelength was λ0 = 8 Å, with an elastic resolution Δ ~30 μeV measured by using a standard
vanadium sample. Flat sample cells with 0.6 mm thickness were used, resulting in a

14
transmission of about 94%. The sample orientation angle with respect to the incident neutron
beam direction was 135o. The QENS was measured in a Q range of 0.23 – 1.33 Å-1.
The high-resolution experiment was carried out on the IN10 back-scattering at the
ILL, Grenoble. The incident neutron wavelength was λ0 = 6.271 Å, with an energy resolution
Δ ~1 μeV measured by using a standard vanadium sample. The thickness of flat sample cells
was 0.5 mm. Seven detectors were positioned at angles corresponding to average Q values of
0.11, 0.21, 0.29, 0.41, 0.6, 1.18, 1.45 Å-1.
4. Results and Discussion
We analyzed our data using isotropic models for the sake of simplicity, although it has
been recently demonstrated that an isotropic approximation can underestimate the diffusion
coefficient of the interlayer water molecules [17]. First a preliminary analysis was performed
using the simplest models, and some important conclusions were drawn. Then the data for Ni-
hectorite and Sm-hectorite were examined in the slow exchange approximation assuming that
QENS spectra consist of two components: the bound water component and the “free” water
component.
4.1. Preliminary analysis
4.1.1 High resolution data
The QENS spectra measured with IN10 were fitted by the following model (Figure 2):
),()(
)(1)()()(),( 22 ωωπ
ωδω QRQ
QQBQAQS ⊗⎥⎦
⎤⎢⎣
⎡+Γ
Γ+= (16)
The first term in the brackets (delta function) represents elastic scattering; the second
one (Lorentzian) approximates quasielastic scattering. R(Q,ω) is a resolution function, and ⊗
denotes the convolution operation. A(Q) and B(Q) are intensities of elastic and quasielastic
scattering, respectively.
The quasielastic fwhm’s (= 2Γ(Q)) obtained from the best fit of eq. 16 to the QENS
data measured with theIN10 are shown in Figure 3. There are no results for the Na-hectorite at
higher Q values, because the QENS spectra become too broad in this Q-region to be measured
with the backscattering technique. The fwhm for Na-hectorite shows Q-dependence that is
much steeper than for Ni-hectorite and Sm-hectorite; the latter results are very close to each
other. This result indicates that Ni2+ and Sm3+ cations interact with water molecules much
stronger than Na+.

15
Figure 2. Experimental QENS spectra (circles) measured on the IN10 backscattering
spectrometer. Lines: (black) the best fit with eq. 16; (green) elastic scattering; (red)
quasielastic scattering. FWHM_IN10.tif
Figure 3. fwhm’s of quasielastic scattering (fwhm = 2Γ(Q)) obtained from fitting model (eq.
16) to the experimental spectra measured on the IN10 spectrometer.

16
Figure 4. Intensity of elastic scattering A(Q) obtained from fitting model 16 to the
experimental spectra measured on the IN10 spectrometer.
The elastic scattering intensity A(Q) (Figure 4) contains a strong small angle scattering
contribution that is much higher for Na-hectorite at Q = 0.11 Å-1. This effect can be explained
by the difference in the samples preparation: because Na-hectorite sample was synthesized
already in the Na-form, no additional treatment was needed; in order to prepare another two
hectorite samples we had to saturate them with Sm3+ or Ni2+ (see Section 3.1 for details).
Thus we can suppose that, during preparation of the Sm-hectorite and Ni-hectorite samples
(suspension in the solutions, centrifugation, and filtration), we could lose the smaller clay
particles or somehow change the pore size distribution in the samples. High elastic intensity at
Q = 0.41 Å-1 is due to the (001) peak corresponding to the interlayer basal spacing (BS).
The A(Q) was found to be the same for all three samples except the above mentioned
points at Q = 0.11 Å-1 and 0.41 Å-1. This result is very important, because it indicates that
water molecules hydrating Ni2+ and Sm3+ cations cannot be considered as immobile in our
experiment, and the QENS component contains information on their diffusion mobility;
otherwise we would have observed an additional elastic scattering in comparison with the Na
sample, in which the water molecules hydrating the Na+ cation are in fast exchange with
“free” water molecules. In the case of Ni2+, the exchange between the bound and “free” water
17
is extremely slow, and the translation diffusion of the bound water molecules indicated in our
experiment must be attributed to the mobility of the whole hydration complex Ni2+(H2O)6.
Therefore the diffusion mobility of Ni2+ cation in the interlayer of the hectorite is high enough
to be measured with the backscattering spectrometer. For the Sm3+ cation, the exchange rate
between the bound and the “free” water is not known exactly [11]. However, the closeness of
the results obtained for the Sm-hectorite and Ni-hectorite samples suggests that the slow
exchange approximation is probably applicable to the Sm-hectorite sample as well.
4.1.2 Low resolution data
The position of the (001) reflection, which is visible in the angular dependency of the
integral intensity of scattered neutrons measured with the TOF spectrometer (Figure 5), gives
the values of the interlayer BS. These values indicate that all three samples are in a two-layer
hydrate state. The BS values show dependence on the hydration state of the cation: in the case
of the weakly hydrated interlayer Na+, the BS is significantly smaller than that for the strongly
hydrated Ni2+, although the ionic radius of Na+ is larger (0.98 Å [33]) than that for Ni2+ (0.78
Å [33]). The interlayer spacing for Sm-hectorite is larger than that for the two other samples,
which is an indication that Sm3+ cations in the clay interlayer (at least some of them) form
outer-sphere adsorption complexes.

18
Figure 5. Intensity of scattered neutrons as a function of scattering angle (TOF data). The BS
is indicated for each data set.
The QENS spectra, measured for the Na sample, were fitted by two models: model 16,
which was used for the analysis of the high resolution data, and the model that takes into
account individual reorientations of water molecules:
),(),()(
)(1)()()(),( 22 ωωωπ
ωδω QRQSQ
QQBQAQS rot ⊗⎥⎦
⎤⎢⎣
⎡⊗
+ΓΓ
+= , (17)
where Srot(Q,ω) is the rotation scattering law defined by eq. 9 (the first three terms of the
expansion), with the radius of rotation R0 = 1 Å (O-H distance in the water molecule). The
other terms of formula 17 are the same as in eq. 16. For the fitting of the low-resolution
QENS data by models 16 and 17, we used the results for the elastic intensity A(Q) found from
the analysis of the high-resolution spectra (Figure 4) after normalization by the total scattered
intensity in the Q range of 0.2 – 0.3 Å-1.
Figure 6. The low-resolution QENS spectra measured for the Na-hectorite sample. Lines:
(green) fit by model 16, (red) fit by model 17.

19
The quality of the fit by model 16 degrades at Q > 0.6 Å-1, and model 17 fits the
experimental spectra better at these Q values (Figure 6). The rotation diffusion constant was
found to be Dr = 0.06 ± 0.02 meV, this value is somewhat lower than that reported for the
bulk water at room temperature (Dr ≈ 0.1 meV [34]). The translational diffusion QENS
widths (fwhm = 2Γ(Q)) for the Na-hectorite sample are shown in Figure 7. The results
obtained using models 16 and 17 are very close to each other for Q ≤ 0.71 Å-1 (Q2 < 0.51 Å-2)
and can be described by the simple diffusion model 8 with diffusion coefficient D = (0.63 ±
0.03) x 10-9 m2/s. The difference between models 16 and 17 arises at higher Q values, where
effect of reorientations becomes important; whereas the result for model 16 is still close to the
strait line predicted by the simple diffusion law, the fwhm, obtained using model 17, shows
increasingly lower values tending to its high Q2 limit, as it is supposed by the jumping
mechanism of diffusion [18]. However, neither the Singwi-Sjölander [35] nor the Hall-Ross
[36] jump diffusion models can fit the experimental data for Na-hectorite with good accuracy
(see Figure 7), therefore the water diffusion in the Na-hectorite is probably a more complex
process than is supposed by the simple jump diffusion models.
Figure 7. The fwhm of the translational QENS component obtained for Na-hectorite sample
with high resolution (green squares) and low resolution (circles). Open circles: model 16,
black circles: model 17. Red line represents simple diffusion law (eq. 8). Blue line is a fit by
the Hall-Ross model [36].

20
The agreement between the results for the Na-hectorite sample obtained with the high
and low resolutions is good (Figure 7). Unfortunately the quasielastic widths Γ(Q) for this
sample are measurable with a backscattering spectrometer at low Q (Q ≤ 0.6 Å-1) only.
Malikova et al. [17] reported a good agreement in the relaxation times of water mobility in a
synthetic Na-hectorite extracted with the NSE (high resolution) and TOF (low and medium
resolutions) techniques in a Q range up to Q = 1 Å-1 [17] using an approximation equivalent to
model 16. Thus the approximation that we use for the data analysis is sufficient for the
description of the experimental data obtained for the Na-hectorite sample. Therefore we did
not try to fit our QENS spectra using KWW function (eq. 10), which would complicate our
analysis of the Sm-hectorite and Ni-hectorite samples.
The obtained water diffusion coefficient D = (0.63 ± 0.03) x 10-9 m2/s for the Na-
hectorite sample is higher than D = (0.43 – 0.46) x 10-9 m2/s reported in ref 17 for the same
system. One of the reasons for this difference could be some differences in the samples
preparation: the water content for the sample described in ref 17, n(H2O)/Na+ = 7.1, was
considerably lower than in our case, n(H2O)/Na+ = 11.5. Another possible reason is the elastic
neutron scattering on clay atoms. The use of a fluorated clay mineral strongly reduces the
elastic scattering from the clay layer atoms in comparison to natural clays. However, for the
fluorated hectorite, the elastic scattering is small but not negligible: at large Q values, it is of
about 5% of the total intensity, but at smaller Q values, it can be much higher as a result of the
small angle scattering (Figure 4). In our case, the contribution of the elastic scattering to the
total intensity is about 25% at Q = 0.2 Å-1. If we ignored the elastic contribution, the water
diffusion coefficient estimated with the resolution of our experiment (Δ ~ 30 μeV) would be
D = (0.55 ± 0.03) x 10-9 m2/s.
The QENS spectra measured for the Ni-hectorite and Sm-hectorite samples were fitted
by expression 17. The obtained fwhm of the translational QENS component is shown in
Figure 8 together with the data for the Na-hectorite and the high-resolution results. The
presented fwhm indicates that water molecules in the Na-hectorite are more mobile than those
in the Sm-hectorite and Ni-hectorite samples. The result for the Sm-hectorite is close to that
for the Ni-hectorite; this means that interaction between water and Sm3+ is strong, and the
Sm3+ is most probably fully hydrated. Thus our QENS results do not support the previous
interpretation of the neutron diffraction experiments that the Sm3+ cation forms an inner-
sphere complex with the clay surface. The higher mobility of water molecules in the Sm-
hectorite sample in comparison to the Ni-hectorite leaves an opportunity for a compromise
with the results of the neutron diffraction experiments: it can be supposed that not all
21
adsorbed Sm3+ cations interact with water molecules, probably because of the precipitation.
For example, in the Sm hydroxide, the number of oxygen atoms closest to the Sm, NO = 9,
and Sm-oxygen distance, RSmO = 2.47 Å [37], are very similar to the parameters of the first
coordination shell of the Sm3+ cation in an aqueous solution. This interpretation is supported
by our cationic exchange analysis: it was found that 32% of the adsorbed Sm3+ cations are not
exchangeable.
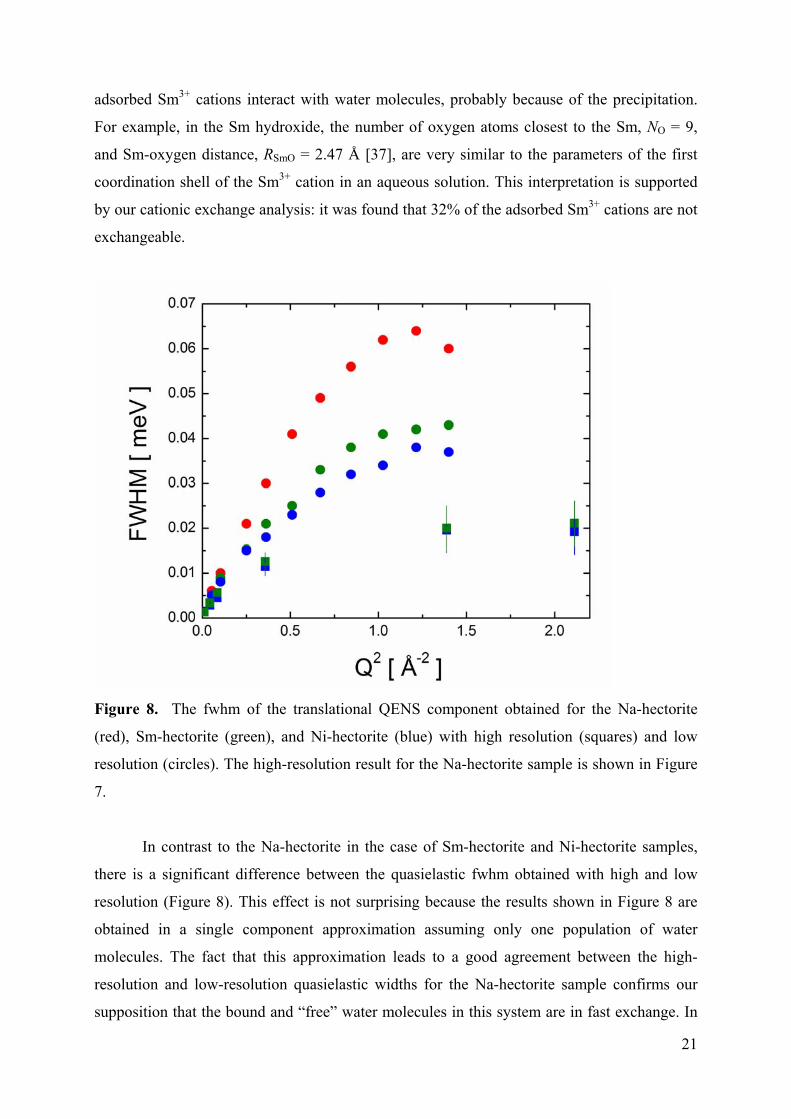
Figure 8. The fwhm of the translational QENS component obtained for the Na-hectorite
(red), Sm-hectorite (green), and Ni-hectorite (blue) with high resolution (squares) and low
resolution (circles). The high-resolution result for the Na-hectorite sample is shown in Figure
7.
In contrast to the Na-hectorite in the case of Sm-hectorite and Ni-hectorite samples,
there is a significant difference between the quasielastic fwhm obtained with high and low
resolution (Figure 8). This effect is not surprising because the results shown in Figure 8 are
obtained in a single component approximation assuming only one population of water
molecules. The fact that this approximation leads to a good agreement between the high-
resolution and low-resolution quasielastic widths for the Na-hectorite sample confirms our
supposition that the bound and “free” water molecules in this system are in fast exchange. In
22
the case of Ni-hectorite, the single component approximation is not applicable, because we
expect to observe two distinct QENS components corresponding to the bound and “free”
water molecules. The high-resolution QENS is more sensitive to the slow motions of the
bound water molecules, and the low-resolution data reflects mainly the faster motions of the
“free” water molecules. Because the results obtained for the Sm-hectorite look very similar to
those for the Ni-hectorite, one can suppose that the slow exchange approximation is likely
applicable to the Sm-hectorite sample as well.
4.2. Slow exchange approximation for Ni-hectorite and Sm-hectorite
The aim of the further analysis is to determine the diffusion coefficients of the
interlayer cations Ni2+ and Sm3+ supposing that these cations diffuse together with their
hydration shells. Because of complexity of the studied systems and some deficit of the
experimental data measured with high resolution, we can only make some rough estimations.
First the QENS spectra for the Ni-hectorite were fitted by the following model (Figure
9):
[ ] ),()),()1(),()(()()(),( ωωαωαωδω QRQSQSQBQAQS freebound ⊗−++= , (18)
where α is the fraction of the bound water molecules. Sbound(Q,ω) and Sfree(Q,ω) are the QENS
components for the bound and “free” water molecules respectively. The other terms in
expression 18 are the same as those in 16 and 17.
The Sfree(Q,ω) was modeled in the same way as before:
),()(
)(1),( 22 ωωπ
ω QSQ
QQS rot
free
freefree ⊗
+Γ
Γ=
where ),( ωQSrot is a rotational scattering law, the same as in model 17. It should be noted
that effect of individual rotations of water molecules is only important at Q > 0.6 Å-1 and only
for the low-resolution analysis, because such rotations are too fast to be detected with a
backscattering spectrometer.
In the first approximation Sbound(Q,ω) was expressed as:
22 )()(1),(ωπ
ω+Γ
Γ=
QSbound
boundbounde (19)
Only the parameters B(Q), Γfree(Q) and Γbound(Q) were varied in the fitting procedure.
For A(Q) and parameters of ),( ωQSrot , the values found from the preliminary analysis were
used. For six water molecules hydrating Ni2+, α = 0.25. The fitting procedure was iterative:
when the high-resolution data was fitted, Γfree(Q) was kept fixed, using the value obtained

23
from the low-resolution analysis. And, vice versa, fitting the low-resolution spectra, we used,
in the same way, the high-resolution result for Γbound(Q).
The result of the fit, fwhm = 2Γbound(Q), is shown in Figure 10. Unfortunately, only
four Q values are now available. The spectra at Q = 0.11 Å-1 and 0.41 Å-1 were not fitted
because of the strong elastic scattering (the small angle scattering and (001) peak). The
spectrum at Q = 1.45 Å-1 (Q2 = 2.11 Å-2) was also excluded from the analysis, because the
low-resolution data was not available at this Q value, and, therefore, a separation of
Sbound(Q,ω) and Sfree(Q,ω) was hardly possible. The fit of the first three points with the simple
diffusion model 8 gives the three-dimensional (3D) diffusion coefficient of the Ni2+ cation in
the hectorite interlayer space: DNi = (0.12 ± 0.02) x 10-9 m2/s. However, this value is only a
high limit estimation of DNi, because expression 19 does not take into account rotation
diffusion.
Figure 9. The QENS spectra for the Ni-hectorite sample measured with high resolution (top)
and low resolution (bottom). Curves: (black) the fit by model 18; (green) elastic scattering;
(red) bound water component; (blue) “free” water component.

24
Figure 10. The fwhm of the Sbound(Q,ω) component for the Ni-hectorite sample: the result of
the fit using model 19 (black circles); the result of the fit using model 20 with Δrot = 4.5 μeV
(open circles). Lines represent a fit by model 8.
In a simplified form, taking into account rotation effects, the Sbound(Q,ω) can be
expressed as (see eqs. 6, 7b, and 9):
( ) 2222. )()(
))(1()(
)()(),(
ωωω
+Δ+Γ
Δ+Γ−+
+ΓΓ
≈rotbound
rotbound
bound
boundbound Q
QQEISF
QEISFQS , (20)
where Δrot is the rotational quasielastic width.
The structure factors EISF(Q) = )( 020 QRj , calculated using the isotropic
approximation 9, for isolated rotations of water molecules and reorientation of the hydration
complex Ni2+(H2O)6 are plotted in Figure 11. The radius of rotation R0 = 1 Å (O-H distance in
the water molecule) was used to calculate the EISF(Q) for the isolated rotations of water
molecules; for the rotational radius of the Ni2+(H2O)6 complex we used the Ni – H distance R0
= 2.7 Å found in neutron diffraction experiments on aqueous solutions and hydrated Ni-
montmorillonite [9]. The individual rotations of water molecules cannot considerably affect
our results, at least at Q2 values less than 0.4 Å-2, even if we suppose that this rotations are
much slower than in bulk water, because at these Q values EISF(Q) >0.85 and the Sbound(Q,ω)
is dominated by the first term of eq. 20. However the reorientation of the hydration complex
Ni2+(H2O)6 can be visible even at low Q values.

25
Figure 11. The structure factors EISF(Q) = )( 020 QRj for individual rotations of water
molecules (black) and for the reorientation of the hydration complex Ni2+(H2O)6.
The reorientation correlation time τ1 of the hydration complex Ni2+(H2O)6 in an
aqueous solution calculated by molecular dynamics (MD) simulation was found to be τ1 =150
ps [38]. The corresponding quasielastic width, fwhm = 2h/τ1 ≈ 9 μeV, is very close to the
fwhmbound shown in Figure 10 at Q2 =1.39 Å-2, where the first term of eq. 20 vanishes (Figure
11). On the other hand, a hypothesis that the observed quasielastic signal from the bound
water molecules is purely rotational is not consistent with our experimental data: model 18
with Sbound(Q,ω) defined by model 20, and the parameter Γbound(Q) = 0 does not fit the high-
resolution QENS spectra (see Figure 12).
The accuracy of our high-resolution data does not allow us to introduce another fitting
parameter. Nevertheless, one can estimate the lower limit of Γbound(Q). It was already
mentioned above that, at Q2 =1.39 Å-2, the second term of eq. 20 dominates (Figure 11). The
fwhm value at Q2 =1.39 Å-2 was used as an upper limit estimation for the rotational width Δrot
rotrottrQFWHM Δ≈Δ+Δ≈= 2)(2)39.1( 2 (21)
The fit of the high-resolution data at Q = 0.21 Å-1, 0.29 Å-1 and 0.6 Å-1 by models 18
and 20 with Δrot estimated from eq. 21 (Figure 12) gives the low limit estimations for the

26
Γbound(Q) and the diffusion coefficient of the Ni2+ cation: DNi = (0.07 ± 0.02) x 10-9 m2/s
(Figure 10).
Figure 12. The high-resolution QENS for the Ni-hectorite sample (circles) fitted with models
18 and 20 using the following constrains: Γbound(Q) = 0, Δrot is a fitted parameter (black line);
Δrot = 4.5 μeV, Γbound(Q) is a fitted parameter (red line). The EISF(Q) = )( 020 QRj is calculated
using R0 = 2.7 Ǻ (see the text for details).
Thus, the upper and lower limit values for DNi, taking into account the error bars, give
the estimation of the diffusion coefficient of the Ni2+ cation in the interlayer of the hectorite:
DNi = (0.05 – 0.14) x 10-9 m2/s.
The QENS spectra for the Sm-hectorite sample were analyzed in the same way as the
Ni-hectorite data, but for two cases:
a) All adsorbed Sm3+ cations interact with water molecules. In this case the fraction of
the bound water molecules is α = 0.27.
b) Only half of the adsorbed Sm3+ interact with water molecules, as it follows from the
neutron diffraction experiments, α = 0.135.
A distance of R0 = 3.1 Å for Sm-H correlation, as obtained from neutron diffraction
experiments [4-6], was used in the EISF(Q) calculation for the rotation of the hydrated
Sm3+(H2O)8 complex. Unfortunately, the statistical accuracy of our high-resolution data is not
good enough to give a preference to one of the above cases from the goodness of fit. The
quality of the fit of the experimental QENS is approximately the same for both cases. In case
(b) (α = 0.135), the smaller contribution of the Sbound(Q,ω) component is compensated by the

27
weak narrowing of the Sfree(Q,ω) component (by ~ 10 %) and by the strong decrease of the
Sbound(Q,ω) width Γbound(Q). The fwhm of Sbound(Q,ω) for both cases is plotted in Figures 13
and 14, and the estimated values of the diffusion coefficients for the Sm3+ cation are shown in
Table 1. The Dsm values found for case (a) are slightly higher than DNi, while in case (b) it is
DSm < DNi. The result for case (b) looks more realistic, because the Sm3+ cation is larger than
Ni2+, and it is hydrated by a larger number of water molecules, therefore its diffusion mobility
should be slower.
Figure 13. The fwhm of the Sbound(Q,ω) component for the Sm-hectorite sample obtained
with α = 0.27: the result of the fit using model 19 (black circles); the result of the fit using
model 20 with Δrot = 4.9 μeV (open circles). Lines represent a fit by model 8.
For the first time the diffusion mobility of strongly hydrated interlayer cations have
been measured by QENS. The previous QENS study of the rotational and translational
diffusional dynamics of water in Ca2+- and Mg2+-exchanged montmorillonite carried out by
Tuck et al. [23] with a similar experimental setup found no evidence of the diffusion mobility
of the water molecules hydrating interlayer cations, although Mg2+, like Ni2+, is very strongly
hydrated. The MD simulation performed for Mg-beidellite [39] also showed that, over the
time scales of the simulations (500-1175 ps), the solvated Mg2+ cations remain in fixed
locations near negative charge sites within the clay layers. Natural montmorillonite and
beidellite clay minerals used for those studies are clays with tetrahedral substitutions, whereas
the synthetic hectorite that we probed in our experiments contains only octahedral
substitutions. Therefore, our results indicate that interlayer cations are more mobile in clays

28
with octahedral substitutions than in clays with tetrahedral ones, where negative charge sites
locate closer to the layer surface.
Figure 14 The fwhm of the Sbound(Q,ω) component for the Sm-hectorite sample obtained with
α = 0.135: the result of the fit using model 19 (black circles); the result of the fit using model
20 with Δrot = 3.3 μeV (open circles). Lines represent a fit by model 8.
Table 1. Diffusion coefficients of Ni2+ and Sm3+ obtained for different values of the
parameter α (Fraction of the bound water molecules)
Cation α Dion x 10-9 m2/s
Ni2+ 0.25 0.05 – 0.14
Sm3+ 0.27 0.06 – 0.18
0.135 0.04 – 0.11
The QENS method, with the use of fluorated clay, is very promising for the study of
hydration of clay interlayer cations. Not only diffusion coefficients but also coordination
numbers can be estimated. In the case of the present study, the obtained information is not
very detailed because of the lack of experimental data measured at high resolution: only
spectra measured by seven detectors were available, and the statistical accuracy was also
poor. More detailed results could be achieved with the use of more modern backscattering
spectrometers, such as IN16 (ILL), SPHERES (FRM-2), or BASIS (SNS). The combination
29
of MD simulations with experimental results would also be very helpful for the interpretation
of the latter.
5. Conclusion
QENS experiments were performed with Na-hectorite, Ni-hectorite, and Sm-hectorite
samples in order to compare the results obtained for Sm3+ with other interlayer cations:
strongly hydrated Ni2+ and relatively weakly hydrated Na+. It was found that water mobility in
the Sm-hectorite sample is very close to the water mobility in the Ni-hectorite. This is only
possible if the Sm3+ ion is fully hydrated. A compromise with the neutron diffraction data can
be found, assuming that not all adsorbed Sm interacts with water molecules, probably due to
precipitation. This is supported by the cationic exchange experiment.
It was shown that water molecules hydrating Ni2+ and Sm3+ exhibit diffusion mobility
measurable with backscattering spectrometers. The diffusion coefficients of the exchangeable
cations were found using the slow exchange approximation to be DNi = (0.05 – 0.14) x 10-9
m2/s and DSm = (0.04 – 0.18) x 10-9 m2/s.
Acknowledgment.
We gratefully acknowledge financial support from the EURATOM (Contract No.
044806: “Hydration and Hydrolysis of Exchangeable Radionucleides in Clays”). This
research project has been supported by the European Commission under the 6th Framework
Programme through the Key Action: Strengthening the European Research Infrastructures.
Contract No. RII3-CT-2003-505925 (NMI 3). L. Le Forestier thanks the French national
research agency (ANR) for financial support of synthesis equipment (project ANR-07-JCJC-
0013-01).
Supporting Information Available: Simple model for fast and slow exchange limits of
QENS. This material is available free of charge via the Internet at http://pubs.acs.org.
References and Notes
1. Sposito, G.; Skipper, N.T.; Sutton, R.; Park, S.-H.; Soper, A.K.; Greathouse, J.A.
Proc. Natl. Acad. Sci. U.S.A. 1999, 96, 3358-3364.
2. Bradbury, M.H.; Bayens, B. Geochim. Cosmochim. Acta 2002, 66, 2325-2334.
3. Pitteloud, C.; Powell, D.H; Gonzalez, M.A.; Cuello, G.J. Colloids and Surfaces A:
Physicochem. Eng. Aspects 2003, 217, 129-136.
30
4. Sobolev, O.; Charlet, L.; Cuello, G. J.; Gehin, A.; Brendle J.; Geoffroy, N. J. Phys.: Condens. Matter. 2008, 20, 104207.
5. Sobolev, O.; Charlet, L.; Cuello, G.J.; Gehin, A.; Brendle, J. Radiochem. Acta 2008, 96, 1–5.
6. Sobolev, O.; Charlet, L.; Cuello, G.J. ILL Experimental Report, Prop. No 6-05-742
7. Slade, P. G.; Self, P. G. and Quirk J. P. Clays Clay Minerals 1998, 46, 629–635.
8. Kowal-Fouchard, A.; Drot R.; Simoni, E.; Marmier, N.; Fromagec, F. and Ehrhardt, J-
J; New J. Chem. 2004, 28, 864–869.
9. Pitteloud, C.; Powell, D. H.; and Fischer, H. E. Phys. Chem. Chem. Phys. 2001, 3,
5567-5574.
10. Smith, D.W. Inorganic Substances: A Prelude to the Study of Descriptive Inorganic
Chemistry; Cambridge University Press: Cambridge, U.K., 1990.
11. Salmon, P. S.; Howell W. S.; Mills R. J. Phys. C: Solid State Phys. 1987, 20, 5727-
5747.
12. Hunt, J. P.; Friedman, H. L. Prog. Inorg. Chem. 1983, 30, 359.
13. Impey, R. W.; Maden, P. A.; McDonald, I. R. J. Phys. Chem. 1983, 87, 5071.
14. Koneshan, S.; Rasaiah, J. C.; Lynden-Bell, R. M.; Lee S. H. J. Phys. Chem. B 1998,
102, 4193-4204.
15. Malikova , N.; Cadene, A.; Marry, V.; Dubois, E.; Turq, P.; Zanotti, J.-M.; Longeville
S. Chemical Physics 2005, 317, 226–235.
16. González, F.; Jurányi, F.; Van Loon, L.; Gimmi, T. Eur. Phys. J. Special Topics 2007,
141, 65–68.
17. Malikova, N.; Cadene, A.; Dubois, E.; Marry, V.; Durand-Vidal, S.; Turq, P.; Breu, J.;
Longeville, S.; Zanotti, J.-M. J. Phys. Chem. C 2007, 111, 17603-17611.
18. Bee, M. Quasielastic Neutron Scattering: Principles and Applications in Solid State
Chemistry, Biology and Materials Science, Adam Hilger, Bristol, 1988.
19. Bee, M. Chemical Physics 2003, 292, 121–141.
20. Cummins, H.Z.; Gen, Li.; Hwang, Y.H.; Shen, G.Q.; Du, W.M.; Hernandez, J.; Tao,
N.J.Z. Phys. B 1997, 103, 501–519.
21. Arbe, A.; Colmenero, J.; Monkenbusch M.; Richter, D. Phys. Rev. Lett. 1998, 81, 590-
593.
22. Sobolev, O.; Novikov, A.; Pieper, J. Chem. Phys. 2007, 334, 36-44.
23. Tuck, J.J.; Hall, P.L.; Hayes, M.H.B.; Ross, D.K.; Poinsignon, C. J.Chem. Soc.,
Faraday Trans. 1984, 80, 309.
24. Cebula, D.J.; Thomas, R.K.; White, J.W. Clays Clay Miner. 1981, 29, 241.

31
25. Swenson, J.; Bergman, R.; Howells, W.S. J.Chem.Phys. 2000, 113, 2873.
26. Swenson, J.; Bergman, R.; Longeville, S. J.Chem.Phys. 2001, 115, 11299.
27. Swenson, J.; Howells, W.S. J. Chem. Phys. 2002, 117, 857.
28. Mamontov, E. J. Chem. Phys. 2004, 121, 9193.
29. Marry, V.; Malikova, N.; Cadene, A.; Dubois, E.; Durand-Vidal, S.; Turq, P.; Breu, J.;
Longeville, S.; Zanotti, J.-M. J.Phys.: Condens. Matter 2008, 20, 104205.
30. Salmon, P.S. J. Phys. C: Solid State Phys., 1987, 20, 1573-1587.
31. Gerstmans, A.; Urbanczyk, L.; Jérôme, R.; Robert, J.L.; Grandjean, J. Clay Min.,
2008, 43, 205-212.
32. Hamilton, D.L.; Henderson, C.M.B. Mineral. Mag. 1968, 36, 832-838.
33. Emsley, J. The Elements; Oxford University Press: New York, 2000.
34. Teixeira, J.; Bellissent-Funel M.-C.; Chen, S. H.; Dianoux, A. J.; Phys. Rev. A 1985,
31, 1913-1917.
35. Singwi K. S. and Sjolander A. Phys. Rev. 1960, 119, 863-871.
36. Hall P. L. and Ross D. K. Mol. Phys. 1981, 42, 673-682.
37. Milligan, W.O.; Mullica, D.F.; Oliver, J.D. J. Appl. Crystallogr. 1979, 12, 411-412.
38. Egorov, A.A.; Komolkin, A.V.; Lyubartsev, A.P.; Laaksonen, A. Theor. Chem. Acc.
2006, 115, 170-176.
39. Greathouse, J.A.; Refson, K.; Sposito, G. J. Am. Chem. Soc. 2000, 122, 11459-11464.