h.w.w. spoon , a.f.m. moorwood - arxiv · we have re-analyzed the 6–12µm iso spectrum of the...
TRANSCRIPT

arX
iv:a
stro
-ph/
0310
721v
1 2
4 O
ct 2
003
Astronomy & Astrophysicsmanuscript no. paper April 11, 2018(DOI: will be inserted by hand later)
Mid-infrared spectral evidence for a luminous dust enshroudedsource in Arp 220 ⋆
H.W.W. Spoon1, A.F.M. Moorwood2, D. Lutz3, A.G.G.M. Tielens1,4, R. Siebenmorgen2, and J.V. Keane5
1 Kapteyn Institute, P.O. Box 800, NL-9700 AV Groningen, the Netherlands2 European Southern Observatory, Karl-Schwarzschild Strasse 2, D-85748 Garching, Germany3 Max-Planck-Institut fur Extraterrestrische Physik (MPE), Postfach 1312, D-85741 Garching, Germany4 SRON, P.O. Box 800, NL-9700 AV Groningen, the Netherlands5 NASA-Ames Research Center, Mail Stop 245-6, Moffett Field, CA 94035, USA
Received date; accepted date
Abstract. We have re-analyzed the 6–12µm ISO spectrum of the ultra-luminous infrared galaxy Arp 220with the conclusionthat it is not consistent with that of a scaled up version of a typical starburst. Instead, both template fitting with spectra of thegalaxies NGC 4418 and M 83 and with dust models suggest that itis best represented by combinations of a typical starburstcomponent, exhibiting PAH emission features, and a heavilyabsorbed dust continuum which contributes∼40% of the 6–12µm flux and likely dominates the luminosity. Of particular significance relative to previous studies of Arp 220 is the factthat the emission feature at 7.7µm comprises both PAH emission and a broader component resulting from ice and silicateabsorption against a heavily absorbed continuum. Extinction to the PAH emitting source, however, appears to be relativelylow. We tentatively associate the PAH emitting and heavily dust/ice absorbed components with the diffuse emission region andthe two compact nuclei respectively identified by Soifer et al. (2002) in their higher spatial resolution 10µm study. Both thesimilarity of the absorbed continuum with that of the embedded Galactic protostars and results of the dust models imply thatthe embedded source(s) in Arp 220 could be powered by, albeitextremely dense, starburst activity. Due to the high extinction,it is not possible with the available data to exclude that AGN(s) also contribute some or all of the observed luminosity. In thiscase, however, the upper limit measured for its hard X-ray emission would require Arp 220 to be the most highly obscured AGNknown.
Key words. Galaxies: individual: Arp220 — Galaxies: ISM — Galaxies: nuclei — Galaxies: starburst — Infrared: galaxies
1. Introduction
The galaxy Arp 220 (IC 4553; cz=5450km/s; D=73 Mpc) wasoriginally classified by Arp (1966) as a “galaxy with adjacentloops”. Its optical image (1′′ = 352 pc) shows faint structures,reminiscent of tails or loops, suggesting it to be the remnant ofa recent galaxy merger (Toomre & Toomre 1972). IRAS (1983)increased interest in Arp 220 through the discovery of its far-IRluminosity and infrared-to-blue ratio which characterized it asan extreme member of the “unidentified infrared sources” dis-covered during the mission (Houck et al. 1984; Soifer et al.1984). When later the spectroscopic redshifts of these “uniden-tified infrared sources” became available, Arp 220 turned outto have a similarly large infrared luminosity (1.35×10¹² L⊙),making it the nearest member (by a factor of∼2) of the new
Send offprint requests to: H.W.W. Spoon([email protected])⋆ Based on observations with ISO, an ESA project with instruments
funded by ESA Member States (especially the PI countries: France,Germany, the Netherlands and the United Kingdom) and with the par-ticipation of ISAS and NASA
class of UltraLuminous InfraRed Galaxies (ULIRGs; Sanderset al. 1988), with LIR ≥1012 L⊙. Numerous studies across allwavebands have since examined Arp 220 in close detail, alsoshowing this nearest ULIRG to be unusual in some aspectsrather than being typical for the class.
Like most other ULIRGs, Arp 220 is the product of theinteraction of two gas-rich disk galaxies (Sanders & Mirabel1996). Groundbased observations at 10–30µm suggest that itsluminosity arises in the innermost 250 pc (Wynn-Williams &Becklin 1993). Radio and mm observations reveal its two nu-clei to be surrounded by molecular disks of r∼100 pc, whichcounterrotate with respect to each other (Sakamoto et al. 1999).The eastern nucleus seems to be embedded within an outer gasdisk of r∼1 kpc, which rotates in the same sense. The westernnucleus is connected to the eastern nucleus by a thin gas bridge,traced in Hi absorption, and appears to lie above the outer gasdisk (Mundell et al. 2001). The projected separation of the twonuclei amounts to 345 pc (0.98′′; Baan & Haschick 1995). Highsensitivity VLBI observations disclose the presence of multi-ple compact radio sources dispersed over the two nuclei. Theknots are consistent with free-free emission from luminousra-

2 H.W.W. Spoon et al.: Mid-infrared spectral evidence for a luminous dust enshrouded source in Arp 220
Fig. 1.The 2–3000µm spectrum of Arp 220.Filled circlesrepresent the IRAS fluxes. Spectra shown are: the smoothed 2.4–4.9µmISO-PHT-S spectrum (Spoon et al. 2002); the 3.2–3.8µm CGS4 spectrum obtained in 1.2′′ slit (Imanishi & Dudley 2000); the5.0–16µm ISO-CAM-CVF spectrum (Tran et al. 2001); the 17–22µm UCL spectrum (Smith et al. 1989); the smoothed 45–200µm ISO-LWS spectrum (Fischer et al. 1997). Other spectral data included in the plot are ISO-PHT photometry (Klaas et al.1997; M.Haas, priv. comm.); ISO-SWS background subtractedcontinuum measurements (E.Sturm, priv. comm.); UKIRT andSCUBA far-IR photometry (Eales et al. 1989; Dunne et al. 2000, 2001) and mm-observations (Anantharamaiah et al. 2000). Thedash-dotted lineis one choice for the local continuum in the 5–25µm region (see also Fig. 5). The inset shows a comparisonof the 5.8–11.7µm ISO-PHT-S (Spoon et al. 2002) and the 5.0–16µm ISO-CAM-CVF spectra (shown asgreyandblack linesrespectively) with the Keck-MIRLIN photometry (filled circles) of Soifer et al. (1999).
dio supernovae expanding in a dense medium (Smith et al.1998, 1999).
At shorter wavelengths (in the UV, optical and near-IR)the view towards the nuclear components is greatly impairedby strong dust extinction of at least AV=30–50 (Sturm et al.1996). In the mid-IR, the dust opacity (Aλ) is a factor of 10–100less than at optical wavelengths and Smith et al. (1989) usedthis property to study the nature of the central power sourcein Arp 220 in the 8–13µm (N-band) and 17–22µm (Q-band)atmospheric windows. Based on the weakness of the 11.2µmPAH emission band within the deep 9.7µm silicate absorptionfeature, they concluded that only 2–10% of the total infraredluminosity is powered by starburst activity, with an obscuredAGN responsible for the rest. Further analysis of the 9.7µm sil-icate absorption feature led Dudley & Wynn-Williams (1997)to conclude, however, that the obscured power source resem-bles a scaled-up embedded protostar.
Not limited to the mid-IR atmospheric windows, ISO spec-troscopy revealed two pronounced spectral features in the pre-viously unstudied 5–8µm range. In line with ISO observationsof Galactic star forming regions, the two features were identi-fied as the 6.2µm and 7.7µm PAH emission bands (Genzel etal 1998). Using the ratio of 7.7µm PAH emission to the un-
derlying 7.7µm continuum as a criterium to discern starburst-and AGN-dominated galaxies, Genzel et al. (1998), Lutz et al.(1998), Spoon et al. (1998), Rigopoulou et al. (1999) and Tranet al. (2001) classified Arp 220 as starburst-dominated. Highangular resolution groundbased N-band spectroscopy has sinceshown the 11.2µm PAH emission in the nuclear region to bediffusely distributed over the central∼2′′ and the starburst as-sociated with the PAH emission not to be able to account formore than 10–50% of the bolometric luminosity (Soifer et al.2002). In summary, the mid-IR low-resolution spectral diag-nostics appear mostly starburst-like but star formation appearsquantitatively insufficient to account for the bolometric lumi-nosity, unless strongly obscured or otherwise modified. Thesame is, to a lesser degree, true for the more direct tracing ofstarburst activity by mid-IR fine-structure lines. The ratio of∼1/37 of starburst ionizing luminosity and bolometric luminos-ity, derived by Genzel et al. (1998) for this source, is aboutafactor 2 less than in comparison starbursts.
Since Arp 220 is often regarded as a nearby template fordusty galaxies at high redshift undergoing vigorous star for-mation (e.g. faint SCUBA sources), it is imperative to clearlyidentify its power source(s). Despite the quantitative problemswith the starburst origin for the luminosity, alluded to above,

H.W.W. Spoon et al.: Mid-infrared spectral evidence for a luminous dust enshrouded source in Arp 220 3
the general consensus since ISO has been massive young stars(Genzel & Cesarsky 2000). However, the infrared luminousgalaxy NGC 4945, which shows no outward evidence for anactive galactic nucleus even in ISO observations (Genzel etal.1998; Spoon et al. 2000), has turned out to contain a heav-ily obscured AGN visible only in hard X-rays (Iwasawa et al.1993; Done et al. 1996; Guainazzi et al. 2000). For Arp 220,BeppoSAX and Chandra observations do not detect a similarhard X-ray source (Iwasawa et al. 2001; Clements et al. 2002).The only possibility for an energetically significant AGN toexist in Arp 220 would therefore be in the form of a deeplyembedded source, hidden behind a ‘Compton-thick’ shell ofNH ≥1025 cm−2 with a covering factor close to unity (Iwasawaet al. 2001). The presence of huge amounts of molecular gas inthe central parts (∼1010M⊙; Scoville et al. 1997; Sakamoto etal. 1999) indicates that sufficient obscuring material is indeed athand. And the very large 850µm dust-continuum flux to 7.7µmPAH flux (Haas et al. 2001) could mean that the luminosity ofthis embedded source is redistributed into the far-IR.
2. The infrared spectrum of Arp 220
The 2–3000µm spectral energy distribution of Arp 220 (Fig. 1)is characterised by a steeply rising dust continuum, setting inaround 4–5µm, and leading up to a remarkably strong far-IRflux peak at 60–100µm. The most prominent features in theinfrared spectrum are the silicate absorption features at 9.7µmand 18µm and a broad flux peak at 7.8µm.
2.1. The mid-IR spectrum of Arp 220
In Fig. 2 we compare the mid-IR spectra of Arp 220, NGC 4418and the central region of the starburst galaxy M 83. At first sightthe three spectra look quite similar. The spectral structure in thespectrum of NGC 4418 is, however, the product of strong iceand silicate absorptions (Spoon et al. 2001), whereas the spec-trum of M 83 is dominated by the commonly observed emissionbands of Polycyclic Aromatic Hydrocarbons (PAHs). The spec-trum of Arp 220 shows characteristics of both: PAH emission isreadily detected at 6.2µm and 11.2µm (and in the groundbased3µm spectrum; Imanishi & Dudley 2000), while absorptionsfrom water ice and silicates are found at 6.0µm and 9.7µm,respectively (Spoon et al. 2002). The strongest feature in thespectrum, peaking at 7.7µm, has been previously attributed ex-clusively to PAH emission. On closer inspection, however, thefeature seems to be a blend of a 7.7µm PAH emission featureand a continuum peak resulting from absorption by ice on theshort wavelength side and silicates on the long wavelength side.
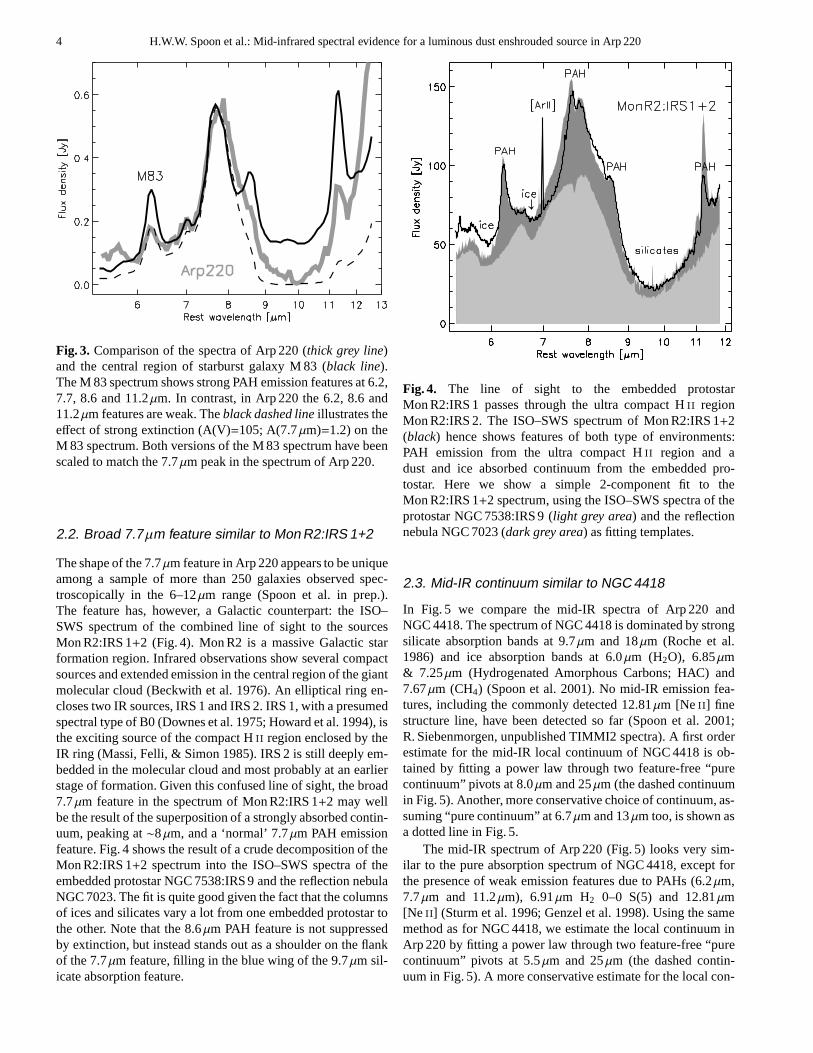
Close comparison of the 7.7µm feature in the spectrum ofArp 220 with the 7.7µm PAH feature in the spectrum of thestarburst galaxy M 83 (Fig. 3) shows that the 7.7µm featurein Arp 220 is quite broad. Moreover, the ratio of the 7.7µmpeak to the 6.2µm and 11.2µm PAH bands is very large inArp 220 compared to other sources (cf. Fig. 3). The profile of7.7µm PAH emission bands is, however, known to be very sta-ble over a wide range of integrated galaxy spectra (Helou etal. 2000). Peeters et al. (2002) found that Galactic ISM spectrashow a similarly stable 7.7µm PAH feature. Only for evolved
Fig. 2. A comparison of the ISO–PHT–S spectra of M 83,Arp 220 and NGC 4418. While the spectrum of M 83 is dom-inated by PAH emission bands, the spectrum of NGC 4418 isdominated by absorption bands of ices and silicates. The spec-trum of Arp 220 shows characteristics of both. The spectra ofM 83 and NGC 4418 have been scaled and offset.
stars and isolated Herbig AeBe stars are the width and centralwavelength of the 7.7µm PAH feature known to vary (Peeterset al. 2002). These stars are however very unlikely to domi-nate the spectrum of Arp 220. Therefore, there is no reason toassume that PAH features in Arp 220, if present, should havean intrinsically different shape than in any other galaxy spec-trum. Likewise, while the relative strengths of the PAH featuresare known to vary from source to source, no Galactic or extra-galactic sources show such extreme ratios as Arp 220 (Peeterset al. 2002). Alternatively, the large width of the 7.7µm fea-ture might also be the result of a strong velocity dispersionwithin the PAH emitting gas (∆v∼5000 km/s). A similar ve-locity broadening is, however, not observed for the 6.2 and11.2µm PAH features. Strong extinction as a cause for theunusual strength and width of the 7.7µm peak can also beruled out. This is best illustrated by fitting a starburst spec-trum (here: M 83) to the peak of the 7.7µm feature and apply-ing foreground extinction (Fig. 3). The weakness of the 6.2µmPAH feature is reproduced well for a foreground extinctionA(V)=105, but the spectrum beyond 8.5µm and the 8.6µmand 11.3µm PAH features are not. While the relative featurestrengths depend on the adopted extinction curve (Sect. 3.2),no plausible extinction will be able towiden the 7.7µm fea-ture. We here propose instead the weakness of the 6.2µm PAHfeature to be indicative of an unusually small contributionofthe family of PAH emission features to the mid-IR spectrum ofArp 220 and the unusual strength and width of the 7.7µm fea-ture to be the result of an underlying mid-IR continuum, peak-ing strongly near 7.7µm. Evidence in support for this model ispresented below.
4 H.W.W. Spoon et al.: Mid-infrared spectral evidence for a luminous dust enshrouded source in Arp 220
Fig. 3. Comparison of the spectra of Arp 220 (thick grey line)and the central region of starburst galaxy M 83 (black line).The M 83 spectrum shows strong PAH emission features at 6.2,7.7, 8.6 and 11.2µm. In contrast, in Arp 220 the 6.2, 8.6 and11.2µm features are weak. Theblack dashed lineillustrates theeffect of strong extinction (A(V)=105; A(7.7µm)=1.2) on theM 83 spectrum. Both versions of the M 83 spectrum have beenscaled to match the 7.7µm peak in the spectrum of Arp 220.
2.2. Broad 7.7µm feature similar to Mon R2:IRS 1+2
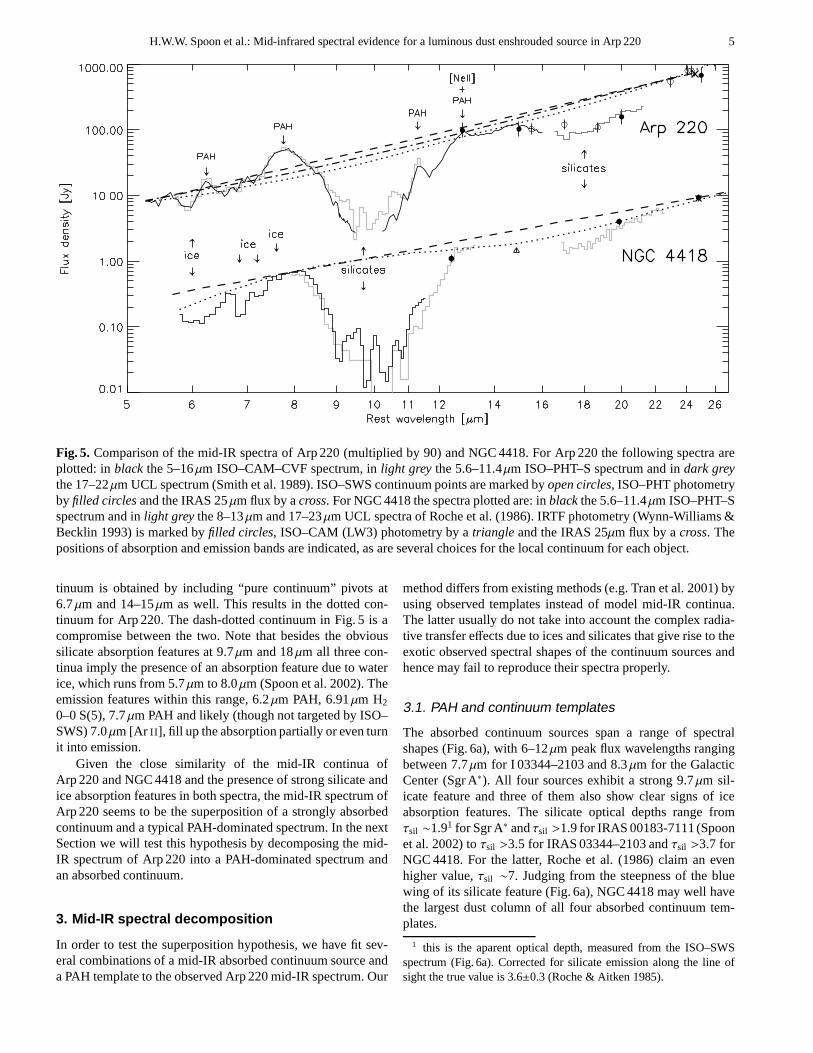
The shape of the 7.7µm feature in Arp 220 appears to be uniqueamong a sample of more than 250 galaxies observed spec-troscopically in the 6–12µm range (Spoon et al. in prep.).The feature has, however, a Galactic counterpart: the ISO–SWS spectrum of the combined line of sight to the sourcesMon R2:IRS 1+2 (Fig. 4). Mon R2 is a massive Galactic starformation region. Infrared observations show several compactsources and extended emission in the central region of the giantmolecular cloud (Beckwith et al. 1976). An elliptical ring en-closes two IR sources, IRS 1 and IRS 2. IRS 1, with a presumedspectral type of B0 (Downes et al. 1975; Howard et al. 1994), isthe exciting source of the compact Hii region enclosed by theIR ring (Massi, Felli, & Simon 1985). IRS 2 is still deeply em-bedded in the molecular cloud and most probably at an earlierstage of formation. Given this confused line of sight, the broad7.7µm feature in the spectrum of Mon R2:IRS 1+2 may wellbe the result of the superposition of a strongly absorbed contin-uum, peaking at∼8µm, and a ‘normal’ 7.7µm PAH emissionfeature. Fig. 4 shows the result of a crude decomposition of theMon R2:IRS 1+2 spectrum into the ISO–SWS spectra of theembedded protostar NGC 7538:IRS 9 and the reflection nebulaNGC 7023. The fit is quite good given the fact that the columnsof ices and silicates vary a lot from one embedded protostar tothe other. Note that the 8.6µm PAH feature is not suppressedby extinction, but instead stands out as a shoulder on the flankof the 7.7µm feature, filling in the blue wing of the 9.7µm sil-icate absorption feature.
Fig. 4. The line of sight to the embedded protostarMon R2:IRS 1 passes through the ultra compact Hii regionMon R2:IRS 2. The ISO–SWS spectrum of Mon R2:IRS 1+2(black) hence shows features of both type of environments:PAH emission from the ultra compact Hii region and adust and ice absorbed continuum from the embedded pro-tostar. Here we show a simple 2-component fit to theMon R2:IRS 1+2 spectrum, using the ISO–SWS spectra of theprotostar NGC 7538:IRS 9 (light grey area) and the reflectionnebula NGC 7023 (dark grey area) as fitting templates.
2.3. Mid-IR continuum similar to NGC 4418
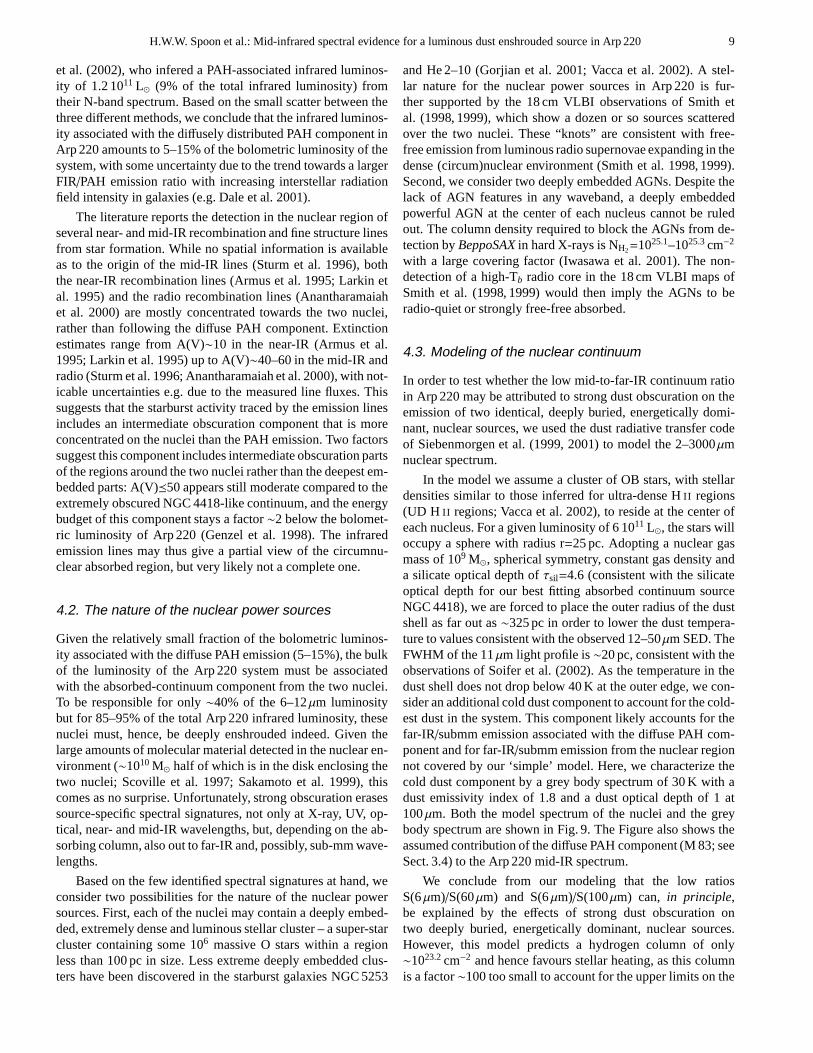
In Fig. 5 we compare the mid-IR spectra of Arp 220 andNGC 4418. The spectrum of NGC 4418 is dominated by strongsilicate absorption bands at 9.7µm and 18µm (Roche et al.1986) and ice absorption bands at 6.0µm (H2O), 6.85µm& 7.25µm (Hydrogenated Amorphous Carbons; HAC) and7.67µm (CH4) (Spoon et al. 2001). No mid-IR emission fea-tures, including the commonly detected 12.81µm [Neii] finestructure line, have been detected so far (Spoon et al. 2001;R. Siebenmorgen, unpublished TIMMI2 spectra). A first orderestimate for the mid-IR local continuum of NGC 4418 is ob-tained by fitting a power law through two feature-free “purecontinuum” pivots at 8.0µm and 25µm (the dashed continuumin Fig. 5). Another, more conservative choice of continuum,as-suming “pure continuum” at 6.7µm and 13µm too, is shown asa dotted line in Fig. 5.
The mid-IR spectrum of Arp 220 (Fig. 5) looks very sim-ilar to the pure absorption spectrum of NGC 4418, except forthe presence of weak emission features due to PAHs (6.2µm,7.7µm and 11.2µm), 6.91µm H2 0–0 S(5) and 12.81µm[Ne ii] (Sturm et al. 1996; Genzel et al. 1998). Using the samemethod as for NGC 4418, we estimate the local continuum inArp 220 by fitting a power law through two feature-free “purecontinuum” pivots at 5.5µm and 25µm (the dashed contin-uum in Fig. 5). A more conservative estimate for the local con-
H.W.W. Spoon et al.: Mid-infrared spectral evidence for a luminous dust enshrouded source in Arp 220 5
Fig. 5. Comparison of the mid-IR spectra of Arp 220 (multiplied by 90) and NGC 4418. For Arp 220 the following spectra areplotted: inblack the 5–16µm ISO–CAM–CVF spectrum, inlight grey the 5.6–11.4µm ISO–PHT–S spectrum and indark greythe 17–22µm UCL spectrum (Smith et al. 1989). ISO–SWS continuum pointsare marked byopen circles, ISO–PHT photometryby filled circlesand the IRAS 25µm flux by across. For NGC 4418 the spectra plotted are: inblackthe 5.6–11.4µm ISO–PHT–Sspectrum and inlight greythe 8–13µm and 17–23µm UCL spectra of Roche et al. (1986). IRTF photometry (Wynn-Williams &Becklin 1993) is marked byfilled circles, ISO–CAM (LW3) photometry by atriangle and the IRAS 25µm flux by across. Thepositions of absorption and emission bands are indicated, as are several choices for the local continuum for each object.
tinuum is obtained by including “pure continuum” pivots at6.7µm and 14–15µm as well. This results in the dotted con-tinuum for Arp 220. The dash-dotted continuum in Fig. 5 is acompromise between the two. Note that besides the obvioussilicate absorption features at 9.7µm and 18µm all three con-tinua imply the presence of an absorption feature due to waterice, which runs from 5.7µm to 8.0µm (Spoon et al. 2002). Theemission features within this range, 6.2µm PAH, 6.91µm H2
0–0 S(5), 7.7µm PAH and likely (though not targeted by ISO–SWS) 7.0µm [Ar ii], fill up the absorption partially or even turnit into emission.
Given the close similarity of the mid-IR continua ofArp 220 and NGC 4418 and the presence of strong silicate andice absorption features in both spectra, the mid-IR spectrum ofArp 220 seems to be the superposition of a strongly absorbedcontinuum and a typical PAH-dominated spectrum. In the nextSection we will test this hypothesis by decomposing the mid-IR spectrum of Arp 220 into a PAH-dominated spectrum andan absorbed continuum.
3. Mid-IR spectral decomposition
In order to test the superposition hypothesis, we have fit sev-eral combinations of a mid-IR absorbed continuum source anda PAH template to the observed Arp 220 mid-IR spectrum. Our
method differs from existing methods (e.g. Tran et al. 2001) byusing observed templates instead of model mid-IR continua.The latter usually do not take into account the complex radia-tive transfer effects due to ices and silicates that give rise to theexotic observed spectral shapes of the continuum sources andhence may fail to reproduce their spectra properly.
3.1. PAH and continuum templates
The absorbed continuum sources span a range of spectralshapes (Fig. 6a), with 6–12µm peak flux wavelengths rangingbetween 7.7µm for I 03344–2103 and 8.3µm for the GalacticCenter (Sgr A∗). All four sources exhibit a strong 9.7µm sil-icate feature and three of them also show clear signs of iceabsorption features. The silicate optical depths range fromτsil ∼1.91 for Sgr A∗ andτsil >1.9 for IRAS 00183-7111 (Spoonet al. 2002) toτsil >3.5 for IRAS 03344–2103 andτsil >3.7 forNGC 4418. For the latter, Roche et al. (1986) claim an evenhigher value,τsil ∼7. Judging from the steepness of the bluewing of its silicate feature (Fig. 6a), NGC 4418 may well havethe largest dust column of all four absorbed continuum tem-plates.
1 this is the aparent optical depth, measured from the ISO–SWSspectrum (Fig. 6a). Corrected for silicate emission along the line ofsight the true value is 3.6±0.3 (Roche & Aitken 1985).

6 H.W.W. Spoon et al.: Mid-infrared spectral evidence for a luminous dust enshrouded source in Arp 220
Fig. 6.PAH and continuum templates used in the decomposition of theobserved mid-IR spectrum of Arp 220.Left panel: Fourmid-IR absorbed continuum spectra. The spectra are shown attheir instrumental resolution: R∼90 for IRAS 03344–02103 andNGC 4418; R∼40 for IRAS 00183–7111; R∼1000 for Sgr A∗. The spectra have been normalized to their 7.5–8.5µm peak fluxesand are sorted according to the central wavelength of their 7.5–8.5µm peak flux.Right panel: Three mid-IR PAH-dominatedspectra, shown at a spectral resolution R∼90. The spectra have been normalized to their 7.7µm peak fluxes and are sorted inorder of increasing 9–12µm continuum.
As PAH templates we selected the reflection nebulaNGC 7023, the Orion Bar star forming region and the cen-tral region of the starburst galaxy M 83. The latter has beenpreferred over other nearby starburst templates, like M 82 orNGC 253, because its 5–16µm spectrum appears less affectedby extinction than the other two galaxy spectra. Together, thethree selected PAH templates (Fig. 6b) are meant to cover thefull range of spectral shapes from quiescent PDRs to intensestar forming regions. Note the large difference in strength ofthe 9–12µm continuum between the spectra of NGC 7023 andthe Orion Bar. The difference is attributed to the presence ofhot dust in the Orion Hii region, which is absent in the coldenvironment of a reflection nebula. In contrast, the PAH spec-tra are quite similar, except for a somewhat weaker 6.2µm PAHfeature relative to the 7.7µm PAH feature in M 83 and a some-what stronger 11.2µm PAH feature relative to the 7.7µm PAHfeature in the Orion Bar spectrum.
3.2. The extinction law at mid-infrared wavelengths
Unlike the extinction law at optical or near-IR wavelengths,surprisingly little is known about the shape and the generalap-plicability of the extinction law at mid-IR wavelengths. Resultsobtained for different lines of sight vary considerably. A gooddefinition of the shape of the mid-IR extinction law is, however,important for a good decomposition of the Arp 220 spectrum.
The differences among extinction laws appear largest at 3–8µm. Assuming a standard graphite-silicate mixture, aλ−1.75
power law fall-off is expected for this wavelength range (Fig. 7;Draine 1989; Martin & Whittet 1990). ISO measurements ofmolecular hydrogen towards the Orion Peak-1 as well as Hi
recombination lines of compact Hii regions support this model
(Bertoldi et al. 1999; Martın-Hernandez et al. 2003). Hi re-combination line observations, probing the dusty, complexlineof sight to the Galactic center (Sgr A∗), indicate, however, anearly flat extinction curve between 3 and 8µm (Fig. 7; Lutz1999), with Aλ/AV a factor∼4 higher at 7µm compared to theextinction law of Draine (1989). This would point to the pres-ence of larger, fluffier grains in the line of sight to the Galacticcenter than towards other Galactic sources (e.g. Krugel &Siebenmorgen 1994).
Beyond 8µm, the 9.7 and 18µm bands of amorphous sili-cates dominate the extinction curve. Both the shape (FWHM)and the strength of the bands (both A9.7/AV and A9.7/A18) arereported to vary between different lines of sight (e.g. Fig. 6a)and from observer to observer (Draine 1989). Here we willadopt the astronomical silicate profile of Weingartner & Draine(2001).
In order to explore the effect of differences between mid-IRextinction curves on the spectral decomposition, we here definetwo extinction curves which should be representative for therange of extinction properties between different lines of sight.The extinction law, which we will refer to asDraine local,combines theλ−1.75 power law fall-off for λ <8.14µm with asilicate feature of strength A9.6/AV=0.06 typical for the localsolar neighbourhood (Roche & Aitken 1984). In contrast, theLutz gc extinction law is ‘flat’ from 3–8µm and has a silicatefeature strength of A9.6/AV=0.14 (Lutz 1999). Both extinctionlaws are shown in Fig. 7

H.W.W. Spoon et al.: Mid-infrared spectral evidence for a luminous dust enshrouded source in Arp 220 7
Fig. 7. Comparison of two mid-IR extinction laws, overlayedon the PAH emission spectrum of reflection nebula NGC 7023(grey area). The Galactic center extinction law of Lutz (1999)is shown as ablack line, the extinction law of Draine (1989)for the local solar neigbourhood as adotted line. The extinc-tion laws are refered to asLutz gc and draine local, re-spectively.
3.3. Decomposition method
For each continuum and PAH template combination we haveexplored a four parameter space for the best fit to the observedArp 220 ISO spectrum. The four parameters explored are:
– the contribution of the absorbed-continuum spectrum to thetotal spectrum
– the contribution of the PAH spectrum to the total spectrum– the adopted extinction law: eitherdraine local orLutz gc
– the amount of reddening (AV) on the PAH spectrum
For a 2-component model spectrum to give a good fit to theArp 220 spectrum, the model spectrum has to reproduce severalkey spectral features which make the Arp 220 spectrum standapart from other mid-IR galaxy spectra. These key features are,in order of decreasing importance:
– the width of the 7.7µm feature– the absence of the 8.6µm PAH feature in the red flank of
the 7.7µm feature– the strength of the 11.2µm PAH feature relative to the
7.7µm feature– the strength of the 6.2µm PAH feature relative to the 7.7µm
feature– the depth of the 9.7µm silicate feature– the profile of the 6.0µm water ice feature
3.4. Decomposition results
In Fig. 8 we present the best fits to the 6–12µm Arp 220 spec-trum. The fits clearly show that an appreciable contributionfrom a strongly absorbed continuum source (e.g. NGC 4418,or a stronger absorbed version of this spectrum) is requiredfor
a good fit to the observed spectral features. Compared to theextinction on the continuum source (τsil >3.7), the extinctionon the PAH component is minor, ranging fromτsil=0.2 to 1.4).At these small obscurations, the choice of extinction law doesnot play an important role. The best fits further reveal that adirect measurement of the silicate optical depth from the ISOspectrum will be severely hampered by the presence of filled-inemission from the PAH component (see Fig. 8), resulting in aserious underestimation of the true silicate optical depth.
Other combinations of our continuum and PAH tem-plates fail to reproduce key features of the Arp 220 spectrum.Fits involving the continuum templates IRAS 03344–2103 andIRAS 00183–7111, for example, fail to fit the width of the7.7µm feature, because their continua peak at too short a wave-length (Fig. 6a). The continuum of Sgr A∗, on the other hand,does peak at the right wavelength, but its silicate feature is tooshallow and too narrow to leave much room for any contribu-tion from the PAH component to the 8.5–11.5µm fit. Strongextinction will have to be imposed on the PAH component tominimize its contribution to the 8.5–11.5µm fit. This, however,also minimizes the flux in the 11.2µm PAH feature to beyondwhat is still consistent with the observations. A similar prob-lem exists for the Orion Bar PAH template. Its 10µm contin-uum is the strongest among the three PAH templates (Fig. 6b)and hence requires an appreciable extinction on its contribu-tion to any Arp 220 fit; too much for a good fit to the 11.2µmPAH feature. PAH template NGC 7023 suffers from the oppo-site problem. Its continuum is too weak to produce good fits tothe Arp 220 spectrum.
Absorptions by ices play an important role in distortingthe spectral shape of strongly dust enshrouded sources likeNGC 4418 (Spoon et al. 2001; Fig. 6a). Their impact is, how-ever, small for moderately absorbed spectra like the line ofsight to Sgr A∗ (Fig. 6a). On the other hand, as the abundanceof ices is variable and changes from one Galactic molecularcloud to another, it is useful to assess the impact of an increasedwater ice abundance on our fits. We therefore ran tests with aLutz gc extinction law with five times higher water ice abun-dance and compared the best fitting parameters to those for theunmodifiedLutz gc extinction law. Only for those templatecombinations requiring high foreground extinction on the PAHtemplate were the individual parameters found to change no-ticeably (but<10%). For all other combinations, including ourbest fits (Fig. 8), the effects turn out to be negligible. Furtherexperiments with an extinction curve supplemented with boththe 6µm ice and 6.8µm HAC absorption features show thatunder these conditions successful fits can be obtained also withan (additionally obscured) Sgr A∗ continuum. This stresses thepresence of ice absorptions in the continuum as a key require-ment for a successful fit, and one of the reasons why NGC 4418produces the best results in our original fits.
4. Discussion
Our successful decomposition of the 6–12µm ISO–PHT–Sspectrum into a strongly absorbed continuum and a weakly ab-sorbed PAH component confirms our initial suspicion that a)its exotic mid-IR spectrum resembles a blend of the spectra of

8 H.W.W. Spoon et al.: Mid-infrared spectral evidence for a luminous dust enshrouded source in Arp 220
Fig. 8. Four 2-component fits to the Arp 220 mid–IR ISO spectra (ISO–PHT–S: dark grey histogram; ISO–CAM–CVF:darkgrey line). In each panel thedark grey arearepresents the contribution of the continuum component andthe light grey areathecontribution of the PAH component. The PAH component is the same in all panels: the spectrum of the starburst galaxy M 83.The absorbed continuum component differs between left and right panels. In the left panels it is NGC4418 as observed; in theright panels it is NGC 4418 as seen through an additional screen of A(9.6µm)=2.5, equivalent to a factor ten more attenuationat 9.6µm. The fractional contribution of each fit component to the total 6–12µm fit is stated in brackets behind the name of thetemplate. Also indicated is the amount of 9.6µm screen extinction on the PAH component.
NGC 4418 and M 83 (Fig. 2) and b) that the only difference be-tween the mid-IR spectra of Arp 220 and a strongly ice- anddust-absorbed source like NGC 4418 is the additional presenceof PAH emission features in the spectrum of Arp 220 (Fig. 5).
4.1. Identification of the spectral components
The large difference in obscuration of the two spectral com-ponents of our fit indicates that these most likely representtwo spatially separate components. Recent high angular res-olution N-band spectroscopy of the nuclear region (Soifer et al.2002) show the 11.2µm PAH emission and the 11–12µm con-tinuum emission to have clearly different distributions. Whilethe absorbed-continuum emission clearly peaks on the two nu-clei, the PAH emission extends over a far wider area and doesnot peak on either nucleus. We therefore associate our absorbedcontinuum component with the two nuclei and our PAH com-ponent with the region in between and around the two nuclei.
We estimate the infrared luminosity associated with the dif-fusely distributed PAH component from the observed 6.2µm
PAH emission feature by assuming a generic conversion ra-tio between L(6.2µm PAH) and L(IR) and taking into accountthe weak obscuration on the 6.2µm PAH feature as indicatedby our best 2-component model fits. We derive the L(6.2µmPAH)/L(IR) ratio from our sample of∼70 mid-IR ISO spec-tra of normal and starburst galaxies and obtain a value of0.003±0.001. Assuming this conversion factor applies also tothe conditions in the ULIRG Arp 220 and applying it to ourfour best fitting template combinations (Fig. 8) we find the in-frared luminosity associated with the diffuse PAH componentto amount to 1.2–2.11011 L⊙; 9–15% of the total infrared lumi-nosity of the system. A comparable result is obtained from thepeak flux density of the 7.7µm PAH feature, using the empiri-cal conversion factor S(7.7µm PAH)/F(IR)=10−11.84 Jy W−1 m2
for starburst galaxies, determined by Lutz et al. (2003). Takinginto account the weak obscuration on the 7.7µm PAH fea-ture (ranging from A(7.7µm)=0.07 to 0.49), the implied in-frared luminosity is 0.7–1.81011 L⊙; 5–13% of the total in-frared luminosity of the system. The results from both meth-ods are in complete agreement with the value derived by Soifer
H.W.W. Spoon et al.: Mid-infrared spectral evidence for a luminous dust enshrouded source in Arp 220 9
et al. (2002), who infered a PAH-associated infrared luminos-ity of 1.2 1011 L⊙ (9% of the total infrared luminosity) fromtheir N-band spectrum. Based on the small scatter between thethree different methods, we conclude that the infrared luminos-ity associated with the diffusely distributed PAH component inArp 220 amounts to 5–15% of the bolometric luminosity of thesystem, with some uncertainty due to the trend towards a largerFIR/PAH emission ratio with increasing interstellar radiationfield intensity in galaxies (e.g. Dale et al. 2001).
The literature reports the detection in the nuclear region ofseveral near- and mid-IR recombination and fine structure linesfrom star formation. While no spatial information is availableas to the origin of the mid-IR lines (Sturm et al. 1996), boththe near-IR recombination lines (Armus et al. 1995; Larkin etal. 1995) and the radio recombination lines (Anantharamaiahet al. 2000) are mostly concentrated towards the two nuclei,rather than following the diffuse PAH component. Extinctionestimates range from A(V)∼10 in the near-IR (Armus et al.1995; Larkin et al. 1995) up to A(V)∼40–60 in the mid-IR andradio (Sturm et al. 1996; Anantharamaiah et al. 2000), with not-icable uncertainties e.g. due to the measured line fluxes. Thissuggests that the starburst activity traced by the emissionlinesincludes an intermediate obscuration component that is moreconcentrated on the nuclei than the PAH emission. Two factorssuggest this component includes intermediate obscurationpartsof the regions around the two nuclei rather than the deepest em-bedded parts: A(V)�50 appears still moderate compared to theextremely obscured NGC 4418-like continuum, and the energybudget of this component stays a factor∼2 below the bolomet-ric luminosity of Arp 220 (Genzel et al. 1998). The infraredemission lines may thus give a partial view of the circumnu-clear absorbed region, but very likely not a complete one.
4.2. The nature of the nuclear power sources
Given the relatively small fraction of the bolometric luminos-ity associated with the diffuse PAH emission (5–15%), the bulkof the luminosity of the Arp 220 system must be associatedwith the absorbed-continuum component from the two nuclei.To be responsible for only∼40% of the 6–12µm luminositybut for 85–95% of the total Arp 220 infrared luminosity, thesenuclei must, hence, be deeply enshrouded indeed. Given thelarge amounts of molecular material detected in the nuclearen-vironment (∼1010 M⊙ half of which is in the disk enclosing thetwo nuclei; Scoville et al. 1997; Sakamoto et al. 1999), thiscomes as no surprise. Unfortunately, strong obscuration erasessource-specific spectral signatures, not only at X-ray, UV,op-tical, near- and mid-IR wavelengths, but, depending on the ab-sorbing column, also out to far-IR and, possibly, sub-mm wave-lengths.
Based on the few identified spectral signatures at hand, weconsider two possibilities for the nature of the nuclear powersources. First, each of the nuclei may contain a deeply embed-ded, extremely dense and luminous stellar cluster – a super-starcluster containing some 106 massive O stars within a regionless than 100 pc in size. Less extreme deeply embedded clus-ters have been discovered in the starburst galaxies NGC 5253
and He 2–10 (Gorjian et al. 2001; Vacca et al. 2002). A stel-lar nature for the nuclear power sources in Arp 220 is fur-ther supported by the 18 cm VLBI observations of Smith etal. (1998, 1999), which show a dozen or so sources scatteredover the two nuclei. These “knots” are consistent with free-free emission from luminous radio supernovae expanding in thedense (circum)nuclear environment (Smith et al. 1998, 1999).Second, we consider two deeply embedded AGNs. Despite thelack of AGN features in any waveband, a deeply embeddedpowerful AGN at the center of each nucleus cannot be ruledout. The column density required to block the AGNs from de-tection byBeppoSAXin hard X-rays is NH2=1025.1–1025.3 cm−2
with a large covering factor (Iwasawa et al. 2001). The non-detection of a high-Tb radio core in the 18 cm VLBI maps ofSmith et al. (1998, 1999) would then imply the AGNs to beradio-quiet or strongly free-free absorbed.
4.3. Modeling of the nuclear continuum
In order to test whether the low mid-to-far-IR continuum ratioin Arp 220 may be attributed to strong dust obscuration on theemission of two identical, deeply buried, energetically domi-nant, nuclear sources, we used the dust radiative transfer codeof Siebenmorgen et al. (1999, 2001) to model the 2–3000µmnuclear spectrum.
In the model we assume a cluster of OB stars, with stellardensities similar to those inferred for ultra-dense Hii regions(UD H ii regions; Vacca et al. 2002), to reside at the center ofeach nucleus. For a given luminosity of 6 1011 L⊙, the stars willoccupy a sphere with radius r=25 pc. Adopting a nuclear gasmass of 109 M⊙, spherical symmetry, constant gas density anda silicate optical depth ofτsil=4.6 (consistent with the silicateoptical depth for our best fitting absorbed continuum sourceNGC 4418), we are forced to place the outer radius of the dustshell as far out as∼325 pc in order to lower the dust tempera-ture to values consistent with the observed 12–50µm SED. TheFWHM of the 11µm light profile is∼20 pc, consistent with theobservations of Soifer et al. (2002). As the temperature in thedust shell does not drop below 40 K at the outer edge, we con-sider an additional cold dust component to account for the cold-est dust in the system. This component likely accounts for thefar-IR/submm emission associated with the diffuse PAH com-ponent and for far-IR/submm emission from the nuclear regionnot covered by our ‘simple’ model. Here, we characterize thecold dust component by a grey body spectrum of 30 K with adust emissivity index of 1.8 and a dust optical depth of 1 at100µm. Both the model spectrum of the nuclei and the greybody spectrum are shown in Fig. 9. The Figure also shows theassumed contribution of the diffuse PAH component (M 83; seeSect. 3.4) to the Arp 220 mid-IR spectrum.
We conclude from our modeling that the low ratiosS(6µm)/S(60µm) and S(6µm)/S(100µm) can, in principle,be explained by the effects of strong dust obscuration ontwo deeply buried, energetically dominant, nuclear sources.However, this model predicts a hydrogen column of only∼1023.2 cm−2 and hence favours stellar heating, as this columnis a factor∼100 too small to account for the upper limits on the

10 H.W.W. Spoon et al.: Mid-infrared spectral evidence for aluminous dust enshrouded source in Arp 220
Fig. 9.The 2–3000µm spectrum of Arp 220 (grey) overplotted with a three component fit. Theblack dashedcurve represents themodel SED for the two identical nuclei. Theblack dottedcurve represents grey body emission from 30 K cold dust. Theblackdash-dottedcurve is the sum of these two components. Theblack continuouscurve is the sum of the model SED and the weaklyabsorbed diffuse PAH component (M 83) from our 2-component decomposition(Sect. 3).
hard X-ray flux if the total luminosity were dominated by AGNactivity (Iwasawa et al. 2001).
Note that if any deeply hidden AGN (NH ≥1025 cm−2) werepresent, the covering factor of the obscuration would have to belarge in order to be consistent with the lack of reflected X-raylight measured byBeppoSAX (Iwasawa et al. 2001). The AGNwould hence strongly contribute to the far-IR continuum, butcould not be responsible for the mid-IR continuum.
4.4. Mid-to-far-infrared spectral characteristics
Arp 220 is an outlyer in many spectroscopic diagnostic dia-grams linking mid-IR to far-IR quantities. In all cases Arp 220stands out by having a low ratio of the mid-IR characteristicwith respect to the far-IR characteristic:
– Already in the Bright Galaxy Sample of Sanders et al.(1988), Arp 220 stands out by the smallest S12/S60 ratio.
– Similarly, Arp 220 has the lowest S5.9/S60 ratio among thelarger sample studied spectroscopically in the mid-IR byLutz et al. (1998).
– The ratio of F(6.2µm PAH)/F(FIR) is lower than for anyother galaxy in our database of more than 250 ISO mid-IRgalaxy spectra.
– The ratio F([Ne])/F(FIR) is a factor three lower than forthe average starburst galaxy (Genzel et al. 1998).
– The ratio F(7.7µm PAH)/F(850µm) is the lowest among asample of normal and ultra-luminous galaxies (Haas et al.2001).
Our spectral decomposition offers a simple explanation forthe above observations. A typical starburst spectrum associ-ated with the extended PAH component will contribute stronglyto the mid-IR but weakly to the far-IR, while the domi-nant deeply enshrouded nuclei contribute weakly to the mid-IR and strongly to the far-IR. The resulting combined 3–1000µm SED is hence mostly starburst-like in the mid-IRand dominated by cold dust emission from the enshroudednuclei in the far-IR. Ratios of mid-IR to far-IR quanti-ties, like F([Ne])/F(FIR), F(6.2µm PAH)/F(FIR) or F(7.7µmPAH)/F(850µm), will hence all be systematically lower thanthe values typically found for starburst galaxies. Interestingly,Luhman et al. (2003) advocate a similar scenario as a contrib-utor to the low F([C])/F(FIR) ratio of Arp 220.
Other galaxies may exist with even more strongly obscurednuclei, emitting an even smaller fraction of the nuclearluminosity in the mid-IR than Arp 220 does. These galaxieswould hence look starburst-like in the mid-IR (contributedby a[weakly obscured] circumnuclear starburst) but would be char-acterized by a very strong cold dust continuum in the far-IR.Galaxies of this type, may be recognized spectroscopicallybytheir low S5.9/S60, S5.9/S100, S5.9/S850 or F([C])/F(FIR)ratios and their starburst-like 6.2µm-PAH line-to-continuumratios. Perusal of our ISO spectral database has led to theidentification of several candidate galaxies. Arp 220 may thusbe a local and less extreme template of the class of SCUBAsources seen in the Hubble Deep Field.
Arp 220 is not the only galaxy with spectral structure in the6–12µm range reminiscent of strongly modified PAH bands.

H.W.W. Spoon et al.: Mid-infrared spectral evidence for a luminous dust enshrouded source in Arp 220 11
Other examples are Mrk 231 and most of the galaxies in thesample of Tran et al. (2001). Some of these spectra show, inaddition to strong silicate absorption longward of 7.7µm, clearsigns of water ice absorption shortward of 7.7µm. Dependingon the strength of the PAH emission features these galaxieshave been classified as class I, II or III ice galaxies (Spoon etal. 2002). Like Arp 220, their spectra may well be the result ofstrong extinction on one or more spectral components.
5. Conclusions
We have shown that the 6–12µm spectrum of Arp220 is not thatof a scaled-up typical starburst galaxy but contains a ’normal’starburst component characterized by PAH emission featuresplus a highly obscured dust continuum with ice and silicate ab-sorption. Attempts to decompose the spectrum using a varietyof extragalactic and Galactic template spectra yields a best fitin which a typical starburst, represented by M 83, contributes∼60% and and an ice absorbed continuum galaxy, representedby NGC 4418,∼40% of the 6–12µm luminosity. An impor-tant result in relation to previous studies is our conclusion thatthe pronounced emission feature peaking around 7.7µm is ablend of PAH emission and a broader feature in the contin-uum caused by ice absorption at shorter and silicate absorptionat longer wavelengths. We tentatively conclude that the PAHemitting component is only weakly absorbed and arises in theextended region imaged at higher resolution around 10µm bySoifer et al. (2002) whereas the absorbed continuum is asso-ciated with one or both of the compact nuclei. This extendedstarburst component contributes only 5–15% of the total lumi-nosity with the bulk emitted by the heavily obscured nuclearcomponent(s). One possibility is that this luminosity is gener-ated by starburst activity occuring in a higher density environ-ment than found in lower luminosity starburst galaxies due tothe larger quantity of molecular gas and dust funnelled to thecenter by merging of the two nuclei. Due to the high extinction,it is not possible with the available data to exclude that AGN(s)also contribute some or all of this luminosity. Based on the up-per limits for hard X-ray emission (Iwasawa et al. 2001), how-ever, Arp 220 would need to be the most highly obscured AGNknown.
Acknowledgements.The authors wish to thank Tom Soifer andEiichi Egami for sharing data with us and George Helou, OlivierLaurent, Matt Lehnert, Neil Nagar, Dave Sanders, Eckhard Sturmand Jacqueline van Gorkum for discussions. We are grateful to thereferee for valuable suggestions. This research has made use of theNASA/IPAC Extragalactic Database, which is operated by the JetPropulsion Laboratory, Caltech under contract with NASA.
References
Anantharamaiah K.R., Viallefond F., Mohan, N.R., et al., 2000, ApJ537, 613
Armus L., Shupe D.L., Matthews K., et al., 1995, ApJ 440, 200Arp H.C., 1966, ApJS 14, 1Baan W.A., Haschick A.D., 1995, ApJ 454, 745Beckwith S., Evans N.J., Becklin E.E., Neugebauer G., 1976,ApJ 208,
390
Bertoldi F., Timmermann R., Rosenthal D., et al., 1999, A&A 346,267
Clements D.L., McDowell J.C., Shaked S., 2002, ApJ 581, 974Dale D.A., Helou G., Contursi A., et al., 2001, ApJ 549, 215Done C., Madejski G.M., Smith D.A., 1996, ApJ 463, L63Downes D., Winnberg A., Goss W.M., Johansson L.E.B., 1975, A&A
44, 243Draine B.T., 1989, In: Infrared Spectroscopy in Astronomy,B.H.
Kaldeich (ed.), ESA-SP 290, 93Dudley C.C., Wynn-Williams C.G., 1997, ApJ 488, 720Dunne L., Eales S., Edmunds M., et al., 2000, MNRAS 315, 115Dunne L., Eales S.A., 2001, MNRAS 327, 697Eales S.A., Wynn-Williams C.G., Duncan W.D., 1989, ApJ 339,859Evans A.S., Becklin E.E., Scoville N.Z., et al., 2003, AJ 125, 2341Fischer J., Satyapal S., Luhman M.L., et al., 1997, In: FirstISO
Workshop on Analytical Spectroscopy, A.M. Heras, K. Leech,N.R. Trams, M. Perry (eds.), ESA-SP 419, 149
Genzel R., Lutz D., Sturm E., et al., 1998, ApJ 498, 579Genzel R., Cesarsky C.J., 2000, A&ARA 38, 761Gorjian V., Turner J.L., Beck S.C., 2001, ApJ 554, L29Guainazzi M., Matt G., Brandt W.N., et al., 2000, A&A 356, 463Haas M., Klaas U., Muller S.A.H., et al., 2001, A&A 367, L9Helou G., Lu N.Y., Werner M.W., et al., 2000, ApJ 532, L21Houck J.R., Soifer B.T., Neugebauer G., et al., 1984, ApJ 278, L63Howard E.M., Pipher J.L., Forrest W.J., 1994, ApJ 425, 707Imanishi M., Dudley C.C., 2000, ApJ 545, 701Iwasawa K., Koyama K., Awaki H., et al., 1993, ApJ 409, 155Iwasawa K., Matt K., Guainazzi M., Fabian A.C., 2001, MNRAS 326,
894Klaas U., Haas M., Heinrichsen I., Schulz B., 1997, A&A 325, L21Krugel E., Siebenmorgen R., 1994, A&A 288, 929Larkin J.E., Armus L., Knop R.A., et al., 1995, ApJ 452, 599Luhman M.L., Satyapal S., Fischer J., et al., 2003, ApJ 594, 758Lutz D., Spoon H.W.W., Rigopoulou D., et al., 1998, ApJ 505, L103Lutz D., 1999, In: The Universe as seen by ISO, P. Cox, M.F. Kessler
(eds.), ESA-SP 427, 623Lutz D., Sturm E., Genzel R., et al., 2003, A&A 409, 867Martin P.G., Whittet D.C.B., 1990, ApJ 357, 113Martın-Hernandez N.L., van der Hulst J.M., Tielens A.G.G.M., 2003,
A&A 407, 957Massi M., Felli M., Simon M., 1985, A&A 152, 387Mundell C.G., Ferruit P., Pedlar A., 2001, ApJ 560, 168Peeters E., Hony S., Van Kerckhoven C., et al., 2002, A&A 390,1089Rigopoulou D., Spoon H.W.W., Genzel R., et al., 1999, AJ 118,2625Roche P.F., Aitken D.K., 1984, MNRAS 208, 481Roche P.F., Aitken D.K., 1985, MNRAS 215, 425Roche P.F., Aitken D.K., Smith C.H., James S.D., 1986, MNRAS218,
19PSakamoto K., Scoville N.Z., Yun M.S., et al., 1999, ApJ 514, 68Sanders D.B., Soifer B.T., Elias J.H., et al., 1988, ApJ 325,74Sanders D.B., Mirabel I.F., 1996, ARA&A 34, 749Scoville N.Z., Yun M.S., Bryant P.M., 1997, ApJ 484, 702Siebenmorgen R., Krugel E., Zota E., 1999, A&A 351, 140Siebenmorgen R., Krugel E., Laureijs R.J., 2001, A&A 377, 735Smith C.H., Aitken D.K., Roche P.F., 1989, MNRAS 241, 425Smith H.E., Lonsdale C.J., Lonsdale C.J., et al., 1998, ApJ 493, L17Smith H.E., Lonsdale C.J., Lonsdale C.J., et al., 1999, Ap&SS 266,
125Soifer B.T., Helou G., Lonsdale C.J., et al., 1984, ApJ 283, L1Soifer B.T., Sanders D.B., Madore B.F., et al., 1987, ApJ 320, 238Soifer B.T., Neugebauer G., Matthews K., et al., 1999, ApJ 513, 207Soifer B.T., Neugebauer G., Matthews K., et al., 2002, AJ 124, 2980

12 H.W.W. Spoon et al.: Mid-infrared spectral evidence for aluminous dust enshrouded source in Arp 220
Spoon H.W.W., Genzel R., Lutz, D., 1998, In: Star Formation with theInfrared Space Observatory, J.L. Yun, R. Liseau (eds.), ASPConf.Series 132, 414
Spoon H.W.W., Koornneef J., Moorwood A.F.M., et al., 2000, A&A357, 898
Spoon H.W.W., Keane J.V., Tielens A.G.G.M., et al., 2001, A&A 365,L353
Spoon H.W.W., Keane J.V., Tielens A.G.G.M., et al., 2002, A&A 385,1022
Spoon H.W.W., Moorwood A.F.M., Pontoppidan K.M., et al., 2003,A&A 402, 499
Sturm E., Lutz D., Genzel R., et al., 1996, A&A 315, L133Sturm E., Lutz D., Tran D., et al., 2000, A&A 358, 481Thornley M.D., Forster Schreiber N.M., Lutz D., et al., 2000, ApJ 539,
641Toomre A., Toomre J., 1972, ApJ 178, 623Tran Q.D., Lutz D., Genzel R., et al., 2001, ApJ 552, 527Vacca W.D., Johnson K.E., Conti P.S., 2002, ApJ 123, 772Weingartner J.C., Draine B.T., 2001, ApJ 548, 296Wynn-Williams C.G., Becklin E.E., 1993, ApJ 412, 535