huntington beach ity school district - cafr.file.core
TRANSCRIPT
HUNTINGTON BEACH CITY
SCHOOL DISTRICT
ANNUAL FINANCIAL REPORT
JUNE 30, 2018
HUNTINGTON BEACH CITY SCHOOL DISTRICT
TABLE OF CONTENTS JUNE 30, 2018
FINANCIAL SECTION Independent Auditor's Report 2Management's Discussion and Analysis 5Basic Financial Statements
Government-Wide Financial Statements Statement of Net Position 14Statement of Activities 15
Fund Financial Statements Governmental Funds - Balance Sheet 16Reconciliation of the Governmental Funds Balance Sheet to the Statement of Net Position 17Governmental Funds - Statement of Revenues, Expenditures, and Changes in Fund Balances 19Reconciliation of the Governmental Funds Statement of Revenues, Expenditures, and Changes in Fund Balances to the Statement of Activities 20Fiduciary Funds - Statement of Changes in Net Position 22
Notes to Financial Statements 23
REQUIRED SUPPLEMENTARY INFORMATION General Fund - Budgetary Comparison Schedule 70Schedule of Changes in the District's Total OPEB Liability and Related Ratios 71Schedule of the District's Proportionate Share of the Net OPEB Liability - MPP Program 72Schedule of the District's Proportionate Share of the Net Pension Liability 73Schedule of District Contributions 74Note to Required Supplementary Information 75
SUPPLEMENTARY INFORMATION Schedule of Expenditures of Federal Awards 78Local Education Agency Organization Structure 79Schedule of Average Daily Attendance 80Schedule of Instructional Time 81Reconciliation of Annual Financial and Budget Report With Audited Financial Statements 82Schedule of Financial Trends and Analysis 83Schedule of Charter Schools 84
Combining Statements - Non-Major Governmental Funds Combining Balance Sheet 85Combining Statement of Revenues, Expenditures, and Changes in Fund Balances 86
Note to Supplementary Information 87
INDEPENDENT AUDITOR'S REPORTS Report on Internal Control Over Financial Reporting and on Compliance and Other Matters Based on an Audit of Financial Statements Performed in Accordance With Government Auditing Standards 90Report on Compliance for Each Major Program and Report on Internal Control Over Compliance Required by the Uniform Guidance
92
Report on State Compliance 94
HUNTINGTON BEACH CITY SCHOOL DISTRICT
TABLE OF CONTENTS JUNE 30, 2018
SCHEDULE OF FINDINGS AND QUESTIONED COSTSSummary of Auditor's Results 98Financial Statement Findings 99Federal Awards Findings and Questioned Costs 100State Awards Findings and Questioned Costs 101Summary Schedule of Prior Audit Findings 102

1
FINANCIAL SECTION
10681 Foothill Blvd., Suite 300, Rancho Cucamonga, CA 91730 P 909.466.4410 F 909.466.4431 W vtdcpa.com
2
INDEPENDENT AUDITOR'S REPORT
Governing Board Huntington Beach City School District Huntington Beach, California
Report on the Financial Statements
We have audited the accompanying financial statements of the governmental activities, each major fund, and the aggregate remaining fund information of the Huntington Beach City School District (the District) as of and for the year ended June 30, 2018, and the related notes to the financial statements, which collectively comprise the District's basic financial statements as listed in the table of contents.
Management's Responsibility for the Financial Statements
Management is responsible for the preparation and fair presentation of these financial statements in accordance with accounting principles generally accepted in the United States of America; this includes the design, implementation, and maintenance of internal control relevant to the preparation and fair presentation of financial statements that are free from material misstatement, whether due to fraud or error.
Auditor's Responsibility
Our responsibility is to express opinions on these financial statements based on our audit. We conducted our audit in accordance with auditing standards generally accepted in the United States of America and the standards applicable to financial audits contained in Government Auditing Standards, issued by the Comptroller General of the United States; and the 2017-2018 Guide for Annual Audits of K-12 Local Education Agencies and State Compliance Reporting, issued by the California Education Audit Appeals Panel as regulations. Those standards require that we plan and perform the audit to obtain reasonable assurance about whether the financial statements are free from material misstatement.
An audit involves performing procedures to obtain audit evidence about the amounts and disclosures in the financial statements. The procedures selected depend on the auditor's judgment, including the assessment of the risks of material misstatement of the financial statements, whether due to fraud or error. In making those risk assessments, the auditor considers internal control relevant to the District's preparation and fair presentation of the financial statements in order to design audit procedures that are appropriate in the circumstances, but not for the purpose of expressing an opinion on the effectiveness of the District's internal control. Accordingly, we express no such opinion. An audit also includes evaluating the appropriateness of accounting policies used and the reasonableness of significant accounting estimates made by management, as well as evaluating the overall presentation of the financial statements.
We believe that the audit evidence we have obtained is sufficient and appropriate to provide a basis for our audit opinions.
3
Opinions
In our opinion, the financial statements referred to above present fairly, in all material respects, the respective financial position of the governmental activities, each major fund, and the aggregate remaining fund information of the District, as of June 30, 2018, and the respective changes in financial position thereof for the year then ended in accordance with accounting principles generally accepted in the United States of America.
Emphasis of Matter - Change in Accounting Principles
As discussed in Note 1 and Note 16 to the financial statements, in 2018, the District adopted new accounting guidance, GASB Statement No. 75, Accounting and Financial Reporting for Postemployment Benefits Other Than Pensions. Our opinion is not modified with respect to this matter.
Other Matters
Required Supplementary Information
Accounting principles generally accepted in the United States of America require that the Management's Discussion and Analysis on pages 5 through 13, Budgetary Comparison Schedule on page 70, Schedule of Changes in the District's Total OPEB Liability and Related Ratios on page 71, Schedule of the District's Proportionate Share of the Net OPEB Liability - MPP Program on page 72, Schedule of the District's Proportionate Share of the Net Pension Liability on page 73, and the Schedule of District Contributions on page 74, be presented to supplement the basic financial statements. Such information, although not a part of the basic financial statements, is required by the Governmental Accounting Standards Board who considers it to be an essential part of financial reporting for placing the basic financial statements in an appropriate operational, economic, or historical context. We have applied certain limited procedures to the required supplementary information in accordance with auditing standards generally accepted in the United States of America, which consisted of inquiries of management about the methods of preparing the information and comparing the information for consistency with management's responses to our inquiries, the basic financial statements, and other knowledge we obtained during our audit of the basic financial statements. We do not express an opinion or provide any assurance on the information because the limited procedures do not provide us with sufficient evidence to express an opinion or provide any assurance.
Other Information
Our audit was conducted for the purpose of forming opinions on the financial statements that collectively comprise the District's basic financial statements. The accompanying supplementary information such as the combining and individual non-major fund financial statements and Schedule of Expenditures of Federal Awards, as required by Title 2 U.S. Code of Federal Regulations (CFR) Part 200, Uniform Administrative Requirements, Cost Principles, and Audit Requirements for Federal Awards (Uniform Guidance) and the other supplementary information as listed in the table of contents are presented for purposes of additional analysis and are not a required part of the basic financial statements.
The accompanying supplementary information is the responsibility of management and was derived from and relates directly to the underlying accounting and other records used to prepare the basic financial statements. Such information has been subjected to the auditing procedures applied in the audit of the basic financial statements and certain additional procedures, including comparing and reconciling such information directly to the underlying accounting and other records used to prepare the basic financial statements or to the basic financial statements themselves, and other additional procedures in accordance with auditing standards generally accepted in the United States of America. In our opinion, the accompanying supplementary information is fairly stated, in all material respects, in relation to the basic financial statements as a whole.
4
Other Reporting Required by Government Auditing Standards
In accordance with Government Auditing Standards, we have also issued our report dated December 11, 2018, on our consideration of the District's internal control over financial reporting and on our tests of its compliance with certain provisions of laws, regulations, contracts, and grant agreements and other matters. The purpose of that report is solely to describe the scope of our testing of internal control over financial reporting and compliance and the results of that testing, and not to provide an opinion on the effectiveness of the District's internal control over financial reporting or on compliance. That report is an integral part of an audit performed in accordance with Government Auditing Standards in considering the District's internal control over financial reporting and compliance.
Rancho Cucamonga, California December 11, 2018
BOARD OF TRUSTEES
Paul Morrow, Ed.D.President
Rosemary SaylorVice President
Shari KowalkeClerk
Bridget KaubMember
Ann SullivanMember
ADMINISTRATION
Gregory HaulkSuperintendent
Jennifer ShepardAssistant Superintendent
Educational Services
Patricia HagerAssistant Superintendent
Human Resources
Jon M. ArchibaldAssistant SuperintendentAdministrative Services
HUNTINGTON BEACH CITY SCHOOL DISTRICT
17011 Beach Blvd., Suite 560, Huntington Beach, CA 92647 (714) 964-8888
“We Are An Equal Opportunity Employer”5
This section of Huntington Beach City School District's (the District) annual financial report presents our discussion and analysis of the District's financial performance during the fiscal year that ended on June 30, 2018, with comparative information from June 30, 2017. Since this discussion and analysis is designed to focus on current activities, resulting changes, and currently known facts, please read it in conjunction with the basic financial statements and the related footnotes, which immediately follow this section. Responsibility for the completeness and accuracy of this information remains with the District.
USING THIS REPORT
These financial statements are presented in accordance with Governmental Accounting Standards Board (GASB) Statement No. 34, Basic Financial Statements and Management Discussion and Analysis for State and Local Governments. Under this new Statement, the focus of the financial statements is on the District as a whole.
This annual report consists of a series of statements. The "Management's Discussion and Analysis" (this section), the Statement of Net Position (page 14), and the Statement of Activities (page 15), provide information about the activities of the District as a whole, and present a longer-term view of the District's finances. Fund financial statements start on page 16. For governmental activities, these statements tell how revenues were received and how expenditures were made within the current year - and what is available for future spending. These fund financial statements also present more detailed information within the fund-focus by providing financial information about the District's most significant funds. The remaining statements provide financial information about activities for which the District acts solely as an agent for the benefit of the District's students.
OVERVIEW OF THE FINANCIAL STATEMENTS
The Financial Statements
The financial statements presented herein include all of the activities of the Huntington Beach City School District and the Huntington Beach City School Financing Corporation (its component unit) using the integrated approach as prescribed by GASB Statement No. 34.
Within the government-wide financial statements, all of the current year's revenues and expenses are taken into account regardless of when cash is received and/or paid. These two statements report the District's Net Position and changes in them. Net Position represents the difference between assets, deferred outflows of resources, liabilities, and deferred inflows of resources, which is one way to measure the financial health or financial position of the District. Over time, increases or decreases in the District's Net Position are one indicator of whether its financial health is improving or deteriorating. Other factors to consider in this analysis are changes in the State-wide funding process, the age and condition of the school facilities, and the affect of funding from outside grantor agencies.

HUNTINGTON BEACH CITY SCHOOL DISTRICT
MANAGEMENT'S DISCUSSION AND ANALYSIS JUNE 30, 2018
6
The focus of the Statement of Net Position is designed to be similar to 'bottom line' results for the District from the economic resources measurement focus using the accrual basis of accounting. This statement, for the first time, combines and consolidates current financial resources with Capital Assets and related Long-Term Obligations. The statement also focuses on the Net Position of the District as a whole rather than the individual fund balance of the funds of the District.
The Statement of Activities focuses on the costs of the District's functions or programs and how they are supported by specific Federal and State grants, contributions, and auxiliary activities, separate from support received from State apportionment and other State revenues, property taxes, and interest. This report is intended to summarize and simplify the user's analysis of the costs of the District services to students and to the public. Certain activities between the funds of the District have been eliminated to focus the reader on the District-wide approach to the financial statements.
The Fund Financial Statements include statements for each of the two categories of activities: governmental and fiduciary.
The Governmental Funds are prepared using the current financial resources measurement focus and modified accrual basis of accounting. The District's primary services are reported in this category. This includes the education of kindergarten through grade eight students, special education programs, food and nutrition programs, and other programs supporting the education of the students within the District. Also included is the activity related to the ongoing improvement and maintenance of our school and administration buildings and sites. Property taxes, State funding, user fees, interest income, and Federal, State and local program grants, as well as our recently passed general obligation bonds, finance these programs and services.
The Fiduciary Funds are agency funds that are held by the District on behalf of others such as our associated student body activities. The District's fiduciary activities are reported in a separate Statement of Changes in Net Position. We exclude these activities from the District's other financial statements because the District cannot use these assets to finance its operations. The District is responsible for ensuring the assets reported in these funds are used only for their intended purposes.
A Reconciliation of the Fund Financial Statements to the Government-Wide Financial Statements is provided to explain the differences created by the integrated approach and is presented on pages 17 and 18, and pages 20 and 21.
FINANCIAL HIGHLIGHTS OF THE PAST YEAR
• The net position of our District increased during the 2017-2018 fiscal year by $120,324 (Table 2). • Student attendance is measured in Average Daily Attendance (ADA) and is the primary component of our
State apportionment funding. ADA decreased from the previous year by 129 ADA due to a decrease in our enrollment.
• Implementation of bond projects reduced facility expenditures needed from the General Fund.
HUNTINGTON BEACH CITY SCHOOL DISTRICT
MANAGEMENT'S DISCUSSION AND ANALYSIS JUNE 30, 2018
7
THE DISTRICT AS A WHOLE
Net Position
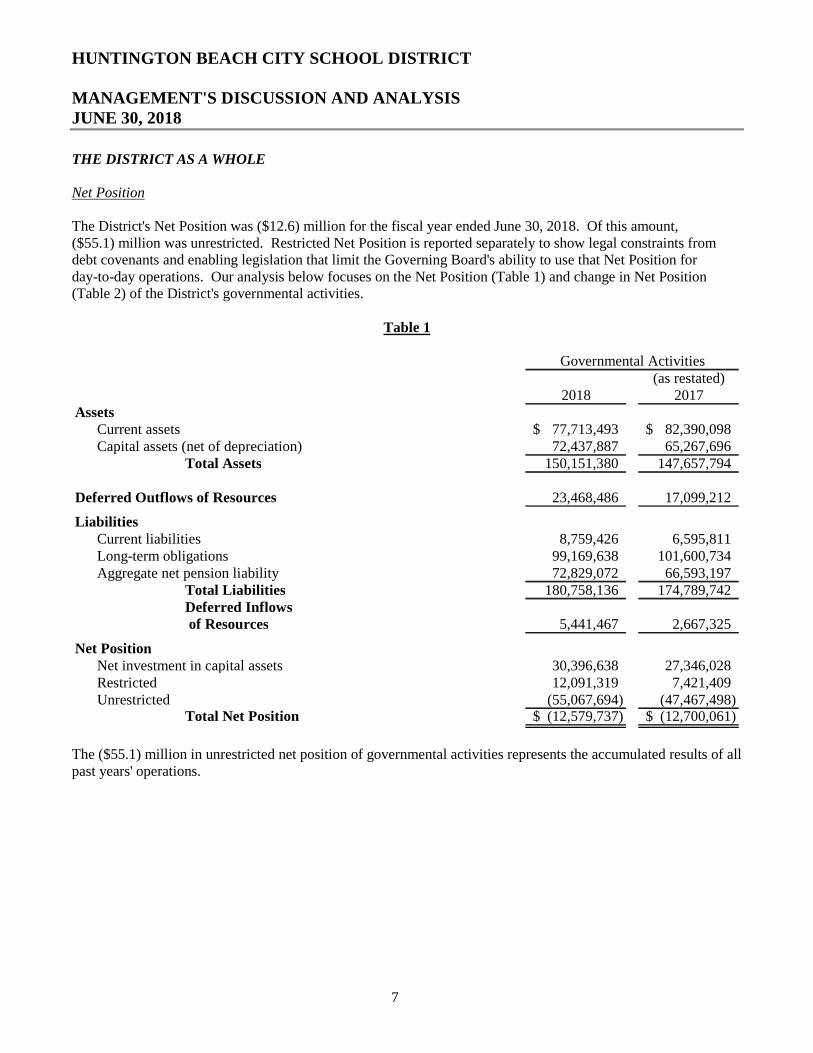
The District's Net Position was ($12.6) million for the fiscal year ended June 30, 2018. Of this amount, ($55.1) million was unrestricted. Restricted Net Position is reported separately to show legal constraints from debt covenants and enabling legislation that limit the Governing Board's ability to use that Net Position for day-to-day operations. Our analysis below focuses on the Net Position (Table 1) and change in Net Position (Table 2) of the District's governmental activities.
Table 1
(as restated)2018 2017
AssetsCurrent assets 77,713,493$ 82,390,098$ Capital assets (net of depreciation) 72,437,887 65,267,696
Total Assets 150,151,380 147,657,794
Deferred Outflows of Resources 23,468,486 17,099,212
LiabilitiesCurrent liabilities 8,759,426 6,595,811Long-term obligations 99,169,638 101,600,734Aggregate net pension liability 72,829,072 66,593,197
Total Liabilities 180,758,136 174,789,742Deferred Inflows of Resources 5,441,467 2,667,325
Net PositionNet investment in capital assets 30,396,638 27,346,028Restricted 12,091,319 7,421,409Unrestricted (55,067,694) (47,467,498)
Total Net Position (12,579,737)$ (12,700,061)$
Governmental Activities
The ($55.1) million in unrestricted net position of governmental activities represents the accumulated results of all past years' operations.
HUNTINGTON BEACH CITY SCHOOL DISTRICT
MANAGEMENT'S DISCUSSION AND ANALYSIS JUNE 30, 2018
8
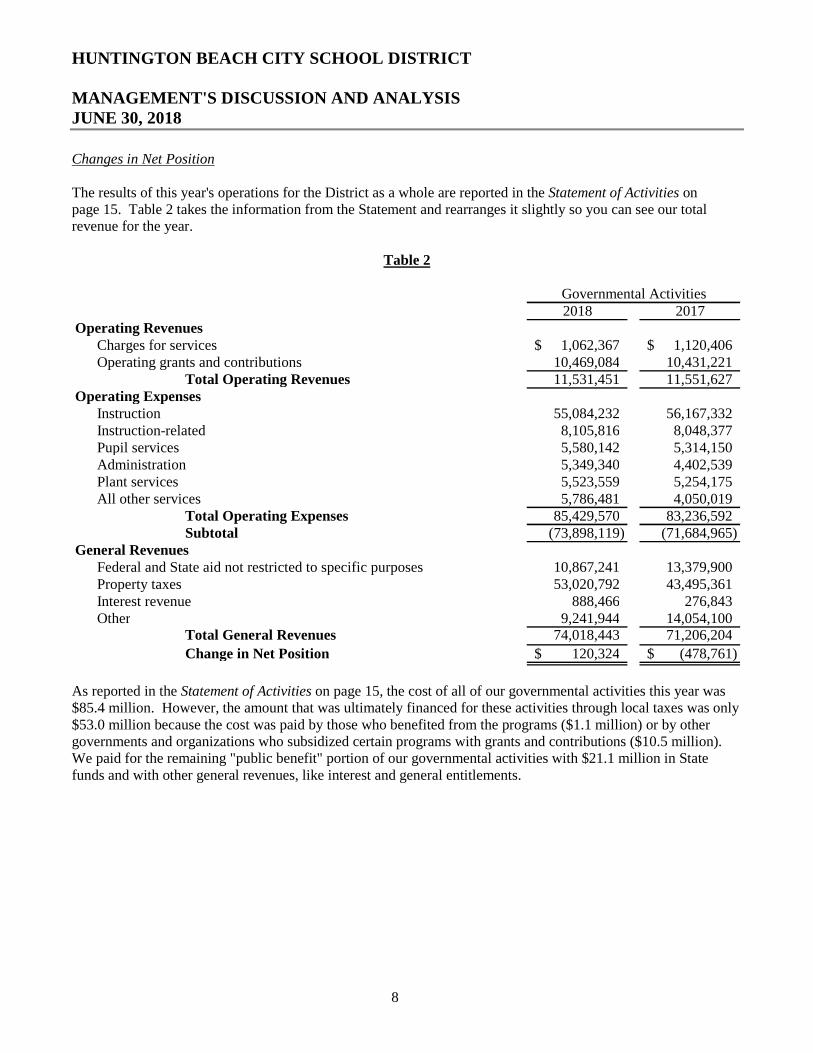
Changes in Net Position
The results of this year's operations for the District as a whole are reported in the Statement of Activities on page 15. Table 2 takes the information from the Statement and rearranges it slightly so you can see our total revenue for the year.
Table 2
2018 2017Operating Revenues
Charges for services 1,062,367$ 1,120,406$ Operating grants and contributions 10,469,084 10,431,221
Total Operating Revenues 11,531,451 11,551,627Operating Expenses
Instruction 55,084,232 56,167,332Instruction-related 8,105,816 8,048,377Pupil services 5,580,142 5,314,150Administration 5,349,340 4,402,539Plant services 5,523,559 5,254,175All other services 5,786,481 4,050,019
Total Operating Expenses 85,429,570 83,236,592Subtotal (73,898,119) (71,684,965)
General RevenuesFederal and State aid not restricted to specific purposes 10,867,241 13,379,900Property taxes 53,020,792 43,495,361Interest revenue 888,466 276,843Other 9,241,944 14,054,100
Total General Revenues 74,018,443 71,206,204
Change in Net Position 120,324$ (478,761)$
Governmental Activities
As reported in the Statement of Activities on page 15, the cost of all of our governmental activities this year was $85.4 million. However, the amount that was ultimately financed for these activities through local taxes was only $53.0 million because the cost was paid by those who benefited from the programs ($1.1 million) or by other governments and organizations who subsidized certain programs with grants and contributions ($10.5 million). We paid for the remaining "public benefit" portion of our governmental activities with $21.1 million in State funds and with other general revenues, like interest and general entitlements.
HUNTINGTON BEACH CITY SCHOOL DISTRICT
MANAGEMENT'S DISCUSSION AND ANALYSIS JUNE 30, 2018
9
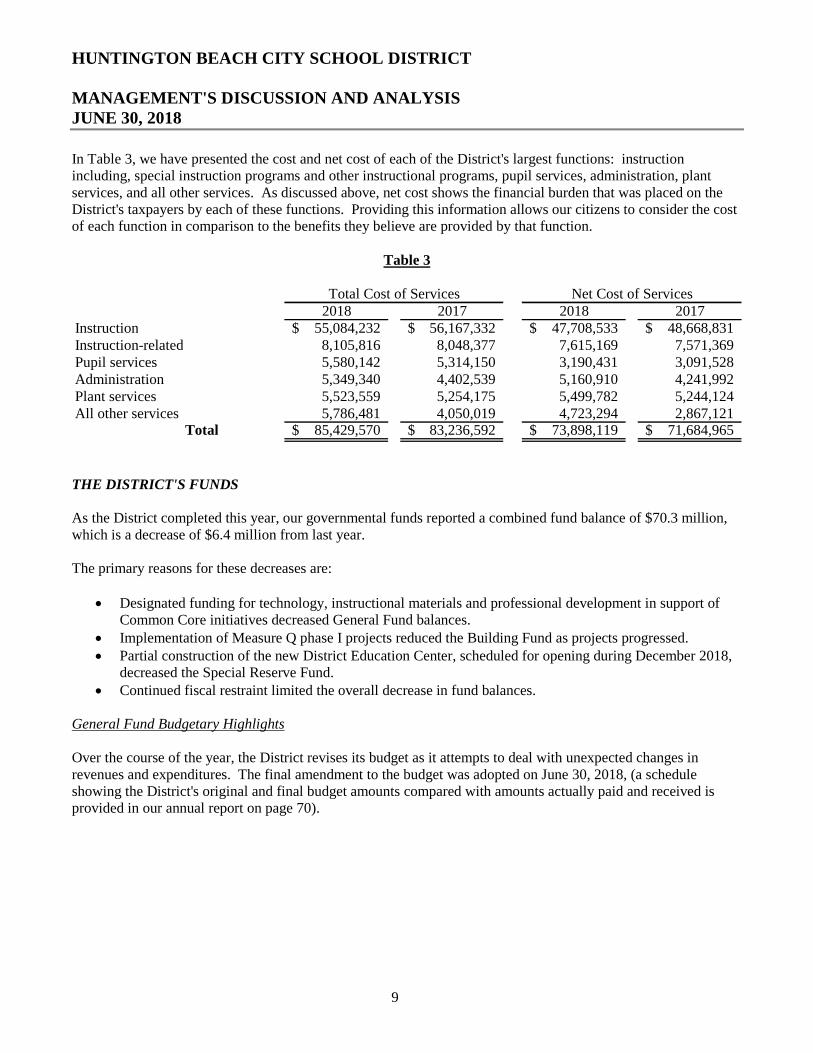
In Table 3, we have presented the cost and net cost of each of the District's largest functions: instruction including, special instruction programs and other instructional programs, pupil services, administration, plant services, and all other services. As discussed above, net cost shows the financial burden that was placed on the District's taxpayers by each of these functions. Providing this information allows our citizens to consider the cost of each function in comparison to the benefits they believe are provided by that function.
Table 3
2018 2017 2018 2017Instruction 55,084,232$ 56,167,332$ 47,708,533$ 48,668,831$ Instruction-related 8,105,816 8,048,377 7,615,169 7,571,369Pupil services 5,580,142 5,314,150 3,190,431 3,091,528Administration 5,349,340 4,402,539 5,160,910 4,241,992Plant services 5,523,559 5,254,175 5,499,782 5,244,124All other services 5,786,481 4,050,019 4,723,294 2,867,121
Total 85,429,570$ 83,236,592$ 73,898,119$ 71,684,965$
Total Cost of Services Net Cost of Services
THE DISTRICT'S FUNDS
As the District completed this year, our governmental funds reported a combined fund balance of $70.3 million, which is a decrease of $6.4 million from last year.
The primary reasons for these decreases are:
• Designated funding for technology, instructional materials and professional development in support of Common Core initiatives decreased General Fund balances.
• Implementation of Measure Q phase I projects reduced the Building Fund as projects progressed. • Partial construction of the new District Education Center, scheduled for opening during December 2018,
decreased the Special Reserve Fund. • Continued fiscal restraint limited the overall decrease in fund balances.
General Fund Budgetary Highlights
Over the course of the year, the District revises its budget as it attempts to deal with unexpected changes in revenues and expenditures. The final amendment to the budget was adopted on June 30, 2018, (a schedule showing the District's original and final budget amounts compared with amounts actually paid and received is provided in our annual report on page 70).
HUNTINGTON BEACH CITY SCHOOL DISTRICT
MANAGEMENT'S DISCUSSION AND ANALYSIS JUNE 30, 2018
10
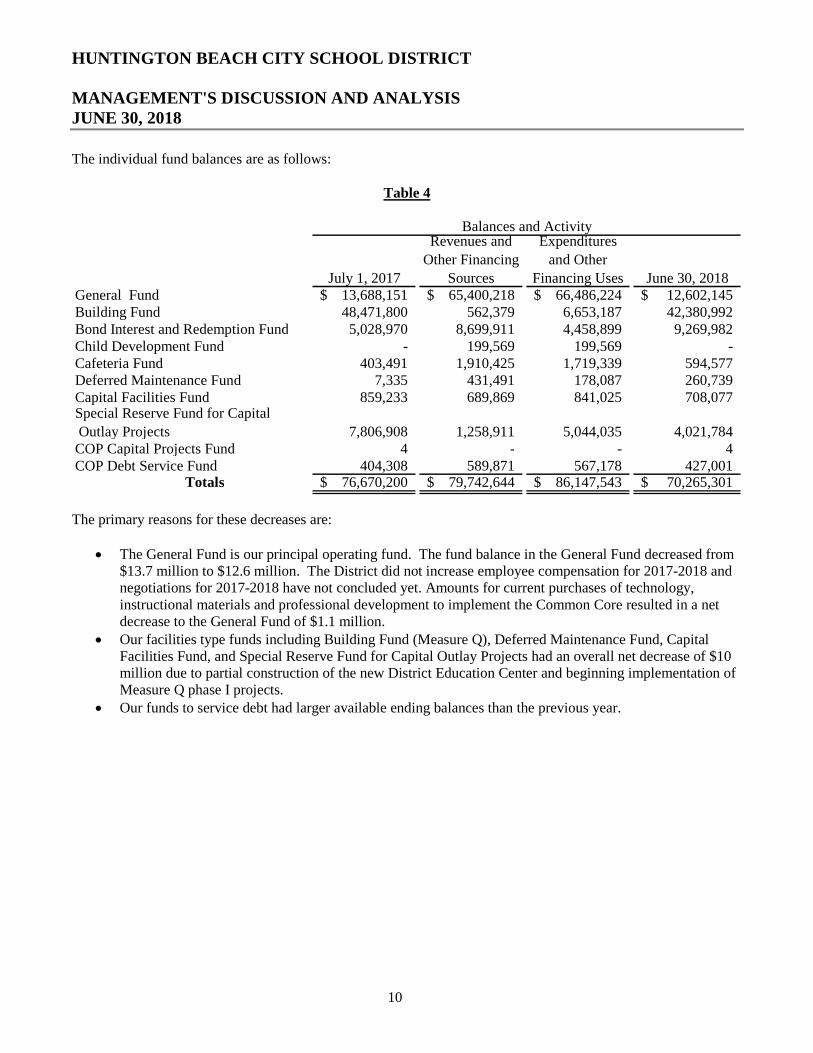
The individual fund balances are as follows:
Table 4
July 1, 2017
Revenues and
Other Financing
Sources
Expenditures
and Other
Financing Uses June 30, 2018General Fund 13,688,151$ 65,400,218$ 66,486,224$ 12,602,145$ Building Fund 48,471,800 562,379 6,653,187 42,380,992Bond Interest and Redemption Fund 5,028,970 8,699,911 4,458,899 9,269,982Child Development Fund - 199,569 199,569 -Cafeteria Fund 403,491 1,910,425 1,719,339 594,577Deferred Maintenance Fund 7,335 431,491 178,087 260,739Capital Facilities Fund 859,233 689,869 841,025 708,077Special Reserve Fund for Capital
Outlay Projects 7,806,908 1,258,911 5,044,035 4,021,784COP Capital Projects Fund 4 - - 4COP Debt Service Fund 404,308 589,871 567,178 427,001
Totals 76,670,200$ 79,742,644$ 86,147,543$ 70,265,301$
Balances and Activity
The primary reasons for these decreases are:
• The General Fund is our principal operating fund. The fund balance in the General Fund decreased from $13.7 million to $12.6 million. The District did not increase employee compensation for 2017-2018 and negotiations for 2017-2018 have not concluded yet. Amounts for current purchases of technology, instructional materials and professional development to implement the Common Core resulted in a net decrease to the General Fund of $1.1 million.
• Our facilities type funds including Building Fund (Measure Q), Deferred Maintenance Fund, Capital Facilities Fund, and Special Reserve Fund for Capital Outlay Projects had an overall net decrease of $10 million due to partial construction of the new District Education Center and beginning implementation of Measure Q phase I projects.
• Our funds to service debt had larger available ending balances than the previous year.
HUNTINGTON BEACH CITY SCHOOL DISTRICT
MANAGEMENT'S DISCUSSION AND ANALYSIS JUNE 30, 2018
11
CAPITAL ASSET AND DEBT ADMINISTRATION
Capital Assets
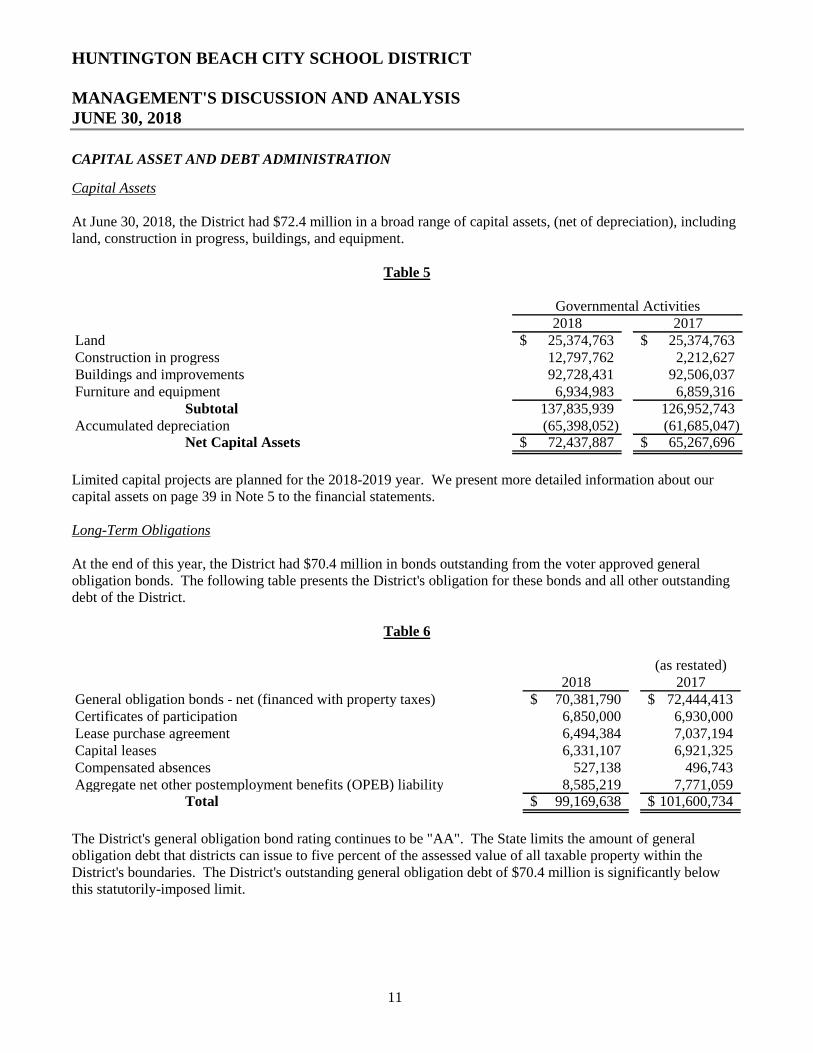
At June 30, 2018, the District had $72.4 million in a broad range of capital assets, (net of depreciation), including land, construction in progress, buildings, and equipment.
Table 5
2018 2017Land 25,374,763$ 25,374,763$ Construction in progress 12,797,762 2,212,627Buildings and improvements 92,728,431 92,506,037Furniture and equipment 6,934,983 6,859,316
Subtotal 137,835,939 126,952,743Accumulated depreciation (65,398,052) (61,685,047)
Net Capital Assets 72,437,887$ 65,267,696$
Governmental Activities
Limited capital projects are planned for the 2018-2019 year. We present more detailed information about our capital assets on page 39 in Note 5 to the financial statements.
Long-Term Obligations
At the end of this year, the District had $70.4 million in bonds outstanding from the voter approved general obligation bonds. The following table presents the District's obligation for these bonds and all other outstanding debt of the District.
Table 6
(as restated)2018 2017
General obligation bonds - net (financed with property taxes) 70,381,790$ 72,444,413$ Certificates of participation 6,850,000 6,930,000Lease purchase agreement 6,494,384 7,037,194Capital leases 6,331,107 6,921,325Compensated absences 527,138 496,743Aggregate net other postemployment benefits (OPEB) liability 8,585,219 7,771,059
Total 99,169,638$ 101,600,734$
The District's general obligation bond rating continues to be "AA". The State limits the amount of general obligation debt that districts can issue to five percent of the assessed value of all taxable property within the District's boundaries. The District's outstanding general obligation debt of $70.4 million is significantly below this statutorily-imposed limit.
HUNTINGTON BEACH CITY SCHOOL DISTRICT
MANAGEMENT'S DISCUSSION AND ANALYSIS JUNE 30, 2018
12
Other obligations include certificates of participation, compensated absences, lease purchase agreement, and aggregate net other postemployment benefits (OPEB) liability. We present more detailed information regarding our long-term obligations starting on page 42 in Note 9 of the financial statements.
Net Pension Liability (NPL)
At year-end the District had a net pension liability of $72,829,072, as a result of GASB Statement No. 68, Accounting and Financial Reporting for Pensions.
ECONOMIC FACTORS AND NEXT YEAR'S BUDGETS AND RATES
Economic Conditions in California
The 2013-2014 Enacted State Budget included the most far reaching reform of California's school finance system in 40 years. The new Local Control Funding Formula (LCFF) is tied to a comprehensive local accountability system requiring local educational agencies to adopt a Local Control Accountability Plan (LCAP). The major features of the LCFF include the following:
● Base grants tied to specific grade spans resulting in absolute dollar equalization when fully implemented. ● Additional funding for students from low-income families and English language learners equal to
20 percent of the base grant and an additional 50 percent of the base grant for districts with concentrations of qualifying students equal to or greater than 55 percent of student enrollment.
● An Economic Recovery Target to ensure most districts receive at least their 2007-2008 funding level when the LCFF is fully implemented in 2020-2021.
The District ended the 2017-2018 fiscal year in a positive financial position but facing new challenges. Continued fiscal restraint helped stabilize District finances. After a decrease of in ADA of 129 in 2017-2018, we are forecasting a decrease in ADA of 50 for 2018-2019 because of continuing declining enrollment in Orange County, one of the fastest aging counties in America. We are prioritizing programs and staffing to determine expense reductions necessary in response to continuing declining enrollment.
The District passed Measure Q on the November 2016 ballot to repair and upgrade our elementary and middle school facilities to provide safe, well-maintained environments. Multipurpose rooms and Science, Technology, Engineering, the Arts and Mathematics (STEAM) Labs will be built at our middle schools and 21st Century Classrooms will be installed throughout the District in addition to electrical, plumbing, roofing, seismic and security upgrades. Initial projects started in June 2018 with Dwyer Middle School and Hawes Elementary School under construction with various completion dates.
The sale of our former District Education Center and renovation of a surplus former school site into a new District Education Center will help to consolidate services and reduce operating costs. We will have one less site, consolidate Food Service and Maintenance on the new site and end our short-term lease obligation for temporary District Office facilities. The new District Education Center is scheduled to open during December 2018.
HUNTINGTON BEACH CITY SCHOOL DISTRICT
MANAGEMENT'S DISCUSSION AND ANALYSIS JUNE 30, 2018
13
The District will need budget reductions during the next three years to survive and those reductions will need to include staff and program reductions and the closure of a school site. Teacher shortages will make recruiting and retaining staff a challenge. We have very competitive compensation packages compared to the local districts we compete with for Teachers but will be challenged to continue that competitive advantage given we are one of the lowest funded elementary districts under the new LCFF funding model. Technology and materials to implement the California Common Core State Standards are expensive and required for all school districts regardless of funding levels. Employer rates for CalSTRS and CalPERS will increase significantly through 2020-2021 and beyond. Everyone recognizes that the implementation of the LCFF is dependent on the California economy. The LCFF funding model is expected to be fully funded during the 2018-2019 fiscal year and dependent on smaller cost-of-living adjustments (COLA) for future years. The election of a new Governor will add uncertainty to the school funding process.
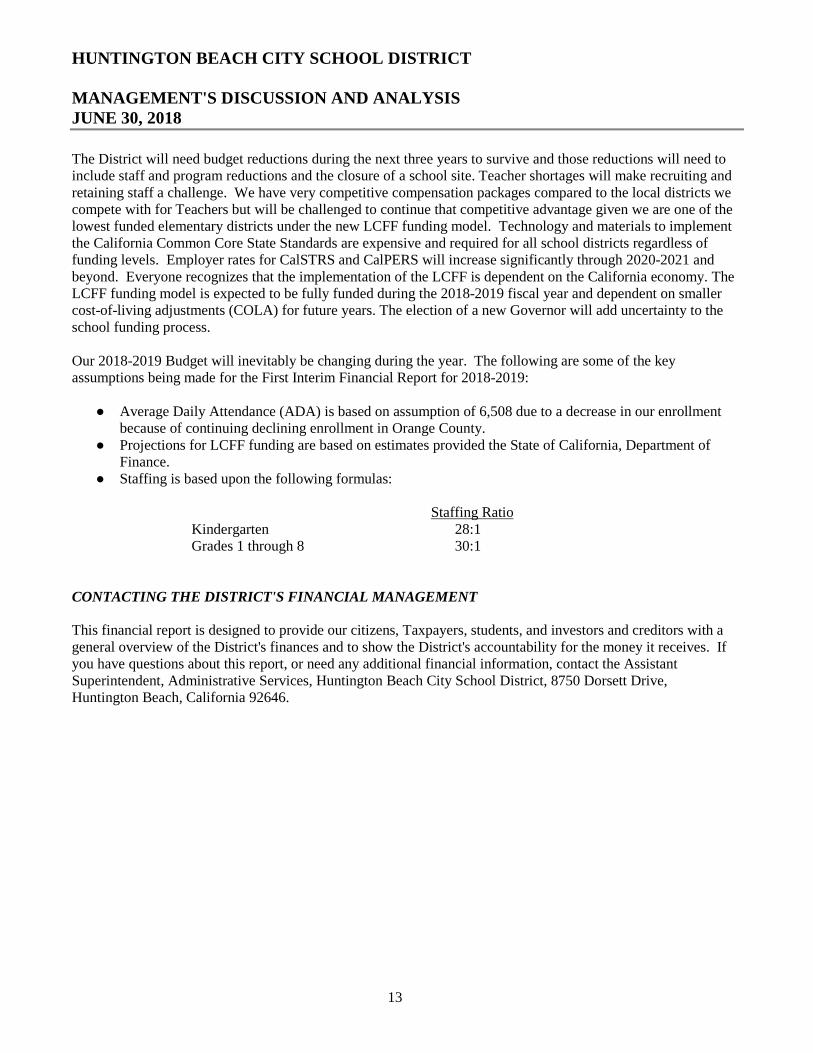
Our 2018-2019 Budget will inevitably be changing during the year. The following are some of the key assumptions being made for the First Interim Financial Report for 2018-2019:
● Average Daily Attendance (ADA) is based on assumption of 6,508 due to a decrease in our enrollment because of continuing declining enrollment in Orange County.
● Projections for LCFF funding are based on estimates provided the State of California, Department of Finance.
● Staffing is based upon the following formulas:
Staffing Ratio Kindergarten 28:1 Grades 1 through 8 30:1
CONTACTING THE DISTRICT'S FINANCIAL MANAGEMENT
This financial report is designed to provide our citizens, Taxpayers, students, and investors and creditors with a general overview of the District's finances and to show the District's accountability for the money it receives. If you have questions about this report, or need any additional financial information, contact the Assistant Superintendent, Administrative Services, Huntington Beach City School District, 8750 Dorsett Drive, Huntington Beach, California 92646.
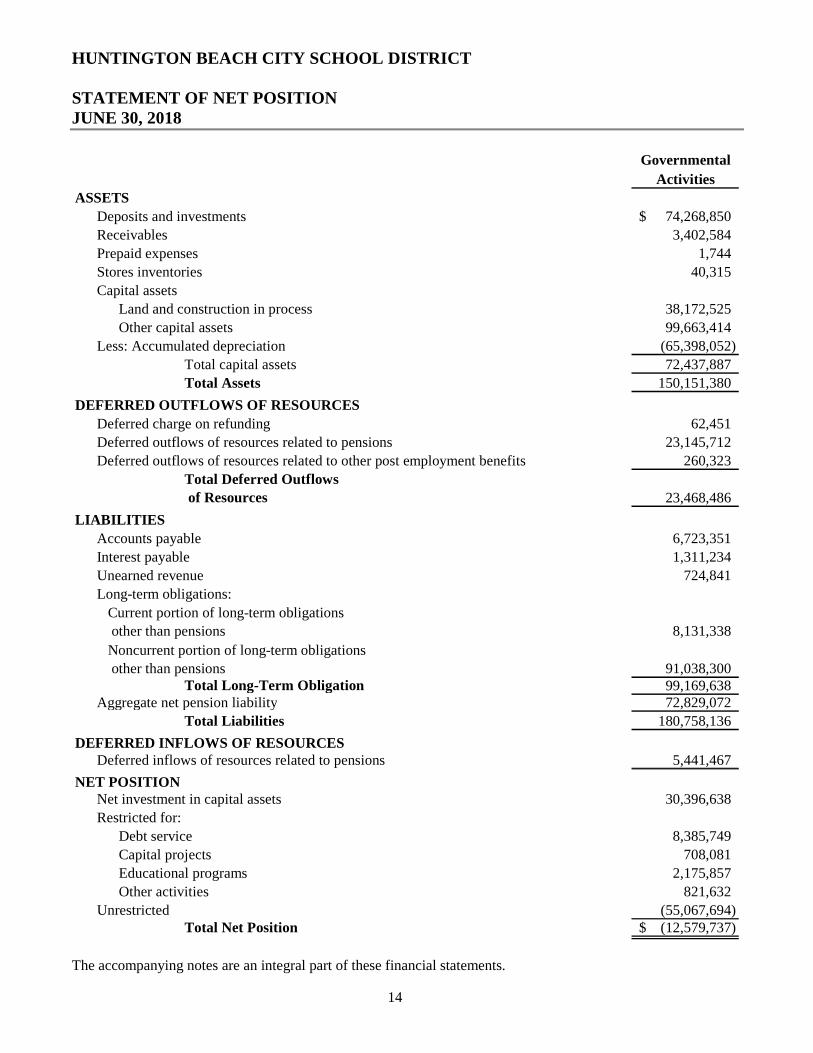
HUNTINGTON BEACH CITY SCHOOL DISTRICT
STATEMENT OF NET POSITION JUNE 30, 2018
The accompanying notes are an integral part of these financial statements.
14
Governmental
Activities
ASSETS
Deposits and investments 74,268,850$
Receivables 3,402,584
Prepaid expenses 1,744
Stores inventories 40,315
Capital assets
Land and construction in process 38,172,525
Other capital assets 99,663,414
Less: Accumulated depreciation (65,398,052)
Total capital assets 72,437,887
Total Assets 150,151,380
DEFERRED OUTFLOWS OF RESOURCES
Deferred charge on refunding 62,451
Deferred outflows of resources related to pensions 23,145,712
Deferred outflows of resources related to other post employment benefits 260,323
Total Deferred Outflows
of Resources 23,468,486
LIABILITIES
Accounts payable 6,723,351
Interest payable 1,311,234
Unearned revenue 724,841
Long-term obligations:
Current portion of long-term obligations
other than pensions 8,131,338
Noncurrent portion of long-term obligations
other than pensions 91,038,300Total Long-Term Obligation 99,169,638
Aggregate net pension liability 72,829,072
Total Liabilities 180,758,136
DEFERRED INFLOWS OF RESOURCESDeferred inflows of resources related to pensions 5,441,467
NET POSITIONNet investment in capital assets 30,396,638
Restricted for:
Debt service 8,385,749
Capital projects 708,081
Educational programs 2,175,857
Other activities 821,632
Unrestricted (55,067,694)Total Net Position (12,579,737)$
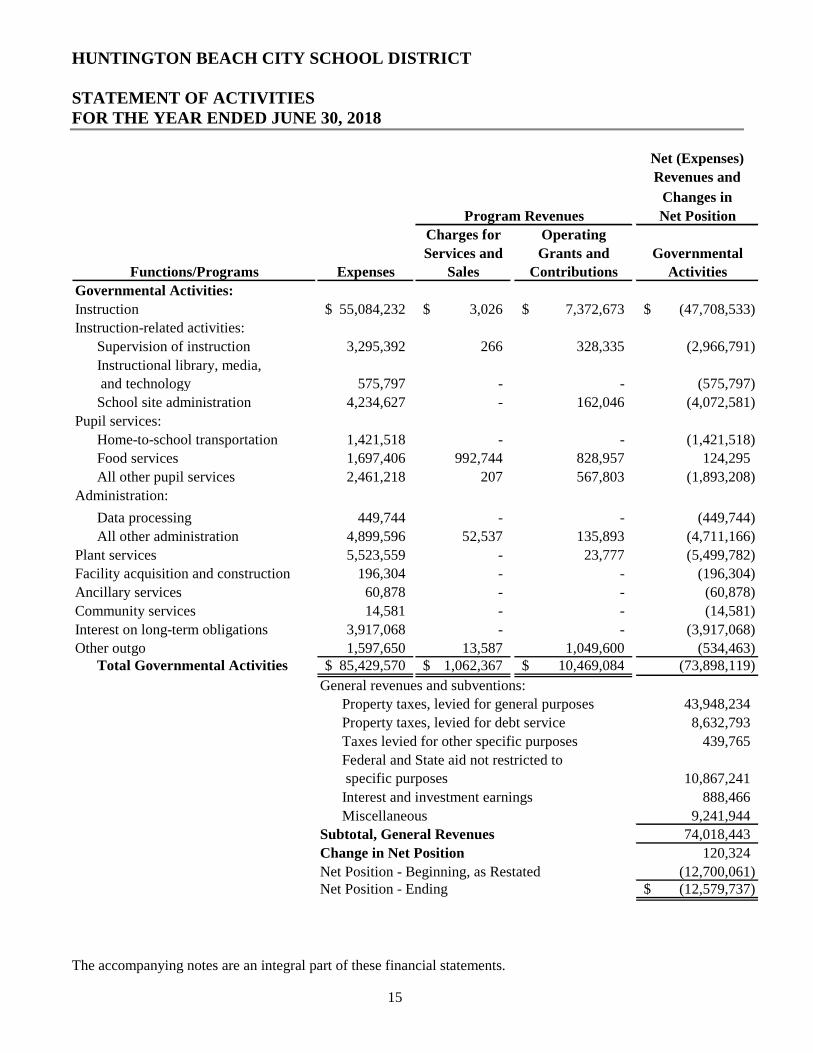
HUNTINGTON BEACH CITY SCHOOL DISTRICT
STATEMENT OF ACTIVITIES FOR THE YEAR ENDED JUNE 30, 2018
The accompanying notes are an integral part of these financial statements.
15
Net (Expenses)
Revenues and
Changes in
Charges for Operating
Services and Grants and Governmental
Functions/Programs Expenses Sales Contributions Activities
Governmental Activities:
Instruction 55,084,232$ 3,026$ 7,372,673$ (47,708,533)$
Instruction-related activities:
Supervision of instruction 3,295,392 266 328,335 (2,966,791)
Instructional library, media,
and technology 575,797 - - (575,797)
School site administration 4,234,627 - 162,046 (4,072,581)
Pupil services:
Home-to-school transportation 1,421,518 - - (1,421,518)
Food services 1,697,406 992,744 828,957 124,295
All other pupil services 2,461,218 207 567,803 (1,893,208)
Administration:
Data processing 449,744 - - (449,744)
All other administration 4,899,596 52,537 135,893 (4,711,166)
Plant services 5,523,559 - 23,777 (5,499,782)
Facility acquisition and construction 196,304 - - (196,304)
Ancillary services 60,878 - - (60,878)
Community services 14,581 - - (14,581)
Interest on long-term obligations 3,917,068 - - (3,917,068)
Other outgo 1,597,650 13,587 1,049,600 (534,463)Total Governmental Activities 85,429,570$ 1,062,367$ 10,469,084$ (73,898,119)
General revenues and subventions:
Property taxes, levied for general purposes 43,948,234
Property taxes, levied for debt service 8,632,793
Taxes levied for other specific purposes 439,765
10,867,241
Interest and investment earnings 888,466
Miscellaneous 9,241,944
74,018,443
Change in Net Position 120,324
Net Position - Beginning, as Restated (12,700,061)Net Position - Ending (12,579,737)$
Net PositionProgram Revenues
Federal and State aid not restricted to
specific purposes
Subtotal, General Revenues
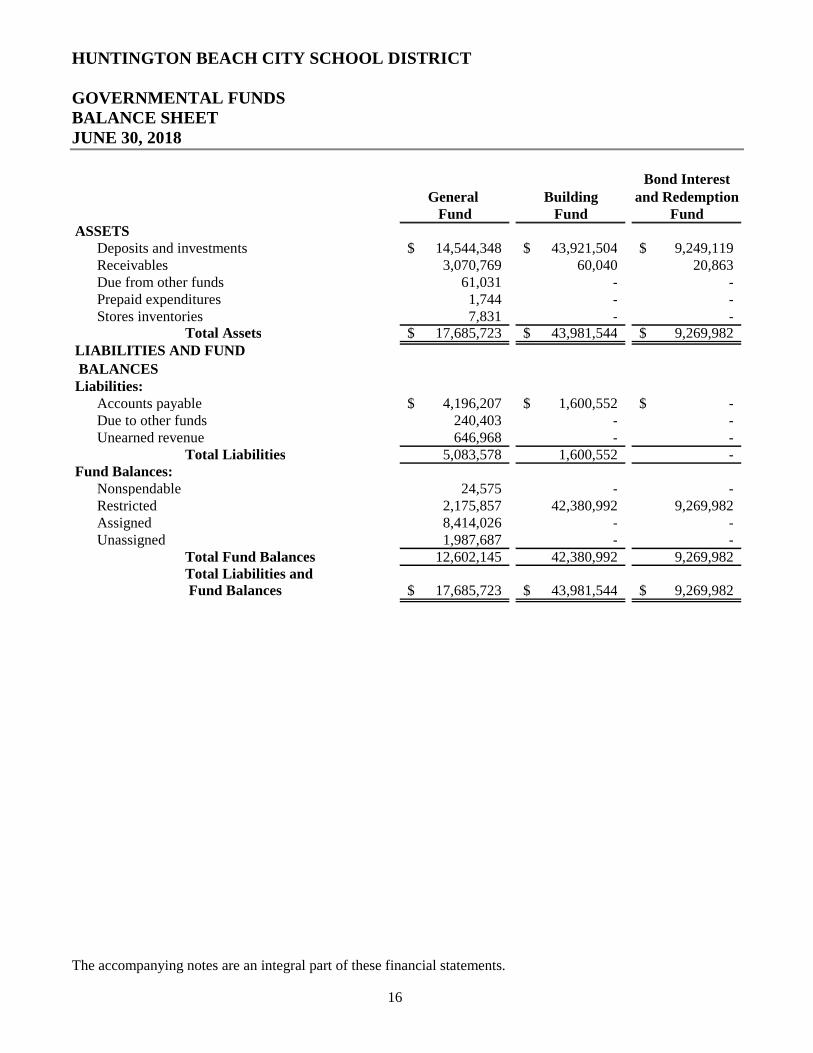
HUNTINGTON BEACH CITY SCHOOL DISTRICT
GOVERNMENTAL FUNDS BALANCE SHEET JUNE 30, 2018
The accompanying notes are an integral part of these financial statements.
16
Bond InterestGeneral Building and Redemption
Fund Fund FundASSETS
Deposits and investments 14,544,348$ 43,921,504$ 9,249,119$ Receivables 3,070,769 60,040 20,863Due from other funds 61,031 - -Prepaid expenditures 1,744 - -Stores inventories 7,831 - -
Total Assets 17,685,723$ 43,981,544$ 9,269,982$ LIABILITIES AND FUND
BALANCESLiabilities:
Accounts payable 4,196,207$ 1,600,552$ -$ Due to other funds 240,403 - -Unearned revenue 646,968 - -
Total Liabilities 5,083,578 1,600,552 -Fund Balances:
Nonspendable 24,575 - -Restricted 2,175,857 42,380,992 9,269,982Assigned 8,414,026 - -Unassigned 1,987,687 - -
Total Fund Balances 12,602,145 42,380,992 9,269,982Total Liabilities and Fund Balances 17,685,723$ 43,981,544$ 9,269,982$
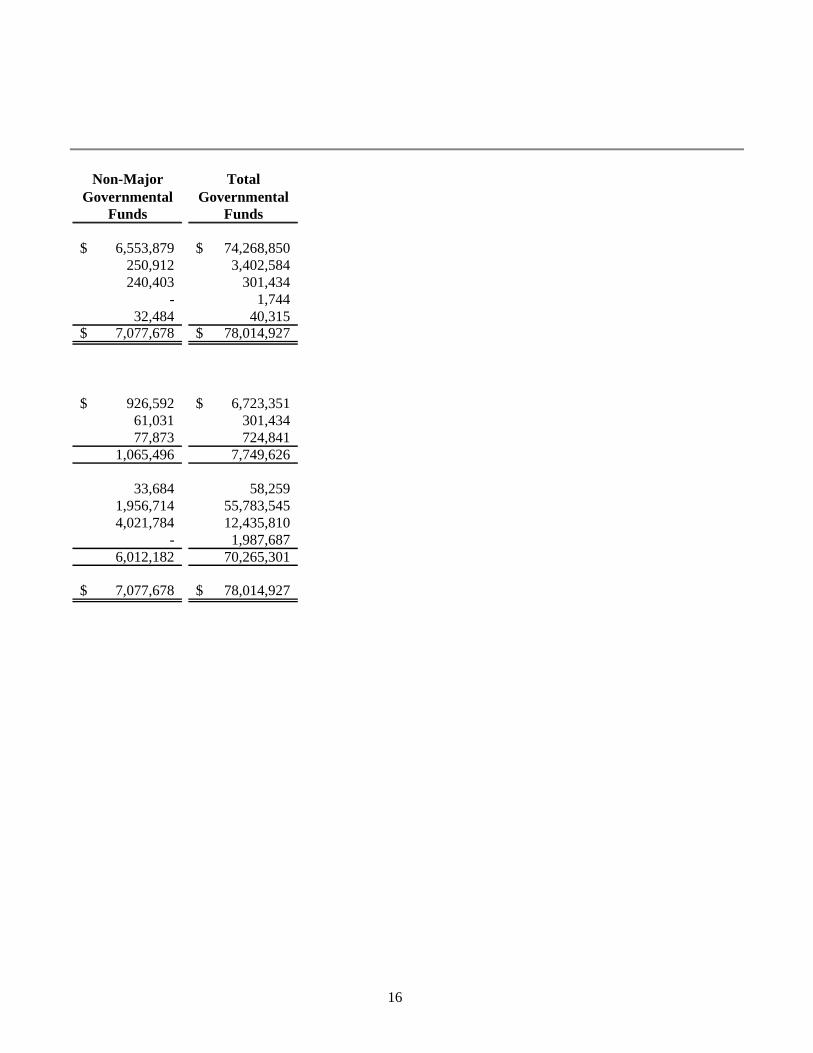
16
Non-Major TotalGovernmental Governmental
Funds Funds
6,553,879$ 74,268,850$ 250,912 3,402,584240,403 301,434
- 1,74432,484 40,315
7,077,678$ 78,014,927$
926,592$ 6,723,351$ 61,031 301,43477,873 724,841
1,065,496 7,749,626
33,684 58,2591,956,714 55,783,5454,021,784 12,435,810
- 1,987,6876,012,182 70,265,301
7,077,678$ 78,014,927$
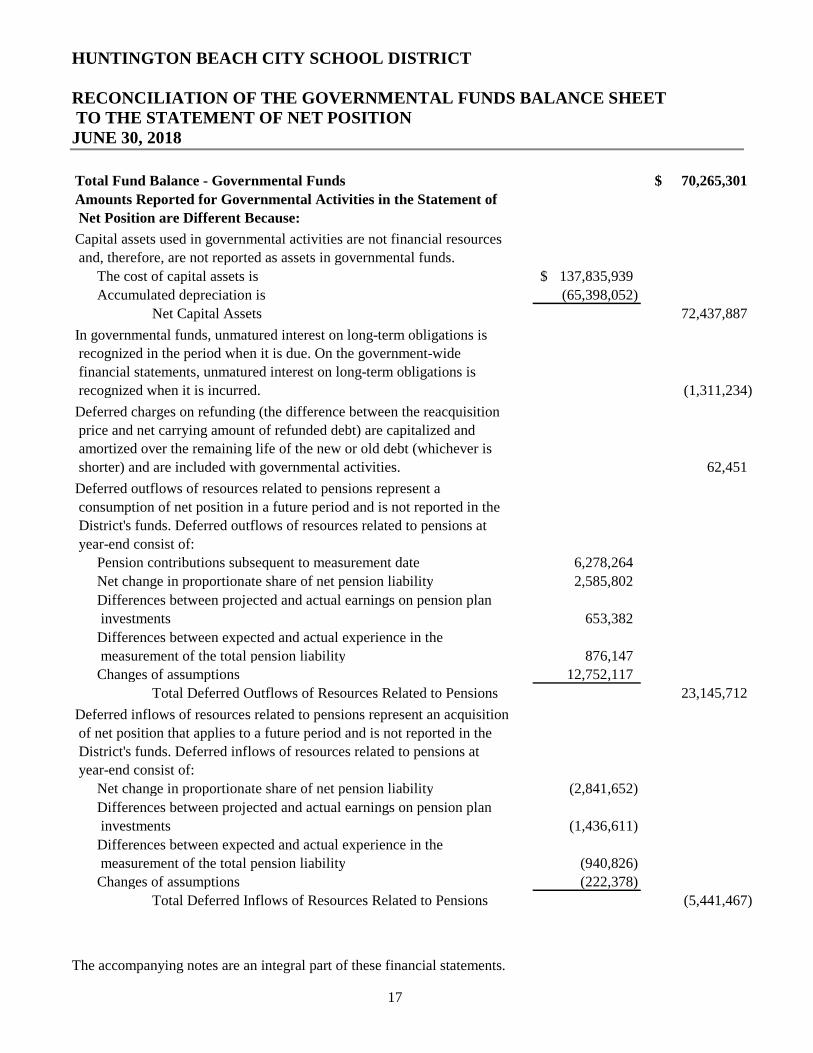
HUNTINGTON BEACH CITY SCHOOL DISTRICT
RECONCILIATION OF THE GOVERNMENTAL FUNDS BALANCE SHEET TO THE STATEMENT OF NET POSITION JUNE 30, 2018
The accompanying notes are an integral part of these financial statements.
17
Total Fund Balance - Governmental Funds 70,265,301$
Amounts Reported for Governmental Activities in the Statement of
Net Position are Different Because:
Capital assets used in governmental activities are not financial resources
and, therefore, are not reported as assets in governmental funds.
The cost of capital assets is 137,835,939$
Accumulated depreciation is (65,398,052)
Net Capital Assets 72,437,887
In governmental funds, unmatured interest on long-term obligations is
recognized in the period when it is due. On the government-wide
financial statements, unmatured interest on long-term obligations is
recognized when it is incurred. (1,311,234)
Deferred charges on refunding (the difference between the reacquisition
price and net carrying amount of refunded debt) are capitalized and
amortized over the remaining life of the new or old debt (whichever is
shorter) and are included with governmental activities. 62,451
Deferred outflows of resources related to pensions represent a
consumption of net position in a future period and is not reported in the
District's funds. Deferred outflows of resources related to pensions at
year-end consist of:
Pension contributions subsequent to measurement date 6,278,264
Net change in proportionate share of net pension liability 2,585,802
Differences between projected and actual earnings on pension plan
investments 653,382
Differences between expected and actual experience in the
measurement of the total pension liability 876,147
Changes of assumptions 12,752,117
Total Deferred Outflows of Resources Related to Pensions 23,145,712
Deferred inflows of resources related to pensions represent an acquisition
of net position that applies to a future period and is not reported in the
District's funds. Deferred inflows of resources related to pensions at
year-end consist of:
Net change in proportionate share of net pension liability (2,841,652)
Differences between projected and actual earnings on pension plan
investments (1,436,611)
Differences between expected and actual experience in the
measurement of the total pension liability (940,826)
Changes of assumptions (222,378)
Total Deferred Inflows of Resources Related to Pensions (5,441,467)
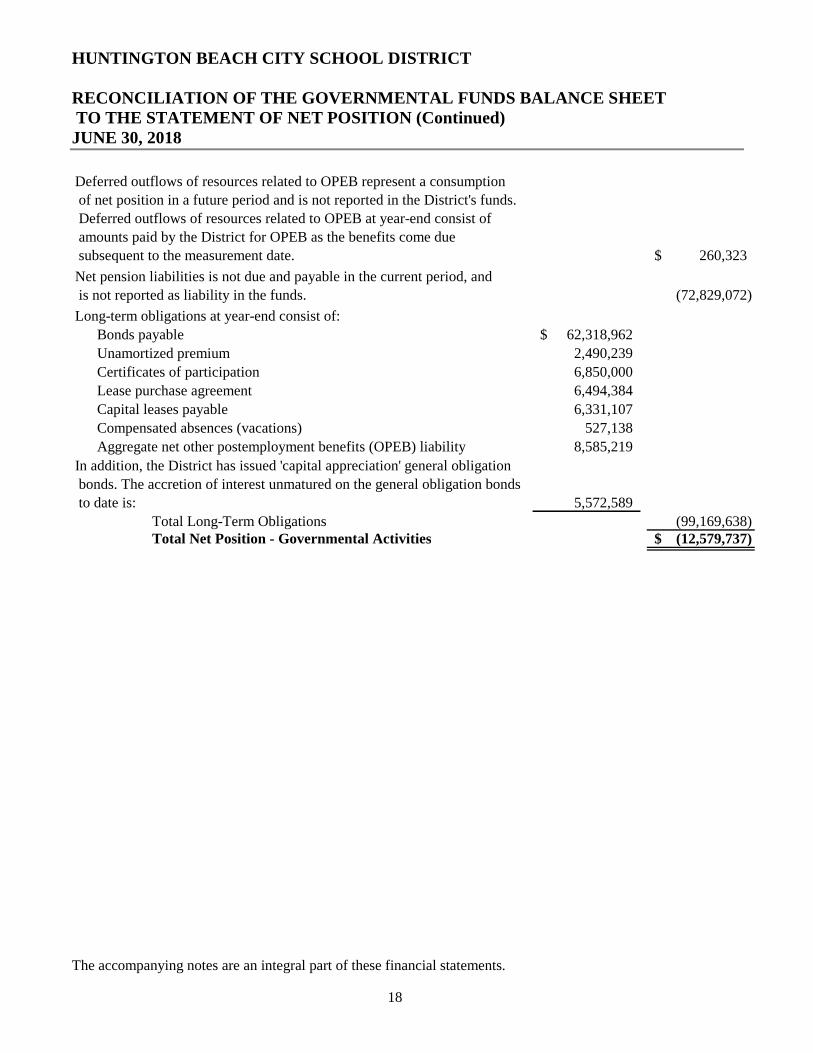
HUNTINGTON BEACH CITY SCHOOL DISTRICT
RECONCILIATION OF THE GOVERNMENTAL FUNDS BALANCE SHEET TO THE STATEMENT OF NET POSITION (Continued) JUNE 30, 2018
The accompanying notes are an integral part of these financial statements.
18
Deferred outflows of resources related to OPEB represent a consumption
of net position in a future period and is not reported in the District's funds.
Deferred outflows of resources related to OPEB at year-end consist of
amounts paid by the District for OPEB as the benefits come due
subsequent to the measurement date. 260,323$
Net pension liabilities is not due and payable in the current period, and
is not reported as liability in the funds. (72,829,072)
Long-term obligations at year-end consist of:
Bonds payable 62,318,962$
Unamortized premium 2,490,239
Certificates of participation 6,850,000
Lease purchase agreement 6,494,384
Capital leases payable 6,331,107
Compensated absences (vacations) 527,138
Aggregate net other postemployment benefits (OPEB) liability 8,585,219
In addition, the District has issued 'capital appreciation' general obligation
bonds. The accretion of interest unmatured on the general obligation bonds
to date is: 5,572,589
Total Long-Term Obligations (99,169,638)Total Net Position - Governmental Activities (12,579,737)$
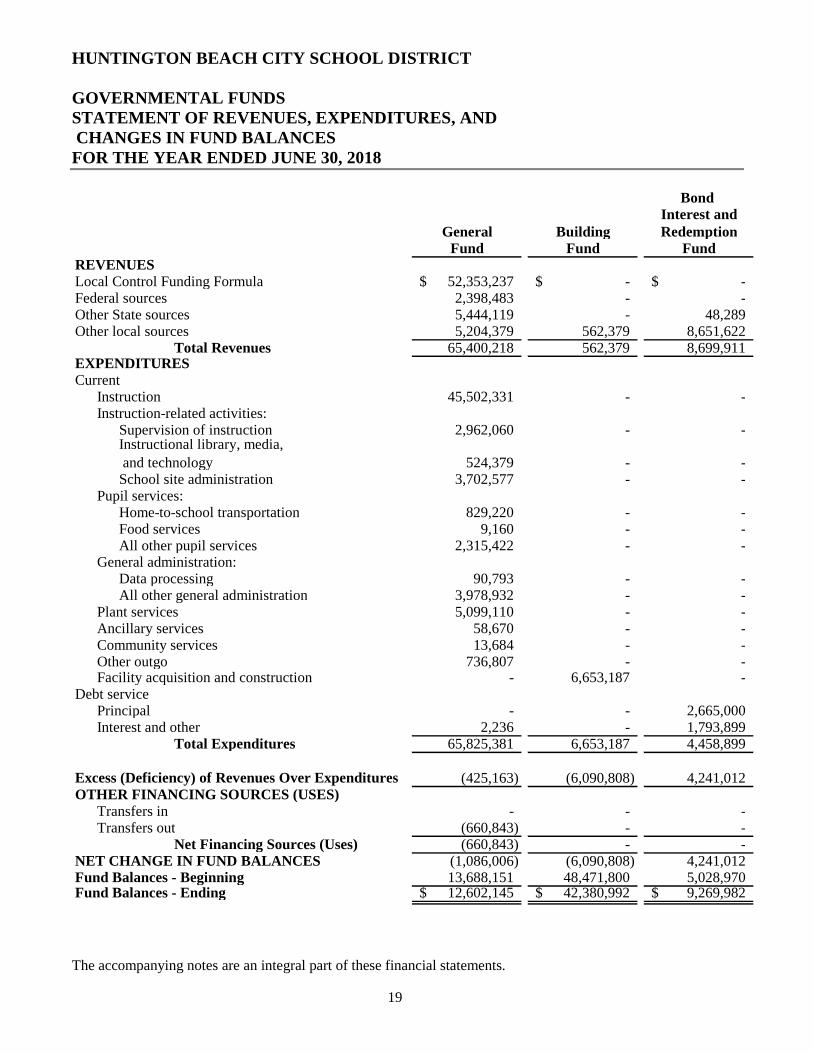
HUNTINGTON BEACH CITY SCHOOL DISTRICT
GOVERNMENTAL FUNDS STATEMENT OF REVENUES, EXPENDITURES, AND CHANGES IN FUND BALANCES FOR THE YEAR ENDED JUNE 30, 2018
The accompanying notes are an integral part of these financial statements.
19
Bond Interest and
General Building RedemptionFund Fund Fund
REVENUESLocal Control Funding Formula 52,353,237$ -$ -$ Federal sources 2,398,483 - -Other State sources 5,444,119 - 48,289Other local sources 5,204,379 562,379 8,651,622
Total Revenues 65,400,218 562,379 8,699,911EXPENDITURESCurrent
Instruction 45,502,331 - -Instruction-related activities:
Supervision of instruction 2,962,060 - -Instructional library, media,
and technology 524,379 - -School site administration 3,702,577 - -
Pupil services:Home-to-school transportation 829,220 - -Food services 9,160 - -All other pupil services 2,315,422 - -
General administration:Data processing 90,793 - -All other general administration 3,978,932 - -
Plant services 5,099,110 - -Ancillary services 58,670 - -Community services 13,684 - -Other outgo 736,807 - -Facility acquisition and construction - 6,653,187 -
Debt servicePrincipal - - 2,665,000Interest and other 2,236 - 1,793,899
Total Expenditures 65,825,381 6,653,187 4,458,899
Excess (Deficiency) of Revenues Over Expenditures (425,163) (6,090,808) 4,241,012OTHER FINANCING SOURCES (USES)
Transfers in - - -Transfers out (660,843) - -
Net Financing Sources (Uses) (660,843) - -NET CHANGE IN FUND BALANCES (1,086,006) (6,090,808) 4,241,012Fund Balances - Beginning 13,688,151 48,471,800 5,028,970Fund Balances - Ending 12,602,145$ 42,380,992$ 9,269,982$
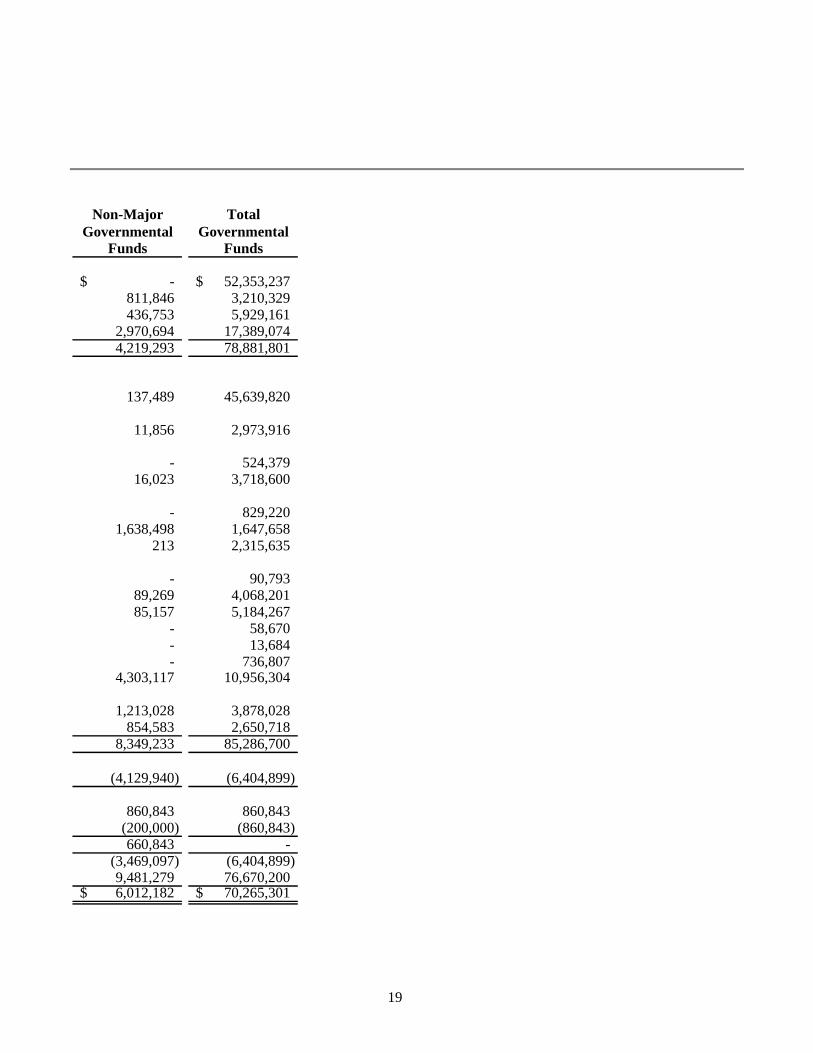
19
Non-Major TotalGovernmental Governmental
Funds Funds
-$ 52,353,237$ 811,846 3,210,329436,753 5,929,161
2,970,694 17,389,0744,219,293 78,881,801
137,489 45,639,820
11,856 2,973,916
- 524,37916,023 3,718,600
- 829,2201,638,498 1,647,658
213 2,315,635
- 90,79389,269 4,068,20185,157 5,184,267
- 58,670- 13,684- 736,807
4,303,117 10,956,304
1,213,028 3,878,028854,583 2,650,718
8,349,233 85,286,700
(4,129,940) (6,404,899)
860,843 860,843(200,000) (860,843)660,843 -
(3,469,097) (6,404,899)9,481,279 76,670,2006,012,182$ 70,265,301$
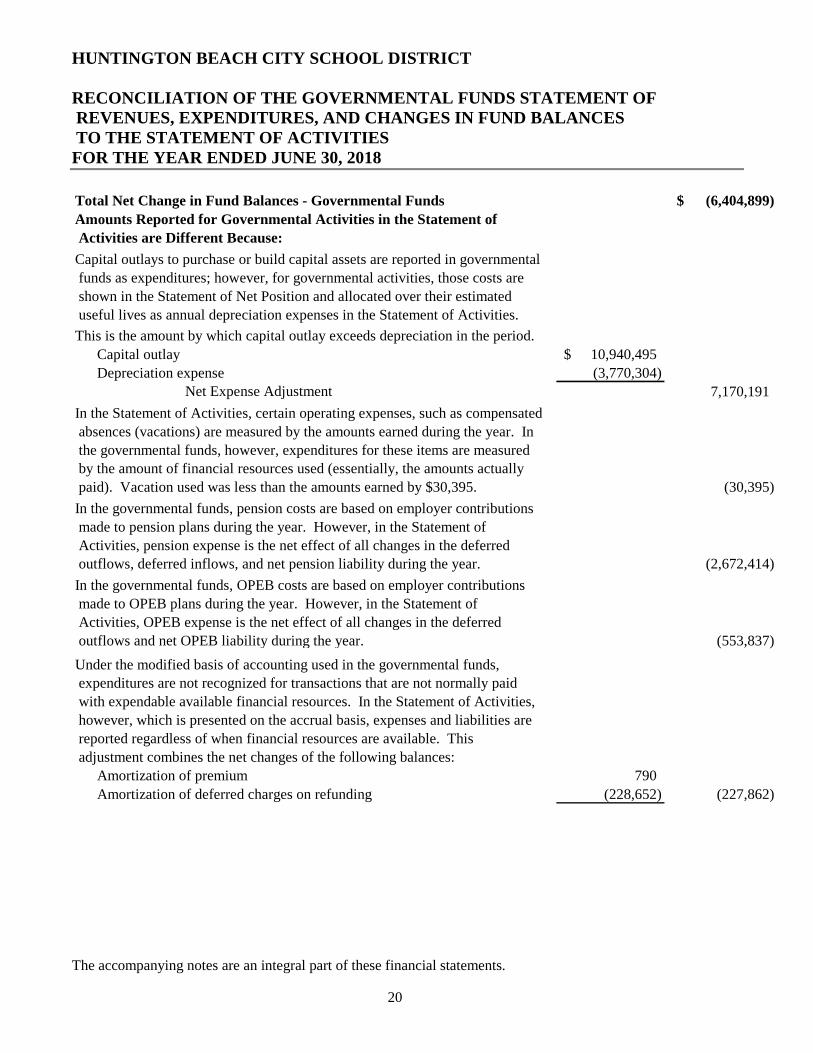
HUNTINGTON BEACH CITY SCHOOL DISTRICT
RECONCILIATION OF THE GOVERNMENTAL FUNDS STATEMENT OF REVENUES, EXPENDITURES, AND CHANGES IN FUND BALANCES TO THE STATEMENT OF ACTIVITIES FOR THE YEAR ENDED JUNE 30, 2018
The accompanying notes are an integral part of these financial statements.
20
Total Net Change in Fund Balances - Governmental Funds (6,404,899)$
Amounts Reported for Governmental Activities in the Statement of
Activities are Different Because:
Capital outlays to purchase or build capital assets are reported in governmental
funds as expenditures; however, for governmental activities, those costs are
shown in the Statement of Net Position and allocated over their estimated
useful lives as annual depreciation expenses in the Statement of Activities.
This is the amount by which capital outlay exceeds depreciation in the period.
Capital outlay 10,940,495$
Depreciation expense (3,770,304)
Net Expense Adjustment 7,170,191
In the Statement of Activities, certain operating expenses, such as compensated
absences (vacations) are measured by the amounts earned during the year. In
the governmental funds, however, expenditures for these items are measured
by the amount of financial resources used (essentially, the amounts actually
paid). Vacation used was less than the amounts earned by $30,395. (30,395)
In the governmental funds, pension costs are based on employer contributions
made to pension plans during the year. However, in the Statement of
Activities, pension expense is the net effect of all changes in the deferred
outflows, deferred inflows, and net pension liability during the year. (2,672,414)
In the governmental funds, OPEB costs are based on employer contributions
made to OPEB plans during the year. However, in the Statement of
Activities, OPEB expense is the net effect of all changes in the deferred
outflows and net OPEB liability during the year. (553,837)
Under the modified basis of accounting used in the governmental funds,
expenditures are not recognized for transactions that are not normally paid
with expendable available financial resources. In the Statement of Activities,
however, which is presented on the accrual basis, expenses and liabilities are
reported regardless of when financial resources are available. This
adjustment combines the net changes of the following balances:
Amortization of premium 790
Amortization of deferred charges on refunding (228,652) (227,862)
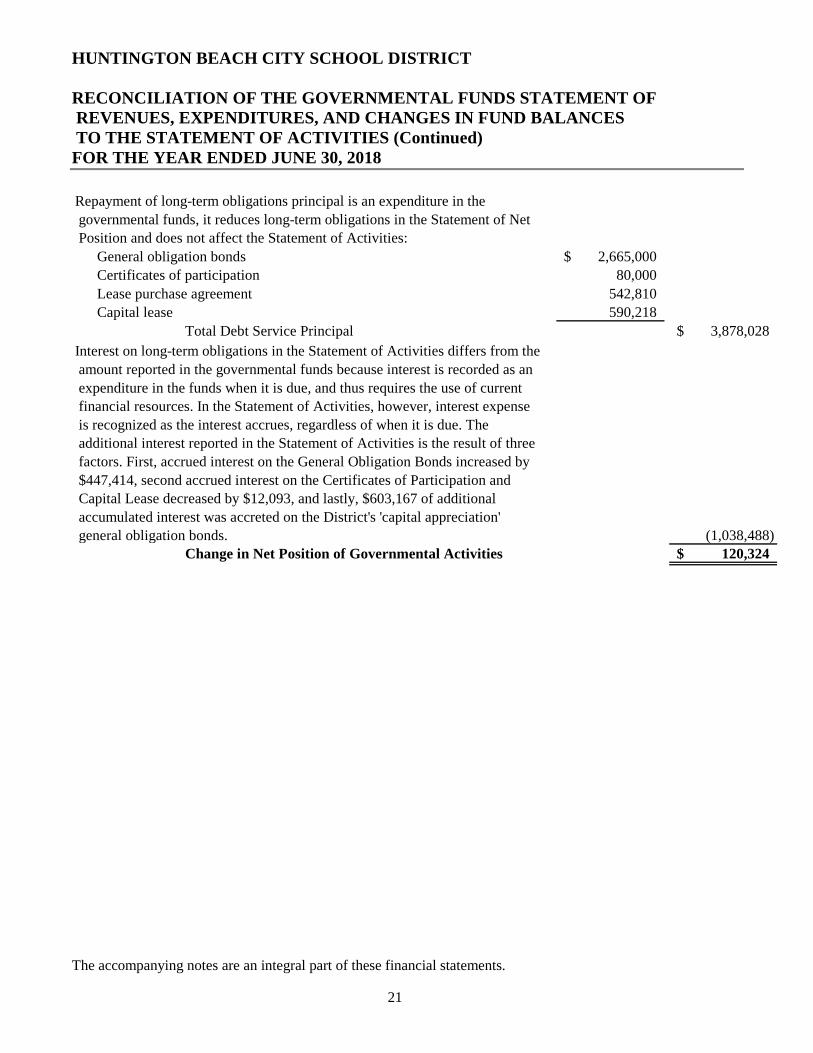
HUNTINGTON BEACH CITY SCHOOL DISTRICT
RECONCILIATION OF THE GOVERNMENTAL FUNDS STATEMENT OF REVENUES, EXPENDITURES, AND CHANGES IN FUND BALANCES TO THE STATEMENT OF ACTIVITIES (Continued) FOR THE YEAR ENDED JUNE 30, 2018
The accompanying notes are an integral part of these financial statements.
21
Repayment of long-term obligations principal is an expenditure in the
governmental funds, it reduces long-term obligations in the Statement of Net
Position and does not affect the Statement of Activities:
General obligation bonds 2,665,000$
Certificates of participation 80,000
Lease purchase agreement 542,810
Capital lease 590,218
Total Debt Service Principal 3,878,028$
Interest on long-term obligations in the Statement of Activities differs from the
amount reported in the governmental funds because interest is recorded as an
expenditure in the funds when it is due, and thus requires the use of current
financial resources. In the Statement of Activities, however, interest expense
is recognized as the interest accrues, regardless of when it is due. The
additional interest reported in the Statement of Activities is the result of three
factors. First, accrued interest on the General Obligation Bonds increased by
$447,414, second accrued interest on the Certificates of Participation and
Capital Lease decreased by $12,093, and lastly, $603,167 of additional
accumulated interest was accreted on the District's 'capital appreciation'
general obligation bonds. (1,038,488)
Change in Net Position of Governmental Activities 120,324$
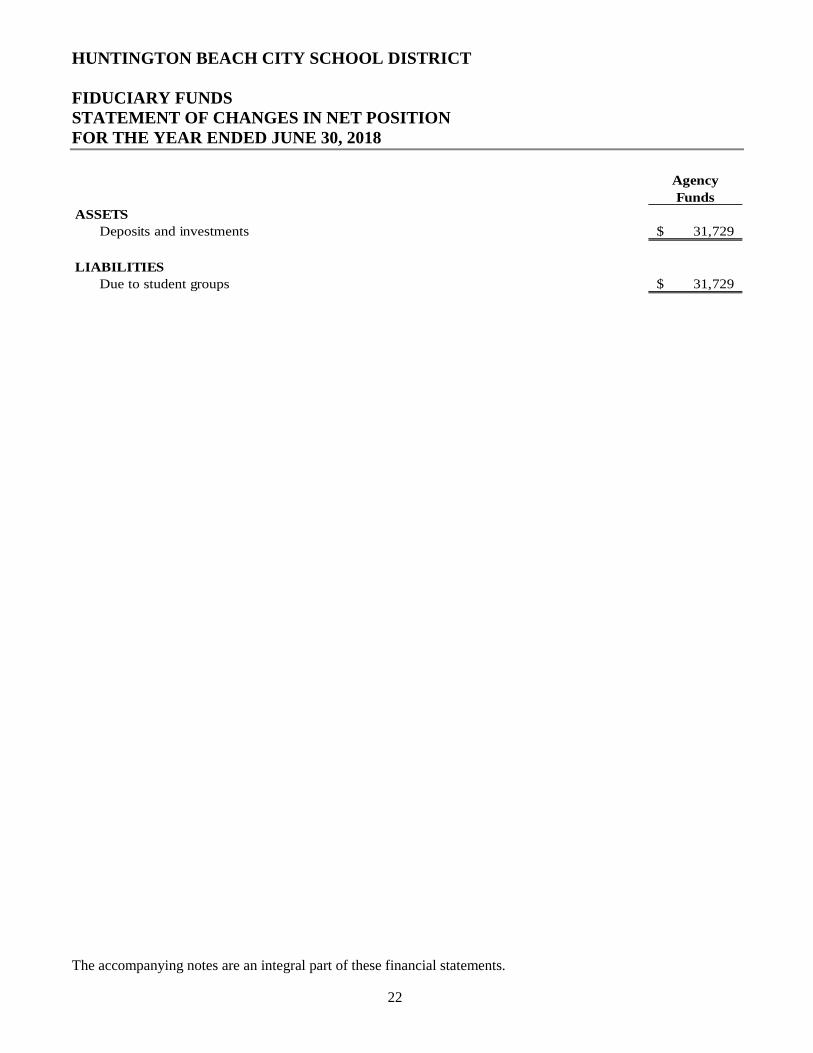
HUNTINGTON BEACH CITY SCHOOL DISTRICT
FIDUCIARY FUNDS STATEMENT OF CHANGES IN NET POSITION FOR THE YEAR ENDED JUNE 30, 2018
The accompanying notes are an integral part of these financial statements.
22
Agency
Funds
ASSETS
Deposits and investments 31,729$
LIABILITIES
Due to student groups 31,729$
HUNTINGTON BEACH CITY SCHOOL DISTRICT
NOTES TO FINANCIAL STATEMENTS JUNE 30, 2018
23
NOTE 1 - SUMMARY OF SIGNIFICANT ACCOUNTING POLICIES
Financial Reporting Entity
The Huntington Beach City School District (the District) was organized in 1905 under the laws of the State of California. The District operates under a locally-elected five-member Board form of government and provides educational services to grades K-8 as mandated by the State of California. The District operates seven elementary schools and two middle schools.
A reporting entity is comprised of the primary government, component units, and other organizations that are included to ensure the financial statements are not misleading. The primary government of the District consists of all funds, departments, boards, and agencies that are not legally separate from the District. For the District, this includes general operations, food service, and student related activities of the District.
Component Units
Component units are legally separate organizations for which the District is financially accountable. Component units may also include organizations that are fiscally dependent on the District, in that the District approves their budget, the issuance of their debt or the levying of their taxes. In addition, component units are other legally separate organizations for which the District is not financially accountable but the nature and significance of the organizations relationship with the District is such that exclusion would cause the District's financial statements to be misleading or incomplete. For financial reporting purposes, the component unit has a financial and operational relationship which meets the reporting entity definition criteria of the Governmental Accounting Standards Board (GASB) Statement No. 14, The Financial Reporting Entity, and thus is included in the financial statements of the District. The component unit, although a legally separate entity, is reported in the financial statements as if it were part of the District's operations because the governing board of the component unit is essentially the same as the governing board of the District and because its purpose is to finance the construction of facilities to be used for the benefit of the District.
The Huntington Beach City School Financing Corporation's financial activity is presented in the financial statements within the COP Debt Service Fund and COP Capital Projects Fund. Certificates of Participation and Lease/Purchase Agreements issued by the Corporation are included as long-term liabilities in the government-wide financial statements. Individually-prepared financial statements are not prepared for the Huntington Beach City School Financing Corporation.
Other Related Entities
Charter School The District has approved a Charter for Kinetic Academy pursuant to Education CodeSection 47605. The Kinetic Academy Charter School is not operated by the District and not considered a component unit of the District.
Basis of Presentation - Fund Accounting
The accounting system is organized and operated on a fund basis. A fund is defined as a fiscal and accounting entity with a self-balancing set of accounts, which are segregated for the purpose of carrying on specific activities or attaining certain objectives in accordance with special regulations, restrictions, or limitations. The District's funds are grouped into two broad fund categories: governmental and fiduciary.
HUNTINGTON BEACH CITY SCHOOL DISTRICT
NOTES TO FINANCIAL STATEMENTS JUNE 30, 2018
24
Governmental Funds Governmental funds are those through which most governmental functions typically are financed. Governmental fund reporting focuses on the sources, uses, and balances of current financial resources. Expendable assets are assigned to the various governmental funds according to the purposes for which they may or must be used. Current liabilities are assigned to the fund from which they will be paid. The difference between governmental fund assets and liabilities is reported as fund balance. The following are the District's major and non-major governmental funds:
Major Governmental Funds
General Fund The General Fund is the chief operating fund for all districts. It is used to account for the ordinary operations of the District. All transactions except those accounted for in another fund are accounted for in this fund.
One fund currently defined as a special revenue fund in the California State Accounting Manual (CSAM) does not meet the GASB Statement No. 54 special revenue fund definition. Specifically, Fund 20, Special Reserve Fund for Postemployment Benefits, is not substantially composed of restricted or committed revenue sources. While these funds are authorized by statute and will remain open for internal reporting purposes, this fund functions effectively as an extension of the General Fund, and accordingly has been combined with the General Fund for presentation in these audited financial statements.
As a result, the General Fund reflects an increase in assets, liabilities, fund balance, and revenues of $2,180,862, $112, $2,180,750, and $25,679, respectively.
Building Fund The Building Fund exists primarily to account separately for proceeds from sale of bonds (Education Code Section 15146) and may not be used for any purposes other than those for which the bonds were issued.
Bond Interest and Redemption Fund The Bond Interest and Redemption Fund is used for the repayment of bonds issued for a District (Education Code Sections 15125-15262).
Non-Major Governmental Funds
Special Revenue Funds The Special Revenue funds are used to account for the proceeds from specific revenue sources (other than trusts, major capital projects, or debt service) that are restricted or committed to the financing of particular activities, that compose a substantial portion of the inflows of the fund and that are reasonably expected to continue. Additional resources that are restricted, committed, or assigned to the purpose of the fund may also be reported in the fund.
Child Development Fund The Child Development Fund is used to account separately for Federal, State, and local revenues to operate child development programs and is to be used only for expenditures for the operation of child development programs.
Cafeteria Fund The Cafeteria Fund is used to account separately for Federal, State, and local resources to operate the food service program (Education Code Sections 38090-38093) and is used only for those expenditures authorized by the governing board as necessary for the operation of the District's food service program (Education Code Sections 38091 and 38100).
HUNTINGTON BEACH CITY SCHOOL DISTRICT
NOTES TO FINANCIAL STATEMENTS JUNE 30, 2018
25
Deferred Maintenance Fund The Deferred Maintenance Fund is used to account separately for revenues that are restricted or committed for deferred maintenance purposes (Education Code Section 17582).
Capital Project Funds The Capital Project funds are used to account for financial resources to be used for the acquisition or construction of major capital facilities and other capital assets (other than those financed by proprietary funds and trust funds).
Capital Facilities Fund The Capital Facilities Fund is used primarily to account separately for monies received from fees levied on developers or other agencies as a condition of approval (Education Code Sections 17620-17626 and Government Code Section 65995 et seq.). Expenditures are restricted to the purposes specified in Government Code Sections 65970-65981 or to the items specified in agreements with the developer (Government Code Section 66006).
Special Reserve Fund for Capital Outlay Projects The Special Reserve Fund for Capital Outlay Projects exists primarily to provide for the accumulation of General Fund monies for capital outlay purpose (Education Code Section 42840).
COP Capital Projects Fund The COP Capital Projects Fund is used to account for capital projects financed by Certificates of Participation.
Debt Service Funds The Debt Service funds are used to account for the accumulation of resources for, and the payment of, principal and interest on general long-term obligations.
COP Debt Service Fund The COP Debt Service Fund is used to account for the interest and redemption of
principal of Certificates of Participation.
Fiduciary Funds Fiduciary funds are used to account for assets held in trustee or agent capacity for others that cannot be used to support the District's own programs. The fiduciary fund category is split into four classifications: pension trust funds, investment trust funds, private-purpose trust funds, and agency funds. The key distinction between trust and agency funds is that trust funds are subject to a trust agreement that affects the degree of management involvement and the length of time that the resources are held.
Trust funds are used to account for the assets held by the District under a trust agreement for individuals, private organizations, or other governments and are therefore, not available to support the District's own programs. The District reports no trust funds. Agency funds are custodial in nature (assets equal liabilities) and do not involve measurement of results of operations. The District's agency fund accounts for student body activities (ASB).
Basis of Accounting - Measurement Focus
Government-Wide Financial Statements The government-wide financial statements are prepared using the economic resources measurement focus and the accrual basis of accounting. This is the same approach used in the preparation of the proprietary fund financial statements, but differs from the manner in which governmental fund financial statements are prepared.
HUNTINGTON BEACH CITY SCHOOL DISTRICT
NOTES TO FINANCIAL STATEMENTS JUNE 30, 2018
26
The government-wide financial Statement of Activities presents a comparison between expenses, both direct and indirect, and program revenues of the District and for each governmental function, and excludes fiduciary activity. Direct expenses are those that are specifically associated with a service, program, or department and are therefore clearly identifiable to a particular function. The District does not allocate indirect expenses to functions in the statement of Activities, except for depreciation. Program revenues include charges paid by the recipients of the goods or services offered by the programs and grants and contributions that are restricted to meeting the operational or capital requirements of a particular program. Revenues that are not classified as program revenues are presented as general revenues. The comparison of program revenues and expenses identifies the extent to which each program is self-financing or draws from the general revenues of the District. Eliminations have been made to minimize the double counting of internal activities.
Net position should be reported as restricted when constraints placed on net position are either externally imposed by creditors (such as through debt covenants), grantors, contributors, or laws or regulations of other governments or imposed by law through constitutional provisions or enabling legislation. The net position restricted for other activities result from special revenue funds and the restrictions on their use.
Fund Financial Statements Fund financial statements report detailed information about the District. The focus of governmental and enterprise fund financial statements is on major funds rather than reporting funds by type. Each major fund is presented in a separate column. Non-major funds are aggregated and presented in a single column.
Governmental Funds All governmental funds are accounted for using a flow of current financial resources measurement focus and the modified accrual basis of accounting. With this measurement focus, only current assets and current liabilities generally are included on the balance sheet. The statement of revenues, expenditures, and changes in fund balances reports on the sources (revenues and other financing sources) and uses (expenditures and other financing uses) of current financial resources. This approach differs from the manner in which the governmental activities of the government-wide financial statements are prepared. Governmental fund financial statements therefore include reconciliation with brief explanations to better identify the relationship between the government-wide financial statements, prepared using the economic resources measurement focus and the accrual basis of accounting, and the governmental fund financial statements, prepared using the flow of current financial resources measurement focus and the modified accrual basis of accounting.
Fiduciary Funds Fiduciary funds are accounted for using the flow of economic resources measurement focus and the accrual basis of accounting. The Fiduciary funds are excluded from the government-wide financial statements because they do not represent resources of the District.
Revenues - Exchange and Non-Exchange Transactions Revenue resulting from exchange transactions, in which each party gives and receives essentially equal value is recorded on the accrual basis when the exchange takes place. On a modified accrual basis, revenue is recorded in the fiscal year in which the resources are measurable and become available. Available means that the resources will be collected within the current fiscal year or are expected to be collected soon enough thereafter to be used to pay liabilities of the current fiscal year. Generally, available is defined as collectible within 45 or 60 days. However, to achieve comparability of reporting among California districts and so as not to distort normal revenue patterns, with specific respect to reimbursement grants and corrections to State-aid apportionments, the California Department of Education has defined available for districts as collectible within one year. The following revenue sources are considered to be both measurable and available at fiscal year-end: State apportionments, interest, certain grants, and other local sources.
HUNTINGTON BEACH CITY SCHOOL DISTRICT
NOTES TO FINANCIAL STATEMENTS JUNE 30, 2018
27
Non-exchange transactions, in which the District receives value without directly giving equal value in return, include property taxes, certain grants, entitlements, and donations. Revenue from property taxes is recognized in the fiscal year in which the taxes are received. Revenue from certain grants, entitlements, and donations is recognized in the fiscal year in which all eligibility requirements have been satisfied. Eligibility requirements include time and purpose requirements. On a modified accrual basis, revenue from non-exchange transactions must also be available before it can be recognized.
Unearned Revenue Unearned revenue arises when potential revenue does not meet both the "measurable" and "available" criteria for recognition in the current period or when resources are received by the District prior to the incurrence of qualifying expenditures. In subsequent periods, when both revenue recognition criteria are met, or when the District has a legal claim to the resources, the liability for unearned revenue is removed from the combined balance sheet and revenue is recognized.
Certain grants received before the eligibility requirements are met are recorded as unearned revenue. On the governmental fund financial statements, receivables that will not be collected within the available period are also recorded as unearned revenue.
Expenses/Expenditures On the accrual basis of accounting, expenses are recognized at the time they are incurred. The measurement focus of governmental fund accounting is on decreases in net financial resources (expenditures) rather than expenses. Expenditures are generally recognized in the accounting period in which the related fund liability is incurred, if measurable, and typically paid within 90 days. Principal and interest on long-term obligations, which has not matured, are recognized when paid in the governmental funds as expenditures. Allocations of costs, such as depreciation and amortization, are not recognized in the governmental funds but are recognized in the entity-wide statements.
Investments
Investments held at June 30, 2018, with original maturities greater than one year are stated at fair value. Fair value is estimated based on quoted market prices at year-end. All investments not required to be reported at fair value are stated at cost or amortized cost. Fair values of investments in the county investment pool are determined by the program sponsor.
Prepaid Expenditures (Expenses)
Prepaid expenditures (expenses) represent amounts paid in advance of receiving goods or services. The District reports the expenditures when paid.
Stores Inventories
Inventories consist of expendable food and supplies held for consumption. Inventories are stated at cost on the weighted average basis. The costs of inventory items are recorded as expenditures in the governmental funds.
Capital Assets and Depreciation
The accounting and reporting treatment applied to the capital assets associated with a fund are determined by its measurement focus. General capital assets are long-lived assets of the District. The District maintains a capitalization threshold of $5,000. The District does not possess any infrastructure. Improvements are capitalized; the costs of normal maintenance and repairs that do not add to the value of the asset or materially extend an asset's life are not capitalized, but are expensed as incurred.
HUNTINGTON BEACH CITY SCHOOL DISTRICT
NOTES TO FINANCIAL STATEMENTS JUNE 30, 2018
28
When purchased, such assets are recorded as expenditures in the governmental funds and capitalized in the government-wide financial statements of Net Position. The valuation basis for general capital assets are historical cost, or where historical cost is not available, estimated historical cost based on replacement cost. Donated capital assets are capitalized at estimated fair market value on the date donated.
Depreciation of capital assets is computed and recorded by the straight-line method. Estimated useful lives of the various classes of depreciable capital assets are as follows: buildings, 20 to 50 years; improvements, 5 to 50 years; equipment, 2 to 15 years.
Interfund Balances
On fund financial statements, receivables and payables resulting from short-term interfund loans are classified as "interfund receivables/payables". These amounts are eliminated in the governmental activities of the Statement of Net Position.
Compensated Absences
Compensated absences are accrued as a liability as the benefits are earned. The entire compensated absence liability is reported on the government-wide Statement of Net Position. For governmental funds, the current portion of unpaid compensated absences is recognized upon the occurrence of relevant events such as employee resignations and retirements that occur prior to year-end that have not yet been paid with expendable available financial resources. These amounts are reported in the fund from which the employees who have accumulated leave are paid.
Sick leave is accumulated without limit for each employee at the rate of one day for each month worked. Leave with pay is provided when employees are absent for health reasons; however, the employees do not gain a vested right to accumulated sick leave. Employees are never paid for any sick leave balance at termination of employment or any other time. Therefore, the value of accumulated sick leave is not recognized as a liability in the District's financial statements. However, credit for unused sick leave is applicable to all classified school members who retire after January 1, 1999. At retirement, each member will receive .004 year of service credit for each day of unused sick leave. Credit for unused sick leave is applicable to all certificated employees and is determined by dividing the number of unused sick days by the number of base service days required to complete the last school year, if employed full-time.
Accrued Liabilities and Long-Term Obligations
All payables, accrued liabilities, and long-term obligations are reported in the government-wide fund financial statements. In general, governmental fund payables and accrued liabilities that, once incurred, are paid in a timely manner and in full from current financial resources are reported as obligations of the funds.
However, claims and judgments, compensated absences, special termination benefits, and contractually required pension contributions that will be paid from governmental funds are reported as a liability in the fund financial statements only to the extent that they are due for payment during the current year. Bonds, capital leases, and long-term loans are recognized as a liability on the fund financial statements when due.
HUNTINGTON BEACH CITY SCHOOL DISTRICT
NOTES TO FINANCIAL STATEMENTS JUNE 30, 2018
29
Debt Issuance Costs, Premiums, and Discounts
In the government-wide financial statements, long-term obligations are reported as liabilities in the applicable governmental activities Statement of Net Position. Debt premiums and discounts, as well as issuance costs related to prepaid insurance costs are amortized over the life of the bonds using the straight-line method.
In governmental fund financial statements, bond premiums and discounts, as well as debt issuance costs are recognized in the current period. The face amount of the debt is reported as other financing sources. Premiums received on debt issuance are also reported as other financing sources. Issuance costs, whether or not withheld from the actual debt proceeds, are reported as debt services expenditures.
Deferred Outflows/Inflows of Resources
In addition to assets, the statement of net position also reports deferred outflows of resources. This separate financial statement element represents a consumption of net position that applies to a future period and so will not be recognized as an expense or expenditure until then. The District reports deferred outflows of resources for deferred charges on refunding of debt, for pension related items, and for OPEB related items.
In addition to liabilities, the statement of net position reports a separate section for deferred inflows of resources. This separate financial statement element represents an acquisition of net position that applies to a future period and so will not be recognized as revenue until then. The District reports deferred inflows of resources for pension related items.
Pensions
For purposes of measuring the net pension liability and deferred outflows/inflows of resources related to pensions, and pension expense, information about the fiduciary net position of the California State Teachers Retirement System (CalSTRS) and the California Public Employees' Retirement System (CalPERS) plan for schools (Plans) and additions to/deductions from the Plans' fiduciary net position have been determined on the same basis as they are reported by CalSTRS and CalPERS. For this purpose, benefit payments (including refunds of employee contributions) are recognized when due and payable in accordance with the benefit terms. Member contributions are recognized in the period in which they are earned. Investments are reported at fair value.
Postemployment Benefits Other Than Pensions (OPEB)
For purposes of measuring the aggregate net OPEB liability, deferred outflows of resources and deferred inflows of resources related to OPEB, and OPEB expense, information about the fiduciary net position of the CalSTRS Medicare Premium Payment (MPP) Program and additions to/deductions from the MPP's fiduciary net position have been deter-mined on the same basis as they are reported by the MPP. For this purpose, the MPP recognizes benefit payments when due and payable in accordance with the benefit terms. Investments are reported at fair value, except for money market investments and participating interest-earning investment contracts that have a maturity at the time of purchase of one year or less, which are reported at cost.
HUNTINGTON BEACH CITY SCHOOL DISTRICT
NOTES TO FINANCIAL STATEMENTS JUNE 30, 2018
30
Fund Balances - Governmental Funds
As of June 30, 2018, fund balances of the governmental funds are classified as follows:
Nonspendable - amounts that cannot be spent either because they are in nonspendable form or because they are legally or contractually required to be maintained intact.
Restricted - amounts that can be spent only for specific purposes because of constitutional provisions or enabling legislation or because of constraints that are externally imposed by creditors, grantors, contributors, or the laws or regulations of other governments.
Committed - amounts that can be used only for specific purposes determined by a formal action of the governing board. The governing board is the highest level of decision-making authority for the District. Commitments may be established, modified, or rescinded only through resolutions or other action as approved by the governing board. The District currently does not have any committed funds.
Assigned - amounts that do not meet the criteria to be classified as restricted or committed but that are intended to be used for specific purposes. Under the District's adopted policy, only the governing board or chief business officer/assistant superintendent of business services may assign amounts for specific purposes.
Unassigned - all other spendable amounts.
Spending Order Policy
When an expenditure is incurred for purposes for which both restricted and unrestricted fund balance is available, the District considers restricted funds to have been spent first. When an expenditure is incurred for which committed, assigned, or unassigned fund balances are available, the District considers amounts to have been spent first out of committed funds, then assigned funds, and finally unassigned funds, as needed, unless the governing board has provided otherwise in its commitment or assignment actions.
Minimum Fund Balance Policy
The governing board adopted a minimum fund balance policy for the General Fund in order to protect the District against revenue shortfalls or unpredicted one-time expenditures. The policy requires a Reserve for Economic Uncertainties consisting of unassigned amounts equal to no less than three percent of General Fund expenditures and other financing uses.
Net Position
Net position represents the difference between assets and liabilities. Net position net of investment in capital assets consists of capital assets, net of accumulated depreciation, reduced by the outstanding balances of any borrowings used for the acquisition, construction, or improvement of those assets. Net position is reported as restricted when there are limitations imposed on their use either through the enabling legislation adopted by the District or through external restrictions imposed by creditors, grantors, or laws or regulations of other governments. The District applies restricted resources when an expense is incurred for purposes for which both restricted and unrestricted net position is available. The government-wide financial statements report $12,091,319 of restricted net position, restricted due to enabling legislation.
HUNTINGTON BEACH CITY SCHOOL DISTRICT
NOTES TO FINANCIAL STATEMENTS JUNE 30, 2018
31
Interfund Activity
Exchange transactions between funds are reported as revenues in the seller funds and as expenditures/expenses in the purchaser funds. Flows of cash or goods from one fund to another without a requirement for repayment are reported as interfund transfers. Interfund transfers are reported as other financing sources/uses in governmental funds. Repayments from funds responsible for particular expenditures/expenses to the funds that initially paid for them are not presented on the financial statements. Interfund transfers are eliminated in the governmental columns of the Statement of Activities.
Estimates
The preparation of the financial statements in conformity with accounting principles generally accepted in the United States of America requires management to make estimates and assumptions that affect the amounts reported in the financial statements and accompanying notes. Actual results may differ from those estimates.
Property Tax
Secured property taxes attach as an enforceable lien on property as of January 1. Taxes are payable in two installments on November 1 and February 1 and become delinquent on December 10 and April 10, respectively. Unsecured property taxes are payable in one installment on or before August 31. The County of Orange bills and collects the taxes on behalf of the District. Local property tax revenues are recorded when received.
Change in Accounting Principles
In June 2015, the GASB issued Statement No. 75, Accounting and Financial Reporting for Postemployment Benefits Other Than Pensions. The primary objective of this Statement is to improve accounting and financial reporting by State and local governments for postemployment benefits other than pensions (other postemployment benefits or OPEB). It also improves information provided by State and local governmental employers about financial support for OPEB that is provided by other entities. This Statement results from a comprehensive review of the effectiveness of existing standards of accounting and financial reporting for all postemployment benefits (pensions and OPEB) with regard to providing decision-useful information, supporting assessments of accountability and inter-period equity, and creating additional transparency.
This Statement replaces the requirements of Statements No. 45, Accounting and Financial Reporting by Employers for Postemployment Benefits Other Than Pensions, as amended, and No. 57, OPEB Measurements by Agent Employers and Agent Multiple-Employer Plans, for OPEB. Statement No. 74, Financial Reporting for Postemployment Benefit Plans Other Than Pension Plans, establishes new accounting and financial reporting requirements for OPEB plans.
The District has implemented the provisions of this Statement as of June 30, 2018.
HUNTINGTON BEACH CITY SCHOOL DISTRICT
NOTES TO FINANCIAL STATEMENTS JUNE 30, 2018
32
In March 2017, the GASB issued Statement No. 85, Omnibus 2017. The objective of this statement is to address practice issues that have been identified during implementation and application of certain GASB Statements. This Statement addresses a variety of topics including issues related to blending component units, goodwill, fair value measurement and application, and postemployment benefits (pensions and other postemployment benefits [OPEB]). Specifically, this Statement addresses the following topics:
• Blending a component unit in circumstances in which the primary government is a business-type activity that reports in a single column for financial statement presentation;
• Reporting amounts previously reported as goodwill and "negative" goodwill;
• Classifying real estate held by insurance entities;
• Measuring certain money market investments and participating interest-earning investment contracts at amortized cost;
• Timing of the measurement of pension or OPEB liabilities and expenditures recognized in financial statements prepared using the current financial resources measurement focus;
• Recognizing on behalf payments for pensions or OPEB in employer financial statements;
• Presenting payroll-related measures in required supplementary information for purposes of reporting by OPEB plans and employers that provide OPEB;
• Classifying employer-paid member contributions for OPEB;
• Simplifying certain aspects of the alternative measurement method for OPEB; and
• Accounting and financial reporting for OPEB provided through certain multiple-employer defined benefit OPEB plans.
The District has implemented the provisions of this Statement as of June 30, 2018.
In May 2017, the GASB issued Statement No. 86, Certain Debt Extinguishment Issues. The primary objective of this Statement is to improve consistency in accounting and financial reporting for in-substance defeasance of debt by providing guidance for transactions in which cash and other monetary assets acquired with only existing resources—resources other than the proceeds of refunding debt—are placed in an irrevocable trust for the sole purpose of extinguishing debt. This Statement also improves accounting and financial reporting for prepaid insurance on debt that is extinguished and notes to financial statements for debt that is defeased in substance.
The District has implemented the provisions of this Statement as of June 30, 2018.
New Accounting Pronouncements
In November 2016, the GASB issued Statement No. 83, Certain Asset Retirement Obligations. This Statement addresses accounting and financial reporting for certain asset retirement obligations (AROs). An ARO is a legally enforceable liability associated with the retirement of a tangible capital asset. A government that has legal obligations to perform future asset retirement activities related to its tangible capital assets should recognize a liability based on the guidance in this Statement.
HUNTINGTON BEACH CITY SCHOOL DISTRICT
NOTES TO FINANCIAL STATEMENTS JUNE 30, 2018
33
This Statement establishes criteria for determining the timing and pattern of recognition of a liability and a corresponding deferred outflow of resources for AROs. This Statement requires that recognition occur when the liability is both incurred and reasonably estimable. The determination of when the liability is incurred should be based on the occurrence of external laws, regulations, contracts, or court judgments, together with the occurrence of an internal event that obligates a government to perform asset retirement activities. Laws and regulations may require governments to take specific actions to retire certain tangible capital assets at the end of the useful lives of those capital assets, such as decommissioning nuclear reactors and dismantling and removing sewage treatment plants. Other obligations to retire tangible capital assets may arise from contracts or court judgments. Internal obligating events include the occurrence of contamination, placing into operation a tangible capital asset that is required to be retired, abandoning a tangible capital asset before it is placed into operation, or acquiring a tangible capital asset that has an existing ARO.
The requirements of this Statement are effective for reporting periods beginning after June 15, 2018. Early implementation is encouraged.
In January 2017, the GASB issued Statement No. 84, Fiduciary Activities. The objective of this Statement is to improve guidance regarding the identification of fiduciary activities for accounting and financial reporting purposes and how those activities should be reported.
This Statement establishes criteria for identifying fiduciary activities of all State and local governments. The focus of the criteria generally is on (1) whether a government is controlling the assets of the fiduciary activity and (2) the beneficiaries with whom a fiduciary relationship exists. Separate criteria are included to identify fiduciary component units and postemployment benefit arrangements that are fiduciary activities.
The requirements of this Statement are effective for reporting periods beginning after December 15, 2018. Early implementation is encouraged.
In June 2017, the GASB issued Statement No. 87, Leases. The objective of this Statement is to better meet the information needs of financial statement users by improving accounting and financial reporting for leases by governments. This Statement increases the usefulness of governments' financial statements by requiring recognition of certain lease assets and liabilities for leases that previously were classified as operating leases and recognized as inflows of resources or outflows of resources based on the payment provisions of the contract. It establishes a single model for lease accounting based on the foundational principle that leases are financings of the right to use an underlying asset. Under this Statement, a lessee is required to recognize a lease liability and an intangible right-to-use lease asset, and a lessor is required to recognize a lease receivable and a deferred inflow of resources, thereby enhancing the relevance and consistency of information about governments' leasing activities.
The requirements of this Statement are effective for the reporting periods beginning after December 15, 2019. Early implementation is encouraged.
In April 2018, the GASB issued Statement No. 88, Certain Disclosures Related to Debt, including Direct Borrowings and Direct Placements. The primary objective of this Statement is to improve the information that is disclosed in notes to government financial statements related to debt, including direct borrowings and direct placements. It also clarifies which liabilities governments should include when disclosing information related to debt.
HUNTINGTON BEACH CITY SCHOOL DISTRICT
NOTES TO FINANCIAL STATEMENTS JUNE 30, 2018
34
This Statement defines debt for purposes of disclosure in notes to financial statements as a liability that arises from a contractual obligation to pay cash (or other assets that may be used in lieu of cash) in one or more payments to settle an amount that is fixed at the date the contractual obligation is established.
This Statement requires that additional essential information related to debt be disclosed in notes to financial statements, including unused lines of credit; assets pledged as collateral for the debt; and terms specified in debt agreements related to significant events of default with finance-related consequences, significant termination events with finance-related consequences, and significant subjective acceleration clauses.
For notes to financial statements related to debt, this Statement also requires that existing and additional information be provided for direct borrowings and direct placements of debt separately from other debt.
The requirements of this Statement are effective for reporting periods beginning after June 15, 2018. Early implementation is encouraged.
In June 2018, the GASB issued Statement No. 89, Accounting for Interest Cost Incurred Before the End of a Construction Period. The objectives of this Statement are (1) to enhance the relevance and comparability of information about capital assets and the cost of borrowing for a reporting period and (2) to simplify accounting for interest cost incurred before the end of a construction period.
This Statement establishes accounting requirements for interest cost incurred before the end of a construction period. Such interest cost includes all interest that previously was accounted for in accordance with the requirements of paragraphs 5–22 of Statement No. 62, Codification of Accounting and Financial Reporting Guidance Contained in Pre-November 30, 1989 FASB and AICPA Pronouncements, which are superseded by this Statement. This Statement requires that interest cost incurred before the end of a construction period be recognized as an expense in the period in which the cost is incurred for financial statements prepared using the economic resources measurement focus. As a result, interest cost incurred before the end of a construction period will not be included in the historical cost of a capital asset reported in a business-type activity or enterprise fund.
This Statement also reiterates that in financial statements prepared using the current financial resources measurement focus, interest cost incurred before the end of a construction period should be recognized as an expenditure on a basis consistent with governmental fund accounting principles.
The requirements of this Statement are effective for reporting periods beginning after December 15, 2019. Earlier application is encouraged. The requirements of this Statement should be applied prospectively.
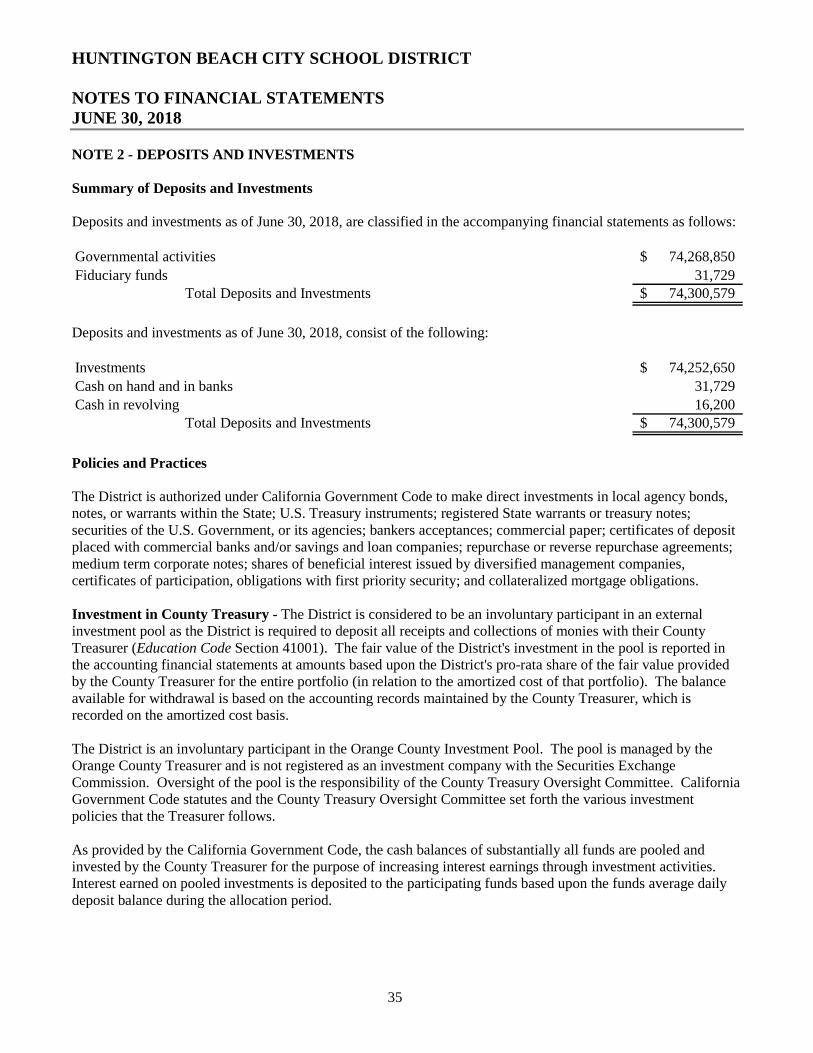
HUNTINGTON BEACH CITY SCHOOL DISTRICT
NOTES TO FINANCIAL STATEMENTS JUNE 30, 2018
35
NOTE 2 - DEPOSITS AND INVESTMENTS
Summary of Deposits and Investments
Deposits and investments as of June 30, 2018, are classified in the accompanying financial statements as follows:
Governmental activities 74,268,850$
Fiduciary funds 31,729Total Deposits and Investments 74,300,579$
Deposits and investments as of June 30, 2018, consist of the following:
Investments 74,252,650$
Cash on hand and in banks 31,729
Cash in revolving 16,200Total Deposits and Investments 74,300,579$
Policies and Practices
The District is authorized under California Government Code to make direct investments in local agency bonds, notes, or warrants within the State; U.S. Treasury instruments; registered State warrants or treasury notes; securities of the U.S. Government, or its agencies; bankers acceptances; commercial paper; certificates of deposit placed with commercial banks and/or savings and loan companies; repurchase or reverse repurchase agreements; medium term corporate notes; shares of beneficial interest issued by diversified management companies, certificates of participation, obligations with first priority security; and collateralized mortgage obligations.
Investment in County Treasury - The District is considered to be an involuntary participant in an external investment pool as the District is required to deposit all receipts and collections of monies with their County Treasurer (Education Code Section 41001). The fair value of the District's investment in the pool is reported in the accounting financial statements at amounts based upon the District's pro-rata share of the fair value provided by the County Treasurer for the entire portfolio (in relation to the amortized cost of that portfolio). The balance available for withdrawal is based on the accounting records maintained by the County Treasurer, which is recorded on the amortized cost basis.
The District is an involuntary participant in the Orange County Investment Pool. The pool is managed by the Orange County Treasurer and is not registered as an investment company with the Securities Exchange Commission. Oversight of the pool is the responsibility of the County Treasury Oversight Committee. California Government Code statutes and the County Treasury Oversight Committee set forth the various investment policies that the Treasurer follows.
As provided by the California Government Code, the cash balances of substantially all funds are pooled and invested by the County Treasurer for the purpose of increasing interest earnings through investment activities. Interest earned on pooled investments is deposited to the participating funds based upon the funds average daily deposit balance during the allocation period.
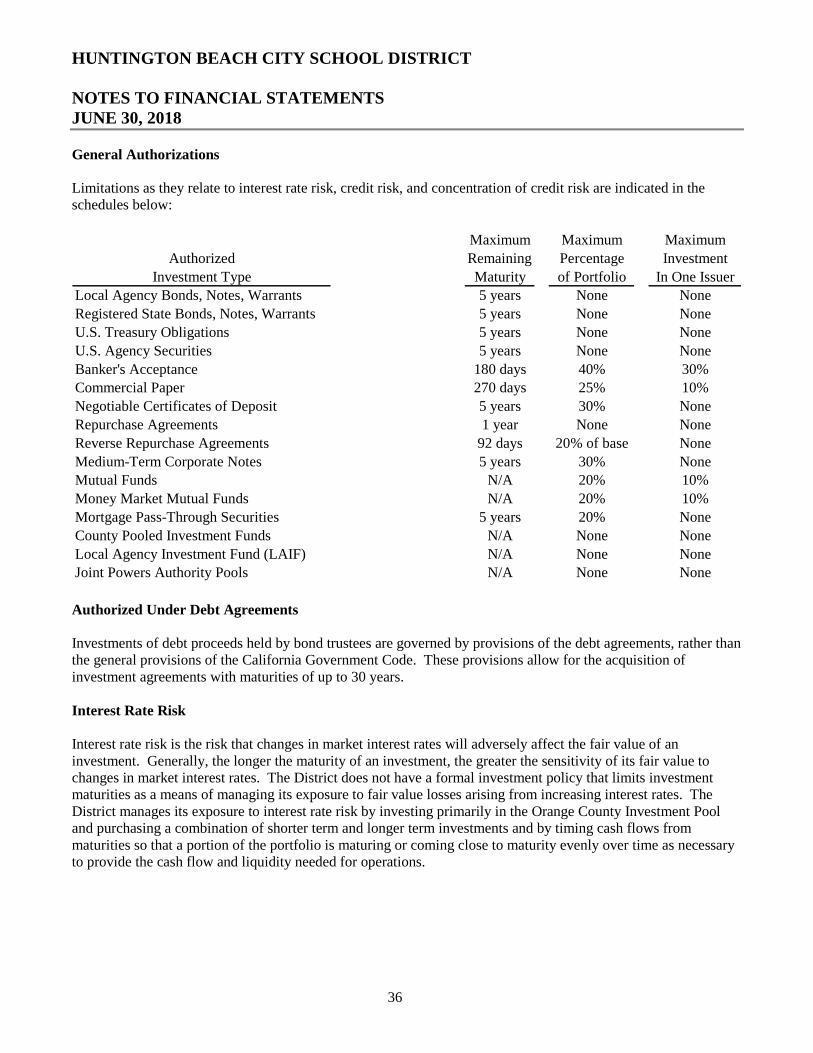
HUNTINGTON BEACH CITY SCHOOL DISTRICT
NOTES TO FINANCIAL STATEMENTS JUNE 30, 2018
36
General Authorizations
Limitations as they relate to interest rate risk, credit risk, and concentration of credit risk are indicated in the schedules below:
Maximum Maximum Maximum
Authorized Remaining Percentage Investment
Investment Type Maturity of Portfolio In One Issuer
Local Agency Bonds, Notes, Warrants 5 years None None
Registered State Bonds, Notes, Warrants 5 years None None
U.S. Treasury Obligations 5 years None None
U.S. Agency Securities 5 years None None
Banker's Acceptance 180 days 40% 30%
Commercial Paper 270 days 25% 10%
Negotiable Certificates of Deposit 5 years 30% None
Repurchase Agreements 1 year None None
Reverse Repurchase Agreements 92 days 20% of base None
Medium-Term Corporate Notes 5 years 30% None
Mutual Funds N/A 20% 10%
Money Market Mutual Funds N/A 20% 10%
Mortgage Pass-Through Securities 5 years 20% None
County Pooled Investment Funds N/A None None
Local Agency Investment Fund (LAIF) N/A None None
Joint Powers Authority Pools N/A None None
Authorized Under Debt Agreements
Investments of debt proceeds held by bond trustees are governed by provisions of the debt agreements, rather than the general provisions of the California Government Code. These provisions allow for the acquisition of investment agreements with maturities of up to 30 years.
Interest Rate Risk
Interest rate risk is the risk that changes in market interest rates will adversely affect the fair value of an investment. Generally, the longer the maturity of an investment, the greater the sensitivity of its fair value to changes in market interest rates. The District does not have a formal investment policy that limits investment maturities as a means of managing its exposure to fair value losses arising from increasing interest rates. The District manages its exposure to interest rate risk by investing primarily in the Orange County Investment Pool and purchasing a combination of shorter term and longer term investments and by timing cash flows from maturities so that a portion of the portfolio is maturing or coming close to maturity evenly over time as necessary to provide the cash flow and liquidity needed for operations.
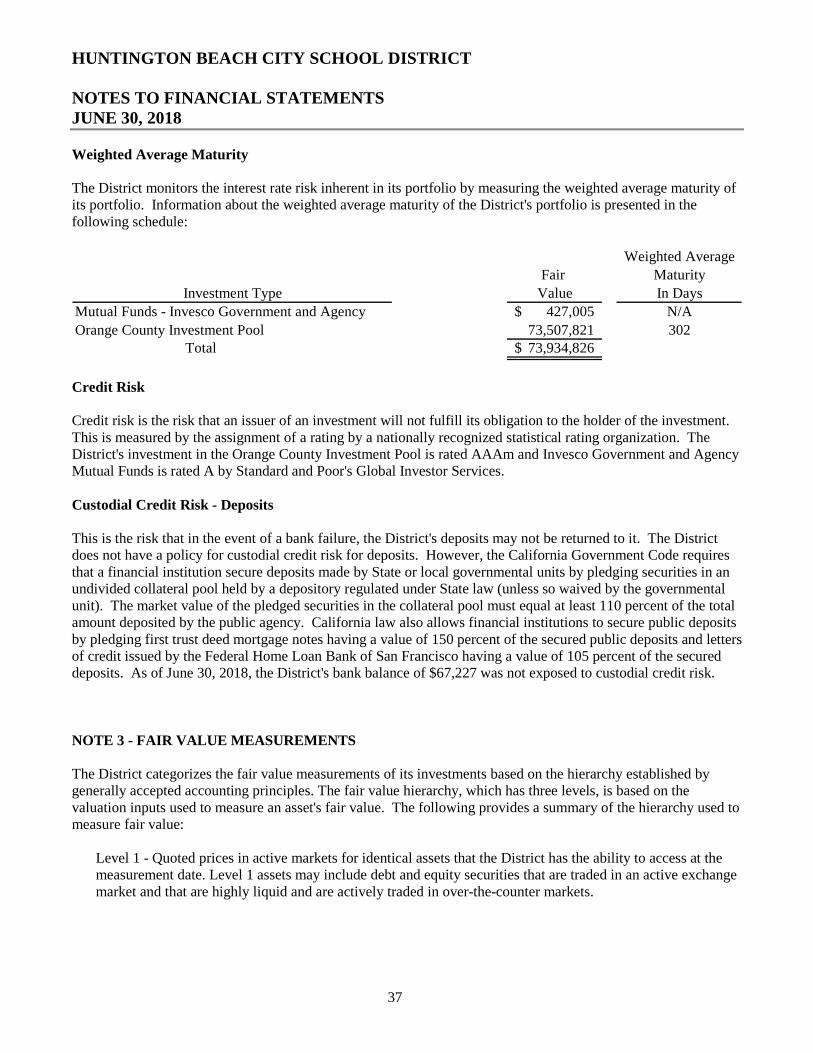
HUNTINGTON BEACH CITY SCHOOL DISTRICT
NOTES TO FINANCIAL STATEMENTS JUNE 30, 2018
37
Weighted Average Maturity
The District monitors the interest rate risk inherent in its portfolio by measuring the weighted average maturity of its portfolio. Information about the weighted average maturity of the District's portfolio is presented in the following schedule:
Weighted Average
Fair Maturity
Investment Type Value In Days
Mutual Funds - Invesco Government and Agency 427,005$ N/A
Orange County Investment Pool 73,507,821 302Total 73,934,826$
Credit Risk
Credit risk is the risk that an issuer of an investment will not fulfill its obligation to the holder of the investment. This is measured by the assignment of a rating by a nationally recognized statistical rating organization. The District's investment in the Orange County Investment Pool is rated AAAm and Invesco Government and Agency Mutual Funds is rated A by Standard and Poor's Global Investor Services.
Custodial Credit Risk - Deposits
This is the risk that in the event of a bank failure, the District's deposits may not be returned to it. The District does not have a policy for custodial credit risk for deposits. However, the California Government Code requires that a financial institution secure deposits made by State or local governmental units by pledging securities in an undivided collateral pool held by a depository regulated under State law (unless so waived by the governmental unit). The market value of the pledged securities in the collateral pool must equal at least 110 percent of the total amount deposited by the public agency. California law also allows financial institutions to secure public deposits by pledging first trust deed mortgage notes having a value of 150 percent of the secured public deposits and letters of credit issued by the Federal Home Loan Bank of San Francisco having a value of 105 percent of the secured deposits. As of June 30, 2018, the District's bank balance of $67,227 was not exposed to custodial credit risk.
NOTE 3 - FAIR VALUE MEASUREMENTS
The District categorizes the fair value measurements of its investments based on the hierarchy established by generally accepted accounting principles. The fair value hierarchy, which has three levels, is based on the valuation inputs used to measure an asset's fair value. The following provides a summary of the hierarchy used to measure fair value:
Level 1 - Quoted prices in active markets for identical assets that the District has the ability to access at the measurement date. Level 1 assets may include debt and equity securities that are traded in an active exchange market and that are highly liquid and are actively traded in over-the-counter markets.
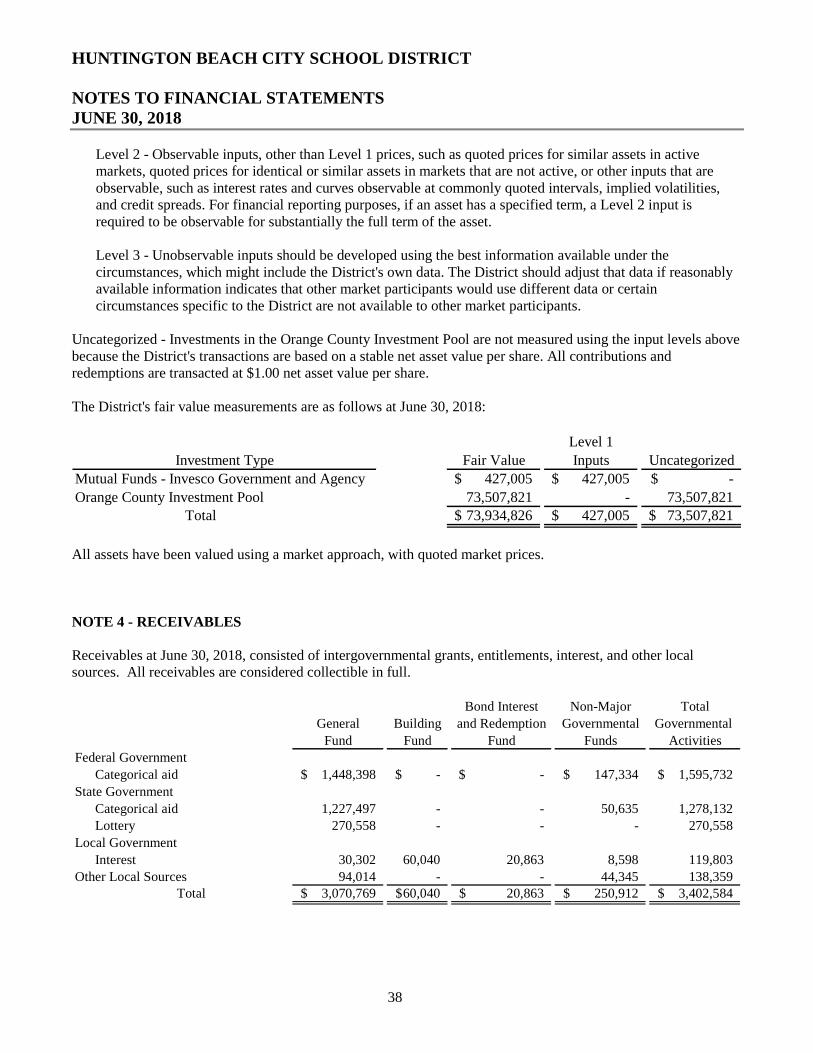
HUNTINGTON BEACH CITY SCHOOL DISTRICT
NOTES TO FINANCIAL STATEMENTS JUNE 30, 2018
38
Level 2 - Observable inputs, other than Level 1 prices, such as quoted prices for similar assets in active markets, quoted prices for identical or similar assets in markets that are not active, or other inputs that are observable, such as interest rates and curves observable at commonly quoted intervals, implied volatilities, and credit spreads. For financial reporting purposes, if an asset has a specified term, a Level 2 input is required to be observable for substantially the full term of the asset.
Level 3 - Unobservable inputs should be developed using the best information available under the circumstances, which might include the District's own data. The District should adjust that data if reasonably available information indicates that other market participants would use different data or certain circumstances specific to the District are not available to other market participants.
Uncategorized - Investments in the Orange County Investment Pool are not measured using the input levels above because the District's transactions are based on a stable net asset value per share. All contributions and redemptions are transacted at $1.00 net asset value per share.
The District's fair value measurements are as follows at June 30, 2018:
Level 1
Investment Type Fair Value Inputs Uncategorized
Mutual Funds - Invesco Government and Agency 427,005$ 427,005$ -$
Orange County Investment Pool 73,507,821 - 73,507,821Total 73,934,826$ 427,005$ 73,507,821$
All assets have been valued using a market approach, with quoted market prices.
NOTE 4 - RECEIVABLES
Receivables at June 30, 2018, consisted of intergovernmental grants, entitlements, interest, and other local sources. All receivables are considered collectible in full.
Bond Interest Non-Major Total
General Building and Redemption Governmental Governmental
Fund Fund Fund Funds Activities
Federal Government
Categorical aid 1,448,398$ -$ -$ 147,334$ 1,595,732$
State Government
Categorical aid 1,227,497 - - 50,635 1,278,132
Lottery 270,558 - - - 270,558
Local Government
Interest 30,302 60,040 20,863 8,598 119,803
Other Local Sources 94,014 - - 44,345 138,3593,070,769$ 60,040$ 20,863$ 250,912$ 3,402,584$ Total
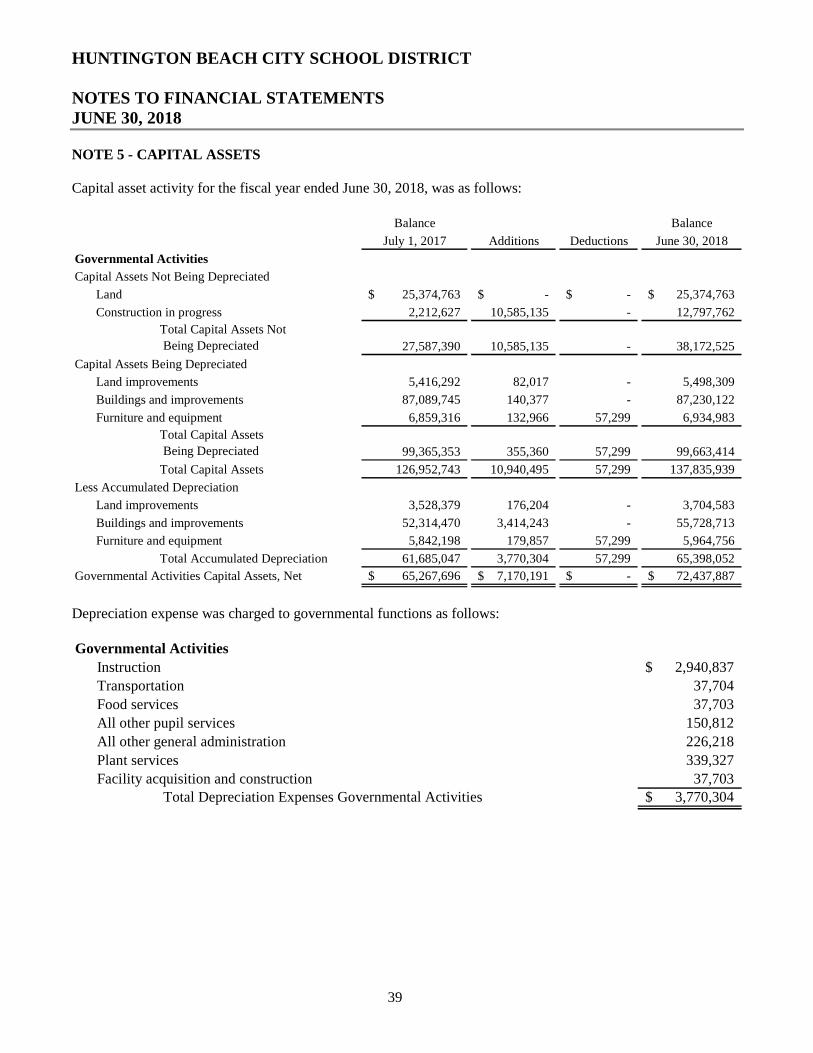
HUNTINGTON BEACH CITY SCHOOL DISTRICT
NOTES TO FINANCIAL STATEMENTS JUNE 30, 2018
39
NOTE 5 - CAPITAL ASSETS
Capital asset activity for the fiscal year ended June 30, 2018, was as follows:
Balance Balance
July 1, 2017 Additions Deductions June 30, 2018
Governmental Activities
Capital Assets Not Being Depreciated
Land 25,374,763$ -$ -$ 25,374,763$
Construction in progress 2,212,627 10,585,135 - 12,797,762
Total Capital Assets Not
Being Depreciated 27,587,390 10,585,135 - 38,172,525
Capital Assets Being Depreciated
Land improvements 5,416,292 82,017 - 5,498,309
Buildings and improvements 87,089,745 140,377 - 87,230,122
Furniture and equipment 6,859,316 132,966 57,299 6,934,983
Total Capital Assets
Being Depreciated 99,365,353 355,360 57,299 99,663,414
Total Capital Assets 126,952,743 10,940,495 57,299 137,835,939
Less Accumulated Depreciation
Land improvements 3,528,379 176,204 - 3,704,583
Buildings and improvements 52,314,470 3,414,243 - 55,728,713
Furniture and equipment 5,842,198 179,857 57,299 5,964,756
Total Accumulated Depreciation 61,685,047 3,770,304 57,299 65,398,052
Governmental Activities Capital Assets, Net 65,267,696$ 7,170,191$ -$ 72,437,887$
Depreciation expense was charged to governmental functions as follows:
Governmental Activities
Instruction 2,940,837$
Transportation 37,704
Food services 37,703
All other pupil services 150,812
All other general administration 226,218
Plant services 339,327
Facility acquisition and construction 37,703Total Depreciation Expenses Governmental Activities 3,770,304$
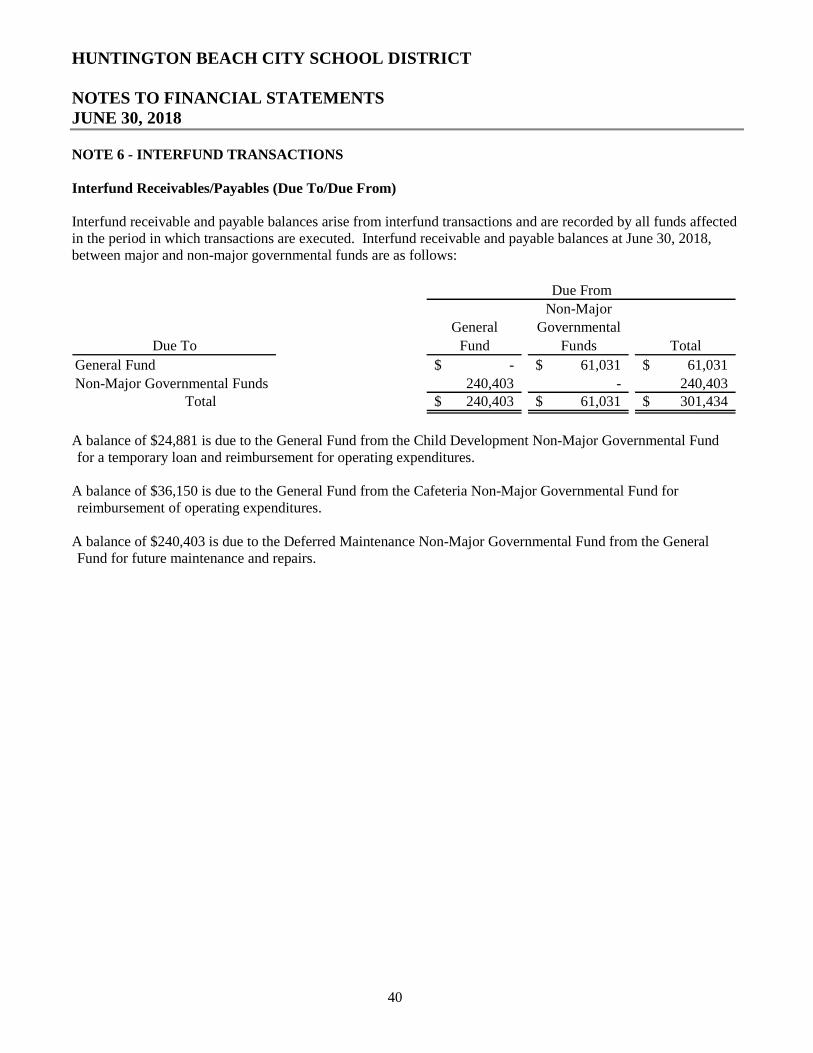
HUNTINGTON BEACH CITY SCHOOL DISTRICT
NOTES TO FINANCIAL STATEMENTS JUNE 30, 2018
40
NOTE 6 - INTERFUND TRANSACTIONS
Interfund Receivables/Payables (Due To/Due From)
Interfund receivable and payable balances arise from interfund transactions and are recorded by all funds affected in the period in which transactions are executed. Interfund receivable and payable balances at June 30, 2018, between major and non-major governmental funds are as follows:
Non-Major
General Governmental
Due To Fund Funds Total
General Fund -$ 61,031$ 61,031$
Non-Major Governmental Funds 240,403 - 240,403Total 240,403$ 61,031$ 301,434$
Due From
A balance of $24,881 is due to the General Fund from the Child Development Non-Major Governmental Fund for a temporary loan and reimbursement for operating expenditures.
A balance of $36,150 is due to the General Fund from the Cafeteria Non-Major Governmental Fund for reimbursement of operating expenditures.
A balance of $240,403 is due to the Deferred Maintenance Non-Major Governmental Fund from the General Fund for future maintenance and repairs.
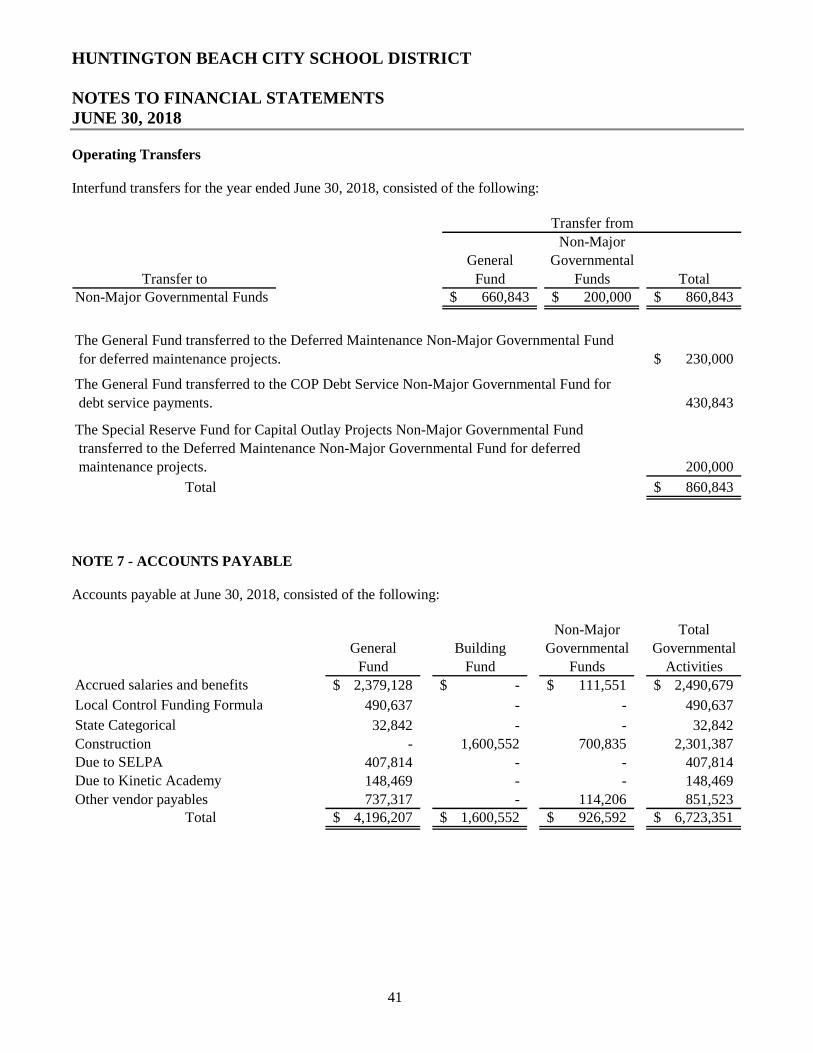
HUNTINGTON BEACH CITY SCHOOL DISTRICT
NOTES TO FINANCIAL STATEMENTS JUNE 30, 2018
41
Operating Transfers
Interfund transfers for the year ended June 30, 2018, consisted of the following:
Non-Major
General Governmental
Transfer to Fund Funds TotalNon-Major Governmental Funds 660,843$ 200,000$ 860,843$
230,000$
430,843
200,000
860,843$ Total
The Special Reserve Fund for Capital Outlay Projects Non-Major Governmental Fund
transferred to the Deferred Maintenance Non-Major Governmental Fund for deferred
maintenance projects.
Transfer from
The General Fund transferred to the Deferred Maintenance Non-Major Governmental Fund
for deferred maintenance projects.
The General Fund transferred to the COP Debt Service Non-Major Governmental Fund for
debt service payments.
NOTE 7 - ACCOUNTS PAYABLE
Accounts payable at June 30, 2018, consisted of the following:
Non-Major Total
General Building Governmental Governmental
Fund Fund Funds ActivitiesAccrued salaries and benefits 2,379,128$ -$ 111,551$ 2,490,679$
Local Control Funding Formula 490,637 - - 490,637
State Categorical 32,842 - - 32,842
Construction - 1,600,552 700,835 2,301,387Due to SELPA 407,814 - - 407,814Due to Kinetic Academy 148,469 - - 148,469
Other vendor payables 737,317 - 114,206 851,523Total 4,196,207$ 1,600,552$ 926,592$ 6,723,351$
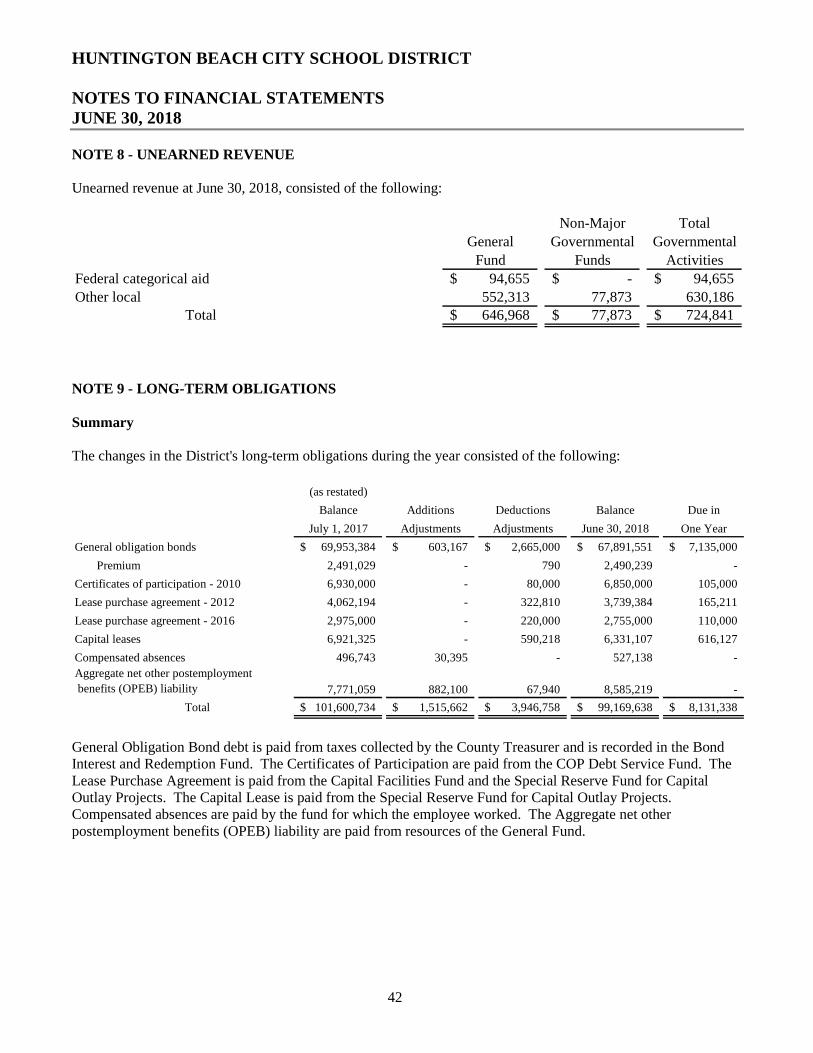
HUNTINGTON BEACH CITY SCHOOL DISTRICT
NOTES TO FINANCIAL STATEMENTS JUNE 30, 2018
42
NOTE 8 - UNEARNED REVENUE
Unearned revenue at June 30, 2018, consisted of the following:
Non-Major Total
General Governmental Governmental
Fund Funds Activities
Federal categorical aid 94,655$ -$ 94,655$
Other local 552,313 77,873 630,186Total 646,968$ 77,873$ 724,841$
NOTE 9 - LONG-TERM OBLIGATIONS
Summary
The changes in the District's long-term obligations during the year consisted of the following:
(as restated)
Balance Additions Deductions Balance Due in
July 1, 2017 Adjustments Adjustments June 30, 2018 One Year
General obligation bonds 69,953,384$ 603,167$ 2,665,000$ 67,891,551$ 7,135,000$
Premium 2,491,029 - 790 2,490,239 -
Certificates of participation - 2010 6,930,000 - 80,000 6,850,000 105,000
Lease purchase agreement - 2012 4,062,194 - 322,810 3,739,384 165,211
Lease purchase agreement - 2016 2,975,000 - 220,000 2,755,000 110,000
Capital leases 6,921,325 - 590,218 6,331,107 616,127
Compensated absences 496,743 30,395 - 527,138 -
Aggregate net other postemployment
benefits (OPEB) liability 7,771,059 882,100 67,940 8,585,219 -
Total 101,600,734$ 1,515,662$ 3,946,758$ 99,169,638$ 8,131,338$
General Obligation Bond debt is paid from taxes collected by the County Treasurer and is recorded in the Bond Interest and Redemption Fund. The Certificates of Participation are paid from the COP Debt Service Fund. The Lease Purchase Agreement is paid from the Capital Facilities Fund and the Special Reserve Fund for Capital Outlay Projects. The Capital Lease is paid from the Special Reserve Fund for Capital Outlay Projects. Compensated absences are paid by the fund for which the employee worked. The Aggregate net other postemployment benefits (OPEB) liability are paid from resources of the General Fund.
HUNTINGTON BEACH CITY SCHOOL DISTRICT
NOTES TO FINANCIAL STATEMENTS JUNE 30, 2018
43
General Obligation Bonds
2002 Series A
In May 2002, the District issued current and capital appreciation, General Obligation Bonds, Election 2002, Series 2002A, in the amount of $19,995,023 (accreting to $25,320,000) in order to raise money for modernization, reconstruction, and new construction. The District received authorization at an election held March 5, 2002, by a fifty-five percent majority of the votes cast by the eligible voters within the District. In August 2005, a portion of the bonds were refunded (see 2005 refunding note that follows). The remaining bonds have maturity dates of August 1, 2024, 2025, and 2026, with an interest rate of 8.40 percent. At June 30, 2018, the outstanding principal on the bonds amounted to $3,377,211, including accretion to date.
2003 Series A
In July 2003, the District issued current and capital appreciation, General Obligation Bonds, Election 2002, Series 2003A, in the amount of $10,003,939 (accreting to $17,489,929) in order to raise money for modernization, reconstruction, and new construction. In August 2005, a portion of the bonds were refunded (see 2005 refunding note that follows). The remaining bonds mature annually beginning August 1, 2024 through August 1, 2028. At June 30, 2018, the outstanding principal on the bonds amounted to $4,804,340, including accretion to date.
2005 Refunding
In August 2005, the District refunded a portion of previously issued bonds, with the issuance of the 2005 Refunding General Obligation Bonds. The proceeds of $27,980,000 were used to refund on an advance basis the unmatured current interest bonds of the 2002 Series A and 2003 Series A bonds and pay legal, financial and contingent costs in connection therewith. In September 2014 and May 2015, a portion of the 2005 Refunding General Obligation Bonds were refunded (see 2014A and 2015A refunding notes that follow). At June 30, 2018, the outstanding balance was paid off.
2014A Refunding
In August 2014, the District refunded a portion of the previously issued 2005 refunding bonds, with the issuance of the 2014A General Obligation Refunding Bonds. The proceeds of $565,000 were used to refund on an advance basis a portion of the unmatured principal and interest of the 2005 refunding bond and pay legal and financial, contingent cost in connection therewith. The refunding qualified as an in substance defeasance. The debt is considered an in substance defeasance because the District irrevocably placed funds with an escrow agent to be used solely to satisfy scheduled principal and interest payment of the debt. At June 30, 2018, the outstanding principal on the bonds amounted to $565,000.
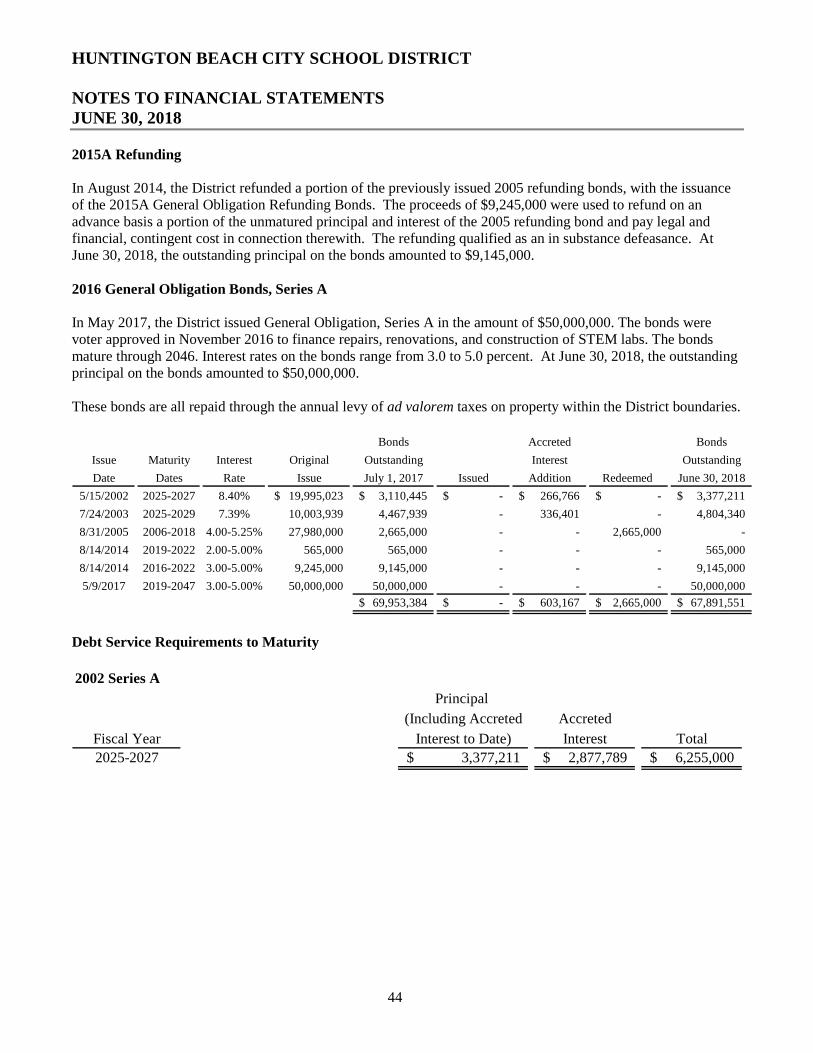
HUNTINGTON BEACH CITY SCHOOL DISTRICT
NOTES TO FINANCIAL STATEMENTS JUNE 30, 2018
44
2015A Refunding
In August 2014, the District refunded a portion of the previously issued 2005 refunding bonds, with the issuance of the 2015A General Obligation Refunding Bonds. The proceeds of $9,245,000 were used to refund on an advance basis a portion of the unmatured principal and interest of the 2005 refunding bond and pay legal and financial, contingent cost in connection therewith. The refunding qualified as an in substance defeasance. At June 30, 2018, the outstanding principal on the bonds amounted to $9,145,000.
2016 General Obligation Bonds, Series A
In May 2017, the District issued General Obligation, Series A in the amount of $50,000,000. The bonds were voter approved in November 2016 to finance repairs, renovations, and construction of STEM labs. The bonds mature through 2046. Interest rates on the bonds range from 3.0 to 5.0 percent. At June 30, 2018, the outstanding principal on the bonds amounted to $50,000,000.
These bonds are all repaid through the annual levy of ad valorem taxes on property within the District boundaries.
Bonds Accreted Bonds
Issue Maturity Interest Original Outstanding Interest Outstanding
Date Dates Rate Issue July 1, 2017 Issued Addition Redeemed June 30, 2018
5/15/2002 2025-2027 8.40% 19,995,023$ 3,110,445$ -$ 266,766$ -$ 3,377,211$
7/24/2003 2025-2029 7.39% 10,003,939 4,467,939 - 336,401 - 4,804,340
8/31/2005 2006-2018 4.00-5.25% 27,980,000 2,665,000 - - 2,665,000 -
8/14/2014 2019-2022 2.00-5.00% 565,000 565,000 - - - 565,000
8/14/2014 2016-2022 3.00-5.00% 9,245,000 9,145,000 - - - 9,145,000
5/9/2017 2019-2047 3.00-5.00% 50,000,000 50,000,000 - - - 50,000,000
69,953,384$ -$ 603,167$ 2,665,000$ 67,891,551$
Debt Service Requirements to Maturity
2002 Series A
Principal
(Including Accreted Accreted
Fiscal Year Interest to Date) Interest Total
2025-2027 3,377,211$ 2,877,789$ 6,255,000$
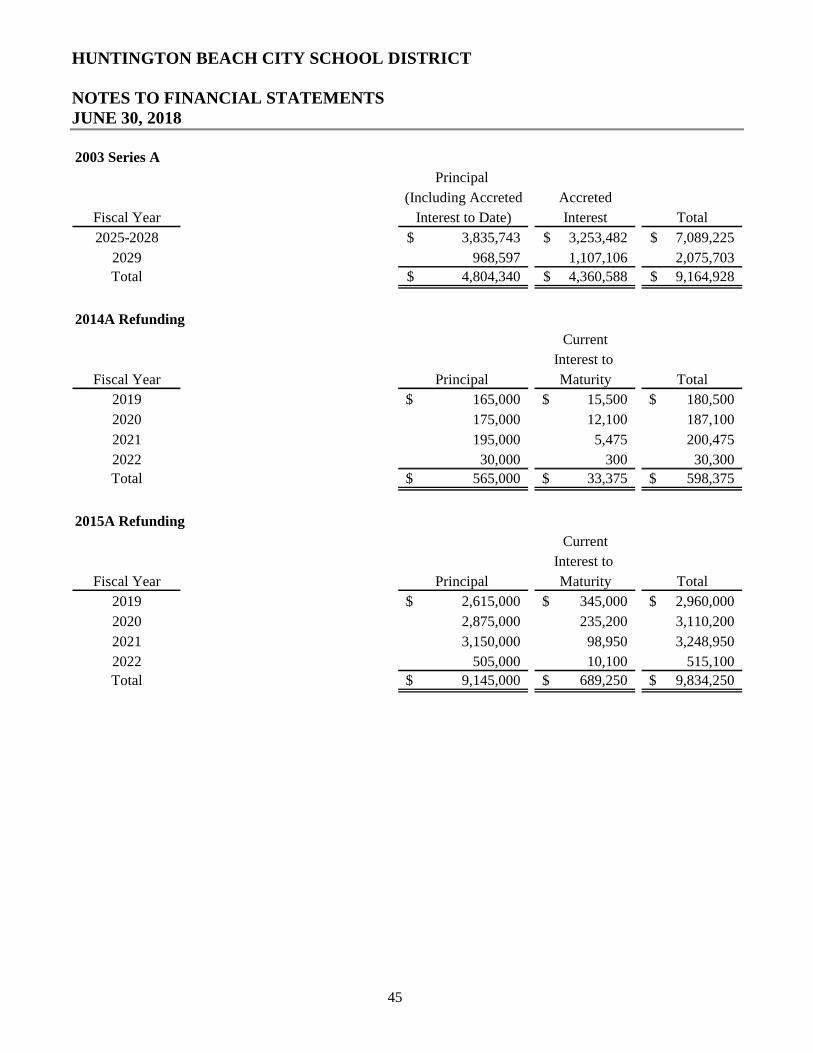
HUNTINGTON BEACH CITY SCHOOL DISTRICT
NOTES TO FINANCIAL STATEMENTS JUNE 30, 2018
45
2003 Series A
Principal
(Including Accreted Accreted
Fiscal Year Interest to Date) Interest Total
2025-2028 3,835,743$ 3,253,482$ 7,089,225$
2029 968,597 1,107,106 2,075,703
Total 4,804,340$ 4,360,588$ 9,164,928$
2014A Refunding
Current
Interest to
Fiscal Year Principal Maturity Total
2019 165,000$ 15,500$ 180,500$
2020 175,000 12,100 187,100
2021 195,000 5,475 200,475
2022 30,000 300 30,300
Total 565,000$ 33,375$ 598,375$
2015A Refunding
Current
Interest to
Fiscal Year Principal Maturity Total
2019 2,615,000$ 345,000$ 2,960,000$
2020 2,875,000 235,200 3,110,200
2021 3,150,000 98,950 3,248,950
2022 505,000 10,100 515,100
Total 9,145,000$ 689,250$ 9,834,250$
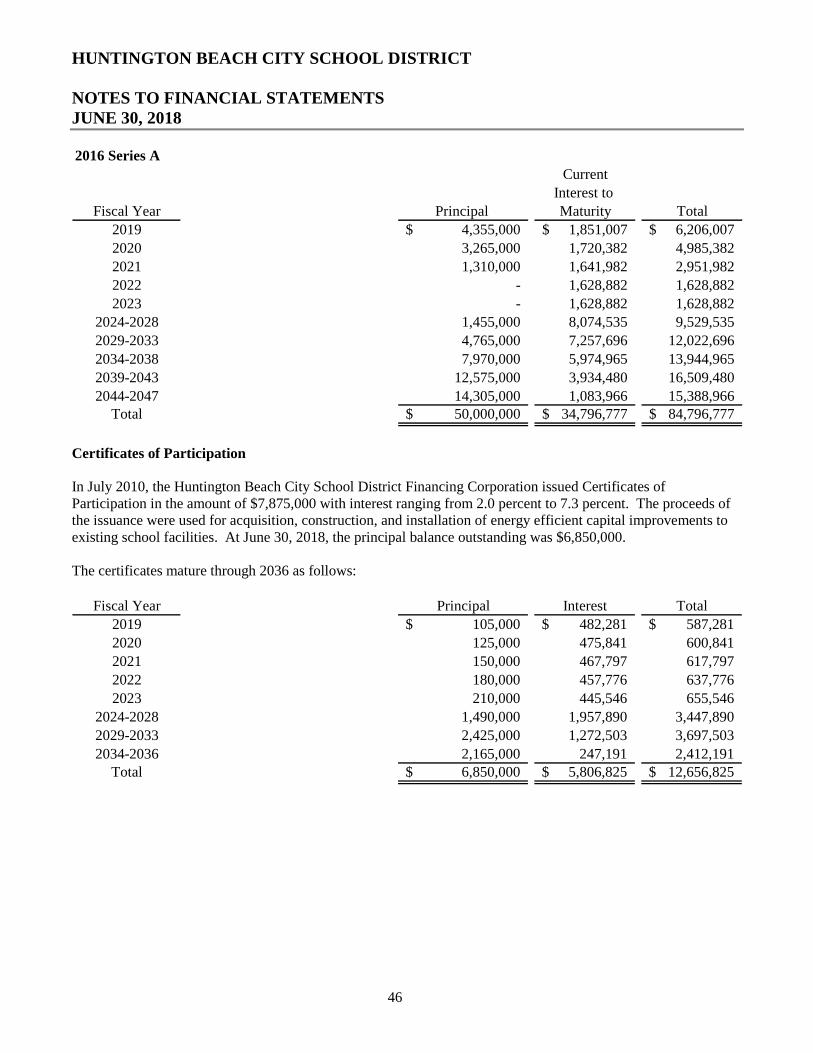
HUNTINGTON BEACH CITY SCHOOL DISTRICT
NOTES TO FINANCIAL STATEMENTS JUNE 30, 2018
46
2016 Series A
Current
Interest to
Fiscal Year Principal Maturity Total
2019 4,355,000$ 1,851,007$ 6,206,007$
2020 3,265,000 1,720,382 4,985,382
2021 1,310,000 1,641,982 2,951,982
2022 - 1,628,882 1,628,882
2023 - 1,628,882 1,628,882
2024-2028 1,455,000 8,074,535 9,529,535
2029-2033 4,765,000 7,257,696 12,022,696
2034-2038 7,970,000 5,974,965 13,944,965
2039-2043 12,575,000 3,934,480 16,509,480
2044-2047 14,305,000 1,083,966 15,388,966Total 50,000,000$ 34,796,777$ 84,796,777$
Certificates of Participation
In July 2010, the Huntington Beach City School District Financing Corporation issued Certificates of Participation in the amount of $7,875,000 with interest ranging from 2.0 percent to 7.3 percent. The proceeds of the issuance were used for acquisition, construction, and installation of energy efficient capital improvements to existing school facilities. At June 30, 2018, the principal balance outstanding was $6,850,000.
The certificates mature through 2036 as follows:
Fiscal Year Principal Interest Total
2019 105,000$ 482,281$ 587,281$
2020 125,000 475,841 600,841
2021 150,000 467,797 617,797
2022 180,000 457,776 637,776
2023 210,000 445,546 655,546
2024-2028 1,490,000 1,957,890 3,447,890
2029-2033 2,425,000 1,272,503 3,697,503
2034-2036 2,165,000 247,191 2,412,191Total 6,850,000$ 5,806,825$ 12,656,825$
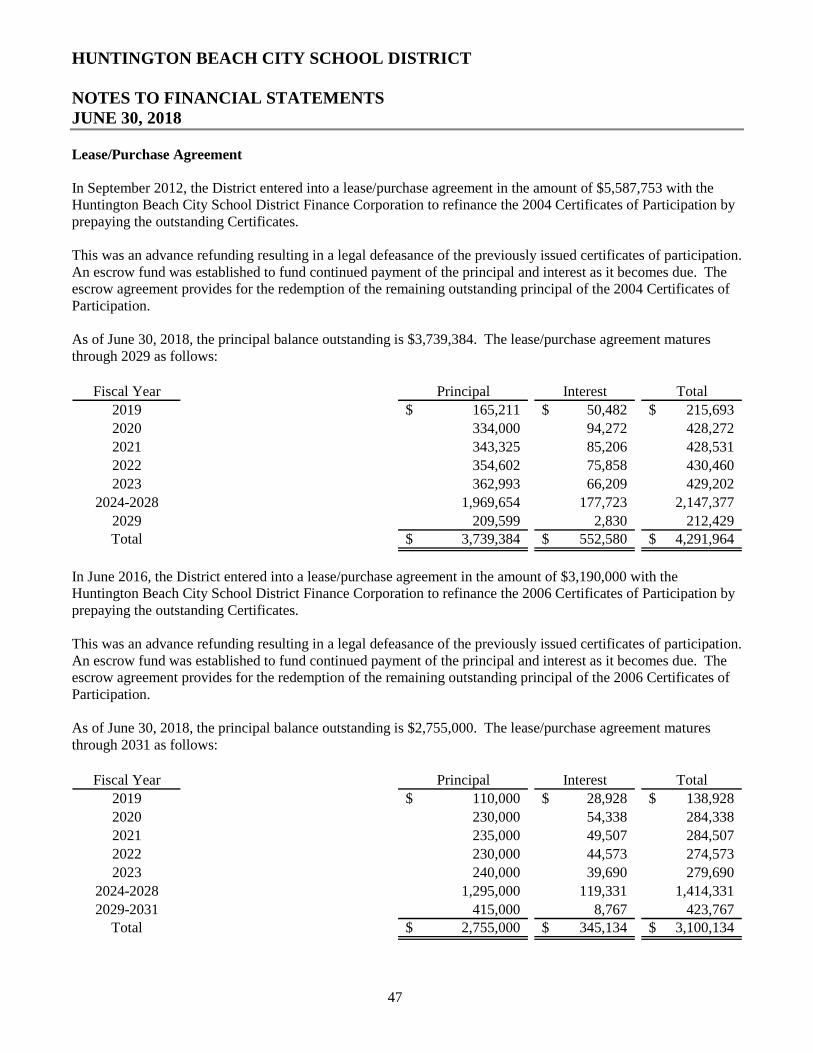
HUNTINGTON BEACH CITY SCHOOL DISTRICT
NOTES TO FINANCIAL STATEMENTS JUNE 30, 2018
47
Lease/Purchase Agreement
In September 2012, the District entered into a lease/purchase agreement in the amount of $5,587,753 with the Huntington Beach City School District Finance Corporation to refinance the 2004 Certificates of Participation by prepaying the outstanding Certificates.
This was an advance refunding resulting in a legal defeasance of the previously issued certificates of participation. An escrow fund was established to fund continued payment of the principal and interest as it becomes due. The escrow agreement provides for the redemption of the remaining outstanding principal of the 2004 Certificates of Participation.
As of June 30, 2018, the principal balance outstanding is $3,739,384. The lease/purchase agreement matures through 2029 as follows:
Fiscal Year Principal Interest Total
2019 165,211$ 50,482$ 215,693$
2020 334,000 94,272 428,272
2021 343,325 85,206 428,531
2022 354,602 75,858 430,460
2023 362,993 66,209 429,202
2024-2028 1,969,654 177,723 2,147,377
2029 209,599 2,830 212,429Total 3,739,384$ 552,580$ 4,291,964$
In June 2016, the District entered into a lease/purchase agreement in the amount of $3,190,000 with the Huntington Beach City School District Finance Corporation to refinance the 2006 Certificates of Participation by prepaying the outstanding Certificates.
This was an advance refunding resulting in a legal defeasance of the previously issued certificates of participation. An escrow fund was established to fund continued payment of the principal and interest as it becomes due. The escrow agreement provides for the redemption of the remaining outstanding principal of the 2006 Certificates of Participation.
As of June 30, 2018, the principal balance outstanding is $2,755,000. The lease/purchase agreement matures through 2031 as follows:
Fiscal Year Principal Interest Total
2019 110,000$ 28,928$ 138,928$
2020 230,000 54,338 284,338
2021 235,000 49,507 284,507
2022 230,000 44,573 274,573
2023 240,000 39,690 279,690
2024-2028 1,295,000 119,331 1,414,331
2029-2031 415,000 8,767 423,767Total 2,755,000$ 345,134$ 3,100,134$
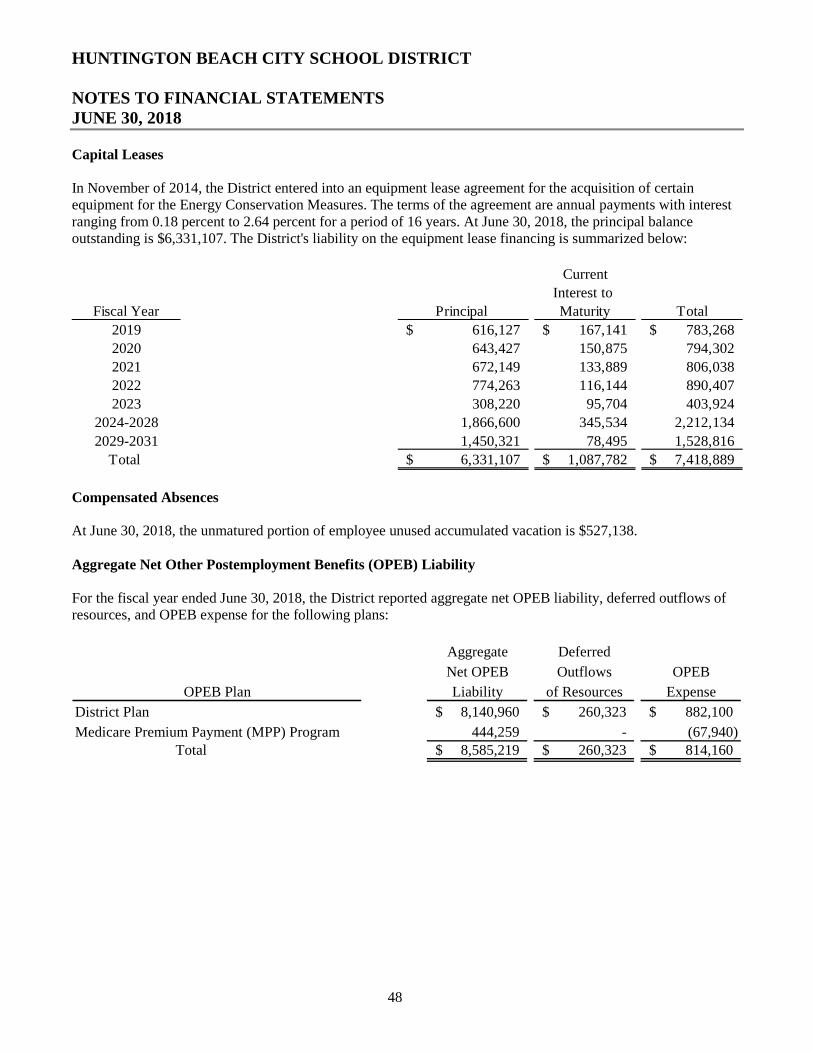
HUNTINGTON BEACH CITY SCHOOL DISTRICT
NOTES TO FINANCIAL STATEMENTS JUNE 30, 2018
48
Capital Leases
In November of 2014, the District entered into an equipment lease agreement for the acquisition of certain equipment for the Energy Conservation Measures. The terms of the agreement are annual payments with interest ranging from 0.18 percent to 2.64 percent for a period of 16 years. At June 30, 2018, the principal balance outstanding is $6,331,107. The District's liability on the equipment lease financing is summarized below:
Current
Interest to
Fiscal Year Principal Maturity Total
2019 616,127$ 167,141$ 783,268$
2020 643,427 150,875 794,302
2021 672,149 133,889 806,038
2022 774,263 116,144 890,407
2023 308,220 95,704 403,924
2024-2028 1,866,600 345,534 2,212,134
2029-2031 1,450,321 78,495 1,528,816
Total 6,331,107$ 1,087,782$ 7,418,889$
Compensated Absences
At June 30, 2018, the unmatured portion of employee unused accumulated vacation is $527,138.
Aggregate Net Other Postemployment Benefits (OPEB) Liability
For the fiscal year ended June 30, 2018, the District reported aggregate net OPEB liability, deferred outflows of resources, and OPEB expense for the following plans:
Aggregate Deferred
Net OPEB Outflows OPEB
OPEB Plan Liability of Resources Expense
District Plan 8,140,960$ 260,323$ 882,100$
Medicare Premium Payment (MPP) Program 444,259 - (67,940)Total 8,585,219$ 260,323$ 814,160$
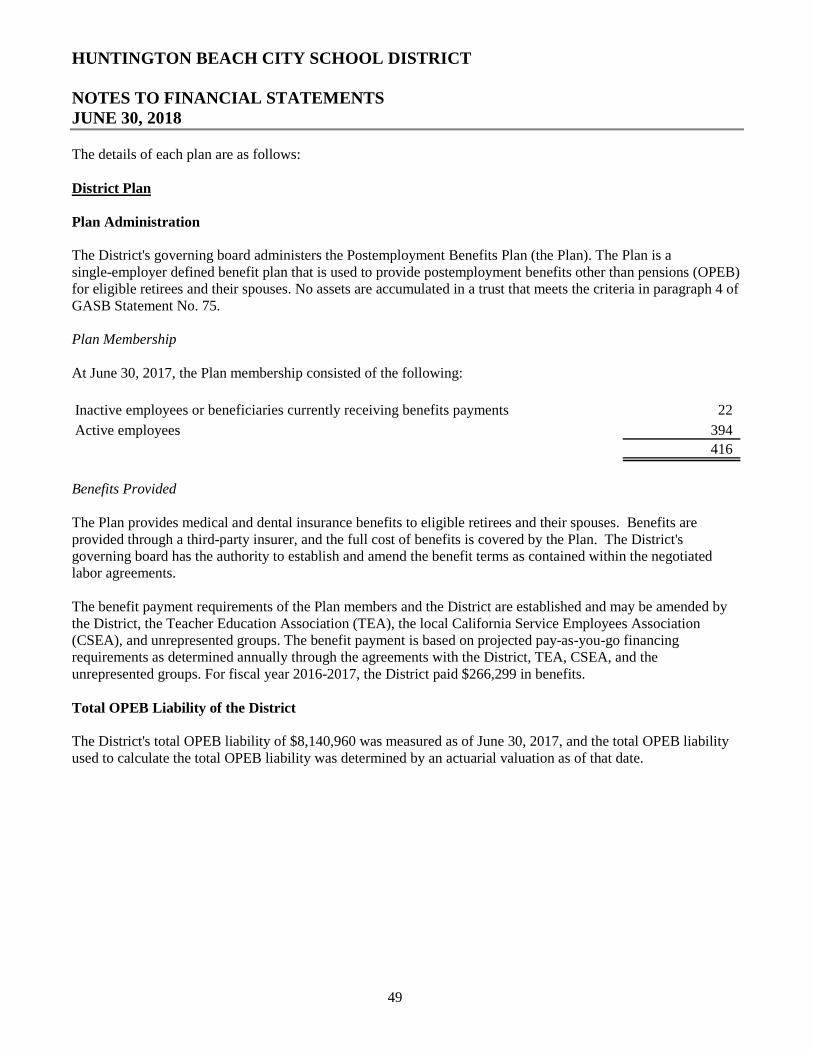
HUNTINGTON BEACH CITY SCHOOL DISTRICT
NOTES TO FINANCIAL STATEMENTS JUNE 30, 2018
49
The details of each plan are as follows:
District Plan
Plan Administration
The District's governing board administers the Postemployment Benefits Plan (the Plan). The Plan is a single-employer defined benefit plan that is used to provide postemployment benefits other than pensions (OPEB) for eligible retirees and their spouses. No assets are accumulated in a trust that meets the criteria in paragraph 4 of GASB Statement No. 75.
Plan Membership
At June 30, 2017, the Plan membership consisted of the following:
Inactive employees or beneficiaries currently receiving benefits payments 22
Active employees 394
416
Benefits Provided
The Plan provides medical and dental insurance benefits to eligible retirees and their spouses. Benefits are provided through a third-party insurer, and the full cost of benefits is covered by the Plan. The District's governing board has the authority to establish and amend the benefit terms as contained within the negotiated labor agreements.
The benefit payment requirements of the Plan members and the District are established and may be amended by the District, the Teacher Education Association (TEA), the local California Service Employees Association (CSEA), and unrepresented groups. The benefit payment is based on projected pay-as-you-go financing requirements as determined annually through the agreements with the District, TEA, CSEA, and the unrepresented groups. For fiscal year 2016-2017, the District paid $266,299 in benefits.
Total OPEB Liability of the District
The District's total OPEB liability of $8,140,960 was measured as of June 30, 2017, and the total OPEB liability used to calculate the total OPEB liability was determined by an actuarial valuation as of that date.
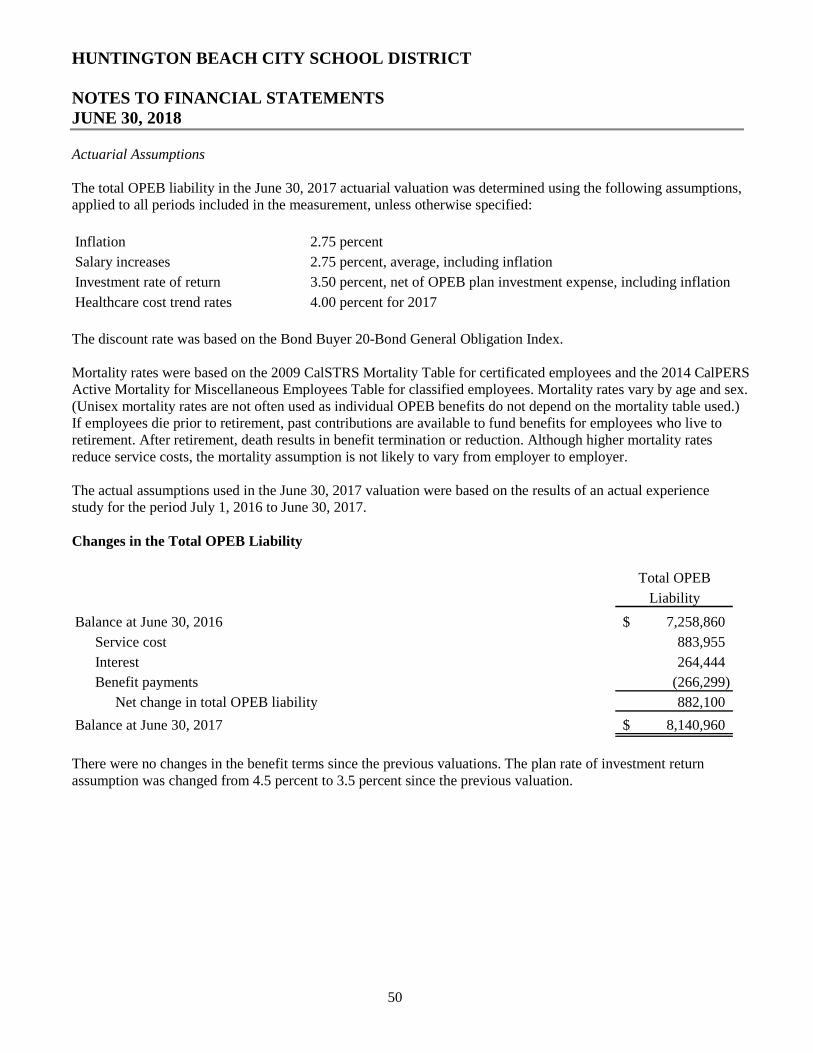
HUNTINGTON BEACH CITY SCHOOL DISTRICT
NOTES TO FINANCIAL STATEMENTS JUNE 30, 2018
50
Actuarial Assumptions
The total OPEB liability in the June 30, 2017 actuarial valuation was determined using the following assumptions, applied to all periods included in the measurement, unless otherwise specified:
Inflation 2.75 percent
Salary increases 2.75 percent, average, including inflation
Investment rate of return 3.50 percent, net of OPEB plan investment expense, including inflation
Healthcare cost trend rates 4.00 percent for 2017
The discount rate was based on the Bond Buyer 20-Bond General Obligation Index.
Mortality rates were based on the 2009 CalSTRS Mortality Table for certificated employees and the 2014 CalPERS Active Mortality for Miscellaneous Employees Table for classified employees. Mortality rates vary by age and sex. (Unisex mortality rates are not often used as individual OPEB benefits do not depend on the mortality table used.) If employees die prior to retirement, past contributions are available to fund benefits for employees who live to retirement. After retirement, death results in benefit termination or reduction. Although higher mortality rates reduce service costs, the mortality assumption is not likely to vary from employer to employer.
The actual assumptions used in the June 30, 2017 valuation were based on the results of an actual experience study for the period July 1, 2016 to June 30, 2017.
Changes in the Total OPEB Liability
Total OPEB
Liability
Balance at June 30, 2016 7,258,860$
Service cost 883,955
Interest 264,444
Benefit payments (266,299)
Net change in total OPEB liability 882,100
Balance at June 30, 2017 8,140,960$
There were no changes in the benefit terms since the previous valuations. The plan rate of investment return assumption was changed from 4.5 percent to 3.5 percent since the previous valuation.
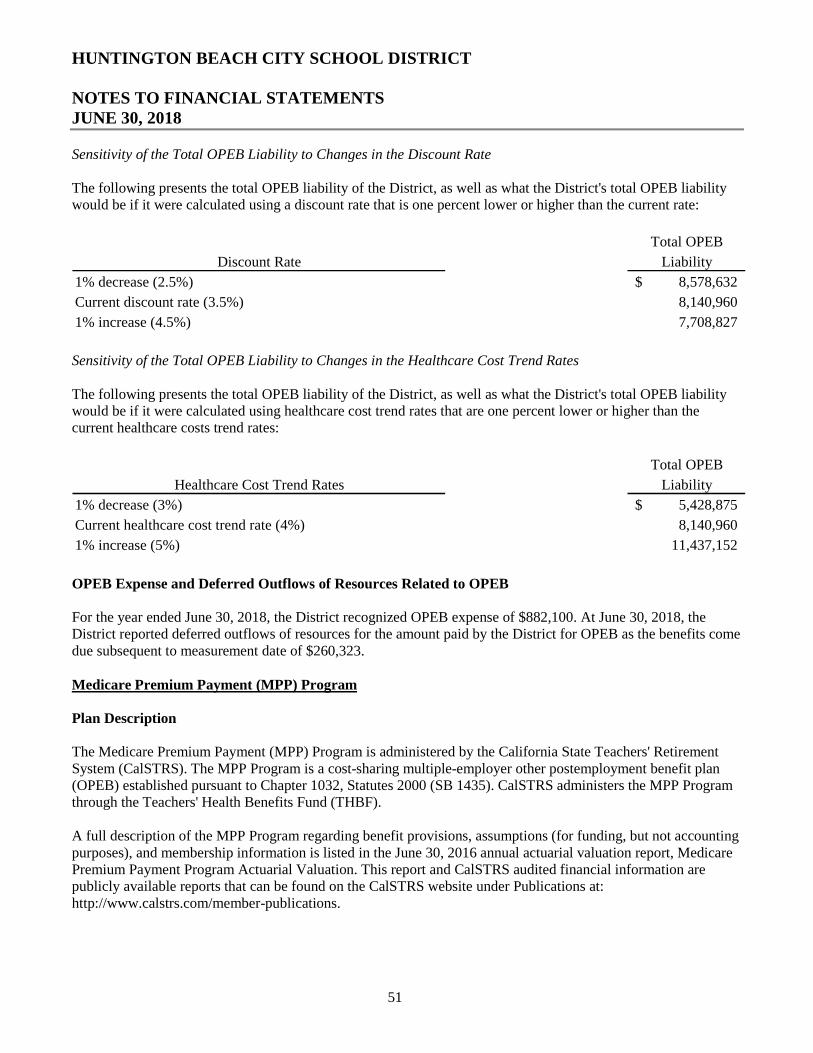
HUNTINGTON BEACH CITY SCHOOL DISTRICT
NOTES TO FINANCIAL STATEMENTS JUNE 30, 2018
51
Sensitivity of the Total OPEB Liability to Changes in the Discount Rate
The following presents the total OPEB liability of the District, as well as what the District's total OPEB liability would be if it were calculated using a discount rate that is one percent lower or higher than the current rate:
Total OPEB
Discount Rate Liability
1% decrease (2.5%) 8,578,632$
Current discount rate (3.5%) 8,140,960
1% increase (4.5%) 7,708,827
Sensitivity of the Total OPEB Liability to Changes in the Healthcare Cost Trend Rates
The following presents the total OPEB liability of the District, as well as what the District's total OPEB liability would be if it were calculated using healthcare cost trend rates that are one percent lower or higher than the current healthcare costs trend rates:
Total OPEB
Healthcare Cost Trend Rates Liability
1% decrease (3%) 5,428,875$
Current healthcare cost trend rate (4%) 8,140,960
1% increase (5%) 11,437,152
OPEB Expense and Deferred Outflows of Resources Related to OPEB
For the year ended June 30, 2018, the District recognized OPEB expense of $882,100. At June 30, 2018, the District reported deferred outflows of resources for the amount paid by the District for OPEB as the benefits come due subsequent to measurement date of $260,323.
Medicare Premium Payment (MPP) Program
Plan Description
The Medicare Premium Payment (MPP) Program is administered by the California State Teachers' Retirement System (CalSTRS). The MPP Program is a cost-sharing multiple-employer other postemployment benefit plan (OPEB) established pursuant to Chapter 1032, Statutes 2000 (SB 1435). CalSTRS administers the MPP Program through the Teachers' Health Benefits Fund (THBF).
A full description of the MPP Program regarding benefit provisions, assumptions (for funding, but not accounting purposes), and membership information is listed in the June 30, 2016 annual actuarial valuation report, Medicare Premium Payment Program Actuarial Valuation. This report and CalSTRS audited financial information are publicly available reports that can be found on the CalSTRS website under Publications at: http://www.calstrs.com/member-publications.
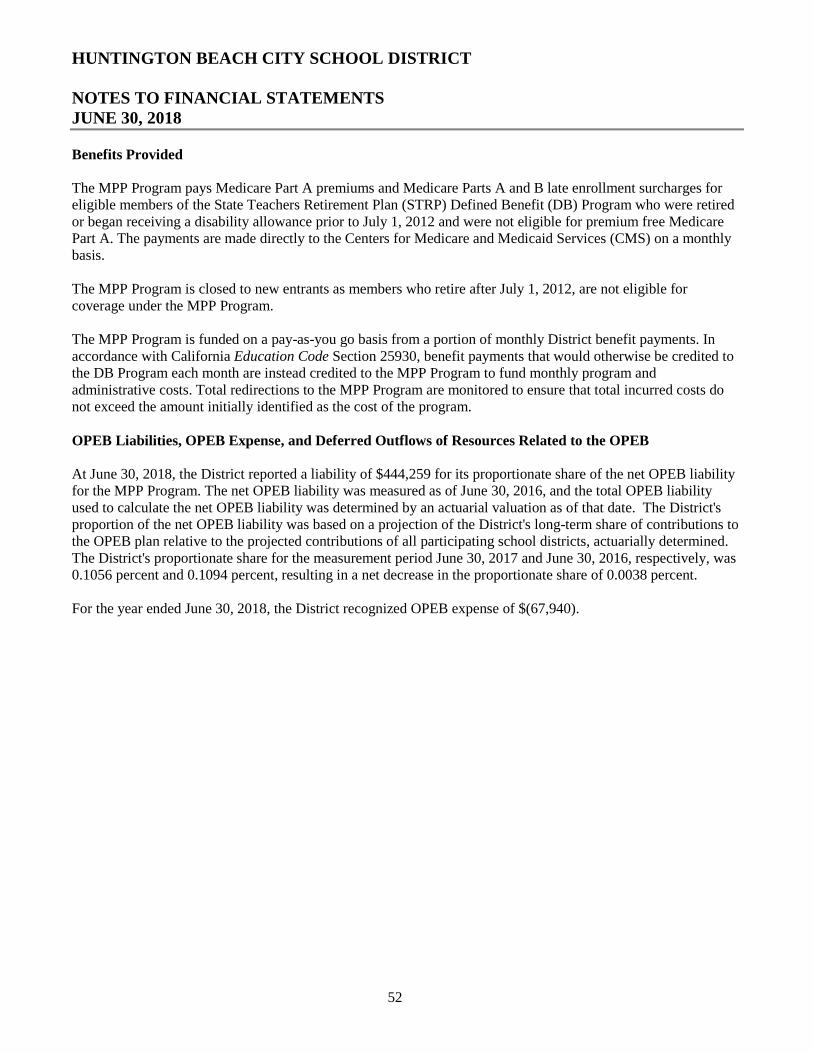
HUNTINGTON BEACH CITY SCHOOL DISTRICT
NOTES TO FINANCIAL STATEMENTS JUNE 30, 2018
52
Benefits Provided
The MPP Program pays Medicare Part A premiums and Medicare Parts A and B late enrollment surcharges for eligible members of the State Teachers Retirement Plan (STRP) Defined Benefit (DB) Program who were retired or began receiving a disability allowance prior to July 1, 2012 and were not eligible for premium free Medicare Part A. The payments are made directly to the Centers for Medicare and Medicaid Services (CMS) on a monthly basis.
The MPP Program is closed to new entrants as members who retire after July 1, 2012, are not eligible for coverage under the MPP Program.
The MPP Program is funded on a pay-as-you go basis from a portion of monthly District benefit payments. In accordance with California Education Code Section 25930, benefit payments that would otherwise be credited to the DB Program each month are instead credited to the MPP Program to fund monthly program and administrative costs. Total redirections to the MPP Program are monitored to ensure that total incurred costs do not exceed the amount initially identified as the cost of the program.
OPEB Liabilities, OPEB Expense, and Deferred Outflows of Resources Related to the OPEB
At June 30, 2018, the District reported a liability of $444,259 for its proportionate share of the net OPEB liability for the MPP Program. The net OPEB liability was measured as of June 30, 2016, and the total OPEB liability used to calculate the net OPEB liability was determined by an actuarial valuation as of that date. The District's proportion of the net OPEB liability was based on a projection of the District's long-term share of contributions to the OPEB plan relative to the projected contributions of all participating school districts, actuarially determined. The District's proportionate share for the measurement period June 30, 2017 and June 30, 2016, respectively, was 0.1056 percent and 0.1094 percent, resulting in a net decrease in the proportionate share of 0.0038 percent.
For the year ended June 30, 2018, the District recognized OPEB expense of $(67,940).
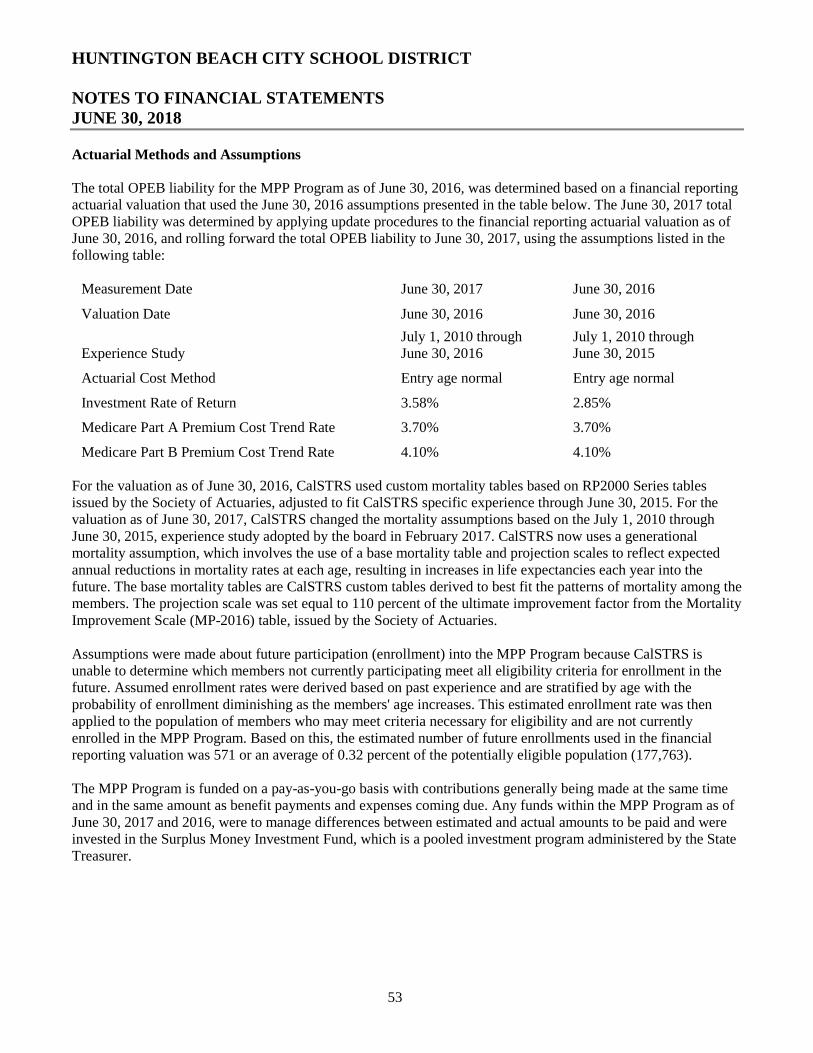
HUNTINGTON BEACH CITY SCHOOL DISTRICT
NOTES TO FINANCIAL STATEMENTS JUNE 30, 2018
53
Actuarial Methods and Assumptions
The total OPEB liability for the MPP Program as of June 30, 2016, was determined based on a financial reporting actuarial valuation that used the June 30, 2016 assumptions presented in the table below. The June 30, 2017 total OPEB liability was determined by applying update procedures to the financial reporting actuarial valuation as of June 30, 2016, and rolling forward the total OPEB liability to June 30, 2017, using the assumptions listed in the following table:
Measurement Date June 30, 2017 June 30, 2016
Valuation Date June 30, 2016 June 30, 2016
Experience Study July 1, 2010 through June 30, 2016
July 1, 2010 through June 30, 2015
Actuarial Cost Method Entry age normal Entry age normal
Investment Rate of Return 3.58% 2.85%
Medicare Part A Premium Cost Trend Rate 3.70% 3.70%
Medicare Part B Premium Cost Trend Rate 4.10% 4.10%
For the valuation as of June 30, 2016, CalSTRS used custom mortality tables based on RP2000 Series tables issued by the Society of Actuaries, adjusted to fit CalSTRS specific experience through June 30, 2015. For the valuation as of June 30, 2017, CalSTRS changed the mortality assumptions based on the July 1, 2010 through June 30, 2015, experience study adopted by the board in February 2017. CalSTRS now uses a generational mortality assumption, which involves the use of a base mortality table and projection scales to reflect expected annual reductions in mortality rates at each age, resulting in increases in life expectancies each year into the future. The base mortality tables are CalSTRS custom tables derived to best fit the patterns of mortality among the members. The projection scale was set equal to 110 percent of the ultimate improvement factor from the Mortality Improvement Scale (MP-2016) table, issued by the Society of Actuaries.
Assumptions were made about future participation (enrollment) into the MPP Program because CalSTRS is unable to determine which members not currently participating meet all eligibility criteria for enrollment in the future. Assumed enrollment rates were derived based on past experience and are stratified by age with the probability of enrollment diminishing as the members' age increases. This estimated enrollment rate was then applied to the population of members who may meet criteria necessary for eligibility and are not currently enrolled in the MPP Program. Based on this, the estimated number of future enrollments used in the financial reporting valuation was 571 or an average of 0.32 percent of the potentially eligible population (177,763).
The MPP Program is funded on a pay-as-you-go basis with contributions generally being made at the same time and in the same amount as benefit payments and expenses coming due. Any funds within the MPP Program as of June 30, 2017 and 2016, were to manage differences between estimated and actual amounts to be paid and were invested in the Surplus Money Investment Fund, which is a pooled investment program administered by the State Treasurer.
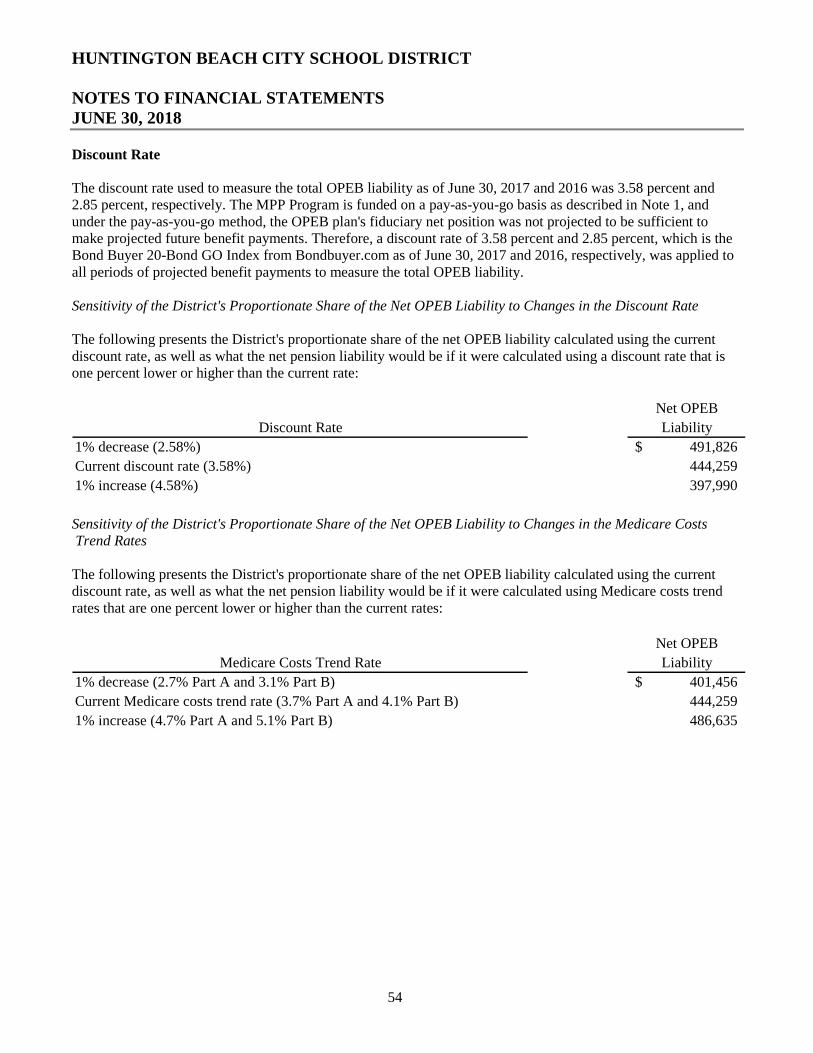
HUNTINGTON BEACH CITY SCHOOL DISTRICT
NOTES TO FINANCIAL STATEMENTS JUNE 30, 2018
54
Discount Rate
The discount rate used to measure the total OPEB liability as of June 30, 2017 and 2016 was 3.58 percent and 2.85 percent, respectively. The MPP Program is funded on a pay-as-you-go basis as described in Note 1, and under the pay-as-you-go method, the OPEB plan's fiduciary net position was not projected to be sufficient to make projected future benefit payments. Therefore, a discount rate of 3.58 percent and 2.85 percent, which is the Bond Buyer 20-Bond GO Index from Bondbuyer.com as of June 30, 2017 and 2016, respectively, was applied to all periods of projected benefit payments to measure the total OPEB liability.
Sensitivity of the District's Proportionate Share of the Net OPEB Liability to Changes in the Discount Rate
The following presents the District's proportionate share of the net OPEB liability calculated using the current discount rate, as well as what the net pension liability would be if it were calculated using a discount rate that is one percent lower or higher than the current rate:
Net OPEB
Discount Rate Liability
1% decrease (2.58%) 491,826$
Current discount rate (3.58%) 444,259
1% increase (4.58%) 397,990
Sensitivity of the District's Proportionate Share of the Net OPEB Liability to Changes in the Medicare Costs Trend Rates
The following presents the District's proportionate share of the net OPEB liability calculated using the current discount rate, as well as what the net pension liability would be if it were calculated using Medicare costs trend rates that are one percent lower or higher than the current rates:
Net OPEB
Medicare Costs Trend Rate Liability
1% decrease (2.7% Part A and 3.1% Part B) 401,456$
Current Medicare costs trend rate (3.7% Part A and 4.1% Part B) 444,259
1% increase (4.7% Part A and 5.1% Part B) 486,635
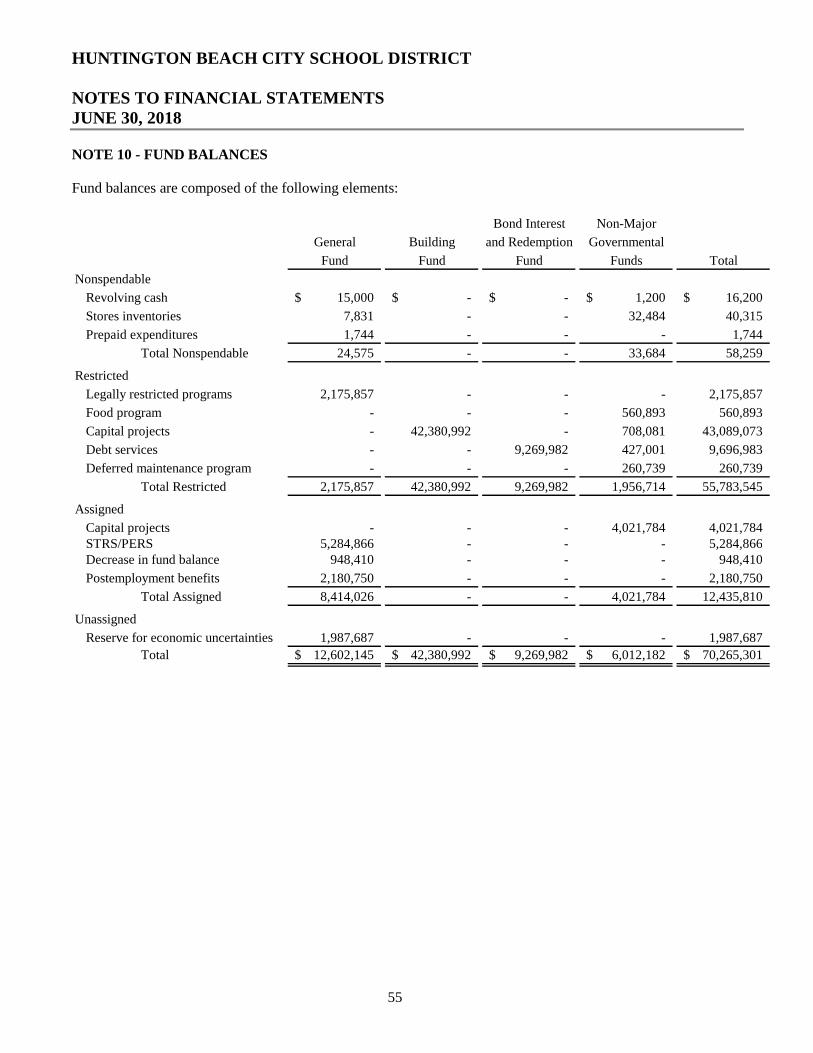
HUNTINGTON BEACH CITY SCHOOL DISTRICT
NOTES TO FINANCIAL STATEMENTS JUNE 30, 2018
55
NOTE 10 - FUND BALANCES
Fund balances are composed of the following elements:
Bond Interest Non-Major
General Building and Redemption Governmental
Fund Fund Fund Funds Total
Nonspendable
Revolving cash 15,000$ -$ -$ 1,200$ 16,200$
Stores inventories 7,831 - - 32,484 40,315
Prepaid expenditures 1,744 - - - 1,744
Total Nonspendable 24,575 - - 33,684 58,259
Restricted
Legally restricted programs 2,175,857 - - - 2,175,857
Food program - - - 560,893 560,893
Capital projects - 42,380,992 - 708,081 43,089,073
Debt services - - 9,269,982 427,001 9,696,983
Deferred maintenance program - - - 260,739 260,739
Total Restricted 2,175,857 42,380,992 9,269,982 1,956,714 55,783,545
Assigned
Capital projects - - - 4,021,784 4,021,784STRS/PERS 5,284,866 - - - 5,284,866Decrease in fund balance 948,410 - - - 948,410
Postemployment benefits 2,180,750 - - - 2,180,750
Total Assigned 8,414,026 - - 4,021,784 12,435,810
Unassigned
Reserve for economic uncertainties 1,987,687 - - - 1,987,687
Total 12,602,145$ 42,380,992$ 9,269,982$ 6,012,182$ 70,265,301$
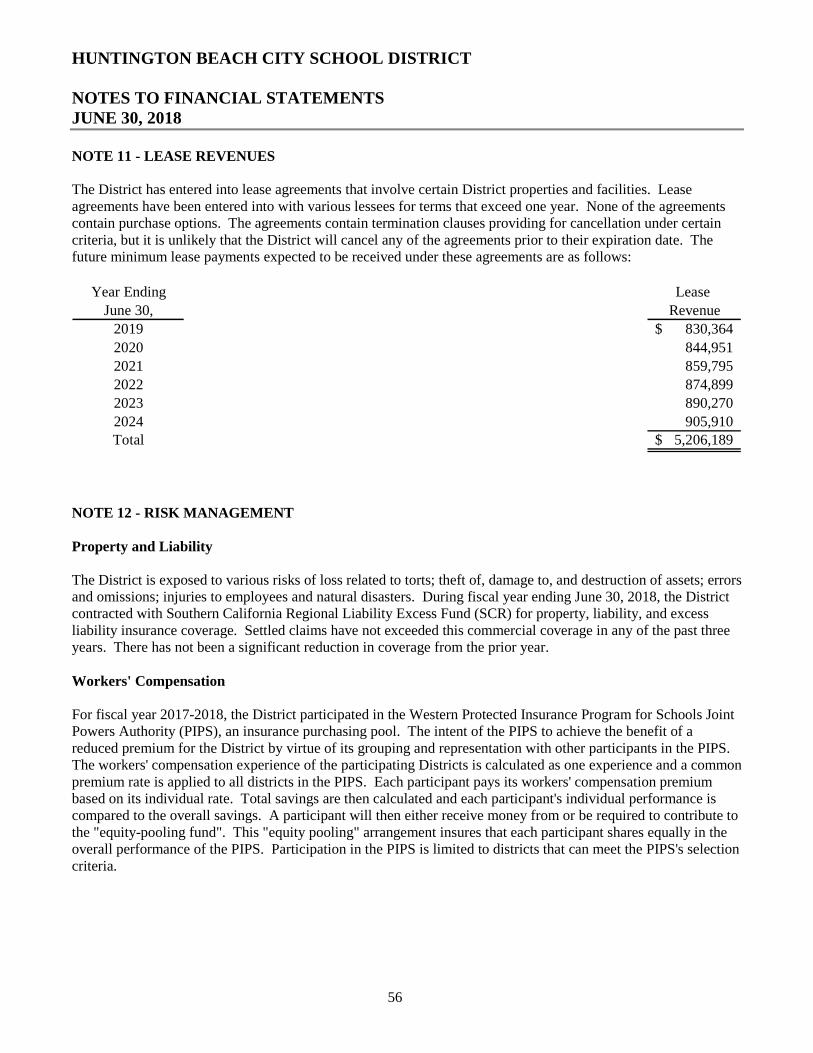
HUNTINGTON BEACH CITY SCHOOL DISTRICT
NOTES TO FINANCIAL STATEMENTS JUNE 30, 2018
56
NOTE 11 - LEASE REVENUES
The District has entered into lease agreements that involve certain District properties and facilities. Lease agreements have been entered into with various lessees for terms that exceed one year. None of the agreements contain purchase options. The agreements contain termination clauses providing for cancellation under certain criteria, but it is unlikely that the District will cancel any of the agreements prior to their expiration date. The future minimum lease payments expected to be received under these agreements are as follows:
Year Ending Lease
June 30, Revenue
2019 830,364$
2020 844,951
2021 859,795
2022 874,899
2023 890,270
2024 905,910Total 5,206,189$
NOTE 12 - RISK MANAGEMENT
Property and Liability
The District is exposed to various risks of loss related to torts; theft of, damage to, and destruction of assets; errors and omissions; injuries to employees and natural disasters. During fiscal year ending June 30, 2018, the District contracted with Southern California Regional Liability Excess Fund (SCR) for property, liability, and excess liability insurance coverage. Settled claims have not exceeded this commercial coverage in any of the past three years. There has not been a significant reduction in coverage from the prior year.
Workers' Compensation
For fiscal year 2017-2018, the District participated in the Western Protected Insurance Program for Schools Joint Powers Authority (PIPS), an insurance purchasing pool. The intent of the PIPS to achieve the benefit of a reduced premium for the District by virtue of its grouping and representation with other participants in the PIPS. The workers' compensation experience of the participating Districts is calculated as one experience and a common premium rate is applied to all districts in the PIPS. Each participant pays its workers' compensation premium based on its individual rate. Total savings are then calculated and each participant's individual performance is compared to the overall savings. A participant will then either receive money from or be required to contribute to the "equity-pooling fund". This "equity pooling" arrangement insures that each participant shares equally in the overall performance of the PIPS. Participation in the PIPS is limited to districts that can meet the PIPS's selection criteria.
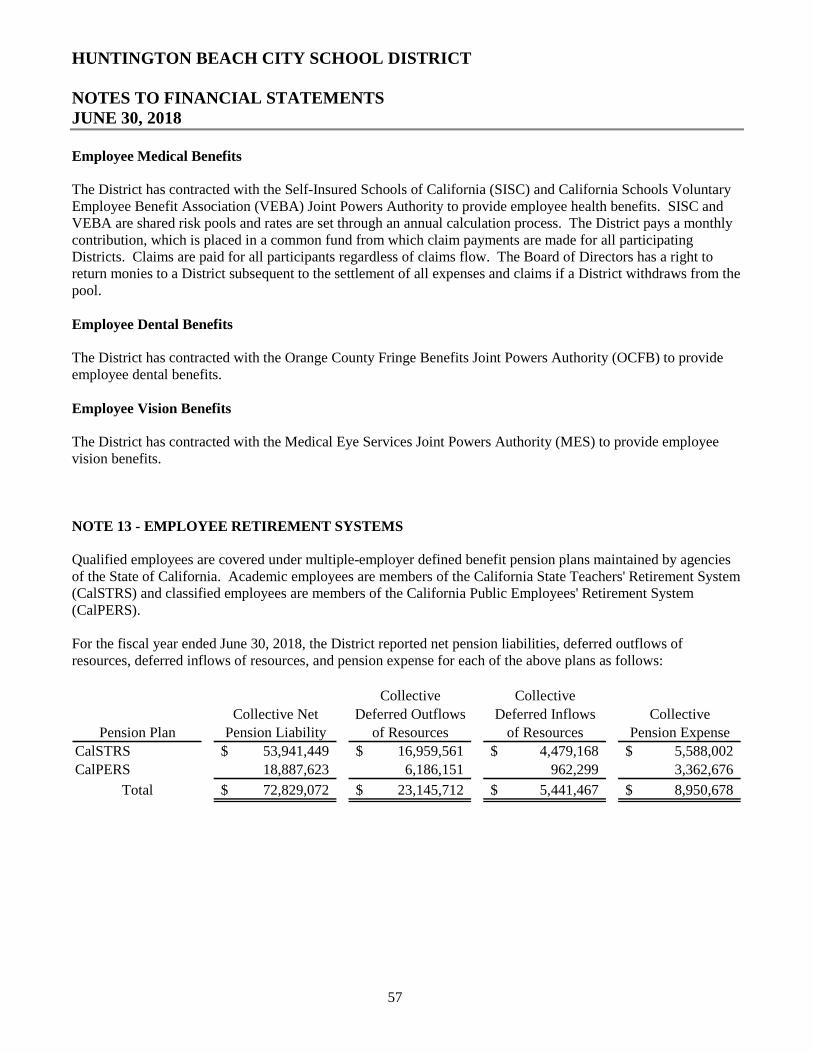
HUNTINGTON BEACH CITY SCHOOL DISTRICT
NOTES TO FINANCIAL STATEMENTS JUNE 30, 2018
57
Employee Medical Benefits
The District has contracted with the Self-Insured Schools of California (SISC) and California Schools Voluntary Employee Benefit Association (VEBA) Joint Powers Authority to provide employee health benefits. SISC and VEBA are shared risk pools and rates are set through an annual calculation process. The District pays a monthly contribution, which is placed in a common fund from which claim payments are made for all participating Districts. Claims are paid for all participants regardless of claims flow. The Board of Directors has a right to return monies to a District subsequent to the settlement of all expenses and claims if a District withdraws from the pool.
Employee Dental Benefits
The District has contracted with the Orange County Fringe Benefits Joint Powers Authority (OCFB) to provide employee dental benefits.
Employee Vision Benefits
The District has contracted with the Medical Eye Services Joint Powers Authority (MES) to provide employee vision benefits.
NOTE 13 - EMPLOYEE RETIREMENT SYSTEMS
Qualified employees are covered under multiple-employer defined benefit pension plans maintained by agencies of the State of California. Academic employees are members of the California State Teachers' Retirement System (CalSTRS) and classified employees are members of the California Public Employees' Retirement System (CalPERS).
For the fiscal year ended June 30, 2018, the District reported net pension liabilities, deferred outflows of resources, deferred inflows of resources, and pension expense for each of the above plans as follows:
Collective Collective
Collective Net Deferred Outflows Deferred Inflows Collective
Pension Plan Pension Liability of Resources of Resources Pension Expense
CalSTRS 53,941,449$ 16,959,561$ 4,479,168$ 5,588,002$
CalPERS 18,887,623 6,186,151 962,299 3,362,676
Total 72,829,072$ 23,145,712$ 5,441,467$ 8,950,678$
HUNTINGTON BEACH CITY SCHOOL DISTRICT
NOTES TO FINANCIAL STATEMENTS JUNE 30, 2018
58
The details of each plan are as follows:
California State Teachers' Retirement System (CalSTRS)
Plan Description
The District contributes to the State Teachers Retirement Plan (STRP) administered by the California State Teachers' Retirement System (CalSTRS). STRP is a cost-sharing multiple-employer public employee retirement system defined benefit pension plan. Benefit provisions are established by State statutes, as legislatively amended, within the State Teachers' Retirement Law.
A full description of the pension plan regarding benefit provisions, assumptions (for funding, but not accounting purposes), and membership information is listed in the June 30, 2016, annual actuarial valuation report, Defined Benefit Program Actuarial Valuation. This report and CalSTRS audited financial information are publicly available reports that can be found on the CalSTRS website under Publications at: http://www.calstrs.com/member-publications.
Benefits Provided
The STRP provides retirement, disability and survivor benefits to beneficiaries. Benefits are based on members' final compensation, age and years of service credit. Members hired on or before December 31, 2012, with five years of credited service are eligible for the normal retirement benefit at age 60. Members hired on or after January 1, 2013, with five years of credited service are eligible for the normal retirement benefit at age 62. The normal retirement benefit is equal to 2.0 percent of final compensation for each year of credited service.
The STRP is comprised of four programs: Defined Benefit Program, Defined Benefit Supplement Program, Cash Balance Benefit Program and Replacement Benefits Program. The STRP holds assets for the exclusive purpose of providing benefits to members and beneficiaries of these programs. CalSTRS also uses plan assets to defray reasonable expenses of administering the STRP. Although CalSTRS is the administrator of the STRP, the State is the sponsor of the STRP and obligor of the trust. In addition, the State is both an employer and nonemployer contributing entity to the STRP.
The District contributes exclusively to the STRP Defined Benefit Program, thus disclosures are not included for the other plans.
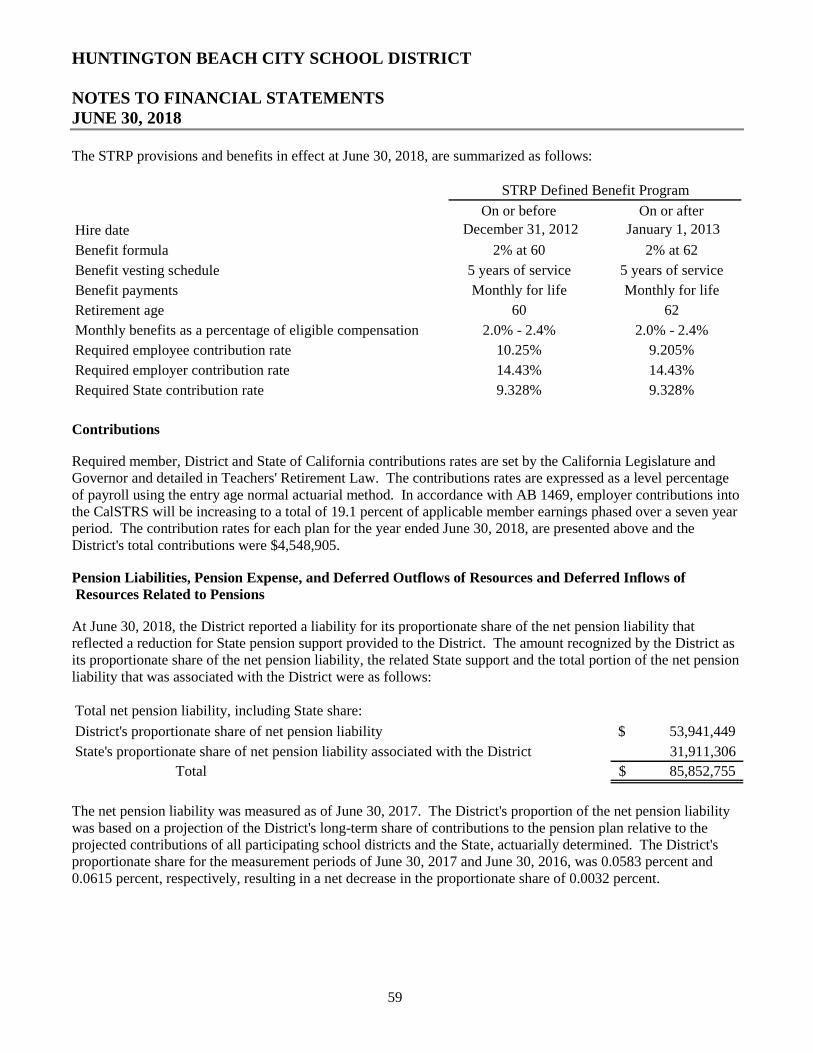
HUNTINGTON BEACH CITY SCHOOL DISTRICT
NOTES TO FINANCIAL STATEMENTS JUNE 30, 2018
59
The STRP provisions and benefits in effect at June 30, 2018, are summarized as follows:
Hire date
On or before
December 31, 2012
On or after
January 1, 2013
Benefit formula 2% at 60 2% at 62
Benefit vesting schedule 5 years of service 5 years of service
Benefit payments Monthly for life Monthly for life
Retirement age 60 62
Monthly benefits as a percentage of eligible compensation 2.0% - 2.4% 2.0% - 2.4%
Required employee contribution rate 10.25% 9.205%
Required employer contribution rate 14.43% 14.43%
Required State contribution rate 9.328% 9.328%
STRP Defined Benefit Program
Contributions
Required member, District and State of California contributions rates are set by the California Legislature and Governor and detailed in Teachers' Retirement Law. The contributions rates are expressed as a level percentage of payroll using the entry age normal actuarial method. In accordance with AB 1469, employer contributions into the CalSTRS will be increasing to a total of 19.1 percent of applicable member earnings phased over a seven year period. The contribution rates for each plan for the year ended June 30, 2018, are presented above and the District's total contributions were $4,548,905.
Pension Liabilities, Pension Expense, and Deferred Outflows of Resources and Deferred Inflows of Resources Related to Pensions
At June 30, 2018, the District reported a liability for its proportionate share of the net pension liability that reflected a reduction for State pension support provided to the District. The amount recognized by the District as its proportionate share of the net pension liability, the related State support and the total portion of the net pension liability that was associated with the District were as follows:
53,941,449$
31,911,306
85,852,755$
Total net pension liability, including State share:
District's proportionate share of net pension liability
State's proportionate share of net pension liability associated with the District
Total
The net pension liability was measured as of June 30, 2017. The District's proportion of the net pension liability was based on a projection of the District's long-term share of contributions to the pension plan relative to the projected contributions of all participating school districts and the State, actuarially determined. The District's proportionate share for the measurement periods of June 30, 2017 and June 30, 2016, was 0.0583 percent and 0.0615 percent, respectively, resulting in a net decrease in the proportionate share of 0.0032 percent.
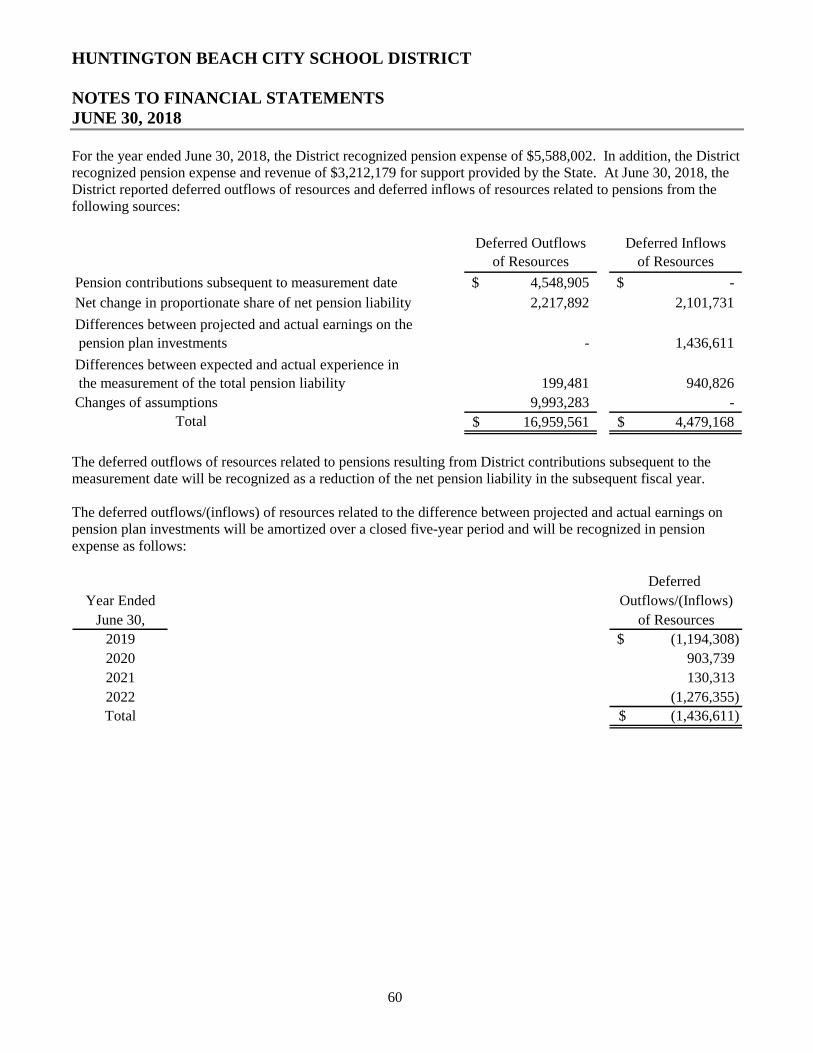
HUNTINGTON BEACH CITY SCHOOL DISTRICT
NOTES TO FINANCIAL STATEMENTS JUNE 30, 2018
60
For the year ended June 30, 2018, the District recognized pension expense of $5,588,002. In addition, the District recognized pension expense and revenue of $3,212,179 for support provided by the State. At June 30, 2018, the District reported deferred outflows of resources and deferred inflows of resources related to pensions from the following sources:
Deferred Outflows
of Resources
Deferred Inflows
of Resources
4,548,905$ -$
2,217,892 2,101,731
199,481 940,826
9,993,283 -
Total 16,959,561$ 4,479,168$
1,436,611
Net change in proportionate share of net pension liability
Changes of assumptions
Differences between expected and actual experience in
the measurement of the total pension liability
Pension contributions subsequent to measurement date
Differences between projected and actual earnings on the
pension plan investments -
The deferred outflows of resources related to pensions resulting from District contributions subsequent to the measurement date will be recognized as a reduction of the net pension liability in the subsequent fiscal year.
The deferred outflows/(inflows) of resources related to the difference between projected and actual earnings on pension plan investments will be amortized over a closed five-year period and will be recognized in pension expense as follows:
Deferred
Year Ended Outflows/(Inflows)
June 30, of Resources
2019 (1,194,308)$
2020 903,739
2021 130,313
2022 (1,276,355)
Total (1,436,611)$
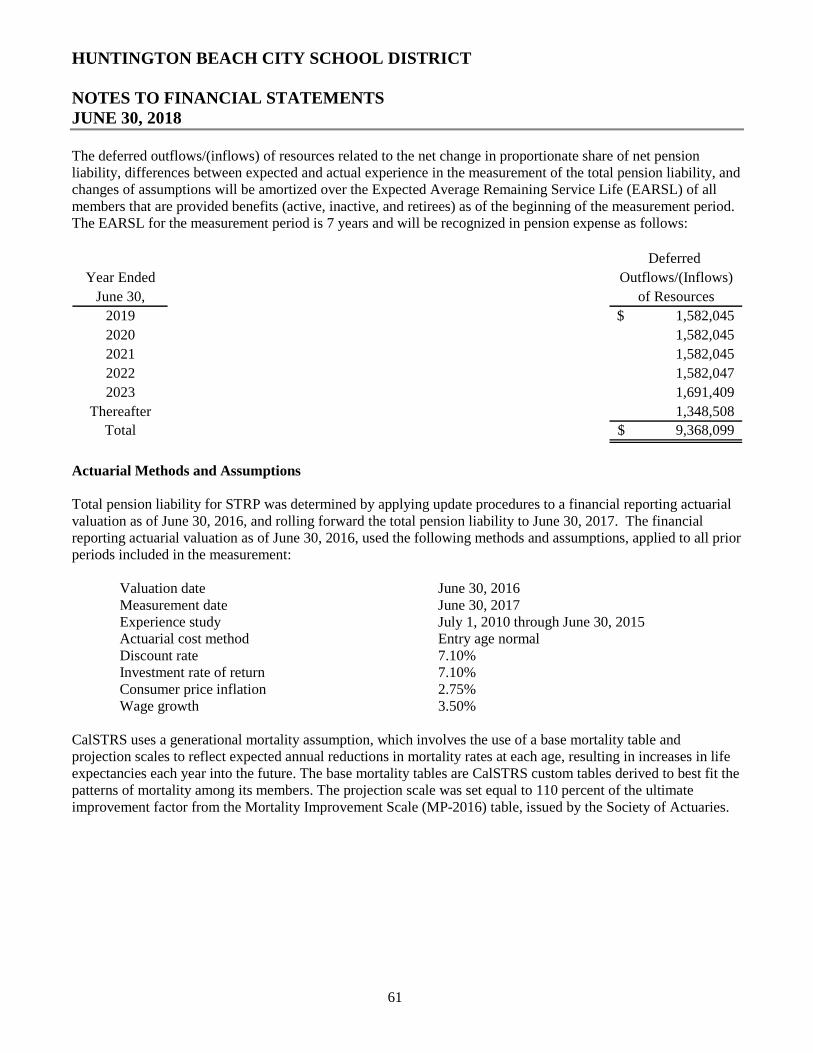
HUNTINGTON BEACH CITY SCHOOL DISTRICT
NOTES TO FINANCIAL STATEMENTS JUNE 30, 2018
61
The deferred outflows/(inflows) of resources related to the net change in proportionate share of net pension liability, differences between expected and actual experience in the measurement of the total pension liability, and changes of assumptions will be amortized over the Expected Average Remaining Service Life (EARSL) of all members that are provided benefits (active, inactive, and retirees) as of the beginning of the measurement period. The EARSL for the measurement period is 7 years and will be recognized in pension expense as follows:
Deferred
Year Ended Outflows/(Inflows)
June 30, of Resources
2019 1,582,045$
2020 1,582,045
2021 1,582,045
2022 1,582,047
2023 1,691,409
Thereafter 1,348,508
Total 9,368,099$
Actuarial Methods and Assumptions
Total pension liability for STRP was determined by applying update procedures to a financial reporting actuarial valuation as of June 30, 2016, and rolling forward the total pension liability to June 30, 2017. The financial reporting actuarial valuation as of June 30, 2016, used the following methods and assumptions, applied to all prior periods included in the measurement:
Valuation date June 30, 2016 Measurement date June 30, 2017 Experience study July 1, 2010 through June 30, 2015 Actuarial cost method Entry age normal Discount rate 7.10% Investment rate of return 7.10% Consumer price inflation 2.75% Wage growth 3.50%
CalSTRS uses a generational mortality assumption, which involves the use of a base mortality table and projection scales to reflect expected annual reductions in mortality rates at each age, resulting in increases in life expectancies each year into the future. The base mortality tables are CalSTRS custom tables derived to best fit the patterns of mortality among its members. The projection scale was set equal to 110 percent of the ultimate improvement factor from the Mortality Improvement Scale (MP-2016) table, issued by the Society of Actuaries.
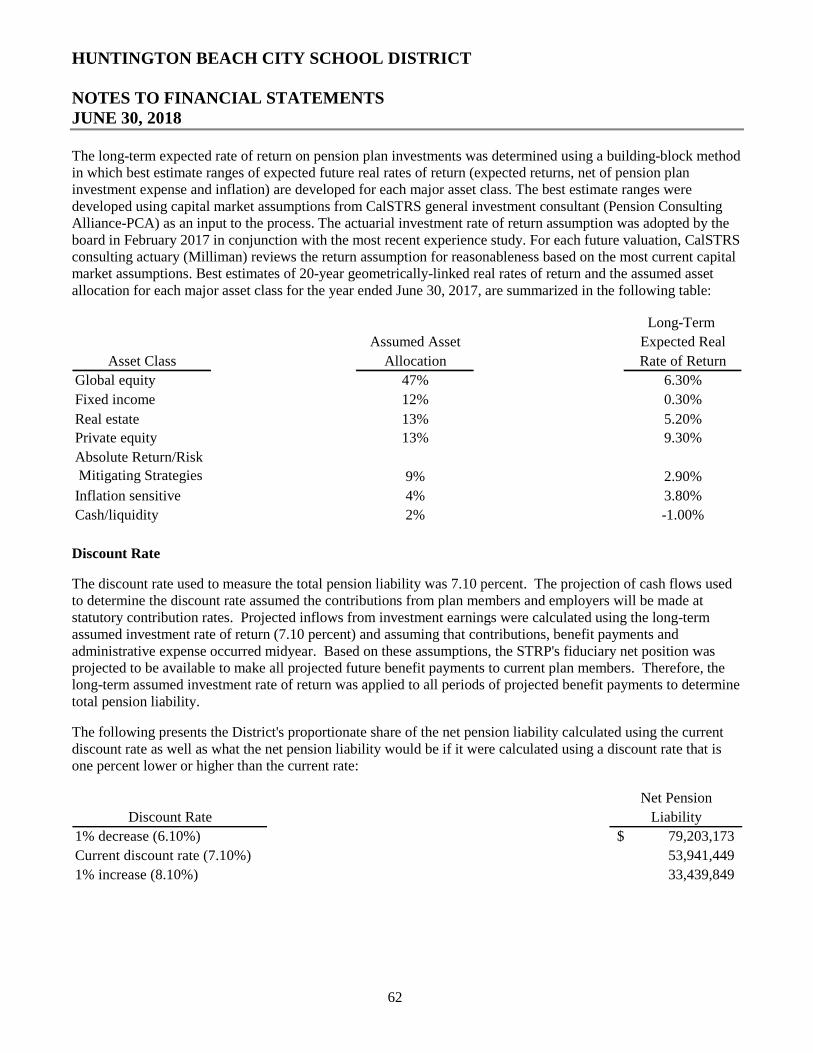
HUNTINGTON BEACH CITY SCHOOL DISTRICT
NOTES TO FINANCIAL STATEMENTS JUNE 30, 2018
62
The long-term expected rate of return on pension plan investments was determined using a building-block method in which best estimate ranges of expected future real rates of return (expected returns, net of pension plan investment expense and inflation) are developed for each major asset class. The best estimate ranges were developed using capital market assumptions from CalSTRS general investment consultant (Pension Consulting Alliance-PCA) as an input to the process. The actuarial investment rate of return assumption was adopted by the board in February 2017 in conjunction with the most recent experience study. For each future valuation, CalSTRS consulting actuary (Milliman) reviews the return assumption for reasonableness based on the most current capital market assumptions. Best estimates of 20-year geometrically-linked real rates of return and the assumed asset allocation for each major asset class for the year ended June 30, 2017, are summarized in the following table:
Long-Term
Assumed Asset Expected Real
Asset Class Allocation Rate of Return
Global equity 47% 6.30%
Fixed income 12% 0.30%
Real estate 13% 5.20%
Private equity 13% 9.30%
Absolute Return/Risk
Mitigating Strategies 9% 2.90%
Inflation sensitive 4% 3.80%
Cash/liquidity 2% -1.00%
Discount Rate
The discount rate used to measure the total pension liability was 7.10 percent. The projection of cash flows used to determine the discount rate assumed the contributions from plan members and employers will be made at statutory contribution rates. Projected inflows from investment earnings were calculated using the long-term assumed investment rate of return (7.10 percent) and assuming that contributions, benefit payments and administrative expense occurred midyear. Based on these assumptions, the STRP's fiduciary net position was projected to be available to make all projected future benefit payments to current plan members. Therefore, the long-term assumed investment rate of return was applied to all periods of projected benefit payments to determine total pension liability.
The following presents the District's proportionate share of the net pension liability calculated using the current discount rate as well as what the net pension liability would be if it were calculated using a discount rate that is one percent lower or higher than the current rate:
Net Pension
Discount Rate Liability
1% decrease (6.10%) 79,203,173$
Current discount rate (7.10%) 53,941,449
1% increase (8.10%) 33,439,849
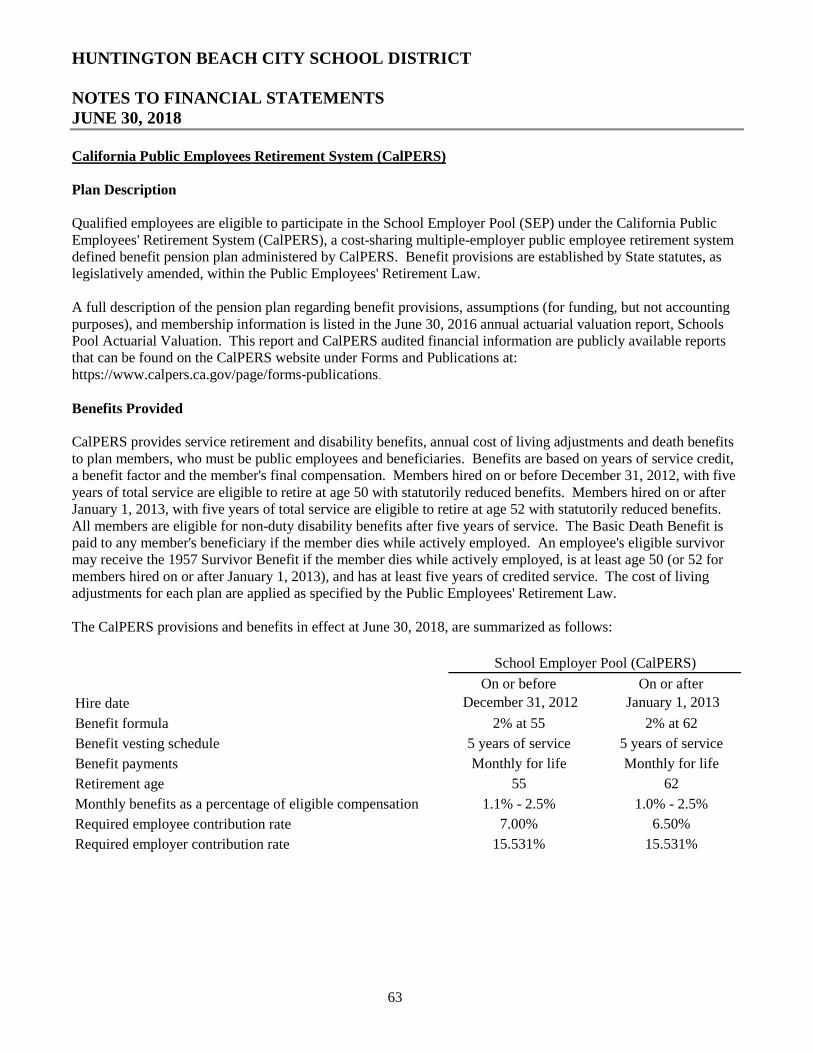
HUNTINGTON BEACH CITY SCHOOL DISTRICT
NOTES TO FINANCIAL STATEMENTS JUNE 30, 2018
63
California Public Employees Retirement System (CalPERS)
Plan Description
Qualified employees are eligible to participate in the School Employer Pool (SEP) under the California Public Employees' Retirement System (CalPERS), a cost-sharing multiple-employer public employee retirement system defined benefit pension plan administered by CalPERS. Benefit provisions are established by State statutes, as legislatively amended, within the Public Employees' Retirement Law.
A full description of the pension plan regarding benefit provisions, assumptions (for funding, but not accounting purposes), and membership information is listed in the June 30, 2016 annual actuarial valuation report, Schools Pool Actuarial Valuation. This report and CalPERS audited financial information are publicly available reports that can be found on the CalPERS website under Forms and Publications at: https://www.calpers.ca.gov/page/forms-publications.
Benefits Provided
CalPERS provides service retirement and disability benefits, annual cost of living adjustments and death benefits to plan members, who must be public employees and beneficiaries. Benefits are based on years of service credit, a benefit factor and the member's final compensation. Members hired on or before December 31, 2012, with five years of total service are eligible to retire at age 50 with statutorily reduced benefits. Members hired on or after January 1, 2013, with five years of total service are eligible to retire at age 52 with statutorily reduced benefits. All members are eligible for non-duty disability benefits after five years of service. The Basic Death Benefit is paid to any member's beneficiary if the member dies while actively employed. An employee's eligible survivor may receive the 1957 Survivor Benefit if the member dies while actively employed, is at least age 50 (or 52 for members hired on or after January 1, 2013), and has at least five years of credited service. The cost of living adjustments for each plan are applied as specified by the Public Employees' Retirement Law.
The CalPERS provisions and benefits in effect at June 30, 2018, are summarized as follows:
Hire date
On or before
December 31, 2012
On or after
January 1, 2013
Benefit formula 2% at 55 2% at 62
Benefit vesting schedule 5 years of service 5 years of service
Benefit payments Monthly for life Monthly for life
Retirement age 55 62
Monthly benefits as a percentage of eligible compensation 1.1% - 2.5% 1.0% - 2.5%
Required employee contribution rate 7.00% 6.50%
Required employer contribution rate 15.531% 15.531%
School Employer Pool (CalPERS)
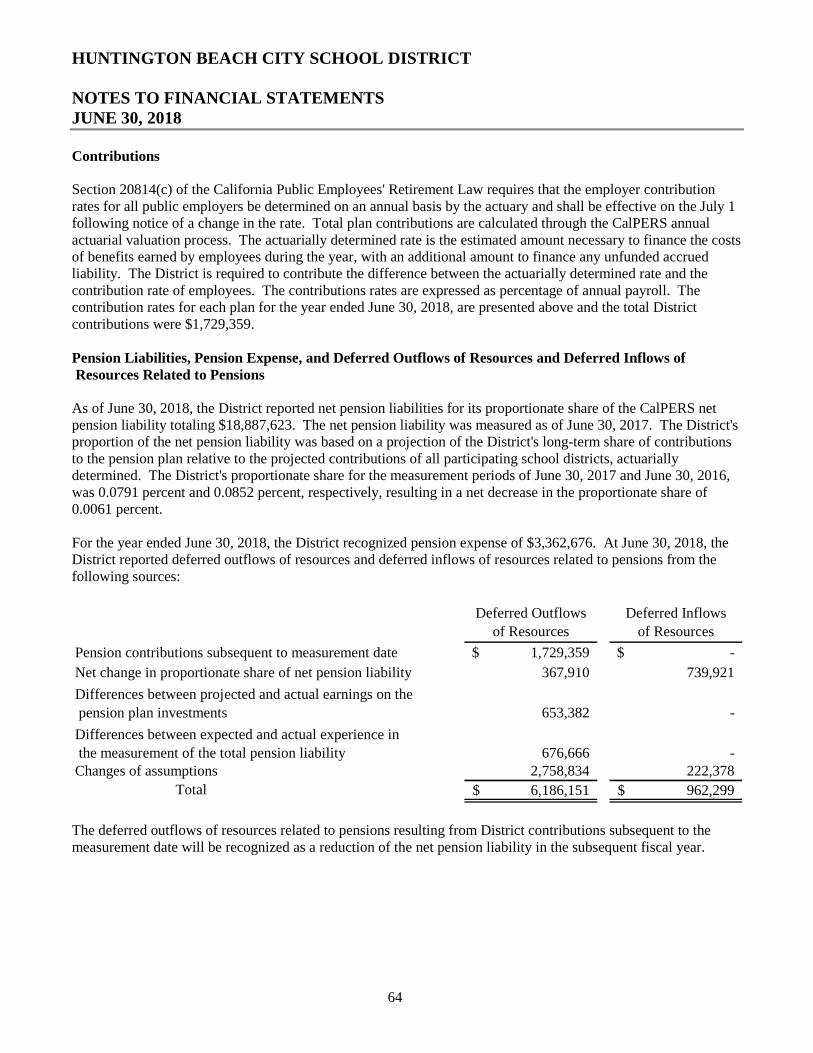
HUNTINGTON BEACH CITY SCHOOL DISTRICT
NOTES TO FINANCIAL STATEMENTS JUNE 30, 2018
64
Contributions
Section 20814(c) of the California Public Employees' Retirement Law requires that the employer contribution rates for all public employers be determined on an annual basis by the actuary and shall be effective on the July 1 following notice of a change in the rate. Total plan contributions are calculated through the CalPERS annual actuarial valuation process. The actuarially determined rate is the estimated amount necessary to finance the costs of benefits earned by employees during the year, with an additional amount to finance any unfunded accrued liability. The District is required to contribute the difference between the actuarially determined rate and the contribution rate of employees. The contributions rates are expressed as percentage of annual payroll. The contribution rates for each plan for the year ended June 30, 2018, are presented above and the total District contributions were $1,729,359.
Pension Liabilities, Pension Expense, and Deferred Outflows of Resources and Deferred Inflows of Resources Related to Pensions
As of June 30, 2018, the District reported net pension liabilities for its proportionate share of the CalPERS net pension liability totaling $18,887,623. The net pension liability was measured as of June 30, 2017. The District's proportion of the net pension liability was based on a projection of the District's long-term share of contributions to the pension plan relative to the projected contributions of all participating school districts, actuarially determined. The District's proportionate share for the measurement periods of June 30, 2017 and June 30, 2016, was 0.0791 percent and 0.0852 percent, respectively, resulting in a net decrease in the proportionate share of 0.0061 percent.
For the year ended June 30, 2018, the District recognized pension expense of $3,362,676. At June 30, 2018, the District reported deferred outflows of resources and deferred inflows of resources related to pensions from the following sources:
Deferred Outflows
of Resources
Deferred Inflows
of Resources
1,729,359$ -$
367,910 739,921
676,666 -2,758,834 222,378
6,186,151$ 962,299$
Pension contributions subsequent to measurement date
Differences between projected and actual earnings on the
pension plan investments 653,382 -
Total
Net change in proportionate share of net pension liability
Differences between expected and actual experience in
the measurement of the total pension liabilityChanges of assumptions
The deferred outflows of resources related to pensions resulting from District contributions subsequent to the measurement date will be recognized as a reduction of the net pension liability in the subsequent fiscal year.
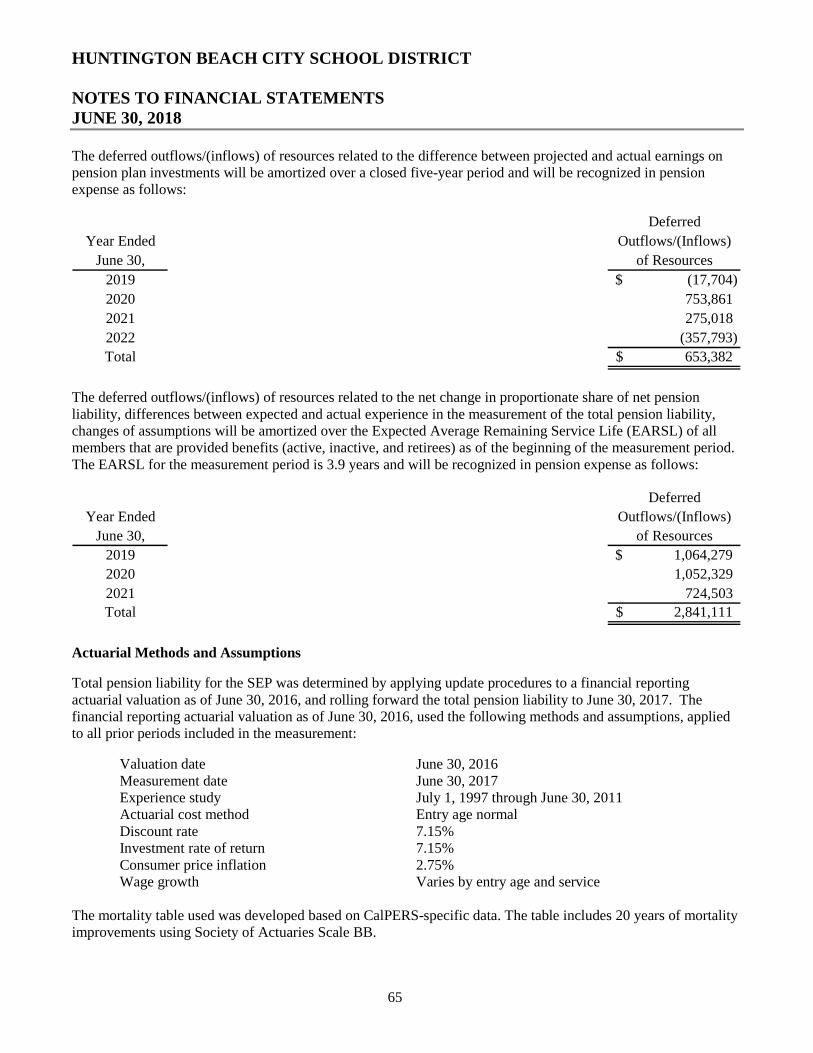
HUNTINGTON BEACH CITY SCHOOL DISTRICT
NOTES TO FINANCIAL STATEMENTS JUNE 30, 2018
65
The deferred outflows/(inflows) of resources related to the difference between projected and actual earnings on pension plan investments will be amortized over a closed five-year period and will be recognized in pension expense as follows:
Deferred
Year Ended Outflows/(Inflows)
June 30, of Resources
2019 (17,704)$
2020 753,861
2021 275,018
2022 (357,793)
Total 653,382$
The deferred outflows/(inflows) of resources related to the net change in proportionate share of net pension liability, differences between expected and actual experience in the measurement of the total pension liability, changes of assumptions will be amortized over the Expected Average Remaining Service Life (EARSL) of all members that are provided benefits (active, inactive, and retirees) as of the beginning of the measurement period. The EARSL for the measurement period is 3.9 years and will be recognized in pension expense as follows:
Deferred
Year Ended Outflows/(Inflows)
June 30, of Resources
2019 1,064,279$
2020 1,052,329
2021 724,503
Total 2,841,111$
Actuarial Methods and Assumptions
Total pension liability for the SEP was determined by applying update procedures to a financial reporting actuarial valuation as of June 30, 2016, and rolling forward the total pension liability to June 30, 2017. The financial reporting actuarial valuation as of June 30, 2016, used the following methods and assumptions, applied to all prior periods included in the measurement:
Valuation date June 30, 2016 Measurement date June 30, 2017 Experience study July 1, 1997 through June 30, 2011 Actuarial cost method Entry age normal Discount rate 7.15% Investment rate of return 7.15% Consumer price inflation 2.75% Wage growth Varies by entry age and service
The mortality table used was developed based on CalPERS-specific data. The table includes 20 years of mortality improvements using Society of Actuaries Scale BB.
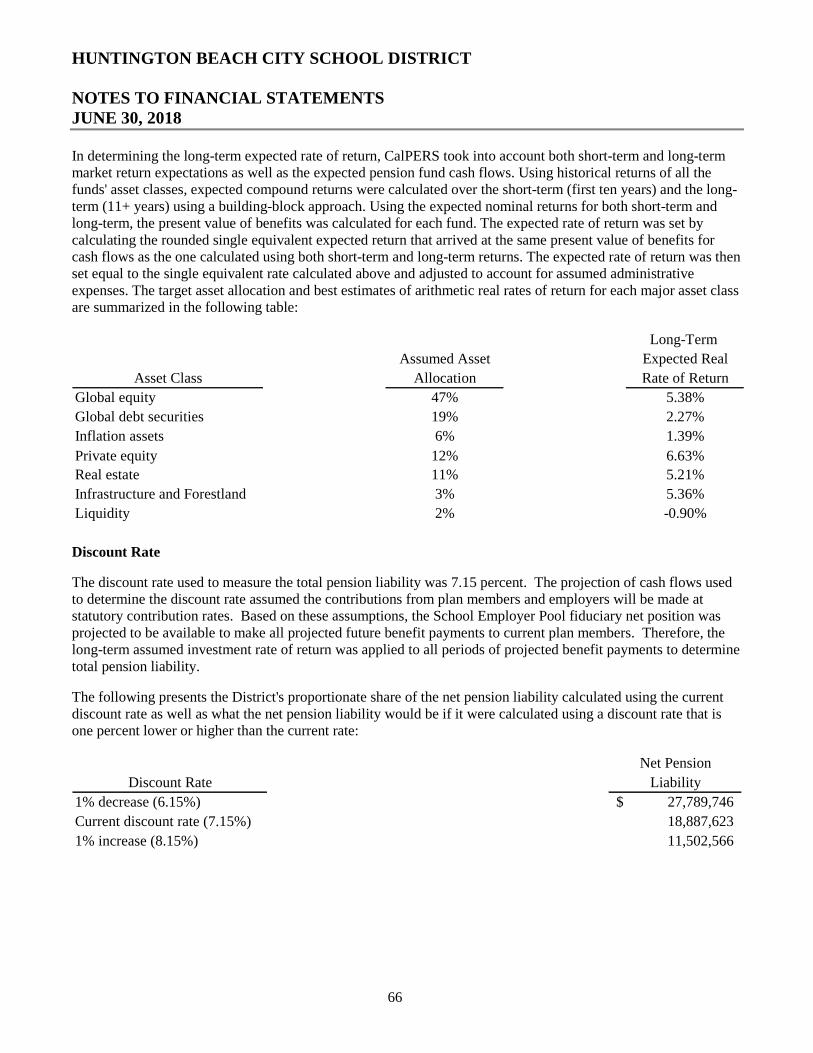
HUNTINGTON BEACH CITY SCHOOL DISTRICT
NOTES TO FINANCIAL STATEMENTS JUNE 30, 2018
66
In determining the long-term expected rate of return, CalPERS took into account both short-term and long-term market return expectations as well as the expected pension fund cash flows. Using historical returns of all the funds' asset classes, expected compound returns were calculated over the short-term (first ten years) and the long-term (11+ years) using a building-block approach. Using the expected nominal returns for both short-term and long-term, the present value of benefits was calculated for each fund. The expected rate of return was set by calculating the rounded single equivalent expected return that arrived at the same present value of benefits for cash flows as the one calculated using both short-term and long-term returns. The expected rate of return was then set equal to the single equivalent rate calculated above and adjusted to account for assumed administrative expenses. The target asset allocation and best estimates of arithmetic real rates of return for each major asset class are summarized in the following table:
Long-Term
Assumed Asset Expected Real
Asset Class Allocation Rate of Return
Global equity 47% 5.38%
Global debt securities 19% 2.27%
Inflation assets 6% 1.39%
Private equity 12% 6.63%
Real estate 11% 5.21%
Infrastructure and Forestland 3% 5.36%
Liquidity 2% -0.90%
Discount Rate
The discount rate used to measure the total pension liability was 7.15 percent. The projection of cash flows used to determine the discount rate assumed the contributions from plan members and employers will be made at statutory contribution rates. Based on these assumptions, the School Employer Pool fiduciary net position was projected to be available to make all projected future benefit payments to current plan members. Therefore, the long-term assumed investment rate of return was applied to all periods of projected benefit payments to determine total pension liability.
The following presents the District's proportionate share of the net pension liability calculated using the current discount rate as well as what the net pension liability would be if it were calculated using a discount rate that is one percent lower or higher than the current rate:
Net Pension
Discount Rate Liability
1% decrease (6.15%) 27,789,746$
Current discount rate (7.15%) 18,887,623
1% increase (8.15%) 11,502,566
HUNTINGTON BEACH CITY SCHOOL DISTRICT
NOTES TO FINANCIAL STATEMENTS JUNE 30, 2018
67
PARS
Plan Description
The District contributes to the Public Agency Retirement System (PARS), a cost-sharing multiple employer retirement trust. The plan provides retirement benefits to participants not covered by CalSTRS or CalPERS. PARS issues a separate comprehensive annual financial report that includes financial statements and required supplementary information. Copies of the PARS annual financial report may be obtained from PARS, P.O. Box 10009, Costa Mesa, California 92627.
Funding Policy
Active plan members contribute 3.75 percent of their salary and the District contributes an equal amount to the plan. Total District contributions for the fiscal year ending June 30, 2018, approximate $62,080. As of June 30, 2018, the total plan obligations to the District approximate $906,865.
On Behalf Payments
The State of California makes contributions to CalSTRS on behalf of the District. These payments consist of State General Fund contributions to CalSTRS in the amount of $2,595,071 (9.328 percent of annual payroll). Contributions are no longer appropriated in the annual Budget Act for the legislatively mandated benefits to CalPERS. Therefore, there is no on behalf contribution rate for CalPERS. Under accounting principles generally accepted in the United States of America, these amounts are to be reported as revenues and expenditures. Accordingly, these amounts have been recorded in these financial statements. On behalf payments have been included in the calculation of available reserves for the fiscal year ending June 30, 2018 and included in the budgeted amounts reported in the General Fund - Budgetary Comparison Schedule.
NOTE 14 - COMMITMENTS AND CONTINGENCIES
Grants
The District received financial assistance from Federal and State agencies in the form of grants. The disbursement of funds received under these programs generally requires compliance with terms and conditions specified in the grant agreements and are subject to audit by the grantor agencies. Any disallowed claims resulting from such audits could become a liability of the General Fund or other applicable funds. However, in the opinion of management, any such disallowed claims will not have a material adverse effect on the overall financial position of the District at June 30, 2018.
Litigation
The District is involved in various litigation arising from the normal course of business. In the opinion of management and legal counsel, the disposition of all litigation pending is not expected to have a material adverse effect on the overall financial position of the District at June 30, 2018.
HUNTINGTON BEACH CITY SCHOOL DISTRICT
NOTES TO FINANCIAL STATEMENTS JUNE 30, 2018
68
Construction Commitments
As of June 30, 2018, the District had the following commitments with respect to the unfinished capital projects:
Remaining Expected
Construction Date of
Capital Project Commitments Completion
Kettler District Education Center Renovation 6,433,188$ December 2018
Dwyer Middle School Modernization 5,369,954 October 2018
Dwyer Middle School New Gym and STEM Lab 13,096,281 October 2019
Hawes Elementary Modernization 5,558,298 June 2019
Moffett Elementary Modernization 5,441,575 April 2020
Security Fencing Various School Sites 939,549 June 201936,838,845$
NOTE 15 - PARTICIPATION IN PUBLIC ENTITY RISK POOLS AND JOINT POWER AUTHORITIES
The District is a member of the Western Protected Insurance Program for Schools Joint Powers Authority (PIPS), Southern California Regional Liability Excess Fund (SCR), Orange County Fringe Benefits (OCFB), and the Medical Eye Services (MES). The District pays an annual premium to the applicable entity for its health, dental, vision, workers' compensation, and property/liability coverage. The relationships between the District, the pools, and the JPAs are such that they are not component units of the District for financial reporting purposes.
These entities have budgeting and financial reporting requirements independent of member units and their financial statements are not presented in these financial statements; however, fund transactions between the entities and the District are included in these statements. Audited financial statements are generally available from the respective entities.
During the year ended June 30, 2018, the District made payments of $995,354 to PIPS, $403,839 to SCR, and $564,238 to OCFB, for workers' compensation, property and liability, excess liability, and dental insurance, and $76,098 to Medical Eye Services for vision insurance.
NOTE 16 - RESTATEMENT OF PRIOR YEAR NET POSITION
The District adopted GASB Statement No. 75, Accounting and Financial Reporting for Postemployment Benefits Other Than Pensions, in the current year. As a result, the effect on the current fiscal year is as follows:
Government-Wide Financial Statements
Net Position - Beginning (9,599,104)$
Inclusion of aggregate net OPEB liability from the adoption of GASB Statement No. 75 (2,840,634)
Inclusion of deferred outflows of resources from the adoption of GASB Statement No. 75 (260,323)
Net Position - Beginning, as restated (12,700,061)$
69
REQUIRED SUPPLEMENTARY INFORMATION
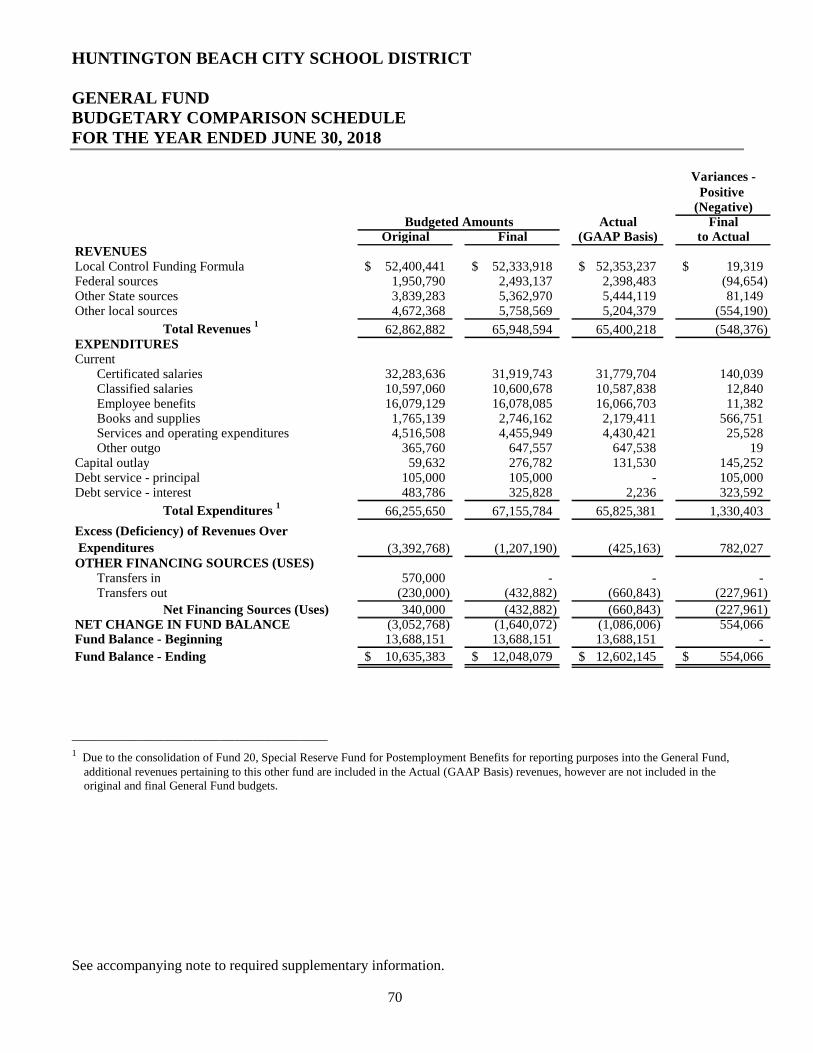
HUNTINGTON BEACH CITY SCHOOL DISTRICT
GENERAL FUND BUDGETARY COMPARISON SCHEDULE FOR THE YEAR ENDED JUNE 30, 2018
See accompanying note to required supplementary information.
70
Variances -Positive
(Negative)Actual Final
Original Final (GAAP Basis) to ActualREVENUESLocal Control Funding Formula 52,400,441$ 52,333,918$ 52,353,237$ 19,319$ Federal sources 1,950,790 2,493,137 2,398,483 (94,654)Other State sources 3,839,283 5,362,970 5,444,119 81,149Other local sources 4,672,368 5,758,569 5,204,379 (554,190)
Total Revenues 1 62,862,882 65,948,594 65,400,218 (548,376)EXPENDITURESCurrent
Certificated salaries 32,283,636 31,919,743 31,779,704 140,039Classified salaries 10,597,060 10,600,678 10,587,838 12,840Employee benefits 16,079,129 16,078,085 16,066,703 11,382Books and supplies 1,765,139 2,746,162 2,179,411 566,751Services and operating expenditures 4,516,508 4,455,949 4,430,421 25,528Other outgo 365,760 647,557 647,538 19
Capital outlay 59,632 276,782 131,530 145,252Debt service - principal 105,000 105,000 - 105,000Debt service - interest 483,786 325,828 2,236 323,592
Total Expenditures 1 66,255,650 67,155,784 65,825,381 1,330,403
Excess (Deficiency) of Revenues Over
Expenditures (3,392,768) (1,207,190) (425,163) 782,027OTHER FINANCING SOURCES (USES)
Transfers in 570,000 - - -Transfers out (230,000) (432,882) (660,843) (227,961)
Net Financing Sources (Uses) 340,000 (432,882) (660,843) (227,961)NET CHANGE IN FUND BALANCE (3,052,768) (1,640,072) (1,086,006) 554,066Fund Balance - Beginning 13,688,151 13,688,151 13,688,151 -
Fund Balance - Ending 10,635,383$ 12,048,079$ 12,602,145$ 554,066$
Budgeted Amounts
_______________________________________________________
1 Due to the consolidation of Fund 20, Special Reserve Fund for Postemployment Benefits for reporting purposes into the General Fund, additional revenues pertaining to this other fund are included in the Actual (GAAP Basis) revenues, however are not included in the original and final General Fund budgets.
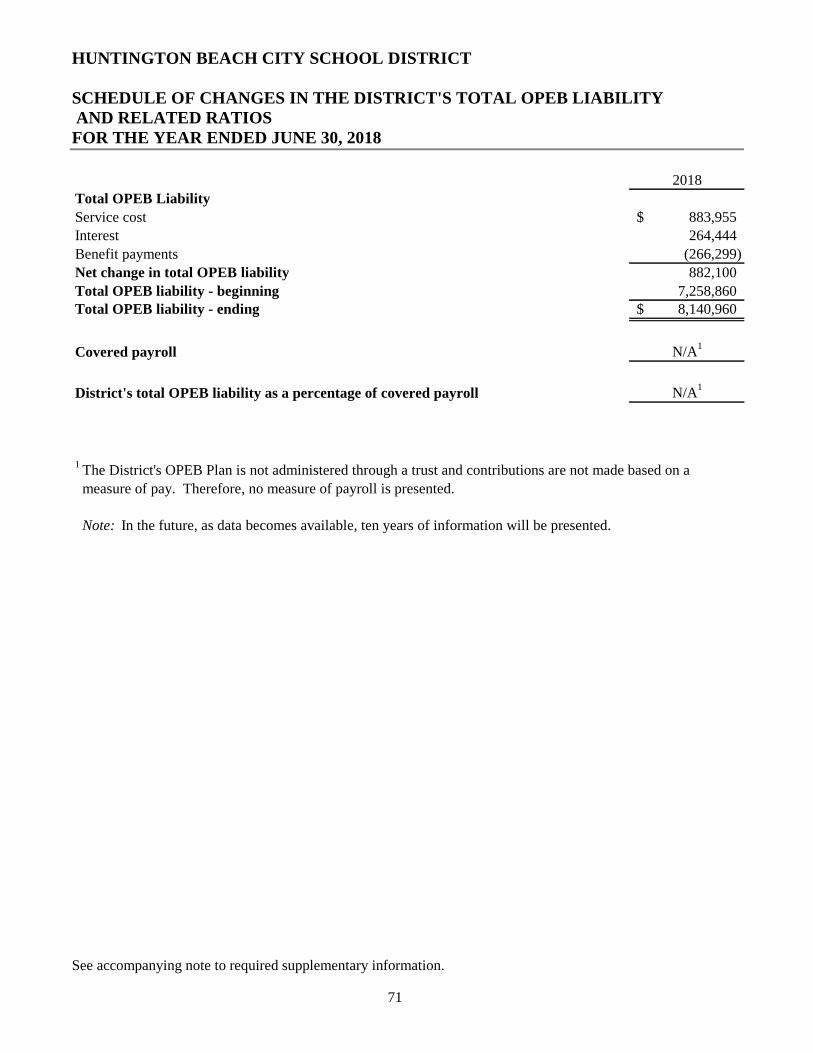
HUNTINGTON BEACH CITY SCHOOL DISTRICT
SCHEDULE OF CHANGES IN THE DISTRICT'S TOTAL OPEB LIABILITY AND RELATED RATIOS FOR THE YEAR ENDED JUNE 30, 2018
See accompanying note to required supplementary information.
71
2018
Total OPEB Liability
Service cost 883,955$
Interest 264,444
Benefit payments (266,299)
Net change in total OPEB liability 882,100
Total OPEB liability - beginning 7,258,860Total OPEB liability - ending 8,140,960$
Covered payroll N/A1
District's total OPEB liability as a percentage of covered payroll N/A1
Note: In the future, as data becomes available, ten years of information will be presented.
1 The District's OPEB Plan is not administered through a trust and contributions are not made based on a
measure of pay. Therefore, no measure of payroll is presented.
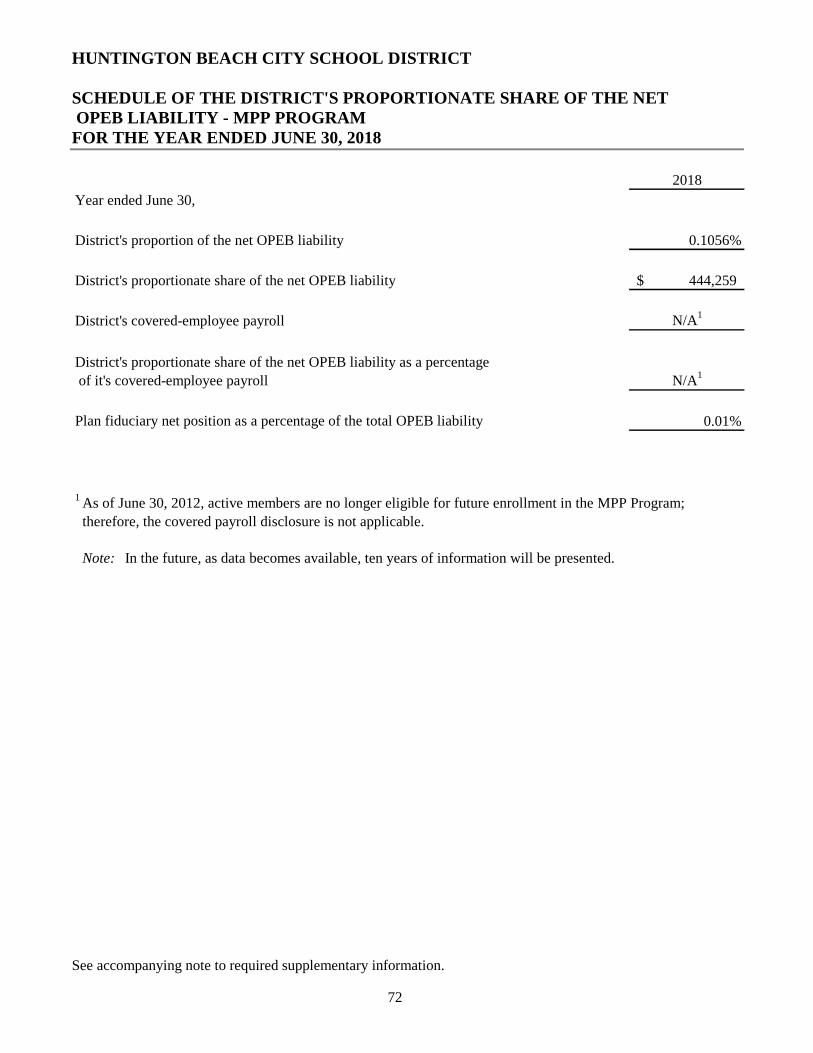
HUNTINGTON BEACH CITY SCHOOL DISTRICT
SCHEDULE OF THE DISTRICT'S PROPORTIONATE SHARE OF THE NET OPEB LIABILITY - MPP PROGRAM FOR THE YEAR ENDED JUNE 30, 2018
See accompanying note to required supplementary information.
72
2018
Year ended June 30,
District's proportion of the net OPEB liability 0.1056%
District's proportionate share of the net OPEB liability 444,259$
District's covered-employee payroll N/A1
District's proportionate share of the net OPEB liability as a percentage
of it's covered-employee payroll N/A1
Plan fiduciary net position as a percentage of the total OPEB liability 0.01%
Note: In the future, as data becomes available, ten years of information will be presented.
1 As of June 30, 2012, active members are no longer eligible for future enrollment in the MPP Program;
therefore, the covered payroll disclosure is not applicable.
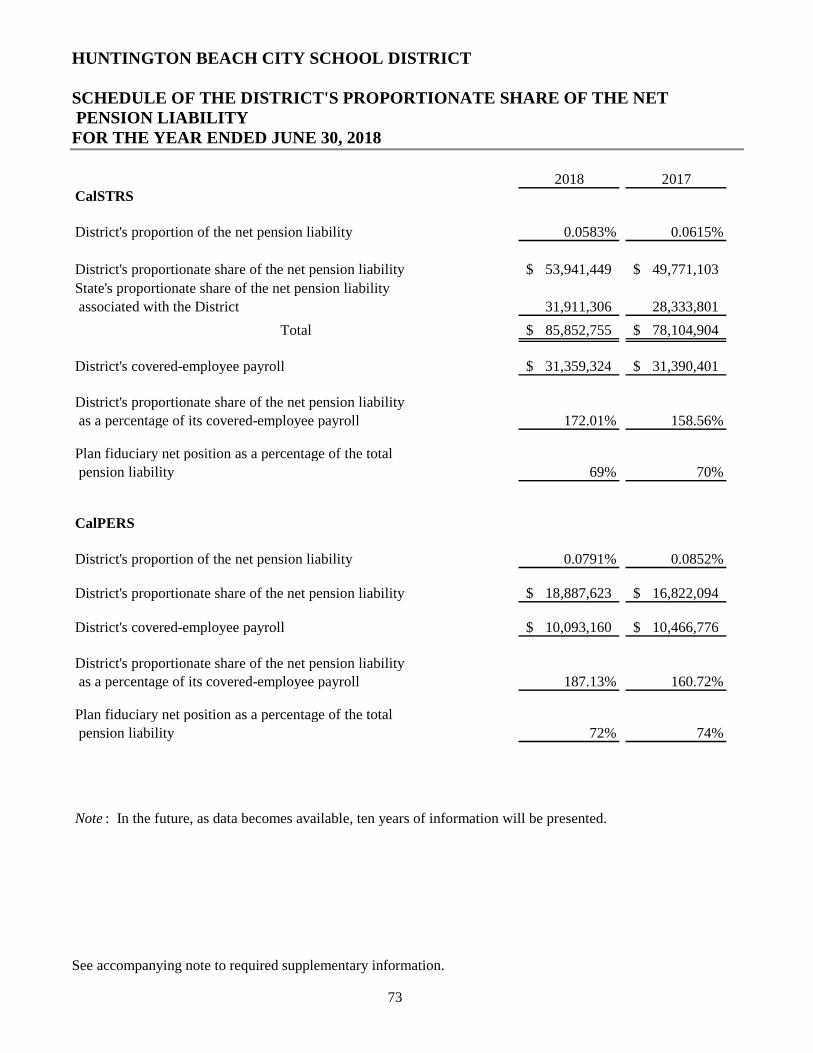
HUNTINGTON BEACH CITY SCHOOL DISTRICT
SCHEDULE OF THE DISTRICT'S PROPORTIONATE SHARE OF THE NET PENSION LIABILITY FOR THE YEAR ENDED JUNE 30, 2018
See accompanying note to required supplementary information.
73
2018 2017CalSTRS
District's proportion of the net pension liability 0.0583% 0.0615%
District's proportionate share of the net pension liability 53,941,449$ 49,771,103$
State's proportionate share of the net pension liability
associated with the District 31,911,306 28,333,801
Total 85,852,755$ 78,104,904$
District's covered-employee payroll 31,359,324$ 31,390,401$
District's proportionate share of the net pension liability
as a percentage of its covered-employee payroll 172.01% 158.56%
Plan fiduciary net position as a percentage of the total
pension liability 69% 70%
CalPERS
District's proportion of the net pension liability 0.0791% 0.0852%
District's proportionate share of the net pension liability 18,887,623$ 16,822,094$
District's covered-employee payroll 10,093,160$ 10,466,776$
District's proportionate share of the net pension liability
as a percentage of its covered-employee payroll 187.13% 160.72%
Plan fiduciary net position as a percentage of the total
pension liability 72% 74%
Note : In the future, as data becomes available, ten years of information will be presented.
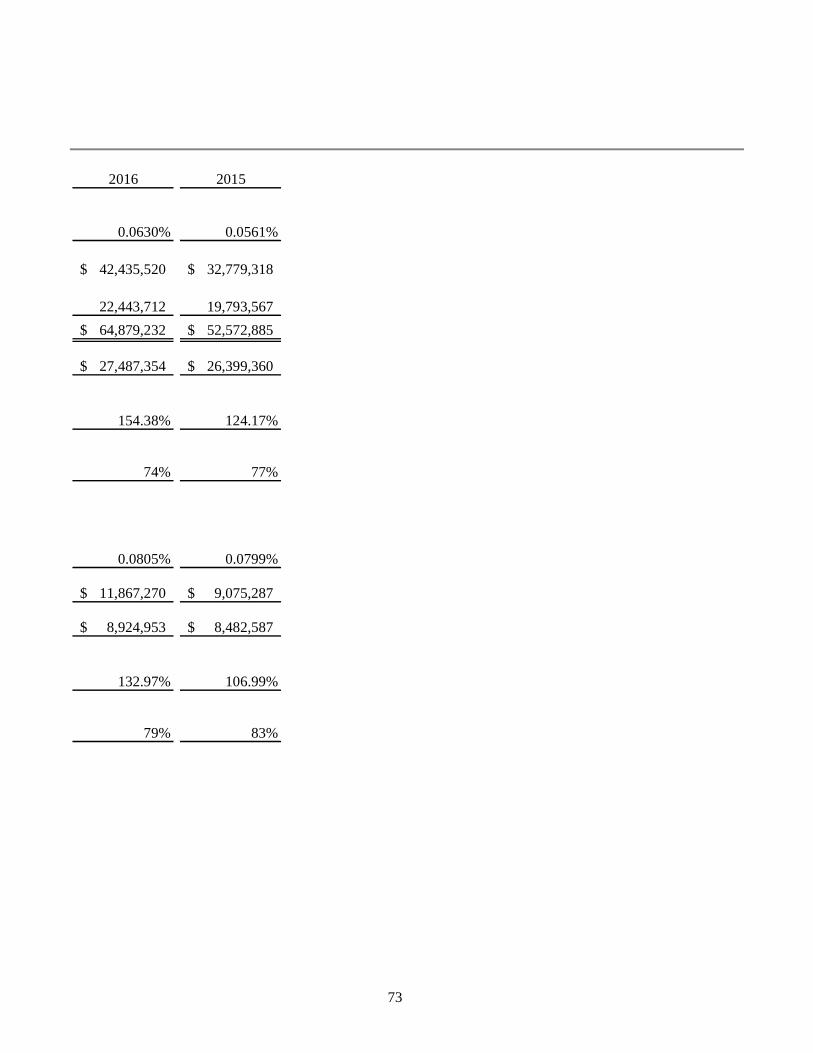
73
2016 2015
0.0630% 0.0561%
42,435,520$ 32,779,318$
22,443,712 19,793,567
64,879,232$ 52,572,885$
27,487,354$ 26,399,360$
154.38% 124.17%
74% 77%
0.0805% 0.0799%
11,867,270$ 9,075,287$
8,924,953$ 8,482,587$
132.97% 106.99%
79% 83%
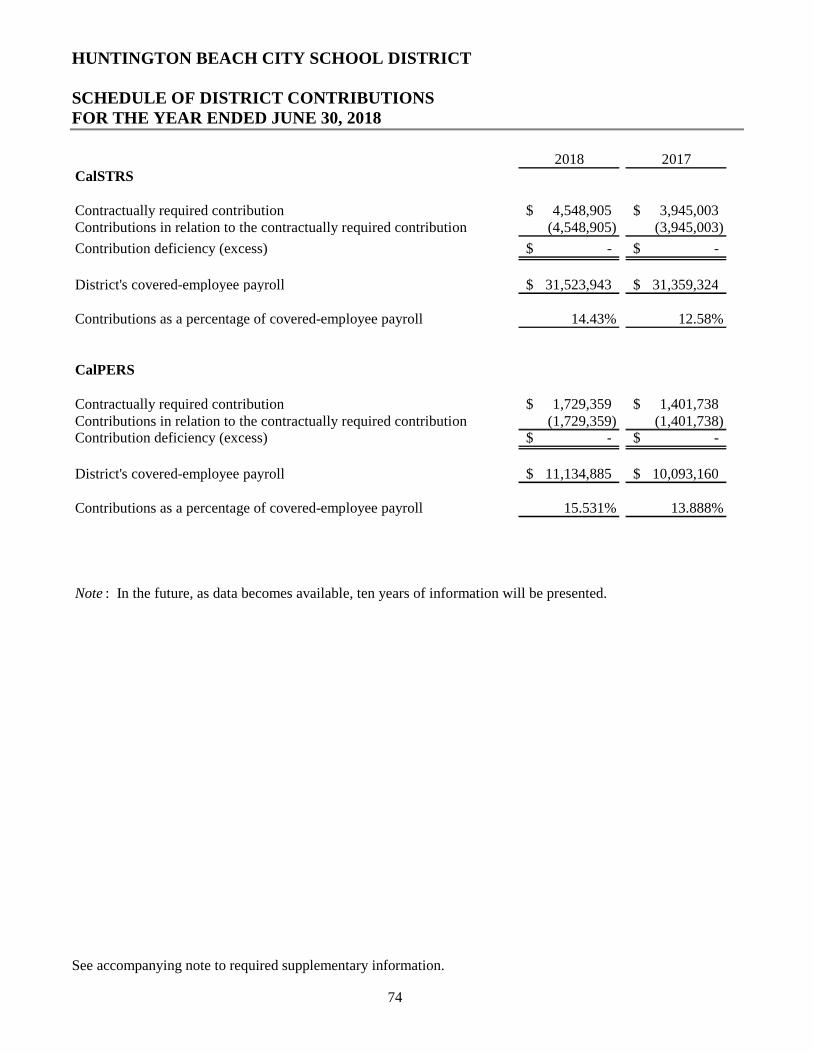
HUNTINGTON BEACH CITY SCHOOL DISTRICT
SCHEDULE OF DISTRICT CONTRIBUTIONS FOR THE YEAR ENDED JUNE 30, 2018
See accompanying note to required supplementary information.
74
2018 2017CalSTRS
Contractually required contribution 4,548,905$ 3,945,003$ Contributions in relation to the contractually required contribution (4,548,905) (3,945,003)
Contribution deficiency (excess) -$ -$
District's covered-employee payroll 31,523,943$ 31,359,324$
Contributions as a percentage of covered-employee payroll 14.43% 12.58%
CalPERS
Contractually required contribution 1,729,359$ 1,401,738$ Contributions in relation to the contractually required contribution (1,729,359) (1,401,738)Contribution deficiency (excess) -$ -$
District's covered-employee payroll 11,134,885$ 10,093,160$
Contributions as a percentage of covered-employee payroll 15.531% 13.888%
Note : In the future, as data becomes available, ten years of information will be presented.
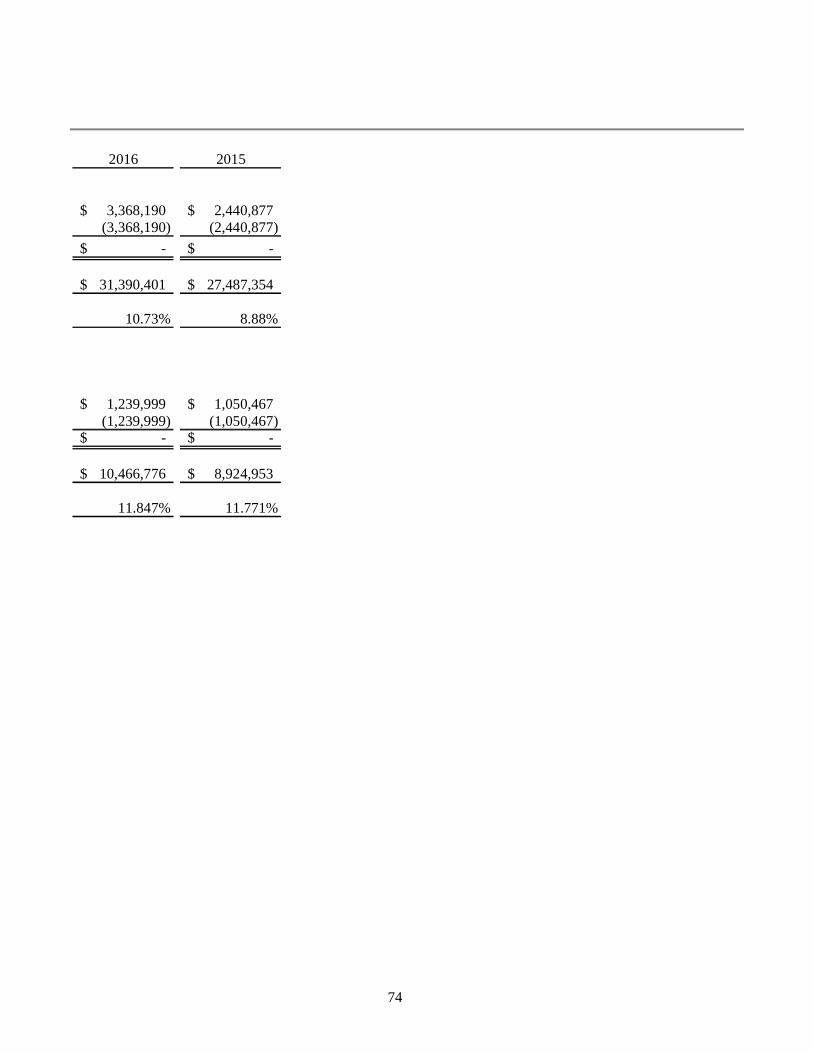
74
2016 2015
3,368,190$ 2,440,877$ (3,368,190) (2,440,877)
-$ -$
31,390,401$ 27,487,354$
10.73% 8.88%
1,239,999$ 1,050,467$ (1,239,999) (1,050,467)
-$ -$
10,466,776$ 8,924,953$
11.847% 11.771%
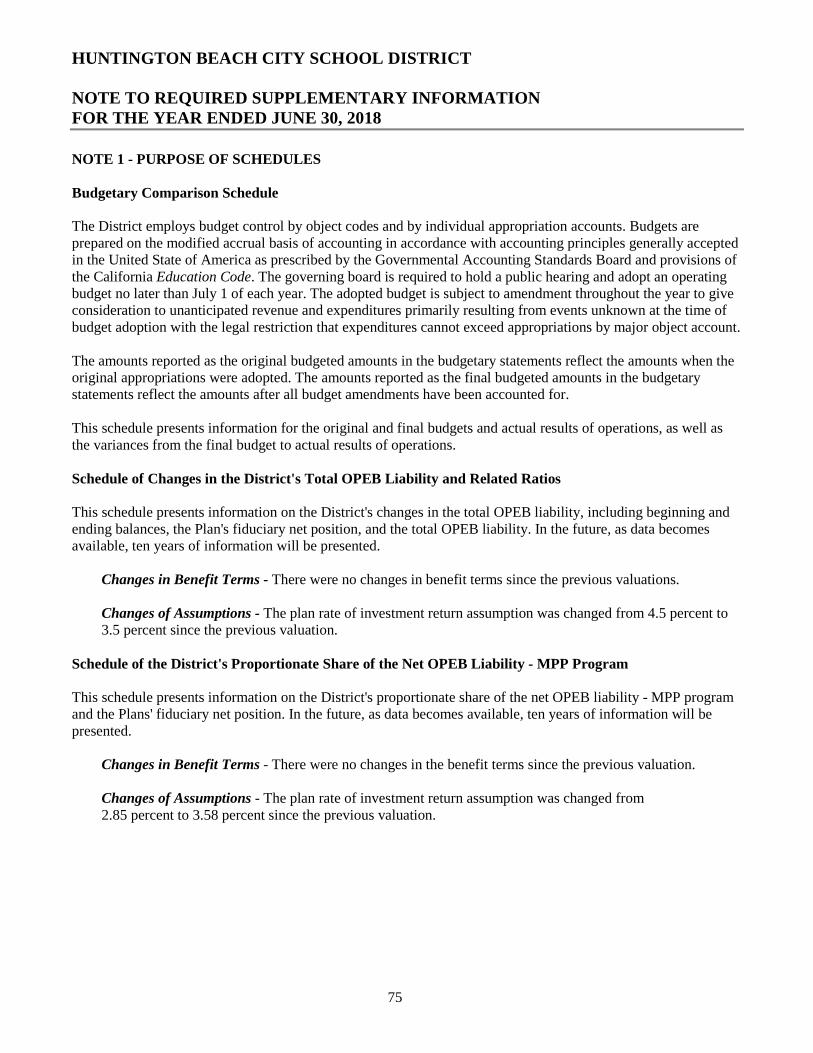
HUNTINGTON BEACH CITY SCHOOL DISTRICT
NOTE TO REQUIRED SUPPLEMENTARY INFORMATION FOR THE YEAR ENDED JUNE 30, 2018
75
NOTE 1 - PURPOSE OF SCHEDULES
Budgetary Comparison Schedule
The District employs budget control by object codes and by individual appropriation accounts. Budgets are prepared on the modified accrual basis of accounting in accordance with accounting principles generally accepted in the United State of America as prescribed by the Governmental Accounting Standards Board and provisions of the California Education Code. The governing board is required to hold a public hearing and adopt an operating budget no later than July 1 of each year. The adopted budget is subject to amendment throughout the year to give consideration to unanticipated revenue and expenditures primarily resulting from events unknown at the time of budget adoption with the legal restriction that expenditures cannot exceed appropriations by major object account.
The amounts reported as the original budgeted amounts in the budgetary statements reflect the amounts when the original appropriations were adopted. The amounts reported as the final budgeted amounts in the budgetary statements reflect the amounts after all budget amendments have been accounted for.
This schedule presents information for the original and final budgets and actual results of operations, as well as the variances from the final budget to actual results of operations.
Schedule of Changes in the District's Total OPEB Liability and Related Ratios
This schedule presents information on the District's changes in the total OPEB liability, including beginning and ending balances, the Plan's fiduciary net position, and the total OPEB liability. In the future, as data becomes available, ten years of information will be presented.
Changes in Benefit Terms - There were no changes in benefit terms since the previous valuations.
Changes of Assumptions - The plan rate of investment return assumption was changed from 4.5 percent to 3.5 percent since the previous valuation.
Schedule of the District's Proportionate Share of the Net OPEB Liability - MPP Program
This schedule presents information on the District's proportionate share of the net OPEB liability - MPP program and the Plans' fiduciary net position. In the future, as data becomes available, ten years of information will be presented.
Changes in Benefit Terms - There were no changes in the benefit terms since the previous valuation.
Changes of Assumptions - The plan rate of investment return assumption was changed from 2.85 percent to 3.58 percent since the previous valuation.
HUNTINGTON BEACH CITY SCHOOL DISTRICT
NOTE TO REQUIRED SUPPLEMENTARY INFORMATION FOR THE YEAR ENDED JUNE 30, 2018
76
Schedule of the District's Proportionate Share of the Net Pension Liability
This schedule presents information on the District's proportionate share of the net pension liability (NPL), the Plans' fiduciary net position and, when applicable, the State's proportionate share of the NPL associated with the District. In the future, as data becomes available, ten years of information will be presented.
Changes in Benefit Terms - There were no changes in benefit terms since the previous valuations for both CalSTRS and CalPERS.
Changes of Assumptions - The CalSTRS plan rate of investment return assumption was changed from 7.60 percent to 7.10 percent since the previous valuation. The CalPERS plan rate of investment return assumption was changed from 7.65 percent to 7.15 percent since the previous valuation.
Schedule of District Contributions
This schedule presents information on the District's required contribution, the amounts actually contributed, and any excess or deficiency related to the required contribution. In the future, as data becomes available, ten years of information will be presented.
77
SUPPLEMENTARY INFORMATION
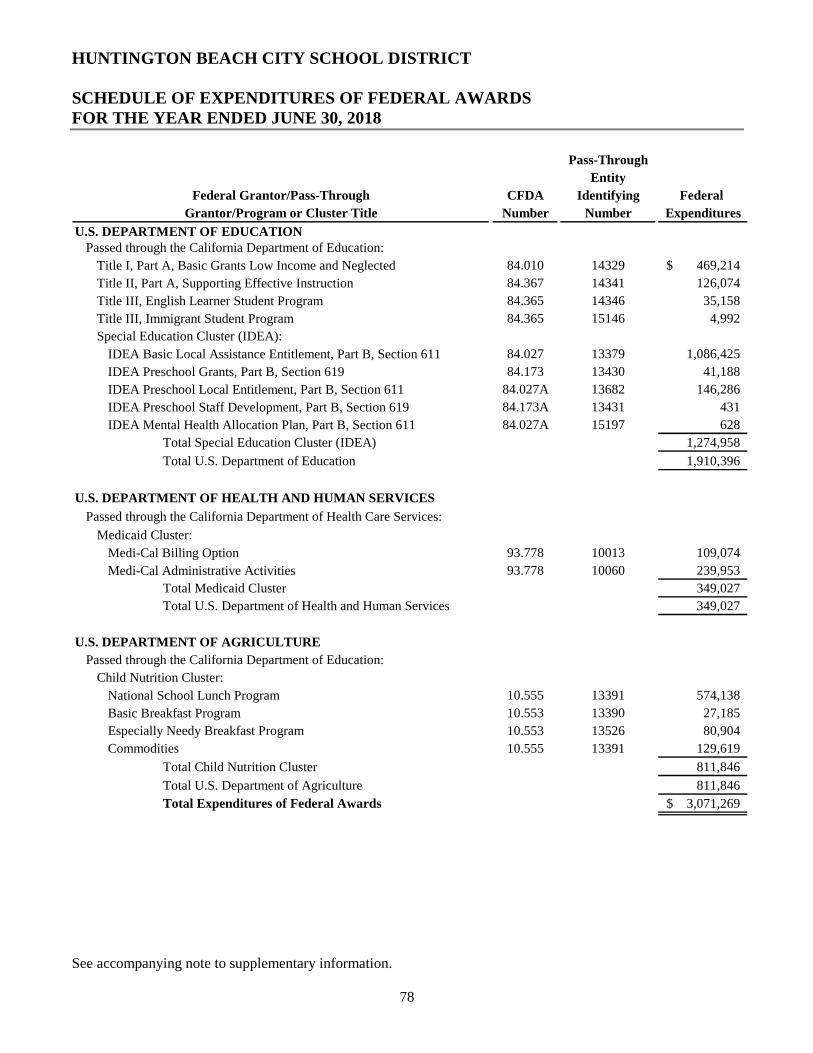
HUNTINGTON BEACH CITY SCHOOL DISTRICT
See accompanying note to supplementary information.
78
SCHEDULE OF EXPENDITURES OF FEDERAL AWARDS FOR THE YEAR ENDED JUNE 30, 2018
Pass-Through
Entity
Federal Grantor/Pass-Through CFDA Identifying Federal
Grantor/Program or Cluster Title Number Number Expenditures
U.S. DEPARTMENT OF EDUCATIONPassed through the California Department of Education:
Title I, Part A, Basic Grants Low Income and Neglected 84.010 14329 469,214$
Title II, Part A, Supporting Effective Instruction 84.367 14341 126,074
Title III, English Learner Student Program 84.365 14346 35,158
Title III, Immigrant Student Program 84.365 15146 4,992
Special Education Cluster (IDEA):
IDEA Basic Local Assistance Entitlement, Part B, Section 611 84.027 13379 1,086,425
IDEA Preschool Grants, Part B, Section 619 84.173 13430 41,188
IDEA Preschool Local Entitlement, Part B, Section 611 84.027A 13682 146,286
IDEA Preschool Staff Development, Part B, Section 619 84.173A 13431 431
IDEA Mental Health Allocation Plan, Part B, Section 611 84.027A 15197 628
Total Special Education Cluster (IDEA) 1,274,958
Total U.S. Department of Education 1,910,396
U.S. DEPARTMENT OF HEALTH AND HUMAN SERVICES
Passed through the California Department of Health Care Services:
Medicaid Cluster:
Medi-Cal Billing Option 93.778 10013 109,074
Medi-Cal Administrative Activities 93.778 10060 239,953
Total Medicaid Cluster 349,027
Total U.S. Department of Health and Human Services 349,027
U.S. DEPARTMENT OF AGRICULTURE
Passed through the California Department of Education:
Child Nutrition Cluster:
National School Lunch Program 10.555 13391 574,138
Basic Breakfast Program 10.553 13390 27,185
Especially Needy Breakfast Program 10.553 13526 80,904
Commodities 10.555 13391 129,619
Total Child Nutrition Cluster 811,846
Total U.S. Department of Agriculture 811,846
Total Expenditures of Federal Awards 3,071,269$

HUNTINGTON BEACH CITY SCHOOL DISTRICT
See accompanying note to supplementary information.
79
LOCAL EDUCATION AGENCY ORGANIZATION STRUCTURE JUNE 30, 2018
ORGANIZATION
The Huntington Beach School District was established in 1905 and consists of an area comprising approximately 14 square miles. The District operates seven elementary schools and two middle schools. There were no boundary changes during the year.
GOVERNING BOARD
MEMBER OFFICE TERM EXPIRES
Rosemary Saylor President 2018
Shari Kowalke Vice President 2018
Ann Sullivan Clerk 2020
Bridget Kaub Member 2020
Paul Morrow, Ed. D Member 2018
ADMINISTRATION
Gregory Haulk Superintendent
Jennifer Shepard Assistant Superintendent, Educational Services
Jon M. Archibald Assistant Superintendent, Administrative Services
Patricia Hager Assistant Superintendent, Human Resources
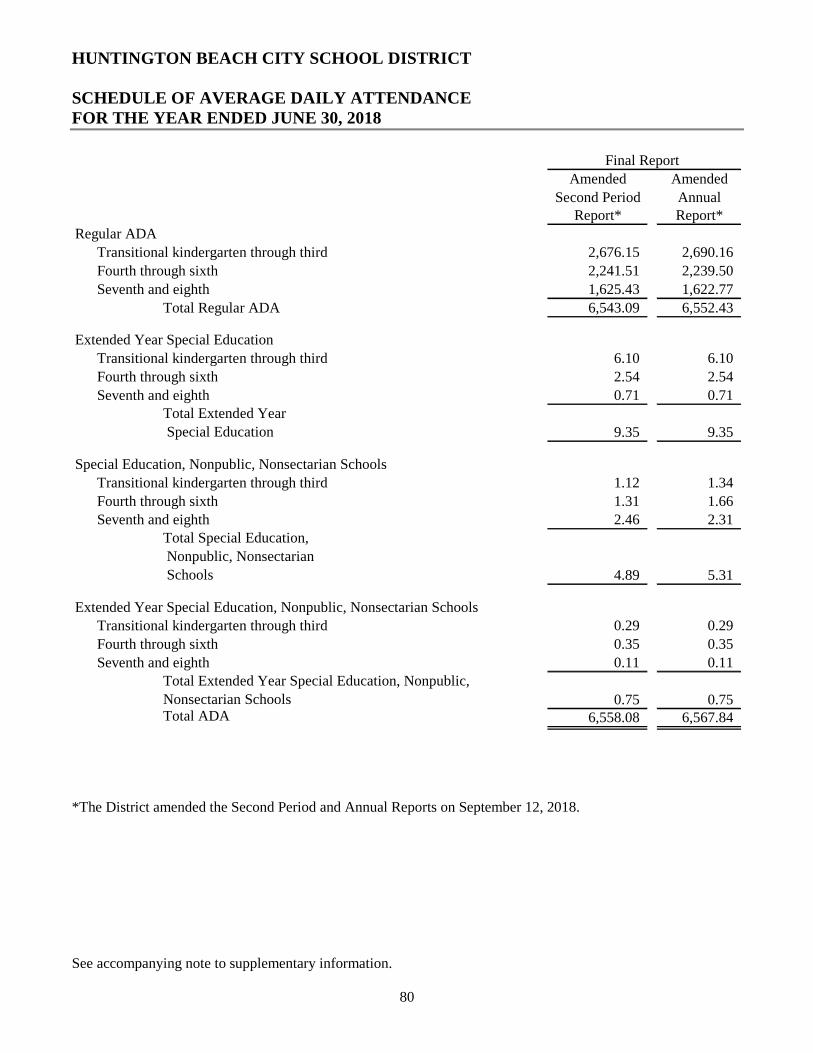
HUNTINGTON BEACH CITY SCHOOL DISTRICT
See accompanying note to supplementary information.
80
SCHEDULE OF AVERAGE DAILY ATTENDANCE FOR THE YEAR ENDED JUNE 30, 2018
Final Report
Amended Amended
Second Period AnnualReport* Report*
Regular ADA
Transitional kindergarten through third 2,676.15 2,690.16
Fourth through sixth 2,241.51 2,239.50
Seventh and eighth 1,625.43 1,622.77
Total Regular ADA 6,543.09 6,552.43
Extended Year Special Education
Transitional kindergarten through third 6.10 6.10
Fourth through sixth 2.54 2.54
Seventh and eighth 0.71 0.71Total Extended Year
Special Education 9.35 9.35
Special Education, Nonpublic, Nonsectarian Schools
Transitional kindergarten through third 1.12 1.34
Fourth through sixth 1.31 1.66
Seventh and eighth 2.46 2.31Total Special Education,
Nonpublic, Nonsectarian
Schools 4.89 5.31
Extended Year Special Education, Nonpublic, Nonsectarian Schools
Transitional kindergarten through third 0.29 0.29
Fourth through sixth 0.35 0.35
Seventh and eighth 0.11 0.11Total Extended Year Special Education, Nonpublic,
Nonsectarian Schools 0.75 0.75Total ADA 6,558.08 6,567.84
*The District amended the Second Period and Annual Reports on September 12, 2018.
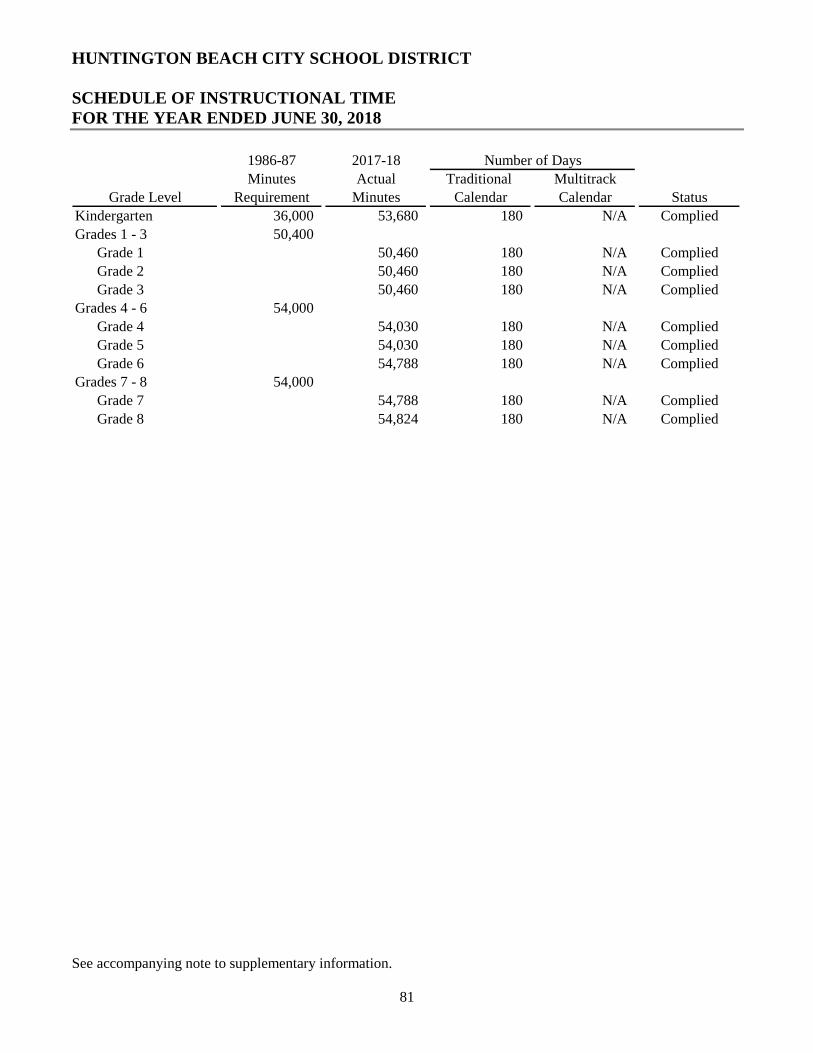
HUNTINGTON BEACH CITY SCHOOL DISTRICT
See accompanying note to supplementary information.
81
SCHEDULE OF INSTRUCTIONAL TIME FOR THE YEAR ENDED JUNE 30, 2018
1986-87 2017-18 Number of Days
Minutes Actual Traditional Multitrack
Grade Level Requirement Minutes Calendar Calendar Status
Kindergarten 36,000 53,680 180 N/A Complied
Grades 1 - 3 50,400
Grade 1 50,460 180 N/A Complied
Grade 2 50,460 180 N/A Complied
Grade 3 50,460 180 N/A Complied
Grades 4 - 6 54,000
Grade 4 54,030 180 N/A Complied
Grade 5 54,030 180 N/A Complied
Grade 6 54,788 180 N/A Complied
Grades 7 - 8 54,000
Grade 7 54,788 180 N/A Complied
Grade 8 54,824 180 N/A Complied
HUNTINGTON BEACH CITY SCHOOL DISTRICT
See accompanying note to supplementary information.
82
RECONCILIATION OF ANNUAL FINANCIAL AND BUDGET REPORT WITH AUDITED FINANCIAL STATEMENTS FOR THE YEAR ENDED JUNE 30, 2018
There were no adjustments to the Unaudited Actual Financial Report, which required reconciliation to the audited financial statements at June 30, 2018.
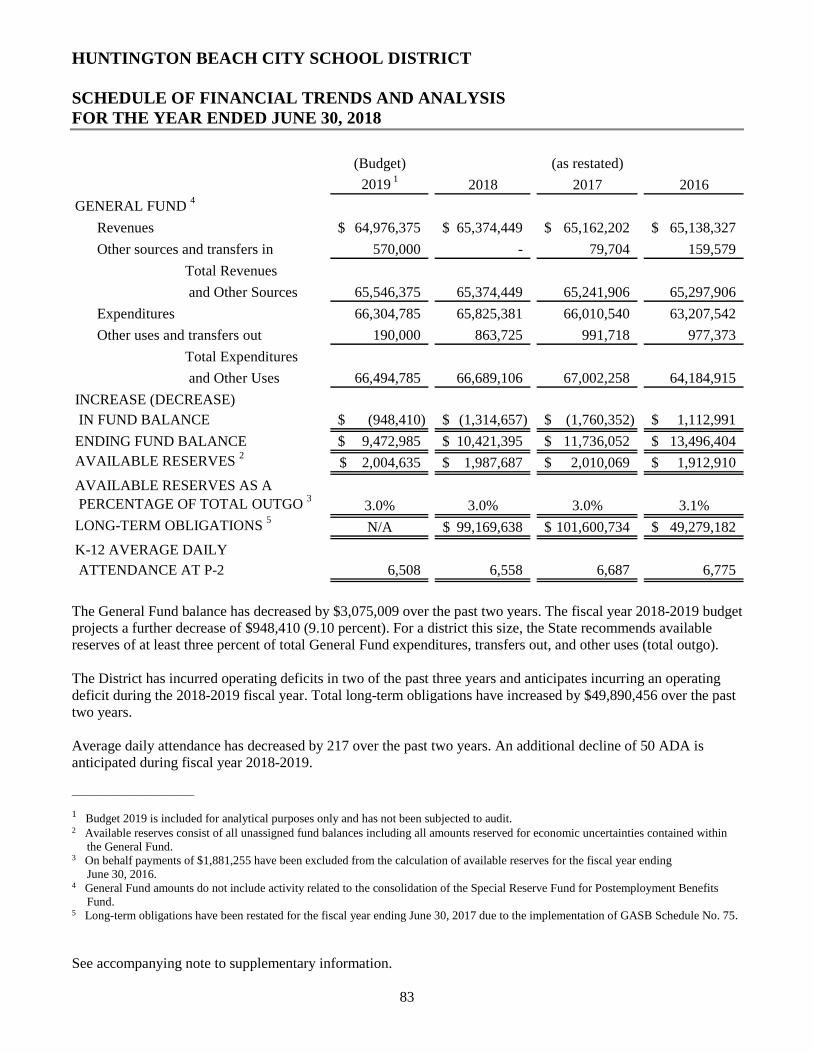
HUNTINGTON BEACH CITY SCHOOL DISTRICT
See accompanying note to supplementary information.
83
SCHEDULE OF FINANCIAL TRENDS AND ANALYSIS FOR THE YEAR ENDED JUNE 30, 2018
(Budget) (as restated)
2019 12018 2017 2016
GENERAL FUND 4
Revenues 64,976,375$ 65,374,449$ 65,162,202$ 65,138,327$
Other sources and transfers in 570,000 - 79,704 159,579
Total Revenues
and Other Sources 65,546,375 65,374,449 65,241,906 65,297,906
Expenditures 66,304,785 65,825,381 66,010,540 63,207,542
Other uses and transfers out 190,000 863,725 991,718 977,373
Total Expenditures
and Other Uses 66,494,785 66,689,106 67,002,258 64,184,915
INCREASE (DECREASE)
IN FUND BALANCE (948,410)$ (1,314,657)$ (1,760,352)$ 1,112,991$
ENDING FUND BALANCE 9,472,985$ 10,421,395$ 11,736,052$ 13,496,404$
AVAILABLE RESERVES 2
2,004,635$ 1,987,687$ 2,010,069$ 1,912,910$
AVAILABLE RESERVES AS A
PERCENTAGE OF TOTAL OUTGO 3
3.0% 3.0% 3.0% 3.1%
LONG-TERM OBLIGATIONS 5
N/A 99,169,638$ 101,600,734$ 49,279,182$
K-12 AVERAGE DAILY
ATTENDANCE AT P-2 6,508 6,558 6,687 6,775
The General Fund balance has decreased by $3,075,009 over the past two years. The fiscal year 2018-2019 budget projects a further decrease of $948,410 (9.10 percent). For a district this size, the State recommends available reserves of at least three percent of total General Fund expenditures, transfers out, and other uses (total outgo).
The District has incurred operating deficits in two of the past three years and anticipates incurring an operating deficit during the 2018-2019 fiscal year. Total long-term obligations have increased by $49,890,456 over the past two years.
Average daily attendance has decreased by 217 over the past two years. An additional decline of 50 ADA is anticipated during fiscal year 2018-2019.
_______________________
1 Budget 2019 is included for analytical purposes only and has not been subjected to audit. 2 Available reserves consist of all unassigned fund balances including all amounts reserved for economic uncertainties contained within
the General Fund. 3 On behalf payments of $1,881,255 have been excluded from the calculation of available reserves for the fiscal year ending
June 30, 2016. 4 General Fund amounts do not include activity related to the consolidation of the Special Reserve Fund for Postemployment Benefits
Fund. 5 Long-term obligations have been restated for the fiscal year ending June 30, 2017 due to the implementation of GASB Schedule No. 75.
HUNTINGTON BEACH CITY SCHOOL DISTRICT
See accompanying note to supplementary information.
84
SCHEDULE OF CHARTER SCHOOLS FOR THE YEAR ENDED JUNE 30, 2018
Name of Charter School Included in Audit Report
Kinetic Academy (1812) No
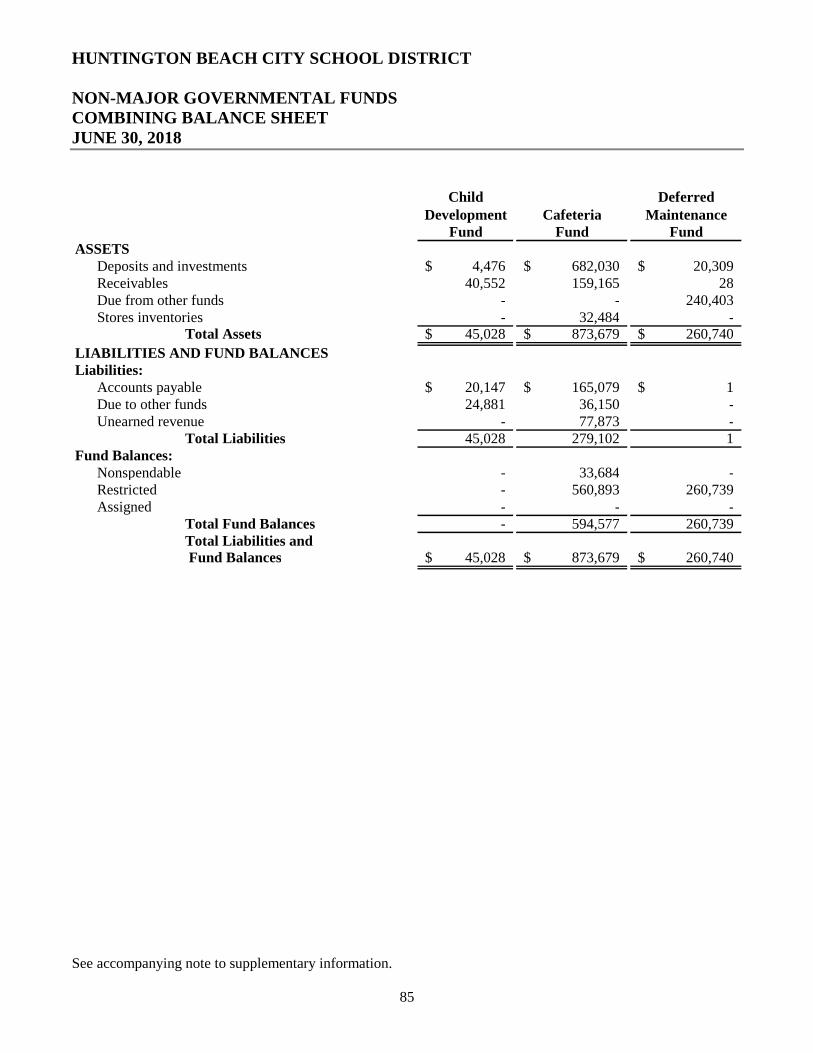
HUNTINGTON BEACH CITY SCHOOL DISTRICT
See accompanying note to supplementary information.
85
NON-MAJOR GOVERNMENTAL FUNDS COMBINING BALANCE SHEET JUNE 30, 2018
Child DeferredDevelopment Cafeteria Maintenance
Fund Fund FundASSETS
Deposits and investments 4,476$ 682,030$ 20,309$ Receivables 40,552 159,165 28Due from other funds - - 240,403Stores inventories - 32,484 -
Total Assets 45,028$ 873,679$ 260,740$
LIABILITIES AND FUND BALANCESLiabilities:
Accounts payable 20,147$ 165,079$ 1$ Due to other funds 24,881 36,150 -Unearned revenue - 77,873 -
Total Liabilities 45,028 279,102 1Fund Balances:
Nonspendable - 33,684 -Restricted - 560,893 260,739Assigned - - -
Total Fund Balances - 594,577 260,739Total Liabilities and Fund Balances 45,028$ 873,679$ 260,740$
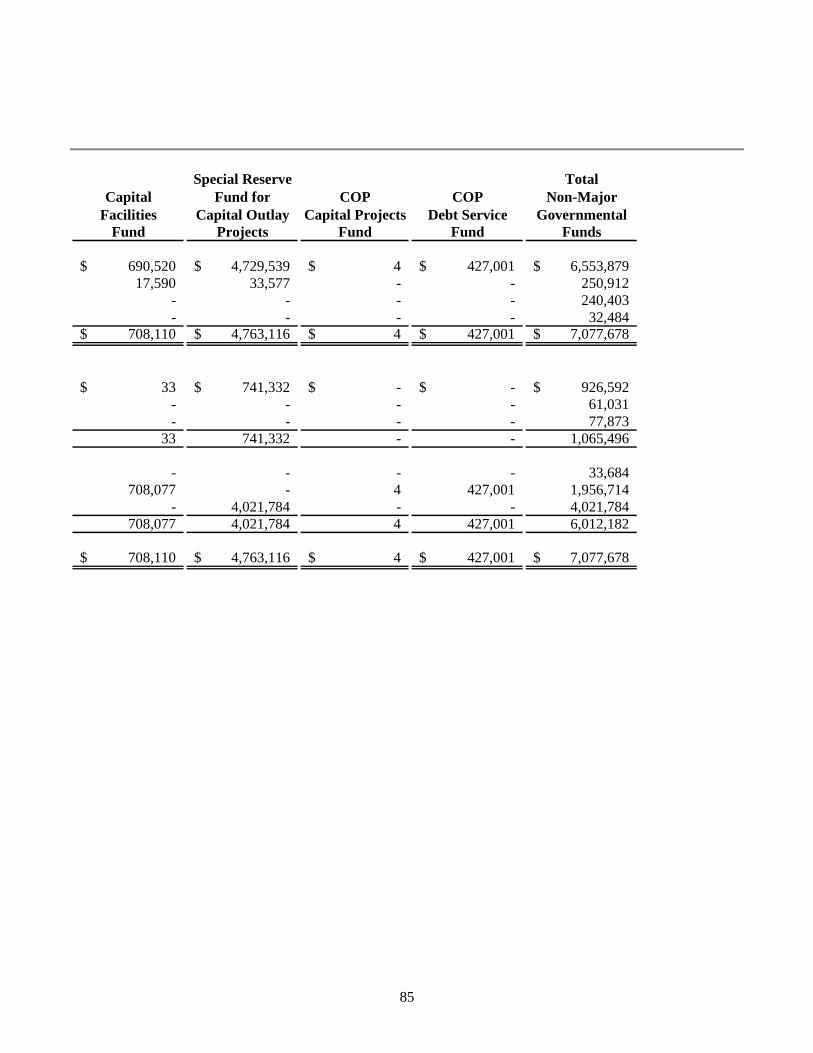
85
Special Reserve TotalCapital Fund for COP COP Non-Major
Facilities Capital Outlay Capital Projects Debt Service GovernmentalFund Projects Fund Fund Funds
690,520$ 4,729,539$ 4$ 427,001$ 6,553,879$ 17,590 33,577 - - 250,912
- - - - 240,403- - - - 32,484
708,110$ 4,763,116$ 4$ 427,001$ 7,077,678$
33$ 741,332$ -$ -$ 926,592$ - - - - 61,031- - - - 77,873
33 741,332 - - 1,065,496
- - - - 33,684708,077 - 4 427,001 1,956,714
- 4,021,784 - - 4,021,784708,077 4,021,784 4 427,001 6,012,182
708,110$ 4,763,116$ 4$ 427,001$ 7,077,678$
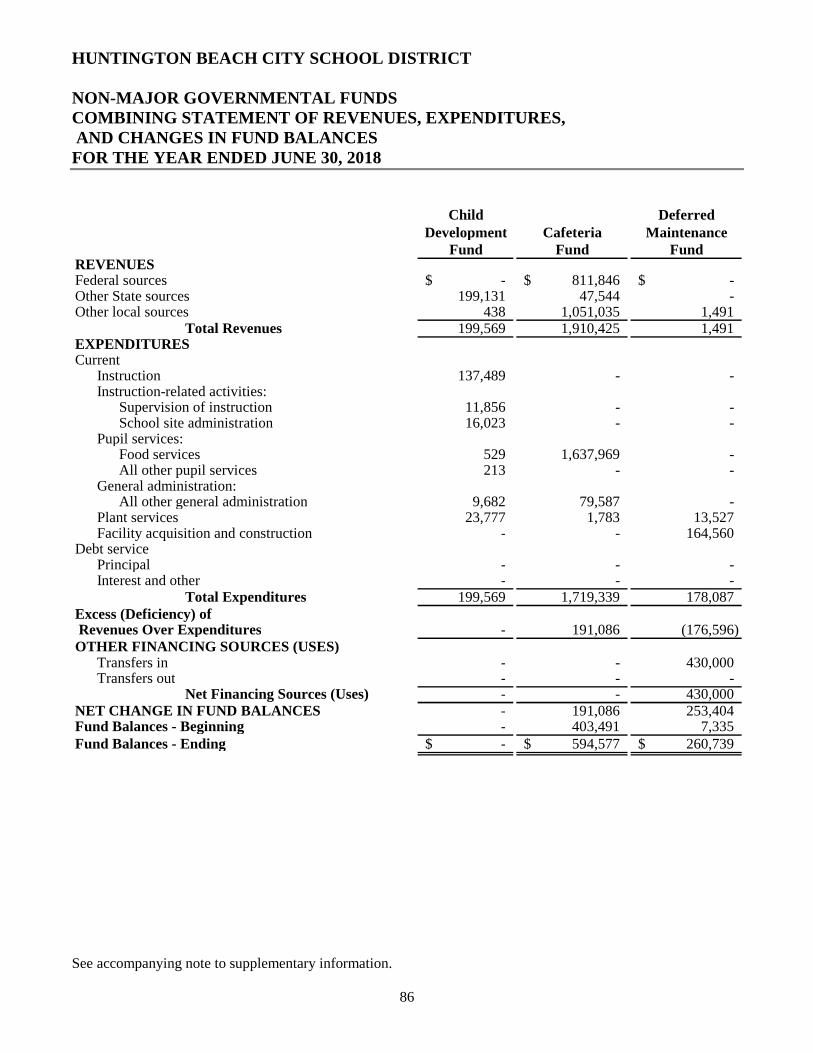
HUNTINGTON BEACH CITY SCHOOL DISTRICT
See accompanying note to supplementary information.
86
NON-MAJOR GOVERNMENTAL FUNDS COMBINING STATEMENT OF REVENUES, EXPENDITURES, AND CHANGES IN FUND BALANCES FOR THE YEAR ENDED JUNE 30, 2018
Child DeferredDevelopment Cafeteria Maintenance
Fund Fund FundREVENUESFederal sources -$ 811,846$ -$ Other State sources 199,131 47,544 -Other local sources 438 1,051,035 1,491
Total Revenues 199,569 1,910,425 1,491EXPENDITURESCurrent
Instruction 137,489 - -Instruction-related activities:
Supervision of instruction 11,856 - -School site administration 16,023 - -
Pupil services:Food services 529 1,637,969 -All other pupil services 213 - -
General administration:All other general administration 9,682 79,587 -
Plant services 23,777 1,783 13,527Facility acquisition and construction - - 164,560
Debt servicePrincipal - - -Interest and other - - -
Total Expenditures 199,569 1,719,339 178,087Excess (Deficiency) of Revenues Over Expenditures - 191,086 (176,596)OTHER FINANCING SOURCES (USES)
Transfers in - - 430,000Transfers out - - -
Net Financing Sources (Uses) - - 430,000NET CHANGE IN FUND BALANCES - 191,086 253,404Fund Balances - Beginning - 403,491 7,335Fund Balances - Ending -$ 594,577$ 260,739$
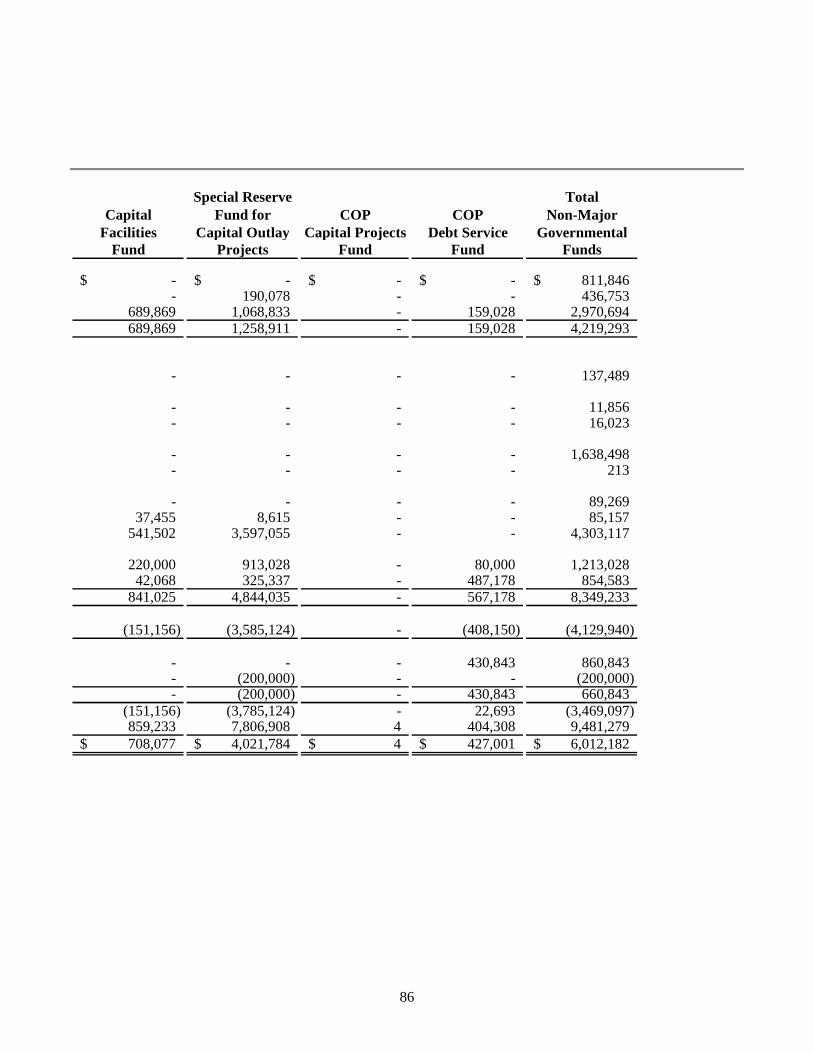
86
Special Reserve TotalCapital Fund for COP COP Non-Major
Facilities Capital Outlay Capital Projects Debt Service GovernmentalFund Projects Fund Fund Funds
-$ -$ -$ -$ 811,846$ - 190,078 - - 436,753
689,869 1,068,833 - 159,028 2,970,694689,869 1,258,911 - 159,028 4,219,293
- - - - 137,489
- - - - 11,856- - - - 16,023
- - - - 1,638,498- - - - 213
- - - - 89,26937,455 8,615 - - 85,157
541,502 3,597,055 - - 4,303,117
220,000 913,028 - 80,000 1,213,02842,068 325,337 - 487,178 854,583
841,025 4,844,035 - 567,178 8,349,233
(151,156) (3,585,124) - (408,150) (4,129,940)
- - - 430,843 860,843- (200,000) - - (200,000)- (200,000) - 430,843 660,843
(151,156) (3,785,124) - 22,693 (3,469,097)859,233 7,806,908 4 404,308 9,481,279708,077$ 4,021,784$ 4$ 427,001$ 6,012,182$
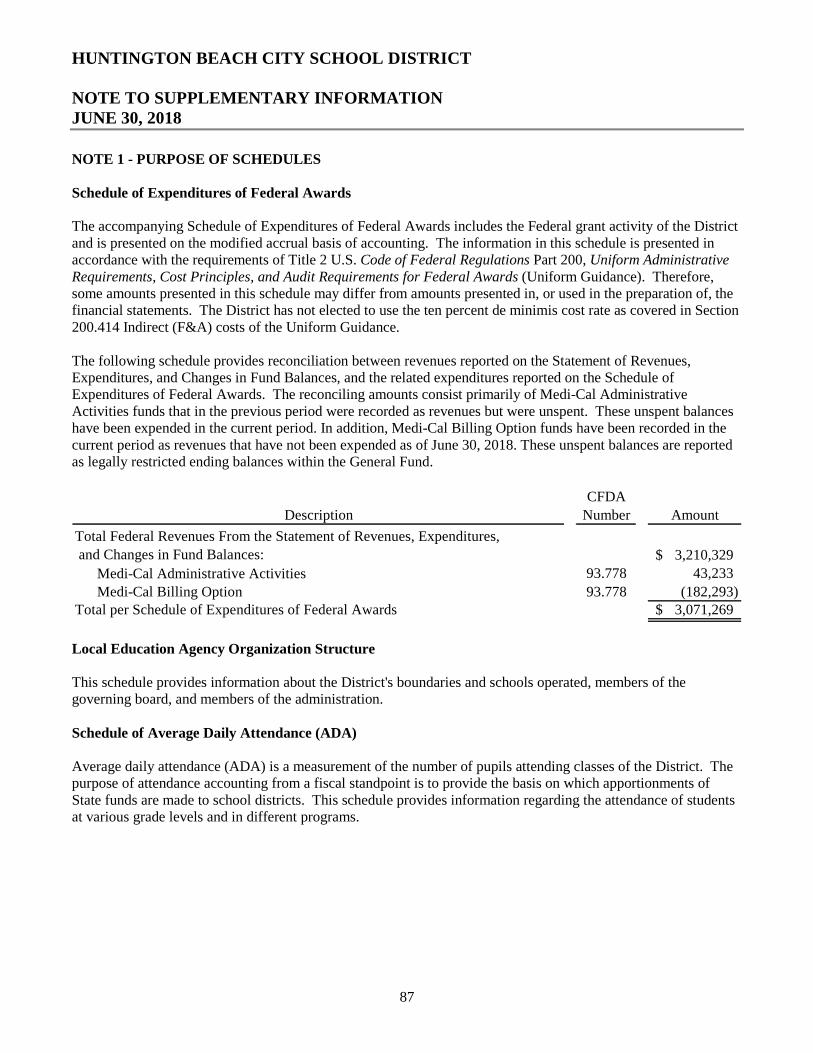
HUNTINGTON BEACH CITY SCHOOL DISTRICT
87
NOTE TO SUPPLEMENTARY INFORMATION JUNE 30, 2018
NOTE 1 - PURPOSE OF SCHEDULES
Schedule of Expenditures of Federal Awards
The accompanying Schedule of Expenditures of Federal Awards includes the Federal grant activity of the District and is presented on the modified accrual basis of accounting. The information in this schedule is presented in accordance with the requirements of Title 2 U.S. Code of Federal Regulations Part 200, Uniform Administrative Requirements, Cost Principles, and Audit Requirements for Federal Awards (Uniform Guidance). Therefore, some amounts presented in this schedule may differ from amounts presented in, or used in the preparation of, the financial statements. The District has not elected to use the ten percent de minimis cost rate as covered in Section 200.414 Indirect (F&A) costs of the Uniform Guidance.
The following schedule provides reconciliation between revenues reported on the Statement of Revenues, Expenditures, and Changes in Fund Balances, and the related expenditures reported on the Schedule of Expenditures of Federal Awards. The reconciling amounts consist primarily of Medi-Cal Administrative Activities funds that in the previous period were recorded as revenues but were unspent. These unspent balances have been expended in the current period. In addition, Medi-Cal Billing Option funds have been recorded in the current period as revenues that have not been expended as of June 30, 2018. These unspent balances are reported as legally restricted ending balances within the General Fund.
CFDA
Description Number Amount
Total Federal Revenues From the Statement of Revenues, Expenditures,
and Changes in Fund Balances: 3,210,329$
Medi-Cal Administrative Activities 93.778 43,233
Medi-Cal Billing Option 93.778 (182,293)Total per Schedule of Expenditures of Federal Awards 3,071,269$
Local Education Agency Organization Structure
This schedule provides information about the District's boundaries and schools operated, members of the governing board, and members of the administration.
Schedule of Average Daily Attendance (ADA)
Average daily attendance (ADA) is a measurement of the number of pupils attending classes of the District. The purpose of attendance accounting from a fiscal standpoint is to provide the basis on which apportionments of State funds are made to school districts. This schedule provides information regarding the attendance of students at various grade levels and in different programs.
HUNTINGTON BEACH CITY SCHOOL DISTRICT
88
NOTE TO SUPPLEMENTARY INFORMATION JUNE 30, 2018
Schedule of Instructional Time
The District has received incentive funding for increasing instructional time as provided by the Incentives for Longer Instructional Day. The District neither met nor exceeded its target funding. This schedule presents information on the amount of instructional time offered by the District and whether the District complied with the provisions of Education Code Sections 46200 through 46206.
Districts must maintain their instructional minutes at the 1986-87 requirements, as required by Education CodeSection 46201.
Reconciliation of Annual Financial and Budget Report with Audited Financial Statements
This schedule provides the information necessary to reconcile the fund balance of all funds reported on the Unaudited Annual Financial Report to the audited financial statements.
Schedule of Financial Trends and Analysis
This schedule discloses the District's financial trends by displaying past years' data along with current year budget information. These financial trend disclosures are used to evaluate the District's ability to continue as a going concern for a reasonable period of time.
Schedule of Charter Schools
This schedule lists all Charter Schools chartered by the District, and displays information for each Charter School on whether or not the Charter School is included in the District's audit.
Non-Major Governmental Funds - Balance Sheet and Statement of Revenues, Expenditures, and Changes in Fund Balances
The Non-Major Governmental Funds Combining Balance Sheet and Combining Statement of Revenues, Expenditures, and Changes in Fund Balances are included to provide information regarding the individual funds that have been included in the Non-Major Governmental Funds column on the Governmental Funds Balance Sheet and Statement of Revenues, Expenditures, and Changes in Fund Balances.
89
INDEPENDENT AUDITOR'S REPORTS
10681 Foothill Blvd., Suite 300, Rancho Cucamonga, CA 91730 P 909.466.4410 F 909.466.4431 W vtdcpa.com
90
INDEPENDENT AUDITOR'S REPORT ON INTERNAL CONTROL OVER FINANCIAL REPORTING AND ON COMPLIANCE AND OTHER MATTERS
BASED ON AN AUDIT OF FINANCIAL STATEMENTS PERFORMED IN ACCORDANCE WITH GOVERNMENT AUDITING STANDARDS
Governing Board Huntington Beach City School District Huntington Beach, California
We have audited, in accordance with the auditing standards generally accepted in the United States of America and the standards applicable to financial audits contained in Government Auditing Standards issued by the Comptroller General of the United States, the financial statements of the governmental activities, each major fund, and the aggregate remaining fund information of Huntington Beach City School District (the District) as of and for the year ended June 30, 2018, and the related notes to the financial statements, which collectively comprise the District's basic financial statements, and have issued our report thereon dated December 11, 2018.
Emphasis of Matter - Change in Accounting Principles
As discussed in Note 1 and Note 16 to the financial statements, in 2018, the District adopted new accounting guidance, GASB Statement No. 75, Accounting and Financial Reporting for Postemployment Benefits Other Than Pensions. Our opinion is not modified with respect to this matter.
Internal Control Over Financial Reporting
In planning and performing our audit of the financial statements, we considered the District's internal control over financial reporting (internal control) to determine the audit procedures that are appropriate in the circumstances for the purpose of expressing our opinions on the financial statements, but not for the purpose of expressing an opinion on the effectiveness of The District's internal control. Accordingly, we do not express an opinion on the effectiveness of the District's internal control.
A deficiency in internal control exists when the design or operation of a control does not allow management or employees, in the normal course of performing their assigned functions, to prevent, or detect and correct, misstatements on a timely basis. A material weakness is a deficiency, or a combination of deficiencies, in internal control, such that there is a reasonable possibility that a material misstatement of the District's financial statements will not be prevented, or detected and corrected on a timely basis. A significant deficiency is a deficiency, or a combination of deficiencies, in internal control that is less severe than a material weakness, yet important enough to merit attention by those charged with governance.
Our consideration of internal control was for the limited purpose described in the first paragraph of this section and was not designed to identify all deficiencies in internal control that might be material weaknesses or significant deficiencies. Given these limitations, during our audit we did not identify any deficiencies in internal control that we consider to be material weaknesses. However, material weaknesses may exist that have not been identified.
91
Compliance and Other Matters
As part of obtaining reasonable assurance about whether the District's financial statements are free from material misstatement, we performed tests of its compliance with certain provisions of laws, regulations, contracts, and grant agreements, noncompliance with which could have a direct and material effect on the determination of financial statement amounts. However, providing an opinion on compliance with those provisions was not an objective of our audit, and accordingly, we do not express such an opinion. The results of our tests disclosed no instances of noncompliance or other matters that are required to be reported under Government Auditing Standards.
Purpose of This Report
The purpose of this report is solely to describe the scope of our testing of internal control and compliance and the results of that testing, and not to provide an opinion on the effectiveness of the District's internal control or on compliance. This report is an integral part of an audit performed in accordance with Government Auditing Standards in considering the District's internal control and compliance. Accordingly, this communication is not suitable for any other purpose.
Rancho Cucamonga, California December 11, 2018
10681 Foothill Blvd., Suite 300, Rancho Cucamonga, CA 91730 P 909.466.4410 F 909.466.4431 W vtdcpa.com
92
INDEPENDENT AUDITOR'S REPORT ON COMPLIANCE FOR EACH MAJOR PROGRAM AND REPORT ON INTERNAL CONTROL
OVER COMPLIANCE REQUIRED BY THE UNIFORM GUIDANCE
Governing Board Huntington Beach City School District Huntington Beach, California
Report on Compliance for Each Major Federal Program
We have audited Huntington Beach City School District's (the District) compliance with the types of compliance requirements described in the OMB Compliance Supplement that could have a direct and material effect on each of the District's major Federal programs for the year ended June 30, 2018. The District's major Federal programs are identified in the summary of auditor's results section of the accompanying schedule of findings and questioned costs.
Management's Responsibility
Management is responsible for compliance with the Federal statutes, regulations, and the terms and conditions of its Federal awards applicable to its Federal programs.
Auditor's Responsibility
Our responsibility is to express an opinion on compliance for each of the District's major Federal programs based on our audit of the types of compliance requirements referred to above. We conducted our audit of compliance in accordance with auditing standards generally accepted in the United States of America; the standards applicable to financial audits contained in Government Auditing Standards, issued by the Comptroller General of the United States; and the audit requirements of Title 2 U.S. Code of Federal Regulations Part 200, Uniform Administrative Requirements, Cost Principles, and Audit Requirements for Federal Awards (Uniform Guidance). Those standards and the Uniform Guidance require that we plan and perform the audit to obtain reasonable assurance about whether noncompliance with the types of compliance requirements referred to above that could have a direct and material effect on a major Federal program occurred. An audit includes examining, on a test basis, evidence about the District's compliance with those requirements and performing such other procedures as we considered necessary in the circumstances.
We believe that our audit provides a reasonable basis for our opinion on compliance for each major Federal program. However, our audit does not provide a legal determination of the District's compliance.
Opinion on Each Major Federal Program
In our opinion, the District complied, in all material respects, with the types of compliance requirements referred to above that could have a direct and material effect on each of its major Federal programs for the year ended June 30, 2018.
93
Report on Internal Control Over Compliance
Management of the District is responsible for establishing and maintaining effective internal control over compliance with the types of compliance requirements referred to above. In planning and performing our audit of compliance, we considered the District's internal control over compliance with the types of requirements that could have a direct and material effect on each major Federal program to determine the auditing procedures that are appropriate in the circumstances for the purpose of expressing an opinion on compliance for each major Federal program and to test and report on internal control over compliance in accordance with the Uniform Guidance, but not for the purpose of expressing an opinion on the effectiveness of internal control over compliance. Accordingly, we do not express an opinion on the effectiveness of the District's internal control over compliance.
A deficiency in internal control over compliance exists when the design or operation of a control over compliance does not allow management or employees, in the normal course of performing their assigned functions, to prevent, or detect and correct, noncompliance with a type of compliance requirement of a Federal program on a timely basis. A material weakness in internal control over compliance is a deficiency, or a combination of deficiencies, in internal control over compliance, such that there is a reasonable possibility that material noncompliance with a type of compliance requirement of a Federal program will not be prevented, or detected and corrected, on a timely basis. A significant deficiency in internal control over compliance is a deficiency, or a combination of deficiencies, in internal control over compliance with a type of compliance requirement of a Federal program that is less severe than a material weakness in internal control over compliance, yet important enough to merit attention by those charged with governance.
Our consideration of internal control over compliance was for the limited purpose described in the first paragraph of this section and was not designed to identify all deficiencies in internal control over compliance that might be material weaknesses or significant deficiencies. We did not identify any deficiencies in internal control over compliance that we consider to be material weaknesses. However, material weaknesses may exist that have not been identified.
The purpose of this report on internal control over compliance is solely to describe the scope of our testing of internal control over compliance and the results of that testing based on the requirements of the Uniform Guidance. Accordingly, this report is not suitable for any other purpose.
Rancho Cucamonga, California December 11, 2018
10681 Foothill Blvd., Suite 300, Rancho Cucamonga, CA 91730 P 909.466.4410 F 909.466.4431 W vtdcpa.com
94
INDEPENDENT AUDITOR'S REPORT ON STATE COMPLIANCE
Governing Board Huntington Beach City School District Huntington Beach, California
Report on State Compliance
We have audited Huntington Beach City School District's (the District) compliance with the types of compliance requirements as identified in the 2017-2018 Guide for Annual Audits of K-12 Local Education Agencies and State Compliance Reporting that could have a direct and material effect on each of the District's State government programs as noted below for the year ended June 30, 2018.
Management's Responsibility
Management is responsible for compliance with the requirements of State laws, regulations, and the terms and conditions of its State awards applicable to its State programs.
Auditor's Responsibility
Our responsibility is to express an opinion on compliance of each of the District's State programs based on our audit of the types of compliance requirements referred to above. We conducted our audit in accordance with auditing standards generally accepted in the United States of America; the standards applicable to financial audits contained in Government Auditing Standards, issued by the Comptroller General of the United States; and the 2017-2018 Guide for Annual Audits of K-12 Local Education Agencies and State Compliance Reporting. These standards require that we plan and perform the audit to obtain reasonable assurance about whether noncompliance with the compliance requirements referred to above that could have a material effect on the applicable government programs noted below. An audit includes examining, on a test basis, evidence about the District's compliance with those requirements and performing such other procedures as we considered necessary in the circumstances. We believe that our audit provides a reasonable basis for our opinions. Our audit does not provide a legal determination of the District's compliance with those requirements.
Unmodified Opinion
In our opinion, the District complied, in all material respects, with the compliance requirements referred to above that are applicable to the government programs noted below that were audited for the year ended June 30, 2018.
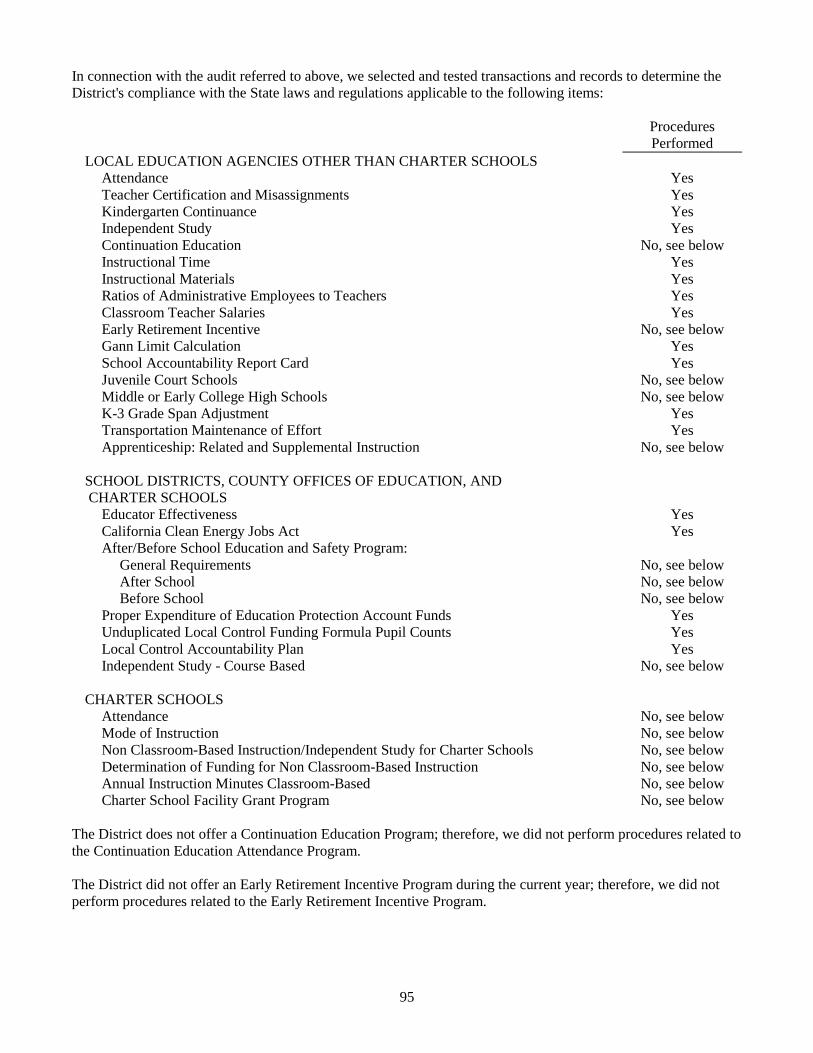
95
In connection with the audit referred to above, we selected and tested transactions and records to determine the District's compliance with the State laws and regulations applicable to the following items:
Procedures Performed
LOCAL EDUCATION AGENCIES OTHER THAN CHARTER SCHOOLS Attendance Yes Teacher Certification and Misassignments Yes Kindergarten Continuance Yes Independent Study Yes Continuation Education No, see below Instructional Time Yes Instructional Materials Yes Ratios of Administrative Employees to Teachers Yes Classroom Teacher Salaries Yes Early Retirement Incentive No, see below Gann Limit Calculation Yes School Accountability Report Card Yes Juvenile Court Schools No, see below Middle or Early College High Schools No, see below K-3 Grade Span Adjustment Yes Transportation Maintenance of Effort Yes Apprenticeship: Related and Supplemental Instruction No, see below
SCHOOL DISTRICTS, COUNTY OFFICES OF EDUCATION, AND CHARTER SCHOOLS
Educator Effectiveness Yes California Clean Energy Jobs Act Yes After/Before School Education and Safety Program:
General Requirements No, see below After School No, see below Before School No, see below
Proper Expenditure of Education Protection Account Funds Yes Unduplicated Local Control Funding Formula Pupil Counts Yes Local Control Accountability Plan Yes Independent Study - Course Based No, see below
CHARTER SCHOOLS Attendance No, see below Mode of Instruction No, see below Non Classroom-Based Instruction/Independent Study for Charter Schools No, see below Determination of Funding for Non Classroom-Based Instruction No, see below Annual Instruction Minutes Classroom-Based No, see below Charter School Facility Grant Program No, see below
The District does not offer a Continuation Education Program; therefore, we did not perform procedures related to the Continuation Education Attendance Program.
The District did not offer an Early Retirement Incentive Program during the current year; therefore, we did not perform procedures related to the Early Retirement Incentive Program.
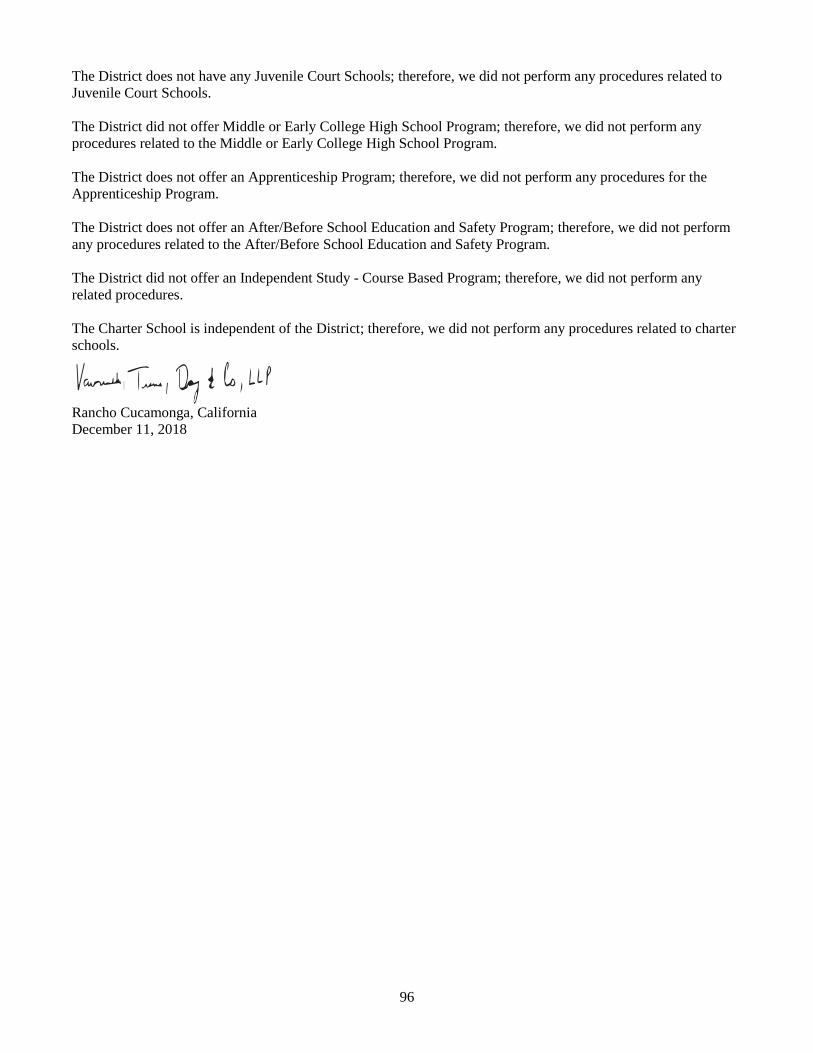
96
The District does not have any Juvenile Court Schools; therefore, we did not perform any procedures related to Juvenile Court Schools.
The District did not offer Middle or Early College High School Program; therefore, we did not perform any procedures related to the Middle or Early College High School Program.
The District does not offer an Apprenticeship Program; therefore, we did not perform any procedures for the Apprenticeship Program.
The District does not offer an After/Before School Education and Safety Program; therefore, we did not perform any procedures related to the After/Before School Education and Safety Program.
The District did not offer an Independent Study - Course Based Program; therefore, we did not perform any related procedures.
The Charter School is independent of the District; therefore, we did not perform any procedures related to charter schools.
Rancho Cucamonga, California December 11, 2018
97
SCHEDULE OF FINDINGS AND QUESTIONED COSTS
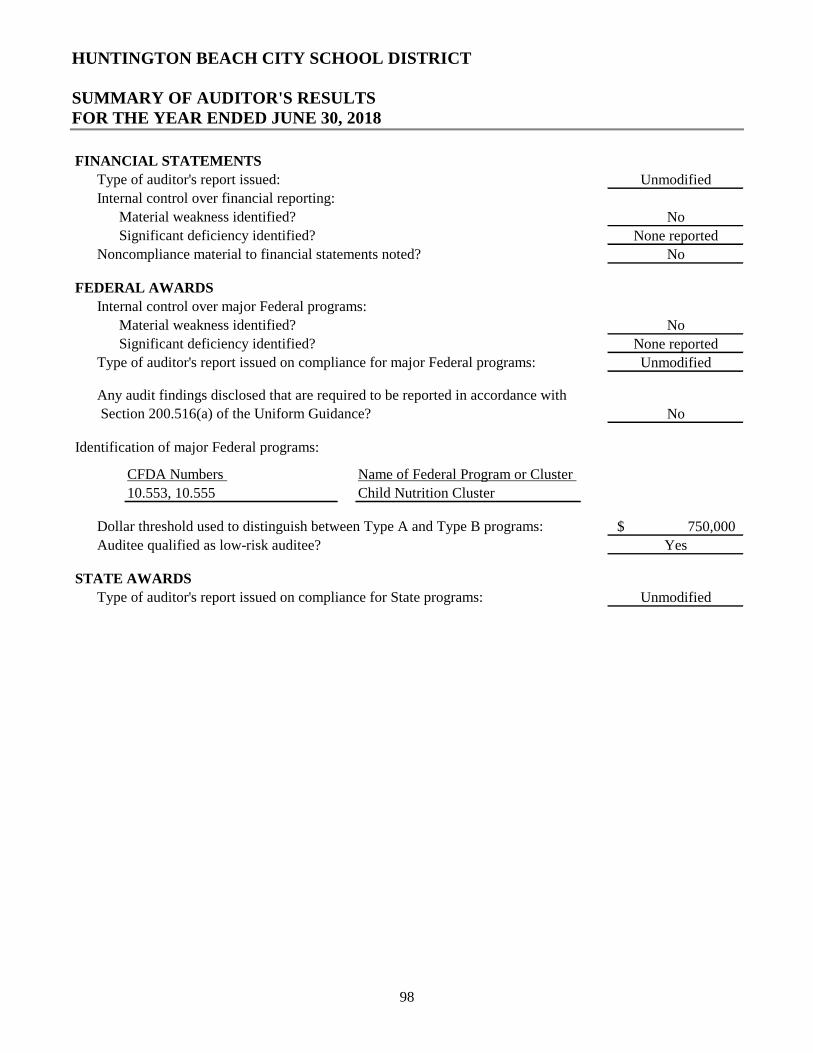
HUNTINGTON BEACH CITY SCHOOL DISTRICT
SUMMARY OF AUDITOR'S RESULTS FOR THE YEAR ENDED JUNE 30, 2018
98
FINANCIAL STATEMENTS
Unmodified
No
None reported
No
FEDERAL AWARDS
No
None reported
Unmodified
No
CFDA Numbers Name of Federal Program or Cluster
10.553, 10.555 Child Nutrition Cluster
750,000$
Auditee qualified as low-risk auditee? Yes
STATE AWARDS
Unmodified
Dollar threshold used to distinguish between Type A and Type B programs:
Significant deficiency identified?
Any audit findings disclosed that are required to be reported in accordance with
Section 200.516(a) of the Uniform Guidance?
Type of auditor's report issued on compliance for State programs:
Noncompliance material to financial statements noted?
Internal control over major Federal programs:
Material weakness identified?
Significant deficiency identified?
Type of auditor's report issued on compliance for major Federal programs:
Identification of major Federal programs:
Type of auditor's report issued:
Internal control over financial reporting:
Material weakness identified?

HUNTINGTON BEACH CITY SCHOOL DISTRICT
FINANCIAL STATEMENT FINDINGS FOR THE YEAR ENDED JUNE 30, 2018
99
None reported.
HUNTINGTON BEACH CITY SCHOOL DISTRICT
FEDERAL AWARDS FINDINGS AND QUESTIONED COSTS FOR THE YEAR ENDED JUNE 30, 2018
100
None reported.

HUNTINGTON BEACH CITY SCHOOL DISTRICT
STATE AWARDS FINDINGS AND QUESTIONED COSTS FOR THE YEAR ENDED JUNE 30, 2018
101
None reported.
HUNTINGTON BEACH CITY SCHOOL DISTRICT
SUMMARY SCHEDULE OF PRIOR AUDIT FINDINGS FOR THE YEAR ENDED JUNE 30, 2018
102
Except as specified in previous sections of this report, summarized below is the current status of all audit findings reported in the prior year's Schedule of Findings and Questioned Costs.
Financial Statement Findings
None reported.
Federal Awards Findings
None reported.
State Awards Findings
None reported.