hungary stabilization and economic reform - world … · report no. 718-tu hungary stabilization...
TRANSCRIPT
Report No. 718-tU
HungaryStabilization and Economic Reform
May 31,1988
Country Operations Department IVEurope, Middle East and North Africa Region
FOR OFFICIAL USE ONLY
Document of the World 3ank
This document has :- restricted distribution and may be used by recipientsonly in the performan-ce of thieir official duties. Its contents may not otherwisebe disclosed without World Bank authorization.
Pub
lic D
iscl
osur
e A
utho
rized
Pub
lic D
iscl
osur
e A
utho
rized
Pub
lic D
iscl
osur
e A
utho
rized
Pub
lic D
iscl
osur
e A
utho
rized
Pub
lic D
iscl
osur
e A
utho
rized
Pub
lic D
iscl
osur
e A
utho
rized
Pub
lic D
iscl
osur
e A
utho
rized
Pub
lic D
iscl
osur
e A
utho
rized

FISCAL YEARJanuary 1 to December 31
CURRENCY EQUIVALENTS(Forints per US$1.00)
Period End-PeriodAverage (Dec. 31)
1980 32.53 32.211981 34.31 34.431982 36.63 39.611983 42.67 45.191984 48.04 51.201985 50.12 47.351986 45.83 45.931987 46.97 46.39
LIST OF ABBREVIATIONS
CMEA = Council for Mutual Economic CooperationCSO Central Statistical OfficeERP = Effective Rate of ProtectionNBH = National Bank of HungaryNPO = National Planning OfficeNSB National Savings BankPIT = Personal Income TaxPPP = Purchasing Power ParitySDI = State Development InstituteTFP = Total Factor ProductivityVAT = Value Added Tax

FM OFFICIAL uw OWLY
BSTRACT
This report analyzes developments in the Hungarian economy si'.e1985. After surveying recent economic developments (Chapter I), the reporteramines the framework of domestic and external regulatory policies andincentives for industrial development and exports (Chapters II and III).One lesson that has emerged from the Hungarian experience is that asupportive macroeconomic en-vironment that keeps domestic demand under tightcontrol is needed to get the desired supply response from economic reform.A parallel lesson is that reform measures can make macroeconomic policymakingmore difficult, at least in the short-run. To lessen this possibility it isimportant to increase financial discipline, which in the Hungarian contextmeans a reduction in the amount of financial subsidies and supports fromthe State to enterprises. The effects of recent reforms to the regulatoryenvironment are analyzed, and ways of increasing their effectiveness oresuggested. Economic reform also places greater reliance on markets, andit is important that markets send signals that encourage a strong supplyresponse, especially of nonruble exports. The failure of this to occurin 1985-86 is analyzed, and measures to avert this outcome in the futureare suggested. Chapter IV analyzes the authorities' medium-termstabilization/reform program. The program represents a consistent andfeasible strategy for stabilizing the economy and stopping the growth ofexternal debt. The success of the program depends on a marked reduction inthe convertible currency current account deficit in 1988 and a consistentand vigorous implementation of the economic reform.
This report was written by Timothy Condon (EM4), using contributions frc..Sadao Nagaoka (PPR), Martin Schrenk (EM4), David Newbery and Mario deZamaroczy (Consultants), and Carlos Hinayon (EM4). Maria Luisa de la Puentewas responsible for the production of the document. The main miPsion visitedHungary in June-July 1987. Its findings were supplemented through visits inOctober 1987 and March 1988. The initial draft of this report was presentedto the authorities in October 1987, and discussed with them in January 1988.This report incorporates the results of the discussions. Final discussionswith the authorities took place in May 1988.
This document has a restricted distribution and may be used bv recipients only in the performanceof their official duties. Its contents may not otherwise be disclosed without World Bank authorization.

HUNGARY: STABILIZATION AND ECONOMIC REFORM
Table of ContentsPage No.
COUNTRY DATA
SUMMARY AND CONCLUSIONS . . . . . . . . . . . . i-v
CHAPTER I: Recent Economic Developments . . . . . . . . 1
A. Output and Productivity Trends .. . . . . . . .
B. Macroeconomic Balances . . . . . . . . . . 5C. Consumption and Investment . . . . . . . . . . 7D. Public Finance . . . . . . . . . . . . . . 12E. Money and Credit . . . . . . . . . . 13F. Inflation . . . . . . . . . . . . 15G. Current Account . . . . . . . . . . . . . 17H. External Debt and Creditworthiness . . . . . . . . 19I. Summary . . . . . . . . . . . . . 22
CHAPTER II: Domestic Policies and Competition . . . . . . . 23
A. Establishing Financial Discipline . . . . . . . . 23a. Regulatory Environment . . . . . . . . . . . 25
B. The Hungarian Tax Reform . . . . . . . . . . 28a. The Impact of the Tax Reform on Socialist Sector Enterprises . 29b. The Effect on the Private Sectcr . . . . . . . .
c. The Revenue Impact of the Tax Reform . . . . . . . 31d. Conclusions . . . . . . . . . . . . . . 33
C. The Domestic Pricing System . . . . . . . . . . 33a. Recent Developments . . . . . . . . . . 34b. Future Reform of the Pricing System . . . . . . . . 34
CHAPTER III: External Policies and Competition . . . . . . . 36
A. Expor' Policies and Incentives . . . . . . . . . . 36a. Recent Trends in Competitiveness . . . . . . . . 36b. Investment Incentives . . . . . . . . . . . 38c. Other Export Promotion Measures . . . . . . . . 38
B. Nonruble Impcrt Policies and Incentives . . . . . . . 39a. Recent Trends in Tariffs and Effective Protection . . . . 39b. Nor.tariff Import Barriers . . . . . . . . . . 40
C. Recommendations . . . . . . . . . . . . . 40
CHAPTER IV: Medium-Term Prospects . . . . . . . . . . 42
A. The Economic Stabilization and Structural Reform Program . . . 42B. Risks to the Scenario . . . . . . . . . . . . 45
ANNEX 1: Notes on Enterprise Subsidies . . . . . . . . . 49
ANNEX 2: Notes on the Effect of the Tax Reform . . . . . . . 52
STATISTICAL APPENDIX. . . . . . . . . . . . . . 53
MAP

Page of 2 pagsCOUTRV OATA: jUj#KY
93.036 sq km 10.63 million (mid-1986) 11S.0 per sq kmAnnual growth rate 0.19% (from 1970 to 1956) 2286S per sq km of arable land
POPULATIm CI4AhErTERiSTIC5 LloAll MELIICrude birth rate (per 1.OO) 11.9 Population per physician (§90) 347Crude death rate (per 1.000) 13.9 Population per hospital bed (1901) 110Infant mortality iper 1.000 live births) 19.0
IKuCm Dh5TftLRMTIL L9771X of private incom. highest 20 percent 32.3 3I
lowest 40 percent 26.2 X owe"d by top 1f of owersS owned by smallest 101 of owners
ACCESS TO PIPED bA1TER 91a1 ACCESS TO FLECTRICITY 119A01X of population - urban 63.0 I/ X of population - urban 99.2
- rural 43.1 J/ - rural 97.6
NUTEITION 19231 EDUCATIONCalorie intake as X of requirements 134.0 Adult literacy rate X (1982) 98.9Per capita protein intake (gns.) 105.3 Primary school enrollment X (1981) 97.0
GUP PER CAPITA IN 1oAa 2/: UIS 2-020
ANNLUAL RATE OF GROWNTH M. eonstant grices)
US *ln. S 1970-75 1°75-0L !980-iM 1m 198
GOP at Market Prices 26.0 100.0 6.2 3.2 1.8 I.$ 3.4Gross Domestic Investment 6.9 26.8 6.9 2.2 -3.8 6.5 SSGross Domestic Saving 6.4 24.6 10.8 5.7 2.4 -6.3 7.9Resource Balance 0.1 0. Exports of Goods. NFS 9.9 37.9 9.6 6.9 5.S -2.2 4.2Imports of Goods. NFS 10.0 38.4 7.S 3.9 1.5 2.7 3.1
0OuTPUT. LABOR FORCE ANDPRODUCTIVITY IN lgf6
Gross Value Added Labor Foree 3_ G.V.A. Per WorkerFt Bln. USS; Ern. % dinu I usi -t
Agriculture 179.0 3.9 16.5 986.2 20.2 3.955 89.6Industry (ncl. constr.) 439.5 9.6 40.6 1.884.0 38.5 5.096 115.4Services 372.1 8.1 34.2 2.022.3 41.3 4.005 90.7Unallocated 4/ 923 LA 2 -8 _**
Total/Average 1084.5 23.6 100.0 4.892.5 100.0 4.415 I/ 100.0 /
GOVER IIENT FINANCE
Consolidated Central Gover_n_nt id"Ft Cln .1 of GAP1987 1 m72--M
Current Receipts 637.3 52.6 58.7Current Expenditures 613.4 50.6 52.8Current Surplus 23.9 2.6 5.8Capital Expenditures 47.9 4.0 6.9External Assistance (net)
1/ Percentage of occupied dwellings.Z/ World Bank Atlas methodology. All other conversions to dollars in this table are at the
average comnercial c-change rate prevailing during the period covered.I/ Active earners.A/ Customs duties, valuation differences commodity and indirect taxes are not allocated by sector.5/ Excluding unallocated.
Not applicableNot available
EH4COMay 19882496G

Page 2 of 2 pagesQgl,ITRY DATA: HUNGARY
MQb CREDIT AND PRICES1211. 1%21 1211 1J84 JiMla 1987
(Ft billions)
Domestic credit 659.6 700.4 729.5 76?.8 825.9 961.6 1071.9Central Government (net) 20.0 30.1 29.7 11.8 21.7 92.0 126.1Local Government 4.3 4.1 5.2 4.6 6.' 7.3 10.4Credit to Non-government 635.5 665.1 695.2 750.9 798A 862.3 935.4
Money and quasimoney 380.2 405.6 421.2 443.1 487.8 556.5 595.1
(percentage growth rates)
Money and quasimoney 7.9 6.7 3.8 5.2 10.1 14.1 7.9Domestic credit 8.8 6.2 4.2 5.3 7.6 16.4 11.5Central Government (net) 80.2 5O.S -1.3 -60.3 83.9 324.^ 37.4Enterprise working capital S.5 5.2 5.2 9.0 12.8 10.S 1.4Household 7.9 1l.S 1S.S 16.4 14.1 14.7 15.7
Memorandum items:M2/GOP (percent) 48.8 47.8 46.9 45.2 47.2 51.1 48.6CPI inflation (percent) 4.6 6.9 7.3 8.3 7.0 5.3 8.6
BALANCE OF PAYMENTS MERCHANDISE EXPORTS (AVERAGE 1980-8613.22 1211 1JM lii l186 1987/n Trade in Trade in
_2Rubes Nonrubles(Millions US$) Fuels. electric S mln % $ mln X
energy 27.1 0.7 452.1 9.4Exports of Goods & NFS 10315.2 10143.9 10270.7 10162.9 10713.1 11696.0 Raw materials. semi-Merchandise (FOB) 9056.6 8879.8 8836.7 8930.3 9147.7 9892.0 finished products.Non-Factor Services 1258.6 1264.1 1434.0 1232.6 1565.4 1804.0 spare parts 911.9 23.2 1674.5 34.8
Machinery, transportImports of Goods & NFS 9843.6 9498.5 9305.7 9536.o 11219.8 11436.0 equipment. otherMerchandise (FOB) 8578.8 8452.4 8022.6 8323.6 9670.6 9787.0 capital goods 1751.0 44.5 606.1 12.6Non-Factor Services 1264.8 1046.1 1283.1 1213.2 1549.2 1649.0 Manufactured
consumer goods 677.0 17.2 657.4 13.7Resource Balance 471.6 645.4 965.0 626.1 -306.7 260.0 Agricultural goods S6.7 14.4 1424.0 g2_.6
Total 3935.6 100.0 4814.1 100.0Net Factor Income -963.2 -666.2 -759.7 -750.5 -857.1 -95S.0(inte est payment) 1128.1 812.8 945.9 989.6 1121.8 1169.0 EXTERNAL DEBT. DECEMBER 31. 1987Net Current Trdnsfers 62.7 56.0 66.0 68.8 77.8 106.0 USS Billignn(workers remittances) .. .. .. .. .. .. (Convertible currency)
Public debt incl. guaranteed 15.8Current A:count Balance -428.9 35.2 271.3 -55.6 -1286.0 -558.0 Non-guaranteed private debt
Total outstanding and disbursed 1S.8Long-Term Capital Inflow 118.3 81.2 860.1 1714.4 652 S .545.0Direct Investment 0.0 0.0 0.0 0.0 0.o 0.0 OEBT SERVICE RATIO FOR 1987 %Official Capital Grants 0.0 0.0 0.0 0.0 0.0 0.0Net LT Loans 202.2 161.3 1016.0 1904.8 1028.0 722.0 (Convertible Currency)Othe, LT Inflows (Net) -83.9 -30.1 -155.9 -190.4 -375.5 -177.0 Public debt. ncl. guaranteed 47.5
Non-guaranteed private debtTotal 47.5
Total Other Items (Net) -386.7 388.5 -825.8 -395.5 606.6 -1155.0Net Short Term Capital -968.5 346.6 -944.6 -488.0 476.9 .. IBRD/IDA LENDING (December 19871 (Mln. USSICapital Flows N.E.I. 0.0 0.0 0.0 0.0 0.0Errors and Omissions S81.8 41.9 118.8 92.S 129.7 .. IBRD IDA
Change in Net Reserves 697.3 -504.9 -305.6 -1263.3 26.9 1198.0 Outstanding and disbursed 722.2Net Credit from the IMF 239.1 356.7 433.9 -95.3 -49.5 -300.0 Undisbursed S62.0Other Reserve Changes 458.2 -861.6 -739.5 -1168.0 76.4 1498.0 Outstanding. incl.(- indicates increase) undisbursed 1284.2
Exchange Rate Adjustment 254.9RATE OF EXCHANGE
1987 (averageL 1986 (averaaelUS$ 1.00 = 46.97 USS 1.00 = 45.83Ft. 1.00 = $0.021 Ft. 1.00 = $0.022
. Not applicable .. Not availableL Preliminary
EM4COMay 1988 (2496G)
-1i -
SUMMARY AND CONCLUSIONS
(i) Hungary's economic reform program involves increasing reliance onmarket forces, improving factor productivity, increasing the flexibility ofthe economic system, shifting production capacity toward activities more inline with Hungarian dynamic comparative advantage, and increasing convertiblecurrency exports. Since 1983, the World Bank has supported Hungary's reformprogram, directly through its assistance program, which has included twoindustrial restructuring loans, and indirectly by increasing Hungary'sparticipation in the international capital markets. Visible progress inestablishing a sustainable supply response has been lacking, and the balanceof payments began to deteriorate in 1985, necessitating a substantialincrease in debt. In 1987, the authorities developed a program designed tostabilize the economy and promote economic restructuring. This reportreviews economic developments in 1986-87, analyzes key aspects of theincentive system as well as the program for stabilization and restructuring.That program embodies improvements in the economy's supply response,particularly compared with the 1985-86 period. This report makes a number ofrecommendations in this regard.
A. Recent Economic Developments and Follow-Up Needs
(ii) After a successful stabilization in 1982-84, Hungary's economicperformance deteriorated in 1985-86. GDP growth fell by 0.3 percent in 1985and nonruble exports declined by 6.6 percent. In 1986, GDP growth increasedby 1.5 percent but there was a further 3.8 percent decline in nonrubleexports. The combination of a poor supply response, growing domestic demandand declining terms of trade led to growing macroeconomic imbalances. By1986, the current account deficit in convertible currencies reached6.0 percent of GDP and the State budget deficit 4.3 percent. The currentaccount deficits were financed by external borrowing, but the total increasein external debt, measured in U.S. dollars, also reflected the effects ofcross exchange rate changes and a compositional shift in the structure ofdebt toward currencies that were appreciating against the dollar.
(iii) The authorities responded to the deterioration in the economy byimplementing measures in 1987 to reduce the current account and fiscaldeficits. These measures were partly effective, and the deterioration in themacroeconomic balances was reversed. GDP growth was 3.4 percent, andnonruble exports grew by 5.0 percent. Moreover, there was no decline in thenonruble terms of trade. There was, however, another large increase inexternal debt, most of it due to the effect of the depreciation of the dollarin the fourth quarter of the year. In early 1988, the most pressingmacroeconomic problem is the need to sustain the turnaround in economicperformance that began in 1987 in a situation where the heavy debt serviceburden reduces the room for maneuver.
(iv) A principal shortcoming of economic policymaking in 1987 was theinability to implement a sufficiently contractionary aggregate demand

- ii -
policy. Real household consumption, rather than declining by 0.5-1.0 percentas planned, grew by 2.8 percent. Investment also recorded stronger thanplanned growth. The unexpected strength of domestic demand had severalcauses. Anticipatory buying developed in the second half of the year as newsof price increases that would take effect in January 1988 with theintroduction of a major tax reform became known. Loose monetary policy in1985-86 also may have created a liquidity overhang that frustrated efforts toreduce demand in 1987. Interest rate policy may not have been -ufficientlyactive to reduce the shift out of deposits into cash, which could be readilyspent. Enterprise liquidity, following two years of rapid growth of Statefinancial subsidies and supports, was high, and monetary policy was notsufficient.y tight for the enterprise sector.
(v) In combination with the measures introduced in 1987 to stabilizethe economy, the authorities elaborated a Stabilization and Economic ReformProgram for 1988-90. A main element of the program is the implementation ofa tight aggregate demand policy in 1988. The experience of 1987 indicatesthat several policy several measures are called for, the first one being atight fiscal policy. Developments in 1987 Oemonstrate that the authoritiesare able to introduce deficit reducing measures in a quick and flexiblemanner. A stronger commitment to improve the fiscal b-alance will benecessary in order to attain the planned reduction in the 1988 State budgetdeficit from 2.9 to 0.8 percent of GDP. Monetary policy for both householdsand enterprises must also be tightened. For the enterprise sector, thetightening of short-term refinancing credit limits is the main tool ofmonetary policy. To permit greater short-term management, open marketoperations are also needed. These would enable ti,s monetary authorities tointervene at the first sign of excess enterprise liquidity. For thehousehold sector, an active interest rate policy is needed to encouragesavings and discourage a flight from savings deposits into cash holdings.
(vi) An improvement in the efficiency of investment, which has been lowin Hungary, is also necessary. A continuation of the recen. trend of scalingback low yielding public investments is needed. Better enterprise investmentdecisions are also needed. A tightening of enterprise financial disciplinethrough a multi-year, pre-announced and front-loaded program of reductions inState financial supports to enterprises is an important step. The reductionin enterprise financial supports is also important because the supports fueldomestic demand, which crowds out nonruble export demand. Strict enforcementof the new bankruptcy law as well as measures to reduce the scope for bankruptenterprises to be refloated would also send an unambiguous signal toenterprises that they will bear the cost of imprudent investment decisions.Reforms to integrate the capital market, especially the planned integrationof the household and enterprise financial systems are also necessary. Suchreforms would increase the competition for long-term investment resources,which, provided financial discipline is tight, would lead naturally to animprovement in the allocation of investment resources. In addition, fullintegration would increase the interest sensitivity of the financial system,which would improve the effectiveness of monetary policy. Finally, in a moreintegrated financial system, State support for subsidized credit schemesshould be minimized. The authorities' intentions are in line with theserecommendations.

- iii -
(vii) An important develoDment in 1987 was the 5 percent growth innonruble exports after two years of falling exports. The growth appearsrelated to an improvement in the incentive to export to the nonruble areacompared with selling on the domestic market and in the ruble area. Thecontinuation of an active exchange rate policy is needed to sustain and buildon the gains of 1987. Moreover, an active exchange rate policy thatsustained the incentive for nonruble exports would promote investment inefficient exports and permit Hungary to dispense with subsidized investmentcredit as an export promotion measure. Finally, it may be possible toimprove debt management in Hungary to avoid large increases in the growth ofexternal debt, measured in U.S. dollars, resulting from cross exchange ratemovements and compositional shifts in debt structure.
B. Domestic Policies and Competition
(viii) Hungary has made significant progress in reforming the regulatoryenvironment to encourage profit maximizing behavior by enterprises. Abankruptcy law was enacted in September 1986, and a major tax reformimplemented in January 1988. These measures have the potential to increasethe efficiency of resource usc in the economy but several additional measuresare needed. The program for reducing state financial supports to enterprisesis a key to establishing financial discipline. The bankruptcy law wi 1 bemuch more effective in discouraging imprudent enterprise decisions i. anenvironment of tight financial discipline. An increase in provisioningagainst doubtful loans by commercial banks will increase the banks' interestin the soundness of their portfolios.
(ix) The introduction of the Value Added Tax and the Personal Income Taxin January 1988, simultaneously with the elimination of several distortionarytaxes, has simplified the tax system and removed many distortions. Someshort-run transitional problems have arisen, however, which require somemodifications. First, permitting private sector entrepreneurs to deduct thecost of their own labor from pre-tax profits would promote neutrality of taxtreatment across enterprises and elicit a stronger supply response from thedynamic private sector. Second, factor price changes accompanying the taxreform may not correspond to the authorities' original intentions. Expectedfactor market reforms, especially granting enterprise managers the freedom todetermine individual employee earnings (subject to a ceiling on the overallenterprise wage bill related to performance) will help promote more efficientuse of labor and capital. Finally, given the need for a sharp improvement inthe public sector's net financial position in 1988, a contingency package ofexpenditure reductions is called for to guard against the possibility of arevenue shortfall in the first year of the tax reform.
(x) Domestic pricing policy aims to shift larger numbers of goods intothe category of freely determined prices. This commendable policy would befurther strengthened by the trade measures, discussed below, to stimulateimport competition. Also, domestic competition would be increased. Inaddition, as noted in various points in this report, distortions arising fromthe system of administered prices are costly to the economy. There is a need
- iv-
to study the levels and manner of setting of the administered prices inHungary to see if the goals of the pricing policy could be met moreefficiently and at a lower fiscal cost.
C. External Policies and Competition
(xi) Policies to promote exports in Hungary are generally well focusedand sustainable in the long-run. It is recommended that the authoritiescontinue to pursue an active exchange rate policy as a principal instrumentof export promotion. There has been less progress in reforming the importregime. Two non-tariff barriers, the import licensing system and the globalquota on consumef goods, effectively close off significant import competitionand artificially reduce the equilib-ium level of the real exchange rate(defined as the price of cradable goods relative to the price of nontradablegoods). The report recommends that the reform program include reform of thelicensing system to increase its automaticity, and the pre-announcedelimination of the consumer goods quota over a period of time. Given thepressure cn the balance of payments, temporary tariff surcharges may beneeded as a transitional measure to minimize the risks of a substantialdeterioration in external balances.
D. Medium-Term Prospects
(xii) The main goals of the Stabilization and Economic Reform Program areto halt the growth of external debt by the end of the period and toaccelerate the restructuring of the economy. The authorities have requestedthe support of the IMF and the World Bank for their program. A main elementof the program is a sharp contraction in domestic demand in 1988 in order toproduce significant improvements in internal and external balance. Theconvertible currency account deficit is projected to fall from $847 millionin 1987 (3.2 percent of GDP) to $500 million in 1988 (1.9 percent of GDP),and the fiscal deficit from the 1987 level of Ft 35 billion (2.9 percent ofGDP) to Ft 10 billion (0.8 percent of GDP). To analyze the implications andthe feasibility of this program, scenarios were developed using a model thatcaptures the links between growth and external constraints. The Governmentwill need to take measures to reduce domestic demand. Nonruble imports areprojected to contract sharply in 1988, while nonruble exports expand by anaverage of 5 percent in 1988-90. Consumption is expected to fall by2-2.5 percent in 1988 in a reversal of the policy that has kept it fromfalling for over thirty years. Policies to reduce domestic demand must bebalanced with the need to raise domestic savings by the equivalent of2.6 percent of GDP in 1988.
(xiii) The economic reforms, especially the reduction in enterprisesubsidies and other financial support and the measures to improve the use ofcapital and labor, are expected to raise productivity growth. While only amodest increase in the investment rate is projected, the measures discussedabove are expected to increase investment efficiency and improve the supplyresponse. GDP growth is expected to be low for the rest of the decade; in1991-95, however, growth is expected to exceed 3 percent.

v
(xiv) The authorities' medium-term adjustment program represents afeasible and consistent path for the economy to grow out of its currentproblems. The path is not an easy one, however. In addition there are realrisks to the program, starting with the uncertainty surrounding the economy'sresponse to the sta;ilization and reform measures. The report argues thatthe authorities can reduce the risks through a vigorous and consistentimplementation of the economic reform. If there is visible progress instabilizing the economy and in implementing the reform, it is likely thatthere would be some flexibility in the financing plan. If the authorities'commitment to the stabilization and reform effort is perceived to waver,however, it is likely that resistance would develop on the part ofinternational lenders, and Hungary could face financing gaps that would beimpossible to fill at reasonable terms or at all.

CHAPTER I
RECENT ECONOMIC DEVELOPMENTS
1.01 By end-1984 Hungary had, with the help of twn IMF Stand-ByArrangements, successfully stabilized its economy following the severeliquidity crisis of 1982. The current account was in surplus, as was theState budget. The successful stabilization was mainly due to tight demandmanagement during 1982-84, which included administrative restrictions toreduce imports but created pent-up demand by 1985. In 1985 a renewal of theeconomic reform was initiated with Bank assistance. Reforms to increasedecentralization, enterprise autonomy and reliance on "indirect regulators",or market-based signals, to guide economic actions were instituted. Inaddition, the authorities judged that, following the stabilization period amore expansionary demand management policy was justified. The economy'sresponse in 1985 and 1986 was poor. The supply side of the economy stagnatedwhile domestic demand expanded. The macroeconomic balances deteriorated inboth years, and there was a dramatic increase in external debt. During 1987,the authorities took measures to halt the deterioration and these measureswere partly effective. There was, however, a further significant increase innet external indebtedness. In early 1988, the most pressing macroeconomicproblem is the need to service the large external debt and make substantialprogress toward eliminating the current account deficit.
1.02 This chapter reviews developments in the economy in 1986 and 1987.It is possible to make the case that, in 1987, Hungary turned the situationarotnd and one can now expect a period of improved economic performance. Themeasures responsible for the turnaround are discussed and the reasons theimprov3ment fell short of expectations are also analyzed. The need toimprove the implementation of the reform, broadly defined to include themaintenance of a sound macroeconomic environment, is identified as a keyingredient in a sustained improvement in economic performance. Severalmeasures are discussed in this regard.
A. Output and Productivity Trends
1.03 A comparison of the five-year intervals, 1976-81 and 1981-86,reveals a near uniform deceleration in sectoral value added growth(Table 1.1). The figures also suggest that a principal cause for theslowdown was the fall in the growth of total factor productivity (TFP). Therate of decline in the labor force did not change much, reflecting a trendthat began in the mid-1970s. Capital stock growth was slower in 1981-86, butthe rapid growth during the earlier period led to an overblown investmentprogram that could not be sustained. While the causes of the productivityslowdown remain a puzzle, by 1985-86 the cumulative effect of slower TFPgrowth, exy)ansionary aggregate demand policy and adverse terms of tradeshocks led to economic stagnation.
1.04 Industry, which in 1986 accounted for 34 percent of GDP and 31percent of total employment, grew at an average annual rate of 1.7 percent in1981-86. Employment fell by 1.5 percent per year, nearly the same rate asduring 1976-81. Gross capital-stock growth was 4.8 percent per year, however,

-2-
much slower than the 7.3 percent average for 1976-81. The deceleration ofcapital stock growth was accompanied by a compression of nonruble capitalgoods imports, which may have slowed the accumulation of technologicalcapability and reduced technical efficiency. Another factor that contributedto the fall in TFP was the failure to improve the allocation of investment,the effects of which were less visible when the capital stock was growingmore rapidly. Allocative efficiency was adversely affected by traderestrictions, which were introduced to improve external balance, andpolicy-induced barriers to mobility, which slowed down structural changewithin firms and industries. In addition, the lack of competition in thedomestic and CMEA markets had a negative effect on the quality of enterprisemanagement. Weak management partly explains the loss of export market sharein 1980-85 in non-CMEA markets, where quality and servicing are important.While these technical, allocative and other inefficiencies are difficult todisentangle, their joint effect is reflected in the decline in theproductivity of Hungarian industry.
Table 1.1: FIVE YEAR GROWTH RATES
(percent per year)
TFP Labor Force Capital Stock Value Added1976-81 1981-86 1976-81 1981-86 1976-81 1981-86 1976-81 1981-86
Industry 0.2 -0.6 -1.4 -1.5 7.3 4.8 4.0 1.7Agriculture &forestry 3.2 2.2 -1.7 -0.8 5.6 3.3 3.7 2.6
Construction 0.4 -1.0 -1.5 -2.4 11.1 1.4 3.7 -1.9Transportation
& communic. 1.6 -0.5 -0.1 0.0 3.5 2.6 3.5 1.0Trade & materialservices -2.3 -0.9 0.8 0.8 5.8 4.8 1.2 2.1
Nornuaterialservices 1.5 0.8 1.9 1.3 4.8 4.6 4.0 2.6
Total 0.8 0.1 -0.6 -0.5 5.4 4.1 3.5 1.7
Source: Central Statistical Office, Statistical Yearbook, and Work Bank Staffcalculations.
Notes: Growth rates are computed between period end points. Capital stocks aregross capital stocks at ronstant prices. TFP is computed as theresidual of a Cobb-Douglas production function for each sector.
1.05 In 1986, value-added in industry fell by 0.5 percent, not as bad asthe 2.1 percent decline in 1985 but far short of the annual Plan target of2.0-2.5 percent growth. Part of the shortfall is attributable to the poorexport performance. The sector is export-oriented, with half of final sales

- 3 -
directed to export markets, split roughly in half between ruble and nonrublemarkets. In 1986, the volume of ruble exports rose by only 0.8 percent whilenonruble exports fell by 4.0 percent. The major factors responsible for thefall in nonruble exports were crowding out by unrestrained domestic demand,deteriorating profitability (discussed in Chapter II), weak demand conditionsin some developing country markets, especially in the Middle East, as well asproblems of quality and servicing.
1.06 Industrial value added grew by 4.1 percent in 1987, a markedimprovement over 1985-86. Within industry, the chemical, electric energy,engineering and machinery, and construction materials sectors recorded betterthan average growth. Part of the improvement is attributable to the6.0 percent increase in nonruble exports, with particularly strong growth inthe chemicals and light industry subsectors. The growth of tne buildingraterials subsector can be traced to the buying spree that was triggered bythe announcemnent of large price increases to take effect in 1988(para. 1.23). For a second consecutive year, a cold winter led to higherdomestic demand for electricity.
1.07 The poor performance of the industry sector, particularly innonruble exports, in 1985 and 1986 increased pressure on the agriculture andforestry sector to find new markets and products. The agriculture andforestry sector, which accounted for 16.7 percent of GDP and 20.4 percent ofemployment in 1986, contributed together with food industry 31 percent ofnonruble export earnings. Despite the relatively high TFP and value-addedgrowth shown in Table 1.1, the sector's recent performance has been mixed.The value of agricultural production is split roughly equally between animalhusbandry and crop production. Declining world prices for livestock led toreductions in the numbers of pigs, poultry and cattle between 1984 and 1986and production of animals for slaughter fell in 1985 and 1986. Procurementprices were raised in 1985 to compensate for some of the decline in worldprices. At the beginning of 1987, the pig and poultry populations werehigher than the year earlier partly as a result of the subsidies. In 1987sales of live animals and animal products grew by 2.4 percent.
1.08 The 1988 Plan budget contains a reduction in agricultural subsidiesand livestock producers will have to look for ways of increasing efficiencyto improve profitability. The depressed condition of world markets haseroded profitability and resulted in some scaling back of production. Theconditions that contributed to this situation--world production outpacingconsumption, weak developing country markets, competition from theEEC--cannot be expected to disappear in the short-term, making the search forefficiency improvements even more urgent. Improving the quality of feed isan important area for further work in improving the efficiency of thelivestock sector (see para. 1.09).
1.09 Cereal production plays a key role in the agricultural sector fortwo reasons: the livestock sector depends on grain inputs, and cereal is amajor foreign-exchange earner. Wheat and maize make up 90 percent of totalcereal production and account for 34.0 percent of the value ot total cropproduction. In 1985 and 1986, drought caused wheat production to fall

- 4 -
sharply. The drought continued in 1987, and in 1987 wheat sales were9.9 percent below the 1986 level. Poor weather since 1985 has adverselyaffected wheat production, and higher corn production has been unable to keeptotal cereal production from falling steadily since 1984. Domestic pricesfor wheat and corn have been substantially below world prices (seeTable 1.7). The domestic pricing policy, which includes a relatively highprice of high protein soybean meal, has given rise to a number ofdistortions. The large proportion of cereal (44 percent of wheat andvirtually all corn) used as animal feed effectively subsidizes livestockproduction. Technically suboptimum feeding regimes have also developed.There is a need to develop a systematic approach to administered pricesetting using international prices as an efficiency standard.
1.10 Output of the Constructiou sector makes up about 40 percent ofthe capital stock, so chaluges in construction closely follow changes ininvestment demand. In 1985, the index of the volume of construction-installation activity was only 77 percent of the 1980 level. The largedrop in the demand for construction was due principally to the stabilizationpolicy in 1982-84, which led to a sustained fall in real investment. Thedeclining TFP for the construction sector shown in Table 1.1 suggests thatthe fall in investment left excess capacity in the construction sector.Restructuring plans exist for some state construction companies, but therewould be advantages to formulating and implementing a sectoral restructuringplan, particularly since the adjustment scenario discussed in Chapter IVdoes not project a large increase in the investment rate. One element of arestructuring plan could be the shift of activity from state enterprises tothe private sector, which doubled its share of construction-installationactivity from 13.4 percent in 1980 to 26.3 percent in 1985.
1.11 In the energy sector, Hungary has large reserves of lignite andbrown coal and modest reserves of coal and natural gas. The share of solidfuel in use has fallen from 62 percent in 1970 to 34 percent in 1985, whilehydrocarbons accounted for the largest share increase. Hungary producesnearly 90 percent of its coal needs but imports nearly 80 percent of itscrude oil needs. The large investments in oil-refining capacity undertakenduring the three Five-Year Plans between 1971 and 1985, however, have leftHungary virtually self-sufficient in the production of refined petroleumproducts. Although Hungary imports most of its crude oil from the SovietUnion, sizable spot purchases from the USSR, which are paid for inconvertible currencies, occur occasionally. In addition, Hungary exportsrefined petroleum products, almost all of which are sold to the nonruble area.
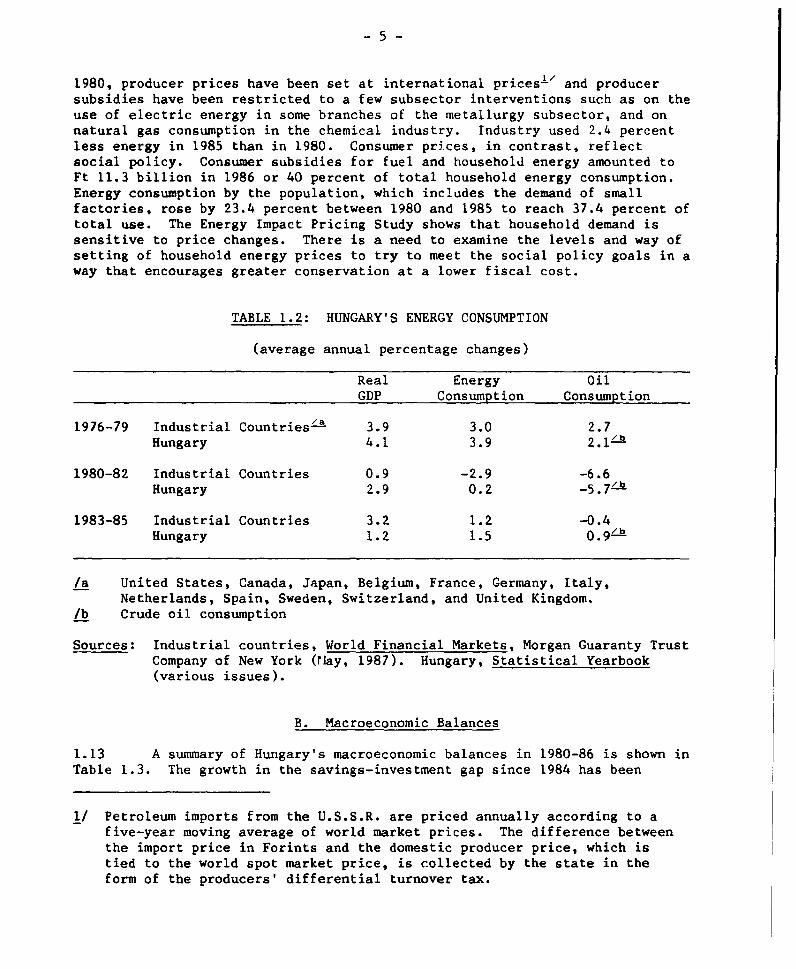
1.12 Energy conservation policy aims to reduce the energy elasticity ofGDP from 1.25 in 1983-85 to 0.35-0.4 by curbing production in energy-intensivesectors (metallurgy, and chemical fertilizers) and promoting energy-savinginvestments through subsidized credit. Efforts to conserve energy have beenless effective in slowing consumption in Hungary than in the industrialcountries (Table 1.2). Part of the reason for the poor record on energyconservation may be the subsidization of household energy prices. Since
- 5 -
1980, producer prices have been set at international prices-I and producersubsidies have been restricted to a few subsector interventions such as on theuse of electric energy in some branches of the metallurgy subsector, and onnatural gas consumption in the chemical industry. Industry used 2.4 percentless energy in 1985 than in 1980. Consumer prices, in contrast, reflectsocial policy. Consumer subsidies for fuel and household energy amounted toFt 11.3 billion in 1986 or 40 percent of total household energy consumption.Energy consumption by the population, which includes the demand of smallfactories, rose by 23.4 percent between 1980 and 1985 to reach 37.4 percent oftotal use. The Energy Impact Pricing Study shows that household demand issensitive to price changes. There is a need to examine the levels and way ofsetting of household energy prices to try to meet the social policy goals in away that encourages greater conservation at a lower fiscal cost.
TABLE 1.2: HUNGARY'S ENERGY CONSUMPTION
(average annual percentage changes)
Real Energy OilGDP Consumption Consumption
1976-79 Industrial Countries/a 3.9 3.0 2.7Hungary 4.1 3.9 2.1/b
1980-82 Industrial Countries 0.9 -2.9 -6.6Hungary 2.9 0.2 _5.7/b
1983-85 Industrial Countries 3.2 1.2 -0.4Hungary 1.2 1.5 0.9/b
/a United States, Canada, Japan, Belgium, France, Germany, Italy,Netherlands, Spain, Sweden, Switzerland, and United Kingdom.
/b Crude oil consumption
Sources: Industrial countries, World Financial Markets, Morgan Guaranty TrustCompany of New York (rlay, 1987). Hungary, Statistical Yearbook(various issues).
B. Macroeconomic Balances
1.13 A summary of Hungary's macroeconomic balances in 1980-86 is shown inTable 1.3. The growth in the savings-investment gap since 1984 has been
1/ Petroleum imports from the U.S.S.R. are priced annually according to afive-year moving average of world market prices. The difference betweenthe import price in Forints and the domestic producer price, which istied to the world spot market price, is collected by the state in theform of the producers' differential turnover tax.

-6-
Table 1.3: MACROECONOMIC BALANCES, 1981-87
(percent of GDP)
1981 1982 1983 1984 1985 1986 1987
Current account balance -3.5 -1.5 0.2 1.4 -0.3 -5.4 -2.2
Private and Enterprise Sectors
Gross fixed investment 17.5 17.5 16.0 16.0 15.5 18.8 19.0Fixed investment 14.3 14.3 14.1 13.3 12.9 16.0 16.2Households 3.1 3.3 3.6 3.7 3.7 4.9 4.6Enterprises 11.2 10.9 10.5 9.6 9.2 11.0 11.6Change in stocks 3.2 3.3 1.9 2.7 2.5 2 9 2.8
National savings 16.9 18.2 17.3 16.2 17.9 16.6 19.1Households 3.5 3.5 4.9 4.7 4.3 4.6 3.7Enterprises 13.4 14.7 12.4 11.6 13.6 12.0 15.4
Savings-Investment gap -0.5 0.6 1.3 0.2 2.5 -2.3 -0.1Households 0.4 0.2 1.3 0.9 0.6 -0.3 -0.9Enterprises -1.0 0.4 -0.0 -0.7 1.8 -1.9 1.0
Public Sector /a
Gross domestic investment 12.2 11.0 10.5 9.7 9.5 8.0 7.8Fixed investment 12.2 11.0 10.5 9.7 9.5 8.0 7.9Change in stocks 0.0 0.0 0.0 0.0 0.0 0.0 0.0
National savings 9.3 8.9 9.3 10.9 6.8 4.9 5.5Current revenues 67.1 65.4 67.8 67.7 64.9 71.3 65.9Current expenditures 57.9 56.5 58.4 56.7 58.1 66.4 60.4
Savings-investment gap -2.9 -2.1 -1.1 1.2 -2.8 -3.1 -2.3
Public and Private
Savings-investment gap -3.5 -1.5 0.2 1.4 -0.3 -5.4 -2.2
Memorandum items:
Share of domestic investmentfinanced by foreign savings 11.7 5.1 -0.7 -5.5 1.1 20.1 8.2
/a Public sector refers to the consolidated state and local governments.
Sources: Central Statistical Office, Ministry of Finance, and NationalPlanning Office, Government Financial Statistics (various issues).
filled by external borrowing. Stopping the growth of external debt requiresthat Hungary raise its saving rate relative to its investment rate. Thestabilization of 1982-84 relied on reducing the investment rate. That policy
-7-
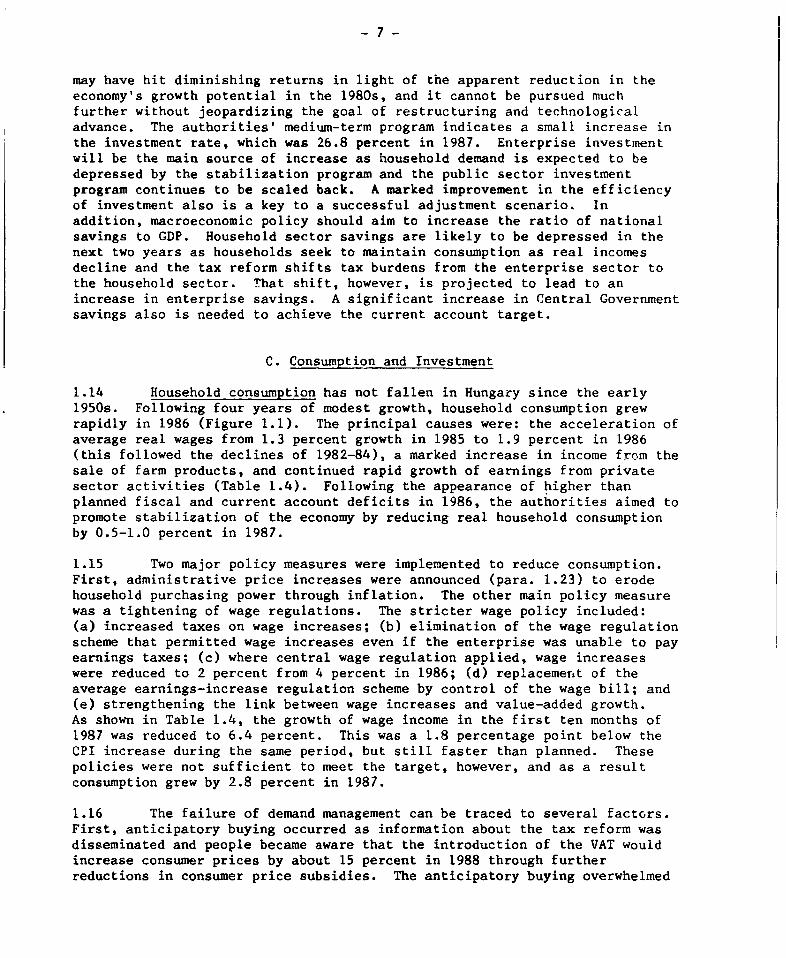
may have hit diminishing returns in light of the apparent reduction in theeconomy's growth potential in the 1980s, and it cannot be pursued muchfurther without jeopardizing the goal of restructuring and technologicaladvance. The authorities' medium-term program indicates a small increase inthe investment rate, which was 26.8 percent in 1987. Enterprise investmentwill be the main source of increase as household demand is expected to bedepressed by the stabilization program and the public sector investmentprogram continues to be scaled back. A marked improvement in the efficiencyof investment also is a key to a successful adjustment scenario. Inaddition, macroeconomic policy should aim to increase the ratio of nationalsavings to GDP. Household sector savings are likely to be depressed in thenext two years as households seek to maintain consumption as real incomesdecline and the tax reform shifts tax burdens from the enterprise sector tothe household sector. That shift, however, is projected to lead to anincrease in enterprise savings. A significant increase in Central Governmentsavings also is needed to achieve the current account target.
C. Consumption and Investment
1.14 Household consumption has not fallen in Hungary since the early1950s. Following four years of modest growth, household consumption grewrapidly in 1986 (Figure 1.1). The principal causes were: the acceleration ofaverage real wages from 1.3 percent growth in 1985 to 1.9 percent in 1986(this followed the declines of 1982-84), a marked increase in income from thesale of farm products, and continued rapid growth of earnings from privatesector activities (Table 1.4). Following the appearance of higher thanplanned fiscal and current account deficits in 1986, the authorities aimed topromote stabilization of the economy by reducing real household consumptionby 0.5-1.0 percent in 1987.
1.15 Two major policy measures were implemented to reduce consumption.First, administrative price increases were announced (para. 1.23) to erodehousehold purchasing power through inflation. The other main policy measurewas a tightening of wage regulations. The stricter wage policy included:(a) increased taxes on wage increases; (b) elimination of the wage regulationscheme that permitted wage increases even if the enterprise was unable to payearnings taxes; (c) where central wage regulation applied, wage increaseswere reduced to 2 percent from 4 percent in 1986; (d) replacement of theaverage earnings-increase regulation scheme by control of the wage bill; and(e) strengthening the link between wage increases and value-added growth.As shown in Table 1.4, the growth of wage income in the first ten months of1987 was reduced to 6.4 percent. This was a 1.8 percentage point below theCPI increase during the same period, but still faster than planned. Thesepolicies were not sufficient to meet the target, however, and as a resultconsumption grew by 2.8 percent in 1987.
1.16 The failure of demand management can be traced to several factors.First, anticipatory buying occurred as information about the tax reform wasdisseminated and people became aware that the introduction of the VAT wouldincrease consumer prices by about 15 percent in 1988 through furtherreductions in consumer price subsidies. The anticipatory buying overwhelmed

- 8 -
Table 1.4: CASH RECEIPTS OF THE POPULATION(FT billions)
Earnings Other Sales of Social Totalin Farm Labor Farm Benefits Other Cash
Wages Cooperatives Income Products in Cash Receipts /a Receipts
1984 207.0 35.9 11.9 47.9 115.9 110.5 528.61985 222.2 36.3 12.6 49.6 125.8 129.3 575.81986 238.1 38.0 14.4 54.5 136.8 147.9 629.71987 261.6 39.5 16.4 59.9 150.5 175.7 703.6
(Annual percentage changes)
1977 8.1 8.3 -0.8 24.6 9.8 14.4 10.31978 9.8 6.7 4.4 6.6 7.4 11.3 8.61979 6.4 5.9 -3.8 6.6 16.7 17.5 9.11980 2.6 4.7 5.7 11.4 15.7 25.4 9.51981 4.4 11.6 5.7 3.6 8.4 17.1 7.41982 5.0 11.0 5.0 11.4 8.5 14.2 8.11983 3.0 4.5 3.2 10.0 9.1 23.0 8.11984 5.2 -1.0 7.9 7.1 12.1 35.7 11.71985 7.3 1.2 5.3 3.7 8.5 17.5 8.91986 7.3 3.5 18.1 9.9 7.6 14.4 9.51987 7.7 3.9 13.8 9.8 9.6 18.8 10.8
/a Mainly receipts from private economic activities, and insurance receiptsother than social benefits.
Source: Monthly Bulletin of Statistics
the impact of administrative price increases that occurred in the first halfof 1987 and led to greater household consumption. Second, monetary policywas ineffective in draining excess liquidity from the enterprise sector,which permitted faster than planned wage increases. Monetary policy was alsounable to halt a decline in household savings. By drawing down their savingsdeposits, consumers were able to increase consumption despite the reductionin real income from wages. It is also likely that a liquidity overhangexisted at end-1986 (para. 1.26). An increase in interest rates on householdloans and deposits would have been an appropriate monetary policy. InSeptember, a 3 percentage point premium was added to long-term deposit ratesto try to reduce the flow from savings deposits, but by then much of thedamage was done. During the third quarter of 1987, household savingsdeposits declined by Ft 5 billion (about 2 percent), while currency holdingsincreased by Ft 6 billion more than planned. Total household savings areestimated to have fallen by 19 percent in 1987. Stabilization policy in 1988calls for a 2.0-2.5 percent reduction in household consumption. The needremains to develop flexible instruments of monetary control that can be usedto support a contractionary aggregate demand policy, and to use a more activeinterest rate policy.

-9-
1.17 Real gross fixed investment declined in each year during 1980 to1985 (Figure 1.1), the result of a stabilization policy that aimed to reducedomestic demand but protect household consumption levels. That trend wasreversed in 1986 when gross fixed investment grew by 6.5 percent. The fallin the investment rate resulted in an across-the-board fall in the growthrate of the capital stock (Table 1.1). Capital productivity has beennegative in Hungary since the mid-1970's_' but the effects of the lowproductivity on overall growth may have been less apparent when the capitalstock was growing more rapidly. The authorities' medium-term program callsfor a substantial improvement in the efficiency of investment. An improvedallocation of investment, favoring the manufacturing industries where Hungaryin potentially competitive, would help.
1.18 In 1986 there was a shift in investment composition toward themanufacturing industries and away from the basic materials and electricenergy subsectors. Investment in mining and electric energy (over 50 percentGovernment financed) fell by 7.2 percent and 4.7 percent respectively, andinvestment in metallurgy, another sector identified as needing restructuring,
Fisure 1.1: SOURCES OF GROWTH
(billions of 1981 Forint)
15~~~~~~~~~~~~~~~~~~~~~~~~~~~~0
10
5 <.
0~ ~~~~t
1911 192 193 1914 1965 19_5 1961
YearS wtncSMtIastastleM &W 1.
2/ The Economic Survey of Europe in 1986, U.N. Economic Commission forEurope discusses trends in factor and total productivity at the aggregatelevel through 1985. Report No. 6124-HU, Hungary: Industrial Policy,Performance, and Prospects for Adjustment, also discusses developmentsin factor and total productivity in Hungarian industry through 1983.
- 10 -
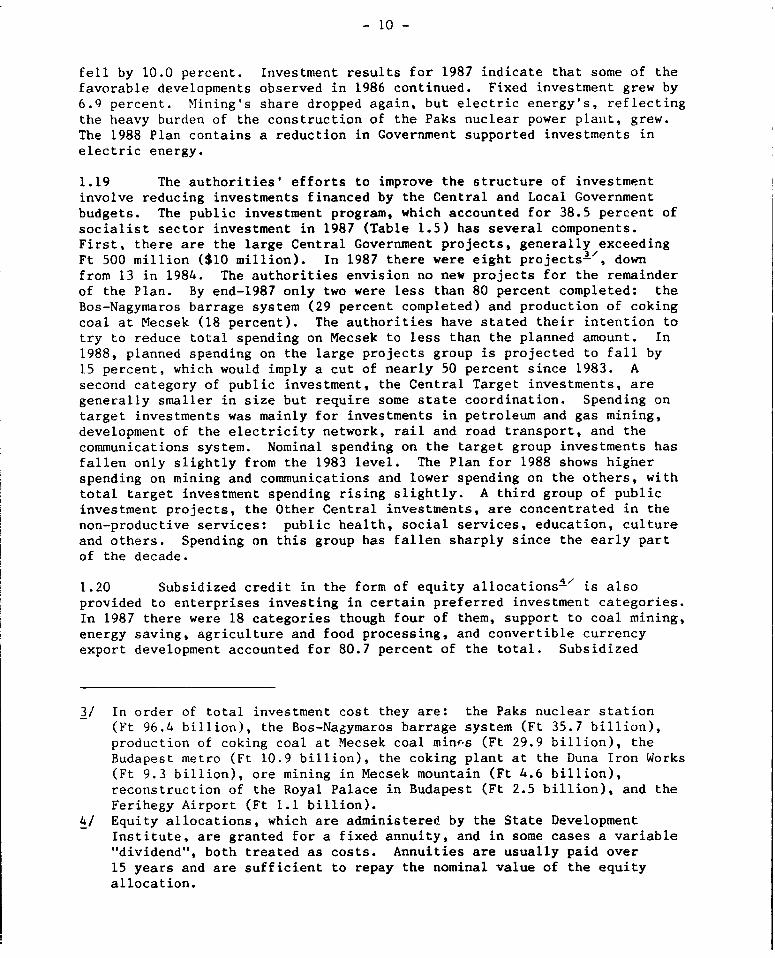
fell by 10.0 percent. Investment results for 1987 indicate that some of thefavorable developments observed in 1986 continued. Fixed investment grew by6.9 percent. Mining's share dropped again, but electric energy's, reflectingthe heavy burden of the construction of the Paks nuclear power plant, grew.The 1988 Plan contains a reduction in Government supported investments inelectric energy.
1.19 The authorities' efforts to improve the structure of investmentinvolve reducing investments financed by the Central and Local Governmentbudgets. The public investment program, which accounted for 38.5 percent ofsocialist sector investment in 1987 (Table 1.5) has several components.First, there are the large Central Government projects, generally exceedingFt 500 million ($10 million). In 1987 there were eight projects- , downfrom 13 in 1984. The authorities envision no new projects for the remainderof the Plan. By end-1987 only two were less than 80 percent completed: theBos-Nagymaros barrage system (29 percent completed) and production of cokingcoal at Mecsek (18 percent). The authorities have stated their intention totry to reduce total spending on Mecsek to less than the planned amount. In1988, planned spending on the large projects group is projected to fall by15 percent, which would imply a cut of nearly 50 percent since 1983. Asecond category of public investment, the Central Target investments, aregenerally smaller in size but require some state coordination. Spending ontarget investments was mainly for investments in petroleum and gas mining,development of the electricity network, rail and road transport, and thecommunications system. Nominal spending on the target group investments hasfallen only slightly from the 1983 level. The Plan for 1988 shows higherspending on mining and communications and lower spending on the others, withtotal target investment spending rising slightly. A third group of publicinvestment projects, the Other Central investments, are concentrated in thenon-productive services: public health, social services, education, cultureand others. Spending on this group has fallen sharply since the early partof the decade.
1.20 Subsidized credit in the form of equity allocations4- is alsoprovided to enterprises investing in certain preferred investment categories.In 1987 there were 18 categories though four of them, support to coal mining,energy saving, agriculture and food processing, and convertible currencyexport development accounted for 80.7 percent of the total. Subsidized
3/ In order of total investment cost they are: the Paks nuclear station(Ft 96.4 billion), the Bos-Nagymaros barrage system (Ft 35.7 billion),production of coking coal at Mecsek coal minvs (Ft 29.9 billion), theBudapest metro (Ft 10.9 billion), the coking plant at the Duna Iron Works(Ft 9.3 billion), ore mining in Mecsek mountain (Ft 4.6 billion),reconstruction of the Royal Palace in Budapest (Ft 2.5 billion), and theFerihegy Airport (Ft 1.1 billion).
4/ Equity allocations, which are administered by the State DevelopmentInstitute, are granted for a fixed annuity, and in some cases a variable"dividend", both treated as costs. Annuities are usually paid over15 years and are sufficient to repay the nominal value of the equityallocation.

- 11 -
Table 1.5: SOCIALIST SECTOR'' INVESTMENT, 1987
(Ft billions)
Councils,State State Bank Enterprises,Budget Loans Loans other sources Total
Central Government 19.8 11.9 - 23.4 55.1of which:-Large 2.4 7.0 - 4.2 13.6-Target 8.9 4.4 - 13.5 26.8-Other 8.5 0.5 - 5.7 14.7Loc&. Government 7.0 - - 27.8 34.8Enterprises 7.1 9.8 33.9 97.9 148.7Total 33.9 21.7 33.9 149.1 238.6
/a Socialist sector investmer.t comprises total investment less privatesector investment. In 1987 it was 81.1 percent of the total.
Source: National Planning Office
credit is administered by the State Development Institute (SDI) which borrowsfrom the National Bank of Hungary at a rate 0.5 percentage points below therate on long-term refinancing credit for commercial banks. A grant from theCentral Government covers the difference between SDI's earnings and its costof funds.
1.21 Local Government (Council) investments are the final component ofpublic investment. They are roughly equal in amount to central targetinvestments but are concentrated in infrastructure. Financing for Councilinvestments is mainly out of the grant from the Central Government budget,municipal taxes and user fees, and bond issues. Council investments areprojected to decrease by 22 percent in 1988 because of the failure of Councilrevenues, especially the grant from the Central Government, to increasesufficiently to offset higher current spending requirements.
1.22 As the role of the public sector has diminished, enterprises haveassumed a greater role in determining the allocation of investment. As thefigures from Table 1.5 indicate, only 29 percent of enterprise investment wasfinanced by loans, either from the State (through the SDI) or from commercialbanks. Retained earnings financed two-thirds of enterprise investment. Withsuch a large proportion financed by retained earnings, strict financialdiscipline is needed to ensure that enterprise investment decisions aresound. The reduction of State subsidies and financial supports toenterprises will help. The introduction of greater competition in theallocation of investment credit would help increase the efficiency ofenterprise investment. In the short-term, competition would be stimulated byforcing commercial banks to compete for long-term investment throughcompetitive bidding. In the medium-term, the continued development and
- 12 -
integration of the financial system should permit the use priority areas tobe phased out and the SDI to become better integrated into the financialsystem. The elimination of the requirement that long-term loans be matchedby long-term deposits, which restricts capital mobility, would also helpimprove the allocation of investment resources.
D. Public Finance
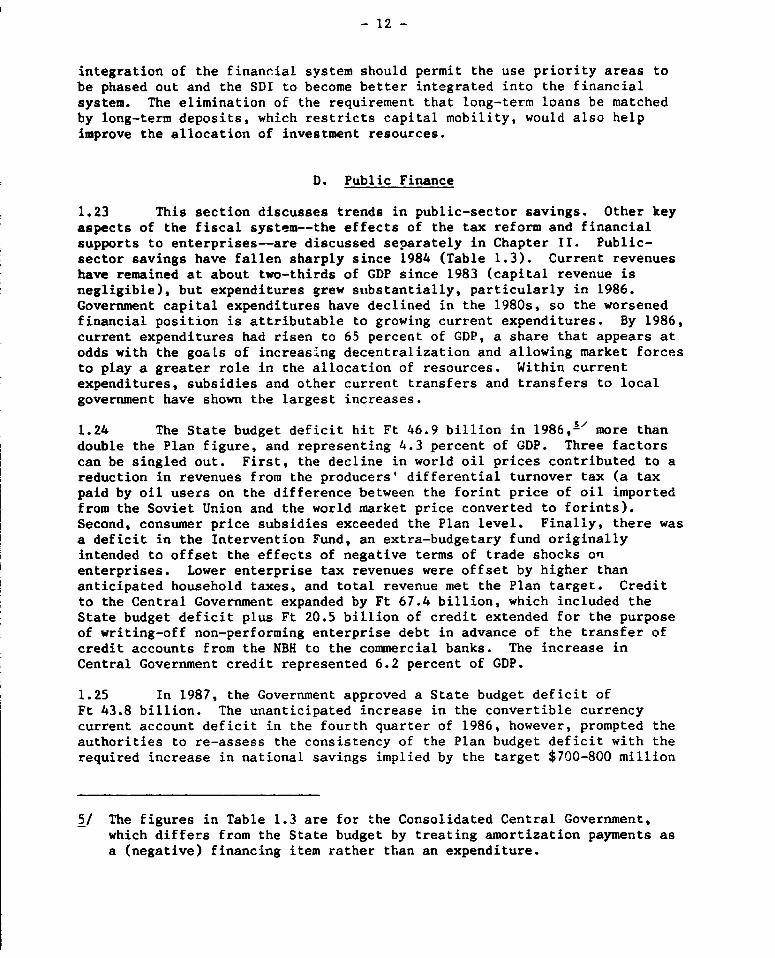
1.23 This section discusses trends in public-sector savings. Other keyaspects of the fiscal system--the effects of the tax reform and financialsupports to enterprises--are discussed separately in Chapter II. Public-sector savings have fallen sharply since 1984 (Table 1.3). Current revenueshave remained at about two-thirds of GDP since 1983 (capital revenue isnegligible), but expenditures grew stubstantially, particularly in 1986.Government capital expenditures have declined in the 1980s, so the worsenedfinancial position is attributable to growing current expenditures. By 1986,current expenditures had risen to 65 percent of GDP, a share that appears atodds with the goaLs of increasing decentralization and allowing market forcesto play a greater role in the allocation of resources. Within currentexpenditures, subsidies and other current transfers and transfers to localgovernment have shown the largest increases.
1.24 The State budget deficit hit Ft 46.9 billion in 1986, ' more thandouble the Plan figure, and representing 4.3 percent of GDP. Three factorscan be singled out. First, the decline in world oil prices contributed to areduction in revenues from the producers' differential turnover tax (a taxpaid by oil users on the difference between the forint price of oil importedfrom the Soviet Union and the world market price converted to forints).Second, consumer price subsidies exceeded the Plan level. Finally, there wasa deficit in the Intervention Fund, an extra-budgetary fund originallyintended to offset the effects of negative terms of trade shocks onenterprises. Lower enterprise tax revenues were offset by higher thananticipated household taxes, and total revenue met the Plan target. Creditto the Central Government expanded by Ft 67.4 billion, which included theState budget deficit plus Ft 20.5 billion of credit extended for the purposeof writing-off non-performing enterprise debt in advance of the transfer ofcredit accounts from the NBH to the commercial banks. The increase inCentral Government credit represented 6.2 percent of GDP.
1.25 In 1987, the Government approved a State budget deficit ofFt 43.8 billion. The unanticipated increase in the convertible currencycurrent account deficit in the fourth quarter of 1986, however, prompted theauthorities to re-assess the consistency of the Plan budget deficit with therequired increase in national savings implied by the target $700-800 million
5/ The figures in Table 1.3 are for the Consolidated Central Government,which differs from the State budget by treating amortization payments asa (negative) financing item rather than an expenditure.

- 13 -
current account deficit. As a result, the State budget deficit target wasreduced to Ft 30-35 billion. New measures necessary to support the lowerdeficit target were approved in April. The most important measure was anincrease in the ceiling on consuler price inflation to 9 percent from theinitial 7 percent level, which permitted consumer price subsidies to belowered. A series of price increases occurred in April, with the mostimportant being a 16-22 percent meat price increase. There was also an8 percent devaluation of the forint against the convertible currency basket.Finally, there was a 3.6 percent appreciation of the forint against thetransferable ruble, which was designed in part to raise revenue from theproducers' differential turnover tax. In July, another series of priceincreases occurred. These included a 20 percent increase in the prices ofhousehold energy, tobacco, and flour and bakery products, and a 10 percentincrease in gasoline and diesel oil prices. This combination of measuresreduced the State budget deficit to Ft 35 billion in 1987. Nevertheless,given the fall in the household savings rate during 1987, (para. 1.15) thereduction in the fiscal deficit was inadequate for a $700-800 million currentaccount deficit.
E. Money and Credit
1.26 The years 1982-84 were marked by tight credit and monetary policiesto support the goal of a current account surplus in the convertible currencybalance of payments. With the appearance of a $329 million surplus in 1984,credit target.: were relaxed and the growth of monetary and credit aggregatesaccelerated (Table 1.6). Plan targets for the growth of credit were overshotin 1985 and 1986. Much of the excessive growth of credit was credit to theCentral Government that resulted from the increasingly loose fiscal stanceBroad money also expanded rapidly in 1985 and 1986. Rapid growth of the realmoney supply may have created a liquidity overhang by end-1986. (A liquidityoverhang occurs when agents are forced to hold real money balances in excessof the desired amount. Limited possibilities for diversification of assetsand chronic excess demand for some consumer goods create the conditions for aliquidity overhang.) A sudden attempt to use these excess real balances putsadditional demand pressure on the domestic goods market, and could spill overinto the balance of payments, confounding efforts to implement an effectivemonetary policy. Developments in household consumption in 1987 wereconsistent with the existence of a liquidity overhang.
1.27 In January 1987, the two-tier banking system was created byseparating the commercial credit departments from the NBH. The authoritiesintended to pursue a tight monetary policy and target growth rates of M2, anddomestic credit were reduced consistent with a change in net foreignliabilities associated with a $700-&00 million convertible currency currentaccount deficit. After two years of excessive credit growth, however, the1987 targets were too loose. When data for the first half of 1987 revealedno significant slowing down in the rate of credit expansion--principally dueto continued rapid growth of credit to households and the Central Government--the monetary authorities reduced the refinancing limits that commercial bankscould extend for working capital credits. Combined with the measures to

- 14 -
contain the fiscal deficit, the tightening of short-term refinancing limitsslowed the growth of credit expansion at the end of 1987, though for the yearboth broad money growth and domestic credit growth exceeded their plantargets. The National Bank's lack of experience in conducting monetarypolicy may also have contributed to the faster than planned growth.
1.28 The credit plan for 1988 indicates a sharp contraction in domesticcredit growth and broad money growth (Table 1.6). Central Government creditgrowth is projected to slow to 0.6 percent, consistent with a fiscal deficitof Ft 10.4 billion of which Treasury bills sales to households and enterpriseswill finance Ft 3 billion. Household credit expansion, 80 percent of whichfinances housing, is projected to be 10.3 per.ent. The brunt of the creditcontraction wAl1 be borne by enterprises in the form of scarcer, moreexpensive short-term working capital. The income velocity of M2 is projectedto increase from 2.06 in 1987 to 2.31. The large increase in velocityreflects not only the tighter monetary policy, but also the effects offinancial innovations--including the introduction of treasury bills and thefurther development of the money market--and higher inflationary expectations.These would tend to lead households and enterprises to economize on the useof cash balances. The tight monetary policy is further justified by theunknown size of excess liquidity in the economy. There is a risk that,despite the anticipatory buying in 1987, household liquidity remainsexcessive. Excess enterprise liquidity also poses a danger because the
Table 1.6: MONETARY AND FINANCIAL DATA
(percentage growth rates)
1982 1983 1984 1985 1986 1987 1988/P
Money and quasimoney(M2) 6.7 3.8 5.2 10.1 14.1 7.9 1.7
Domestic credit 6.2 4.2 5.3 7.6 16.4 11.5 6.0Central Government(net) 50.5 -1.3 -60.3 83.9 324.0 37.4 0.6
Enterprise workingcapital 5.2 5.2 9.0 12.8 10.5 1.4 -1.8
Household 11.5 15.5 16.4 14.1 14.7 15.7 10.3
Memorandum items:Income velocityof M2 2.09 2.13 2.21 2.12 1.96 2.06 2.31
CPI inflation(percent) 6.9 7.3 8.3 7.0 5.3 9.0 15.0
/P Plan
Sources: Central Statistical Office, National Bank of Hungary.

- 15 -
household spending in the third and fourth quarters of 1987 may havetranslated into greater liquid asset holdings of enterprises. In 1988 theneed remains to develop instruments for short-term monetary management. Openmarket operations, for example, would allow more flexible monetary managementthan the current instruments, short term refinencing credit limits andreserve requirements. Implementing a treasury bill auction would create theconditions for open market operations, as well as develop the capitalmarket. A tight monetary policy will also help develop the capital market bypromo'-ing competition in the financial sector and increasing enterprisefinancial discipline.
1.29 At present, interest rate policy differentiates between thehousehold sector and the enterprise sector. Borrowing and lending rates forthe household sector are negative in real terms (Table 1.7), though the3 percentage point increase in long-term deposit rates inttoduced inSeptember 1987 (para. 1.16) should compensate for the accelesation ofconsumer price inflation in 1987. Housing loans, the bulk of householdcredit, carry a 1-3 percent nominal interest rate and a maximum maturity of35 years. Because of the low average yield of the National Savings Banks'(NSB) loan portfolio, increases in household deposits generate losses thstmust be covered by transfers from the Central Government budget. This couldlead the authorities to be overly cautious in raising household depositrates. Borrowing and lending rates for enterprises are in principle freelydetermined, but in practice the NBH continues to exert influence on theinterest rate structure through the interest rate on refinancing credit.This influence is likely to diminish as the interbank money market and openmarket operations develop.
1.30 The Hungarian financial system is being rapidly transformed. Thesegmentation of the household and enterprise financial markets persists,however, with full integration planned for 1989-90. Resolution of the housingfinance issue is blocking complete integration. Two main problems must beaddressed: the need to ensure that housing finance does not become starvedfor funds when financial institutions are free to compete for householddeposits; and the need to safeguard the social policy goal of providingassistance in hcusing finance. There is some urgency to resolving theseproblems. The solvency of the NSB would be threatened if disintermediationwere to occur. Integration of the two financial sectors also would increasecompetition in the banking system as commercial banks compete for housingdeposits. This could increase the interest sensitivity of the financialsystem, and enhance monetary policy. In addition, as competition develops,interest rates could play a larger role in the allocation of credit, whichcould improve the efficiency of investment.
F. Inflation
1.31 Maintaining relatively low inflation has been an important goal ofHungarian macroeconomic policy, and, as shown in Table 1.7 and StatisticalAppendix Table 5.2, inflation has been relatively low and stable. Thesuccessful anti-inflation policy has been an important factor in the heavy

- 16 -
Table. L7: KEY ECONOMIC VARIABLES, 1980-66
(percent)
1980 1981 1982 1983 1984 1985 1986 1987/Y
INCENTIVE INDICATORS
1. Real Effective Exchange Rate1.1 Index 1980=100 100.0 84.8 78.7 84.7 84.0 85.6 101.2 121.21.2 Annual Change (an increase
represents a depreciation) - -15.2 -7.2 7.6 -0.8. 1.9 18.2 19.8
2. Real Interest Rates2.1 One-year savings notes
(households) -4.6 1.S -3.6 -3.1 -'.0 -2.8 -1.2 -2.92.2 Long-term lending rate
(households) -5.6 -1.5 -3.6 -4.0 -4.9 -3.7 -2.2 -5.22.3 12-month time deposit rate
(enterprises) 1.0 0.7 -0.3 1.9 3.3 0.02.4 Long-term investment rate
(enterprises) 6.6 6.2 6.4 S.0 4.1 3.1
Memo Item: Change in the CPI 9.1 4.6 9 7.3 8.3 7.0 5.3 8.6
3. Index of Real Wages3.1 Real wage index (1980=100) 100.0 101.1 ;OJ.4 97.2 94.9 96.1 97.6 97.93.2 Annual change -1.7 1.1 -0.7 -3.2 -2.4 1.3 1.6 0.3
4. Ratios of Domestic AgriculturalPrices to International Prices
4.1 Soymeal 83.0 94.0 66.0 90.0 91.0 116.0 110.04.2 Wheat 39.0 41.0 40.0 46.0 42.0 56.0 66.04.3 Corn 56.0 57.0 65.0 66.0 47.0 59.0 94.0
EXTERNAL TRAOE INDICATORS
5. Volume Index of Exports (1980=100)5.1 Fuels. electric energy 100.0 87.2 140.1 212.7 211.6 121.7 159.0 161.05.2 Materials, semi-finished
products, spare parts 100.0 99.3 97.9 112.1 121.3 120.5 119.4 128.05.3 Machinery, transport equipment.
other capital goods 100.0 100.6 111.8 115.6 120.3 133.0 129.6 132.05.4 Industrial consumer goods 100.0 113.6 104.0 107.0 112.5 118.0 116.7 123.05.5 Materials for the food industry,
live animals. processed foodproducts 100.0 111.6 121.6 126.1 135.3 134.2 126.7 127.0
5.6 TOTAL 100.0 102.6 110.0 121.0 127.0 127.0 124.0 129.0
6. Export Shares World Trade6.1 Food 0.93 1.06 1.15 1.07 1.03 1.11 1.086.2 Metals and minerals 0.42 0.45 0.42 0.41 0.49 0.44 0.546.3 Total primaries 0.39 0.43 0.52 0.52 0.64 0.66 0.756.4 Chemicals 0.59 0.67 0.70 0.67 0.66 0.70 0.616.5 Machinery and transport equipment 0.58 0.54 0.58 0.55 0.49 0.53 0.496.6 Other manufacturers 0.SO 0.52 0.53 0.53 0.50 0.54 0.496.7 Total manufacturers 0.54 0.53 0.56 0.54 0.50 0.53 0.496.8 Total merchandise 0.47 0.49 0.54 0.54 0.54 0.57 0.54
7. Manufactured Exports (Ruble and Nonruble)7.1 Real growth rates 0.5 0.6 11.1 3.4 4.0 10.S -2.6 1.87.2 Value as share of total exports 26.2 25.3 26.9 25.8 25.4 28.8 30.1 30.0
8. Comodity Terms of Trade (X/M)8.1 Index 1980=100 (total) 100.0 99.2 97.0 94.5 92.6 91.6 88.4 89.0
8.1.1 Ruble 100.0 96.1 93.2 90.7 88.9 88.3 88.2 90.98.1.2 Nonruble 100.0 102.2 101.1 98.6 96.3 95.2 88.6 88.6
8.2 Annual change (total) 0.3 -0.8 -2.3 -2.5 -2.1 -1.0 -3.5 0.78.2.1 Ruble -1.1 -3.9 -3.1 -2.6 -2.0 -0.7 -0.1 3.08.2.2 Nonruble 1.7 2.2 -1.1 -2.4 -2.4 -1.1 -6.9 0.0
La Preliminary
Sources: Central Statistical Office, National Bank of Hungary, Statistical Yearbook (various issues),Efficiency Studies, Research Institute of Agricultural Economics. Budapest. 1986.

- 17 -
subsidization of both consumer and producer prices, which has led to pricedistortions, some of which have been mentioned. Policy induced distortionsare inevitably costly, and the cost is borne by the budget. The negativecorrelations between changes in credit to the government and changes innational accounts deflators, shown in Table 1.8, suggest than one of thereasons for growth in the fiscal deficit is spending on price subsidies tocontrol inflation. Consumer price inflation decelerated from 7 percent in1985 to 5.3 percent in 1986. The authorities relaxed the inflation ceilingin 1987, raising it to 9 percent in order to contain the fiscal deficit. Theconsumer price index is expected to increase by 15-16 percent in 1988 whenthe Value Added Tax is introduced. The authorities intend to reduce thenumber of subsidized commodities to a few basic ones including milk, householdheating, and public transportation and to implement a social benefits packageto compensate especially affected groups for the higher prices.
Table 1.8: CORRELATION COEFFICIENTS BETWEEN GOVERNMENT CREDIT EXPANSIONAND CHANGES IN NATIONAL ACCOUNTS DEFLATORS, 1981-86
Deflator forPrivate Public Gross fixed
GDP Consumption Consumption Consumption Investment
-.37 -.34 -.33 -.25 -.44
Source: National Bank of Hungary, Fobb nepgazdasagi folyamatok, 1986 andstaff calculations.
G. Current Account
1.32 A detailed look at the balance of payments from 1980 to 1987 ispresented in Tables 3.1 and 3.2 of the Statistical Appendix. Text Table 1.9summarizes recent developments in convertible currency transactions. Theprimary cause of the deterioration in the current account in 1985-86 was thetrade balance, which declined by $1.7 billion in 1985-86. Nonruble importvolumes grew by 2.6 percent in 1985 and 0.8 percent in 1986, while nonrubleexports declined by 6.6 percent and 3.8 percent. The 6.9 percent fall in thenonruble terms of trade in 1986 (Table 1.7), which cost the economy$350-400 million also contributed to the worsening trade balance. Thedepreciation of the dollar and declining commodity prices were the maincauses of the terms of trade loss. Hungary is adversely affected by adepreciation of the dollar because about 50 percent of its nonruble exportsare denominated in dollars, compared with only 30 percent of nonrubleimports. Hungarian organizations were not efficient in using forwardcontracts to hedge against exchange rate risk.
1.33 Partly to increase the effectiveness of the active exchange ratepolicy, in March 1987 the authorities canceled the Competitive Pricing Rule,which aimed at linking domestic price changes to world price changes for

- 18 -
Table 1.9: CONVERTIBLE CURRENCY CURRENT ACCOUNT, SELECTED ITEMS
(US$ millions)
1984 1985 1986 1987
Current Account 329 -457 -1419 -847Merchandise exports (fob) 4965 4475 4136 5078Merchandise imports (fob) 3729 4179 4675 5075Trade balance 1236 296 -539 3Tourism receipts (net) 163 149 199 368Current account/GDP ( percent) 1.7 -2.2 -6.0 -3.2
Source: National Bank of Hungary
about 80 percent of manufacturing turnover but had the effect of permittingincreases in export profitability to be translated into increases in domesticscales profitability. As a result of this and other measures, which arediscussed in Chapter II, in the first nine months of 1987, nonruble salesprices grew faster than domestic sales prices. In the light industrysubsector, for example nonruble sales prices grew by 10.5 percent, anddomestic sales prices by only 3.0 percent. Export performance alsoimproved. During 1987, the volume of nonruble exports grew by 5.0 percentand their value by 11.7 percent. Firmer commodity prices also helped Hungaryavoid a terms of trade loss in 1987. The increase in the volume of nonrubleexports and stable terms of trade compensated for the faster than Plannedgrowth of nonruble imports and contributed to the $542 million improvement inthe 1987 trade balance.
1.34 The balance of ruble trade continued to improve in 1987, recordinga trade surplus of $117 million, up from $17 million in 1986. Part of thelarger-than-expected improvement is attributable to a 2.8 percent terms oftrade gain, which is mainly due to the fall in oil prices as determined bythe Bucharest formula. Export volumes increased by 2.5 percent and importvolumes by 3.7 percent. The bulk of ruble trade is conducted throughbilateral agreements between CMEA member governments. In principle, theagreements maintain balance, and the appearance of a larger-than-expectedtrade surplus is awkward because the transferable ruble, which wasestablished in 1963 for the purpose of bilateral clearing of inter-CMEAtrade, has no "commodity convertibility" so that in practice it has failed tocreate the conditions for multilateral clearing. In addition to thedifficulty of clearing accounts, larger-than-planned ruble exports may be adrain on convertible currency. The Hungarian authorities' response to theaccumulation of a larger-than-expected trade surplus in 1987 was to try toreduce the attractiveness of ruble exports. In March 1987, the forint wasappreciated by 3.6 percent against the transferable ruble. The 2 percentprofit guarantee on ruble exports was eliminated in 1988, and onJanuary 1, 1988 a further 3.7 percent revaluation occurred.

- 19 -
H. External Debt and Creditworthiness
1.35 Hungary overcame a severe liquidity crisis in 1982, and, with thehelp of two IMF Stand-By Arrangements, in 1983-84 succeeded in producing acurrent account surplus, restructuring its debt and restoring itsinternational credit standing. Developments since 1985, however, have causedincreasing concern. The deteriorating macroeconomic performance was financedby relatively large amounts of external borrowing, and Hungary's debt anddebt service ratios grew sharply in 1985-86, as shown in Table 1.10 andFigure 1.2. In 1987, apprehension among lenders was reflected in a hardeningof the terms on Hungary's syndicated loans. The current situation requiresskillful macroeconomic management. Above all, it requires a soundmedium-term program showing progress in economic restructuring that willimprove Hungary's competitiveness, bring about a decline in the debt burdenand an improvement in long-term creditworthiness. Elements of such a programare discussed in Chapter IV.
1.36 Total external liabilities 1n convertible currencies, includingshort-term debt and outstanding IMF purchases, rose from $8.8 billion at theend of 1984 to $17.7 billion in 1987. Net external liabilities, measured asgross liabilities less the external assets of Hungary, rose even faster thangross debt, from $4.4 billion at end-1984 to an estimated $10.9 billion atthe end of 1987. At least half of the recent increase in Hungary's debtmeasured in dollars is explained by changes in cross exchange rates of majorcurrencies since 1985. By end-1986, 60 percent of Hungary's medium to longterm debt was repayable in currencies other than the dollar, up from20 percent at end-1984. Yen and Deutschemark denominated loans accounted for19 percent and 12 percent respectively of the total, though these figureswere probably lower bounds because loans repayable in multiple currenciesmade up 18 percent of the 1986 total.
1.37 The change in the ratio of net debt to exports (Figure 1.2), bothmeasured in dollars, measures the growth in the burden of Hungary's externaldebt. The ratio is less affected by the change in the value of the dollarthan is the total debt figure, since both numerator and denominator arecalculated in dollars. Hungary's net debt relative to exports of goods andservices rose from 66 percent in 1984 to an estimated 152 percent in 1987.Net debt relative to GDP, both measured in dollars, is a better measure ofthe long-term creditworthiness of an economy because, over time, resourcescan be shifted to foreign exchange earning or saving activities. Hungary'snet external debt relative to GDP, which was 20 percent in 1984, rose to33 percent in 1986 and to 42 percent in 1987.
1.38 The maturity distribution of Hungary's external debt indicates achange in borrowing strategy. Short-term debt fell to $1.9 billion or11.0 percent of total convertible currency debt in 1987, whereas in 1980,short-term debt accounted for 36.8 percent of the total. Table 1.11 showsHungary's debt service for 1984-87, as well as projections for 1988-90. Theimplications of the projections are discussed in Chapter IV. The $2.6 billionin 1986 amortization payments included prepayment of $523 million of of loanscontracted at relatively high interest rates. By prepaying such loans,

- 20 -
Table 1.10: CONVERTIBLE CURRENCY EXTERNAL DEBT(US$ millions)
1980 1981 1982 1983 1984 1985 1986 1987
Total debt 9090.0 8699.0 7715.0 8250.0 8835.6 11760.2 15085.6 17739.0of which:Long term 5743.0 5850.0 5951.0 6127.0 7414.8 10005.5 12663.9 15785.0Short term 3347.0 2849.0 1764.0 2123.0 1420.8 1705.2 2421.7 1954.0
Internationalreserves 2558.0 2033.0 1233.0 1862.0 2556.0 3543.0 3638.8 2478.0Other foreignassets 1256.0 1219.0 1539.0 1792.0 2196.7 3199.0 3656.8 4357.0Total foreignassets 3814.0 3252.0 2772.0 3654.0 4752.0 6742.0 7295.6 6835.0
Net externaldebt 5276.0 5447.0 4943.0 4596.0 4082.9 5018.2 7790.0 10904.0
(percent)Net debt/exports/a 87.6 89.2 76.9 74.0 66.1 81.7 117.6 151.8
Net debt/GDP 23.6 24.0 21.3 21.9 20.0 24.3 32.8 41.8Debt-serviceratio/a 13.5 13.5 31.0 32.0 41.8 51.3 56.4 47.5
/a Foreign exchange earnings are adjusted to include nonconvertible currencyexports corresponding to nonconvertible currency imports of energy and rawmaterials, and to exclude estimated re-exports. These adjustments are madebecause the nonconvertible currency exports represent potential convertiblecurrency exports. They would be sold for convertible currency if Hungarywere unable to import energy and raw materials from the nonconvertible area.
Sources: National Bank of Hungary, and Bank staff calculations.
Hungary has reduced its amortization profile through 1990. Principalrepayments were $2.3 billion in 1987, including early repayments ofapproximately $420 million. Interest payments have risen steadily since 1984and are projected to continue to rise through 1990, reflecting the growth inindebtedness. Total debt service rose from $2.6 billion in 1984 to$3.7 billion in 1986, but fell to $3.4 billion in 1987 and is projected toaverage $3.1 billion in 1988-90.
1.39 As discussed in Chapter IV, Hungary is expected to require$2.0 billion in gross inflows in 1988-90 to roll over maturing long-term debtand finance its current account deficits. Unlike 1985 and 1986 when the bulkof new funds came from syndicated loans, the share of bilateral and

- 21 -
Figure 1.2: CREDITWORTHINESS INDICATORS
(percent)
am
LID .
00
1 1X1 1C s 19
~~~U4 Wqa L LS ;5 Ln c
Table 1.11: EXTERNAL DEBT SERVICE
(US$ millions)
Projections1984 1985/a 1986/a 1987/a 1988 1989 1990
Total principal payments 1681 2210 2650 2286 1811 1628 1881of which:
Amortization 1681 2114 2600 1986 1520 1435 1778IMF repurchases 0 96 50 300 290 191 102
Total 'nterest payments 899 945 1085 1130 1296 1321 1330
of which: IMF charges 56 81 72 60 40 21 10Total debt service 2580 3155 3735 3416 3107 2949 3211
/a Amortization includes prepayment of medium and lor.g term debt which wouldhave matured in subsequent years. The amounts were $457 million in 1985,
$523 million in 1986, and approximately $420 million in 1987.
Sources: National Bank of Hungary and Bank staff estimates.

- 22 -
multilateral creditors is projected to increase substantially in 1988-90,though it is recognized that increased multilateral commitments depend on animprovement in the macroeconomic environment and on progress on the economicreform. To ensure its favorable access to international capital markets,Hungary must continue to generate improvements in the convertible currencytrade balance and eliminate the current account deficit. Debt managementalso might help reduce potential exchange rate losses on the debt, which, asnoted in para. 1.36, accounted for over half the growth in net debt between1984 and 1987.
I. Summary
1.40 During 1987, Hungary was able to reverse the deterioration in themacroeconomic balances that began in 1985. Economic growth quickened, andconvertible currency exports increased. The improvement in the convertiblecurrency current account fell srhorL of Lhe planned amount, nowever, and rorthe third consecutive year Hungary recorded a large increase in its netexternal debt. The need to service the large external debt and at the sametime make substantial progress toward achieving a current account surplus isthe most pressing constraint facing the authorities.
1.41 Several measures can be taken to support the positive developmentsthat emerged in 1987 and also satisfy the external constraint. There is aneed to develop rapidly the instruments that will support the restrictivedemand management policy the authorities intend to follow. One of thelessons of 1987 is that such instruments are not yet in place. Excessliquidity poses a danger in 1988, and a reduction in enterprise subsidies, atight monetary policy, and an active interest rate policy are needed toreduce the risks of such a danger. The introduction of open marketoperations in treasury bills would also help absorb a liquidity overhang.There is a need to increase the productivity of investment to sustain even amodest growth path. Increasing the share of investment resources allocatedthrough competitive markets will be effective only if tight enterprisefinancial discipline is established. Chapter II discusses ways of increasingfinancial discipline. The improvement of the incentive to export to thenonruble area was a favorable development in 1987. Measures to sustain thatincentive are needed to minimize the risk that export performance reverts tothe dismal pattern observed in 1985-86. Chapter III discusses measures thatwould help attain some of these targets. Chapter IV then discusses theelements of a medium-term adjustment scenario that would permit sustainablegrowth and satisfy the tight external constraint.
- 23 -
CHAPTER II
DOMESTIC POLICIES AND COMPETITION
2.01 The worsening economic performance in 1985 and 1986 described inChapter I occurred at the same time that reforms were liberalizing parts ofthe domestic regulatory environment to encourage the restructuring of a moreflexible, responsive economy. Legal restrictions on the establishment ofenterprises were reduced by allowing enterprises greater independence (andincentives) to found subsidiaries, joint ventures and other activities; bylegalizing small enterprise activity; and by abolishing the profilerestrictions regulating the production activities of enterprises. Because ofhigh concentration in the domestic market and limited import competition, theincentive system continued to shelter enterprises from competition, limitedtheir ability to produce more, better or different goods, and to respond tocompetition by reducing costs. In these circumstances it is not surprisingthat the reforms have not led to the hoped for quick improvement of theeconomy's supply response.
2.02 One lesson that has emerged from the Hungarian experience is that,without financial discipline, economic liberalization reforms can makemacroeconomic management difficult. A principal cause of financialindiscipline has been State financial supports to enterprises. In Hungary, acomplicated system of enterprise taxation effectively served as a separatefinancial system. Under this system, 90 percent of enterprise gross profitswere taxed away. The authorities have implemented reforms of the regulatoryenvironment designed to increase financial discipline and reduce the role ofthe Central Government budget in financial intermediation. A bankruptcy lawwas enacted that established the legal framework for winding-up insolvententerprises. A comprehensive tax reform was introduced on January 1, 1988 tosimplify the tax system and shift more of the tax burden from enterprises tohouseholds. The first and second parts of this chapter examine thesereforms.
2.03 Another important part of the incentive system is the domesticpricing system, which is discussed in the third part of this chapter. Theprice system simulating world market pricing was abandoned in March 1987 andthe focus of price reform is now to increase the percentage of goods whoseprices are market determined. Allowing greater import competition, inaddition to helping sustain an appropriate real exchange rate, would expandthe scope for market determined prices.
A. Establishing Financial Discipline
2.04 State financial support to Hungarian enterprises has grown steadilyand significantly since 1980 (Figure 2.1), reaching 22 percent of GDP in1987. Financial supports include direct and indirect subsidies such assubventions, investment support, tax forgiveness, debt forgiveness andrescheduling, and other support. The high level of financial support reducesenterprise financial discipline and strains the Government budget. Limited

- 24 -
data on the number of enterprises with long-term liquidity problems1'indicate that these supports are used to bail out firms with long-termliquidity problems. Thus, in 1984, when such financial support barelyincreased, there was a 26.7 percent increase in the average number ofenterprises with long-term liquidity problems, and a 38.8 percent increase inthe average amount of unrecoverable debts. By end-1986, after two years oflax demand management during which financial support grew by 28.7 percent,the average number of enterprises with long-term liquidity problems fell by60 percent, and the average amount of unrecoverable debt fell by47.1 percent. The concern is that the financial supports may keepinefficient enterprises in business, slowing restructuring.
2.05 In the past, a multiplicity of actors could intervene to grantfinancial support to enterprises. Crisis situations resulted in the creationof ad hoc interministerial state committees composed of representatives ofinterested bodies. The committees generally were temporary, and woulddisappear when Ehe crisis hau been surmounted. Their temperary nattire andthe lack of a central administrative body permitted ample scope for
Figure 2.1: ENTERPRISE FINANCIAL SUPPORTS
(billions of Forints)
250 -
240-
230-
220-
210a
200-
120 r170
140 IIIIIII
1980 19t1 1982 19U3 1964 1 9a5 19U5 1957
I/ Defined as enterprises and cooperatives which were insolvent and hadunrecoverable debts of at least Ft 25 million (about $500 thousand).Quarterly data is available beginning in 1983.
- 25 -
bargaining over outcomes. Further, restructuring or rehabilitation planswere often unfulfilled after the dissolution of the committee. The case ofthe Ganz-Mavag transportation equipment company is illustrative. The companyhas been refloated three times since 1976, the latest time through the newliquidation framework (para. 2.09). Performance criteria established in thefirst two refloatation operations were not met. The bankruptcy law went intoeffect in September 1986 establishing the Refloatation Institute to overseerefloatation agreements.
a. Regulatory Environment
2.06 Annex Al describes in more detail the system of enterprisesubsidies. Briefly seven major categories of subsidies are administered byseveral actors. The Central Government administers the largest part of thetotal, 70 percent in 1987 but only 57 percent in the 1988 Plan. Thedeclining role of the Central Government in subsidizing enterprises is atrend that dates back at least to 1981 when 93 percent of enterprisesubsidies were channeled through the State budget. Subsidies from localCouncils, decentralized funds and other sources account for the rest. Thevarious kinds of subsidies, and more importantly their large volume, drive awedge between enterprises and market forces. In some cases, subsidies havebeen used to support loss-making enterprises. Such support sends a signal toenterprise managers that discourages a timely response to difficulties andadaptation to market forces. The use of financial supports to prop-uploss-making enterprises also inhibits entry by soaking-up financialresources, crowding out possible new entrants. These supports also put aheavy burden on the evolving financial system and inhibit the efficient useof financial and physical capital.
2.07 The government has recognized the fiscal and efficiency burden thatthe high level of enterprise financial sup orts represents, and it has madeseveral changes in the regulatory environment to reduce this burden. First,the introduction of the Value Added Tax and the Personal Income Tax,discussed in the second part of this chapter, should reduce the scope forbargaining over taxes and duties. Second, the enactment of a bankruptcy lawcreates the institutional environment necessary for the liquidation ofloss-making enterprises. Finally, permitting existing enterprises to convertthemselves partly into shareholding companies represents an importantliberalization of the legal framework governing economic activity that couldreduce the need for government intervention to prop-up loss-makingenterprises.
2.08 The new law decree on bankruptcy was enacted and came into force onSeptember 1, 1986, repealing the previous legislation dating to 1978.Briefly, liquidation proceedings may be brought against an enterprise when ithas continuously been insolvent, (i.e., when its liabilities exceed assets)and it fails to meet claims against it. The Budapest court has jurisdictionover the liquidation proceeding and decides the issue of insolvency. Theliquidation process involves several steps, the first of which is a thirty-dayconciliation period during which an agreement with creditors is sought. Ifnone is reached, the Ministry of Finance can decide within another thirty

- 26 -
days to refloat the enterprise. If no refloatation is grar.ted, theliquidation of the enterprise is carried out by a liquidator appointed by theCouncil of Ministers. If a decision to refloat is taken, the refloatationplan must be completed within six months.
2.09 The law on bankruptcy in principle provides the institutionalframework for the timely exit of insolvent enterprises. Its applicationduring the first year has been a disappointment, though it is possible thacearly expectations of a large number of liquidations were unrealistic. Inaddition, there appears to have been a bias in the liquidation process towardrefloatation and away from liquidation. The Refloatation Comamittee, thegovernment body that oversees the liquidation process, dealt with elevencases in 1987. In one case, agreement was reached between creditors and theenterprise during the mandatory conciliation period. Two of the enterpriseswere liquidated, and eight are in various stages of being refloated. Threeof the five,industrial enterprises being refloated are very large (Ganz-Mavagand the Mecsek and Tatabanya coal mines). Expectatinng for even moreliquidations in 1987 perhaps failed to consider the heavy concentration oflosses. The five industrial enterprises accounted for 50 percent of totalindustrial enterprise losses in 1986 and nearly 10 percent of industrialvalue-added. Justification for refloating rather than liquidating the largeenterprises is usually based on the adverse employment consequences ofliquidation; avoiding such consequences is specified in the bankruptcy law asgrounds for state intervention to prevent liquidation. The need to meetcontractual .nternational export obligations, and the possibility of anadverse effect on the balance of payments are also cited. The issue of openunemployment is becoming less contentious, and the authorities estimate thatabout 100,000 industrial workers will become unemployed by 1990 as a resultof the stabilization/reform program discussed in Chapter IV.
2.10 The experience through 1987 suggests that some additional measuresare needed to increase the effectiveness of the refloatation/liquidationpolicy. The most important measure is a limit on the scope for CentralGovernment intervention through various channels to circumvent theliquidation process. A sharp reduction in total enterprise subsidies isneeded. The 1988 Plan contains a 15 percent reduction ir such subsidies andfor 1989 and 1990 the authorities are committed to further reductions of10 percent per year from the 1988 Plan level. This subsidy reduction programwill increase financial discipline and encourage greater enterpriseefficiency. In addition, strict limit on debt to equity conversions by theSDI would reinforce the authorities' commitment to stop providing specialfinancial support outside the liquidation framework.
2.11 The financing of the Refloatation Institute also creates theimpression that rehabilitation is the preferred outcome. That impressionguides the behavior of enterprise managers, and it may discourage them fromtaking early measures to avoid bankruptcy because they expect favorabletreatment in the liquidation process. To change this impression, statutorylimitations on the financing of the Refloatation Institute are needed. It isrecommended that the government guarantee of bonds and bank credit to financethe Refloatation Fund be eliminated and the Refinance Institute's source offinance be limited to the amount provided through the Central Government

- 27 -
budget. The authorities have agreed to implement these recommended changesbeginning in 1988.
2.12 In addition to reducing enterprise subsidies, the bankruptcy lawwould be made more effective if creditors were more interested in thesoundness of their loans. There is conflicting evidence on whether thecapital base of any of the newly established commercial banks is sufficientto withstand the liquidation of a large borrower. That this question existsafter one year of operations is evidence that the auditing proceduras ofbanks are inadequate. A portfolio audit will be carried out during 1988 bythe office of the State Banking Supervisor to determine the scope of theproblem of non-performing loans and the capital adequacy of the commercialbanks. The findings of the audit can be used to pinpoint the worst cases ofoverexposure, and measures to improve them can be formulated. In themeantime, it has been noted by the World Bank's Financial Market Study thatthe present system of permitting banks to set aside risk reserves of up to20 perccnt of pre-tax profits may be inadequate. To address this problem,regulations on loan loss provisioning were tightened, including a requirementthat a 20 percent reserve be set aside on bad debts. 2/ In addition,creditors would have a greater incentive to begin bankruptcy proceedings ifcapital gains from the sale of assets of liquidated companies were tax exempt.
2.13 Changes in the rehabilitation packages may encourage enterprisemanagers to react more quickly to market changes. Concessions granted aspart of rehabilitation packages, including preferential credit, debtrescheduling and write-off, and tax forgiveness may cause managers to delayadjustment in the expectation of a favorable outcome of the liquidationproceeding. Increasing the accountability of enterprise managers, as well asthe incentives, could be ways of stimulating an improved competitiveperformance. In some countries bankruptcy is considered a failure of topmanagement, which is almost always replaced by a new management team. InHungary, rehabilitation agreements seldom result. in changes of management.One reason could be a lack of managerial candidates who would want the topjobs in failing enterprises. To overcome this problem, managers fromsuccessful companies could be lent to ailing enterprises to guide themthrough the restructuring and to groom a new management team.
2.14 Changes in the regulations on the forms of economic association mayalso help foster domestic competition. The maximum number of employees inprivate enterprises was recently doubled to 30. During 1988, individualswill be permitted to form limited liability companies. In January 1989,enactment of a new Law of Association is planned. Legislative changes willpermit: (i) state enterprises to convert themselves into joint stockcompanies; (ii) individuals to hold shares in joint stock companies; and(iii) single individuals to create limited liability associations and joint
2/ A debt is classified as bad when a principal or interest payment isoverdue by more than 60 days (90 days in the case of accounts receivablegreater than Ft 25 million ($500 thousand)).

- 28 -
stock companies. These changes to the regulatory framework have thepotential to alter significantly the regulatory framework affectingenterprises by stimulating entry and increasing capital mobility. Greatercapital mobility would facilitate the break-up of insolvent enterprises bymaking it easier to shift assets to higher profitability activities.
B. The Hungarian Tax Reform
2.15 When the authorities renewed the economic reform in 1985, taxreform was seen as an important step. The aims of tax reform were to reducethe over-complicated system of financial intermediation through budgetaryredistribution, which had given rise to an inequitable and inconsistent taxsystem. The technical assistance of the IMF was requested to help design andimplement a Value Added Tax, or VAT, and a Personal Income Tax, or PIT. Withthe help of the IMF, the authorities implemented both these taxes onJanuary 1, 1988, and at the same time removed several other caxes. The VATand the PIT have several advantages over the former tax system. The VAT isan efficient tax because it is neutral with respect to the structure ofproduction. In contrast, the previous system had over 100 rates of turnovertax, numerous direct price subsidies, as well as direct taxes that werefrequently negotiated on a case-by-case basis. This system led to theinequitable situation of different tax treatment of the same product, andreduced production efficiency by permitting some inefficient operations tosurvive because of favorable tax treatment. The aim of the authorities inintroducing the PIT was to eliminate the principal shortcomings of the oldsystem, which included a multiplicity of taxes and rates on similar bases,the great complexity of the system, and the inequitable treatment of personsin similar situations.
2.16 The extent to which the system has been simplified can be seen byconsidering the situation of an employee of a socialist enterprise who alsobelongs to an enterprise working association (a VGMK, which works on contractfor an enterprise after normal working hours), has a household plot, and somebond holdings. Such an individual's income would have been subject to eightdifferent taxes under the old system. Under the new system, that number willbe reduced to two. Moreover, by integrating the income earned from privatesector activities into the PIT, the new system will help eliminate thepercepticn that too much of private sector earnings were escaping taxation.In addition, integrating private sector earnings into the PIT, amounts to arecognition of the importance of the private sector in the Hungarian economy.
2.17 The tax reform represents a major accomplishment that has thepotential to greatly improve the efficiency of resource use. This sectionexamines the likely impact of the tax reform on the enterprise sector, theprivate sector, and the fiscal deficit. The message is that, despite theimportance of the tax reform as a way of improving resource use in theeconomy, some improvements can still be made. In addition, the possibilitythat the tax reform could worsen the budget balarce is a strong reason forthe authorities to have a package of contingency expenditure cuts tosafeguard the fiscal deficit target.

- 29 -
a. The Impact of the Tax Reform on Socialist Sector Enterprises
2.18 The VAT is borne by final consumers and hence does not directlyaffect enterprises. The PIT will affect enterprises as they are required to"gross-up" employee salaries on January 1, l9R8 so as to leave the employeesno worse off after paying the PIT anid the higher social security contribution.In addition to the VAT and the PIT, a progressive tax levied according to theratio of distributed profits to the total of wages and salaries was alsointroduced on January 1, 1988. The other way the tax reform will affectenterprises is through the elimination of the following taxes: (1) the wagetax, a 10 percent tax on the wage bill plus fringe benefits paid to employees;(2) the 15 percent municipal profits tax; (3) the net worth tax, a 3 percenttax on the net worth of the enterprise; and (4) the earnings tax, which waspaid in connection with the regulation of :ihe earnings of employees from wagesand premia, through taxes on profit distribution and penal taxes on excessivewage increases will be retained. The most common form of the earnings tax,to which 76 percent of industrial sector enterprises were subject in 1986,was applied at rates similar to the PIT on individual employee earnings.
2.19 Table 2.1 examines the effect of the tax reform on socialist sectorenterprises by cmnoaring 1986 enterprise profits with what they would havebeen had the tax reform been introduced and had enterprise behavior notchanged (the column labelled "1988"). Out of total value added, total wagecosts rise by 15.2 percent due to the wage gross-up (see Annex 2 fordetails). Higher total wage costs mainly account for the decline in netbefore--tax profits after the tax reform. The other large difference arisesfrom the elimination of the earnings and wage taxes. As a result, dividendsplus retained earnings increase slightly as a result of the tax reform.
2.20 The elimination of the earnings and wage taxes may lead to a6 percent decrease in total labor costs, despite the increase in wage costsbrought about by the grossing-up requirement (see Annex 2 for details). Thefall in total labor costs is partly due to the assumption that enterprisespaid the 10 percent wage tax. Widespread exemptions from the wage taxexisted, however, and labor costs in enterprises that did not pay the wagetax would be likely to increase after the tax reform. Nevertheless, one aimof the tax reform was to raise the cost of labor in order to encourage moreefficient use by reducing i^onr hoarding. The possibility that labor costswill fall and that, as a result, enterprises will not be encouraged to uselabor more efficiently, increases the urgency of wage reforms to enhance thelink between produ-tivity and real wages. Toward that end, effectiveJanuary 1, 1989 t'-.3 authorities will introduce a wage reform that grantsmanagers in the productive sector (GDP less most services) ente.-prisescomplete freedom to 4etermine individual earnings (subject to an overalllimit on earnings increases related to enterprise performance).
2.21 The authorities originally intended to eliminate the tax oninvestment, bXit retained it in the socialist sector (at a higher rate and ina different form) due to concern that the increase in enterprise profits thatresulted from the tax reform could frustrate efforts to tighten demandmanagement. The investment tax now takes the form of a less than 100 percent
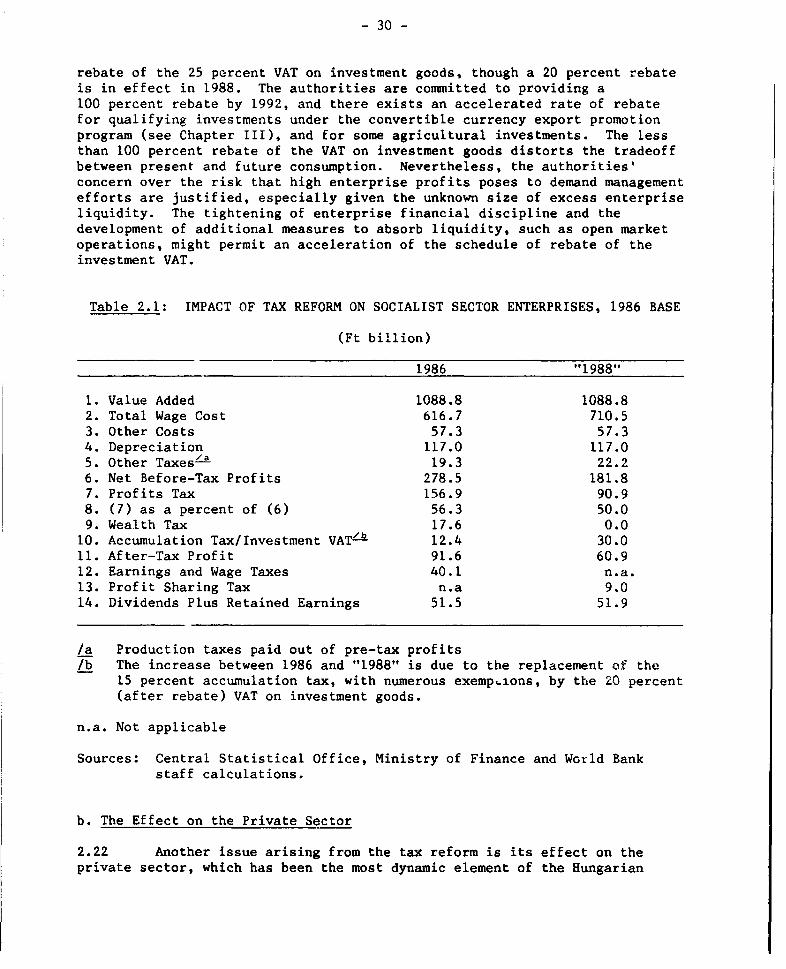
- 30 -
rebate of the 25 percent VAT on investment goods, though a 20 percent rebateis in effect in 1988. The authorities are committed to providing a100 percent rebate by 1992, and there exists an accelerated rate of rebatefor qualifying investments under the convertible currency export promotionprogram (see Chapter III), and for some agricultural investments. The lessthan 100 percent rebate of the VAT on investment goods distorts the tradeoffbetween present and future consumption. Nevertheless, the authorities'concern over the risk that high enterprise profits poses to demand managementefforts are justified, especially given the unknown size of excess enterpriseliquidity. The tightening of enterprise financial discipline and thedevelopment of additional measures to absorb liquidity, such as open marketoperations, might permit an acceleration of the schedule of rebate of theinvestment VAT.
Table 2.1: IMPACT OF TAX REFORM ON SOCIALIST SECTOR ENTERPRISES, 1986 BASE
(Ft billion)
1986 "1988"
1. Value Added 1088.8 1088.82. Total Wage Cost 616.7 710.53. Other Costs 57.3 57.34. Depreciation 117.0 117.05. Other Taxes/a 19.3 22.26. Net Before-Tax Profits 278.5 181.87. Profits Tax 156.9 90.98. (7) as a percent of (6) 56.3 50.09. Wealth Tax 17.6 0.010. Accumulation Tax/Investment VAT-b 12.4 30.011. After-Tax Profit 91.6 60.912. Earnings and Wage Taxes 40.1 n.a.13. Profit Sharing Tax n.a 9.014. Dividends Plus Retained Earnings 51.5 51.9
/a Production taxes paid out of pre-tax profits/b The increase between 1986 and "1988" is due to the replacement of the
15 percent accumulation tax, with numerous exemp.ions, by the 20 percent(after rebate) VAT on investment goods.
n.a. Not applicable
Sources: Central Statistical Office, Ministry of Finance and World Bankstaff calculations.
b. The Effect on the Private Sector
2.22 Another issue arising from the tax reform is its effect on theprivate sector, which has been the most dynamic element of the Hungarian

- 31 -
economy in the 1980s. The private sector grew by 5 percent per year during1981-86 to reach 15 percent of GDP. Domestic demand is projected to slowduring 1988-90 and the danger is that the tax reform will depress the privatesector precisely when its dynamism is needed most. This concern is mostacute for the non-agriculture private sector. A number of exeraptions andspecial provisions are available to the agriculture sector, which effectivelyexempt many small farmers from the PIT.
2.23 The situation for entrepreneurs outside the agriculture sector ismore mixed however. The main change in the tax treatment of non-agricultureentrepreneurs is the replacement of the association tax, a tax on employeewages with a maximum rate of 12 percent, by the entrepreneurial tax, a flat25 percent tax on profits (total revenue - material, wage and other costs -depreciation - social security contribution on the entrepreneur's income).3'A Ft 100,000 ($2000) exemption is granted under the entrepreneurial tax.Examples developed by the Ministry of Finance suggest that the higher rate ofthe entrepreneurial total tax compared with the association tax is likely toincrease the total tax burden of non-agriculture entrepreneurs after the taxreform.
2.24 The authorities are concerned that the perception exists that theprivate sector is being discriminated against as a result of the tax reform,and are investigating measures to eliminate that perception. Toward thatend, effect:-.ve January 1, 1989 entrepreneurs will be permitted to deduct thecost of their own labor input along with other wage costs. In addition, areform of the system of enterprise taxation is being elaborated forintroduction during 1989 to increase the neutrality of the tax system withrespect to the form of enterprise. Measures already introduced in 1988 thatshould stimulate private sector activity include: (i) no mandatory pricereduction for private enterprises (the VAT is expected to result in a fall inproducer prices, which socialist sector enterprises are required toreflect); (ii) reduced social security contributions on employee wagesduring the first year of operation; and (iii) full rebate of the VAT oninvestment, in contrast to the situation for socialist sector enterprises.
c. The Revenue Impact of the Tax Reform
2.25 One of the constraints on implementing the tax reform was that thebudget should move toward balance in 1988 starting from a budget deficit ofFt 35 billion (State budget format) in 1987. The hope when the reforminitially was discussed was that the tax reform (including accompanyingsubsidy reductions) would leave the real income of individuals and enterprisesunchanged, and would be budget neutral. Given the urgency of the stabiliza-tion need, this hope was abandoned. In practice, the main mechanism for
3/ Under the entrepreneurial tax, the 40 percent social securitycontribution on the entrepreneur's income may be treated as a cost.Previously, the social security contribution could only be deducted fromthe general income tax base.

- 32 -
reducing the fiscal deficit is not by introducing the new taxes, which appearto be revenue reducing, but by reducing consumer and producer subsidies.
2.26 Table 2.2 compares the projected yields of the new taxes with theyields of the former taxes as well as estimates of additional expendituresthat are expected to accompany the tax reform. Higher tax revenues areprojected to yield Ft 209 billion. The reduction of budgetary subsidies willyield Ft 53 billion so the total from revenue sources is Ft 262 billion.Revenue losses are projected at Ft 271 billion. Taxes to be eliminated in1988 would have yielded Ft 174 billion. The tax reform results in lowerrevenue from the profits tax and increases Central Government spending.Gross wages of Government employees will have to be increased to compensatefor the PIT and the higher social security contributions. In addition,Government spending will increase due to the introduction of a SocialBenefits package projected to cost Ft 27 billion in 1988. Compensation forDart of the higher expenditures of Local Government is also covered by thetransfer from the Central Government Budget.
Table 2.2: THE REVENUE EFF.CTS OF THE TAX REFORM
(Ft billions)
Revenue Sources Revenue Losses
New Taxes: Taxes to be Eliminated:VAT 94 59 Consumer Turnover TaxesPIT 68 31 Municipal TaxProfit-sharing Tax 9 17 Wage TaxInvestment VAT 30 21 Net Worth TaxEntrepreneurial Tax 8 28 Earnings Tax
Other Changes:Decrease in Subsidies: 13 Accumulation TaxConsumer 24 5 General Individual Income TaxProducer 29 Other Changes:
4 Lower Agriculture Production Taxes35 Lower Profit Taxes/a58 Increased Expenditures'b
Totals 262 271
Net Budgetary Impact -9
/a Net result; the higher profit tax rate adds Ft 9 billion, but the lowerprofit level subtracts Ft 44 billion.
/b Due to higher wage payments (Ft 7 billion), higher costs due to the VAT(Ft 6 billion) and increased social allowances (Ft 27 billion), andincreased transfer to Local Government (Ft 18 billion).
Source: Ministry of Finance

- 33 -
2.27 The estimated net budgetary impact is a loss of Ft 9 billion,indicating that further measures are needed to reach the target Ft 25 billionreduction in the State budget deficit in 1988. Even with additionalmeasures, uncertainty surrounding the estimate argues for even greaterdeficit reducing measures to be held in reserve. Faced with the possibilityof higher than anticipated 1988 fiscal deficits while planning the tax reformin 1987, the authorities retained a tax on investment in the form of a lessthan 100 percent rebate of the VAT on investment goods, and the 20 percenttax on the value of sales by private enterprises and small cooperatives tosocialist enterprises (the Countervalue Tax). The authorities also increasedemployer social security contributions to 40 percent from the 30 percent thatwould have implied balance of the Social Security Administration budget. Inaddition, the rates of the VAT and the PIT were increased for revenuereasons. The calculations in Table 2.2 include these additional revenues.In view of all that has been done, few remaining options exist for furthertax increases. Expenditure reductions, especially of enterprise subsidies,would serve the goals of stabilization and reform.
d. Conclusions
2.28 The tax reform is part of a wider process of economic reform. Itsmain benefit will be to create a stable, statutory and uniform fiscalenvironment that will allow enterprises greater freedom to succeed or fail bytheir own efforts. As the degree of discretion in the fiscal system isreduced, so special interventions should also be restricted and, where theyare essential, they should be justified more openly. This should help toclarify objectives and focus attention on the best way of achieving them. Inthe short-term, however, the tax reform could exacerbate some existingdistortions, particularly in its treatment of capital and labor, and have anegative impact on measures to restore macroeconomic equilibrium. The riskof worsening the Central Government deficit can be minimized by a contingencypackage of expenditure cuts. The revenue constraint limits the authorities'flexibility to eliminate the distortionary taxes however. The equity of thecurrent system would be further increased by implementing a uniform system ofenterprise taxation for all enterprise forms.
C. The Domestic Pricing System
2.29 Measures to reform the domestic pricing system have focused onreducing price subsidies and moving prices from the administered category tothe free category. Much work remains however. Chapter I mentioned thedistorted price of high protein animal feeds as an impediment to productivityimprovements in the meat industry. Chapter I also noted that thesubsidization of household heating may be discouraging efforts at energyconservation. Subsector specific producer price subsidies exist on electricenergy purchased by the metallurgy industry and on natural gas purchased bythe chemical industry. Price liberalization also aims to replace directprice controls by price regulation based on rules governing unfair marketpractices. This section examines recent developments in the pricing system,and expected 1988 developments.

- 34 -
a. Recent Developments
2.30 In March 1987 of the seven-year-old Competitive Pricing Rule wasabandoned. This rule applied to about the 80 percent of total industrialoutput sold in markets where elements of competition existed, either frommore than one domestic producer or from imports (the so-called competitivesector). 3- The Competitive Pricing Rule was supposed to simulate worldmarket pricing for exportable goods. In practice, however, it permittedenterprises to increase domestic prices so that changes in the profitabilityof domestic sales would mirror changes in the profitability of nonrubleexport sales. Dissatisfaction with the Competitive Pricing Rule becamewidespread in 1986. At that time, it appeared that successive devaluationswere having little effect on exports because the pricing rule alloweddomestic sales prices to rise as fast as export prices. As discussed inChapter III, in 1985 and 1986 the difference in profitability growth favoreddomestic sales over nonruble exports. Since August 1987, all price increaseshave required notification of the Price Office. This requirement waseliminated on April 1, 1988.
b. Future Reform of the Pricing System
2.31 Beginning April 1, 1988, consumer goods will be subject to fourcategories of pricing: administered (generally maximum) prices, pricessubject to advance reporting, prices arrived at through consultation, andprices subject only to general rules.4' These will cover 20 percent,22 percent, 5 percent and 53 percent, respectively, of consumer goodsturnover. A principal feature of the new system of consumer goods pricing isto shift from price regulation to the regulation of markets. Theconsultation system referred to above is designed to permit intervention inmarkets where excessive concentration or other problems make competitiveoutcomes unlikely. In the consultation process, buyers and sellers arebrought together for the purpose of arriving at a pricing strategy.
2.32 The authorities' intend to increase gradually the number of goodsin the free category, primarily by reducing the coverage of the advancereporting category. As of January 1, 1988, 62.5 percent of consumer goodsprices will be in the free category. Discussions with the authoritiesindicate that the proportion of prices subject only to general rules canincrease to about 70 percent by 1990. In addition, in 1988 the decree onunfair prices will be modified to conform to the Law of Unfair TradePractices, which will shift the focus of regulation away from price levelstoward market behavior. Chapter I has also identified several pricingdistortions in the administered price category. A .tudy of the levels and
3/ The evolution of the system during 1980-85 is described in Hungary:Investment Issues and Options, Report No. 5585-HU.
4/ The Import Pricing Rule, which limits domestic prices to the cif plustariff price of an equivalent import, and the Law of Unfair EconomicPractices, which proscribes certain trade practices.

- 35 -
method of setting the administered prices is needed to identify ways ofincreasing the efficiency and reducing the fiscal cost of the system.Finally, Chapter III will argue for trade reforms designed to increase importcompetition. Such a development would support the authorities' goal of priceliberalization by expanding the number of markets where competitive outcomescould be expected.
- 36 -
CHAPTER III
EXTERNAL POLICIES AND COMPETITION
3.01 Hungary has made significant progress in liberalizing export tradingrights and developing a consistent export promotion program which reliesheavily on an active exchange rate policy. Import competition remains weakhowever. Non-tariff barriers, principally the import licensing system,insulate most of domestic industry from any serious import competition.Furthermore, import competition for consumer goods industries is prevented bya global quota on consumer goods imports. The resulting protection of thedomestic market has contributed to the general problem of poor quality andtechnological backwardness of Hungarian industry. This chapter describes apossible approach to trade policy reform which broadly consists of:
- increasing the automaticity of the import licensing system
- the systematic removal of the quota on imports of consumer goodswithin a pre-announced period
- continued efforts to broaden, simplify and increase theefficiency of export incentives and institutions.
A. Export Policies and Incentives
a. Recent Trends in Competitiveness
3.02 As noted in Chapter I, the decrease in the volume of nonrubleexports in 1985-86 was an important factor in the deterioration of theconvertible currency trade balance. Hungary's poor export performance, inturn, was the result of a variety of influences, including the loss of exportcompetitiveness. The real effective exchange rate showed a markedappreciation in 1980-85 (Figure 3.1). It began to depreciate in 1986 as aresult of three nominal devaluations amounting to 12 percent which occurredthat year. In 1987, the forint was devalued twice: by 8 percent in March,and by 5 percent in November. A strong depreciation in 1986 would have beenthe appropriate policy response to the large negative terms of trade shockand abrupt closure of important external markets in 1986, which werediscussed in Chapter I. An even greater real depreciation than actuallyoccurred would probably have been required to reverse the loss ofcompetitiveness that occurred in 1980-85 however. The development of salesprice indices (Figure 3.1) also suggests that sales to the domestic marketwere more profitable than nonruble export sales, which, with the lower riskof domestic sales, further discouraged exports. As shown in Figure 3.1,developments since 1986 indicate that the active exchange rate policy hasincreased the relative profitability of nonruble export sales, though itremains lower than for domestic sales.
3.03 A concern of the authorities when considering exchange ratedevaluations is for the inflationary consequences. The authorities haveestimated the elasticity of the producer price index with respect to adevaluation to be 0.6 over a 1.5-year period, and 0.35 for the consumer price
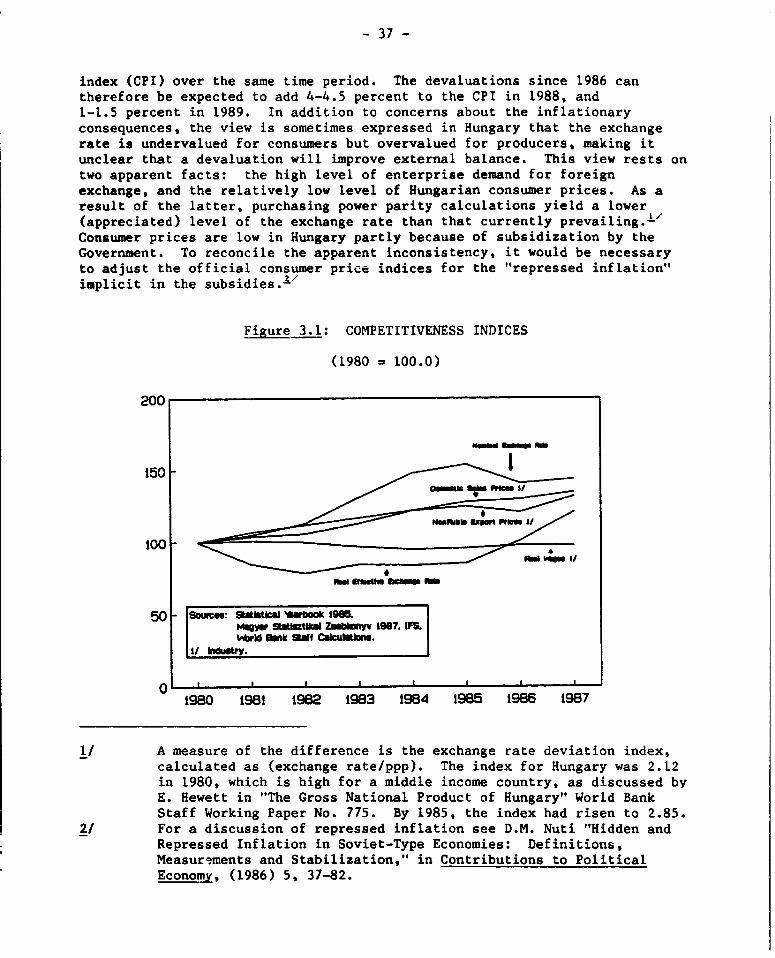
- 37 -
index (CPI) over the same time period. The devaluations since 1986 cantherefore be expected to add 4-4.5 percent to the CPI in 1988, and1-1.5 percent in 1989. In addition to concerns about the inflationaryconsequences, the view is sometimes expressed in Hungary that the exchangerate is undervalued for consumers but overvalued for producers, making itunclear that a devaluation will improve external balance. This view rests ontwo apparent facts: the high level of enterprise demand for foreignexchange, and the relatively low level of Hungarian consumer prices. As aresult of the latter, purchasing power parity calculations yield a lower(appreciated) level of the exchange rate than that currently prevailing.l'Consumer prices are low in Hungary partly because of subsidization by theGovernment. To reconcile the apparent inconsistency, it would be necessaryto adjust the official consumer price indices for the "repressed inflation"implicit in the subsidies. 2
Figure 3.1: COMPETITIVENESS INDICES
(1980 = 100.0)
200
150 -
50 Sotces: StatitWl cu'wbook 1965mqgm StaWiutl Zmblenyv 1987. IFMWaldW ank Sf CmIcuINiOnS.
I/ In.
0 ' I980 1981 1982 1983 1984 1985 1986 1987
1/ A measure of the difference is the exchange rate deviation index,calculated as (exchange rate/ppp). The index for Hungary was 2.12in 1980, which is high for a middle income country, as discussed byE. Hewett in "The Gross National Product of Hungary" World BankStaff Working Paper No. 775. By 1985, the index had risen to 2.85.
2/ For a discussion of repressed inflation see D.M. Nuti "Hidden andRepressed Inflation in Soviet-Type Economies: Definitions,Measurements and Stabilization," in Contributions to PoliticalEconomy, (1986) 5, 37-82.
- 38 -
b. Investment Incentives
3.04 Since 1986, the Hungarian government has granted investmentincentives for export-oriented projects. Any investment that exported atleast 60-70 percent of its output and has a payback period of five years outof the forint value of net foreign exchange earnings was eligible forexemption from accumulation tax, profit tax rebate of 50 percent of interestpayments, and equity allocations.-" The 217 investment projects assistedunder the export promotion program in 1986 amounted to Ft 8.6 biYion. whichrepresented only 4.1 percent of socialist sector investments but 37 percentof investments financed by loans from commercial banks and the State. Theinvestments are expected to generate additional exports of $200 million(equal to 5 percent of 1986 convertible currency exports) annually in thecoming years. In 1987, 278 projects from 236 enterprises were included. Thevalue of the projects represented 6.2 percent of socialist sectorinvestment. Effective in 1988, loans and equity allocations for exportoriented investments may be supplemented by funds from the Central TechnicalDevelopment Fund.
3.05 The investment incentives will increase export capacity by shiftingthe average investment pattern in favor of exports and by affecting the numberof eligible investment projects. Investment incentives are not efficientinstruments, however, to compensate export-oriented producers for anover-valued exchange rate or for the anti-export bias of the trade regime.Projects that are not viable without incentives may be encouraged, whichmight lead to inefficient exports and a distorted production structure.Moreover, promoting exports through new investments does not stimulateexisting producers to increase exports from existing plant and equipment orbetter use of capacity.
c. Other Export Promotion Measures
3.06 Since 1986, an automatic duty drawback system has been in effectwhich allows exporters access to imported inputs at international prices. Inaddition, there was a 6 percent export subsidy in the form of a rebate of theproducers differential turnover tax in 1986 and most of 1987.4' Specificexport subsidies have been limited to the agriculture sector. In 1986-87,the maximum export subsidy or agriculture exports was 34 percent includingthe rebate. In 1988, the rebate was eliminated and the maximum subsidy ratein agriculture was reduced to 28 percent.
3.07 Producers wishing to export were required to apply for foreigntrading rights before engaging in trade. In 1986-87, efforts to expand thenumber resulted in 48 enterprises obtaining specific foreign trade rights in
3/ With the elimination of the accumulation tax on January 1, 1988, a. 50 percent rebate of the VAT on investment is granted.
4/ In November 1987, the rate of subsidy was reduced from 6 percent to3 percent (see Annex 1).

- 39 -
1986, and 36 in 1987. Specific foreign trade rights limit the enterprise totrade in the items specified in the negative list. By end-1987 350 economicunits had specific foreign trade rights. In addition, 101 enterprises hadgeneral trading rights permitting trade in any product except those on thenegative list. Enterprises with general trading rights can trade their ownproducts as well as those of other enterprises. Beginning in 1988, thegranting of foreign trade rights became automatic. Enterprises wishing totrade will need only to register with the Ministry of Trade. Refusal oftrading rights can occur only if the enterprise does not meet pre-specifiedtechnical conditions for the granting of such rights. Since 1984, Hungary hasalso permitted customs free zones to operate. By end-1987, 30 enterpriseswere operating in these zones. Export credits have been an important elementin Hungary's export promotion program. As shown in Table 3.1, in 1986 thegrowth of total credits declined due to the cost of this strategy and toconcern about the creditworthiness of some borrowers. In 1987, however, therewas a large increase in short-term export finance credits due to the growth ofnonruble exports. The authorities intend to limit the use of export financein promoting exports.
Table 3.1: EXPORT CREDIrS IN CONVERTIBLE CURRENCIES
(net flows, US$ millions)
1982 1983 1984 1985 1986 1987
Medium and long term 192 65 125 284 311 97Short term 161 239 307 267 14 442Total 353 304 432 551 325 539
Source: National Bank of Hungary
B. Nonruble Import Policies and Incentives
a. Recent Trends in Tariffs and Effective Protection
3.08 Over the past five years, the average level of tariffs in Hungaryhas decreased. It was 17.6 percent in 1986, and reduced to 16.6 percent in1987 in accordance with Hungary's GATT obligations. A further 1 percentreduction in the average tariff rate will occur in 1988. In addition totariffs, three fees are levied on the forint value of convertible currencyimports: a license fee, a customs clearance fee, and a statistical fee. InNovember 1987 the fees were raised from 6 percent to 9 perent as a transitorymeasure to dampen import demand. In April 1988 the customs clearance fee wasreduced from 4 percent to 3 percent, and the statistical fee from 4 percentto 2 percent thus reducing the total fee to 6 percent. Quantification of thelevel and structure of protection in 1981-85 is provided by the work performedby the Ministry of Trade, which is updating the work using data for 1986-87.

- 40 -
3.09 Between 1981 and 1984 anti-export bias, as measured by the differencebetween the average ERP for domestic sales and the ERP for exports, increasedsubstantially for both industry and agriculture. The major cause was thereduction in indirect tax rebates and export subsidies during the period. Theindirect tax rebate was raised again in 1985 and agriculture subsidies alsoincreased, reducing the anti-export bias against exports of industry andagriculture. Tariff rationalization also reduced the effective rate ofprotection of home-market producers in industry, and consequently the anti-export b.as of tariffs in industry was largely eliminated. Tariff rationali-zation continued in 1986-87, and no major changes in the indirect tax rebateoccurred; so it is likely that anti-export bias in industry remainednegligible. In 1988 the VAT, which is fully rebated on export goods, replacedthe system of turnover taxes, which were not rebated on export goods. Thiswill have an opposite effect from the elimination of the producersdifferential turnover tax rebate, so that, with the continued reduction ofaverage nominal protection, the anti-export bias of the trade regime is likelyto remain small. A more precise assessment must await the updated ERP study.
b. Non-Tariff Import Barriers
3.10 Non-tariff import barriers are particularly distorting because theprotection they afford the domestic market may be infinitely high and hencemay be difficult to offset by changes in relative prices. Although theimport regime has been liberalized, there still exists a global quota onconsumer goods. In 1988, the quota restricts such imports to $170 million,the same as the 1987 quota amount. Quotas on consumer goods are usuallypreferred to quotas on capital goods and intermediate inputs because they areconsidered to cause less distortion of the production structure. Thispresumption rests on the existence of competitive internal markets, which inHungary are limited in scope. In this case, the inefficiencies resultingfrom the import quotas on consumer goods should not be underestimated. Apartfrom limiting consumer choice, domestic producers have less incentive forquality improvements. Consumer goods can exert a strong quality disciplineacross all categories of'goods.
3.11 All other imports are subject to an import licensing requirement.The import license authorizes the holder to enter a foreign trade contract,to purchase the foreign currency needed to perform the contract, and toimplement the contract. Licenses are administered by the Ministry of Trade,which is obligated to act on requests within 30 days. The system isquasi-automatic in principle and no formal changes have been made after 1984,when general quantitative restrictions on imports were abolished. Inpractice, however, the administration of the licensing system has in somecases resulted in delays in the granting of licenses. In early 1988, theauthorities acted to ensure expeditious issue of import licenses toconvertible currency exporters.
C. Recommendations
3.12 Hungary has made progress in rationalizing the system of exportincentives. A major element, the active exchange rate policy, can be

- 41 -
expected to yield positive results with the increase in enterprise financialdiscipline. The liberalization of foreign trade rights is an additionalpositive development. Initial indications suggest a sharp increase in theapplications occurred in the beginning of 1988. Further progress onrationalizing the system of export promotion should focus on eliminacing theanti-export bias of Lhe trade regime. The results of the updated ERP studycould be used to further rationalize protection across sectors subject toHungary's obligatior.s under multilateral trade negotiations. As forinvestment incentives for developing export industries, the most efficientmeasure would be to increase fixiancial discipline and provide a sustained,appropriate real exchange rate.
3.13 The report also recommends the gradual elimination of the twonon-tariff barriers: the licensing system and the consumer goods quota.Such a development, the report argues, would stimulate import competition,exert a strong discipline on domestic markets, promote the aim of priceliberalization and encourage nonruble exports by depreciating the equilibriumlevel of the real exchange rate (the price of tradables relative to the priceof nontradables). Elimination of the consumer goods quota could proceed byreplacing the quota by temporary tariff surcharges set initially toapproximate the effective protection provided by the quantitativerestriction. The tariff surcharges would then decline to zero over apre-determined period. Reform of the general import licensing system shouldaim to increase the automaticity of the system by minimizing the scope foradministrative delays in granting licenses. The Hungarian authorities arenot yet persuaded of the need to reform the general import licensing system.They are committed to carrying out a study of the regulatory frameworkgoverning foreign trade, including the import licensing system, during 1988in order to determine what other modifications, apart from ensuringexpeditious access to exporters, are required. The design of the study isbeing agreed with the World Bank, and the results will form part of Hungary'sdialogue with the Bank.

- 42 -
CHAPTER IV
THE MEDIUM TERM PROSPECTS
4.01 Despite the improved economic performance in 1987, Hungary'smacroeconomic situation remains precarious. The gross financing requirementis large, and meeting it requires further progress toward eliminating theinternal and external imbalances. At the same time, achieving sustainablemedium-term growth requires continued economic reform. The history ofeconomic reform in Hungary shows that stabilization and reform are not alwaysin harmony. In 1988, however, there are a;ome reasons for expecting fewerproblems than in earlier periods. The significant achievements in the reformto date should increase the effectiveness of the indirect instruments throughwhich the contractionary demand policy will be implemented. Also, some ofthe reforms themselves should elicit an improved supply response. Theinability to implement successfully the tight demand policy remains asignificant risk, however. In the rest of this chapter, the elements asuccessful stabilization with reform scenario are discussed. The risks tothe scenario are also discussed.
A. The Economic Stabilization and Structural Reform Program
4.02 The unexpectedly large deterioration in the macroeconomic balancesin 1986, the first year of the Seventh Five-Year Plan (1986-90), prompted areassessment of the feasibility of the entire Plan. The widely discussedreassessment, which occurred during the summer of 1987, led to thedevelopment of an action plan for restoring equilibrium. The action planrepresents an institutional commitment to stabilizing the economy andaccelerating economic restructuring. The authorities have received thesupport of the IMF for the program in the form of a one-year Stand-byArrangement. The Bank also hai been requested to support the program throughan increase in the composition of its lending program. This chapterevaluates the consistency and feasibility of the authorities' program usingan expanded RMSM."' Some of the specifics of the program have already beenmentioned in this report, and so have some of the risks. Subject to therisks, the stabilization/reform program is able to achieve internal andexternal equilibrium by the end of the period and to restore a sustainablegrowth path.
4.03 The program's main targets are halting the growth of external debtand accelerating economic restructuring. It recognizes, however, that someof the policies implemented during the 1982-84 stabilization may havecontributed to the current macro-economic imbalances. Rather than sacrificereform for stabilization, the program promotes both aims. The program
1/ The expanded Revised Minimum Standard Model (RMSM) enforces consistencyamong growth, exports, imports, investment, and the balance of paymentsin addition to the sources and uses of funds in the economy.

- 43 -
includes many of the elements the Bank has been supporting through itsprogram of assistance.1 / It emphasizes the need for technical advance andimprovements in efficiency. Reforms also aim to increase the proportion ofprices subject only to general rules, and reduce consumer price subsidies andincrease labor mobility by permitting greater differentiation of wages.Capital reforms include the integration of the household and enterprisefinancial systems and the introduction of a type of equity instrument. Theprogram also reduces enterprise subsidies to increase enterprise autonomy andfinancial discipline and improve budget balance. Convertible currencyexports are to be expanded, though there is a recognition that the need toeliminate uneconomic exports constrains the speed at which current accountbalance caa be achieved.
4.04 Specific targets have been elaborated only for 1988. Developmentsin 1989-90, for which targets are being elaborated, are based on the goal ofstopping the growth of external debt by the end of the period. The mainmacroeconomic targets for 1988 are: (1) a reduction in the convertiblecurrency current account deficit from $847 million in 1987 to $500 million,and (2) a reduction in the Central Government deficit from Ft 35 billion in1987 to Ft 10.4 billion. The intermediate targets include a 9 percentdecline in real wages, a 2-2.5 percent reduction in household consumption--ti.e first decline in over 30 years--and a 1.25 percent decline in domesticdemand. The main instruments are: (1) a limit on increases in the wage billin most socialist sector enterprises of 3 percent (after the grossing-uprelated to the PIT, which was discussed in para. 2.18); (2) a reduction int'ie growth of credit to the Central Government and the SDI from 22.3 percentin 1987 to 8.0 percent; (3) an active exchange rate policy; and (4) an activeihterest rate policy to raise the household and enterprise savings rates.The projections for 1988-90 shown in Tables 4.1 and 4.2 represent theauthorities' program and the projections for 1991-95 assume a continuation ofthe trends of the earlier period. As Table 4.1 shows, the program contains astrong and sustained nonruble export growth, slow growth of ruble exports, animprovement in the efficiency of investment, and continued increases inpublic sector and enterprise net saving.
4.05 Sectoral output growth (Table 4.1) is uniformly slower in 1988except for agriculture where a recovery of wheat production is projected.The decline in absorption affects nonruble imports more than domestic demand;nonruble imports are expected to decline by 6.0 percent in 1988 (Table 4.1).In contrast, during the 1982-84 stabilization, the only decline in the volumeof imports was a 1.4 percent fall in 1982, and import controls were used moreextensively during that period. In order to bring about the decline, the
2/ The objectives, major elements and the medium-term timetable forindustrial policy reforms were developed by the Government jointly withthe Bank and are outlined in the Letters of Intent submitted to the Bankby the Hungarian authorities in May 1986 and 1987, which formed the basisfor the first two industrial restructuring projects. Details werepresented in the Staff Appraisal Reports Nos. 6069-HU and 6643-HU.

- 44 -
authorities will continue to use an active rate policy, and bring about asignificant reduction in real incomes to dampen demand. In addition, theauthorities plan to eliminate inefficient production in some import intensivesectors, particularly metallurgy and meat processing, and increase theirefforts and to prumote efficient import substitution. A balance must bestruck between tight demand management and the need to raise domestic savingsby the equivalent of 2.6 percent of GDP (Table 4.1). The main source ofsavings is the reduction in the State budget deficit by the equivalent of2 percent of GDP. In addition, the authorities are committed to an activeinterest rate policy on all forms of savings, including household deposits.
4.06 The reduction in domestic demand is one key to increasing exports.Exchange rate policy should support the shift of resources from productionfor the domestic market to production for exports. To ensure a real exchangerate depreciation takes place, the authorities should devalue the forint ifproducer price growth accelerates over that of its trading partners or whenexport price growth falls short of the expected rate. The nonruble terms oftrade are projected to remain constant during the projection period.Nonruble export growth is projected to average 5 percent per year during1988-90. The authorities estimate that the elimination of uneconomicmetallurgy and chemical fertilizer exports will reduce nonruble export growthby 2 percentage points in 1988. The convertible current account improvessteadily and records a small surplus in 1991 (Table 4.2).
4.07 Ruble exports are projected to grow considerably more slowly thanduring the first part of the 1980's, which rainly reflects the expectationthat Hungary will become a net creditor to the ruble area by the end of1988. The authorities intend to try to maintain a basic balance in Hungary'srelations with the ruble area. In 1988, the authorities eliminated theguarantee of profitability on exports to the CMEA, and revalued the forintagainst the transferable ruble. The disincentive to ruble exports would bereinforced by an increase in enterprise financial discipline.
4.08 The productivity improvements shown in Table 4.1 assume thateconomic reform, especially the introduction of the tax reform and thereduction of budgetary and other support to enterprises, succeeds inimproving financial discipline. This is a precondition for encouraging moreefficient use of resources and reversing the decline in TFP that was observedin the first half of the 1980's. By 1990, the end of the stabilization partof the program, TFP in industry is expected to accelerate. Agriculture alsois expected to benefit from the economic reforms, especially price reformsand expansion of small private farming because of favorable tax treatment.TFP growth in the non-material services sector is expected to be high. Thecontinued dynamism of private economic activities, many of which are in thenonmaterials service sector, would be furthered by ensuring neutrality of taxtreatment across enterprise forms.
4.09 The increase in the productivity of capital is also reflected inthe fall in the five-year average ICOR (Table 4.1). One implication of thedecline in the ICOR is that the acceleration of economic growth does notrequire a large increase in the investment rate. Investment represents

- 45 -
27.2 percent of GDP in 1995, compared with 26.8 percent in 1987 (Table 4.1).There is a need to ensure thaL the limited funds are allocated to the mostprofitable investment projects. Chapter I has recommended improvements inthe current system of investment finance. The improvement of capitalproductivity requires that economic reforms succeed in hardening enterprisebudget constraints, and instilling in managers an incentive to seek profits.Continued financial sector reform would be more effective if the 15 percentreduction in financial support to enterprises planned for 1988 weresustained. As noted in Chapter II, the authorities plan to reduce enterprisesubsidies by at least 10 percent per year in 1989-90.
4.10 Stabilization in 1988 followed by a slow resumption of growth isconsistent with a steady reduction in the current account deficit until asmall surplus is achieved in 1991. Gross capital inflows would average$2.1 billion annually in 1988-91 a sharp reduction from 1985-87. Theacceleration of export growth and lower capital inflows would reduce the debtto exports ratio by 15.6 percent between 1987 and 1991 (Table 4.2). By 1995,both the debt to GDP ratio and the debt to exports ratio would be well belowtheir 1987 levels. Reserves fell by a projected $1.3 billion in 1987 to $2.5billion, and are projected to fall to a level consistent with the underlyingassumption that economic reform succeeds in increasing Hungary's integrationwith market-oriented economies, reducing the need to carry reserves as largeas those in 1985-86.
B. Risks to the Scenario
4.11 Apart from the general risks that an uncertain world implies forany projection, the principal risk to a scenario for Hungary is the highlevel of external debt, which limits the room for maneuver on the part of theauthorities, and requires large transfers of resources to Hungary'screditors. Chapter I noted that Hungary is projected to require $2.1 billionper year in gross inflows during 1988-91. The principal risks for Hungaryare developments that would jeopardize that external capital inflow. It isassumed that the successful implementation of the program as described abovewould enable Hungary to obtain the needed external financing. Starting fromthat position, two kinds of risk exist: the risk that the stabilization andreform measures will not yield the projected improvement, and the risk ofinconsistent implementation of the measures themselves. There is also therisk of unfavorable developments in the world economy.
4.12 The risks of uncertainty in the world economy are largely beyondthe control of the Hungarian authorities. The program scenario assumes thatthe nonruble terms of trade will be nearly constant. Factors that wouldcause a fall in the terms of trade are continued weakness of commodity pricesand further declines in the value of the dollar against major currencies.Each percentage point fall in the terms of trade costs Hungary approximately$120 million. A slowdown in growth in Western Europe would also increase theprobability of a slower adjustment scenario. The existence of uncertainty inthe world economy underscores the need for the authorities to be ready to useflexible, market based instruments of economic policy. This report has
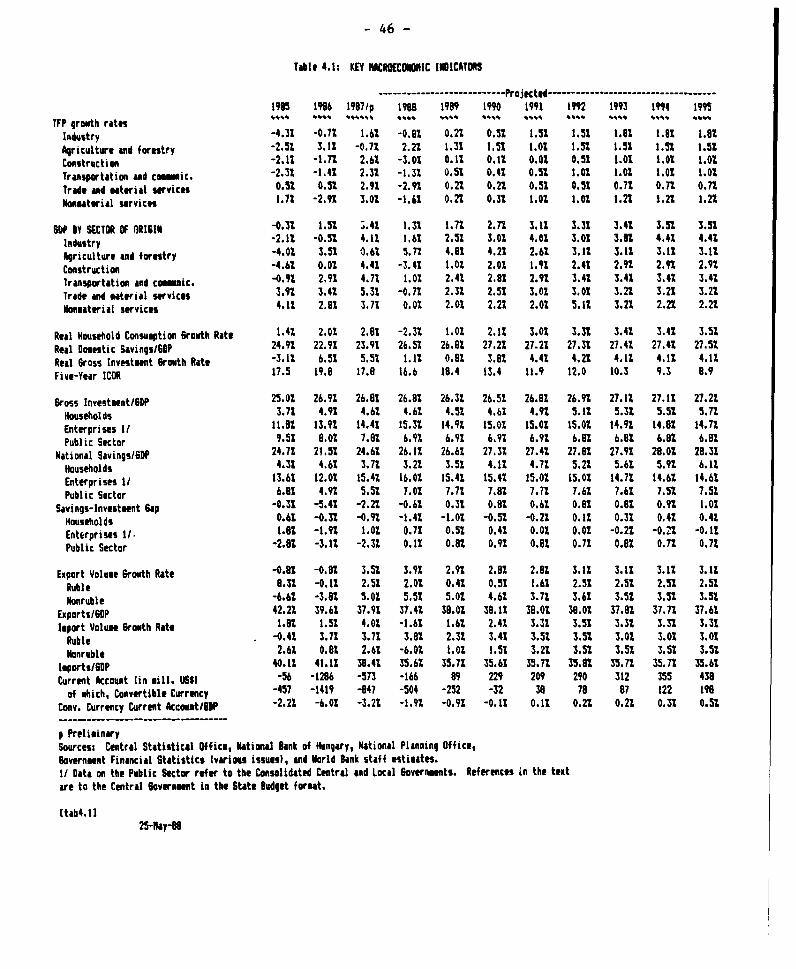
- 46 -
Table 4.1: KEY NtdROECUWNIC IUICATORS
--------- - -- Projt-ted … _ _____- _1995 196 197/p 1998 1989 19MO 1991 1SS2 I193 199 1995
TFP growth rate " '...
Industry -4.31 -0.72 1.62 -0.92 0.22 0.52 1.52 1.52 1.92 1.92 1.92Agriculture and forntry -2.52 3.12 -0.72 2.22 1.3 1.52 1.02 1.52 1.5t 1.52 1.52Construction -2.12 -1.72 2.62 -3.02 0.12 0.12 0.02 0.52 1.02 1.02 1.02Transprtation and comAic. -2.32 -1.42 2.32 -1.32 0.52 0.42 0.52 1.02 1.02 1.02 1.02Trade ad aterial srvicn 0.52 0.52 2.92 -2.92 0.22 0. 2 0.52 0.52 0.72 0.7n 0.72Netaterial service 1.72 -2.92 3.02 -1.62 0.22 0.32 1.02 1.02 1.22 1.22 1.22
6W BY SECTOR OF RI611N -0.32 1.52 3.42 1.32 1.72 2.n 3.12 3.32 3.42 3.52 3.52Indvstry -2.12 -0.52 4.12 1.62 2.52 3.02 4.02 3.02 3.02 4.42 4.42Agriculture d forntry -4.02 3.52 0.62 5.72 4.92 4.22 2.62 3.12 3.12 3.12 3.12Construction -4.62 0.02 4.42 -3.41 1.02 2.02 1.92 2.42 2.92 2.9n 2.92Transportation and com_mic. -0.92 2.92 4.72 1.02 2.42 2.82 2.92 3.42 3.42 3.42 3.42Trade ad material services 3.92 3.42 5.32 -0.72 2.32 2.51 3.02 3.02 3.22 3.22 3.22Nanmaterial services 4.12 2.92 3.72 0.02 2.02 2.22 2.02 5.12 3.22 2.22 2.22
Real Household Consumption 6rovth Rate 1.42 2.02 2.92 -2.32 1.02 2.12 3.02 3.32 3.42 3.42 3.52
Real Domestic Savings/GaP 24.92 22.92 23.92 26.52 26.92 27.22 27.22 27.32 27.42 27.41 27.52Real Gross Investment 6rowth Rate -3.11 6.52 5.52 1.12 0.82 3.92 4.42 4.22 4.12 4.12 4.12Five-Year ICOR 17.5 19.9 17.9 16.6 18.4 13.4 11.9 12.0 10.3 9.3 8.9
6ross Investment/GW 25.02 26.92 26.92 26.82 26.32 26.51 26.92 26.92 27.12 27.12 27.22Households 3.72 4.92 4.62 4.62 4.52 4.62 4.92 5.12 5.32 5.52 5.n
Enterprises I/ 11.9 13.92 14.42 15.32 14.92 15.02 15.02 15.02 14.92 14.92 14.72Public Sector 9.52 9.02 7.82 6.92 6.91 6.92 6.92 6.81 6.82 6.92 6.92
National Savings/6SP 24.72 21.52 24.62 26.12 26.62 27.32 27.42 27.92 27.92 29.01 29.32Nouseholds 4.32 4.62 3.72 3.22 3.52 4.12 4.72 5.22 5.62 5.92 6.12Enterprises lI 13.62 12.02 15.42 16.02 15.42 15.42 15.02 15.02 14.72 14.61 14.62Public Sector 6.92 4.92 5.52 7.02 7.72 7.92 7.72 7.62 7.62 7.52 7.52
SaXvings-Investment Gap -0.32 -5.42 -2.22 -0.62 0.32 0.92 0.62 0.92 0.92 0.9n 1.02Households 0.62 -0.31 -0.92 -1.42 -1.02 -0.52 -0.22 0.12 0.32 0.42 0.42Enterprises 11. 1.92 -1.92 1.02 0.72 0.52 0.42 0.02 0.02 -0.22 -0.22 -0.12Public Sector -2.92 -3.12 -2.32 0.12 0.92 0.92 0.92 0.72 0.92 0.72 0.72
Export Voluee Growth Rate -0.89 -0.92 3.52 3.92 2.92 2.92 2.92 3.12 3.12 3.12 3.12Ruble 9.32 -0.12 2.52 2.01 0.42 0.52 1.62 2.52 2.52 2.52 2.52Nonruble -6.62 -3.92 5.02 5.52 5.02 4.62 3.72 3.62 3.52 3.52 3.52
Exports/6DP 42.22 39.62 37.92 37.42 39.02 39.12 39.02 39.02 37.92 37.71 37.62Import Volume Growth Rate 1.92 1.52 4.02 -1.62 1.62 2.42 3.32 3.52 3.32 3.31 3.32
Ruble -0.42 3.72 3.72 3.92 2.32 3.42 3.52 3.52 3.02 3.02 3.02Nonruble 2.62 0.98 2.62 -6.02 1.02 1.52 3.22 3.52 3.52 3.52 3.52
lmports/lDP 40.12 41.12 38.42 35.62 35.72 35.62 35.72 35.92 35.72 35.72 35.62Current ccount (in mill. LISS) -56 -1296 -573 -166 89 229 209 290 312 355 438
of which, Convertible Currency -457 -1419 -847 -504 -252 -32 38 78 87 122 199Conv. Currency Current Account/6UP -2.22 -6.02 -3.22 -1.92 -0.92 -0.12 0.12 0.21 0.22 0.32 0.52
p PreliminarySources: Central Statistical Office, National Dank of Hungary, National Planning Office,6overnmnt Financial Statistics (varios issues), and World Dink staff estimates.I/ Data on the Public Sector refer to the Consolidated Central and Local Governmnts. References in the textare to the Central Governmnt in the State Budget format.
(tab4.1125-Fay-US
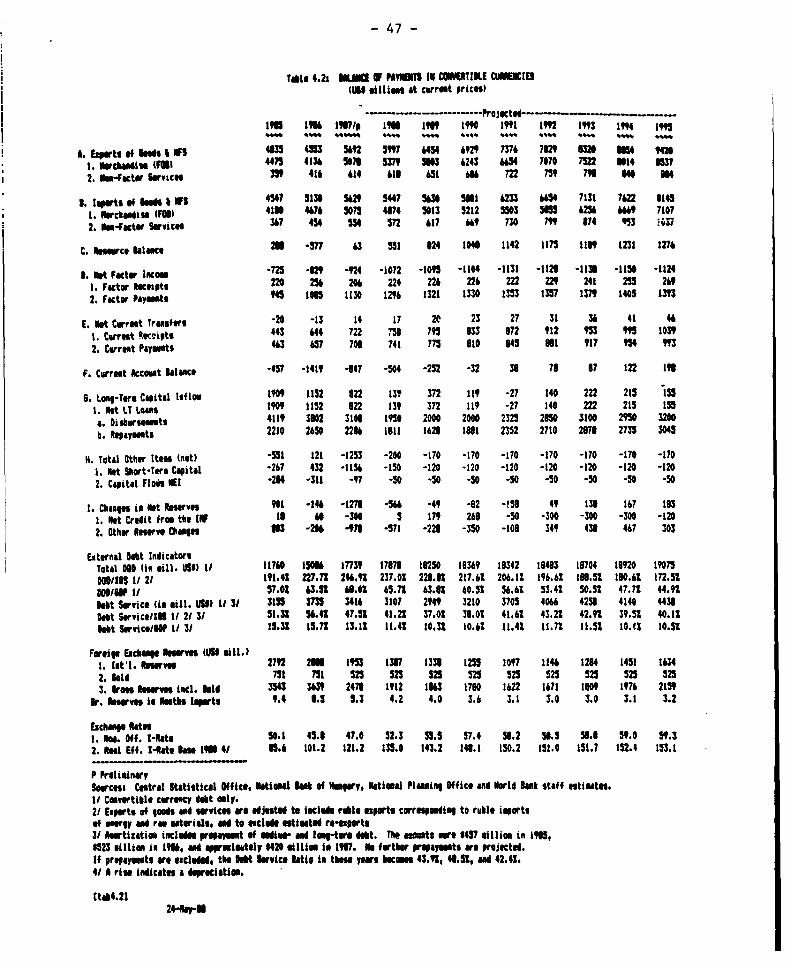
- 47 -
Tale 4.2a ILUN W 14ViT3 IN COWTIILE CUMEIIESjE Giffisims at cirret prices)
.______-r jctd--------------e- c-----19 1934 1967/p 193 19f 1t99 1991 1992 1993 14 1
A. xwts. o ee" I Ws 403 423 592 5997 4454 4929 37 7g I32 M4 "4. Nwedwim (Mfl 4475 4136 5073 5M9 33 4243 UP 770 7522 14 7
2. Ou-factor Shwvtc 359 414 414 &1N Ui U 72 759 7t s >
O. lports e %oft & N3 4547 5134 54 547 54 Ml 4233 4434 7131 7422 31451. NrthFaWise (FM) 4130 4474 5075 474 913 5212 5503 55 42 49 71072. Inefacter Sayice 347 44 554 572 417 649 730 79 374 3 or
C. Ilwce blia ce 20 -m77 3 331 324 104 1142 1173 113 1231 127*
3. Not Factwr Irnc 72t U29 -92 -1072 -105 -1104 -1131 -1123 -1136 -1150 -11241. Factr ceipts 220 254 234 224 224 224 222 229 241 255 242. Factor Payt 945 I0M 1130 1296 1321 1330 1353 1357 1379 1405 133
E. ket Curnt Trasfers -20 '13 14 17 20 23 27 31 34 41 4UI. Cwrtet Altvipts 443 444 722 "A 7 335 072 912 953 9S 10392. Cerrut PaYsots 43 457 706 741 775 Ol 845 Ml 917 95 9S9
F. Carrut kcout lUlace -457 '1419 -647 -304 -252 -32 3o 73 37 122 I9
6. Long-Tore Capital IufLae 1909 1152 322 13Y 372 119 -27 140 222 215 1551. It LT Loas 19 1152 322 139 372 119 -27 140 222 215 155a. Disbursuts 4119 3302 3106 1950 2000 2000 2325 2150 3100 2950 3200h. Reayats 2210 2650 2284 1611 1623 1861 2352 2710 2673 2735 3045
M. Total Other Itccc (nIt) -551 121 -1253 -200 -170 -170 -170 -170 -170 -170 -1701. Nt ShIrt-Ters Capital -267 432 -1154 -150 -120 -120 -120 -120 -120 -120 -1202. Capital Flao N1 -214 -311 -97 -50 -S0 -50 -50 -50 -50 -50 -50
1. Chias" ia Net Rn rs 901 -144 -1273 -5e U49 -2 -151 49 136 1t7 1931. It Credit fro the INf 11 60 -300 5 179 263 -S0 -300 -300 -300 -1202. Othr Rerwv Chun 3 -21 -971 -371 -221 -350 -108 349 43 467 303
External Det IndicatorsTotal oN' (is oill. US$3 I/ 11740 15064 17 178716 1250 18349 18342 16483 1704 18920 197MI/86 1/ 21 191.4 227.71 244.92 237.02 228.32 217.41 206.1 194.61 186.52 10.4O 172.53aoo/w 1/ 57.01 3. be.o0 45.7n 63.8n 40.52 56.61 53.42 50.52 47.72 44. 9het Service (ti sill. US$) 11 3/ 3155 5M 3416 3107 2949 3210 3705 4064 42531 4140 443Dot Svice/llN 112131 51.32 54.42 47.52 41.2 37.02 38.02 41.6* 43.22 42.92 39.52 40.12Dbt ServicelP 1/ 3/ 15.31 15.72 13.11 11.42 10.31 10.42 11.42 11.71 11.53 IO% 10.52
Frewe Exchange, ee RUS sill.I1. [At'l. plne,n 292 23 195S 137 1333 1235 1097 1144 1234 1451 14342.3l1i 751 751 52t 525 525 525 525 525 525 525 5253. er eeve ncl. bhid 354 5 39 2471 1912 1343 1730 1622 1471 109 197 2159
Br. bwevs is Ilths lwrts 9.4 *35 5.3 4.2 4.0 3.6 3.1 3.0 3.0 3.1 3.2
Eschnp Rbte1. FM. Off. 1-Rate 50. 1 45.3 47.0 52.3 33.5 57.4 56.2 58.5 53.3 59.0 59.32. Reel Iff. I-Rate 3ne 1941 8n.4 101.2 121.2 135.0 143.2 13.1 150.2 151.0 151.7 152.4 153.1
P PreoliinrySceual Ccctral Staistical Office, leti leeuk of d Wry, PAtimal Plain Office and brIE ank staff 4 tieat.I/ Cuewrtible cerre debt uly.21 Experts of godcs ad SrWiccore aidJUted te iKcld rale sWrtg corr_pdil to ruble imeprtsef wrgy and ra twrils, ad to eclb edeetltd re-sports31 Amortizatieo inclde propayut of Iedia- ad log-tore det. The cuate we $457 illi, ien 1 ,$523 s1iti. ir 193, ad aWr.iatly $420 sillime t I17. no frtkr prepayeets we projected.If prepsy.uts are excluded, the bbt tvice Rtis i the yers becomes 43.9, 46.52, a 42.42.4/ A ris indicates a Wrciatiu.
(tab4.212"4e

- 48 -
recommended, among others, an active exchange rate policy. Use of suchpolicies when the economy is shocked by external developments wouldfacilitate adjustment with a minimum of income loss.
4.13 There is also a risk that the economy's response to thestabilization and reform measures will not be as strong, and the projectedadjustment speeds not as quick, as projected in the program. The economicreform requires changes in attitudes, which take time, and though the processhas already begun, no one can be certain that it is finished. Scenarios havebeen developed to examine what a slower adjustment would look like. Theprincipal results of a slower response to the economy to the stabilizationand reform measures is a delay in the year by which the goal of stopping thegrowth of external debt is reached. The improvements in the convertiblecurrency current account are less, and as a result, the financingrequirements for a slower adjustment scenario are higher.
4.14 The authorities' ability to mobilize the additional financingneeded to sustain a slower pace of adjustment is '-kely to depend on progressin implementing the economic reform. If the Economic Stabilization andStructural Reform Program were implemented inconsistently, resistence wouldlikely develop on the part of Hungary's international creditors, and thefinancing gaps that result would make the adjustment path unsustainable. Ifthe reform is implemented vi-orously and consistently, it is likely thatHungary would be able to raise additional runds above the amounts projectedin the program. The relatively higher profile of the World Bank and the IMFin Hungary's medium-term financing plan is conditioned on the vigorous andconsistent implementation of the reform. That support will have a catalyticeffect on other lenders, which could increase the room to maneuver in theevent that the economy's response to the stabilization and reform measuresfalls short of that projected in the program.
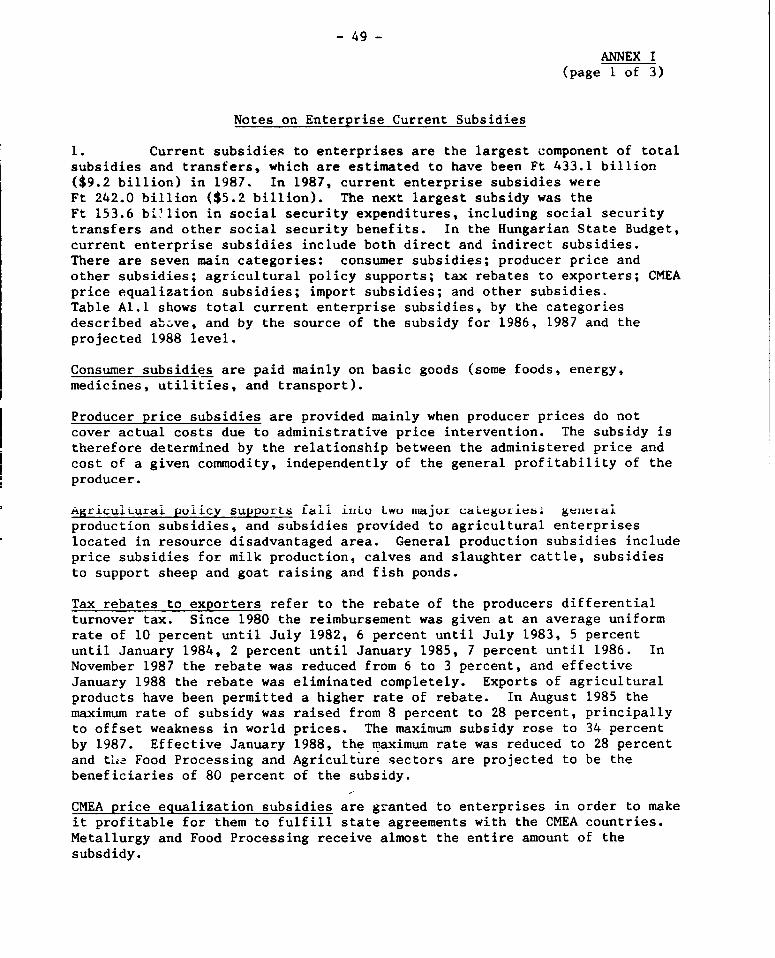
- 49 -
ANNEX I(page 1 of 3)
Notes on Enterprise Current Subsidies
1. Current subsidies to enterprises are the largest component of totalsubsidies and transfers, which are estimated to have been Ft 433.1 billion($9.2 billion) in 1987. In 1987, current enterprise subsidies wereFt 242.0 billion ($5.2 billion). The next largest subsidy was theFt 153.6 bi'lion in social security expenditures, including social securitytransfers and other social security benefits. In the Hungarian State Budget,current enterprise subsidies include both direct and indirect subsidies.There are seven main categories: consumer subsidies; producer price andother subsidies; agricultural policy supports; tax rebates to exporters; CMEAprice equalization subsidies; import subsidies; and other subsidies.Table A1.l shows total current enterprise subsidies, by the categoriesdescribed abvzve, and by the source of the subsidy for 1986, 1987 and theprojected 1988 level.
Consumer subsidies are paid mainly on basic goods (some foods, energy,medicines, utilities, and transport).
Producer price subsidies are provided mainly when producer prices do notcover actual costs due to administrative price intervention. The subsidy istherefore determined by the relationship between the administered price andcost of a given commodity, independently of the general profitability of theproducer.
AgricuiLuraL poiicy supporLs lal iiuLo Lwu imajor caLegULeia ge1IeLaI
production subsidies, and subsidies provided to agricultural enterpriseslocated in resource disadvantaged area. General production subsidies includeprice subsidies for milk production, calves and slaughter cattle, subsidiesto support sheep and goat raising and fish ponds.
Tax rebates to exporters refer to the rebate of the producers differentialturnover tax. Since 1980 the reimbursement was given at an average uniformrate of 10 percent until July 1982, 6 percent until July 1983, 5 percentuntil January 1984, 2 percent until January 1985, 7 percent until 1986. InNovember 1987 the rebate was reduced from 6 to 3 percent, and effectiveJanuary 1988 the rebate was eliminated completely. Exports of agriculturalproducts have been permitted a higher rate of rebate. In August 1985 themaximum rate of subsidy was raised from 8 percent to 28 percent, principallyto offset weakness in world prices. The maximum subsidy rose to 34 percentby 1987. Effective January 1988, the maximum rate was reduced to 28 percentand th.a Food Processing and Agriculture sectors are projected to be thebeneficiaries of 80 percent of the subsidy.
CMEA price equalization subsidies are granted to enterprises in order to makeit profitable for them to fulfill state agreements with the CMEA countries.Metallurgy and Food Processing receive almost the entire amount of thesubsdidy.

- 50 -
ANNEX I(Page 2 of 3)
Import subsidies take the form of an import price subsidy on a few basiccoumodities, mainly energy products whose domestic prices are administered ata lower level than the actual import price.
Table Al.l: TOTAL CURRENT SUBSIDIES AND FINANCIAL SUPPORT TO ENTERPRISES
(billions of Forints)
1 9 8 6 1 9 8 7 1 9 8 8/pCentral Central CentralGovt. Other/a Total Govt. Other/a Total Govt. Other/a Total
Consumer Subsidies 59.8 10.6 70.4 66.0 12.3 78.3 41.7 32.1 73.8Producer Price and OtherSubsidies 24.7 10.5 35.2 24.7 14.5 39.2 15.8 14.0 29.8
Agriculture PolicySupport 13.7 -0.3 13.4 13.7 0.3 14.0 13.5 0.1 13.6
Tax Rebate to Exporters 21.3 1.5 22.8 26.0 1.1 27.1 16.5 -0.4 16.1CMEA Price Equalization 41.5 5.2 46.7 36.6 9.9 46.5 26.5 16.2 42.7Import Subsidies 2.9 -1.1 1.8 1.6 0.1 1.7 1.9 -0.3 1.6Other . 36.7 36.7 . 35.2 35.2 . 27.3 27.3
TOTAL 163.9 63.1 227.0 168.6 73.4 242.0 115.9 89.0 204.9
Source: Ministry of Finance
/a The Ft 36.7 billion figure in 1986 includes 29.8 in subsidies fromDecentralized Funds. In 1987 and 1988, subsidies from DecentralizedFunds were Ft 31.6 billion and Ft 25.3 billion respectively. These subsidiesinclude payments from Local Councils, Direct Subsidies .o Enterprise Funds,payments from Decentralized Funds, Cash in Transit, and Other.
/p Projected
2. In addition to the Central Government budget, Council governments,and decentralized funds provide subsidies to enterprises. Since 1981, inaddition to the overall growth of enterprise subsidies, an increasing sharehas been administered outside the Central Government budget (Table A1.2).The 1988 Plan contains a 15 percent reduction in total enterprise subsidies,but a larger frartion administered outside the Central Governmet budget. Themain reason for the large increase in the share of subsidies administeredoutside the Central Government budget is a shift in the subsidy onpharmaceuticals (Ft 14.7 billion or nearly $300 million projected for 1988)from the Central Government budget to the Social Security budget.

- 51 -
ANNEX I(Page 3 of 3)
Table A1.2: CENTRAL GOVERNMENT SUBSIDIES IN RELATIONTO TOTAL ENTERPRISE CURRENT SUBSIDIES
(percent)
1981 1982 1983 1984 1985 1986 1987 1988/p
93.1 92.0 93.0 81.6 73.9 72.3 69.7 56.6
Source: Ministry of Finance
/p Plan level
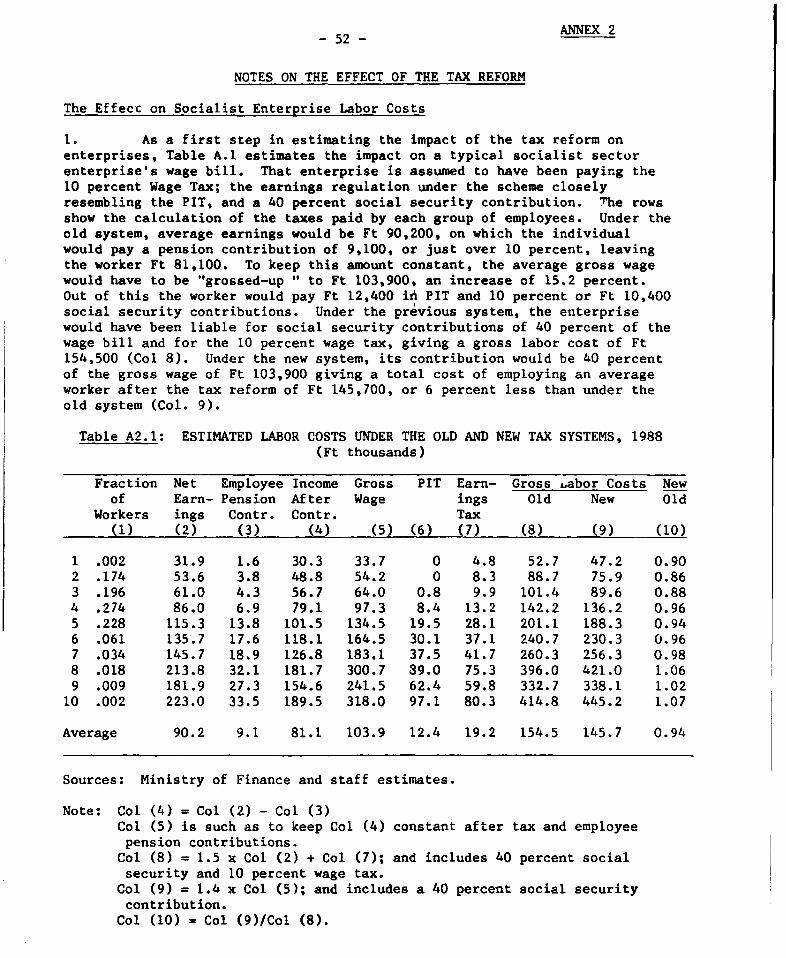
- 52 - ANNEX 2
NOTES ON THE EFFECT OF THE TAX REFORM
The Effect on Socialist Enterprise Labor Costs
1. As a first step in estimating the impact of the tax reform onenterprises, Table A.1 estimates the impact on a typical socialist sectorenterprise's wage bill. That enterprise is assumed to have been paying the10 percent Wage Tax; the earnings regulation under the scheme closelyresembling the PIT, and a 40 percent social security contribution. The rowsshow the calculation of the taxes paid by each group of employees. Under theold system, average earnings would be Ft 90,200, on which the individualwould pay a pension contribution of 9,100, or just over 10 percent, leavingthe worker Ft 81,100. To keep this amount constant, the average gross wagewould have to be "grossed-up " to Ft 103,900, an increase of 15.2 percent.Out of this the worker would pay Ft 12,400 id PIT and 10 percent or Ft 10,400social security contributions. Under the previous system, the enterprisewould have been liable for social security contributions of 40 percent of thewage bill and for the 10 percent wage tax, giving a gross labor cost of Ft154,500 (Col 8). Under the new system, its contribution would be 40 percentof the gross wage of Ft 103,900 giving a total cost of employing an averageworker after the tax reform of Ft 145,700, or 6 percent less than under theold system (Col. 9).
Table A2.1: ESTIMATED LABOR COSTS UNDER THE OLD AND NEW TAX SYSTEMS, 1988(Ft thousands)
Fraction Net Employee Income Gross PIT Earn- Gross ±abor Costs Newof Earn- Pension After Wage ings Old New Old
Workers ings Contr. Contr. Tax(1) (2) (3) (4) (5) (6) (7) (8) (9) (10)
1 .002 31.9 1.6 30.3 33.7 0 4.8 52.7 47.2 0.902 .174 53.6 3.8 48.8 54.2 0 8.3 88.7 75.9 0.863 .196 61.0 4.3 56.7 64.0 0.8 9.9 101.4 89.6 0.884 .274 86.0 6.9 79.1 97.3 8.4 13.2 142.2 136.2 0.965 .228 115.3 13.8 101.5 134.5 19.5 28.1 201.1 188.3 0.946 .061 135.7 17.6 118.1 164.5 30.1 37.1 240.7 230.3 0.967 .034 145.7 18.9 126.8 183.1 37.5 41.7 260.3 256.3 0.988 .018 213.8 32.1 181.7 300.7 39.0 75.3 396.0 421.0 1.069 .009 181.9 27.3 154.6 241.5 62.4 59.8 332.7 338.1 1.0210 .002 223.0 33.5 189.5 318.0 97.1 80.3 414.8 445.2 1.07
Average 90.2 9.1 81.1 103.9 12.4 19.2 154.5 145.7 0.94
Sources: Ministry of Finance and staff estimates.
Note: Col (4) = Col (2) - Col (3)Col (5) is such as to keep Col (4) constant after tax and employeepension contributions.Col (8) = 1.5 x Col (2) + Col (7); and includes 40 percent socialsecurity and 10 percent wage tax.
Col (9) = 1.4 x Col (5); and includes a 40 percent social securitycontribution.
Col (10) = Col (9)/Col (8).

- 53 -
STATISTICAL APPENDIX

- 54 -
STATISTICAL APPENDIX TABLE OF CONTENTS
Table I NATIONAL ACCOUNTS SUMMARY(Millions of Forints at Current Prices)
Table 1.1 POPULATION AND DEMOGRAPHIC INDICATORS
Table 1.2 EMPLOYMENT BY SECTOR
Table 1.3 REAL GDP PER PERSON EMPLOYED
Table 2 NATIONAL ACCOUNTS SUMMARY(Millions of US$ at Constant 1981 Prices)
Table 2.1 GDP BY SOURCE IN CURRENT VALUES
Table 2.2 GDP BY EXPENDITURE IN CURRENT VALUES
Table 2.3 GDP BY SOURCE IN REAL TERMS
Table 2.4 GDP BY EXPENDITURE IN REAL TERMS
Table 2.5 GDP BY INCOME CATEGORY IN CURRENT VALUES
Table 2.6 GROSS FIXED INVESTMENTS(Billions of Current Forints)
Table 2.7 GROSS FIXED INVESTMENTS(Billions of Constant Forints)
Table 3 BALANCE OF PAYMENTS(US$ Millions)
Table 3.1 BALANCE OF PAYMENTS - CONVERTIBLE CURRENCY(US$ Millions)
Table 3.2 BALANCE OF PAYMENTS - NONCONVERTIBLE CURRENCY(USS Millions)
Table 3.3 EXPORT COMPOSITION(Percent)
Table 3.4 IMPORT COMPOSITION(Percent)
Table 3.5 GROWTH RATES OF EXTERNAL TRADE (IN CONSTANT PRICES)AND TRADE ELASTICITIES, 1970-83

- 55 -
Table 3.6 EXPORTS BY CATEGORY IN CURRENT VALUES
Table 3.7 EXPORTS BY CATEGORY IN REAL TERMS
Table 3.8 IMPORTS BY CATEGORY IN CURRENT VALUES
Table 3.9 IMPORTS BY CATEGORY IN REAL TERMS
Table 3.10 TRADE BY MAJOR TRADING PARTNERS(Percent Distribution)
Table 3.11 EXCHANGE RATE - CONVERTIBLE CURRENCY
Table 3.12 PRICE INDICES AND SUBSIDIES
Table 3.13 TERMS OF TRADE BY REGION, COtMODITY AND CURRENCY(1970 = 100.0)
Table 3.14 EXTERNAL TRADE(Billions of Current Forints)
Table 3.15 EXTERNAL TRADE(Billions of 1975 Forints)
Table 4.1 FOREIGN DEBT(US$ Millions)
Table 4.2 INTEREST RATE AND MATURITY(Characteristics of Foreign Indebtedness
Table 5.1 PRICE INDICES OF THE SOCIALIST INDUSTRY(1976 = 100.0)
Table 5.2 CONSUMER PRICE INDEX BY MAIN GROUPS OF EXPENDITURE(1976 - 100.0)
Table 5.3 INDEX NUMBERS OF REAL WAGES PER WORKER(1970 - 100.0)
Table 6 CONSOLi-DATED CENTRAL GOVERNMENT BUDGET(Billions of Forints)
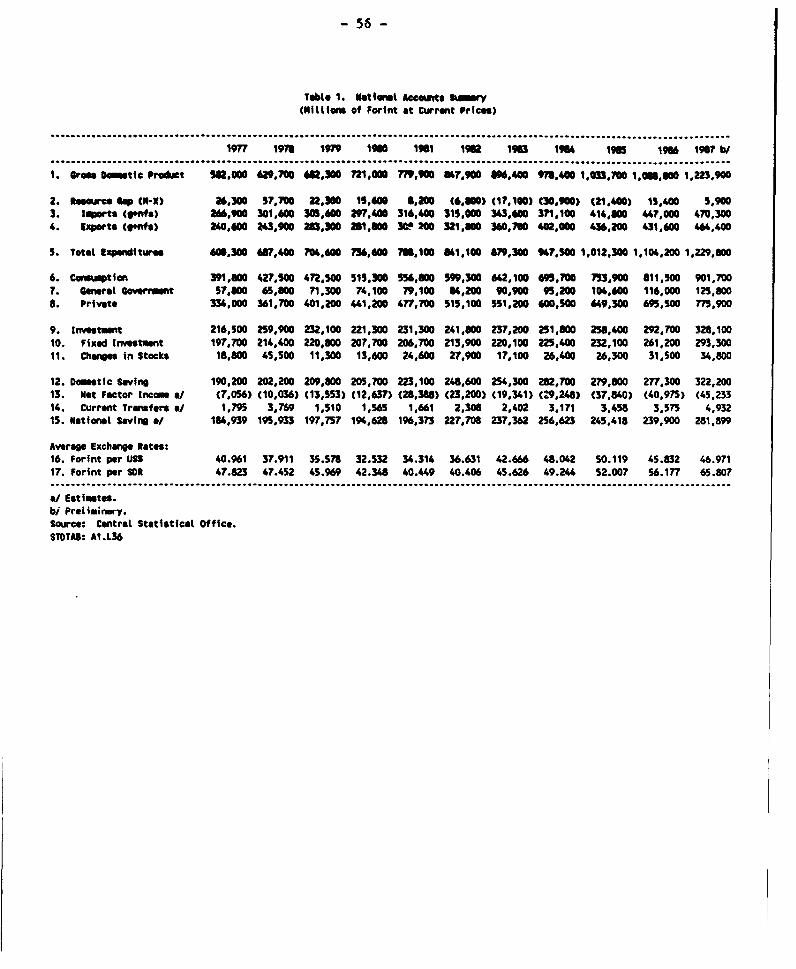
- 56 -
Tabto 1. Natioat l Accwwts Sumry(Mittions of Forint at Current Price.)
................................. ..................................................................... _,...........................................................................
1977 1976 1976 1600 1961 1902 1963 194 1905 1946 1967 b/
1. Geese cemtic Prodict SU000 62,00 *62,300 721.000 7M6OW 84r,900 89P.400 911.400 1.033,M70 1.000.,00 1.223,900
2. asurce GNp (N-X) 26,300 57,700 22.300 15,400 &.200 (6,300) (17.100) (30,900) (21,400) 15,400 5,9003. IIWets (9*pM) 266.900 301.600 305.60 297.400 316,400 315,000 343.400 371,100 414,600 447,000 470,3004. gxw_t (gelnif) 240,400 243,900 263,300 B1M0 C 200 321.100 340,700 402.000 436,200 431,400 464,400
5. Total Expnditurs 60.300 87,40 70".600 n7,4o00 7tf100 261,100 879,300 947,50 1,012,300 1.104.200 1,229,800
6. Consumtion 391,600 427,500 472,SO S15,300 556,800 59.300 642,100 495,700 73,90 8611,500 901,7007. Genral Gover_ snt 57.600 65,600 71,300 74.100 79.100 34,200 90,900 95,200 104,600 116,000 125,8008. Private 334,000 361,700 401,200 441,200 477,700 515,100 SS1,200 00,500 S 49,300 69,5s00 775,900
9. Irvetment 216,500 259,900 232,100 221,300 231,300 241,800 237,200 251,600 258,400 M,700 328.10010. Fixed Investment 197,100 214,400 220.800 207,700 206,700 213,900 220,100 225.400 232,100 261,200 293,30011. Chitne in Stocks 18.800 45,500 11,300 13,600 24,600 27,900 17,100 26,400 26,300 31500 34,800
12. Dosetic Saving 190.200 202,200 209,800 205,110 223,100 248,600 254,300 262,700 279,800 277.300 322,20013. Net Factor Income */ (7,056) (10,036) (13,553) (12.637) (28,388) (23,200) (19,341) (29,248) (37,840) (40,975) (45,23314. Current Tranfr e* 1,795 3,769 1,510 1.565 1,661 2,306 2.402 3,171 3,458 3,575 4,93215. National Savina a/ 184,939 195.933 197,757 194,628 196,3?3 227,708 237,362 256,623 245,418 239,900 281,899
Average Exchange Rates:16. Forint per US 40.961 37.911 35.5sr 32.532 34.314 36.631 42.666 48.042 50.119 45.832 46.97117. Forint per SDR 47.823 47.452 45.969 42.348 40.449 40.406 45.626 49.244 52.007 56.177 65.807
~~~~~~. . . ......... .............. ..................... ........................................... ....................... ................................. ........ .... ........ .....
&/ Estimtes.bi Prelisinury.Source: Central Statistical Office.STOTAB: A1.L36
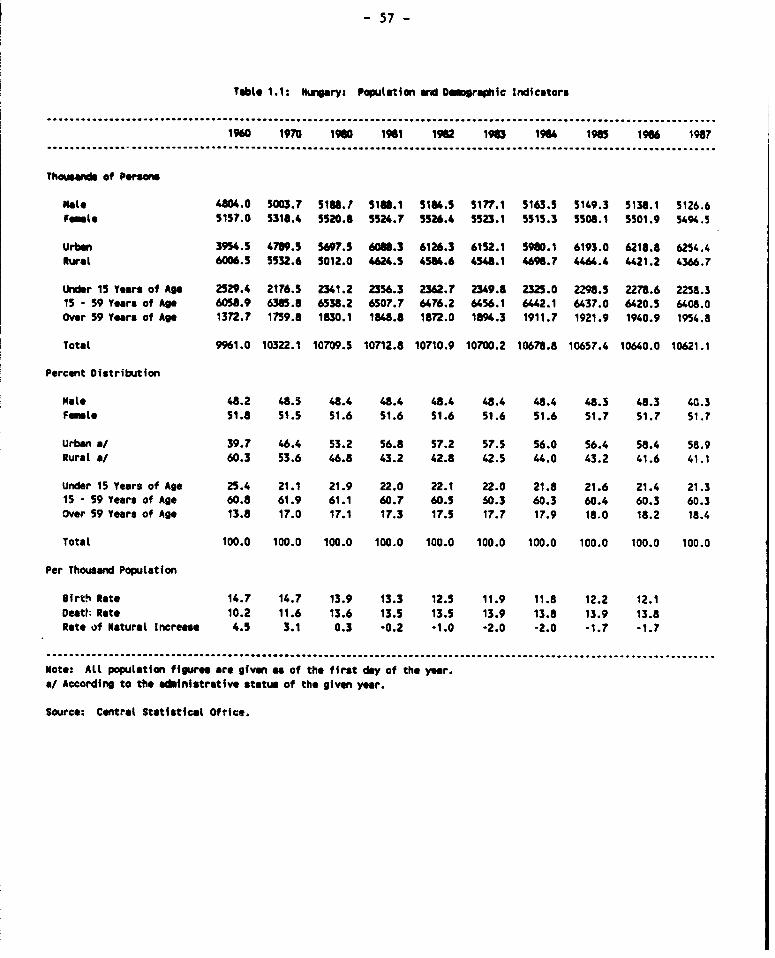
-57 -
Table 1.1: Nun ary: Populeltion and Dogrphlc Indicators
1960 1970 1960 1961 1962 1963 1984 16 1966 1987............... I.......................................................................................................
Thousands of Person
Note 804.0 5003.7 5188.7 5188.1 531U.5 5177.1 5163.5 5149.3 5138.1 5126.6Famole 5157.0 5318.4 5520.8 5524.7 5526.4 5S23.1 5515.3 5508.1 5501.9 5494.5
Urban 39S4.5 4789.5 5697.5 6086.3 6126.3 6152.1 5980.1 6193.0 6218.8 6254.4Rural 6006.5 5532.6 5012.0 4624.5 4584.6 4548.1 4696.7 4464.4 4421.2 4366.7
Under 15 Years of Age 2529.4 2176.5 2341.2 2356.3 2362.7 2349.8 2325.0 2298.5 2278.6 2258.315 - 59 Years of Age 6058.9 6385.8 6538.2 6507.7 6476.2 6456.1 6"42.1 6437.0 6420.5 6408.0Over 59 Years of Age 1372.7 1759.8 1830.1 18U.8 1872.0 1894.3 1911.7 1921.9 1940.9 1954.8
Total 9961.0 10322.1 10709.5 10712.8 10710.9 10700.2 10678.8 10657.4 10640.0 10621.1
Percent Distribution
Nole 48.2 48.5 48.4 48.4 48.4 48.4 48.4 48.3 48.3 4C.3Femtl 51.8 51.5 51.6 51.6 51.6 51.6 51.6 51.7 51.7 51.7
Urban a/ 39.7 46.4 53.2 56.8 57.2 57.5 56.0 56.4 58.4 58.9Rural a/ 60.3 53.6 46.8 43.2 42.8 42.5 44.0 43.2 41.6 41.1
Under 15 Years of Age 25.4 21.1 21.9 22.0 22.1 22.0 21.8 21.6 21.4 21.315 - 59 Years of Age 60.8 61.9 61.1 60.7 60.5 60.3 60.3 60.4 60.3 60.3Over 59 Years of Age 13.8 17.0 17.1 17.3 17.5 17.7 17.9 18.0 18.2 18.4
Total 100.0 100.0 100.0 100.0 100.0 100.0 100.0 100.0 100.0 100.0
Per Thousand Population
irtch Rate 14.7 14.7 13.9 13.3 12.5 11.9 11.8 12.2 12.1Death Rate 10.2 11.6 13.6 13.5 13.5 13.9 13.8 13.9 13.8Rate of Natural Increase 4.5 3.1 0.3 -0.2 1.0 -2.0 -2.0 -1.7 -1.7
Note: Alt population figures are given as of the first day of the year.a/ According to the adsinistrative status of the given year.
Source: Central Statistical Oftice.

Table 1.2: Nwary: EpilZoy t y Sector
........................................ ............................................................................ ...... ......... ...... ......... ....... ........... .... ............ ............ .......................... ................
196.0 1970 1975 1976 1977 1978 1979 1'id0 1981 1962 1962 a1 196M 19 15 19 167.............................................................................................. .............................................................................................................................................. ............. .....
Thoumwd of Peros(As of I Jwuary)
Agrieutture 1i31.8 1253.8 101.? 7 109.1 1040.5 1027.5 1029.5 1038.9 1032.? 1052.6 1073.3 1082.6 I0f.0 1035.1 M.2 942.7
1frntry 1611.1 2150.7 2226.3 2209.2 2181.1 2166.4 2147.1 2100.9 2046.7 2002.9 1996.0 1950.5 19M7.6 185.9 16.6 157?.Tnufecturing & Wining 1346.1 1709.2 1810.7 iMS.A 1764.6 1752.2 1733.9 1697.3 1653.9 1620.4 1613.7 157.5 1S4.6 1539.5 1536.5 155.2
Costruction 205.0 361.5 41S.6 4;.0.4 416.5 414.2 413.2 403.6 392.8 382.5 382.3 373.0 363.2 56.4 347.5 341.S
sevices 1292.1 1575.7 17.5 1624.9 1859.6 1874.9 1904.4 1933.8 1935.1 1946.2 1927.6 195.5 1980.2 1961.9 1022.3 2074.6Transport A Ciniafcotion 292.0 359.2 389.4 402.2 40.5 406.5 408.7 407.3 399.8 394.7 395.2 "9.0 3.0 3.1 46.5 41.3Tred 312.6 400.9 459.2 468.0 476.0 479.9 485.1 488.1 48.0 *91.5 492.1 497.6 S03.8 SO.L S.0 514.2Water Works * Spply 10.6 59.5 68.3 70.5 70.5 72.4 75.3 76.7 76.6 77.3 77.3 77.0 77.5 75.2 71.7 79.2WOn-Wterial Proewtion 676.7 756.1 860.6 884.2 909.6 916.1 93S.3 961.7 970.7 962.7 963.0 989.2 91.9 996.8 1 .3 tO17.1
Totat E toyesnt 4735.0 4960.2 5065.5 5093.2 5061.2 S568.8 5061.0 5073.6 5014.5 5001.9 5001.9 4970.1 4940.0 49t2.9 482.S 45.2
MusAd Growth Ibten 1965-70 1970-75 1976 1977 1978 1979 1900 1901 1962 1963 195 1go 198 197
Agriculture * Forestry -1.2 -2.9 -2.1 -1.8 -1.2 0.2 0.9 -0.6 1.9 .. 0.4 *1.0 -3.4 -4.7 .4.4
Industry 2.8 0.7 -0.3 -1.3 -0.7 -0.9 -2.2 -2.6 -2.1 .. -2.3 -2.2 -0.6 -0.6 -0.9Numafecturing 9 Wining 2.4 0.2 -1.2 -1.4 -0.7 -1.0 -2.1 -2.6 -2.0 .. -2.2 -2.1 -0.3 -0.2 -0.7Construction 5.3 2.8 1.2 -0.9 -0.6 -0.2 -2.3 -2.7 -2.6 .. -2.4 -2.6 -1.9 -2.5 -1.7
Services 1.8 2.4 2.7 1.9 0.8 1.6 1.5 0.1 0.6 .. 0.5 1.2 1.1 2.0 2.6Traport & Cna_ication 2.2 1.6 3.3 0.3 0.7 0.5 -0.3 -1.6 -1.3 .. -0.6 1.0 -0.2 1.1 0.9Trade 3.3 2.8 1.9 1.7 0.8 1.1 0.6 0.0 0.7 .. 1.1 1.2 1.0 0.0 1.1Water Works * supply 4.1 2.8 3.2 0.0 2.7 4.0 1.9 -0.1 0.9 *- -. 4 0.6 0.9 0.6 0.6Non-faterial A Other Net Prcdlction 0.7 2.6 2.7 2.9 0.7 2.1 2.8 0.9 1.2 *- 0.6 1.3 1.7 3.6 4.1
Total E tlo_esnt 1.4 0.4 0.2 -0.2 -0.2 0.2 -0.1 -1.2 -0.3 .. -0.6 -0.6 -O.S -0.4 -0.1....................... ............................................ .......................................... ............................................................... .......... .............. ..... ....................... ..... .......... ..... ...
Source: Central statistical office.
a/ New classification of branches.

- 59 -
T*b 1.3: la y 1 UP Pu P~' b
" im In 1"P 1"a 1" 1 1"11 S 1" 1 19" 195 "W I
Of ............ . Fir ................
lOI"Us a Feumy I.5 51.2 44.1 0.9 1".1 13.6 3. 14.2 140.3 163 UT.3 15.1 14.3
Irdae 1L.0 &. 77A6 1.9 110.8 1A.1 154J.3 1.7 171.4 177.4 17.1 1n73 W.3sWlr r & Nhu SU2 6a I2 11W.3 112.4 49 132 14.2 171.9 15.3 1M.0 180.3 1a.1Webcti 70.2 n5.1 S.r W.o M.9 G 1r.7 UO.4 uLO 1".o uo.o 0 .A 146.4
CswttmSIA iLl W.7 115.3 113.2 13.3 I.2 140. 129.8 132.2 134.2 135.3 136.3
T a t a t 14.9 93 ?5.1 99. 12S.6 %L0 151.1 1566 161.0 16.3 16.8 169.6 174.7
knt0r 1 bn 139 13- tRF7 19iDiD15.W 1511 13W1 l112 115 1311 115 1S36 1387 /
DfaitfUa& was" 7. 4.6 7.0 3.9 2.8 4.0 9.5 -2.7 S.7 -0.7 7.3 5.2
Ird.stry 3.0 3.7 6A6 0.7 06 7.1 6.1 4.7 3.5 -1.9 -0.3 4.4M'iwtuwuvj*& Nfnbte 3.4 3.9 7.1 0.9 0.7 7.r 7.0 4.6 4.7 -1.8 -0.9 4.9
outi%ilm 1.4 2.4 4.4 -0.2 -0.5 4.1 2.0 5.4 -2.7 -2.8 2.6 2.0
sava 4.6 4.3 3A 3.3 -0.2 3.5 0.4 2.4 1.8 1.5 0.8 0.7
T o t * t 4A 4.8 5.8 4.8 0.2 4.1 3.0 1.4 3.3 0.3 1.7 3.0............................................................................................................................. ............................................................................................ .........
W Pr*tf4riny.
W: MP m f i am fr s do oWrst Ststiuticst Off Im 1A" f tin w* frm the Statistical Y_bock f Ia. (at ttrbqimIril of th _w.

- 60 -
Tble 2. National Acets Sua inry("tltion of UW$ at Conatat 1961 Prines)
1977 1976 1979 1900 1961 1962 195 19U 1905 196 1967 b/................................................................................................. I..............................
1. GPOs Dometic Prsdwt 20,590 21,545 21,62 21,8ft 22,723 23.14 23.323 23,941 23,69 24.247 25,0662. Tem of Trade Effect 220 186 30 73 0 (234) (5Z3) (760) (672) (1,211) (1,141)3. Croa Domestic Income 20,618 21,731 21,902 21,961 22.,M 22,920 22,706 23,161 23.007 23,036 23,928
4. So ewce GaW (5-6) 3 1,640 669 476 239 (192) (445) (753) 503) 345 1305. Imorts (pMs) 6,504 9,617 9,174 9,073 9,221 8,674 5,950 9,04 9,754 10,016 10,3286. Cpcity to Impt 7,6 7.m ,505 8,599 8,962 9.065 9,395 9,799 10,2S7 9,671 10,1997. (IExports (g.nfa)) 7,446 7,592 8,475 6,324 6,962 9,29 9,920 10,3S9 11,130 10,812 11,339
S. Total Expenditure. 21,656 23,57T 22,T7 22,437 22,967 22,720 22,332 22,406 22,504 23,361 24,057
9. Conaumption 14,702 15,373 15,743 15,139 16,227 16,501 16,579 16,777 17,072 17,477 17,92910. Genral Goverrmnt 1,929 2,116 2,215 2,218 2,305 2,343 2,349 2,378 2,477 2,591 2,62011. Private 12,773 13,257 13,528 13,621 13,921 14,157 14,230 14,399 14,595 14,86 15,309
12. Investmnt 6,953 8,196 6,=26 6,596 6,741 6,226 5,m S630 5,432 5,904 6,12913. Fixed Investment 6,324 6,630 6,679 6,295 6,024 5,926 s,727 5,314 5,345 5,694 6,00614. Chags in Stocks 629 1,568 149 303 717 300 47 117 67 210 122
15. Domstic Saving 6,115 6,358 6,159 6,122 6,502 6,419 6,219 6,364 5,935 5,559 5,99916. Net Factor Income a/ (250) (343) (434) (384) (827) (634) (503) (716) (874) (912) (926)17. Current Tramfersa 64 129 48 48 48 63 62 76 80 80 10118. National Savinf a/ 5,929 6,144 s,m 5,786 s,723 5,49 5,778 5,745 5,141 4,726 5,174
Forint Deflators (1981 a 1.00)19. Gross Comstic Product 0.823 0.852 0.909 0.960 1.000 1.067 1.120 1.191 1.262 1.309 1.42320. Ilports (g4nfs) 0.915 0.914 0.971 0.95S 1.000 1.034 1.119 1.196 1.239 1.301 1.32721. Exports (g4nfs) 0.942 0.936 0.974 0.963 1.000 1.008 1.060 1.107 1.142 1.156 1.19422. Total Expenditures 0.819 0.850 0.910 0.957 1.000 1.078 1.146 1.232 1.311 1.376 1.49023. Goverruent Consuqption 0.873 0.906 0.938 0.974 1.000 1.047 1.128 1.167 1.231 1.305 1.39924. Private Consuwtion 0.762 0.795 0.84 0.944 1.000 1.060 1.129 1.215 1.297 1.362 1.47725. Fixed Investmnt 0.911 0.942 0.963 0.962 1.000 1.052 1.120 1.191 1.266 1.337 1.42326. Changes in Stocks 0.870 0.846 2.216 1.308 1.000 2.709 10.688 6.600 8.767 4.375 8.286
27. Exchange Rate Index 0.838 0.905 0.964 1.05S 1.000 0.937 0.804 0.714 0.685 0.749 0.731(US cents per Forint)
a/ Estifmtes.b/ Preliminary.Source: Central Statistical Office.STOTAS: NI.Y48

Table 2.1: HUNGARY: CDP ST SOURCE IN CURRENT VALUES
............................................................................... .....................................................................................................................................................................................
It" 1960 1965 1970 1975 1977 1978 1979 1980 1961 1982 1963 1964 1965 1986 1967 .I......................................................... .................................................................................................................. ___
Billions of Current Forints
Nwuufacturing 87 6 108.6 123.5 204.4 231.3 248.5 269.3 243.4 268.3 290.0 303.8 329.7 351.9 361.0 401.1Agriculture & Forestry 34.7 39.7 60.6 86.4 105.4 107.8 108.8 123.5 136.8 148.5 152.9 166.1 146.6 182.6 188.9Construction 12.2 12.5 27.0 43.4 54.5 60.0 63.1 53.4 55.5 60.1 65.5 71.1 74.0 79.0 92.3Transport & Couwmications 11.2 13.8 28.1 39.4 48.1 52.4 54.8 58.5 64.0 70.5 71.4 74.2 77.7 86.3 94.2Trade & Other Material Sectors 4.2 8.9 41.7 69.7 80.4 88.0 90.6 77.7 82.4 86.1 95.7 106.7 120.9 134.0 159.3Non-Materisl Sectors 20.3 25.8 38.4 57.5 67.1 73.7 81.3 89.0 96.4 103.3 112.9 125.4 140.4 154.3 171.6Custom Duties, Valuation 5.0 5.6 13.2 (18.1) (4.6) (0.7) 14.4 75.5 76.5 89.4 94.2 103.3 102.2 91.6 116.5
AlT 0 T A L 175.2 214.9 332.5 482.7 582.2 629.7 682.3 721.0 779.9 847.9 b96.4 978.5 1,033.7 1,068.8 1,223.9
Percent Distribution
aNbuf-eturing 50.0 5s.5 37.1 42.3 39.7 39.5 39.5 33.8 34.4 34.2 33.9 33.7 34.0 33.2 32.8Agriculture & Forestry 19.8 18.5 18.2 17.9 18.1 17.1 15.9 17.1 17.5 17.5 17.1 17.0 16.1 16.8 15.4Construction 7.0 5.8 8.1 9.0 9.4 9.5 9.2 7.4 7.1 7.1 7.3 7.3 7.2 7.3 7.5rarnsport & Com ications 6.4 6.4 8.5 8.2 8.3 8.3 8.0 8.1 8.2 8.3 8.0 7.6 7.5 7.9 7.7Trade & Other Material Sectors 2.4 4.1 12.5 14.4 13.8 14.0 13.3 10.8 10.6 10.2 10.7 11.1 11.7 12.3 13.0Non-Material Sectors 11.6 12.0 11.S 11.9 11.5 11.7 11.9 12.3 12.4 12.2 12.6 12.8 13.6 14.2 14.0Custom Duties, Valuation 2.9 2.6 4.0 -3.7 *0.8 *0.1 2.1 10.5 9.8 10.5 10.5 10.6 9.9 8.4 9.5
T 0 T A L 100.0 100.0 100.0 100.0 100.0 100.0 100.0 100.0 100.0 100.0 100.0 100.0 100.0 100.0 100.0
~~~~~~~----.-.--........................................................................................................................................................................................................................... . ..
a/ Preliminary.Source: Central Statistical Office.

Table 2.2: IUNGARY: GDP sY EXPEINDITUtE IN CIttRENT VALUES
,. ........ ... ...... ............ ..................................... .......................................................................... ................... ....... ............ ... ... . .
It_ 1960 1965 1970 1975 1977 1978 1979 1960 1961 1962 1963 19" 1965 19"6 1967 s/........... .. ... ....... .... ................................................................ ..... .................. ................... .......... ......... ..............................
Sillian. of Current Forints
Cenrmption 130.3 161.6 228.5 336.3 391.8 427.5 472.5 515.3 556.8 599.3 642.1 695.7 753.9 811.5 901.7
Graes Fixed irestr mnt 42.6 49.0 100.2 161.0 197.7 214.4 220.8 207.7 206.7 213.9 220.1 225.4 232.1 261.2 293.3
Ch ge In Stocks 6.2 5.9 11.5 21.4 18.8 45.5 11.3 13.6 24.6 27.9 17.1 26.4 26.3 31.5 34.8
Net Exports of G 4 NFS (3.9) (1.6) (7.7) (36.0) (26.3) (57.7) (22.3) (15.6) (8.2) 6.8 17.1 30.9 21.4 -15.4 -5.9
a,T 0 T A L 175.2 214.9 332.5 482.7 582.0 629.7 682.3 721.0 779.9 847.9 896.4 978.4 1,033.7 1,068.8 1,223.9 t)
Percent Distribution
Consumtion 74.4 75.2 68.7 69.7 67.3 67.9 69.3 71.5 71.4 70.7 71.6 71.1 72.9 74.5 73.7
Gross Fixed Investm t 24.3 22.8 30.1 33.4 34.0 34.0 32.4 28.8 26.5 25.2 24.6 23.0 22.5 24.0 24.0
Ch s in Stocks 3.5 2.7 3.5 4.4 3.2 7.2 1.7 1.9 3.2 3.3 1.9 2.7 2.5 2.9 2.8
Not Exports of G & NFS (2.2) (0.7) (2.3) (7.5) (4.5) (9.2) (3.3) (2.2' (1.1) 0.8 1.9 3.2 2.1 (1.4) (0.5)
T 0 T A L 100.0 100.0 100.0 100.0 100.0 100.0 100.0 100.0 100.0 100.0 100.0 10 100.0 100.0 100.0
........ ............ ..... ....... ..... ....... ..... ....... .............. .......................... .......... .................. ................................
of Pretiminary.Source: Central Statistical Office.

Table 2.3: HUNGARY: GOP Bt SCUFCE IN REAL TERMS
~~.. .. ... ......... ................ . . . . . .. .. . . . . . . .. . . . .- . . . . . .. . . . .. . . . . . . . . . . . . . . . . . . . . .. . .. . . . .. . . .Ito 1960 196S 1970 197S 1975 1976 1979 1980 1961 1962 196 101 195 1966 17 b/........................................................................................................................................................................
------------ 1976 forints ------ - .-- -------------------- 1951 Forints --.--.------- -----------------------------lilline of Conetant Forints
1mwfacturing 71.7 100.4 136.4 196.3 203.5 240.0 252.9 249.3 261.7 274.1 279.0 286.2 230.2 278.9 269.1Agriculture & For etry 65.1 68.3 80.4 97.2 118.0 128.5 126.8 11.5 136.0 151.8 151.9 159.0 1S2.5 157.9 1S7.9Corstruction 18.6 21.0 30.6 43.7 43.2 52.7 S4.9 53.4 54.1 S3.7 ss.2 52.3 49.9 49.9 S2.2Trnport & CoRmicatiomn 19.5 25.2 33.3 43.0 52.7 58.6 60.6 61.1 63.9 64.6 64.8 6.7 6".1 68.0 71.2Trade & Other Material Sectors 24.4 28.7 44.6 64.3 70.7 82.1 83.7 79.6 61.9 81.s 64.S 85.1 U.4 91.3 96.2Won-fttrial Sectorc 32.5 39.S 47.9 63.0 77.8 88.7 92.7 95.1 96.5 100.4 102.2 107.0 111.4 114.6 11.9Custom Duties, Vluation 0.1 0.2 0.6 0.9 74.1 88.7 78.9 81.0 76.S 68.4 62.7 65.2 70.9 71.4 74.sStatistical Discrepancy a/ (9.9) (7.7)
T 0 T A L 222.0 275.6 373. 506.4 640.0 739.3 750.5 751.0 M.6 794.5 600.3 821.5 619.4 832.0 860.3
Amusl Growth Rates 1960-65 1965-70 1970-75 1975-80 l976 1979 1980 1961 1962 1963 1964 l 1966 1967
Real Growth Rates
Natfacteraiw 7.0 6.3 7.3 4.1 5.6 5.6 1.4) 5.0 4.7 1.5 2.5 (2.1) (0S) 3.7Agriculture & Fo retry 1.0 3.3 3.9 2.2 0.9 (1.3) 3.7 3.4 11.6 0.1 4.6 (4.1) 3.S 0.6Constructlon 2.5 7.8 7.4 4.3 4.6 4.2 (2.7) 1.3 (0.7) 2.8 (5.2) (4.6) 0.0 4.6Trwuport & Coammications S.3 5.7 5.2 3.0 3.7 3.4 0.8 4.6 1.1 0.3 2.9 (0.9) 2.9 4.rTrade 4 Other Materiel Sectors 3.3 9.2 7.6 2.4 5.3 1.9 (4.9) 2.9 (S.5) 3.7 0.9 3.9 3.3 S.4Non-Material Sectors 4.0 3.9 5.6 4.1 4.8 4.5 2.6 3.6 1.9 1.8 4.7 4.1 2.9 3.8
T 0 T A L 4.4 6.3 6.2 3.3 4.6 1.5 0.1 2.9 2.8 0.7 2.7 (0.3) 1.s 3.4
a/ The statistical discrepancy arises from the Joining of two constant price series in 1970 nd 1961.b/ Prelioiniry.
Source: Central Statistical Office.

Table 2.4: HUMGARY: GDP BY EXPENDITURE IN REAL TERNS
............. ....................... ............................ ........................................................ ............................ ........................................... ..........................................................
ltem 1960 1965 1970 19Th 1975 1978 1979 1980 1981 1962 1963 1964 1906 1966 1967 b/
........................................................................................ .........................................................................................................................................
.................................
------------- 1976 Forints -------- -------------------------------- 1981 Forints ---- -----.--------------- ----- --------------
Slitions of Constant Forints
ConstuWtion 177.9 213.9 282.4 356.1 471.9 527.5 540.2 543.5 559.3 566.2 569.0 575.7 585.8 599.7 61S.2
Gross Fixed Investomnt 55.0 70.6 120.4 168.2 193.5 227.5 229.2 216.0 206.7 203.4 196.4 189.2 183.4 195.4 206.1
Change in Stocks 3.3 4.4 3.3 11.5 22.5 53.8 5.1 10.4 14.8 10.3 1.6 4.0 3.1 7.2 4.2
Net Exports of G 4 NFS (13.3) (5.4) (32.3) (29.4) (47.9) (69.5) (24.0) (18.9) (8.2) 14.6 33.3 52.6 47.2 29.7 34.7
Statistical Discrepancy t7 (0.9) (7.9)
T 0 T A L 222.0 275.6 373.8 506.4 640.0 739.3 750.5 751.0 772.6 794.5 800.3 821.5 819.5 832.0 860.3
Annumt Growth Rates 1960-65 1965-70 1970-75 1975-80 1978 1979 1980 1981 1982 1963 1984 1985 1966 197 b/
Reel Growth Rates
Conew tion 3.7 5.7 4.7 2.9 4.6 2.4 0.6 2.9 1.2 0.5 1.2 1.8 2.4 2.6
Gross Fixed Invettment 5.1 11.3 6.9 2.2 4.8 0.7 (5.8) (4.3) (1.6) (3.4) (3.7) (3.1) 6.5 5.5
Change in Stocks 5.8 (5.6) 28.5 14.3 149.1 (90.5) 103.9 42.3 (30.4) (84.5) 158.5 (22.5) 132.3 (41.7)
T 0 T A L 4.4 6.3 6.2 3.3 4.6 1.5 0.1 2.9 2.A 0.7 2.7 (0.2) 1.5 3.4
............... ........................... ................................. .................................................................. ........................................................... .....................................
at The statistical discrepwncy arises from the joining of two constant price series in 1970 nd 1981.
b/ Preliminary.
Source Central Statistical Office.
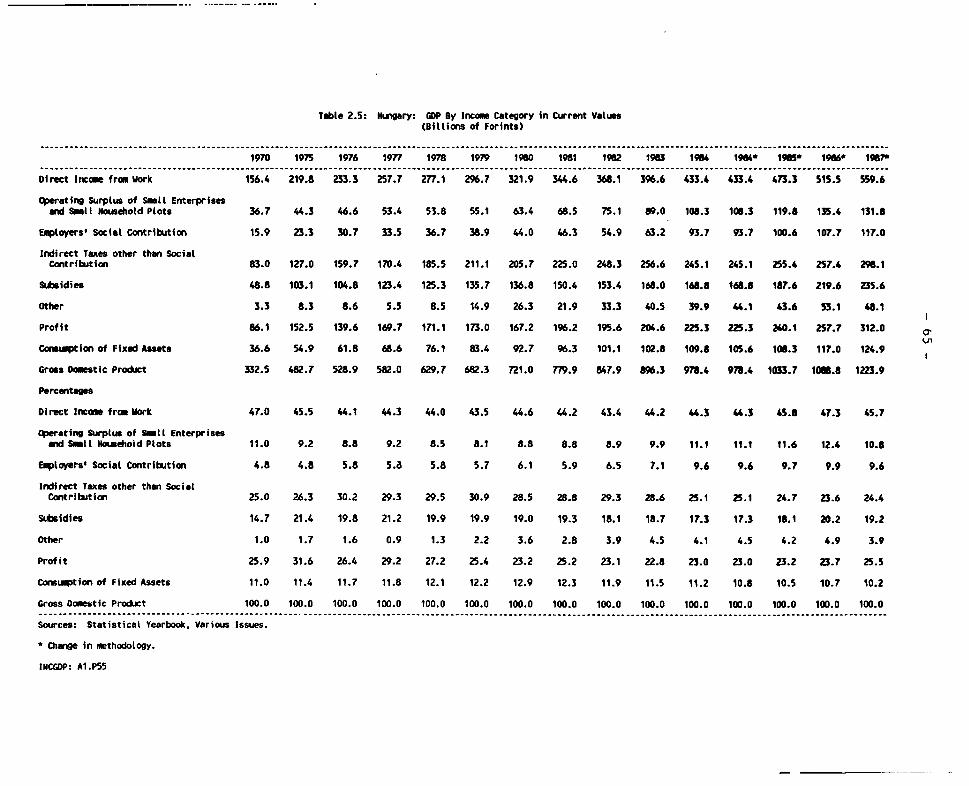
Table 2.5: Hungary: GDP By Income Category in Current Values(Billions of Forints)
1970 1975 1976 1977 1978 1979 1980 1981 1962 1983 1964 1964 1985* 1966* 196?w.........................................................................................................................
......................................................................................................... --------- .. .............. .
Dlrect Incme from Work 156.4 219.8 233.3 257.7 277.1 296.7 321.9 344.6 368.1 396.6 433.4 433.4 473.3 S15.5 559.6
Operatirig Surplus of Smlt Enterprisesand Smll Housdeold Plots 36.7 44.3 46.6 53.4 53.8 55.1 63.4 68.5 75.1 89.0 108.3 106.3 119.6 135.4 131.0
Euployers' Social Contribution 15.9 23.3 30.7 33.5 36.7 38.9 44.0 46.3 54.9 63.2 93.7 93.7 100.6 107.7 117.0
Indirect Taxes other than SocialContribution 83.0 127.0 159.7 170.4 185.5 211.1 205.7 225.0 248.3 256.6 245.1 245.1 255.4 257.4 296.1
Subsidies 48.8 103.1 104.8 123.4 125.3 135.7 136.8 150.4 153.4 168.0 168.8 168.8 187.6 219.6 235.6
Other 3.3 8.3 8.6 5.5 8.5 14.9 26.3 21.9 33.3 40.5 39.9 44.1 43.6 53.1 48.1
Profit 86.1 152.5 139.6 169.7 171.1 173.0 167.2 196.2 195.6 204.6 225.3 225.3 240.1 257.7 312.0
Consuption of Fixed Assets 36.6 54.9 61.8 68.6 76.1 83.4 92.7 96.3 101.1 102.8 109.8 105.6 106.3 117.0 124.9
Gross Domestic ProJct 332.5 482.7 528.9 582.0 629.7 682.3 721.0 779.9 847.9 896.3 978.4 978.4 1033.7 1066.8 1223.9
Percentages
Direct Incme from Work 47.0 45.5 44.1 44.3 44.0 43.5 44.6 44.2 43.4 44.2 44.3 4.3 *5.8 47.3 45.7
Operating Surplus of Smll Enterprisesnd Sm_ll Hosehold Plots 11.0 9.2 8.8 9.2 8.5 8.1 8.8 8.8 8.9 9.9 11.1 11.1 11.6 12.4 10.8
Esployers' Social Contribution 4.8 4.8 5.8 5.a 5.8 5.7 6.1 5.9 6.5 7.1 9.6 9.6 9.7 9.9 9.6
Indirect Taxes other than SocialContribution 25.0 26.3 30.2 29.3 29.5 30.9 28.5 28.8 29.3 28.6 25.1 25.1 24.7 23.6 24.4
Stbsidies 14.7 21.4 19.8 21.2 19.9 19.9 19.0 19.3 18.1 18.7 17.3 17.3 18.1 20.2 19.2
Other 1.0 1.7 1.6 0.9 1.3 2.2 3.6 2.8 3.9 4.5 4.1 4.5 4.2 4.9 3.9
Profit 25.9 31.6 26.4 29.2 27.2 25.4 23.2 25.2 23.1 22.8 23.0 23.0 23.2 23.7 25.5
Consuiption of Fixed Assets 11.0 11.4 11.7 11.8 12.1 12.2 12.9 12.3 11.9 11.5 11.2 10.8 10.5 10.7 10.2
Gross Domestic Product 100.0 100.0 100.0 100.0 100.0 100.0 100.0 100.0 100.0 100.0 100.0 100.0 100.0 100.0 100.0
Sources: Statistical Yearbook, Various Issues.
* Chaige in methodology.
INCGDP: A1.P55

- 66 -
Tabte 2.6: 1uawy: Gross Fixed Irmits(6ittim of O.Tent Forfits)
,.......................................... ......... ............... .... ..... ... ... ....... ........... .. ......... ............... .. ..........
1975 1976 1977 1978 1979 19"O 1981 192 193 1984 1985 1966 1987 b/
Mining 5.4 6.0 7.6 8.4 9.2 9.9 9.5 9.9 12.0 14.1 16.9 16.6 16.6
Electricat bErW 7.5 8.3 10.2 11.6 13.6 13.9 12.9 13.5 15.5 15.7 15.7 13.7 15.9
stattuwgy 3.4 3.7 5.2 6.4 9.2 8.5 7.3 5.5 6.0 5.9 4.4 4.1 3.5
Erg1naerlrn 8.5 10.3 15.2 15.2 14.4 12.2 10.6 11.2 11.4 11.0 9.4 9.7 13.4
BWtdirr Ibteriats 3.3 4.2 4.9 5.1 4.9 3.4 2.5 2.3 2.7 2.5 3.2 2.4 2.5
CsilcaL Krfistry 10.8 11.4 13.2 12.6 10.0 7.9 8.8 11.1 11.1 10.7 13.5 13.5 15.6
Ligt Irdstry 6.7 6.6 7.2 8.0 6.3 4.9 5.1 7.1 5.5 5.3 4.7 6.1 5.7
Misco1twla IrdstrY 0.6 0.7 0.7 0.8 0.9 0.8 1.0 0.8 0.6 0.4 0.4 0.3 0.4
Fowd Idnstry 6.7 7.5 11.3 12.3 11.8 8.7 82 7.7 7.1 8.0 8.7 9.3 9.8
Iruiatry- Tocal 52.9 58.7 75.5 80.4 80.3 70.2 65.9 69.1 71.9 73.6 76.9 75.7 83.4
Cutrctan 3.5 4.1 5.5 7.3 6.2 5.2 4.1 3.4 3.3 3.0 2.5 2.7 3.4
Agricutture & Forestry 22.3 22.5 25.5 29.0 28.9 a6.4 29.7 30.7 27.8 26.5 25.5 28.9 36.2
AWiauLt,e 21.4 21.4 24.1 27.3 27.3 24.9 27.9 29.3 26.6 25.2 24.1 27.1 34.0
Forestry 0.9 1.1 1.4 1.7 1.6 1.5 1.8 1.4 1.2 1.3 1.4 1.8 2.2
Tranport & Camicatios 22.3 20.8 22.4 25.3 28.0 27.0 24.6 24.8 25.6 24.9 25.9 29.5 34.8
Trade 7.6 8.1 7.9 8.1 8.7 10.1 10.7 9.5 9.5 9.8 10.2 9.2 10.4
Intermal 7.0 7.5 7.1 7.3 8.1 9.2 10.2 9.0 8.9 9.3 9.5 8.2 9.4
Exterral 0.6 0.6 0.8 0.8 0.6 0.9 0.5 0.5 0.6 0.5 0.7 1.0 1.0
Water Ecarw 7.8 8.5 9.8 10.6 11.8 11.7 12.0 12.2 13.2 13.8 14.2 18.3 20.7
Other aterial Brdes -- 0.7 0.7 0.9 0.7 0.8 0.7 1.0 1.3 1.3 1.3 1.5 1.5
TOTAL - ibterial Brwehes 116.4 123.4 147.3 161.6 164.6 151.4 147.7 150.7 152.6 152.9 156.5 165.8 190.4
Nw:-4terial Branhes 30.1 28.7 34.2 36.0 39.4 38.3 35.1 35.0 35.3 35.9 37.6 41.6 48.2
of hich:Hmlth/Edcatian 9.5 9.3 11.4 12.0 13.8 14.4 13.7 13.7 15.1 13.6 14.3 17.6
HQairg 12.8 12.1 15.9 15.7 16.0 15.5 13.0 12.9 10.0 9.7 9.6 7.1
Sociatist Sector 146.5 152.1 181.5 197.6 204.0 189.7 182.8 185.7 187.9 188.8 194.1 207.4 258.6
Private al 16.9 18.6 20.0 20.9 21.7 23.7 26.6 29.8 36.1 42.7 45.5 51.8 55.7
Ariculture 0.8 1.0 1.0 1.0 1.0 1.0 1.0 1.0 1.1 1.2 1.5 1.8 2.2
Hcisirg 16.1 17.6 19.0 19.9 20.7 22.7 25.6 23.8 35.0 41.5 44.0 46.4 53.5
TOTAL - ECOMOW 163.4 170.7 201.5 218.5 25.7 213.4 2M9.4 215.5 224 231.5 29.6 259.2 294.3
Saue: Central Statistical Office.a/ Includs private investnunts in iruitry, cmatictian, agriAAte, awd truapwt.
bl Pretiurnry.

- 67 -
T*I. 2.7: oftay &m Fin In-m 0itLia of Cw,tat Fafrin)
...................................................... ............................................................................................... __
19W 1977 19w8 1979 1S0 1M0 131 "a 1 1"a 1 19t 1"a b........ ........... ................................................................................................................. ............................................................................................
--- * 13 ------r----s.---- ---------------------------- horn -------------------------------
iNnirW 6.0 73 T.8 .4 9.1 10.2 9.4 9.4 10.7 12.0 13.J 12.7 11.9Electricel Do* .2 9.8 10.9 12.5 13.0 14.1 12.9 13.0 13.9 13.S 13.0 11.0 11.8Ntatl w 3.7 5.0 S.9 61 7.7 a6 7.3 53 5.3 5.0 3.6 3.2 2.5E*lmwiro 10.3 14.5 13.9 13.0 11.3 12.4 0. 106 10.3 9.5 7.8 7.7 9.7
i"gr rIots 4.1 4.7 4.7 4.5 3.1 3.5 2.5 2.2 2.4 2.2 2.6 1.9 1.8e_lcal I nds 11.4 12.6 11.r 9.1 7.2 &I a9 lO.S 9.9 9.1 11.0 10.4 11.2Lift IrdAtry 6.8 6.8 7.5 5.8 4.6 5.1 5.1 6.7 4.9 4.5 3.8 4.7 4.1
Maclleuos I nrdty 0.7 0.7 0.7 0.8 0.8 0.8 1.0 0.8 0.5 04 0.3 0.3 0.3Food Irnsr 7.5 10.9 11.S 10.9 8.1 8.9 8.2 7.5 6.5 6.9 7.0 7.1 7.1
irdstry- Total 56.7 72.3 74.6 73.1 64.9 71.7 05.9 06.0 64.4 65.1 62.9 59.0 60.4
CaMtnxtifn 4.1 5.3 6.8 5.7 4.8 5.4 4.1 3.3 3.0 2.6 2.1 2.3 2.5
AriaAture & Foretry Z.5 24.7 27.1 2.6 23.5 27.3 29.7 29.5 24..7 Z.2 20.5 21.8 27.1ArfILAUte 21.4 23.4 2.5 25.1 Z.1 25.7 27.9 3L2 23.6 21.1 19.3 20.4 2S.5Fortry 1.1 1.3 1.6 1.5 1.4 1.6 1.8 1.3 1.1 1.1 1.2 1.4 1.6
Trionrt & CCom catlas 2D.8 21.3 3.5 25.6 24.8 27.9 A.6 23.5 23.0 21.4 21.1 Z.9 25.8
Tra* 8.1 7.7 7.6 8.0 9.3 10.4 10.7 9.1 8.6 8.3 8.1 7.5 7.6niten, L 7.5 6.9 6.9 7.4 8.5 9.5 10.2 8.5 8.0 7.8 7.5 6.3
Extaenu 0.6 0.8 0.7 0.6 0.8 0.9 0.5 0.6 0.6 0.5 0.6 1.2
Water ECaW1 8.5 9.3 9.7 10.6 10.5 12.0 12.0 11.5 11.7 11.5 11.1 13.6 14.9
Oh. Nateritl Brrdi 0.7 0.6 0.9 0.6 0.8 0.8 0.7 1.0 1.2 1.2 1.2 1.2 1.1
TOTAL - Narial Urwh2 123.4 141.2 150.2 150.2 138.6 155.5 147.7 143.9 136.6 130.3 127.0 128.3 139.4
Nwt-NterIaL Ordes 28.7 32.8 35.4 35.4 34.7 39.7 35.1 33.2 31.8 30.5 30.3 31.6 34.6of bbich-:HmLtdhEdeation 9.3 10.9 11.2 12.5 13.1 14.9 13.7 13.0 13.6 11.6 11.4
Hlbirig 12.1 15.2 14.4 14.2 13.8 16.1 13.0 12.1 8.9 8.1 7.6
Other 2.4 3.0 3.3 3.3 3.8 4.3 3.8 3.2 3.0 2.8 2.4
SociaList Sector 152.1 174.0 1W.6 15.6 173.3 195.2 182.8 177.1 18.4 10.8 157. 159.9 174.0
Privte a/ 18.6 18.8 18.8 18.9 19.3 23.5 A.6 27.7 30.8 35.0 32.0 34.0 33.3AricAtue 1.0 0.9 0.9 0.9 0.8 1.1 1.0 0.9 1.0 0.9 11 1.2 1.3
Nosirg 17.6 17.9 17.9 18.0 18.5 24.4 25.6 26.8 29.8 32.1 30.9 32.8 32
TOTAL - EDOf 170.7 1S.8 22.4 204.5 192.6 Z0.7 209.4 203.8 199.2 193.8 13.3 193.9 207.3
Sa=: C tral Statistical Offioe.V IrcLus prite i nrrwut in irdstry, owtnaticr, irfAture, wd t. rt.bl Protimirwy.

- 68 -
Toble 3: # ruroy: 8lonce of PaymntsMS Nitt1a)
......................................................................................... ..................illio.... .)
1978 1979 1980 1961 1962 1983 196 1965 1966 1987 p/.......... ................... ___................ .................................. __.... ...... ............ ....
Exports (fob) 666.0 7949.0 878.0 89.0 9063.0 8i .0 96.6 8862.2 9148.0 9692.0lI_ts (fob) M71.0 09.0 9021.0 M855.0 8575.0 8452.0 62.5 8273.9 9670.0 9787.0
Trudk Dle -1107.0 -560.0 -143.0 39.0 501.0 426.0 814.1 606.3 -522.0 105.0
Fr,iht A In wnce (Not) -263.0 -264.0 -332.0 -326.0 -311.0 -246.0 -219.9 -239.6 -313.0 -390.0Trael (Mot) 118.0 179.0 191.0 250.0 257.0 260.0 265.8 262.6 366.0 538.0Uwestmnt IreAm (Net) -264.0 -381.0 -369.0 -1120.0 -962.0 -666.4 -759.7 -750.5 -857.0 -963.0GovwrwAmnt Experditure (Net) -33.0 -39.0 -40.0 -44.0 -42.0 -32.0 -31.6 -3S.6 -228.0 -46.0Other Current Item (Not) 93.0 80.0 67.0 256.0 174.0 236.0 136.6 32.0 -9.0 65.0Unroequted Trrafe (Met) 99.0 42.0 48.0 49.0 63.0 57.0 66.0 68.7 78.0 105.0
Current Account -1437.0 -943.0 -578.0 -896.0 -313.0 36.6 271.3 -56.1 -1285.0 -586.0
Mediur mnd Long-Term CapitatAsets si -76.0 -101.0 -160.0 -130.0 -180.0 -60.0 -155.9 -190.1 -375.0 -207.0Liabilities 1225.0 1037.0 948.0 1119.0 261.0 1S4.0 1014.3 1905.2 1028.0 715.0
Inflows C.) C.) (.) 2025.0 1201.0 1409.0 2856.7 4087.3 3861.0 3108.0Outftows ) C.) t.) -906.0 -940.0 -1255.0 -1842.4 -2182.1 -2833.0 -2286.0
Short-Term CapitalAssets a/ -170.0 12.0 -71.0 -87.0 -33.0 -266.0 -291.6 -415.6 11.0 -442.0Liabilities b/ 1017.0 -129.0 309.0 622.0 -851.0 583.0 -534.1 -78.1 609.0 -714.0
Overatl Balance 559.0 -124.0 440.0 -616.0 -1116.0 427.6 304.0 1165.3 -12.0 -1234.0
Monetary Move_ ntsMontary Gold (-Increase) -134.0 63.0 -177.0 177.0 383.0 -367.6 -167.0 -81.6 -14.8 1278.0Foreign Exchang (-Increasn) -425.0 61.0 -263.0 439.0 498.0 -412.0 -573.0 -986.7 76.8 -44.0Use of Fund Resources c/ - -- -- -- 235.0 352.0 436.0 -97.0 -50.0 ..
Sources: Notional Bank of Hungary and IMF.
a/ Mon-reserve assets; motly export financing.bl IncLudes Errors and Oissions.c/ Includss drawing of Slt 72 Million under CFf in DOecer 1962.pJ Proliminary.
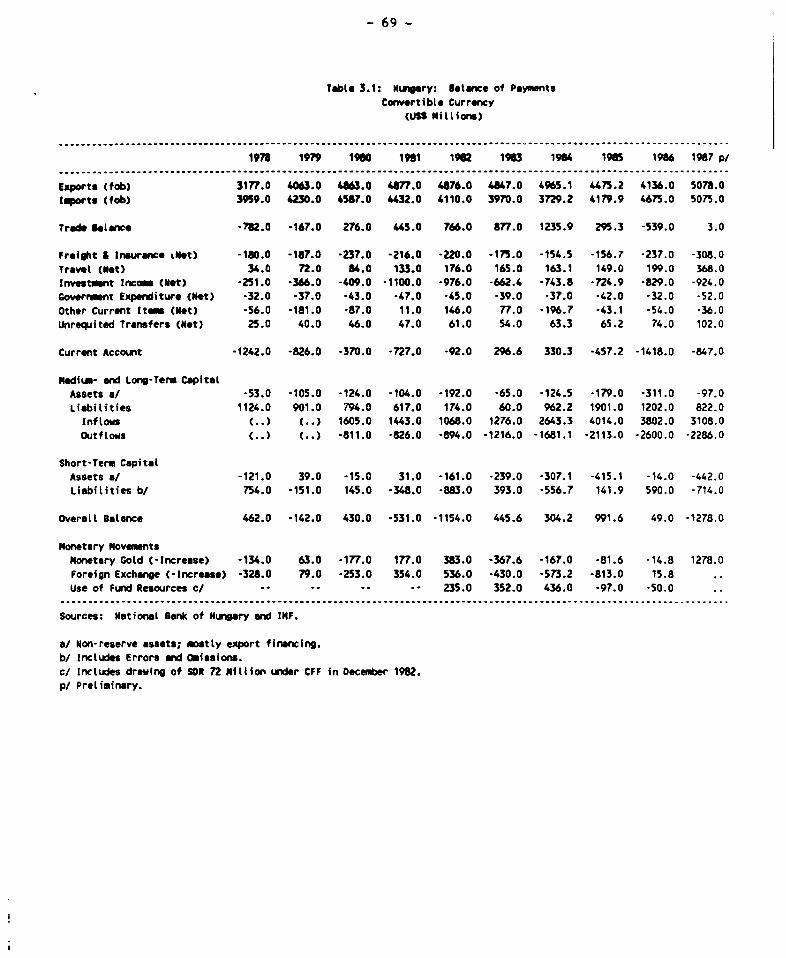
- 69 -
Table 3.1: NuWrry: Balance of PaymentsConvertible Currency
(US Nillions)
..... ................................................................ .. ...... ........ ........ ............... ........... ...................... ..........
1978 1979 1980 1991 1962 1963 1964 1963 1986 1967 p/,............. ....... . .................................................. ...... ...... ... .....
Exports (fob) 3177.0 4063.0 4863.0 4877.0 4876.0 4867.0 4965.1 4475.2 4136.0 5078.0lwportU (fob) 3959.0 4230.0 4587.0 4432.0 4110.0 3970.0 3729.2 4179.9 4675.0 5075.0
Trade alonc -782.0 -167.0 276.0 445.0 766.0 877.0 1235.9 295.3 -539.0 3.0
Freight 4 Insurance %Net) -180.0 -187.0 -237.0 -216.0 -220.0 -175.0 -154.5 -156.7 -237.0 -308.0Travel (Not) 34.0 72.0 84.0 133.0 176.0 165.0 163.1 149.0 199.0 368.0Invest _nt Income (Met) -251.0 -366.0 -409.0 -1100.0 -976.0 -662.4 -743.8 -724.9 -829.0 -924.0Covernment Expenditure (Not) -32.0 -37.0 -43.0 -47.0 -45.0 -39.0 -37.0 -42.0 -32.0 -52.0Other Current Item (Net) -56.0 -181.0 -87.0 11.0 146.0 77.0 -196.7 -43.1 -54.0 -36.0Unrequited Transfers (Net) 25.0 40.0 46.0 47.0 61.0 54.0 63.3 65.2 74.0 102.0
Current Account -1242.0 -826.0 -370.0 -727.0 -92.0 296.6 330.3 -457.2 -1418.0 -847.0
NediLo- and Long-Term CapitalAssets a/ -53.0 -105.0 -124.0 -104.0 -192.0 -65.0 -124.5 -179.0 -311.0 -97.0Liabilities 1124.0 901.0 794.0 617.0 174.0 60.0 962.2 1901.0 1202.0 822.0
InfLows C.) C.) 1605.0 1443.0 1068.0 1276.0 2643.3 4014.0 3802.0 3108.0OutfLows C.) C.) -811.0 -826.0 -894.0 -1216.0 -1681.1 -2113.0 -2600.0 -2286.0
Short-Term CapitalAssets a/ -121.0 39.0 -15.0 31.0 -161.0 -239.0 -307.1 -415.1 -14.0 -442.0Liabilities b/ 754.0 -151.0 145.0 -348.0 -883.0 393.0 -556.7 141.9 590.0 -714.0
Overall BaLance 462.0 -142.0 430.0 -531.0 -1154.0 445.6 304.2 991.6 49.0 -1278.0
Monetary MovementsMonetary Gold (-Increase) -134.0 63.0 -177.0 177.0 383.0 -367.6 -167.0 -81.6 -14.8 1278.0Foreign Exchange (-Increase) -328.0 79.0 -253.0 354.0 536.0 -430.0 -573.2 -813.0 15.8
Use of Fund Resources c/ 235.0 352.0 436.0 -97.0 -50.0
Sources: National Bank of Hungary and IMF.
a/ Non-reserve assets; mostly export fina ncing.bl Includes Errors and Omissions.c/ Includes drawing of SR 72 MiLlion under CFF in December 1982.p/ Preliminary.

- 70 -
Table 3.2: ung ry: 5antue of PaymentsNon-Convertible Currency
(USS Millions)
197A 1979 1960 1961 1982 1963 1964 1985 1966 1987 p/
Exports (fob) 3387.0 3886.0 4015.0 4017.0 4207.0 4031.0 3871.S 4407.0 5012.0 4814.0Iports (fob) 3792.0 4279.0 4434.0 4423.0 4465.0 4482.0 4293.3 4096.0 4995.0 4712.0
Trade 6alance -40S.0 -393.0 -419.0 -406.0 -258.0 -451.0 -421.8 311.0 17.0 102.0
Freight & Insurence (Net) -83.0 -77.0 -95.0 -110.0 -91.0 -71.0 -65.4 *82.9 -76.0 -82.0Travol (Net) 84.0 107.0 107.0 117.0 81.0 95.0 102.7 113.6 167 0 170.0Invs tment Incoe (Net) -13.0 -15.0 20.0 -20.0 14.0 -4.0 15.9 -25.6 -28.0 -39.0Goverrmnt Expenditure (Net) -1.0 -2.0 3.0 3.0 3.0 7.0 S.4 6.4 4.0 6.0Other Current Item (Not) 149.0 261.0 174.0 24S.0 28.0 161.0 333.3 75.1 45.0 101.0Unrequited Transfers (Net) 74.0 2.0 2.0 2.0 2.0 3.0 2.7 3.5 4.0 3.0
Current Account -195.0 -117.0 -208.0 -169.0 -221.0 -260.0 -59.0 401.1 133.0 261.0
MNdiu- and Long-Term CapitalAssets */ -23.0 4.0 -44.0 -26.0 12.0 -15.0 -31.4 -11.1 -64.0 -110.0Liabilities 101.0 136.0 154.0 502.0 87.0 94.0 52.1 4.2 -174.0 -107.0Inflows (.) C.) 191.0 582.0 133.0 133.0 213.4 73.3 59.0
lutftows C.) C.) -37.0 -80.0 -46.0 -39.0 -161.3 -69.1 -233.0
Short-Term CapitalAssets */ -49.0 -27.0 -56.0 -118.0 128.0 -27.0 15.5 -0.5 25.0Liabilities b/ 263.0 22.0 164.0 -274.0 32.0 190.0 22.6 -220.0 19.0 .
Overall SaLance 97.0 18.0 10.0 -85.0 38.0 -18.0 -0.2 173.7 -61.0 44.0
Monetary Movements
Nonetary Gold (-Increase) -- -- -- - -- -- -- -- -- --
Foreign Exchange (-Increase) -97.0 -18.0 -10.0 85.0 -38.0 18.0 0.2 -173.7 61.0 -44.0..... ....... ....... ........... .. .... ...... ........ ............. ......................... .......................................... .................................... ...
Sources: National Bank of Hungary and IMF.
a/ Non-reserve assets; mostly export financing.b/ Includes E rors and Oissions.p. PreliminarV.

- 71 -
Table 3.3: Wry: Ex ort Caosp ition(Percent)
1965 1970 197? 1980 1981 1982 1983 1964 1965.................... ............................................ .. 6......................
I 0 T A t E X P O A T s 100.0 100.0 100.0 10C.0 100.0 100.0 100.0 100.0 100.0Food 23.0 22.5 22.4 22.2 2S.1 24.6 22.8 22.4 21.0Mon-Food Agriculturo 2 4 3.0 1.6 2.9 2.4 2.3 2.6 2.3 2.6Netats and Mieralss 3.3 5.5 4.1 4.2 3.6 2.8 3.0 3.4 2.7Total Non Fuel Primrifes 28.7 31.1 28.1 29.4 31.1 29.7 28.4 28.1 26.3Fuels 1.6 1.3 2.0 4.8 4.r 6.6 9.2 8.6 5.1Total Primries 30.2 32.4 30.1 34.2 35.8 36.3 37.6 36.7 31.4Machirnry & Trasport Equipmnt 32.4 32.3 37.0 32.1 30.9 31.5 30.4 30.1 33.5Other Mnufactures 37.3 35.3 32.9 33.7 33.3 32.1 32.0 33.2 35.1Total Manufactures 69.8 67.6 69.9 65.8 64.2 63.7 62.4 63.3 68.6EXPORTS TO DEVELOPED ECONOMIES 21.7 27.6 18.7 29.5 26.6 24.1 25.3 28.4 27.4Food 10.2 10.4 7.1 7.9 7.2 7.0 7.3 8.1 7.2MSon-Food Agriculture 1.9 2.6 1.1 1.8 1.4 1.4 1.6 1.6 1.6tolF nd gintrlatres 1.2 2.7 1.1 1.7 1.5 1.4 1.4 1.7 1.4Totls Non Fu l Prieries 13.2 1S.8 9.2 11.4 di.e 9l7 10.3 11.3 10.2Fuels 0.6 0.7 0.5 1.6 1.9 1.4 2.1 3.2 2.9lotal PrImries 13.8 16.5 9.7 13.0 12.0 11.1 12.4 14.5 13.1Machinery & Transport Equipmnt 0.7 1.5 1.9 3.5 3.4 3.0 2.7 2.9 2.9Other Manufactures 7.1 9.6 7.0 13.0 11.2 10.0 10.2 11.0 11.4Total Mnufactures 7.8 11.1 8.9 16.5 14.6 13.0 12.9 13.9 14.3EXPORTS TO DEVELOPING COUJNTRIES 9.9 8.8 8.2 13.5 14.3 15.6 14.9 13.8 13.4Food 1.3 1.1 0.8 1.6 2.0 1.9 1.9 2.3 2.0Non-Food Agriculture 0.3 0.2 0.2 0.3 0.4 0.4 0.5 0.4 0.4Metals and tinerats 0.1 0.2 0.2 0.2 0.4 0.3 0.3 0.3 0.1Total Non Fuel Primaries 1.7 1.5 1.3 2.2 2.8 2.6 2.7 3.1 2.5Fuels 0.1 0.1 0.1 0.4 0.3 0.3 0.6 0.4 0.5Total Primaries 1.7 1.6 1.4 2.7 3.1 2.9 3.3 3.5 3.0Machinery & Transport Equipment 2.7 2.6 3.6 4.7 4.9 6.2 5.2 4.1 3.7Other Manufactures 5.5 4.6 3.2 6.2 6.3 6.5 6.3 6.3 6.7Total Manufactures 8.2 7.2 6.8 10.9 11.2 12.7 11.5 10.3 10.4EXPORTS TO O:. EXPORTERS 2.8 2.5 3.2 5.2 6.8 8.7 7.0 5.9 6.0: Food 0.1 0.1 0.3 0.4 0.7 0.8 0.7 1.0 0.7Non-Food Agriculture 0.0 0.0 0.0 0.0 0.0 0.0 0.0 0.0 0.0Metals and M4inerals 0.0 0.1 0.1 0.1 0.2 0.2 0.1 0.1 0.0! Total Non Fuel Primaries 0.1 0.2 0.4 0.6 0.9 1.0 0.9 1.1 0.8Fuels 0.0 0.0 0.0 0.0 0.0 0.1 0.1 0.1 0.1Total Prifmries 0.1 0.2 0.4 0.6 0.9 1.1 1.0 1.2 0.9Machinery & Transport Equipment 1.3 1.3 1.9 1.8 2.9 4.1 3.0 2.3 1.9Other manufactures 1.3 1.0 0.9 Z.8 2.9 3.5 3.0 2.5 3.2Total Manufactures 2.6 2.3 2.8 4.6 5.8 7.6 6.0 4.8 5.1EXPORTS TO CENT PLANNED ECON 67.8 62.5 69.4 52.1 54.8 53.8 50.9 50.4 55.0Food 11.5 10.9 14.1 12.0 15.1 15.3 13.0 11.3 11.3Non-Food Agriculture 0.2 0.2 0.2 0.3 0.2 0.2 0.3 0.2 0.2Metals and Minerals 2.0 2.6 2.6 2.1 1.6 1.1 1.2 1.3 1.1Total Non Fuel Primaries 13.7 13.7 17.0 14.4 17.0 16.7 14.4 12.8 12.5Fuels 0.9 0.5 0.4 0.5 0.9 0.5 0.4 0.4 0.5Total Primcries 14.6 14.2 17.3 14.9 17.9 17.2 14.8 * 13.2 13.0Machinery & Transport Equipment 28.8 27.8 30.8 23.5 22.1 21.7 21.9 22.7 25.9Other Manufactures 24.4 20.6 21.2 13.7 14.8 14.9 14.2 14.5 16.1Total Manufactures 53.2 48.3 52.0 37.2 36.9 36.5 36.1 37.2 42.1EXPORTS TO OTHER COUNTRIES, NES 0.6 1.1 3.7 4.8 4.2 6.6 9.0 7.3 4.2Food 0.0 0.1 0.3 0.6 0.8 0.4 0.6 0.7 0.5Non-Food Agriculture 0.0 0.0 0.1 0.5 0.4 0.3 0.2 0.2 0.5Metals and Minerals 0.0 0.0 0.3 0.1 0.0 0.0 0.1 0.1 0.1Totol Mon Fuel Primries 0.0 0.1 0.6 1.3 1.2 0.7 1.0 0.9 1.1Fuels 0.0 0.0 1.0 2.3 1.6 4.4 6.1 4.6 1.3Total Primaries 0.1 0.2 1.6 3.6 2.8 5.1 7.1 5.5 2.4Machinery & Tranport Equipment 0.2 0.4 0.7 0.4 0.4 0.7 0.6 0.4 0.9Other Manufactures 0.4 0.6 1.5 0.8 1.0 0.8 1.3 1.3 0.9Total Manufactures 0.6 1.0 2.1 1.2 1.4 1.4 1.9 1.8 1.8..................................................................................................................Source: World lIank trade System (TARS).

- 72 -
Table 3.4: Hunwry: Itort Cowosition(Percentg
................. I................ .......................................................................... .. .........1965 1970 1975 1980 1981 1982 1963 1964 1985
..................................... .......................... ...... ......... ........... ....................... ........
T 0 T A L I N P 0 R T s 100.0 100.0 100.0 100.0 100.0 100.0 100.0 100.0 100.0Food 11.9 6.7 6.4 5.0 4.6 3.4 3.5 3.5 3.3Ion-Food Agriculture 13.2 6.5 5.7 4.3 3.0 2.S 2.6 2.7 2.5Metals and Minerals 8.2 5.1 5.3 3.5 2.8 2.5 2.4 2.4 2.2
Total Mon Fuel Primaries 33.4 18.3 17.4 12.8 10.4 8.3 8.5 8.5 8.0Fuels 11.5 5.5 10.2 9.9 8.5 10.5 11 2 10.8 10.8
Total Primaries 44.8 23.8 27.6 22.7 18.9 18.8 19.7 19.3 18.8Machinery & Trasport Equipmmnt 27.1 19.1 24.0 17.6 14.4 14.6 13.4 12.5 13.4Other Manufactures 28.0 19.6 24.0 19.9 17.9 17.0 16.0 16.2 16.6
Total Nanufactures 55.2 38.6 48.0 37.5 32.3 31.5 29.3 28.8 30.0
IMTS FROM DEVELOPED COUNTRIES 25.2 25.9 26.9 30.4 34.0 30.7 28.2 29.0 32.6Food 4.4 2.7 1.9 1.2 1.1 0.7 1.0 0.7 0.9Non-Food AgricuLture 2.8 1.4 1.2 1.8 1.0 0.8 0.8 0.9 0.8Metats and Minerals 1.8 1.2 0.6 0.8 0.6 0.4 0.4 0.4 0.5
Total Non Fuel Prinmries 9.0 5.4 3.7 3-8 2.? 1.9 2.2 2.0 2.2Fuels 0.1 0.3 0.2 0.7 0.6 0.2 0.1 0.2 1.2
Total Primaries 9.1 5.7 3.8 4.4 3.3 2.2 2.3 2.3 3.4Machinery & Transport Equipment 4.8 3.8 5.d 6.6 6.0 5.8 4.8 4.8 5.4Other Manufactures 11.3 8.2 10.5 11.9 10.4 9.5 8.8 8.8 9.2
Total Manufactures 16.1 12.0 16.4 18.5 16.3 15.3 13.6 13.6 14.6
IMPORTS FROM DEVELOPING COUNTRIES 9.6 9.3 8.7 11.1 12.8 13.0 14.4 14.4 12.2Food 3.8 2.1 2.1 2.9 2.3 1.? 1.9 2.0 1.6Non-Food Agriculture 3.3 1.5 0.9 1.0 0.7 0.6 0.7 0.7 0.7Metals and Minerals 0.6 0.4 0.6 0.5 0.3 0.2 0.2 0.2 0.2
Total Non Fuel Primaries 7.7 4.0 3.6 4.4 3.2 2.4 2.8 2.9 2.4Fuels 0.1 0.1 1.5 1.5 0.8 1.5 1.7 1.5 0.7
Total Primaries 7.8 4.1 5.0 5.9 4.0 4.0 4.4 4.4 3.1Machinery & Transport Equipment 0.6 0.2 0.2 0.3 0.3 0.3 0.4 0.4 0.5Other Manufactures 1.3 1.2 1.3 1.7 1.9 1.6 1.7 1.8 1.5
Total Manufactures 1.9 1.4 1.5 2.0 2.2 2.0 2.0 2.3 2.0
IMPORTS FROM OIL EXPORTERS 1.7 2.3 3.0 3.6 3.8 5.1 6.2 5.3 4.0Food 0.2 0.3 0.4 0.7 0.4 0.2 0.2 0.2 0.3Non-Food Agriculture 1.3 0.6 0.3 0.2 0.1 0.1 0.1 0.1 0.1Metals and Minerals 0.1 0.0 0.1 0.1 0.1 0.0 0.0 0.1 0.0
Total Non Fuel Primaries 1.6 0.9 0.8 1.0 0.5 0.4 0.4 0.4 0.5Fuels 0.1 0.1 1.5 1.3 0.7 1.4 1.3 1.2 0.4
Total Primaries 1.6 1.0 2.3 2.2 1.2 1.7 1.7 1.6 0.9Machinery & Transport Equipment 0.0 0.0 0.0 O.t 0.0 0.0 0.0 0.0 0.0Other Manufactures 0.0 0.2 0.1 0.1 0.0 0.0 0.0 0.1 0.1
Total Manufactures 0.0 0.2 0.1 0.1 0.0 0.1 0.1 0.1 0.!
IMPORTS FROM CENT PLAWNED ECON 64.9 64.6 64.0 56.6 50.3 52.5 51.4 50.1 50.7Food 3.6 1.8 2.4 0.9 1.0 0.7 0.4 0.5 0.6Non-Food Agriculture 7.2 3.6 3.6 1.5 1.3 1.1 1.1 1.0 1.1Metals and Minerals 5.7 3.5 4.1 1.9 1.7 1.6 1.5 1.5 1.3
Total Non Fuel Primaries 16.5 8.8 10.1 4.3 3.9 3.4 3.0 3.0 3.0Fuels 11.3 5.1 8.6 7.7 7.2 7.7 7.3 7.8 8.5
Total Primaries 27.8 14.0 18.7 12.0 11.1 11.1 10.4 10.8 11.5Machinery & Transport Equipment 21.7 15.1 17.9 10.7 8.1 8.5 8.2 7.3 7.5Other Mauufactures 15.4 10.1 12.1 6.3 5.r 5.8 5S5 5.5 5.9
Total Manufactures 37.1 25.2 30.0 17.0 13.8 14.2 13.6 12.8 13.4
IMPORTS FROM OTHER CWNTRIES, WES 0.2 0.3 0.4 1.9 2.8 3.8 6.0 6.5 4.5Food 0.1 0.0 0.0 0.0 0.3 0.3 0.2 0.3 0.2Non-Food Agriculture 0.0 0.0 0.0 0.0 0.0 0.0 0.0 0.0 0.0Mt*als nd Irnerals 0.0 0.0 0.0 0.3 0.2 0.3 0.3 0.2 0.2
Total Non Fuel Primries 0.1 0.0 0.0 0.3 0.5 0.6 0.5 0.5 0.4Fuels 0.0 n.0 0.0 0.0 0.0 1.1 2.1 1.3 0.3
Total Primaries 0.1 0.0 0.0 0.3 0.5 1.7 2.6 1.8 0.7Machinery & Tranport EquIpment 0.0 0.0 0.0 0.0 0.0 0.0 0.0 0.0 0.0Other Manufactures 0.1 0.0 0.1 0.1 0.0 0.0 0.0 0.0 0.0
Total Manufactures 0.1 0.0 0.1 0.1 0.0 0.0 0.1 0.0 0.0c . _ .S T. ................ .... ..........................................
Source: WlorLd Bank trade System (TARS).
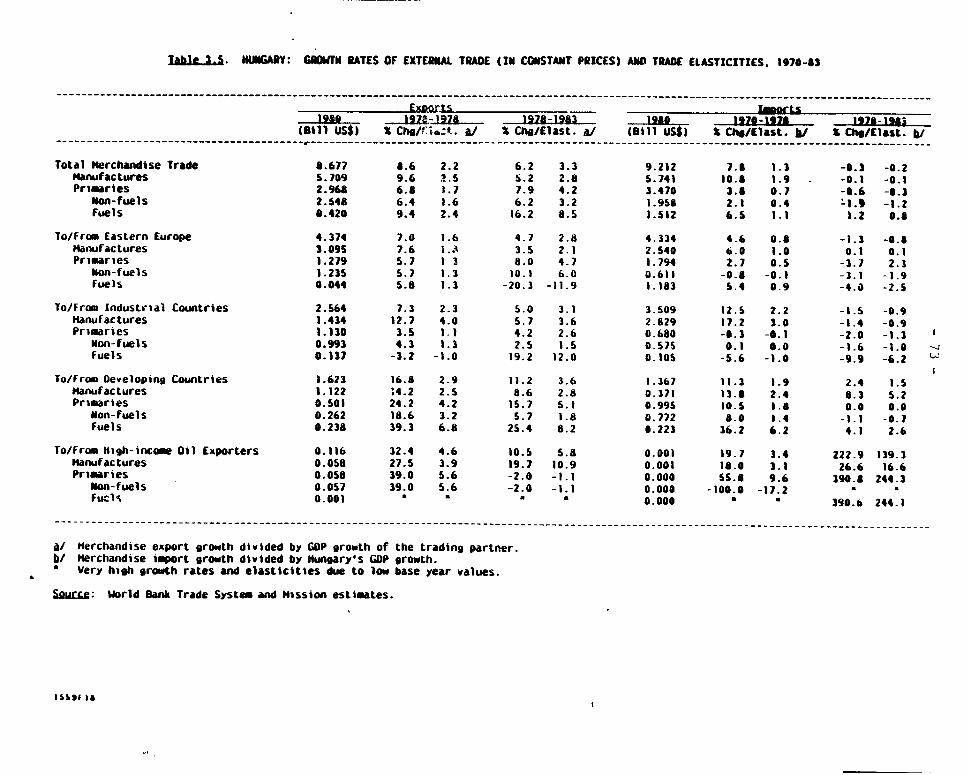
Tahle t.5. HUSAY: GRONH RATES OF EXTEQRAL TRADE (In CONSTANT PRICES) AD TRADE ELASTICITIES. 1970-63
ExDQrts rm .r_S19LQ jgp-9j 197- 1970-1978 1970-.1981
(Bill US$) S ChgIs?i&:k. a/ S Che/Elast. (a. , (Bill US$) . Ch/Elast. b./ x Cho/Elast. b/
Total Herchandise Trade 8.677 8.6 2.2 6.2 3.3 9.212 7.0 1.1 -0.3 -0.2Manufactures 5.709 9.6 2.5 5.2 2.8 5.741 10.5 1.9 -0.1 -0.1Primaries 2.968 6.8 1.7 7.9 4.2 3.470 3.5 0.7 -0.6 -6.3
Non-fuels 2.648 6.4 1.6 6.2 3.2 1.958 2.1 0.4 .1.9 -1.2Fuels 0.420 9.4 2.4 16.2 8.5 1.512 6.5 1.1 1.2 0.8
To/From Eastern Europe 4.374 7.0 1.6 4.7 2.8 4.334 4.6 0.8 -1.3 -0.8manufactures 3.09S 7.6 i.- 3.5 2.1 2.540 6.0 1.0 0.1 0.1Primaries 1.279 5.7 1 3 8.0 4.7 1.794 2.7 0.5 -3.7 2.3
Non-fuels 1.235 5.7 1.3 10.1 6.0 0.61 -0.8 -0.1 -3.1 -1.9fuels 0.044 5.8 1.3 -20.3 -11.9 1.183 5.4 0.9 -4.0 -2.5
To/From Industrial Countries 2.564 7.3 2.3 5.0 3.1 3.509 12.5 2.2 -3.5 -0.9manufactures 1.434 12.7 4.0 5.7 3.6 2.829 17.2 3.0 -1.4 -0.9Primaries 1.130 3.5 1.1 4.2 2.6 0.680 -0.3 -0.1 -2.0 -1.3 I
Non-fuels 0.993 4.3 1.3 2.5 1.5 0.575 0.1 0.0 -1.6 -1.0 -j
Fuels 0.137 -3.2 -1.0 19.2 12.0 0.I05 -5.6 -1.0 -9.9 -6.2 .
To/From Developing Countries 1.623 16.8 2.9 11.2 3.6 1.367 11.3 1.9 2.4 1.5Manufactures 1.122 :4.2 2.5 8.6 2.8 0.371 13.5 2.4 8.3 5.2Primaries 0.501 24.2 4.2 15.7 5.1 0.995 30.5 1.8 0.0 0.0
Non-fuels 0.262 18.6 3.2 5.7 1.8 0.772 8.0 1.4 -1.1 -0.7fuels 0.238 39.3 6.8 25.4 8.2 0.223 36.2 6.2 4.1 2.6
To/From High-income Oil Exporters 0.116 32.4 4.6 10.5 5.8 0.001 19.7 3.4 222.9 139.3Manufactures 0.058 27.5 3.9 19.7 10.9 0.001 18.0 3.1 26.6 16.6Primaries 0.058 39.0 5.6 -2.0 -1.1 0.000 55.8 9.6 390.8 244.3
Mon-fuels 0.057 39.0 5.6 -2.0 -1.1 0.000 -100.0 -17.2 S
Fucls 0.001 * a 0.000 * 390.o 244.1
A/ Merchandise export growth divided by GOP growth of the trading partner.b/ Merchandise imort growth divided by Hugary s GDP growth.
Very high growth rates and elasticities due to low base year values.
SQurc : World Banik Trade System and Hission estimates.
I55 IIt
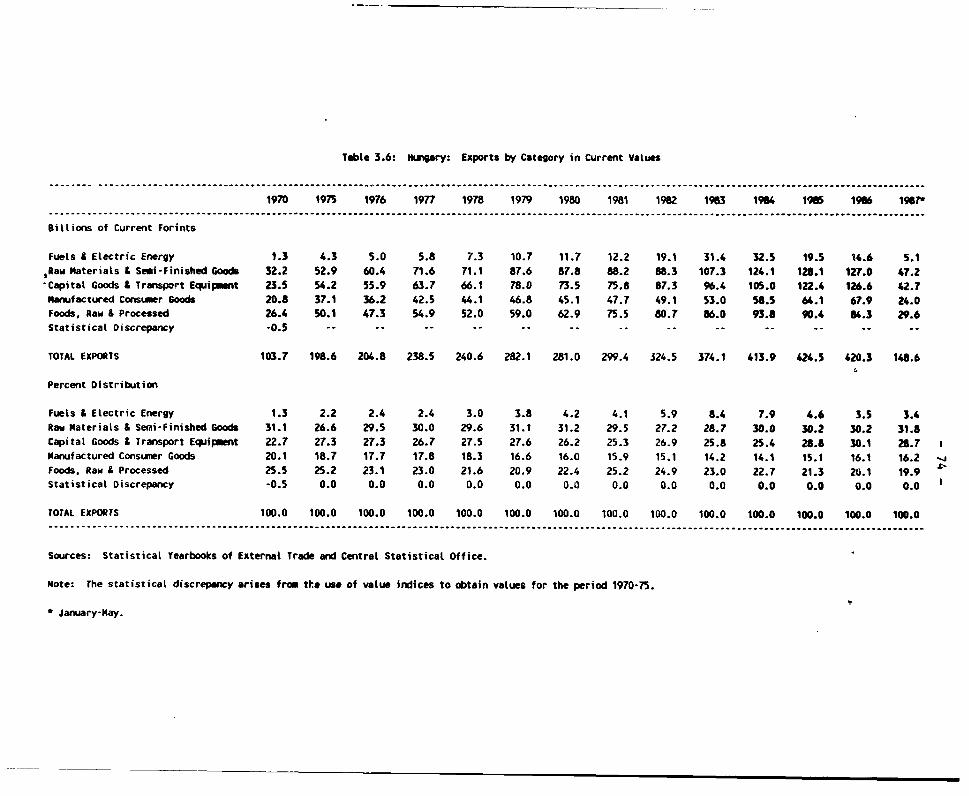
Table 3.6: Nurgary: Exports by Category in Current Values
1970 1975 1976 1977 1978 1979 1980 1981 1982 1963 1964 190 1966 19818
Billions of Current Forints
FueLs * Electric Energy 1.3 4.3 5.0 5.8 7.3 10.7 11.7 12.2 19.1 31.4 32.5 19.5 14.6 5.1Raw Materials & Semi-Finished Goods 32.2 52.9 60.4 71.6 71.1 87.6 87.8 88.2 88.3 107.3 124.1 128.1 127.0 47.2Capital Goods & Transport Equip nt 23.5 54.2 55.9 63.7 66.1 78.0 73.5 75.8 87.3 96.4 105.0 122.4 126.6 42.7Manufactured Consueer Goods 20.8 37.1 36.2 42.5 44.1 46.8 45.1 47.7 49.1 53.0 58.5 64.1 67.9 24.0Foods, Raw & Processed 26.4 50.1 47.3 54.9 52.0 59.0 62.9 75.5 80.7 86.0 93.8 90.4 84.3 29.6Statistical Discrepancy -0.5 - -
TOTAL EXPORTS 103.7 198.6 204.8 238.5 240.6 282.1 281.0 299.4 324.5 374.1 413.9 424.5 420.3 148.6
Percent Distribution
Fuels & Electric Energy 1.3 2.2 2.4 2.4 3.0 3.8 4.2 4.1 5.9 8.4 7.9 4.6 3.5 3.4Raw Materials & Semi-Finished Goods 31.1 26.6 29.5 30.0 29.6 31.1 31.2 29.5 27.2 28.7 30.0 30.2 30.2 31.8Capital Goods & Transport Equipment 22.7 27.3 27.3 26.7 27.5 27.6 26.2 25.3 26.9 25.8 25.4 28.8 30.1 28.7Manufactured Consumer Goods 20.1 18.7 17.7 17.8 18.3 16.6 16.0 15.9 15.1 14.2 14.1 15.1 16.1 16.2 _Foods, Raw & Processed 25.5 25.2 23.1 23.0 21.6 20.9 22.4 25.2 24.9 23.0 22.7 21.3 20.1 19.9Statistical Discrepancy -0.5 0.0 0.0 0.0 0.0 0.0 0.0 0.0 0.0 0.0 0.0 0.0 0.0 0.0
TOTAL EXPORTS 100.0 100.0 100.0 100.0 100.0 100.0 100.0 100.0 100.0 100.0 100.0 100.0 100.0 100.0
Sources: Statistical Yearbooks of External Trade and Central Statistical Office.
Note: The statistical discrepancy arises from the use of value indices to obtain values for the period 1970-75.
January-May.
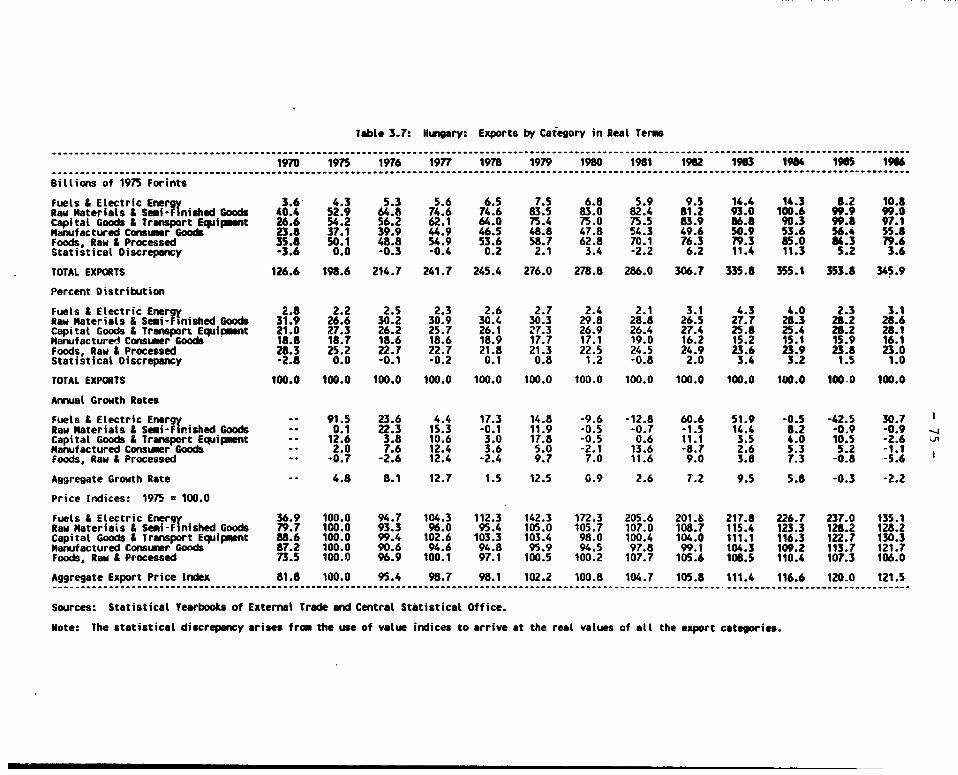
Table 3.7: Huwgary: Exports by Category in Real Terms
1970 1975 1976 1977 1978 1979 1980 1981 1962 1963 1984 1965 1986
Billions of 1975 Forints
Fuels & Electric Ener 3.6 4.3 5.3 5.6 6.5 7.5 6.8 5.9 9.5 14.4 14.3 8.2 10.8Raw Materials & Semi-Finished Goods 40.4 52.9 64.8 74.6 74.6 83.5 83.0 82.4 81.2 93.0 100.6 99.9 99.0Capital Goods & Transport Equipmant 26.6 54.2 56.2 62.1 64.0 75.4 75.0 75.5 83.9 86.8 90.3 99.8 97.1Manufactured Consumer Goods 23.8 37.1 39.9 44.9 46.5 48.8 47.8 54.3 49.6 50.9 53.6 56.4 5S.8Foods, Raw & Processed 35.8 50.1 48.8 54.9 53.6 58.7 62.8 70.1 76.3 79.3 85.0 84.3 79.6Statistical Discrepwncy -3.6 0.0 -0.3 -0.4 0.2 2.1 3.4 -2.2 6.2 11.4 11.3 5.2 3.6
TOTAL EXPORTS 126.6 196.6 214.7 241.7 245.4 276.0 278.8 286.0 306.7 335.8 355.1 353.8 34S.9
Percent Distribution
Fuels & Electric Energy 2.8 2.2 2.5 2.3 2.6 2.7 2.4 2.1 3.1 4.3 4.0 2.3 3.1Raw Materials & Semi-Finished Goods 31.9 26.6 30.2 30.9 30.4 30.3 29.8 28.8 26.5 27.7 28.3 28.2 28.6Capital Goods & Transport EquiPent 21.0 27.3 26.2 25.7 26.1 27.3 26.9 26.4 27.4 25.8 25.4 28.2 28.1Manufactured Consuver Goods 18.8 18.7 18.6 18.6 18.9 17.7 17.1 19.0 16.2 15.2 15.1 15.9 16.1Foods, Raw & Processed 28.3 25.2 22.7 22.7 21.8 21.3 22.5 24.5 24.9 23.6 23.9 23.8 23.0Statistical Discrepancy -2.8 0.0 -0.1 -0.2 0.1 0.8 1.2 -0.8 2.0 3.4 3.2 1.5 1.0
TOTAL EXPORTS 100.0 100.0 100.0 100.0 100.0 100.0 100.0 100.0 100.0 100.0 100.0 100 0 100.0
Annual Growth Rates
Fuels & Electric Ener -- 91.5 23.6 4.4 17.3 14.8 -9.6 -12.8 60.6 51.9 -0.5 -42.5 30.7Raw Materials & Semi-Flnished Goods - 0.1 22.3 15.3 -0.1 11.9 -0.5 -0.7 -1.5 14.4 8.2 -0.9 -0.9 .4
Capital Goods & Transport Equipment -- 12.6 3.8 10.6 3.0 17.8 -0.5 0.6 11.1 3.5 4.0 10.5 -2.6 unManufactured Consamer Goods -- 2.0 7.6 12.4 3.6 5.0 -2.1 13.6 -8.7 2.6 5.3 5.2 -1 1Foods, Raw & Processed -- -0.7 -2.6 12.4 -2.4 9.7 7.0 11.6 9.0 3.8 7.3 -0.8 -5:6
Aggregate Growth Rate -- 4.8 8.1 12.7 1.5 12.5 0.9 2.6 7.2 9.5 5.8 -0.3 -2.2
Price Indices: 1975 = 100.0
Fuels & Electric Energy 36.9 100.0 94.7 104.3 112.3 142.3 172.3 205.6 201.b 217.8 226.7 237.0 135.1Raw Materials & Semi-Finished Goods 79.7 100.0 93.3 96.0 95.4 105.0 105.7 107.0 108.7 115.4 123.3 128.2 128.2Capital Goods & Transport Equipment 88.6 100.0 99.4 102.6 103.3 103.4 98.0 100.4 104.0 111.1 116.3 122.7 130.3Manufactured Consuner Goods 87.2 100.0 90.6 94.6 94.8 95.9 94.5 97.8 99.1 104.3 109.2 113.7 121.7Foods, Raw & Processed 73.5 100.0 96.9 100.1 97.1 100.5 100.2 107.7 105.6 106.5 110.4 107.3 106.0
Aggregate Export Price Index 81.8 100.0 95.4 98.7 98.1 102.2 100.8 104.7 105.8 111.4 116.6 120-0 121.5
Sources: Statistical Yearbooks of External Trade and Central Statistical Office.
Note: The statistical discrepwncy arises from the use of value indices to arrive at the real values of all the export categories.
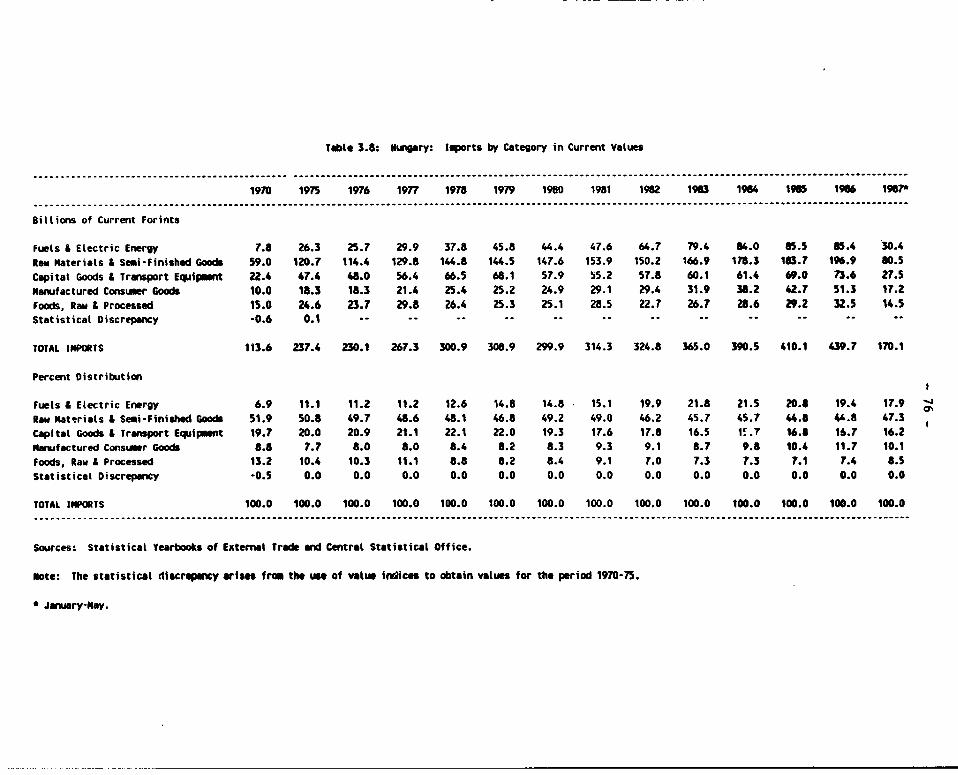
Table 3.8: NuKgary: Imports by Category in Current Values
…-- - - - - - - -- - - - - - - - - - - - - - - - - - - - - - - - - - -
1970 1975 1976 1977 1978 1979 1960 1981 1982 1963 1964 1965 1966 1987'….. . . . . . .. . . . . . . . .. . . . . . . .. . . . . . . . .. . . . . . . . .. . . . . . . .. . . . . . . . .. . . . . . . .. . . . ..... . . .. .
Bitlions of Current Forints
Fuels & Electric Energy 7.8 26.3 25.7 29.9 37.8 45.8 44.4 47.6 64.7 79.4 84.0 85.5 85.4 30.4
Raw Materials & Semi-Finished Goods 59.0 120.7 114.4 129.8 144.8 144.5 147.6 153.9 150.2 166.9 178.3 183.7 196.9 80.5
Capitat Goods & Transport Equip mnt 22.4 47.4 48.0 56.4 66.5 68.1 57.9 55.2 57.8 60.1 61.4 69.0 73.6 27.5
Manufactured Consuaer Goods 10.0 18.3 18.3 21.4 25.4 25.2 24.9 29.1 29.4 31.9 38.2 42.7 51.3 17.2
Foods, Raw & Processed 15.0 24.6 23.7 29.8 26.4 25.3 25.1 28.5 22.7 26.7 28.6 29.2 32.5 14.5
Statistical Discrepancy -0.6 0.1 -- -- - -- -- -- --
TOTAL IMPORTS 113.6 237.4 230.1 267.3 300.9 308.9 299.9 314.3 324.8 365.0 390.5 410.1 439.7 170.1
Percent DistributionI
Fuels & Electric Energy 6.9 11.1 11.2 11.2 12.6 14.8 14.8 15.1 19.9 21.8 21.5 20.8 19.4 17.9 ch
Raw Materials & Semi-Finished Goods 51.9 50.8 49.7 48.6 48.1 46.8 49.2 49.0 46.2 45.7 4S.7 44.8 4".8 47.3
Capital Goods & Transport Equipmnt 19.7 20.0 20.9 21.1 22.1 22.0 19.3 17.6 17.8 16.5 1!.? 16.8 16.7 16.2Manufactured Consueir Goods 8.8 7.7 8.0 8.0 8.4 8.2 8.3 9.3 9.1 8.7 9.8 10.4 11.7 10.1
Foods, Raw & Processed 13.2 10.4 10.3 11.1 8.8 8.2 8.4 9.1 7.0 7.3 7.3 7.1 7.4 8.5
Statistical Discrepancy -0.5 0.0 0.0 0.0 0.0 0.0 0.0 0.0 0.0 0.0 0.0 0.0 0.0 0.0
TOTAL IMPORTS 100.0 100.0 100.0 100.0 100.0 100.0 100.0 100.0 100.0 100.0 100.0 100.0 100.0 100.0
Sources: Statistical Yearbooks of ExternaI Trade wnd Central Statistical Office.
note: The statistical discropenry arises from the use of value indices to obtain vatues for the period 1970-75.
January-May.

Table 3.9: Hungary: loports by Category in Real Terms
1970 1975 1976 1977 1978 1979 1980 1981 1982 1983 1984 1965 1966
Biltions of 1975 Forints
Fuels & Electric Energy 16.1 26.3 27.0 27.2 31.7 33.3 32.3 28.6 33.0 34.9 34.0 32.5 32.7Raw Materials & Semi-Finished Goods 91.6 120.7 127.1 138.5 155.0 142.5 146.9 149.7 143.5 149.4 149.6 149.5 152.2Capital Goods & Transport Equipment 25.7 47.4 46.7 52.5 62.2 63.1 55.7 52.3 53.8 52.8 51.2 54.2 54.7Manufactured Consumer Goods 11.5 18.3 18.7 21.4 25.6 25.2 25.7 29.3 29.1 29.9 33.8 36.6 40.8Foods, Raw & Processed 26.7 24.6 27.6 28.0 26.1 25.2 25.5 28.0 23.9 25.9 25.3 26.3 27.2Statistical Discrepancy -4.6 0.1 -0.5 -0.1 0.6 2.1 1.8 0.4 4.9 6.7 6.0 4.0 2.0TOTAL IMPORTS 167.0 237.4 246.6 267.5 301.2 291.4 287.9 288.3 288.2 299.6 299.9 303.1 309.6
Percent Distribution
Fuels & Electric Energy 9.6 11.1 10.9 10.2 10.5 11.4 11.2 9.9 11.5 11.6 11.3 10.7 10.6Raw Materials & Semi-Finished Goods 54.9 50.8 51.5 51.8 51.5 48.9 51.0 51.9 49.8 49.9 49.9 49.3 49.2Capital Goods & Transport Equipment 15.4 20.0 18.9 19.6 20.7 21.7 19.3 18.1 18.7 17.6 17.1 17.9 17.7Manufactured Consumer Goods 6.9 7.7 7.6 8.0 8.5 8.6 8.9 10.2 10.1 10.0 11.3 12.1 13.2Foods, Raw & Processed 16.0 10.4 11.2 10.5 8.7 8.6 8.9 9.7 8.3 8.6 8.4 8.7 8.8Statistical Discrepancy -2.8 0.0 -0.2 0.0 0.2 0.7 0.6 0.1 1.7 2.2 2.0 1.3 0.6 1TOTAL IMPORTS 100.0 100.0 100.0 100.0 100.0 100.0 100.0 100.0 100.0 100.0 100.0 100.0 100.0 _jAnmuaL Growth Rates
Fuels & Electric Energy 18.8 2.4 0.9 16.7 4.9 -3.1 -11.4 15.3 5.9 -2.8 -4.4 0.7Raw Materials & Semi-Finished Goods -- 0.4 5.4 8.9 12.0 -8.1 3.1 1.9 -4.1 4.1 0.2 -0.1 1.8Capital Goods & Transport Equipment 20.1 -1.4 12.4 18.4 1.4 -11.6 -6.2 2.8 -2.0 -2.9 6.4 0.8Manufactured Consumer Goods 13.4 2.5 14.7 19.5 -1.5 1.9 14.1 -0.8 2.6 13.0 7.4 11.4Foods, Raw & Processed -13.8 12.0 1.6 -6.9 -3.3 0.9 10.2 -14.7 8.4 -2.3 4.1 3.3Aggregate Growth Rate -- 5.6 3.8 8.6 12.6 -3.3 -1.2 0.2 0.0 4.0 0.1 1.1 2.1Price Indices: 1975 = 100.0
Fuels & Electric Energy 48.4 100.0 95.2 110.0 119.1 137.4 137.7 166.2 196.0 227.2 247.1 263.0 260.9Raw Materials & Semi-Finished Goods 64.4 100.0 90.0 93.7 93.4 101.4 100.5 102.8 104.7 111.7 119.1 122.9 129.3Capital Goods & Transport Equipment 86.9 100.0 102.6 107.4 106.9 107.9 103.9 105.6 107.4 113.9 119.9 126.1 134.7Manufactured Consumer Goods 87.1 100.0 97.8 100.0 99.4 100.2 96.8 99.3 101.1 106.9 113.0 118.3 125.9Foods, Raw & Processed 56.3 100.0 86.0 106.2 101.2 100.5 98.6 101.8 95.1 103.1 113.2 111.8 119.5Aggregate Import Price Index 67.8 100.0 93.3 99.9 99.9 106.0 104.2 109.0 112.7 121.8 130.2 135.3 142.0
Sources: Statistical Yearbooks of External Trade and Central Statistical Office.
Note: The statistical discrepancy arises from the use of value indices to arrive at the real values of all the iqxort categories.

Table 3.10: #Wary: lrads by Ntaor Irading Partners(Percent Djisr ibution)
... .. ... I............. ............ ... .. . ........ ...... ... ... ..... .... .... ..... .. . ............ ....... ......... .. ............... .................... .. .. .... . . .. . ... ...... .. ...19ro 1975 1979 196o 1961 1962 1963 1964 1965 19Exports Irp Erts Exports lopta Exprts orts Exports Iports Exports lports Exports lWorts Expo-rts Icports Exports trts Experts I_ts EortR lworts. .. . ... ... . ...... ....... ........ ............ . ...... ...... ..... ...... .... .... .. ... ... .. .. .. ... . ... ... . . . . . . . . . . . . . . .. . . . . . ... . . . . . . . . . . . . . . . . .
Austr.a 11.3 13.7 11.2 13.9 11.0 14.0 14.7 14.2 16.3 15.2 15.? 14.3 17.2 14.2 15.2 14.6 ¶1.s 16.7 14.6 16.4frarnc. 4.2 1.3 5.3 7.1 5.2 5.9 5.6 5.8 5.9 6.5 6.2 6.4 6.1 5.6 4.* 4.9 4.4 9.6 4.9 4.9Germany. fed. Rep. 24.8 18.0 25.4 26.7 30.6 32.6 33.2 30.8 33.1 31.0 30.1 32.2 29.* 15 21.4 30.6 25.4 29.6 ags 32.?Italy 19.6 13.6 16.S t0.6 16.1 7.9 15.3 8.2 12.3 7 8 14.1 7.8 13.1 7.1 9.4 6.9 9.6 7.3 10.1 7.2Japan 0.6 1.7 1.0 2.9 o.a 2.4 o.s 3.8 0.9 3.8 1.0 537 1.1 3.6 1.2 3.1 1.1 4.4 I.r 3.9SwItterr.nd 12.3 8.0 5.3 5.6 3.8 6.3 5.4 6.6 5.1 6.3 5.5 6.3 5.8 6.1 6.s 5.? 6.5 5.1 5.9 s.Un tead Ki,nqdom 8.8 13.0 4.6 6.6 4.9 5.2 3.9 5.4 3.7 5.9 3.7 5.7 4.4 6.6 4.5 S.2 4.1 s.o 4.2 4.7United Stlte. 1.5 3.9 2.7 6.9 4.3 5.0 4.4 7.2 5.8 6.6 6.5 6.2 8.0 8.1 7.Z 7.0 7.5 1.6 7.4 5.4Others 16.7 20.8 28.0 19.5 23.3 20.7 16.8 18.0 16.3 16.9 17.2 17.4 14.9 16.4 29.s 22.0 23.3 19.3 22.5 19.4fotal Develo&wd 100.0 10o.0 100.0 100.0 100.0 100.0 100.0 100.0 100.0 100.0 100.0 100.0 100.0 100.0 100.0 100.0 100.0 160.0 o.10. 100.0Bral,i 4.0 6.7 2.2 12.0 1.7 20.7 0.7 16.2 2.0 20.2 0.7 14.9 3.4 19.9 3.3 19.5 2.4 1Is. 4.2 13.0fqvpt 11.0 7.9 3.9 3.0 2.0 2.9 1.9 1.5 2.9 1.5 2.3 1.4 2.7 1.6 4.2 1.0 6.4 1.6 7.4 2.0trnda 10.3 10.5 5.4 8.3 1.7 2.6 2.3 2.1 3.5 2.5 2.9 1.9 5.0 1.6 2.0 2.1 2.1 3.4 3.4 4.91, an 5.0 6.7 7.9 4.9 3.0 5.9 10.2 9.2 9.1 10.1 14.8 20.9 12.1 78.1 6.9 13.6 8.9 6.9 5.0 7.6Ilaq 2.6 0.3 14.3 18.4 12.1 12.4 9.1 7.3 15.8 0.2 18.1 0.3 12.5 1.7 9.3 0.6 8 5 5 0.1q.osl avra 25. 5 20.6 24.4 4.s 23. 18.7 19.5 11.8 21.0 21.6 19.4 23.4 7n.9 26.4 23.3 24.6 25.2 33.4 27. S9.3Other, 41.6 47.3 41.9 38.9 S5.0 36.6 56.3 45.9 45.1 43.9 41.8 37.2 43.4 30.7 51.0 36.6 46.5 36.5 46.? 43.1lotal Devetp,nq o.o.0 100.0 100.0 100.0 ¶00.0 100.0 100.0 100.0 100.0 100.O 100.0 100.0 100.0 100.0 100.0 100.0 100.0 100.0 100.0 100.0slugar's 1.8 3.1 2.1 2.3 3.0 2.5 2.8 2.7 2.8 2.8 1.1 2.8 3.6 3.2 2.9 2.9 2.6 2.9 2.8 2.6Ch,-.a. Peoples Rep. 0.6 0.8 1.0 1.2 1.6 1.4 1.2 1.4 0.7 1.2 0.7 0.1 1.1 0.7 1.s 1.2 2.4 1.7 3.3 3.4Cze.nho 1lo0j,a 12.6 12.6 12.0 11.6 13.1 10.3 11.9 10.8 11.2 10.3 10.s 10.7 9.6 10.5 10.3 10.2 10.3 9.7 10.1 9.8C;er .. ny. Oem. Rep. 14.9 16.6 154 16.0 151 14.5 13.3 14.5 12.8 14.1 11.6 13.9 11.7 13.7 11.7 12.9 11.0 1 .7 11.2 12.6Pol.did 9.3 9.2 7.5 7.6 6.5 7.6 8.4 7.7 6.3 7.1 7. 1 .9 r.9 9.0 8.4 9.0 7.0 9.2 7.4 6.9 1"atnlla 3.4 3.9 4.0 5.5 5.2 5.0 4.7 4.5 3.8 4.2 3.0 4.0 2.6 3.8 2.9 3.6 3.1 3.4 3.S 3.6is5.2 52.8 55.4 54.3 52.2 57.3 57.3 58.1 62.1 60.1 63.6 59.7 63.2 58.1 59.7 59.2 61.1 59.0 59.4 56.2 _Oih !s 2.2 1.0 2.6 1.5 1.3 1.2 0.4 0.3 0.3 0.2 0.4 0.3 0.3 0.4 2.6 1.0 2.5 1.4 2.1 0.9 colotal Sociallst 100.0 100.0 100.0 100.0 100.0 100.0 100.0 100.0 100.0 100.0 100.0 100.0 100.0 100.0 0 00.0 100.0 100.0 100.0 100.0 100.0
0e-eoped Cra.tr-es 27.6 28.4 20.9 26.8 31.1 37.3 29.5 38.1 26.6 38.3 24.1 Y. 6 25.3 32.S 34.7 34.9 30.6 36.5 31.8 31.9Deve opnqg Countrsres 9.1 6.9 Q o 8.7 15.1 11.4 19.4 14.1 19.6 14.1 23.2 16.1 24.7 16.8 14.9 15.9 14 2 0o 6 11.3 9.1Socs,.list Co.ntries 63.3 62.7 70. 1 64.5 53.8 51.3 S1.1 47.8 53.8 47.6 52.7 49.3 30.0 48. 50.4 49.2 55.0 50.9 56.9 53.0lott o00.0 100.0 100.0 100.0 100.0 100.0 100.0 100.0 100.0 100.0 10.o 100.0 100.0 100.0 100.0 100.0 100.0 100.0 100.6 100.0. .. t .. r .............. .. .. u .. - p e.......................................... ............................................................................................. .................................
Soiurces: Ull cast retrieved throzug rAlts rigw" for T984-86 provided by the rmPicn authotnities.

- 79 -
Table 3.11. HUNGARY: EXCHANGE RATE -- CONVERTIBLE CURRENCY
-------------------------------------------------------- __-------------------__
Exchange rate between HungarianForint and US Dollar(forint/dollar; end of period)
Commercial Non-commercial---------------------------------------------1968------60.00--------30.00----_
1968 60.00 30.001970 60.00 30.001972 55.26 27.631973 _ _1974 46.75 23.381975 _ _1976 41.30 20.651977 40.60 20.301978 35.58 17.791979 35.58 20.331980 32.21 23.951981 34.431982 39.611983 45.1931984 51.1991985 47.3471986 45.9271987 46.387
Source: National Bank of Hungary and IFS.
2444G(24)

- 80 -
Table 3.12: PRTCE INDICES AND SUBSIDIES(1970 = 100)
Dollar Price Index for Imports ProducerValue in Non-Rubles Consumer Industrialof the In Forint In Dollar Price Price Subsi-Forint Terms Terms Index Index dies /a
1970 100.0 100.0 100.0 100.0 100.0 100.01971 100.0 102.2 102.2 102.0 101.6 -1972 105.9 104.4 113.4 104.9 103.5 -1973 121.4 121.6 152.0 108.4 106.6 -1974 124.6 169.6 217.6 110.4 110.1 -1975 136.6 170.2 232.6 114.6 121.8 206.81976 144.3 150.9 217.9 120.3 127.4 201.21977 146.6 162.5 238.4 125.0 129.9 243.41978 159.7 160.5 256.4 130.8 134.7 253.01979 168.6 177.6 299.7 142.4 137.7 270.81980 185.0 181.2 335.5 155.4 158.8 263.61981 174.4 182.6 318.6 162.5 168.8 289.01982 163.0 182.0 296.8 173.7 176.7 293.01983 139.7 196.8 275.2 186.4 186.6 n.a.1984 118.0 213.2 264.9 201.9 194.3 n.a.1985 - 217.3 261.1 216.0 204.0 n.a.1986 - 22b&.8 294.1 227.4 208.3 n.a1987 - 246.0 314.2 - - -
Sources: Subsidies--State budget of Hungary. CPI--CSO, StatisticalYearbook, PPI--CSO, Statistical Yearbook. Exchange rate--National Batik of Hungary. Import price index--CSO, StatisticalYearbook.
/a All numbers are annual averages except subsidies which are end-yearnumbers. Includes consumers and producer subsidies, tax rebates toexporters and modernization grants.
2444G( 2S)

- 81 -
Table 3.13: Hunary: Ters of Trade By Region, Co_modity and Currency(1970 ' 100.0)
I ~~~. ........ ................ ........................... ......................................................... .... .. ..... ........ ......... ....... ...
Raw HaterialsFuets Machinery. Mnafsctured and
Electric Vehicles. Castuer Smi-finished AgricuLturalEnergy Equipwsnt Goods Products Products Total
SOCIALIST1975 93.1 103.3 101.3 84.6 66.2 85.61960 126.4 99.5 88.S 90.0 89.4 80.01981 14S.6 100.1 89.2 88.7 87.6 77.61982 123.4 102.3 89.7 88.4 79.9 73.71983 124.7 103.7 38.9 89.8 76.4 71.61984 121.1 104.2 87.4 89.7 71.6 69.91985 120.8 104.6 86.1 89.9 68.8 68.91986 106.1 104.4 85.9 88.2 62.3 67.6
NOM-SOCIALIST1975 76.4 78.8 93.7 77.9 80.0 81.31980 80.7 79.5 119.7 84.9 78.9 85.51981 75.5 81.1 122.1 83.3 82.1 86.71982 69.5 81.0 119.0 82.7 90.3 87.11983 67.6 81.3 119.4 80.9 86.3 85.21984 68.0 80.2 119.3 81.7 82.8 84.21985 66.6 80.0 119.6 82.6 84.0 84.51986 43.1 78.3 120.2 75.6 79.4 78.7
RUBLE1975 102.3 103.8 100.2 84.6 104.6 88.51980 110.8 98.9 85.8 82.8 109.0 79.81981 111.7 99.8 86.6 82.9 96.9 76.71982 108.9 102.1 87.4 84.2 92.2 74.31983 110.0 103.2 86.5 84.9 92.5 72.31984 107.5 103.3 83.9 84.7 88.4 70.31985 107.5 103.8 83.9 84.7 88.4 70.31986 103.6 103.2 83.4 84.6 86.8 70.2
NON-RUBLE1975 101.7 80.4 95.4 75.6 73.2 77.81980 113.2 77.8 108.7 84.6 75.0 80.71981 104.4 78.4 110.4 82.9 80.7 82.51982 99.6 79.0 108.3 81.8 85.9 81.61983 99.6 80.0 108.3 80.7 80.1 79.71984 101.7 79.3 108.0 81.7 73.7 77.81985 102.4 79.3 108.0 81.8 72.2 76.91986 66.4 77.8 109.7 75.5 64.2 71.5
Source: Statistical Yearbooks of External Trade.
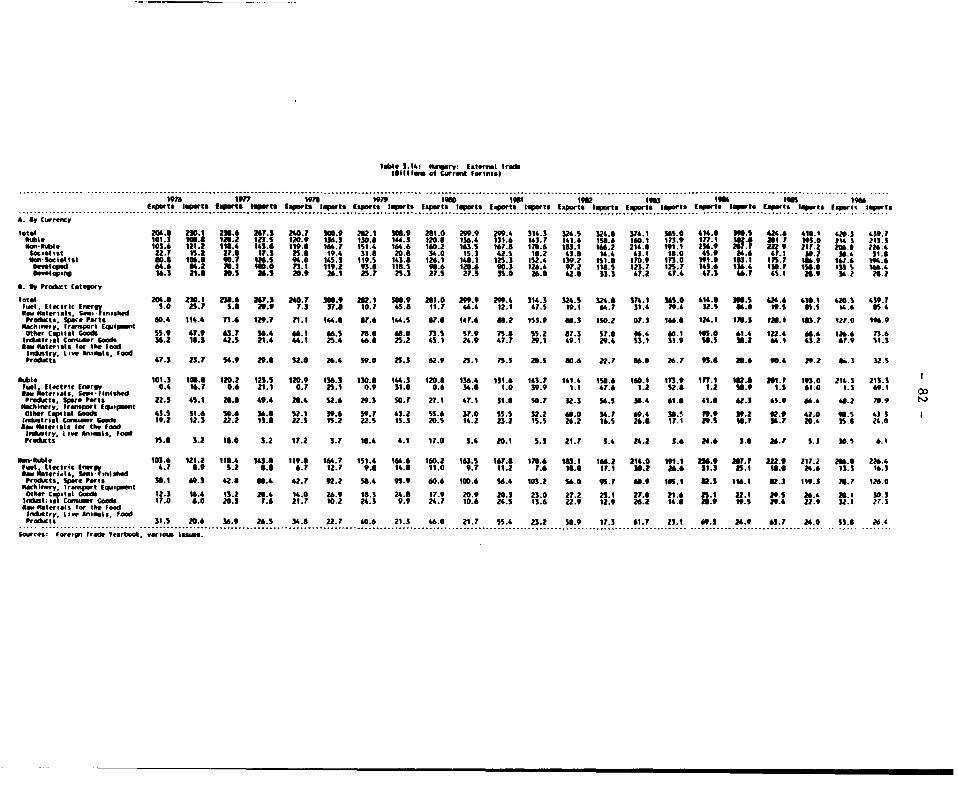
Table 3.lt tiry: Exllria frt(s|tir,t am trael *orints)
... .... .. ........ .......... .................................................. ............................ ................................................ __...................... ................ ............... , _. _....... ... ...........................
1976 It" 197t 19710 19a lnft 19112 t9111 if" ISO 19"Exports lpettJ f_wtot low tl Et tErF ts E tF t tsE l t t ts E twts lpto tl E tt t ttt E rsIS r*ts f ,t. t rts
A. Sy Ctrenty
lOtat 20t.8 230.1 2Yi.6 20.3 24O.r 3W.a m0.1 towts 281no 2pts.s 2w9.4 314.3 32.5 324.o 3A. ss.0 416.e ts u * 1 2 r
tNcn-Itbi U9. 14. MA 1 ^ t trr ts4 tS t2O8 6. S 3. 145.: 141t IS. 1". I' IM ITF ° U n2 * no. 1r .tn4 O 1.t4t8||ts 22.t r S.2 27.s ItA 2S.8 19. 3 sa6 20.6 3t6.0 15.1 *2.5 10.2 43.8 14.4 43.1 l4.0 *5.9 2- .6 4rl I. r io.Nm-scn ktist O u0. s0. g2. 9O. 14S ri 1195 s lS t 126.f 1 g28 i 195.0 1t52.4 139.r2 ISl8 17. tB:r 0 TWO: tt, ,,:s I so:; I" 1 I 6 IK:
a tqpint 14.3 21.6 WeS MA. 20.9 26.1 2s.r? #s. 2?.S 27.5 35. 0 26.0 i2.0 5s<. 3 .2 4r. 4 *.3 **. 4s5 1 M. 3462 M2i
9. eV Product Catoicy
Otota 204.8 2Je.1 23t.6 2.3 2 .7 300.9 2n2.1 30t.9 2n1.0 29t9.9 Mh 3 143 3i24.5 t2 .0 374.1 t S.O 414.8 DO.S i4- .6 4ftt. I *2e.s *n rFuet E tctric IrrerE 5.e 25. ? !1.1 9.9 7.3 37.8 10. r 4.8 I1J "44. 12.1 4?.S 19.1 iS*7 31.4 1. 4 2. s $66 n.s 4f5.S 14.6 ff stt_ ttte'lals, SeZ-_Tin,shed'roktes sweP. tir 60e.4 114.4 71.6 129.7 I1. ls.4 SFA 1".5. VA. t1t.A so.2 S.9 811.3 15e.Z 07. 3 16.41 124. It.11 12i.1 tat.t p U 02. 19.9
tt st wry trrnolt Equipmentothe,r CapitalGO* 5.9 47.9 iss.7 16.4 6 6 711.0 611.S F3.e St WA s 75.4 n .2 8?.2 3t SF. 6.4 T0.1 *s . 61.4 122.4 i t.4 1 .6 n 3.4InuMrStrl Cornse_r eoock 36.2 19.3 42.3 21.4 "A. 25.4 46.6 25.2 4S. I 24.9 47. r 29.1 491 29.4 S5.l 31.9 Slt. Yi.2 "A. *.2 0t.9 SIAOm_ ttterlns for Iker foodIrntry, tiw Aln_sts FocetIraducts 47.3 25. ? s4. 29.6 s 2.e 2i*.4 59.0 25.3 fW2.9 25. I n .s 5 .5 iTo.6 2Z. ? rU. 2t. ? n .a 21114 90.4 29.Z li 3. 32
rJtmt 101t 101rie 1nts Ot] e 202 123.16 120.97 136. 13. IXtt .3 t 120.0 136. l31. 1ii3 7 141.4 ISO. 160.1 IIP2 MAr IV M.?tnt IWO 214.5 2|9 s,
tr od't'''sp.SP pats ' n2.3 4s. 2«.4 49.4 2n.4 S2.6 29.1 SO. r 27.1 *.A 51.6 SO.F 32.3 5i.15 Stt.4 61.8 41.8 62.J 65.11 6.46 4.2 Ye. 9ftchln ry. Irsrpt Er| p nt
lnrSrtftc tE°ctl c4 -iz X19.2 123 22.2 1JS .t 223 5 t52 2.59 s ts S 20o s ̂14 2§ '2S2 IS.S 262 W2S 2 pri94. 1r . t 20 -Lsome Otrtaiels for the food
Irntry itow Aimawls. FoodPtimilacts 15SA 3.2 19.0 3.2 Ir.Z SJ 10.4 4.1 tZ.0 3.4 PO.l I 15 2I.r s.4 24.2 J.* 2f.E .8 asb. J, 5. tt 6. I.
ttrn t*,be 103.6 121.Z 118.4 143.8 119.0 16Nt.7 ISIA IiA. 160.2 1a.s 10.11 1r0.6 18U.1 ti".2 214.0 MA ISA M 22a2frr 2n. 2tr.2 M*.0 226.4Fuel. Electric fW tl 4.7 6.- S.2 6. 6.7 12.7 9.6 14.8 11.0 9.7 11.2 Y.A tf.0 1t.1 te.2 2 .6 Jl.3 as's 11.1 2 .6 11.1 16. I*_m tt* t. Idl S. vbalt <tProducts. Spero r rts Yt.l 0. 3 42.a ae.4 i2.r ? 2.2 sr.A ".9 60.6 100.6 S6. 103.2 sa o 9S.? "S.O 1ff.1 Ul.5 116.1 02.3 119. nt. ? 26.8
tt dinty, Irantport tqwpmentOthoot Ca lotl Got 12. 3 1.4 13.2 20.4 14.0 26.9 11.1 24.8 17.9 20.9 20.3 2t.0 2?.2 23.1 n7. 21.6 IS. -2 It N i. 2iX t
t ;St lT, Ianw t .0 20.3 r.6 21.7 10.2 24.3 9.9 2i .? 10.6 2s.5 13.6 22.9 12.9 2i*.2 14.8 ':9IS C !s Z2. S2V Zlowl OMI4* Iwr 1:It- dcIn&..".a tow An, ts, *tcdPfracfits 31.5 20.* 36.9 2i*.S 34.9 22.7 ig0.6 21.5 465.0 21. r 55.4 23.2 Sfi.9 17.3 61.7 23.1 6i.5 2 .9 iNt. 2 .0 Si. M. 4
............................................................................ ......................... ................ .................................................................................................... ............................ ........... ........................ ........ ...
Sourcsr: Foreign fradr Yearbook wwrxit issu.

Tmt* 1.A5: NsaiWyr3 Satereia Itra(Stitoio of 1975 Forints)
1976 197? 1913 1919 1960 196 1982 396 "a6 338911E q rts iqrts tE_ts I_Ets Erawts lrtf it6rt.q lorts Erats lprts Eprts lpr4t E(spwrts tmports E(otS Imt te 1 imp_te lt E_.tg tI_ts E.put, iorts
A. ty Curromy
*.totaleo Cq
SiAn. 2IS.0 24r.6 242.2 2.6 24S.A 303.s 23.0 20.S 274.1 206.8 22.4 266.9 300.4 264.5 324.3 29f.6 344.5 27 .s 349.9 36. 3 543.9 310.Zmoa1tEel 105.4 11S.9 121.2 118.2 122.8 128.5 133.2 133.? 131.7 132.1 137.0 128.3 141.1 132.S 152.2 136.2 163.6 I.6 11n.. 13S.2 MA It9.4
SociaisI s t 109.6 1136. 121.1 150.6 122.8 115.6 139.8 156.8 t42.4 154.2 1l.4 160.S 15. 152.0 M2.6 159.7 11.4 1S2. 1n.2 i6.1 17.6 1ro.8eui-soc~lie_t 25.9 21.2 31.1 22. 36.0 25.5 30.6 21 0 26.9 16.1 33.1 17.3 33.9 9.6 24.3 1.S 26.6 37.2 .? 2. 31.0 25.9bWIqied 83.7 115.5 9.9 12.1 2.8 26.5 6.0 "S. 1.5 13.1 112 4 124.7 1424 147. 141.6 I5 4. 14.5 1ar . 14. 3.s Dewl aping 672 95. 69 .7 I S 1' 9. 171 129.S 684.6 1I.0 07.2 117.5 60.2 12.2S 81.6 11148 114.S 1121.1 123. 119.1 2 046 127 .? 1 2. 7: 9
16.5 19.9 20.2 18.6 21.5 i9.7 25.6 18.8 26.3 20.6 32.1 19.7 36.1 27.6 33.5 36.5 31.3 32.2 29.7 19.9 *3.6 S s.28. my Proecat categoY
total 215,0 297.6 242.2 248.8 245.A 303.5 273.6 290.5 274.1 286.8 262. 216.9 306.4 284.5 324.5 M95. 344.5 297.5 349.9 382.3 543.9 310.2FetmE Electric E -rgy 5.3 26.9 5.6 27.4 6.7 33.6 7. 33.3 8.6 32.1 5.8 2.7 9.4 33.3 14.6 36.6 14.6 35.8 8.3 24.3 11.2 34.1low Asteriats. Som, fins wd
Prodryt. Spwe Parts 64.8 127.4 74.0 139.2 74.5 *6.2 0 2.8 143.2 62.90 147.4 62.2 ISO. 3 1.0 452.3 92.? 1.9.2 12S.0 .8 156.3 01.6 .1 98.8 153.0Nadm,ewry. Transpot Eqj.nOmrt
Other CITitt Goode 56.2 46:. 42.S 52.6 44.6 SI J.3 51.4 63.2 15.0 55.9 15.3 59.2 63.2 53.3 81.0 3.1 6.6 .6 "B.1 5S.4 9.7 S .1Injistr I Coi nt 0o 39.9 1 . 2 .6 46.5 25.t9 4. 25.S 47.6 26.0 48.9 29.6 30.2 29.4 O 1.3 30.2 54.1 4.3 I 7. 36.9 56.6 41.1Ism Haterits for the FoodItnjitrv, Live niiets. FoodPr.atr 48.6 27.6 51.9 26.0 s5.8 26.2 50.8 25.3 62.9 25.S 10.2 2S.21 76. 23.8 19.4 26.3 85.2 2M.7 8.4 22.6 S9.9 27.4
km*l 165.6 110.9 121.2 116.2 122.8 126.5 133.2 133.7 131.7 132.7Y 137.0 126.3 141.7 232. 152.3 136.2 163.0 135.9 176.7F 115.2 176.5 130.4fuel Electric Etowrg 6. 1 .6 0.CS. . 19.9 0.7 22.8 0.4 26.1 6.5 25.0 9.3 25.1 3.5 23.9 6.5 29.4 6.6 *?3.7 6.5 23.3ISm.Awetiriats. Semi. inishe
rrm.pe.Parts 23.8 47.6 29.4 49.S 29.8 32.71 31.2 SO.8 30.1 50.9 32.8 SI. 1 31.6 55.6 35.7 57.5 37.4 SS.7 36.8 54.7 38.3 S6.7
Otherc Cat I Goode 43.7 30.3 49.3 13.3 50.5 37.0 510.2 40.7 50.2 36.9 S6.6 31.7 5.9. 33.6 66.6 3s.7r 7n.s 35.9 18. 33.3 13.1 MA.I..Intrs Catsirm GoothI 21.9 12.2 24.9 13.3 25.5 14.9 25.6 15.1 25. 1 14.9 7.1I I5.7 29.8 16.3 29.4 16.2 33.5 16.9 MA5.3 17. 5.1 9.SZ rser -tts for the Food
Irhastry. Live Ant .ts, FoanPrnjxts 15.0 3.4 17. 3.3 16.6 4.0 17.3 4.3 M7. 3.? 39.9 4.9 26.0 4.5 22.1 2.9 22.8 2.9 23.3 3.9 25.4 4.2
Nm-IWA. ~~~109.6 136.7 521.1 150.6 122.0 175.6 159.8 15.8 142.4 154.2 145.4 386.5 35.7 352. 512.8 159.7%U. 1834 325 31.2 167. 9674.4 316.6lokt. (lecric Enerw 4.9 9. 5.1 6.5L 6.1 1M. 6.7 10.4 6.1 6.0 5.2 3.6 8.9 8.2 14.9 32.1 16.1 11.3 7.8 36. 11.6 a.9Raw. Setervils. Sivil-lmnis1ssProbacte. Spore Puts 41.6 06.2 4.5. 89. 7 44. 103.S 53.6 92.51 32.6 96.4 49.4 99.2 49.4 91.2 57.6 987 2. 6 V 8.6 MA. 91.4 06.3- 66. 3
NN.citwrv* transort EipAiinimrtOther Ca Gode12.S 566 3 2. S. MS. 25.3 17.2 22.S 16.6 39.6 38.6 20.5 29.2 26.2 21.8 17.6 WS. 36.5 23.3 36.8 29.6 28.4
l,s6untre Cuwer Cook 36.8 6.6 26.6 8.3 21.6 16.9 22.8 30.3 22.4 33.0 21.8 34.0 20.4 35.1 21. 34.0 22.6 17.2 22.2 W9.S 22.6 22.Idew Eater isl fOw the food
lnjestry. (twe Animis. FoodPradicto 33.2 24.2 37. 24.6 37.4 22.2 43.5 21.0 45.0 22.6 50.3 23.2 SS.7 019. 57.3 23.4 63.31 22.8 63.2 22.7 Y 53.9 23.2
Smacas: luau,l Ird vearbin,A veius lerns.

- 84 -
Tobte 4.1: unawary: Forein Doebt(USS Nillions)
. .......................................................................................................................
1975 1979 1980 1961 1962 1963 1964 1965 1986 19"?
Totat Forein Debt
In CnerW5tibl* Currwie 7,55.8 8,299.8 9,090.1 8,697.4 7,715.0 8,250.0 8,635.6 11,760.2 15,065.6 17,739.0by Original Naturity:
hOwrt Tom 3,422.6 3,171.6 3,347.1 2.6418.3 1,764.0 2,123.0 1,420.8 1,7 0.2 2,421.7 1954.0Lwo Trm 4,143.2 5,125.2 5,743.0 S,349.1 5,951.0 6,127.0 7,414. 10,05S5.0 12,663.9 157SM.0
by Type:Firasciat Loans eJ 7,261.6 7,914.9 8,616.5 8,050.5 6,653.0 6,712.0 7,219.9 10,089.0 13,35S.2 15776.0Trdek-retated Credits 186.8 255.6 293.0 401.8 661.0 1,124.0 1,124.9 1,318.S 1,432.8 1652.0Inter-Covernmnt Credit 5.2 1.1 S.9 5.6 5.0 4.0 3.0 2.0 1.2 1.0Other b/ 132.2 128.2 174.7 239.5 396.0 410.0 487.8 350.7 296.4 310.0
In Nonconwertible Currencies 761.7 910.6 1,224.3 1,327.0 1,274.0 1,367.0 1,260.1 1,229.5 1,109.0 1,026.0by Original Naturity:
Short Trom 330.0 354.6 558.0 243.4 249.0 380.0 342.1 176.2 198.7 263.0Lovg Term 431.7 556.0 666.3 1,083.6 1,025.0 987.0 918.0 1,OS3.3 910.3 763.0
by Type:Finnciot Lo ns 344.3 348.6 531.7 270.3 225.0 331.0 340.? 212.3 228.2 290.0Trade-related CredIts 32.8 22.9 23.3 15.4 1 90 30.0 24.1 0.2 0.0 0.0Inter-Goverirmnt Credit 3S3.8 507.8 634.9 1,037.8 974.0 948.0 863.0 1,009.3 872.6 728.0Other 30.8 31.3 34.4 3.5 36.0 58.0 32.3 7.7 8.2 8.0
...............................................................................................................
$oureo: Nationra lank of Hungary.
a/ Syndlcatod loans, bonds and notes, benk-to-bank credit, and deposits and batance of nonresident banks.b/ Including bankers' acceptences.

- 85 -
Tabl- 4.2: wugary: Inter ost Rate and MaturityCharacteristic. of Foreign Ind btedh ss
I978 1979 1960 1981 1962 1963 1964 1985 1966 1967 a/
(Debt in Convertible Currencies)Inte at Rate (X)Average Rate of Interest on
Stock of Debt Outstanding b/ 4.91 5.87 9.71 14.04 12.84 10.26 10.88 9.18 7.87 7.30Average Rate of Interest on
Loans Contracted in YearIndicated c/ 6.78 8.74 8.57 13.07 9.54 10.01 10.23 8.14 6.46 5.94
Maturity (Number of Years)Average Maturity of Loans
Contracted in YearIndicated c/ 5.70 6.50 6.00 6.10 4.70 6.40 6.24 8.50 7.60 7.00
(Debt in Rubles)Interest Rate (X)Average Rate of Interest onStock of Debt Outstanding b/ 2.73 2.52 2.52 2.71 2.64 2.47 3.31 3.63 3.63 3.65
Average Rate of Interest onLoans Contracted in YearIndicated c/ 2.02 2.01 2.07 2.38 3.51 3.53 4.00 3.25 NA NA
Maturity (Number of Years)Average Maturity of LoansContracted in YearIndicated c/ 9.40 10.40 9.90 9.90 8.70 8.90 6.90 7.00 NA NA
Source: National Bank of Hungary.NA = Not available.
a/ January-June, 1987.b/ Includes short-term debt.c/ Medium- and long-term debt only.

- 86 -
Tr1o 5.1 waqW Price IWan of ts Utiatelt Ikdatry(in * 100.0)
~~~~~~~~~~~~~~~~~~~~.................................................. ....................................................................................... ......... ...............
irdlam
Pr nmrs Pric Ird 18.5 9S.6 100.0 lO.0 15.7 1121 IAA T2.5 13S5 146.2 15.5 140.1 16.5 li.2
Ttal $Am Price I1i 7.5 U.S 107.0 10.9 15.3 15.9 12.9 1.9 136.9 1V.2 1M0.1 116.7 1.N 15fi.7Dtic Sstm 7.4 95.8 10.0 101.4 l.0 WA.4 13.2 W.3 .3 151.6 157.3 W.4 10 14..He *l_ wd letail Trt MD.6 se.8 11.0 101.6 15.7 W.2 116.3 12.0 123.4 128.9 13.5 13.4 14.6 14.6
Fr Expat:lUle L.5 10.3 100.0 15.6 10.9 1.9 %.4 10.2 105.1 W.5 111.7 119.0 12.3 125.9
l ,-be h..0 1M.7 107.0 10M.1 10.1 110.3 118.4 125.5 13.5 13M.0 144.5 147.8 143.1 1SS.0
GRwth Rates (M)
Pnuixrs Price ird1 -- 4.0 4.6 2.0 3.6 2.2 15.3 6.3 4.5 5.6 4.3 5.0 2.1 3.5
Total Sate Price rd - 3.5 4.4 1.9 3.3 1.5 15.0 6.5 4.6 5.3 4.1 4.4 2.0 3.7Daotic Sate. s- 3.4 6.6 1.4 4.5 1.3 19.4 7.1 5.1 5.2 3.6 4.5 2.2 3.7
eotessde w t Reai Trad - 2.9 7.7 1.8 3.9 1.4 8.5 4.1 2.0 4.4 3.6 3.7 4.5 --For Ego :
RLe -- 2.4 -4.1 3.6 -1.7 -5.4 3.9 2.9 4.3 3.9 6.5 6.1 -0.3Nabble -- 6.8 -2.7 4.1 -- 6.0 7.3 4.4 1.6 6.8 7.8 2.3 -3.2 9.0
sarces: Statistical Yetok, vwrios isas.p/ PrtLimirwy.Wie: Qvwh a fohr 1975 are erAr e .il grwth rates for the 5-Sewr period 19-7015.

- 87 -
T*Ae 5.2 1zry. Oow. r Price In by raiin d*4* of EWAtu(lISa 1*.0)
,.......................................................................................... ....................... ......................................... .......................
5Wa tw WR tw twa twa nw iF tw ...............................................................................................................................................
Efm J. o.0 1.5 .3 1A 1.5 141.1 16Z.9 15.4 174.2 f.2 159 D.3_ T, 1 o5 10.0 15.0 114.7 139 3.1 13.5 12.1 lIQ3 119.4 133 1Q.3 WI.3CtIeti 1.1 10.0 1.5 109.7 119.6 125. 1.9 1413 150.2 1L87 1.9 2.3 21.9Pw., lNdm*d DW 953 0.O 9.3 96A 1A A 11.3 14. 151. 1.9 5.1 WUA 21.SugdI 1_m 0mi .0 NOO.0 1M. 1 IMA 114A 19.5 13D.9 1.6 14.0 151.9 M.O 19A. 1737.Odwr Irmrla& Artlctu I.A 10.0 12.2 15. 114.0 13A 1O3 144.7 52 1.7 119.7 15.5 0.6uvla MI 15.0 15.2 W.2 110J 116.6 1.3 1.4 149.1 161.0 1.0 W.7 34
Toea 10.1 100.0 .9 10.7 116.4 129.2 13.1 4.4 154.9 167.8 179.5 15.0 2.3
FduIffs 0.9 10.2 5.S 3.6 10.2 13.4 3.4 4.8 S.1 12.1 6.3 2.0 9.2_ ,wr Tc 0.S 0.5 5.0 9.2 12.4 1.7 2.6 13.1 6.7 5.0 1.7 5.2 13.7
Clcdthrg 2.3 5.2 4.5 5.0 9.0 S.0 6.6 5.5 6.3 11.0 10.9 9.4 9.7W&, HN old Bw -1.8 -0.9 -0.7 0.3 8.8 21.4 0.2 10.0 4.9 4.9 20.9 3.5 6.4bnMe am 0 -0.1 2.9 2.4 3.1 8.3 13.2 1.1 2.1 7.8 S.S 5.3 6.1 2.3Odw Idstriat Articlt 3.3 6.7 2.2 3.3 8.0 9.5 9.0 6.4 9.' 7.3 5.9 4.9 6.4Sarwvc 1.9 2.4 3.2 3.9 34 7.0 6.5 7.2 10.1 8.0 9.3 8.9 8.7
Total 1.3 5.0 3.9 4.6 8.9 9.1 4.6 6.9 7.3 8.3 7.0 5.3 8.6==......................... .......................................... .. ... ........... .................. ............ .................... ..... ....... ... ..............................
:ams: Statfstical Yrwdc, wvais im.p/ PreUniray.Nte: Ort rae &Arqp mit pm th ie aw fs urwfas VW.

- 88 -
**be WJ I1 12_ dM _A* et NA w *rio(11* ll6.0)
...................................................................................................................................................
"PC 0 m " "a7in 199 " 191 1 "a 1
bq f As mtMe" _so 19.0 13.2 1*. 192 16.3 I".1 "1.1 31.0 213.1 2n.5 M. 53.3 272.0
_ _ _ 19.0 117.6 1.9 1A 1. 1. 13.0 1. 1R. 11S 11n.7 11.2 11M.1
avow Pie Ing 19.0 114.0 1.J 0.2 13o 1LT 1.A l1.-0 1. 159 in.1 216.2 2m.9
&U km of tram 0S)
1md UuWr -- 4.2 5.1 ?A I.9 7.1 73 S.7 4.0 3.9 5. 8.3 7.A
_m MM *- 3.3 0.1 3.8 3.1 -1.7 -1.? 1.1 o0.7 3.2 -2.4 1.3 1.6
Cw m Pc -- 2.5 5.0 3.9 4*J 5 9.2 44 7.0 7.2 5.1 7.0 S.A
NsW QM raM far 15 M S-Ur m s WiO fgt.

- 89 -
Table 6: Contolidated Central Govenrnnt Budget(lillions of current Forints)
1. CENTtAL GOVERWNENT REVEMUE I/ 1961 1962 1983 1964 1985 1966 1967
Current 4ev nue 418.1 436.7 48.S 53S.2 539.0 619.4 637.3Tax Rvnu 349.6 374.5 426.7 4'l.0 456.2 536.0 575.2IneProfCapGaCins 77.2 70.2 85.7 CA. 1 69.9 96.. 102.4
Payroll t Npomer T"x V 64.5 75.7 8U.2 117.3 1S1.7 174.7 164.5Property Tax 14.9 13.9 21.1 3.9 19.6 17.8 19.8DoTs or Or S 159.7 179.3 187.6 17'.4 1I1.4 179.7 206.6Tax en Intl Trade 28.8 28.5 34.2 33.5 31.8 38.6 32.9Other Taxes 4.2 6.9 13.2 19.8 11.8 26.9 29.0NonTax Revenue 3/ 68.5 64.2 58.8 65.2 82.8 83.4 62.1
Current EApanditures 380.0 399.0 438.6 463.4 491.7 608.5 613.4Wages nd Salaries 29.5 32.1 34.5 36.5 42.4 50.4 46.8OthPurch GAS 56.0 59.1 53.4 58.0 60.3 40.9 75.7Interest Payments 4/ 9.0 9.4 2.1 5.S 3.7 14.1 19.0Subsidies and Transfers 253.1 261.5 311.8 319.1 335.0 428.0 393.7Transfers to OLNG 32.4 36.9 36.8 4.3 50.3 75.1 78.2
Capital Expenditures 58.2 54.8 53.7 S6.1 58.1 44.3 47.9Acquisition of FKAssets 23.1 16.8 34.8 37.9 37.8 32.0 27.5Capital Transfers 35.1 38.0 18.9 18.2 20.3 12.3 20.4Donestic 35.1 38.0 18.9 18.2 20.3 12.3 20.4Foreign 0.0 0.0 0.0 0.0 0.0 0.0 0.0
Net Lending 2.0 1.0 -0.4 0.0 -0.7 1.2 0.0Domestic 0.0 0.0 0.0 0.0 0.1 0.0 0.0Foreign 2.0 1.0 -0.4 0.0 *0.8 1.2 0.0
Budgetary Saving 38.1 39.7 46.9 71.8 47.3 10.9 23.9overall Surplus/Deficit -22.1 -16.1 -6.4 15.7 -10.1 -34.6 -24.0
Total Financing 22.1 16.1 6.4 -15.7 10.1 34.6 24.0Dome tic 5.8 13.2 2.3 -17.0 11.2 43.2 32.3Foreign 16.3 2.9 4.1 1.3 -1.1 8.6 -8.3
Memoranmd i te:Surplus/Deficit in State Budget format -9.5 -12.2 7.3 33.4 -15.8 -46.9 -35.0
. . * * * s o ^ s z s. e................................................................................................................ ee---........................... *-s
1/ Fiscas data are based on GFS classification of general goverr_ nt.2/ Including social security contributions.
3/ Including capital revem.4/ Excluding interest subsidies on housing loans which are included in subsidies.
Source: Goverrwant Financial Statistics (various issues)

NOTES

7i

4
MAP SECTION
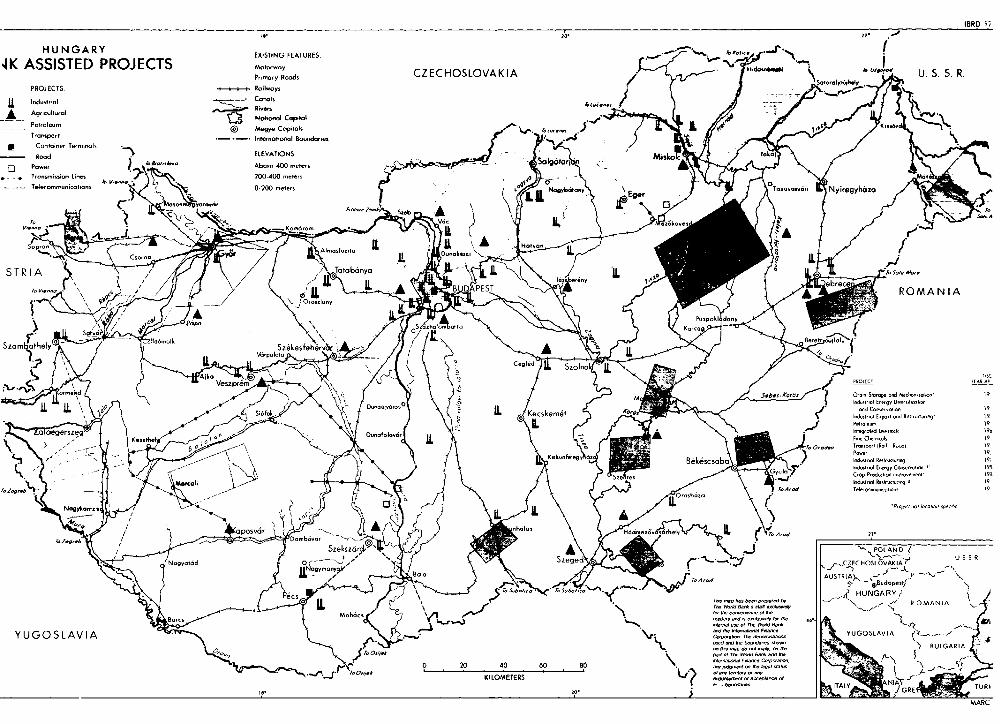
IERD li20 U
H U NGA RY ~ EXISTING FEATURES. ~nr 4K ASSISTED PROJECTS CZEHOLOVTI-ATU.S.S.R.
P,,..,y R-&d CZECHOSLOVAKIA hdo reet U S S. R.
PROjECTS. Rojiwoys fIodustrroi . . Corrals f / > ~ A k 'J~ N iC
A Aqroli, 1ro1 Rive.s4 CrOpO _ 0_ t))_Petroleon. @a Mto9yO Coptols *. v ° I.5 8sw°<\
Tronsp7rt - -Isternotcoool Boorrdor.as A.,.. .C2> f
* Contoner Tererreols ~ ~ ~ .9"C.pt.
C..to- T-kELEVATIONS . TkO
_ Rowd ) 4 Abo-re 400 -et-rs . . Salgtari
* Tr-nsmission ites h 200-400 meters 3t _r
/ ff \Sx j/l \ N L sSecsemet ffi 9 w ~~~~~~~~~~~~~~ILEg<W er
_~~~ L ga_>0 v~W3 iwr~ .1 Koyunr r- gfr
A i q t f Jt1L uSo rltto o s
S/~~~~< IL Tu= . R01AlANI
V,mno .odrossX ( \z 5 * -e C.w M W.. a
YSUTGROS JL AV I A t 9 < ~WAF0Ase t YUGOSLAVIA rnet _ / n o
%> < );o°;xj p2.l0fnew~Ls,ns,r,, . ! _A ROM GANIA
~> > 0 20 40 60 8i0 \,< W W S we w_ i i ./L v 5<i
IL zc j KALY rtGREE00 GnECor z F~~~~~~~~~~~~~~~~'t:,.W L-e-k 19.~~~~~~~~~~~~~~~~~~~~~~~~~~IPonr o !Ui
Sros~~~~~oiro r 0 9orrat...<~~~~~~~~~~~~~ ~~~- ~~~Vodopns'yC..9fThe ROorOOn00 daff kdwr. R.-- MANI
.gy.tdd 0 e -C~~~~~~~~~~~~~~namnPaoi'an ag
20 40 60~ ~~~~ ge Sr oino oAnKoo roo
a. oo ,JGRE TURI~~~~~~~~~~~~~~~~~~~~~~~~~~~~~~~~UTRA-
HUNGARY/ ~ ~ ~ TAR