humboldt river chronology - nevadawater.nv.gov/mapping/chronologies/humboldt/hrc-pt1.pdfhumboldt...
TRANSCRIPT

Nevada Water Basin Information and Chronology Series I–1
Humboldt River ChronologyAn Overview and Chronological History of the
Humboldt River and Related Water Issues
The information contained in Volume 1, Part I – Overview of this Humboldt River Chronology provides ageneral overview and description of the Humboldt River Basin and Humboldt River and its physical, geologic,and hydrologic characteristics and attributes. Volume 2, Part II – Pre-Twentieth Century and Part III –Twentieth and Twenty-First Centuries contain a detailed listing by date of some of the more important eventsassociated with the Humboldt River Basin, the Humboldt River, sub-basins and various tributaries, storagereservoirs, water diversions, and related water supply, water use, water rights, water resources development,fisheries and habitat, and environmental and water quality issues.
Part I – Overview
Introduction
The Humboldt River Basin is an extensive river drainage system located in north-central Nevada andextending in a generally east-to-west direction from its headwaters in the Jarbidge, Independence andRuby Mountains in Elko County, to its terminus in the Humboldt Sink, approximately 225 milesaway in the desert of northwest Churchill County. The basin encompasses an area of approximately16,840 square miles and is the only major river system wholly contained within the State of Nevada.Connecting the Humboldt River’s lofty mountain sources of water to the basin’s terminus is the 310-mile long Humboldt River, which, by some claims, is actually about twice that in length accountingfor its countless meanders.1 One particularly interesting observation in a U.S. Army Corps ofEngineers report’s background study dealt with the meandering flow of the Humboldt River. Thereport noted that the river’s overall length from near Wells to the Humboldt Sink was approximately300 miles. However, “the actual length of the river was much more than this due to its extensivemeandering from side to side of the valleys. At numerous points along the river the direction of flowis transverse and even opposite to the general slope of the valley, and in one valley 130 miles long itis estimated the river flows 380 miles.”2 From the river’s origin near Wells, Nevada, to the HumboldtSink, located southwest of Lovelock, the river drops in elevation by approximately 1,675 feet.
The importance of the Humboldt River and the Humboldt River Valley to early emigration is welldocumented in the history of the West. The river’s course cutting directly through Nevada’s basinand range topography became a primary route for the California Emigrant Overland Trail throughNevada beginning in the early 1840’s and lasting into the early 1870’s. With the completion of thetranscontinental railroad in 1869, the route down the Humboldt River became a major east-westrailroad passage and, through various phases of highway construction, eventually evolved intopresent-day U.S. Interstate 80.
The earliest use of the Humboldt River Basin by Europeans was for trapping beaver. Later the riverprovided water to scattered agricultural activities which served the needs of early emigrant wagontrains. Upon the discovery of silver ore in the lower Humboldt basin in 1860, the economic focusshifted to the development of the river basin’s natural and mineral resources. The resultant influx of

Humboldt River Chronology—Part I DIVISION OF WATER PLANNING
I–2 Nevada Water Basin Information and Chronology Series
people dramatically increased the demands for agricultural produce, necessitating more intensive useof the basin’s extensive rangelands for livestock grazing. By the early 1870’s, extensive ranching andopen-range grazing operations stretched virtually from one end of the basin to the other and reachedup every major stream and tributary to the Humboldt River. By the late 1800’s, most of the basin’smining activities had lapsed into near-dormancy, but the extensive rail and road transportationsystems that mining had fostered now amply served the needs of an expanding farming and ranchingindustry.
Agriculture and transportation effectively dominated the Humboldt River Basin’s economy up untilthe late 1980’s, when gold production, primarily along the Carlin Trend in western Elko County andnorthern Eureka County, turned the basin into the largest producer of gold in the United States.Throughout the late 1980’s and early 1990’s, the mining industry came to dominate the economiesof the principal counties in the Humboldt River Basin.
The Humboldt River Basin encompasses significant portions of five Nevada counties – Elko, Eureka,Lander, Humboldt and Pershing – and also includes smaller portions of three other counties – WhitePine (upper Huntington Valley), Nye County (upper Reese River Valley) and Churchill County(Humboldt Sink).3 The Humboldt River Basin, or Nevada Hydrographic Region 4, is one of 14hydrographic regions, basins or watersheds designated within the State of Nevada.4 The HumboldtRiver Basin is sub-divided into 33 hydrographic areas with one area sub-divided into a hydrographicsub-area. A hydrographic area typically represents a defined valley drainage area5 or some otherdiscreet drainage system within a larger hydrographic region, basin or watershed. Appendix 1 to PartI lists the hydrographic areas located within the Humboldt River Basin along with the area or valleynames, surface areas, counties of coverage and whether they have been designated by the NevadaState Engineer for additional administration.6
For purposes of this overview of the Humboldt River Basin, the hydrographic areas have beenaggregated into eleven “sub-basins”, each of which consists of one or more hydrographic area. Thesub-basin designation allows for more detailed analysis of the region’s hydrographic and geographiccharacteristics than provided by the total basin or watershed concept, while at the same timeproviding a more comprehensive assessment than that possible using the individual hydrographicareas.
The sections which follow present detailed information and analysis of the Humboldt River Basin’sphysical and geographic characteristics, river reaches and stream segments, major tributaries, water-related issues, stream flows, the eleven defined sub-basins, water rights and the river’s adjudicationprocess, reservoirs and storage facilities, mining and mine dewatering, agriculture, changes inrangeland conditions, livestock grazing, erosion, flooding, cheatgrass invasion and wildfires, andsnowpack water content trends and related matters. Also presented at the end of this overview is asection on climatic changes which have taken place during the Pleistocene Epoch (approximately 2million years ago to about 11,000 years ago) and the Holocene Epoch (about 11,000 years ago to thepresent) and the effects on the hydrology of the Great Basin and the Humboldt River Basin.The Great Basin and the Humboldt River Basin
The Humboldt River Basin lies wholly within a vast Intermountain region which was first recognized

DIVISION OF WATER PLANNING Humboldt River Chronology—Part I
Nevada Water Basin Information and Chronology Series I–3
for its unique geophysical structure by John C. Frémont, who fittingly named it the “Great Basin”.7
The hydrographic8 Great Basin is defined as an area of internal drainage systems bordered by theRocky Mountains on the east, the Sierra Nevada9 on the west, the Columbia Plateau on the north andthe Colorado Plateau on the south. Surface waters within this expansive area never reach the ocean,but are confined to closed basins which ultimately drain to terminal lakes, playas, or sinks. The GreatBasin covers an area of approximately 205,780 square miles (131,699,230 acres or 532,970 squarekilometers) and includes nearly all of Nevada, much of eastern California, western Utah, southeasternOregon, and portions of southern Idaho. Within Nevada, four designated hydrographic regions,basins or watersheds constitute the northern boundary of the Great Basin. These include theNorthwest Region (Nevada Hydrographic Region 1),10 the Black Rock Desert Region (NevadaHydrographic Region 2),11 the Humboldt River Basin (Nevada Hydrographic Region 4),12 and theGreat Salt Lake Basin (Nevada Hydrographic Region 11).13 Of these four hydrographic regions, onlythe Humboldt River Basin is wholly contained within Nevada.
The Great Basin is characterized by considerable variation in its topography, with one record examplefor adjacent valley bottoms and mountain tops being the vertical relief of 11,331 feet betweenBadwater in Death Valley (282 feet below mean sea level, or MSL) and nearby Telescope Peak inthe Panamint Range (11,049 feet MSL).14 The most extreme example of this variable topographywithin the Great Basin is the elevation difference of 14,744 feet MSL over a distance of 84 mileswhich separates Death Valley’s Badwater site from the summit of Mount Whitney (14,462 feetMSL).15 More typically, the difference between the Great Basin’s mountaintops and valley bottomsranges from 3,800 feet to 7,600 feet with an average difference of 5,800 feet. The extremetopographic relief of this area greatly affects the distribution of plants and animals and provides nichesfor a multitude of organisms with diverse habitat requirements.16
The Great Basin is a land of striking contrasts containing considerable biological diversity. The GreatBasin ranks as the fourth highest in terms of the number of vascular plant species among 116ecoregions throughout North America and also ranks very high in the number of species of birds,butterflies and mammals.17 This high biological diversity is produced by a blending of the surroundingecoregions’ flora and fauna populations with the unique species of the Great Basin and diversehabitats found within the Great Basin’s “basin and range” topography. The Great Basin is home tothe oldest living organisms on earth, such as the Great Basin bristlecone pines, which can live up to4,900 years, and the creosotebush clones in the Mojave Desert, which are estimated to be 10,000-11,000 years old.18
The landforms of the Great Basin define the region as part of the basin and range physiographicprovince which, in addition to characterizing much of northern and central Nevada, also extendssouth to include the Sonoran Desert and Chihuahuan Desert of Arizona and Mexico. This region ischaracterized by hundreds of long, narrow, and roughly parallel, north-south oriented mountainranges that are separated by deep, sediment-filled valleys. The Great Basin’s mountains aregeologically recent, and the landforms are a product of the formation and erosion of the RockyMountains and the Sierra Nevada. The structure of the more than 400 mountain ranges in the regionare similar, however, their compositions are diverse and range from granite ranges in the westernportion of the Great Basin, basalt ranges in the northwest, rhyolite mountains throughout the center,and limestone mountains dominating the east and southwest.19

Humboldt River Chronology—Part I DIVISION OF WATER PLANNING
I–4 Nevada Water Basin Information and Chronology Series
The Great Basin’s topographic extremes, particularly along its eastern and western mountain borders,provides for relatively abrupt ecological and biological ‘transition zones’, which represent areas ofcontact between the flora and fauna populations of two adjoining regions. These zones of habitattransition retain characteristics of both regions to varying degrees and also create their own uniquehabitat conditions. The Great Basin’s eastern boundary is sharply defined by the Wasatch Mountainsand the Colorado Plateau, while the western boundary is even more distinctly defined by the SierraNevada which has been referred to as one of the world’s sharpest boundaries between biologicalregions. By contrast, the Great Basin’s northern and southern boundaries are far more subtletopographically and the resultant transition zones are broader.20
The climate of the Great Basin is also one of the most variable and extreme in the world. The “rain-shadow” effect imposed by the Sierra Nevada in the west results in the capture of the moisture fromPacific storm systems, thereby creating semi-arid to arid continental climates in the basin’s interiordesert regions. Similarly, the Rocky Mountains on the basin’s eastern border intercept potentialstorm systems coming up from the Gulf of Mexico. Even so, local weather patterns within the GreatBasin are complicated by the intervening mountain ranges which tend to uplift the prevailing air flowsand disperse the moisture as local storms. Therefore, depending on changes in topography, localizedannual precipitation levels can vary from as little as six inches on the valley floors to over 45 incheson the upper elevations of adjacent mountain ranges.21
The distribution of the Great Basin’s present biological communities was shaped primarily by climaticchanges over the most recent glacial event. The Wisconsin Age of the Pleistocene Epoch, the lastperiod of glaciation which lasted from about 122,000 to about 10,000 years before present, is the bestknown of all North American glacial advances and retreats22 and produced extensive glaciers in theGreat Basin’s upper mountain regions and enormous lakes and marshes in the basin’s valley lowlands.During this last ice age period the Great Basin could be geographically divided into five distinctregions: (1) Northwest Lakes of southern Oregon; (2) Lahontan System of northern and westernNevada and northeastern California and once containing the Great Basin’s second largest Pleistocenelake, Lake Lahontan;23 (3) Central Basins of central Nevada; (4) Bonneville System of eastern Nevadaand western Utah and once containing the Great Basin’s largest Pleistocene lake, Lake Bonneville;24
and (5) Death Valley System of southern Nevada and southeastern California.
The higher effective moisture (a combination of cooler temperature and/or greater precipitation)characterizing the late Pleistocene Epoch greatly affected the distribution of plant and animalcommunities. The Holocene Epoch (approximately the last 10,000 years) has resulted in less effectivemoisture than during the Pleistocene and especially the Wisconsin Age. These changing climaticpatterns have resulted in the northward and/or elevational migration of many plant species.25

DIVISION OF WATER PLANNING Humboldt River Chronology—Part I
Nevada Water Basin Information and Chronology Series I–5
Figure 4 – The Hydrographic Great Basin(Courtesy Stephen Trimble, The Sagebrush Ocean – A Natural History of the Great Basin)

Humboldt River Chronology—Part I DIVISION OF WATER PLANNING
I–6 Nevada Water Basin Information and Chronology Series
The Great Basin’s physical and floristic characteristics have tended to divide this region into sevenvegetation zones characterized as follows:26
(1) Absolute Desert – includes playas, salt barrens, and sand dunes;(2) Mojavean Zone – encompasses most of the geographic area of the Mojave Desert with theexception of the higher mountains, dominated by creosotebush scrub, saltbush scrub, shadscalescrub, blackbrush scrub, Joshua-tree woodland and annual vegetation;(3) Shadscale Zone – named after its dominant plant species, but is also populated by many otherspecies of widely spaced, drought-tolerant shrubs that are usually thorny with small leaves;(4) Sagebrush-Grass Zone – the largest of all vegetative zones in the Great Basin and the mostcontiguous, in addition to the dominant big sagebrush, several other sagebrush species andsubspecies also occur and can be locally dominant. This zone has higher precipitation than thatof the shadscale zone supports greater richness of shrubs, grasses, and perennial forbs;(5) Pinyon-Juniper and Western Juniper Zone – typically defined as the lowest elevation of thebroader montane zone, this zone’s plant communities are supported by higher precipitation on themountain slopes resulting in woodlands of pinyon pine and several species of juniper withunderstories of grasses, perennial forbs and shrubs (principally sagebrush and bitterbrush);(6) Montane Zone – constitutes the more restricted montane area between the montane’s lowerpinyon-juniper zone and the upper alpine zone, with a common feature being the widespreadoccurrence of quaking aspens and usually few or no conifer species in the basin’s northern ranges;curl-leaf mountain-mahogany also provides important habitat in this zone;(7) Alpine Zone – the uppermost montane zone, strictly defined as beginning at the limit of theupper treeline; relatively restricted to only a few of the highest mountain ranges and constitutesthe smallest of the principal zones within the Great Basin.
Table 1 – Great Basin Geographic and Vegetation ZonesPrincipal Vegetation Zones by Area and Percent of Great Basin
Vegetation ZoneArea (square miles)[square kilometers] Area (acres)
Percent ofGreat Basin
Rank by Areaof Coverage
(1) Absolute Desert 11,390 [29,510] 7,292,060 5.54% 6(2) Mohavean 37,860 [98,068] 24,233,030 18.40% 2(3) Shadscale 35,260 [91,317 22,564,830 17.13% 3(4) Sagebrush-Grass 79,560 [206,071] 50,921,050 38.66% 1(5) Pinyon-Juniper 26,160 [67,743] 16,739,590 12.71% 4(6) Montane 15,070 [39,037] 9,646,210 7.32% 5(7) Alpine 473 [1,224] 302,460 0.23% 7
Total Great Basin 205,780 [532,970] 131,699,230 — —
Source Data: Brussard, Peter F., David A. Charlet, and David S. Dobkin, “Regional Trends of Biological Resources – Great Basin”,Status and Trends of the Nation’s Biological Resources, Volume 2, U.S. Geological Survey, U.S. Department of the Interior, U.S.Government Printing Office, Washington, D.C., 1998, pages 511.
Table 1, Great Basin Geographic and Vegetation Zones, presents the approximate areas of the GreatBasin’s vegetation zones and their share of the basin’s total area. The Humboldt River Basinoccupies the north-central portion of the Great Basin. With the exception of the Mohavean Zone,all vegetation zones in Table 1 are present within the Humboldt River Basin.
DIVISION OF WATER PLANNING Humboldt River Chronology—Part I
Nevada Water Basin Information and Chronology Series I–7
A Geographic and Hydrologic Overview of the Humboldt River Basin
Overview
This overview of the Humboldt River Basin consists of two parts: (1) an overview of the upperbasin, including those drainage areas located upstream of the U.S. Geological Survey (USGS) gagingstation at Palisade, Nevada (USGS gaging station number 10322500),27 and (2) a lower basinoverview for those drainage areas located downstream of the Palisade gage. [Note: see USGS gagelocations on Figure 3, Humboldt River Flow Schematic, located on page x.] The Palisade gage hasbeen generally accepted as the location along the Humboldt River above which instream flows areincreasing under normal flow conditions and below which the Humboldt River’s flows are decreasing.Furthermore, during the Humboldt River’s water rights adjudication process beginning in the 1920’sand 1930’s (which is discussed more fully in a later section “Humboldt River Water Rights,Adjudication and Related Court Decrees”), this location was also noted as an appropriate dividingpoint for climatological differences affecting the basin’s growing seasons and, consequently, irrigationwater requirements.
Some researchers divide the basin into three geographic areas: upper, middle and lower divisions.28
For example, USGS studies currently underway use this type of division. By this distinction, theupper basin consists of a drainage area of about 5,000 square miles upstream from Palisade; themiddle basin has a drainage areas of about 7,800 square miles and lies between Palisade and EmigrantCanyon, which is a narrow gap located just downstream from Comus; and the lower basin is an areaencompassing some 4,100 square miles located downstream from Emigrant Canyon, extending to andincluding the Humboldt Sink. This division tends to be more geographic than hydrologic as PalisadeCanyon and Emigrant Canyon represent the major constriction points along the Humboldt RiverValley. For this analysis, however, we will adhere to the concepts of an upper Humboldt River Basinand a lower Humboldt River Basin, a division which is based on typical Humboldt River flowaccretion above Palisade and river flow attenuation below Palisade.
The drainage area of the upper Humboldt River Basin covers approximately 5,040 square miles andaccounts for nearly 30 percent of the basin’s total surface area of approximately 16,840 square miles.The upper Humboldt River Basin stretches essentially from Wells, Nevada, located in Elko County,downstream to Palisade, located in Eureka County, a distance of approximately 92 miles. Over thisdistance, the upper Humboldt River drops approximately 740 feet in elevation, corresponding to anaverage river grade of just over eight feet per mile. The lower Humboldt River Basin coversapproximately 11,800 square miles and accounts for the remaining 70 percent of the Humboldt RiverBasin’s total surface area. The Humboldt River’s length through the lower basin, from Palisadedownstream to the Humboldt Sink, located in Churchill County, is approximately 218 miles. Overthis distance, the lower portion of the Humboldt River falls nearly 940 feet, corresponding to anaverage grade of 4.3 feet per mile, about one-half the Humboldt River’s grade through the upperbasin.
While accounting for less than one-third of the Humboldt River Basin’s total surface area, it is theupper Humboldt River Basin that is, in effect, the source of virtually all the Humboldt River’s flowsunder normal (average) water years.29 The source of Humboldt River flow is typically in the form

Humboldt River Chronology—Part I DIVISION OF WATER PLANNING
I–8 Nevada Water Basin Information and Chronology Series
of snowpack runoff from upper elevation watersheds, primarily those in the Ruby Mountains (RubyDome–11,387 feet MSL), the Jarbidge Mountains (Mary’s River Peak–10,565 feet MSL), and theIndependence Mountains (McAfee Peak–10,439 feet MSL). By contrast, the principal high-elevationmountain ranges located within the lower Humboldt River Basin, such as the Toiyabe Mountains(Toiyabe or Arc Dome–11,788 feet MSL) and the Shoshone Mountains (North ShoshonePeak–10,313 feet MSL), both of which are located within the Reese River drainage (sub-basin), andthe Santa Rose Range (Granite Peak–9,732 feet MSL) in the Little Humboldt River drainage (sub-basin), drain to river systems that, under average or normal water year conditions, make no surfacewater contribution to the Humboldt River main stem.
The discussion below is divided into an overview of the upper and lower basins, with the HumboldtRiver beginning near Wells, which is located near the eastern border of the Humboldt River Basin.Aside from being situated very near the source of the Humboldt River, Wells also marks the startingpoint for many early emigrants’ trips down the Humboldt River during the wagon train period of1841 to 1870. At that time, Wells was called Humboldt Wells and was the place along the riverwhere emigrant wagon trains arrived from the northeast using the Fort Hall route of the OverlandEmigrant Trail. It was here that the early emigrants first saw the Humboldt River, no doubtunfavorably comparing it to considerably larger and far more lushly vegetated river systems that theywere familiar with in the East. Nonetheless, the springs and lush meadows in the Wells area allowedthese adventurous travelers to briefly refresh themselves before beginning their long and arduousjourney down the Humboldt River Valley. Judging from a number of diary entries recorded duringthis period, the early emigrants’ generally unfavorable impressions of the Humboldt River near Wellsonly worsened by the time they reached the river’s terminus at the Humboldt Sink.
The Upper Humboldt River Basin
The Humboldt River Basin may be sub-divided into eleven distinct sub-basins, with each sub-basinconsisting of one or more hydrographic areas (see Table 9, Defined Sub-Basins and HydrographicAreas and Sub-Area, for more details on the extent of these defined sub-basins). The upperHumboldt River Basin consists of five of these sub-basins – Mary’s River, Ruby Mountains (includingStarr and Lamoille Valleys), North Fork, Maggie and Susie Creeks, and the Elko Segment – and alsoinclude 11 hydrographic areas. The upper basin’s total surface area is approximately 5,040 squaremiles and includes the major mountain ranges of the Ruby Mountains to the south of the HumboldtRiver, and the Jarbidge and Independence Mountains to the north, which also form a northern borderto the Great Basin.30
The generally recognized source of the Humboldt River system is located in the Mary’s River sub-basin, a drainage area consisting of about 1,070 square miles. The Mary’s River sub-basin qualifiesas the uppermost source of the Humboldt River as it contains the tributary (Mary’s River) farthermostfrom the river’s terminus (the Humboldt Sink) and also includes the river’s easternmost tributary, andthe headwaters of the Humboldt River which begin at Wells, Nevada. The Mary’s River is also thenorthernmost tributary in the Humboldt River Basin, except for some minor tributaries to the NorthFork of the lower basin’s Little Humboldt River (a river system which rarely, in fact, ever reaches theHumboldt River main stem). The Mary’s River begins approximately 56 miles above its confluencewith the Humboldt River near Deeth, Nevada. The easternmost reach of the Humboldt River lies

DIVISION OF WATER PLANNING Humboldt River Chronology—Part I
Nevada Water Basin Information and Chronology Series I–9
above Deeth and up Bishop Creek, approximately 36 miles upstream from Deeth.31 The main portionof the Humboldt River, however, originates near the town of Wells, which lies approximately 20 milesupstream from Deeth. [Note: All river distances are approximate and exclude extensive streammeanders.]
Ten miles downstream from its beginning at Wells, the Humboldt River receives the inflows of BishopCreek flowing into the river from the northeast. On an interesting historical note, fourteen miles upBishop Creek is the Bishop Creek Reservoir, which was the site of an ambitious colonization andreclamation project in 1910 when The Pacific Reclamation Company purchased approximately 40,000acres of land at the mouth of Bishop Creek (Emigration) Canyon. By 1912 the company hadconstructed the present earth-rock fill dam on Bishop Creek with a storage capacity of 30,000 acre-feet, and a diversion canal with the intention of irrigating 30,000 acres of land. In the flats below thereservoir, a town named Metropolis was built, along with a $100,000 brick hotel, a brick school(Lincoln School), electric lights and city parks. By 1914 the population in the area had grown toalmost 1,000 persons. Beginning in 1912, however, problems with water rights on Bishop, Burnt andTrout creeks had dramatically reduced available irrigable lands to only 3,000 acres. Attempts atdryland farming, the first time this had been tried on any significant scale in Nevada, proveddisastrous. By 1924 the population of Metropolis had shrunk to only 200 persons and subsequentdroughts and the depression era of the 1930’s eventually finished off the town. Today, only scatteredruins of the town remain32 and the Bishop Creek Reservoir (sometimes still referred to as MetropolisReservoir) is now not even able to hold water due to cracks in the dam.33
Ten miles below the Humboldt River’s confluence with Bishop Creek is Deeth, where the Mary’sRiver enters the Humboldt River from the north. The Mary’s River drains an area with its sourcewaters located in the upper watersheds of the Jarbidge Mountains, approximately 56 miles upstreamfrom Deeth. Near Deeth, a number of other tributary streams also enter the Humboldt River fromStarr Valley to the southeast. These streams primarily drain the northwest slope of the EastHumboldt Range, which forms the northernmost extension of the Ruby Mountains. Twelve milesdownstream from Deeth is Halleck, and just below Halleck, Lamoille Creek enters the HumboldtRiver from the southeast, draining the northwest slopes of the Ruby Mountains. Eight milesdownstream from Halleck, the North Fork of the Humboldt River enters the Humboldt River mainstem. The North Fork drains an area consisting of over 1,100 square miles stretching north to theSnake River Basin. The headwaters of the North Fork are located in the Independence Mountains,approximately five miles north of McAfee Peak and nearly 70 miles upstream from the HumboldtRiver main stem.
Another eighteen miles down the Humboldt River from its confluence with the North Fork is theHumboldt River Basin’s principal city of Elko. Elko’s town site was laid out on December 29, 1868,by Central Pacific Railroad engineers, and it soon flourished as a major regional transportation hubfor mines to the north and south.34 The plentiful water supplies from the nearby Ruby Mountainsserved a rapidly growing local agriculture and ranching industry. Eight miles below Elko, the SouthFork of the Humboldt River flows into the Humboldt River main stem. The South Fork, along withthe Starr Valley and Lamoille Creek drainage areas, drains an area of nearly 1,900 square milesconsisting primarily of Huntington Valley and the western slopes of the Ruby Mountains.Approximately ten miles up the South Fork from it confluence with the Humboldt River main stem

Humboldt River Chronology—Part I DIVISION OF WATER PLANNING
I–10 Nevada Water Basin Information and Chronology Series
is the South Fork Reservoir, which was constructed in 1987 by the State of Nevada and the ElkoCounty Fair and Recreation Board. The South Fork Reservoir has a storage capacity of 42,000 acre-feet and is used primarily for recreation. From its confluence with the Humboldt River, the SouthFork drainage extends south through Huntington Valley for approximately 68 miles to the easternslope of the Diamond Mountains and very near Christina Peak (9,656 feet MSL). The upper, orsouthernmost portion of Huntington Valley actually extends approximately 15 miles into White PineCounty.
Some sixteen miles below its confluence with the South Fork, the Humboldt River receives the watersof Susie Creek, and just over a mile further downstream Maggie Creek enters the Humboldt River.Maggie Creek drains an area of nearly 620 square miles above Carlin, Nevada, and encompasses adrainage area lying between the Independence Mountains on the east and the Tuscarora Mountainson the west. The Maggie Creek drainage area currently figures prominently in the Humboldt RiverBasin’s gold mining activities and, in fact, presently receives pumped groundwater from thedewatering operations of Newmont’s Gold Quarry Mine. Maggie Creek runs through the “CarlinTrend”, an area containing extensive, but relatively low-grade, gold ore deposits in Western ElkoCounty and northern Eureka County. Gold mining operations along the Carlin Trend have broughtconsiderable fame and fortune to this portion of the Humboldt River Basin.
Just about one mile below Maggie Creek’s confluence with the Humboldt River is the town of Carlin,now primarily a mining community and transportation hub servicing the needs of many of the gold-producing mines in this area. Despite its seemingly strategic location, due to Carlin’s limitedinfrastructure and few available services, most of the region’s miners and their families still reside inElko, some 25 miles away. As a result, while Carlin showed a population of just over 3,100 personsin 1998, Elko’s resident population was more than twelve times greater at nearly 38,000 persons,35
evidencing a significantly larger and more diverse economy. Nearly five miles downstream fromCarlin, the Humboldt River flows out of Elko County and into Eureka County. Another four milesdownstream from the county boundary, the Humboldt River’s flow is recorded at the USGS Palisadegaging station. This location marks the official end of the upper Humboldt River Basin. The totalriver distance along this portion of the upper Humboldt River from Wells to Palisade is approximately92 miles.
The Lower Humboldt River Basin
Below Palisade, the lower Humboldt River Basin consists of six principal defined sub-basins – PineValley, Reese River Valley, Battle Mountain, Little Humboldt River, Sonoma Reach, and theLovelock Reach – which may be further sub-divided into 22 hydrographic areas and one hydrographicsub-area. The lower basin’s total surface area of approximately 11,800 square miles includes themajor mountain ranges of the Toiyabe Mountains and the Shoshone Mountains south of theHumboldt River, and the Santa Rosa Range north of the river.
The lower Humboldt River is more than twice as long as the upper river’s reach and typically reflectsa gradual decline in the river’s flow and a deterioration in water quality from Palisade downstreamto the Humboldt Sink. Historically, this portion of the Humboldt River’s route constituted the mostarduous part of the entire river’s passage by early California emigrants traveling by wagon train.

DIVISION OF WATER PLANNING Humboldt River Chronology—Part I
Nevada Water Basin Information and Chronology Series I–11
Along this stretch these early travelers were forced to bypass the narrow Palisade Canyon and travelover steep and tortuous hills to the north and south of the Humboldt River. Throughout much of thelower Humboldt River Valley, these early pioneers were confronted with a myriad of impediments,including the stifling heat of late summer, a lack of good water, scarcity of feed for livestock, swarmsof mosquitos arising from stagnant pools and wetlands, a monotonous landscape, and deep andchoking dust from the passage of hundreds of wagons before. During normal water years, fromPalisade downstream the flow in the Humboldt River gradually declines as few of the lower basin’sprincipal tributary streams and drainage areas (i.e., Reese River sub-basin and Little Humboldt Riversub-basin, in particular) provide any surface water runoff to the river.
Less than one mile below the Palisade gage Pine Creek enters the Humboldt River from the south,draining an area of approximately 1,000 square miles. Pine Creek and its upstream tributary,Henderson Creek, extend some 64 miles up into Pine Valley and then through Garden Valley to thebase of Roberts Creek Mountain (10,133 feet MSL) in the Roberts Mountains. Stretching south fromthe Humboldt River, the relatively narrow lower portion of Pine Valley soon opens into a broad valleycontaining over 3,500 acres of decreed crop and pasture lands. From its confluence with Pine Creek,the Humboldt River continues through the remainder of the relatively narrow 24-mile long PalisadeCanyon. Eight miles below the outflow of Pine Creek, the Humboldt River enters into a broad, openvalley basin. This typically wider and more gently-sloping river bed configuration characterizes theHumboldt River Valley for the remainder of the river’s length. The relatively flat river bed alsopromotes the river’s increased sinuosity through this lower reach. This tendency for the HumboldtRiver to meander excessively sometimes adds several miles to the river’s twisting length for each milethe river traverses downstream.
Twenty-seven miles downstream from the river’s confluence with the Pine Creek, the Humboldt Rivercrosses out of Eureka County and into Lander County, and 19 miles below this point the river reachesthe town of Battle Mountain. To the south of Battle Mountain lies the Reese River Valley, throughwhich the Reese River extends some 150 miles to the south and encompasses a drainage area of over3,600 square miles. The Reese River Valley is by far the largest sub-basin drainage area within theentire Humboldt River Basin. In draining this vast expanse of central Nevada, the Reese River beginson the slopes of Arc Dome in the Toiyabe Mountains in Nye County, draining some 34 miles ofnorthern Nye County and running nearly the entire length of Lander County before it intersects withthe Humboldt River . Despite the size of this drainage area, seldom can a trace of the waters of theReese River be found near Battle Mountain. Normally stopping short of the Humboldt River by 10to 20 miles, only the floodwaters of the Reese River ever reach the Humboldt River main stem.
Approximately nine miles below Battle Mountain, the Humboldt River exits Lander County andenters Humboldt County, and after another 21 miles the river reaches Red House. This location isof significance as it represents the highest point along the Humboldt River ever reached by Ice AgeLake Lahontan during the Wisconsin Age of late Pleistocene Epoch some 12,000 years ago. Thirtymiles downstream from Red House, the Humboldt River comes to the location where the LittleHumboldt River infrequently enters the Humboldt River main stem. This flood-flow tributary to theHumboldt River main stem drains Paradise Valley to the north and, above that valley, an extensivearea extending north almost to the Idaho state border. Approximately 48 miles upstream fromWinnemucca and 44 miles up the Little Humboldt River from the Humboldt River main stem is

Humboldt River Chronology—Part I DIVISION OF WATER PLANNING
I–12 Nevada Water Basin Information and Chronology Series
located Chimney Reservoir, situated at the confluence of the Little Humboldt River’s North andSouth forks. This reservoir has a storage capacity of 35,000 acre-feet and was constructed in 1974by the Nevada Garvey Ranches. The reservoir’s water rights are owned by Garvey Ranches and theHumboldt County Fair and Recreation Board with the waters used for both irrigation and recreation.
Like the Reese River, outflows from the Little Humboldt River only reach the Humboldt River mainstem during severe storm and flood events. The total drainage area of the Little Humboldt River isnearly 1,750 square miles. The Little Humboldt River drainage stretches first some 45 miles up theLittle Humboldt River and then an additional 40 miles up the Little Humboldt River’s North Fork intothe northern portion of the Santa Rosa Range. Approximately six miles up the Little HumboldtRiver’s generally dry streambed from the Humboldt River’s main stem is located a unique landformcalled the Sand Dunes. This river impediment causes the Little Humboldt River’s floodwaters to firstform Gumboot Lake at the lower or southern end of Paradise Valley. During extreme flood events,the lake’s waters eventually rise to the point where they manage to breach this sand dune formationand enter the Humboldt River with considerable force, but this occurs only rarely.
Four miles below the point where the floodwaters of the Little Humboldt River enter the river’s mainstem is located the City of Winnemucca, the largest city in Humboldt County and the second largestcity after Elko within the Humboldt River Basin, with a population of 8,800 persons in 1998.36
Winnemucca played an important role in the region’s agricultural expansion during the 1870’s and1880’s. Since then the city has become a major transportation hub and regional mining community.Seventeen miles below Winnemucca, the Humboldt River leaves Humboldt County and entersPershing County. Pershing County contains the largest storage reservoir in the Humboldt River Basin– Rye Patch Reservoir – whose waters irrigate the fertile Lovelock Valley agricultural area. TheHumboldt River’s entire reach from Winnemucca to the upper portion of Rye Patch Reservoir coversa distance of 44 miles and presented an especially disagreeable stretch to early emigrants travelingby wagon train. This portion of the California Overland Emigrant Trail caused some of the greatesthardships to these early travelers due to dust, poor water quality, scant forage for livestock and milesof similar landscape.
The waters of the upper portion of Rye Patch Reservoir, which was constructed in 1936, now coveran area formerly called Lassen or Rye Patch Meadows. Here early wagon trains separated, with someearly travelers taking the Applegate-Lassen cutoff towards the Black Rock Desert and thence tonorthern California and southern Oregon beyond. Other emigrants continued down the HumboldtRiver with the knowledge that the ominous Forty-Mile Desert awaited them just beyond theHumboldt Sink. To the weary emigrants, this area of Lassen Meadows represented the firstreasonable grazing for livestock since Winnemucca, and the last decent forage for another 45 milesuntil they reached Big (or Great) Meadows located in the lower Lovelock Valley.
From Lassen Meadows, the Humboldt River’s course extends some 19 miles through the bottom ofRye Patch Reservoir which, when filled to capacity, holds approximately 194,300 acre-feet of waterfor irrigating over 38,000 acres of water-righted crop and pasture lands in Lovelock Valley. RyePatch Reservoir has proven to be of vital importance to lower basin Lovelock Valley farmers. Dueto the highly variable flows in the Humboldt River and extensive upstream diversions, prior to thereservoir’s construction dependable water supplies in the lower basin proved to be very uncertain.

DIVISION OF WATER PLANNING Humboldt River Chronology—Part I
Nevada Water Basin Information and Chronology Series I–13
Rye Patch Reservoir, along with its dedicated water rights transferred from upstream lands nearBattle Mountain, has provided a crucial storage facility for downstream users. By means of anextensive conveyance and delivery system, water stored in Rye Patch Reservoir has helped to satisfythe irrigation requirements of Lovelock Valley’s farmers over highly variable climatic conditions.From the Rye Patch Reservoir’s dam, the Humboldt River flows another 26 miles, mostly throughdiversion structures, canals and irrigation and drainage ditches to the town of Lovelock and beyond.
From Lassen Meadows and the present-day location of Rye Patch Reservoir, the early emigrantsfaced another challenging 45 miles to the lush grasslands in Big Meadows located in the lowerLovelock Valley. But this section was not nearly as hard on the emigrants and their livestock as theWinnemucca to Lassen Meadows reach, since water and grasses were typically more plentiful andof better quality through Lovelock Valley. At Big Meadows, early emigrants rested their livestock,and themselves, in anticipation of the extreme hardships forthcoming in crossing the Humboldt Sinkand the Forty-Mile Desert before reaching the waters of the lower Carson River.
In high water years, the Humboldt River flows another twelve miles from Lovelock to Toulon Lakeand Humboldt Lake, which are connected to the river’s main stem by the Toulon Drain and the ArmyDrain, respectively. Some six miles beyond these “Humboldt Lakes” lies the Humboldt Sink, whereevaporation consumes virtually the entire amount of remaining river flows. The Humboldt River’sterminus actually lies in Churchill County and marks the furthermost extent of the Humboldt Riversystem. During extreme flood periods (e.g., most recently, 1983, 1984 and 1997), the HumboldtRiver may even extend beyond the Humboldt Sink, following the course of the Humboldt Drain andHumboldt Slough to the Carson Sink, located some eights miles further to the south and lyingapproximately 20 feet lower than the Humboldt Sink.37 During these relatively infrequent floodperiods, a hydrologic link is formed between the Humboldt River and Carson River watersheds.
In all, the river’s course through the lower Humboldt River Basin from Palisade to the Humboldt Sinkcovers approximately 218 miles. When combined with the river’s length through the upper HumboldtRiver Basin from Wells to Palisade, a distance of 92 miles, the Humboldt River flows a total distanceof about 310 miles from beginning to end. Although the reader has now covered the HumboldtRiver’s entire length in just a matter of minutes, during the wagon train era of the early 1840s’s tothe late 1860s’s, those who traversed the Humboldt River Basin typically took as much as a monthto complete the entire trip. For those of us today who attempt to document and come to betterunderstand the Humboldt River Basin’s important natural and man-made features, and reconstructthe basin’s historical conditions and the impressions of its earliest travelers, we owe a debt ofgratitude to the many records left behind by these determined and pioneering people.
Humboldt River Basin Principal Water-Related Issues
Overview
A number of water-related issues presently affect the Humboldt River Basin. This section providesa brief summary of major water-related issues and explores some of the relevant aspects of each.Arguably, the most important of these issues include:

Humboldt River Chronology—Part I DIVISION OF WATER PLANNING
I–14 Nevada Water Basin Information and Chronology Series
(1) variable climate and uncertain stream flows and the relatively small amount of overall waterstorage capacity within the basin for irrigation, recreation, fisheries, instream flows, etc.;
(2) out-of-basin and interbasin, water transfers due to more rapid growth and greater water needsin other parts of the state;
(3) open-range grazing and its effects on the basin’s native vegetation, ecological balance,invasive grass species like cheatgrass, erosion, flooding and wildfires;
(4) mine dewatering and mine pit lake formation, and their potential near-term and long-termeffects on groundwater levels and surface-water flows;
(5) habitat restoration of the native Lahontan cutthroat trout which, at one time, thrivedthroughout much of the northern and western portions of the Great Basin and the entireHumboldt River Basin; and
(6) the restoration of the Argenta Marsh in part of the area known as the “Community Pasture”located between Argenta and Battle Mountain.
Some of the Humboldt River’s water-related issues are more or less common to other waterbasinsin northern Nevada, for example, variable precipitation, limited water storage capacity, the growingcontroversy over interbasin or intercounty water transfers and the habitat conditions of the threatenedLahontan cutthroat trout. Other issues are more specific to conditions existing within the HumboldtRiver Basin, for example, rangeland grazing, cheatgrass invasion, rangeland wildfires and minedewatering. Most of these issues are covered, to varying degrees, in other sections of Part I of thischronology and therefore will be presented only briefly here.
Variable Climate and Stream Flows, and Limited Water Storage Facilities
The Humboldt River Basin is subject to highly variable climatic conditions. Trends in annualsnowpack water content measures are more extensively analyzed in a following section (“HumboldtRiver Basin Snowpack Water Content Analysis”). Here the focus is on the resultant hydrologicconditions caused by the region’s highly variable climate and runoff conditions. Like other majorwaterbasins and river systems of northern Nevada, the majority of the precipitation within theHumboldt River Basin occurs during the winter months, typically from November through March orApril. Typically, precipitation comes in the form of rain at the lower elevations and snow in the upperelevations. As a consequence, the most significant water storage ‘facility’ within these basins consistsof the water content within the snowpack that is accumulated in the upper elevation watersheds. Itis the release of the snowpack’s water over time which provides the surface water runoff to rechargegroundwater aquifers and contribute to stream flows.
In terms of variability of Humboldt River flows, Table 2, Northern Nevada Principal River FlowVariation Analysis, presents one, albeit a relatively superficial, measure of stream flow variabilityamong the major water basins of northern Nevada. In this analysis, the “High-Low Difference(Ratio)” measure for each river system shows the difference between the record high (flood) yearflow and the record low (drought) year flow. [Note: all stream flow measures presented in this tableare taken at USGS gaging station locations representing the maximum point of flow during averagewater years; flows accrete above these locations and attenuate below them.]

DIVISION OF WATER PLANNING Humboldt River Chronology—Part I
Nevada Water Basin Information and Chronology Series I–15
Table 2 – Northern Nevada Principal River Flow Variation Analysis†Average Annual, Low and High Water Year Runoff Volumes in Acre-Feet per Year[High Flow/Low Flow Ratio – Times]‡ (Percent Change from Average Water Year)*
By Basin and USGS Gaging StationLocation – (Listed by Gaging StationNumber – See notes)
Average†Water Year(see notes)
Low†Water Year(see notes)
High†Water
Year(see notes)
High-LowDifference
(Ratio)‡
Humboldt River (at Palisade)(Gaging Station 10322500)1
291,040 25,190(-91.3%)*
1,336,450(359.2%)*
[ 53.0 ]‡
Truckee River (at Vista below Steamboat)(Gaging Station 10350000)2
600,170 114,390(-80.9%)
2,016,980(236.1%)
[ 17.6 ]
Carson River (near Carson City)(Gaging Station 10311000)3
301,170 42,350(-85.9%)
826,770(174.5%)
[ 19.5 ]
East Walker River (near Bridgeport, CA)(Gaging Station 10293000)4
107,150 27,150(-74.7%)
320,720(199.3%)
[ 11.8 ]
West Walker River (near Coleville, CA)(Gaging Station 10296500)5
203,440 53,940(-73.5%)
484,340(138.1%)
[ 9.0 ]
† Average water year, low water year and high water year flows are measured at the U.S. Geological Survey (USGS) gaging stationwhere each respective river flow is at a maximum under average water year flows, i.e., river flows accrete (increase) up to this pointand attenuate (decrease) after this point.‡ Bracketed bold figures represent the ratio (in times) of the high water year flow to the low water year flow as an indication of riverflow variability from record year high flow to record year low flow.* Figures in parentheses represent the low and high water year percent differences from the flow volume of the average water year,showing the range of variability of flows for these respective river systems.Gaging Station Period of Record Notes:1 For years of record 1903–1998; High water year: 1984; Low water year: 1934.2 For years of record 1900–1998; High water year: 1983; Low water year: 1992.3 For years of record 1940–1998; High water year: 1983; Low water year: 1977.4 For years of record 1922-1998; High water year: 1983; Low water year: 1931.5 For years of record 1903-1998; High water year: 1907; Low water year: 1977.Source Data: Water Resources Data, Nevada, Water Year 1998, U.S. Geological Survey Water-Data Report NV–98–1, NevadaDistrict Office, Water Resources Division, U.S. Geological Survey, U.S. Department of the Interior, Carson City, Nevada, 1999.
In addition to the climatologic differences between the watersheds of northern Nevada, some portionof the higher variability of the Humboldt River’s flows using this simple ratio method may beexplained by the relative differences in these water basins’ agricultural conditions and practices. Oneprincipal factor affecting the low-flow figures in these northern Nevada river systems may well be therelatively greater degree of irrigation water diversions and withdrawals based on differences inirrigated acreage above Palisade on the Humboldt River as compared to the principal river systemsof western Nevada.38 During low water years, the relatively more intensive upstream irrigationdiversions tend to result in lower river flows downstream (at Palisade) as more water is usedconsumptively (i.e., without appreciable return flows) on upper basin irrigated lands.
Without question, compared to other watersheds in northern Nevada, there exists a relative scarcityof significant water storage facilities within the Humboldt River system, especially given the basin’soverall surface area and intensive uses, primarily agriculture. This means that water users, particularlyirrigators, are dependent to a large extent on natural surface water flows. They depend on weatherand snowpack conditions favorable to creating sufficient snowpack storage and conducive toextending the release and runoff from these mountain “reservoirs” for as long as possible. However,

Humboldt River Chronology—Part I DIVISION OF WATER PLANNING
I–16 Nevada Water Basin Information and Chronology Series
most of the smaller stream systems within the Humboldt River Basin experience relatively rapidrunoff, a condition referred to as “flash flows”, in the spring and early summer, with surface waterflows essentially exhausted by May or June. Without the ability to effectively store and betterregulate this runoff, the irrigation season along these “flash” stream systems is more limited, reducingagricultural activities and production.
A number of water storage facilities exist within the Humboldt River Basin and a number of otherreservoir sites have been proposed. Even so, there are no storage facilities located above Rye PatchReservoir in the lower basin. Those reservoirs currently existing are presented in a later section(“Principal Storage Facilities of the Humboldt River Basin”). Table 3, Humboldt River BasinProposed Dam and Reservoir Sites, lists those proposed reservoir sites which were either listed forfurther study by the U.S. Army Corps of Engineers or Bureau of Reclamation, or which were, atsome point in time, recommended for construction within the designated sub-basins and on thespecified stream systems.
Most of the proposed reservoir sites in Table 3 have proven to be uneconomical, meaning that thecost of construction is generally not sufficiently covered by potential economic benefits either in termsof project economic returns or by the anticipated avoided costs due to potential flood damagemitigation savings. Some reservoir sites listed in Table 3 have been developed at or near theirrecommended locations. For example, the South Fork Reservoir is located at the old proposedHylton dam site on the South Fork Humboldt River, and the Chimney Reservoir is located near themerger of the North and South forks of the Little Humboldt River. In addition, the intermittentnature of some of these stream systems may not provide sufficient water to maintain a reservoir atsome of these sites.
Figures 5 and 6 on the facing page show the Humboldt River’s flow variations on both an annualbasis over the years 1900 through 1998 and on a monthly basis for a “normal” water year (October1 through September 20). Specifically, Figure 5, Humboldt River Annual Flows at Palisade, showsthe variations in river flows for the entire period of record for the USGS Palisade gage. Due tolimited upstream storage above this location, these flows are essentially unregulated. Figure 6,Humboldt River Monthly Average Flows at Palisade shows similar variation of flows at the Palisadegage for each month based on an average or normal water year. Also noted on this graph are thepercent of average annual flows which occur during each month. From this information, we can seethat nearly 77 percent of an average year’s discharge occurs during the four months of March, April,May and June.

DIVISION OF WATER PLANNING Humboldt River Chronology—Part I
Nevada Water Basin Information and Chronology Series I–17
Figure 5 – Humboldt River Annual Flows at Palisade – 1900-1998
Figure 6 – Humboldt River Average Monthly Flows at Palisade
Table 3 – Humboldt River Basin Proposed Dam and Reservoir Sites

Humboldt River Chronology—Part I DIVISION OF WATER PLANNING
I–18 Nevada Water Basin Information and Chronology Series
Principal Dam and Reservoir Sites Surveyed for the Humboldt River Basin
Dam/ReservoirEstimated Size
(Acre-Feet)Humboldt River
Sub-Basin† Reservoir Approximate LocationMary’s River Dam Site 7,000-10,000 Mary’s River Mary’s River just below the confluence
with Meadow Creek, approximately 36miles from Humboldt River.
Vista Dam Site 50,000 Mary’s River Mary’s River nearly 24 miles upstreamfrom Humboldt River and just above HotSprings Creek
Hylton Dam Site 120,000 Ruby Mountains South Fork below the mouth of TenmileCreek (near present site of South ForkReservoir)
Devil’s Gate Dam Site 80,000 North ForkHumboldt River
North Fork, just over 26 miles upstreamfrom Humboldt River main stem
Pie Creek Dam Site 4,000 North ForkHumboldt River
North Fork, just over three miles belowconfluence with Pie Creek
Maggie Creek UpperDam Site
4,000 Maggie Creek Maggie Creek at upper narrows, 26 milesabove Humboldt River and one mile belowconfluence with Beaver Creek
Maggie Creek LowerDam Site
5,000 Maggie Creek Maggie Creek at lower narrows, 10 milesabove Humboldt River and two miles belowconfluence with Simon Creek
Susie Creek Dam Site 6,500 Maggie Creek Susie Creek just over six miles aboveHumboldt River main stem
Rock Creek Dam Site 80,000 Rock Creek Rock Creek at its exit from the SheepCreek Range and just up from the USGSgaging station
Greeley Flat Dam Site 12,500 Little HumboldtRiver
North Fork, approximately 24 milesupstream from confluence with South Fork
Latons Spring Dam Site 10,800 Little HumboldtRiver
South Fork, nine miles above confluence ofSouth and North Forks
Hot Spring Dam Site 20,000‡ Little HumboldtRiver
Little Humboldt River at USGS LittleHumboldt River gage five miles upstreamfrom Paradise Valley
Hardscrabble Dam Site 12,500‡ Little HumboldtRiver
Martin Creek approximately eight milesupstream from northern Paradise Valley
Sugarloaf Dam Site 20,000 Little HumboldtRiver
Martin Creek at USGS Martin Creekgaging site approximately two miles upfrom northern end of Paradise Valley
† For a detailed explanation and listing of the Humboldt River Basin’s defined sub-basins, see the section “Humboldt River Sub-Basin Analysis.” ‡ Estimated storage capacity.Source Data: Humboldt River Basin, Nevada, Water and Related Land Resources, Nevada Department of Conservation and NaturalResources and the U.S. Department of Agriculture, 1962-1966, and “Rock Creek Reservoir – Preliminary Proposal,” Prepared byChilton Engineering for the Rock Creek Recreational Use and Management Board (A Bi-County Agency of Eureka and LanderCounties), Elko, Nevada, February 1979.

DIVISION OF WATER PLANNING Humboldt River Chronology—Part I
Nevada Water Basin Information and Chronology Series I–19
Out-of-Basin or Interbasin Water Transfers
[Note: The concept of interbasin or intercounty water transfers is covered more extensively in the Nevada StateWater Plan, 1999, Part 3 – Water Planning and Management Issues, Section 1 – Water Supply and Allocation,Interbasin and Intercounty Transfers. The following information summarizes some of the material presentedin that issue paper.]39
In addition to being the driest state in the Union based on average annual precipitation, Nevada is alsoone of the fastest growing states and one of the most urbanized states. Unfortunately, most of thestate’s available water resources are not located near its rapidly expanding population areas. Becauseof the limited options available in moving businesses, industries, jobs and people to water, interbasinand intercounty transfers of both surface and ground waters are likely to become more important inmeeting future water needs than in the past. Growing urban areas are continually looking toappropriate new water rights or purchase existing water rights and transfer them to new places of use,frequently in a different basin or county. As Nevada’s most rapid economic growth and developmenthas occurred in its principal population centers of Las Vegas (Clark County) and Reno (WashoeCounty), some have considered that the water resources of the Humboldt River Basin, especiallywater used for irrigation, might satisfy out-of-basin urban growth. However, any analysis of thepotential for future water transfers out of the basin must take into account the use of those watersby the basin’s critical agricultural industry and the concerns that interbasin transfers could severelyrestrict future economic growth and development in the basin-of-origin.
Nevada Revised Statutes (NRS) 533 and 534 provide basic criteria for evaluating all waterappropriations or changes of water rights, including interbasin and intercounty transfers. Over thelast several legislative sessions, Nevada has considered a number of ways to ensure that interbasintransfers do not cause undue economic or environmental harm, especially to its rural counties whereconsiderable water resources exist relative to these counties’ populations. Senate Bill 108, passedby the 1999 Nevada Legislature, now requires the State Engineer to evaluate whether an interbasintransfer is truly needed, whether an applicant for such a transfer needs a water conservation plan andsuch a plan is being implemented, whether the transfer is environmentally sound, and whether theproposed transfer will unduly limit future growth and development in the area of origin, among otherfactors.40
Focus groups conducted in the early 1990’s41 found Nevadans’ views on interbasin water transfersranged from allowing them under the efficiency of free-market conditions to a more “AntediluvianPolicy” which promotes development policies based primarily on an area’s natural ability to supportpopulation and economic growth only through existing, readily available natural resources,particularly water. Due to the inherent importance of water to the very survival of a region, itspeople, ecology and environment, the mere proposal of an interbasin or intercounty water transferis controversial and understandably draws strong public reactions. Realistically, such transfers inNevada have been taking place since the early 1860’s and the Comstock mining era. Based on acontinued geographic imbalance between water demands and water supplies in Nevada, this issue islikely to continue to rank high in a listing of importance and sensitivity. Any resolution to this issuemust attempt to judiciously balance the rights of current water-right owners with the alternativebeneficial uses to which that water can be applied.

Humboldt River Chronology—Part I DIVISION OF WATER PLANNING
I–20 Nevada Water Basin Information and Chronology Series
Rangeland Grazing
The rangeland grazing issues are more extensively covered in two other sections in Part I, one sectiondealing with the importance of agriculture to the Humboldt River Basin (“Agriculture and ItsImportance to the Humboldt River Basin”) and another section dealing more specifically with theeffects of open-range grazing (“Livestock Grazing, Cheatgrass, Rangeland Wildfires, and Flooding”).Together, these sections review the growth of the agricultural industry within the Humboldt RiverBasin and the conditions which led to impacts on the basin’s fragile native grasses and contributedto the dominance in many areas of less-desirable invasive plant species.
During agriculture’s rapid development in the Humboldt River Basin during the 1870’s and 1880’s,open-range livestock grazing reached virtually every lowland meadow and upland watershed. By theearly 1900’s, a recognition of the grazing effects on vegetation depletion and subsequent enhancederosion within the upper watersheds led to the inclusion of a number of these mountainous headwaterareas into the national forest system. For example, during this period the Forest Service incorporatedportions of the Ruby Mountains, Jarbidge Mountains, Independence Mountains and the Santa RosaRange into the Humboldt National Forest, while the upper watershed area of the Reese River Valleywas included in the Toiyabe National Forest. While livestock grazing in the basin has continued tothe present day, improved rangeland conditions have generally resulted from less intensive grazingoperations as the result of better management programs.
Cheatgrass
The issue of the effects of cheatgrass on the Humboldt River Basin is covered far more extensivelyin two subsequent sub-sections in Part I, “Livestock Grazing, Cheatgrass, Rangeland Wildfires, andFlooding”. These sub-sections include “The Cheatgrass ‘Invasion’ ” and “Rangeland Grazing,Cheatgrass, Fires and Flooding”.
It has been primarily the lowland areas of the Humboldt River Basin which have experienced thegreatest invasion of the annual exotic species of cheatgrass. As a forage plant, cheatgrass has onlylimited grazing use by livestock and tends to quickly crowd out other, more desirable forage grasseswhich do not demonstrate the flammability, fire recovery, early germination and rapid growth ofcheatgrass. The “choking” effect of cheatgrass effectively turns diverse grassland landscapes intocheatgrass monocultures making these areas highly susceptible to the repetition of wildfires. Studieson the effects of fire on native and invasive grasses have shown that repeated burning will tend todeplete perennial native grasses and allow annual grasses, primarily cheatgrass, to increase itscoverage dramatically.
Once portions of the basin’s sagebrush-grassland plant community are depleted of its perennial grasscover, as in a wildfire, a secondary succession begins which eventually results in the dominance ofcheatgrass within only a few years. The effects of open-range livestock grazing on increasing theseverity of flooding and wildfires arguably constitute the most substantive changes to the HumboldtRiver Basin’s ecological balance. In this regard, the basin has proven to be a relatively fragileecosystem subject to pressures that human activities have placed upon it.

DIVISION OF WATER PLANNING Humboldt River Chronology—Part I
Nevada Water Basin Information and Chronology Series I–21
Hydrologic Effects of Mine Dewatering
The topic of mine dewatering is presented in more detail in its own section of this overview (“Miningand Mine Dewatering in the Humboldt River Basin”). The mine dewatering section also includesvarious information on the mining industry’s effects on early settlement patterns, the boom-bustnature of early Nevada mining activities, the era of modern gold mining in Nevada, and the conceptof mine dewatering and its effects on local groundwater conditions and on surface water bodies,including the Humboldt River. Within the Humboldt River Basin, a number of surface miningoperations have resulted in large, open pits. Many of these mine pits have extended below localgroundwater levels and therefore require dewatering or the pumping out of groundwater to accessthe ore. After removal, the groundwater must be disposed of through reuse (for example to growalfalfa), surface water discharge, re-injection, or infiltration.
Open pit mine dewatering operations typically consist of perimeter wells to intercept groundwaterflows into the pit and thereby allow for access to and extraction of the ore bodies. Mine dewateringeffectively creates a “cone of depression” near the groundwater extraction points, drawing down thegroundwater table. This cone of depression may have incidental effects on the surface water flowsof nearby springs, streams or other surface water bodies which are dependent on groundwater flowsor recharge. Mine dewatering applies to both surface mining as well as underground mining.
The State of Nevada has recognized the potential effects that these open-pit mining operations mayhave on the region’s hydrologic conditions. As a result, the State Engineer has established amitigation process of preferred uses for the pumped groundwater from these surface miningoperations. To every extent possible, this process attempts to either minimize or localize the effectsof dewatering, or allow the water to substitute for other existing groundwater withdrawals. Theeffects and concerns over mine dewatering fall into two distinct time periods: (1) the short-termeffects which are expected to occur during active mine dewatering operations; and (2) the long-termeffects anticipated when dewatering operations have ceased, the mine pits begin to fill, and theresultant pit lakes reestablish equilibrium with the local groundwater table. The short-term effectsdeal primarily with issues related to the disposal of the pumped groundwater, including quantity,quality and water temperature.
The long-term effects of mine dewatering operations are less well known, and thus have resulted inextensive study, research, analysis and, certainly, controversy. The major long-term issues dealprimarily with:
(1) effects on local groundwater conditions during and after filling;
(2) effects of evaporation on both pit lake levels and the surrounding groundwater conditions;
(3) quality of water flowing into the pits as well as the overall quality of the water within the pit lakes based on interaction with ore bodies;
(4) effects on local springs and creeks and other surface waters during and after filling; and
(5) long-term effects on the flows in the Humboldt River main stem from changes in groundwater conditions and possible changes in tributary flows.
Habit Restoration for the Native Lahontan Cutthroat Trout

Humboldt River Chronology—Part I DIVISION OF WATER PLANNING
I–22 Nevada Water Basin Information and Chronology Series
The Lahontan cutthroat trout (Oncorhynchus clarki henshawi) is an inland subspecies of cutthroattrout endemic to the physiographic Lahontan Basin42 of northern Nevada, eastern California, andsouthern Oregon. In 1970 the U.S. Fish and Wildlife Service (USFWS) listed the Lahontan cutthroattrout (LCT) as “endangered”. In 1975 it reclassified it as “threatened” to facilitate management andallow regulated angling. There is no designated critical habitat for LCT and the species has beenintroduced into habitats outside its native range. Based on geographical, ecological, behavioral, andgenetic factors, the USFWS has determined that three vertebrate population segments of LCT exist:(1) Western Lahontan Basin comprised of the Truckee, Carson, and Walker River basins; (2)Northwestern Lahontan Basin comprised of Quinn River, Black Rock Desert and Coyote LakeBasins; and (3) Humboldt River Basin. The evolution of these cutthroat trout subspecies has takenplace since the last highstand of Lake Lahontan some 12,000 years ago when all the seven sub-basinscomprising that Ice Age lake were connected for the last time. Genetic and morphometricdifferentiation of LCT has suggested that cutthroat trout native to the Humboldt River Basin warrantformal recognition and classification as a unique subspecies of cutthroat trout.43
At one time, due to the interconnection of the rivers and major lakes within the Lahontan Basin, LCTranged throughout much of the Great Basin, particularly throughout the Humboldt River Basin ofnorth-central Nevada, the Truckee, Carson, Walker and Susan River basins of western Nevada andeastern California, and the Black Rock/Quinn, Alvord and Coyote Lake basins of northern Nevadaand southern Oregon. At present, however, LCT exist in only about ten percent of its historic streamhabitat and in less than one percent of its historic lake habitat. Within the Humboldt River Basin,cutthroat trout populations are restricted to the uppermost reaches of a number of principal tributarystreams to the Humboldt River including the upper Humboldt River (East Fork) above LamoilleCreek, Mary’s River, South Fork Humboldt River, North Fork Humboldt River, Maggie Creek andRock Creek. In addition, cutthroat trout populations also exist in the upper reaches of the ReeseRiver and portions of the Little Humboldt River, both of which do not normally connect to theHumboldt River main stem.44
For thousands of years before the arrival of European explorers and settlers LCT served as animportant and plentiful food source throughout Nevada’s waters for Northern Paiute, Shoshone andWashoe native American Indian tribes. On January 10, 1844, John C. Frémont’s first expedition intothe Great Basin arrived at Pyramid Lake in the Truckee River Basin and enjoyed the hospitality ofthe local Paiute Indians and the munificence of the local waters which teemed with an “incrediblylarge” Pyramid Lake sub-species of LCT. Some of these fish reportedly weighed well over 40 poundsand attained a length of up to four feet.45 In his diary and record of his travels, Frémont commentedthat “Their flavor was excellent – superior, in fact, to that of any fish I have ever known. They wereof extraordinary size – about as large as the Columbia River salmon – generally from two to four feetin length.”46 Within one hundred years, due to a combination of over-fishing, pollution, riverimpediments preventing upstream spawning, river diversions and the introduction of exotic, moreaggressive and even predatory fish species, this once-plentiful sub-species of LCT became extinct,and other populations of cutthroat trout in other river systems were either extirpated47 or severelyrestricted in their habitat.
Throughout the LCT’s rapidly dwindling habitat, and particularly within the Humboldt River Basin,the pressures on the species were only slightly less intense than those experienced in Pyramid Lake

DIVISION OF WATER PLANNING Humboldt River Chronology—Part I
Nevada Water Basin Information and Chronology Series I–23
and the Truckee River Basin. Even as early as 1870, it was evident that the native trout species wereexperiencing severe threats to its survival. Reporting on the rapid demise of fish stocks due to over-fishing, on October 19, 1870, the Elko Independent called for greater restraint: “Last season theabundance of fine trout in this portion of the Humboldt [River] furnished the followers of Isaac[Izaak] Walton48 with rare sport, as well as the private table with many a savory meal. Now, thereare scarcely any fish to be found. During the summer, Indians, Chinamen with queues, and Chinamenwithout queues, have slaughtered them with nets, traps, seines, poison, by draining portions of theriver,49 and by the murderous use of giant powder [explosives]. The result has been the destroyingof small trout and spawn and driving the larger fish to more peaceable waters…”50 Elsewhere in theHumboldt River Basin the situation was similar and typified human activities prevalent throughoutthe cutthroat trout’s habitat. Leaving little wonder why fish stocks began disappearing from theReese River and its tributaries, the Reese River Reveille (Austin) reported on July 16, 1870 that “Aparty of the disciples of Izaak Walton returned to town at an early hour this morning bringing a largecatch – upwards of five hundred – of the speckled beauties with them, which were disposed of amongtheir friends…The fishing grounds were near the head waters of the Reese River, in the vicinity ofMount O’Leary51 – a high mountain peak in the Toiyabe Range, christened by the party in honor ofone of their number…”52
While too late to save the Pyramid Lake sub-species of LCT from extinction, cooperative efforts toimprove the status of the cutthroat species in Nevada were begun in the 1940’s with the salvage ofa few large spawning fish from Walker Lake during their last runs up the Walker River. Since 1963,LCT have been transplanted into more than 50 streams throughout the region. Surveys have beenundertaken to identify pure populations of the species and evaluate habitat conditions throughouttheir former range. As early as 1969, habitat improvement projects and livestock grazing exclosureswere initiated and land use practices identified specifically to help in recovering the trout and theirformer habitat.
One of the first and most dramatic projects to restore LCT habitat took place in the LahontanCutthroat Trout Natural Area located in the Black Rock Range in northwest Nevada. Portions ofMahogany Creek were fenced to exclude grazing livestock. The results were nothing less thanremarkable. By the 1970’s, after many years of open-range grazing, Mahogany Creek had degradedinto a wide and shallow spillway and virtually all adjacent vegetation had been removed by grazinglivestock. In just three years after the removal of the livestock, however, the riparian conditionsshowed significant recovery with the streambanks lush and stabilized with native grasses and shrubsand the creek narrowing and deepening its channel, thereby creating far more promising conditionsfor the LCT.53 Today, a number of such restoration projects are being undertaken within theLahontan cutthroat trout’s native habitat to significantly improve these area’s riparian and aquatichabitats. A key factor in these efforts lies in the modification of past management practices andworking in close cooperation and harmony with a number of diverse stakeholders. In addition to theevident benefits to the surviving populations of native LCT, these partnerships are also improvingwater quality and water quantity, providing better flood protection, and increasing the opportunitiesfor recreation.54
The Argenta Marsh

Humboldt River Chronology—Part I DIVISION OF WATER PLANNING
I–24 Nevada Water Basin Information and Chronology Series
The Argenta Marsh, formerly referred to as the Tule Swamps, the Lakes, Big Slough and the ArgentaSwamp, was an extensive riparian and wetland area totaling an estimated 12,000 to 15,000 acreslocated throughout a considerable portion of the Humboldt River’s floodplain between Argenta andBattle Mountain.55 Until it was drained and the Humboldt River channelized through the area in1950’s by the U.S. Army Corps of Engineers, acting in cooperation with the U.S. Bureau ofReclamation (BOR), this area represented one of the most productive and naturally-protected wildlifehabitats along the entire Humboldt River system. Its open waters, direct connections to theHumboldt River’s main and south channels, the region’s labyrinth of sloughs, swamps and braidedand abandoned river channels, thick expanses of tules and dense stands of tall willows formed aninvaluable and virtually inaccessible wetland refuge for a wide variety of wildlife.
The area’s proliferation of wildlife, particularly water fowl, was only surpassed by the nearlyimpenetrable nature of its vegetation. Reportedly, Peter Skene Ogden and his Hudson’s BayCompany fur trappers took some 1,500 beavers from the area in two trapping seasons. Earlyemigrants through the region were forced to detour around this area due to the saturated ground anddense vegetation. Later, local hunters were frequently stymied in their efforts to reap some rewardsfrom the abundant wildlife present due to the virtual inaccessibility of the willow stands. Despitethese difficulties, the productivity of the region was legendary. Historical accounts of the ArgentaMarsh from old journals and newspapers of the late 1800’s speak of “wagon loads of fish” and“hundreds of ducks” being taken by local sportsmen.56
One early reference broadly located the former Argenta Marsh area by “What is known as the bigslough, extending from the lakes, near Argenta, a distance of fourteen miles down the river…”57 Inanother reference alluding to the productivity of the area, it was noted, probably with someexaggeration, that “Beaver and otter are in larger numbers on the Humboldt River than thoseunacquainted with the stream and its animal inhabitants are aware. An experienced trapper informsthe editor that in his opinion there are ten thousand beaver in the sloughs and main channel…AtRobert Henderson’s ranch, near Stone House, the beaver are thick and several dams are to beseen…Traps were placed and thirty-four beaver caught, the fur of which brought $200 in the Chicagomarket…Several beaver lodges can be seen in the big slough [i.e., the Argenta Marsh], a mile northof Battle Mountain.”58
In 1934, the BOR and the Pershing County Water Conservation District (PCWCD) signed arepayment agreement for a reclamation project (the “Humboldt Project”) to effect delivery of waterto Rye Patch Reservoir, located in the lower Humboldt River Basin.59 Near Battle Mountain theBOR began buying water rights for transfer to Rye Patch Reservoir.60 Then in the 1950’s the U.S.Army Corps of Engineers channelized a section of the river between Argenta and Battle Mountainfor the expressed purpose of draining the floodplain,61 then commonly known as the Argenta Marshor Swamp, and move the river’s waters more efficiently to the lower basin for storage and use inLovelock Valley. The wetland area below Argenta, as surveyed and mapped out under contract forthe Surveyor General of Nevada in May 1869, originally included two distinct open water areastotaling some 2,740 acres, which were then known as the Tule Swamps (or the Lakes).
One mapped open water area, located immediately below Argenta, was approximately one mile wideand nearly four miles long and contained some 2,060 acres through which the South Channel of the

DIVISION OF WATER PLANNING Humboldt River Chronology—Part I
Nevada Water Basin Information and Chronology Series I–25
Humboldt River ran. It was generally referred to as the “Argenta Marsh”.62 The main channel of theHumboldt River was located approximately one mile to the north of this upper marsh open waterswamp area. The second swamp or lake area, consisting of some 680 acres, was about one-half toone mile wide and one and one-half miles long and was also bisected by the Humboldt River’s SouthChannel. It was located about one mile northeast of the site of Battle Mountain and just above theconfluence of the South Channel and the Humboldt River main stem, hence the name given to it wasgenerally the “Confluence Marsh”.63 The Humboldt River’s main channel formed the northernboundary of this lower marsh swamp and open water area.64
These two primary open water swamp areas were separated by approximately three miles of sloughs,oxbows and braided and abandoned river channels which afforded extensive and invaluable riparianhabitat for a wide variety of animal species. However, as a consequence of the efforts of the BORand U.S. Army Corps of Engineers, which performed the actual channelization of the HumboldtRiver through the area, this entire wetland area was effectively drained and the riparian habitat andthe wildlife that depended upon it lost. Presently, these lands, totaling nearly 30,000 acres, arearranged in 42 separate fields and administered as common pasture (the “Community Pasture”) bythe PCWCD, which has been the primary beneficiary of the BOR’s water reclamation projects withinthe Humboldt River Basin.65
By the late 1960’s, as the PCWCD approached its final payment for the construction costs of theHumboldt Project, questions arose as to who actually held title to the project and how could title betransferred to the PCWCD.66 Irrespective of the complete repayment by the PCWCD, the BOR’scontract specifically stated that title to the project lands and facilities “…shall be and remain in thename of the United States until otherwise provided by Congress…”67 Subsequently, at least twoattempts in the late 1980’s and early 1990’s to transfer title to the PCWCD failed due to widespreadpublic opposition. One of the main points of debate was the enabling legislation’s failure to addressthe issue of restoring, to some degree, the Argenta Marsh.
In 1997 the issue of transferring title to the Humboldt Project to PCWCD regained interest and thewater district hired a consulting firm68 to outline the costs and obstacles in gaining title toapproximately 30,000 acres of federally-managed lands. It was suggested that the PCWCD wasmaking a preemptive move to secure ownership before other interests – i.e., Elko CountyConservation Association, Sierra Club, Ducks Unlimited, Lahontan Valley Wetlands, and even theBOR – could place a different priority on this land’s use, possibly attempting to convert some portionof it back into wetlands.69
In 1997 the Nevada Division of Wildlife (NDOW) became actively involved in the discussions toresolve the PCWCD’s opposition to the restoration of the Argenta Marsh. In the spring of 1998, inorder to initiate marsh restoration efforts, NDOW assembled a task force to assess the feasibility ofutilizing mine dewatering water from the Barrick and Newmont mining operations in Boulder Flat.It was believed that this water could be delivered to the proposed marsh area via the existing WhiteHouse and Blue House ditch systems and contained in a series of diked cells and open areas.
Notwithstanding certain engineering and water rights issues, the mining companies agreed with theconcept and in the summer of 1998 NDOW sought the assistance of Ducks Unlimited (DU) and their
Humboldt River Chronology—Part I DIVISION OF WATER PLANNING
I–26 Nevada Water Basin Information and Chronology Series
engineering staff to analyze the possibility of restoring the Argenta Marsh. In the fall of 1998,NDOW broadened the participation of interest groups to approximately 20 agencies and entities.70
The resultant proposal encompassed a number of objectives:71
(1) Restore to the maximum extent practicable, the Argenta Marsh at or near its formerlocation and under NDOW management;
(2) Title to the balance of the pasture not converted to wetlands (i.e., the remaining“Community Pasture” lands) would pass to another entity (PCWCD, BLM, Lander County,other);
(3) Rye Patch Dam and all project lands, not designated under the 6F Land and WaterConservation Funds (which would go to the Nevada Division of State Parks), would passto the PCWCD;72
(4) As part of the transfer legislation, a water-righted minimum pool of 3,000-5,000 acre-feetwould be established in Rye Patch Reservoir to support the economically important fisherylocated there;
(5) NDOW also proposed making a mutual commitment with the PCWCD for greatercooperation on downstream water delivery to the Humboldt Sink and Wildlife ManagementArea.
Unfortunately, on the key issue of restoring the Argenta Marsh, the principal participants – thePershing County Water Conservation District and the Nevada Division of Wildlife – still remain apart,particularly with respect to the ultimate size of the restored wetland. While NDOW and DucksUnlimited had initially contemplated a restored wetland area of up to 10,000-12,000 acres, nearlyequaling the size of the area estimated to have been lost in the 1930’s, the PCWCD was consideringa far more modest effort of only 600 acres of restored wetlands. The PCWCD is especiallyconcerned that while the Argenta Marsh may effectively be restored by mine dewatering operations,when mining operations cease marsh proponents and environmentalists will be forced to find waterelsewhere, and irrigation water supplies will represent one obvious source.
Presently, NDOW’s plans call for the construction of approximately 5,000 acres of new wetland areascarved out of the existing 30,000 acres of the Community Pasture. It is anticipated that to maintainthis wetland area approximately 15,000 to 20,000 acre-feet of water rights (at a 3:1 to 4:1 ratio ofwater to acres) will have to be purchased.73

DIVISION OF WATER PLANNING Humboldt River Chronology—Part I
Nevada Water Basin Information and Chronology Series I–27
Humboldt River Basin Selected Gaging Station River and Stream Flows[Note: See Figure 3, Humboldt River Flow Schematic on page x in the front of this publication for a flowchart indicating the general locations of the U.S. Geological Survey’s streamflow gaging stations which arereferred to in this section. Also see Appendix 3 for a presentation of gaging station periods of record.]
This section provides information on stream flows within the Humboldt River Basin. Table 4, UpperHumboldt River Principal Stream Flows, and Table 6, Lower Humboldt River Principal StreamFlows, together present stream flows for USGS gaging stations located along the Humboldt Riversystem’s main stem and for a number of principal tributaries. These tables are divided by geographicand hydrologic convention into an upper Humboldt River Basin (Table 4), including stream flows fordrainage areas located upstream from the USGS gage at Palisade, Nevada, and a lower HumboldtRiver Basin (Table 6) encompassing stream flows for all drainage areas located below Palisade. Theinformation in these two tables shows the average water year flow volumes (in acre-feet per year) andthe corresponding average annual rates of flow (cubic feet per second) for specific periods of recordfor each selected gaging station location. In addition to the average water year flows,74 these tablesalso present a record low (drought) water year flow75 and record high (flood) water year flow76 foreach gaging station. The tables’ footnotes detail the period of record for these three differentmeasures of stream flows.77
An intervening table, Table 5, Northern Nevada River System “Productivity” Comparisons, presentsan analysis and comparisons of water “productivity”, or surface water runoff, for the Humboldt Riversystem as compared to the Truckee, Carson and Walker River systems of western Nevada. Riverproductivity measures a river’s maximum discharge during an average water year relative to thedrainage area contributing to that discharge. By such admittedly simplified measures, river systemscan be compared to one another in terms of acre-feet of water produced in terms of runoff to streamsystems (versus groundwater infiltration) in an “average” water year per square mile of drainagesurface area.
A gaging station’s period of record over which continuous (contiguous) flows are taken is importantin comparing the flows between two points on a stream system. Longer periods of record providemore inclusive and statistically significant information on a region’s extreme hydrologic events (i.e.,floods and droughts) and thereby enhance the comparability of flow information among variousgaging stations located along different reaches of a river. While data presented in the following tablesis for “years of record,” this reflects the overall period of record which may include a number ofdiscontinuous time periods. For example, the annual overall record of the USGS Battle Mountaingaging station is listed as 1897 through 1998. However, the contiguous record is May 1896 throughDecember 1897; March 1921 through April 1924; October 1945 through September 1981; andFebruary 1991 through the current water year (1998). Similarly, the contiguous period of record forthe Comus gaging station is October 1894 through December 1909; September 1910 throughSeptember 1926; and October 1945 through September 1998. Another important gaging stationlocation is Palisade which has contiguous periods of record from October 1902 through October1906 and July 1911 through September 1998. It is interesting to note that none of these importantgaging station locations were in operation during the Humboldt River Basin’s record estimated floodwhich severely affected various portions of the basin between February and April 1910.
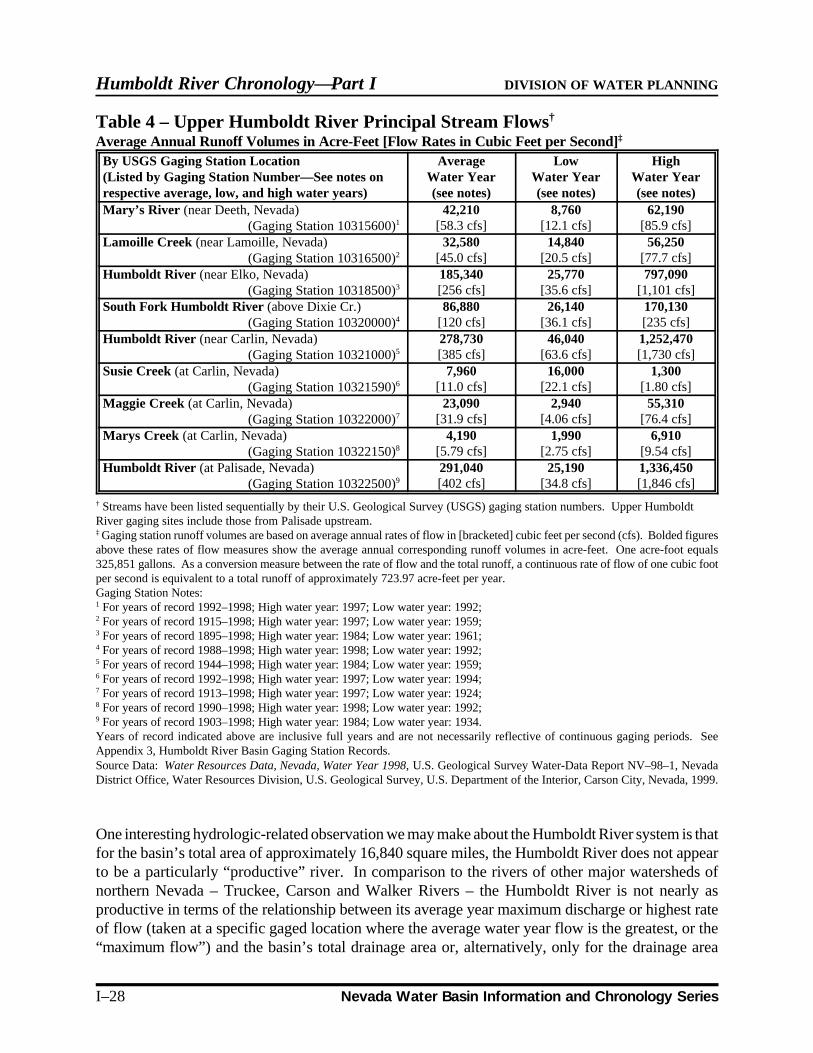
Humboldt River Chronology—Part I DIVISION OF WATER PLANNING
I–28 Nevada Water Basin Information and Chronology Series
Table 4 – Upper Humboldt River Principal Stream Flows†
Average Annual Runoff Volumes in Acre-Feet [Flow Rates in Cubic Feet per Second]‡
By USGS Gaging Station Location(Listed by Gaging Station Number—See notes onrespective average, low, and high water years)
AverageWater Year(see notes)
LowWater Year(see notes)
HighWater Year(see notes)
Mary’s River (near Deeth, Nevada)(Gaging Station 10315600)1
42,210[58.3 cfs]
8,760[12.1 cfs]
62,190[85.9 cfs]
Lamoille Creek (near Lamoille, Nevada)(Gaging Station 10316500)2
32,580[45.0 cfs]
14,840[20.5 cfs]
56,250[77.7 cfs]
Humboldt River (near Elko, Nevada)(Gaging Station 10318500)3
185,340[256 cfs]
25,770[35.6 cfs]
797,090[1,101 cfs]
South Fork Humboldt River (above Dixie Cr.)(Gaging Station 10320000)4
86,880[120 cfs]
26,140[36.1 cfs]
170,130[235 cfs]
Humboldt River (near Carlin, Nevada)(Gaging Station 10321000)5
278,730[385 cfs]
46,040[63.6 cfs]
1,252,470[1,730 cfs]
Susie Creek (at Carlin, Nevada)(Gaging Station 10321590)6
7,960[11.0 cfs]
16,000[22.1 cfs]
1,300[1.80 cfs]
Maggie Creek (at Carlin, Nevada)(Gaging Station 10322000)7
23,090[31.9 cfs]
2,940[4.06 cfs]
55,310[76.4 cfs]
Marys Creek (at Carlin, Nevada)(Gaging Station 10322150)8
4,190[5.79 cfs]
1,990[2.75 cfs]
6,910[9.54 cfs]
Humboldt River (at Palisade, Nevada)(Gaging Station 10322500)9
291,040[402 cfs]
25,190[34.8 cfs]
1,336,450[1,846 cfs]
† Streams have been listed sequentially by their U.S. Geological Survey (USGS) gaging station numbers. Upper HumboldtRiver gaging sites include those from Palisade upstream.‡ Gaging station runoff volumes are based on average annual rates of flow in [bracketed] cubic feet per second (cfs). Bolded figuresabove these rates of flow measures show the average annual corresponding runoff volumes in acre-feet. One acre-foot equals325,851 gallons. As a conversion measure between the rate of flow and the total runoff, a continuous rate of flow of one cubic footper second is equivalent to a total runoff of approximately 723.97 acre-feet per year.Gaging Station Notes:1 For years of record 1992–1998; High water year: 1997; Low water year: 1992;2 For years of record 1915–1998; High water year: 1997; Low water year: 1959;3 For years of record 1895–1998; High water year: 1984; Low water year: 1961;4 For years of record 1988–1998; High water year: 1998; Low water year: 1992;5 For years of record 1944–1998; High water year: 1984; Low water year: 1959;6 For years of record 1992–1998; High water year: 1997; Low water year: 1994;7 For years of record 1913–1998; High water year: 1997; Low water year: 1924;8 For years of record 1990–1998; High water year: 1998; Low water year: 1992;9 For years of record 1903–1998; High water year: 1984; Low water year: 1934.Years of record indicated above are inclusive full years and are not necessarily reflective of continuous gaging periods. SeeAppendix 3, Humboldt River Basin Gaging Station Records.Source Data: Water Resources Data, Nevada, Water Year 1998, U.S. Geological Survey Water-Data Report NV–98–1, NevadaDistrict Office, Water Resources Division, U.S. Geological Survey, U.S. Department of the Interior, Carson City, Nevada, 1999.
One interesting hydrologic-related observation we may make about the Humboldt River system is thatfor the basin’s total area of approximately 16,840 square miles, the Humboldt River does not appearto be a particularly “productive” river. In comparison to the rivers of other major watersheds ofnorthern Nevada – Truckee, Carson and Walker Rivers – the Humboldt River is not nearly asproductive in terms of the relationship between its average year maximum discharge or highest rateof flow (taken at a specific gaged location where the average water year flow is the greatest, or the“maximum flow”) and the basin’s total drainage area or, alternatively, only for the drainage area

DIVISION OF WATER PLANNING Humboldt River Chronology—Part I
Nevada Water Basin Information and Chronology Series I–29
above this location, thereby including only that portion of the total watershed actually contributingto the river’s maximum or peak flow. Table 5, Northern Nevada River System ‘Productivity’Comparisons, presents the complete analysis of this assessment of river productivity and comparisonsbetween and among river systems of northern Nevada.
For example, with an average annual maximum or peak flow78 of 291,040 acre-feet (period of record:1903-1998) recorded at Palisade, Nevada, the Humboldt River shows a slightly lower maximum flowthan the Carson River measured at the Carson City gaging location of 301,170 acre-feet per year(1940-1998).79 But the Carson River’s drainage basin has a total area of only about 3,520 squaremiles, or just over 20 percent of the area of the entire Humboldt River Basin. By this measure, allother things being equal, the Carson River appears to be nearly five times as water productive as theHumboldt River.
Table 5 – Northern Nevada River System “Productivity” Comparisons†
Relative Measures of “Maximum Flow” to Total Watershed and Effective Drainage Areas‡
(Ratios Measured in Acre-Feet per Year per Square Mile – af/yr/mi2)
Basin/River Systemand Gaged Location
Maximumor PeakFlow‡
(acre-fee peryear)
Total Basin(Watershed)Surface Area(square miles)
EffectiveDrainageArea (1)
(square miles)
Ratio – PeakFlow to TotalBasin Area(af/yr/mi2)
Ratio – PeakFlow to
EffectiveDrainage Area
(af/yr/mi2)Humboldt Riverat Palisade, NV 291,040 16,840 5,010 17.3 58.1Carson Riverat Carson City, NV 301,170 3,520 886 85.6 339.9Truckee Riverat Vista (Reno, NV) 600,170 2,300 1,430 260.9 419.7Walker River – Total(combined both forks) 310,590 3,046 609 102.0 510.0 East Fork Walker below Bridgeport, CA 107,150 — 359 — 298.5 West Fork Walker near Coleville, CA 203,440 — 250 — 813.8Western Nevada RiverSystems Combined (2) 1,211,930 8,866 2,925 136.7 414.3
Times More “Productive” Relative to the Humboldt River (3) 7.9X 7.1X
† River system “productivity” measures the volume of surface water runoff in a river system at a particular (gaged) location relativeto the river system’s or watershed’s total drainage area or its drainage area above the point of maximum flow measurement.‡ The “maximum flow” measures the greatest annual volume of discharge (or the maximum annual average rate of flow) for an“average” water year at a particular (gaged) location along a river system or along a specific defined river reach. Above this pointriver flows accrete (increase) and below this point river flows attenuate (decrease) for an average water year. This measure is notto be confused with “peak year” or flood flows, which refer to a year in which the annual total river’s discharge was the greatest.(1) The effective drainage area measures the drainage area above the point on the river system at which the maximum flow isrecorded. In effect, this is the surface area contributing to that maximum flow.(2) Includes combined Carson, Truckee and total Walker River system measures.(3) Measures the relative water productivity figures of the combined three western Nevada river systems as compared to theHumboldt River system above Palisade.Source Data: Water Resources Data, Nevada, Water Year 1998, U.S. Geological Survey Water-Data Report NV–98–1, NevadaDistrict Office, Water Resources Division, U.S. Geological Survey, U.S. Department of the Interior, Carson City, Nevada, 1999.

Humboldt River Chronology—Part I DIVISION OF WATER PLANNING
I–30 Nevada Water Basin Information and Chronology Series
In comparisons to other rivers’ productivity shown in Table 5, the combined maximum flows of theEast Walker River measured below Bridgeport Reservoir (1922-1998) and the West Walker Riverrecorded near Coleville (1903-1998) of approximately 310,590 acre-feet per year,80 are producedfrom a drainage basin totaling 3,046 square miles, or just over 18 percent of the total area of theHumboldt River Basin. And finally, within the smallest of all the major river basins of westernNevada, the Truckee River measured at Vista below Reno shows an average peak flow of 600,170acre-feet per year (1899-1998)81 within a drainage basin totaling only 2,300 square miles in area, orless than 14 percent of the size of the Humboldt River Basin. Therefore, over admittedly somewhatdifferent, but nonetheless extensive periods of record, the western Nevada waterbasins’ rivers haveshown a combined average annual maximum flow of 1,211,930 acre-feet within a total drainage(basin) area of 8,866 square miles. Consequently, with maximum annual river flows nearly 4.2 timesgreater than the Humboldt River at Palisade, and a combined drainage area equal to only 52.6 percentof that of the entire Humboldt River Basin, these western Nevada river systems appear to be 7.9 timesmore water productive as the Humboldt River.82
Another, and more realistic way to assess these rivers’ differences in water productivity is to use onlythe drainage areas above the location where these respective maximum river flows occur, therebyincluding only the surface areas actually contributing to the maximum flow. In this manner, thewestern Nevada watershed rivers’ combined maximum flow actually comes from an effective drainagearea of 2,925 square miles (versus 8,865 square miles for these basins’ combined total area), whilethe effective drainage area above the Palisade gage on the Humboldt River totals 5,010 square miles(versus a total basin area of 16,843 square miles). Even by this measure, however, the waterproductivity of these western Nevada rivers is still 7.1 times greater than that of the Humboldt Riverabove Palisade.83
Several explanations exist for the apparent differences in water productivity, whether on a totalwatershed basis or a drainage area-only basis, between the Humboldt River and those river systemsof western Nevada. One possible explanation is the differences in the geography and topography ofthese northern Nevada watersheds, and that the Humboldt River Basin lies, at least partially, in therain shadow of the Sierra Nevada. The western Nevada river systems tend to have a far greaterproportion of their areas in high-elevation, mountainous drainages which provide considerably greatersnowpack accumulation and potential runoff relative to the basins’ total surface areas. This isparticularly true for the drainage areas above these rivers’ maximum flow locations. For example,the 506-square mile Lake Tahoe Basin comprises nearly 17 percent of the total Truckee River Basinor over 35 percent of the basin’s drainage area above the Truckee River’s point of maximum flow,which is measured at the Vista gage located just below Reno, Nevada.
Within the Humboldt River Basin, by contrast, the basin and range nature of much of this watershedresults in far less area found in high-elevation mountainous watersheds and a far greater proportionof the basin lying in lowland valleys. These lowland valley areas make virtually no contribution tosurface water flows (except during flood periods) in the Humboldt River system (but do contribute,to some degree, to groundwater recharge). This is especially true when considering that many ofthese lowland areas, while receiving annual average precipitation of only 6-8 inches also experienceevaporation rates of over 40 inches per year.

DIVISION OF WATER PLANNING Humboldt River Chronology—Part I
Nevada Water Basin Information and Chronology Series I–31
Table 6 – Lower Humboldt River Principal Stream Flows†
Average Annual Runoff Volumes in Acre-Feet [Flow Rates in Cubic Feet per Second]‡
By USGS Gaging Station Location(Listed by Gaging Station Number—See notes onrespective average, low, and high water years)
AverageWater Year(see notes)
LowWater Year(see notes)
HighWater Year(see notes)
Humboldt River (at Dunphy, Nevada)(Gaging Station 10323425)1
328,680[454 cfs]
57,770[79.8 cfs]
527,050[728 cfs]
Rock Creek (near Battle Mountain, Nevada)(Gaging Station 10324500)2
29,900[41.3 cfs]
1,640[2.27 cfs]
170,130[235 cfs]
Humboldt River (at Battle Mountain, Nevada)(Gaging Station 10325000)3
270,040[373 cfs]
39,460[54.5 cfs]
643,610[889 cfs]
Humboldt River (at Comus, Nevada)(Gaging Station 10327500)4
246,150[340 cfs]
26,640[36.8 cfs]
1,463,870[2,022 cfs]
Little Humboldt River (near Paradise Valley)(Gaging Station 10329000)5
16,650[23.0 cfs]
5,620[7.76 cfs]
58,060[80.2 cfs]
Martin Creek (near Paradise Valley)(Gaging Station 10329500)6
25,340[35.0 cfs]
5,920[8.18 cfs]
78,190[108 cfs]
Humboldt River (near Imlay, Nevada)(Gaging Station 10333000)7
206,330[285 cfs]
18,820[26.0 cfs]
1,460,250[2,017 cfs]
Humboldt River (below Rye Patch Reservoir)(Gaging Station 10335000)8
184,610[255 cfs]
21,140[29.2 cfs]
1,450,840[2,004 cfs]
† Streams have been listed sequentially by their U.S. Geological Survey (USGS) gaging station numbers. Lower Humboldt Rivergaging sites include those downstream from the Palisade gage.‡ Gaging station runoff volumes are based on average annual rates of flow in [bracketed] cubic feet per second (cfs). Bolded figuresabove these rates of flow measures show the average annual corresponding runoff volumes in acre-feet. One acre-foot equals325,851 gallons. As a conversion measure between the rate of flow and the total runoff, a continuous rate of flow of one cubic footper second is equivalent to a total runoff of approximately 723.97 acre-feet per year.Gaging Station Notes:1 For years of record 1991–1998; High water year: 1997; Low water year: 1992;2 For years of record 1918–1998; High water year: 1984; Low water year: 1994;3 For years of record 1897–1998; High water year: 1971; Low water year: 1955;4 For years of record 1895–1998; High water year: 1984; Low water year: 1920;5 For years of record 1975–1998; High water year: 1984; Low water year: 1992;6 For years of record 1922–1998; High water year: 1984; Low water year: 1931;7 For years of record 1935–1998; High water year: 1984; Low water year: 1955;8 For years of record 1936–1998; High water year: 1984; Low water year: 1955.Years of record indicated above are inclusive full years and are not necessarily reflective of continuous gaging periods. SeeAppendix 3, Humboldt River Basin Gaging Station Records.Source Data: Water Resources Data, Nevada, Water Year 1998, U.S. Geological Survey Water-Data Report NV–98–1, NevadaDistrict Office, Water Resources Division, U.S. Geological Survey, U.S. Department of the Interior, Carson City, Nevada, 1999.
Another possible explanation for these differences in runoff and surface areas lies in differencesbetween these watersheds in terms of the water-holding and infiltration capacity of the soils. In oneparticular analysis using solely data provided by the U.S. Geological Survey, two somewhat similardrainage areas were examined for hydrologic differences. One drainage area included the regionabove the Norther Fork Humboldt River gage (which is no longer in operation) in the HumboldtRiver Basin and the other area was the lands in the Carson River Basin above the Carson River gageat Carson City. The North Fork drainage surface area totaled approximately 830 square miles, hada mean basin elevation of 7,000 feet MSL, and averaged 14 inches of precipitation per year.84 TheCarson River drainage above the USGS Carson City gaging station had a total area (above the gage)of 886 square miles, a mean basin elevation of 7,100 feet MSL and an average of 12 inches of

Humboldt River Chronology—Part I DIVISION OF WATER PLANNING
I–32 Nevada Water Basin Information and Chronology Series
precipitation per year.85 Total precipitation was estimated at nearly 620,000 acre-feet per year in theNorth Fork watershed and about 567,000 acre-feet in the Carson River watershed.86
Using 47 years of systematic record, the mean discharge of the North Fork watershed measured atDevil’s Gate near Halleck was about 54,190 acre-feet. This equated to only 8.7 percent of totalprecipitation appearing as surface runoff. For the Carson River watershed, using 59 years of record,the mean discharge was about 301,400 acre-feet, producing a significantly larger 53.2 percent of totalprecipitation appearing as surface water runoff at the Carson City gage. From this analysis, it wouldappear reasonable to conclude that the water-holding capacity and infiltration rates of the upland andfloodplain soils in the Humboldt River’s North Fork sub-basin, at least, are considerably greater,overall, than those of the Carson River Basin above Carson City.
Aside from hydrologic, geographic, topographic and climatologic considerations, another importantreason for this significant difference in water productivity measures between these rivers of northernNevada has to do with the varied irrigation requirements along these basins’ river systems. For themost part, the drainage areas above the rivers’ maximum flow points within the western Nevadawatersheds are not as extensively irrigated as within the Humboldt River system. The combined totalirrigated acreage located above the maximum flow locations on the Truckee, Carson and WalkerRiver systems is estimated at less than 100,000 acres.87 For the Humboldt River above Palisade,estimates of decreed water-righted irrigated acreage total over 150,000 acres and decreed waterrights total almost 400,000 acre-feet.88 Allowing for differences in consumptive use89 and leachingrequirements,90 actual water use and re-use in the upper Humboldt River Basin may be greater thanthis amount. Other sources for these estimates put the total irrigated acreage for all of Elko County,most of which lies above the Palisade gage, at nearly 200,000 acres and total water withdrawals91 atover 900,000 acre-feet in 1997, to include overland flooding and water re-use.92
Beginning with some perceptive observations made by early emigrants about the geography of theHumboldt River Valley,93 the Humboldt River Basin has been either geographically, climatologicallyor hydrologically divided into an upper basin and a lower basin at Palisade Canyon. The water rightsadjudication process of the 1930’s more precisely marked this division hydrologically at the USGSgaging station at Palisade. Early court decisions adjudicating the river’s water rights (see “HumboldtRiver Water Rights, Adjudication, and Related Court Decrees” later in Part I) used this location inrecognizing the climatological differences in crop irrigation requirements and watering periodsbetween irrigated lands in the upper and lower basins, noting the earlier start and later finish for thegrowing season in the lower basin (i.e., March 15 through September 15) than in the upper basin (i.e.,April 15 through August 15) by decree.
Analysis of the stream flows in Tables 4 and 6, point out one particular problem created by using riverflow readings between gaging stations with significantly different inclusive periods of record andespecially different contiguous periods of record. In viewing Table 4 for average water yearHumboldt River flows at Palisade (291,040 acre-feet per year) and then Table 6 at the first gagelocated downstream from Palisade at Dunphy (328,680 acre-feet per year), it appears that HumboldtRiver flows continue increase below Palisade. The reason for this apparent discrepancy lies in thedifferent periods of record for these specific gages. Specifically, the Palisade gage’s record extendsback to 1903 and the period of record for the Dunphy gage (located below Palisade) extends back

DIVISION OF WATER PLANNING Humboldt River Chronology—Part I
Nevada Water Basin Information and Chronology Series I–33
only to 1991 (although some earlier records do exist). Consequently, the Dunphy gage will tend tooverstate long-term average river flows at this location by omitting all or some of the most severedrought periods on record for this river system, i.e., the early 1930’s and the late 1980’s and early1990’s, readings which are included in the Palisade gage’s period of record.
One question that frequently arises with respect to Humboldt River system flows is the estimatedflood-flow contribution to Humboldt River flows of the Reese River and the Little Humboldt River.Despite the rather extensive system of gaging stations that exist on the Humboldt River system, anumber of which are presented in Tables 4 and 6, outflows of these two sub-basins are not monitoredby the U.S. Geological Survey or the Nevada Division of Water Resources due to their infrequent(i.e., flood-only) discharges. Furthermore, differences in the periods of record for gages above andbelow these rivers’ respective inflows effectively preclude the use of analyzing flow differences duringflood years to estimate these streams’ contribution to Humboldt River flows. However, oneparticular study for the Reese River did make estimates of these high-water year outflows into theHumboldt River. The authors of that report estimated that the average outflow of the Reese Riverwas 5,000 acre-feet per year, but the occurrence of outflow was only about once every 15 years onthe average.94 Consequently, this implied an average flood year contribution to the Humboldt Riverfrom the Reese River of about 75,000 acre-feet.95
Another report noted that during the water years of 1953 and 1958, a total of about 58,000 acre-feetwas artificially drained from Gumboot Lake and the lower Little Humboldt River by dredging throughthe Sand Dunes formation at the lower end of Paradise Valley.96 It is also perhaps noteworthy thatthe total discharge recorded during the 1952 water year at the Little Humboldt River gage aboveParadise Valley97 was about 64,330 acre-feet and the total discharge recorded at the Martin Creekgage where it enters Paradise Valley98 was 63,940 acre-feet. The sum of these two discharges is128,270 acre-feet, only slightly less than the sum of the corresponding discharge of the LittleHumboldt River of 136,500 acre-feet recorded during the high water year of 1984.99
Table 7, Humboldt River Main Stem Flows, provides a summary of selected gaging station averagewater year stream flow information extracted from Tables 4 and 6 for only Humboldt River main stemgages over more consistent (and relatively extended) periods of record. Gaging stations in this tableare listed in upstream to downstream order and more clearly show the Humboldt River’s flowaccretion (increase) above the Palisade gaging station site and the river’s attenuation (decrease) belowthis point under normal, or average water year flow conditions. Table 7 shows that between theHumboldt River’s Elko gage and its Palisade gage, average annual flows increase by 105,700 acre-feet, or 57 percent. Between Palisade and Imlay, which is located just above Rye Patch Reservoir,Humboldt River average flows decline by 106,710 acre-feet, or nearly 37 percent.
Analysis of the gaged river flow information in Table 7 tends to support the concept of a hydrologic“division” of the Humboldt River Basin at Palisade based on the increase (accretion) in HumboldtRiver flows above the USGS Palisade gage and the decrease (attenuation) in river flows belowPalisade. Disregarding different periods of record, Table 7 also shows that the cumulative changein the Humboldt River’s flow between Elko and Imlay is practically zero, meaning that the accretionin river flows between Elko and Palisade is virtually eliminated by the affects of attenuation in flowsbetween Palisade and Imlay.100 This may be seen in the “Cumulative Change” column in Table 7.
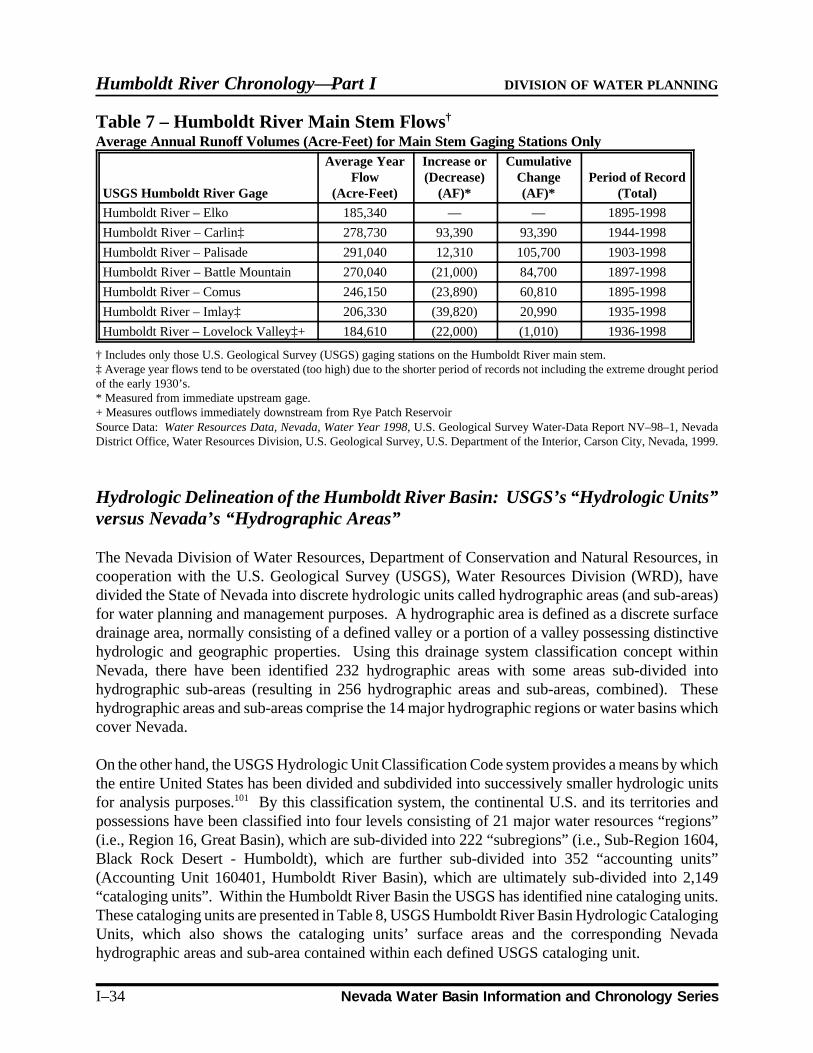
Humboldt River Chronology—Part I DIVISION OF WATER PLANNING
I–34 Nevada Water Basin Information and Chronology Series
Table 7 – Humboldt River Main Stem Flows†
Average Annual Runoff Volumes (Acre-Feet) for Main Stem Gaging Stations Only
USGS Humboldt River Gage
Average YearFlow
(Acre-Feet)
Increase or(Decrease)
(AF)*
CumulativeChange(AF)*
Period of Record(Total)
Humboldt River – Elko 185,340 — — 1895-1998
Humboldt River – Carlin‡ 278,730 93,390 93,390 1944-1998
Humboldt River – Palisade 291,040 12,310 105,700 1903-1998
Humboldt River – Battle Mountain 270,040 (21,000) 84,700 1897-1998
Humboldt River – Comus 246,150 (23,890) 60,810 1895-1998
Humboldt River – Imlay‡ 206,330 (39,820) 20,990 1935-1998
Humboldt River – Lovelock Valley‡+ 184,610 (22,000) (1,010) 1936-1998
† Includes only those U.S. Geological Survey (USGS) gaging stations on the Humboldt River main stem.‡ Average year flows tend to be overstated (too high) due to the shorter period of records not including the extreme drought periodof the early 1930’s.* Measured from immediate upstream gage.+ Measures outflows immediately downstream from Rye Patch ReservoirSource Data: Water Resources Data, Nevada, Water Year 1998, U.S. Geological Survey Water-Data Report NV–98–1, NevadaDistrict Office, Water Resources Division, U.S. Geological Survey, U.S. Department of the Interior, Carson City, Nevada, 1999.
Hydrologic Delineation of the Humboldt River Basin: USGS’s “Hydrologic Units”versus Nevada’s “Hydrographic Areas”
The Nevada Division of Water Resources, Department of Conservation and Natural Resources, incooperation with the U.S. Geological Survey (USGS), Water Resources Division (WRD), havedivided the State of Nevada into discrete hydrologic units called hydrographic areas (and sub-areas)for water planning and management purposes. A hydrographic area is defined as a discrete surfacedrainage area, normally consisting of a defined valley or a portion of a valley possessing distinctivehydrologic and geographic properties. Using this drainage system classification concept withinNevada, there have been identified 232 hydrographic areas with some areas sub-divided intohydrographic sub-areas (resulting in 256 hydrographic areas and sub-areas, combined). Thesehydrographic areas and sub-areas comprise the 14 major hydrographic regions or water basins whichcover Nevada.
On the other hand, the USGS Hydrologic Unit Classification Code system provides a means by whichthe entire United States has been divided and subdivided into successively smaller hydrologic unitsfor analysis purposes.101 By this classification system, the continental U.S. and its territories andpossessions have been classified into four levels consisting of 21 major water resources “regions”(i.e., Region 16, Great Basin), which are sub-divided into 222 “subregions” (i.e., Sub-Region 1604,Black Rock Desert - Humboldt), which are further sub-divided into 352 “accounting units”(Accounting Unit 160401, Humboldt River Basin), which are ultimately sub-divided into 2,149“cataloging units”. Within the Humboldt River Basin the USGS has identified nine cataloging units.These cataloging units are presented in Table 8, USGS Humboldt River Basin Hydrologic CatalogingUnits, which also shows the cataloging units’ surface areas and the corresponding Nevadahydrographic areas and sub-area contained within each defined USGS cataloging unit.

DIVISION OF WATER PLANNING Humboldt River Chronology—Part I
Nevada Water Basin Information and Chronology Series I–35
Table 8 – USGS Humboldt River Basin Hydrologic Cataloging UnitsUSGS Hydrologic Cataloging Units Conversion to Nevada Hydrographic Areas/Sub-AreaRegion 16–Great Basin; Sub-Region 1604–Black Rock Desert-Humboldt; Accounting Unit 160401–TheHumboldt River Basin, Nevada; Cataloging Units 16040101 through 16040109 (Listed Below)
USGS Cataloging UnitsArea
(sq. miles)Area
(acres) Nevada Hydrographic Area Number and Name
01 – Upper Humboldt River 2,720 1,740,790 42–Mary’s River; 43–Starr Valley; 45–Lamoille Valley;49–Elko Segment; 50–Susie Creek; 51–Maggie Creek;52-Marys Creek
02 – North Fork Humboldt 988 632,320 44–North Fork Humboldt River
03 – South Fork Humboldt 1,270 812,800 46–South Fork; 47–Huntington Valley; 48–Dixie Creek-Tenmile Creek
04 – Pine Valley 985 630,400 53–Pine Valley
05 – Middle Humboldt River 3,180 2,035,190 54–Crescent Valley; 55–Carico Lake Valley;60–Whirlwind Valley; 61–Boulder Flat; 64-Clovers;65–Pumpernickel Valley; 66–Kelly Creek Valley
06 – Rock Creek 888 568,320 62–Rock Creek Valley; 63–Willow Creek
07 – Reese River 2,310 1,478,390 56–Upper Reese River Valley; 57–Antelope Valley;58–Middle Reese River Valley; 59–Lower Reese RiverValley
08 – Lower Humboldt River 2,590 1,657,590 70–Winnemucca Segment; 71–Grass Valley; 72–Imlay;73–Lovelock Valley; 73A–Lovelock Valley/Oreana;74–White Plains
09 – Little Humboldt River 1,740 1,113,600 67–Little Humboldt Valley; 68–Hardscrabble; 69–ParadiseValley
Source Data: State Engineer’s Office, Nevada Division of Water Resources, Department of Conservation and Natural Resources;U.S. Geological Survey (USGS), Water Resources Division (WRD).
Irrespective of the delineation by which a region’s hydrology is analyzed, the basic (i.e., lowest level)hydrologic classification unit of study within Nevada remains the hydrographic area (or sub-area).In the following section, the 33 hydrographic areas and one hydrographic sub-area contained withinthe Humboldt River Basin will be combined in a slightly different manner to form eleven sub-basins.These designated sub-basins will then be used to assess various regional characteristics with respectto geography and topography, history and development, hydrology, climate and vegetation patterns.Figure 7, Humboldt River Basin Hydrographic Areas, found in the next section, presents a map ofthe Humboldt River basin with each of the 33 hydrographic areas and one sub-area delineated.Appendix 1 at the end of this Part I provides more detailed information on these hydrographic areasand sub-area.

Humboldt River Chronology—Part I DIVISION OF WATER PLANNING
I–36 Nevada Water Basin Information and Chronology Series
Humboldt River Sub-Basin Analysis
Overview
Due to the vast extent of the Humboldt River Basin and the unique geographic, hydrologic andfloristic characteristics of its various principal drainage areas, the more expansive hydrographic basinhas been dis-aggregated and will be analyzed from a sub-basin perspective. In this regard, theHumboldt River Basin can be divided into eleven sub-basins, each possessing relatively uniquegeography, topography, geology, climatology and hydrology. The Humboldt River Basin’s sub-basins, listed in a general ordering from upper basin to lower basin, consist of the following:102
(1) Mary’s River(2) Ruby Mountains(3) North Fork(4) Maggie Creek(5) Elko Reach(6) Pine Valley(7) Reese River(8) Battle Mountain(9) Little Humboldt River(10) Sonoma Reach(11) Lovelock Reach
Table 9, Defined Humboldt River Basin Sub-Basins, lists the principal sub-basins of the HumboldtRiver Basin and, for purposes of this analysis, their relationship to the basin’s 33 hydrographic areasand one sub-area, along with each sub-basin’s counties of coverage, surface areas and thehydrographic numbered areas and sub-area contained within each respective sub-basin. Also,Appendix 1 to this part lists all the Humboldt River’s Hydrographic Areas and Sub-Area and certaininformation for each.
In terms of our convention of defining an upper and lower Humboldt River Basin, the upperHumboldt River Basin includes the Mary’s River, Ruby Mountains, North Fork, Maggie Creek andElko Reach sub-basins. The lower Humboldt River Basin includes the Pine Valley, Reese River,Battle Mountain, Little Humboldt River, Sonoma reach and Lovelock Reach sub-basins. Thisdividing point is determined at the USGS Palisade gaging station, which lies just upstream from theinflow of Pine Creek (discharging from Pine Valley).
Figure 7, Humboldt River Basin Hydrographic Areas, presents a map of the Humboldt River Basinand the location of the 33 hydrographic areas and one sub-area (73A, Orena). More detailedinformation on these hydrographic areas may be found in Appendix 1 at the end of Part I. [Note: Forinformation on the relative location of Nevada’s fourteen hydrographic regions and basins that arereferred to in this section and their relationship to the Humboldt River Basin, see Figure 2, NevadaHydrographic Regions and Basins, on page ix in the front portion of this volume.]

DIVISION OF WATER PLANNING Humboldt River Chronology—Part I
Nevada Water Basin Information and Chronology Series I–37
Figure 7 – Humboldt River Basin Hydrographic Areas(Courtesy of U.S. Geological Survey (USGS), Water Resources Division, Carson City, Nevada)

Humboldt River Chronology—Part I DIVISION OF WATER PLANNING
I–38 Nevada Water Basin Information and Chronology Series
Table 9 – Defined Sub-Basins and Hydrographic Areas and Sub-Area(Humboldt River Sub-Basins Listed in General Upstream to Downstream Order)
HUMBOLDT RIVERSUB-BASINS† County(ies)‡
SurfaceArea
(acres)
SurfaceArea
(sq. mi.)
Percentof TotalBasin
NevadaArea*
Numbers Mary’s River Sub-Basin Elko 686,720 1,073 6.4% 42
Ruby Mountains Sub-Basin Elko, White Pine 1,194,880 1,867 11.1% 43, 4546, 47, 48
North Fork Sub-Basin Elko 710,400 1,110 6.6% 44
Maggie Creek Sub-Basin Elko, Eureka 396,160 619 3.7% 50, 51Elko Reach Sub-Basin Elko, Eureka,
Lander240,000 375 2.2% 49, 52
Pine Valley Sub-Basin Eureka, Elko 641,280 1,002 6.0% 53Reese River Sub-Basin Lander, Eureka,
Nye2,320,000 3,625 21.5% 54, 55, 56
57, 58, 59
Battle Mountain Sub-Basin Elko, Lander,Eureka,
Humboldt
1,605,120 2,508 14.9% 60, 61, 6263, 64, 66
Little Humboldt River Sub-Basin Humboldt, Elko 1,114,880 1,742 10.3% 67, 68, 69
Sonoma Reach Sub-Basin Humboldt,Pershing
802,560 1,254 7.4% 65, 70, 71
Lovelock Reach Sub-Basin Pershing,Churchill
1,067,520 1,668 9.9% 72, 7373A, 74
Total Humboldt River Basin10,779,52
016,843
† Upper Humboldt River basin sub-basins consist of Mary’s River, Ruby Mountains, North Fork, Maggie Creek and Elko Reach;Lower Humboldt River basin sub-basins include Pine Valley, Reese River, Battle Mountain, Little Humboldt River, Sonoma Reachand Lovelock Reach.‡ Counties listed in order of area of coverage. All Humboldt River sub-basins lie wholly within Nevada.* See Appendix 1 for description of these Hydrographic Areas and Sub-Area.Source Data: Humboldt River Basin, Nevada, Water and Related Land Resources and Nevada Hydrographic Basin StatisticalSummary.
Mary’s River Sub-Basin
The Mary’s River103 sub-basin is a southward-draining tributary to the Humboldt River located in thenorth-central portion of Elko County, Nevada. By means of primarily the Mary’s River, this sub-basin drains the farthermost extent of the Humboldt River system. The sub-basin is identifiedhydrographically as Nevada Hydrographic Area 42, Mary’s River Area, and encompasses a surfacearea of 1,073 square miles. Among the eleven sub-basins within the Humboldt River Basin, theMary’s River sub-basin ranks as the eighth largest with 6.4 percent of the basin’s total surface area.The Mary’s River sub-basin encompasses the northeastern drainages of the Humboldt River systemto include the upper reach of the Humboldt River lying above the town of Deeth, Nevada, includingthe upper Humboldt River’s principal tributary streams of Tabor Creek, Burnt Creek, Bishop Creekand Town Creek. Also included are the smaller drainage areas to the east of Wells and, mostimportantly, the drainage area of Mary’s River and its various tributaries.

DIVISION OF WATER PLANNING Humboldt River Chronology—Part I
Nevada Water Basin Information and Chronology Series I–39
Figure 8 – Mary’s River Sub-Basin
Principal tributaries of Mary’s River include “T” (Anderson) Creek, Hanks Creek, Currant Creek,Storm (Tom Cain) Creek, Hot Creek, Wildcat Creek and Meadow Creek. It has been estimated thatapproximately 96 percent of the surface water emanating from this sub-basin comes from the Mary’sRiver alone.104 The Mary’s River extends northward up into the southern portion of the JarbidgeMountains, just below Mary’s River Peak (10,565 feet MSL) and Fox Creek Peak (9,551 feet MSL),some 50 miles above its confluence with the Humboldt River main stem at Deeth.
The lower portion of the Mary’s River sub-basin between Wells and Deeth have figured prominentlyin Nevada’s early history as a gateway for emigrant wagon trains heading for California. Basically,two routes were open to early travelers using the Overland Emigrant Trail route through north-central Nevada. The northern, or Fort Hall routecame down from the northeast (Thousand SpringsValley) and joined the Humboldt River at Wells(then referred to as Humboldt Wells), while the moresouthern route used the longer Hastings Cutoffroute. This route led the early emigrant wagon trainsacross the southern portion of the Great Salt LakeDesert, entered Nevada at Pilot Peak (10,704 feetMSL), then led early travelers south along theeastern side of the Ruby Mountains, across OverlandPass (then called Hastings Pass), and then norththrough Huntington Valley and along HuntingtonCreek to its confluence with the South Fork of theHumboldt. From there, the route followed the SouthFork to the Humboldt River main stem through thenarrow South Fork canyon, coming out about eightmiles downstream from present-day Elko, Nevada.
The longer and considerably more difficult Hastings Cutoff route added about 10 days to theemigrants’ travel time compared to the more direct northern route. Once this route’s manydrawbacks were more fully publicized, it was virtually abandoned by the early 1850’s. The shorterFort Hall route separated from the Oregon Trail in southern Idaho, entered Nevada in the extremenortheastern corner of Elko County, headed up Goose Creek and then over to Rock Spring Creekand down to the junction with Thousand Springs Creek. From here the trail led up through ThousandSprings Valley and across Summer Camp Ridge and into the Humboldt River Basin near theheadwaters of Bishop Creek. From there the route led down Town Creek to Humboldt Wells, laterbecoming present-day Wells. From this resting area, with its plentiful water and abundant forage, thewagon trains then proceeded down virtually the entire length of the Humboldt River, a distance ofsome 300 arduous miles.
The extreme conditions of the “White Winter” of 1889-90 were especially devastating on large cattleranching operations in the upper Humboldt River Basin as ranchers recognized the need to restrictopen-range grazing operations and raise more forage for winter feed. This winter event, with itsenormous livestock losses, effectively brought to an end the practice of open-range grazingoperations during the winter months without the use of supplemental feed stocks. By one account,

Humboldt River Chronology—Part I DIVISION OF WATER PLANNING
I–40 Nevada Water Basin Information and Chronology Series
it was noted that after this extremely hard winter, one supposedly could walk from Wells, Nevada for100 miles to the Mary’s River fork of the Humboldt River and never step off the carcasses of cowsthat died during this period.105 From this time forward, the cultivation of irrigated native grasses andalfalfa hay for winter livestock feeding became a major agricultural pursuit throughout the entireHumboldt River Basin.106 These activities intensified the concerns over Humboldt River water rightsissues as now the basin’s ranchers were forced to increase their forage stocks through even greaterirrigation diversions and multiple hay croppings throughout the growing season.
In the early twentieth century, the Mary’s River sub-basin experienced an aborted attempt atcolonization. In May 1910, the Pacific Reclamation Company, a corporation composed of easterncapitalists, embarked upon an ambitious settlement, land development, and reclamation project in thelower portion of the Mary’s River sub-basin. Approximately 40,000 acres of land at the mouth ofBishop Creek (Emigration) Canyon were purchased and by 1912 the company had constructed anearth-rock fill dam on Bishop Creek and a diversion canal to irrigate 30,000 acres of land in the valleybelow. A town named Metropolis was created, along with a $100,000 brick hotel, a brick school(Lincoln School), city streets, electric lights and parks. In December 1911, the Southern PacificRailroad opened a branch office and by 1914 the area’s population had grown to almost 1,000persons. By 1912, problems with water rights on Bishop, Burnt and Trout Creeks had dramaticallyreduced the project’s irrigable acreage from 30,000 acres to only 3,000 acres. Attempts at drylandfarming, the first time this had ever been tried on any measurable scale in Nevada, proved disastrousafter the wet year of 1914. By 1924 the population had shrunk to only 200 persons, the railroad wasdismantled in 1925, and droughts and the depression era of the 1930’s eventually finished off thetown. Today, only scattered ruins of the town remain; however, the Bishop Creek Reservoir(sometimes still referred to as Metropolis Reservoir) and the diversion canal still exist, but thereservoir cannot be used due to extensive leaks.107
Topographically, the Mary’s River sub-basin may be divided into three distinct parts to include themountain highlands, the valley uplands, and the valley lowlands. The lowest part of the sub-basin islocated at Deeth at an elevation of 6,000 feet MSL. The sub-basin is bound to the east by the SnakeMountains, to the north and northwest by the Jarbidge Mountains, to the southeast by the WindemereHills and to the south by the northern portion of the East Humboldt Range. In the western portionof the sub-basin, the north-south Mary’s River drainage area is separated from the drainage area ofthe North Fork Humboldt River to the west by a relatively low range of hills. The Humboldt Riverruns through the southernmost portion of the Mary’s River sub-basin and exits the sub-basin to thesouthwest. Other Humboldt River sub-basins bordering the Mary’s River sub-basin include the RubyMountains sub-basin to the south and the North Fork sub-basin to the west. To the north andnorthwest, the Mary’s River sub-basin borders the Snake River Basin (Nevada Hydrographic Region3); to the east it borders the Great Salt Lake Basin (Nevada Hydrographic Region 11); and to thesoutheast it borders the Central Region (Nevada Hydrographic Region 10).
Due to its relatively wide variation in altitude, from mountain peaks well over 10,000 feet MSL inthe Jarbidge Mountains in the north to 6,000 feet at the confluence with the Humboldt River in thesouth, this sub-basin also shows considerable variation in both its climate and precipitation and,consequently, in its land uses and vegetation. Climatological data show an average annualprecipitation in the south end of the Jarbidge Mountains (upper Mary’s River watershed) to be
DIVISION OF WATER PLANNING Humboldt River Chronology—Part I
Nevada Water Basin Information and Chronology Series I–41
approximately 35 inches at elevations above 9,000 feet MSL and about 30 inches for elevationsbetween 8,000 and 9,000 feet MSL. Beyond the influences of the lofty Jarbidge Mountains, sub-basinelevations at between 8,000 and 9,000 feet MSL show about 20 inches of annual precipitation andin the lower valleys where most of the irrigation is conducted, the sub-basin’s precipitation averagesonly about nine inches per year. Virtually all precipitation received by the Humboldt River’s sub-basins occurs during the winter months and is typically in the form of snow at the higher elevationsand rain-snow at the lower elevations.
Sagebrush-grass constitutes the predominant plant cover over much of the Mary’s River sub-basin.In addition, along the Mary’s River from Deeth, located on the Humboldt River main stem, to thelower narrows above the Mary’s River Ranch (located approximately 20 miles upstream from Deeth),irrigated hay meadows are found interlaced with willows (Salix spp.) and rabbitbrush(Chrysothamnus nauseosus). Extensive rabbitbrush areas are also found along the bottoms of thedrainages above Deeth. Between the lower narrows on the Mary’s River and the Humboldt Forestboundary there exist thin stringers of willow interspersed with scattered cottonwood trees (Populusfremontii). In the Jarbidge Mountains throughout the Mary’s River headwaters the willow andcottonwood stands give way to Great Basin wildrye (Elymus cinereus) meadows and at the upperelevations the meadow grasses yield to stands of aspen trees (Populus tremuloides) along the streambottoms and in the small basins which, in turn, give way to clumps of subalpine fir (Abies lasiocarpa)on the more favorable north and west exposures. Also along the upper elevation slopes throughoutthe basin are found extensive areas of curl-leaf mountain mahogany (Cercocarpus ledifolius) andsmall amounts of limber pine (Pinus flexilis).
Throughout this sub-basin, much of the native Great Basin wildrye, Indian ricegrass (Oryzopsishymenoides), and Nevada bluegrass (Poa nevadensis) has disappeared entirely due to many years ofextensive grazing operations by domestic livestock, both cattle and sheep. Significant expanses ofthese native species of ryegrass-bluegrass-wheatgrass understory can now only be found on protectednational forest lands or in remote or inaccessible areas of the sub-basin. In other well-grazed areas,most of the perennial grass understory has been replaced with the invasive, exotic annual cheatgrass(Bromus tectorum) and other less desirable browsing and forage plants such as big sagebrush(Artemisia tridentata), Sandberg bluegrass (Poa secunda), bottlebrush squirreltail (Sitanion hystrix)and small amounts of needlegrass (Stipa spp.).
The more saline or alkali-laden sites within the Mary’s River sub-basin have seen increased growthof greasewood (Sarcobatus vermiculatus) and saltgrass (Distichlis stricta).108 In many areas of thesub-basin, as generally found throughout the entire Humboldt River Basin, the decline in these soiland moisture-holding perennial native grass species has had a telling effect on the land’s water-holding capacity and severely accelerated the effects of erosion. As one indication of the deterioratedand weakened condition of the native grasses on the open ranges in the Humboldt River Basin, thissub-basin holds the distinction for being the site of the discovery of the invasive toxic plant halogeton(Halogeton glomeratus), which was found south of Wells in 1934.

Humboldt River Chronology—Part I DIVISION OF WATER PLANNING
I–42 Nevada Water Basin Information and Chronology Series
Figure 9 – Ruby Mountains Sub-Basin
Ruby Mountains Sub-Basin
The Ruby Mountains109 sub-basin is a northward-draining tributary to the Humboldt River locatedin the southwestern portion of Elko County and extending south from the Humboldt River main steminto the northwest portion of White Pine County, which includes the upper reach and tributaries ofHuntington Creek and the extreme southern portion of the Ruby Mountains. The Ruby Mountainssub-basin is bordered by the Mary’s River sub-basin to the north, the North Fork Humboldt River andElko Reach sub-basins to the northwest, and the Pine Valley sub-basin to the west. To the southwest,south and east, the Ruby Mountains sub-basin is bordered by the Central Region (NevadaHydrographic Region 10).
The Ruby Mountains sub-basin includes five ofNevada’s hydrographic areas lying within theHumboldt River Basin and covers a total surfacearea of 1,867 square miles. In terms of the othersub-basins within the Humboldt River Basin, theRuby Mountains sub-basin ranks as the third largestwith 11.1 percent of the basin’s total surface area.The five hydrographic areas contained within theRuby Mountains sub-basin include: (1) Starr Valley,hydrographic area 43, covering 332 square miles;(2) Lamoille Valley, hydrographic area 45, covering257 square miles; (3) South Fork Area,hydrographic area 46, covering 99 square miles; (4)Huntington Valley, hydrographic area 47, covering787 square miles; and (5) the Dixie Creek andTenmile Creek Area, hydrographic area 48, covering392 square miles.
The Ruby Mountains sub-basin drains the extreme upper southeast portion of the Humboldt Riversystem covering the drainages of the western slopes of the Ruby Mountains and East HumboldtRange in the eastern portion of the sub-basin and the Sulphur Spring and Pinon Mountain ranges inthe western portion of the sub-basin. Major drainage areas within the sub-basin include HuntingtonValley, Dixie Valley and the Lamoille-Starr Valley area. The South Fork of the Humboldt Riverconstitutes the principal stream within the sub-basin, receiving the waters of both Huntington Creekand Dixie Creek before its confluence with the Humboldt River main stem some eight miles belowElko, Nevada. Lamoille Creek, the other principal source of outflow from this sub-basin, drains partof the northern and central Ruby Mountain range and meets the Humboldt River main stemapproximately three miles below Halleck, Nevada. Starr Valley, located in the northeastern portionof the Ruby Mountains sub-basin, and the western slopes of the East Humboldt Range, are drainedby a number of smaller creeks to include Greys Creek, Ackler Creek, Deering Creek, Boulder Creek,Stephens Creek and Reed Creek.
Historically, the Ruby Mountains sub-basin played only a secondary role in early westward migrationto California. The Ruby Mountains and East Humboldt Range to the north, which extend down the

DIVISION OF WATER PLANNING Humboldt River Chronology—Part I
Nevada Water Basin Information and Chronology Series I–43
entire eastern side of the sub-basin, afforded a serious impediment to early explorers and particularlyemigrant wagon trains. The first emigrant party to use the Overland Trail down the Humboldt RiverValley, the Bartleson-Bidwell Party, came through the Ruby Mountain sub-basin in 1841.Recognizing the difficulties that lay ahead, they decided to abandon their wagons to the east of theRuby Mountains sub-basin at the base of the Pequop Mountains. From there they proceeded southalong the western side of Ruby Valley to near Franklin Lake, and then traversed the Ruby Mountainsmore easily as a pack train, using the Harrison Pass route,110 which leads directly into the middleportion of Huntington Valley on the western side of the Ruby Mountains. From there they travelednorth and down Huntington Creek and then the South Fork of the Humboldt River to the river’s mainstem. As Harrison Pass was too step and rugged for wagons, subsequent emigrant wagon trainsusing the Hastings Cutoff route were forced to go some 25 miles further south until they could crossthe Ruby Mountains at Overland Pass (then called Hastings Pass), bringing them into the RubyMountains sub-basin near the extreme southern end of Huntington Valley. This added up to ten daysto their travel time versus the northern Fort Hall Overland Emigrant Trail route, which came downto the Humboldt River main stem from the northeast using the Thousand Springs Valley route in theMary’s River sub-basin. As a result of the disadvantages of this route, the southern Hastings Cutoffroute was virtually abandoned by the early 1850’s.
In other matters of historical significance, in December 1845, John C. Frémont undertook his thirdexpedition into the west and his second into the Great Basin region.111 The Third Frémont (GreatBasin) Expedition entered the Great Basin from the east, separating at Whitton Spring (now knownas Chase Spring) in Independence Valley to the east of the Ruby Mountains in eastern Nevada. Themain group, under Theodore Talbot and guided by Joseph Walker, crossed the Ruby Mountains atSecret Pass and proceeded down Secret Creek and then Soldier Creek to the Humboldt River,intercepting the main stem near present-day Halleck, Nevada. A smaller party under the commandof Frémont and guided by Kit Carson headed off to the south down Ruby Valley and crossed theRuby Mountains at Harrison Pass, eventually arriving at Walker Lake nineteen days later. Three dayslater the Talbot–Walker group, which had used the Humboldt River Valley route, joined Frémont atWalker Lake.
It was during this expedition that Frémont assigned the name Humboldt Mountains to the imposingRuby Mountain Range.112 Then in September 1854, a member of Colonel E.J. Steptoe’s detachmentsearching for a feasible military route across central Nevada found “rubies” (actually garnets) in hisgold pan while prospecting one of the streams above Ruby Valley (east side of the Ruby Mountainrange) near Hastings Pass (later renamed Overland Pass). Based on this chance discovery, the rangewas then named the Ruby Mountains by Colonel Steptoe, replacing the name Humboldt Mountainsassigned by Frémont in 1845 during his Great Basin Expedition.113
In terms of topographic characteristics, the Ruby Mountains sub-basin shows even greater variationin its topography than the Mary’s River sub-basin to the north. After the Toiyabe Range in the ReeseRiver sub-basin, the Ruby Mountains are the second highest mountain range in the Humboldt RiverBasin. Crest elevations of the Ruby Mountains extend up to 11,387 feet MSL (Ruby Dome) with thelower portions of the basin at approximately 5,000 feet MSL. These differences in elevation fromvalley floor to mountain uplands have resulted in significant climatological differences and especiallyvariations in precipitation throughout the sub-basin, greatly affecting vegetation types over relatively

Humboldt River Chronology—Part I DIVISION OF WATER PLANNING
I–44 Nevada Water Basin Information and Chronology Series
short distances. Along the crest of the Ruby Mountains around Ruby Dome, annual precipitationranges from 40-45 inches above 10,000 feet MSL, whereas at the lower elevations annualprecipitation measures only around seven inches.114
In terms of plant coverage, sagebrush-grass constitutes the predominant plant cover over much ofthe Ruby Mountains sub-basin. In the Ruby Mountains area of the sub-basin, the sagebrush overstoryon the lower southern and western exposures yields to chokecherry (Prunus virginiana), snowberry(Symphoricarpos spp.), serviceberry (Amelanchier alnifolia), bitterbrush (Purshia tridentata) andsmall rabbitbrush (Chrysothamnus viscidiflorus) as the elevation increases. Between 7,500 and 9,000feet MSL, mountain mahogany is found on many of the southern and western exposures. Rockspirea(Holodiscus discolor) is also found in this same exposure and elevation zone on drier and rockierslopes. On the northern exposures and extended valleys of the Ruby Mountains, dense groves ofaspen may be found, giving way to scattered stands of limber pine and some white bark pine (Pinusalbicaulis) above 8,500 feet MSL. Small stands of subalpine fir and, rarely, white fir (Abiesconcolor), may also be found at these upper mountain elevations; however, none of these coniferstands presently offer any commercial logging value. It has been estimated that high-altitude conifersconstitute less than one percent of the Ruby Mountain’s total vegetation.115
In the Sulphur Spring and Pinon (Pinyon) Mountain ranges running along the western portion of theRuby Mountains sub-basin, the sagebrush-grass vegetation types on the lower slopes give way tostands of mountain mahogany and pinyon-juniper, primarily juniper (Juniperus utahensis) in this area.Greater concentrations of pinyon (Pinus monophylla) may be found on the slopes of the RubyMountains north of Harrison Pass. Extensive stands of juniper also occur on the broken hills southof White Flats, between Dixie Creek and lower Huntington Creek, and on the southern and easternexposures of Grindstone Mountain (7,377 feet MSL), located north of Dixie Flat. Very few standsof aspen are found in the relatively short canyons emanating from the mountain ranges along the sub-basin’s western border. Somewhat extensive stands of cottonwood may be found in the semi-wetmeadows along the South Fork of the Humboldt River from above Lee to the South Fork’s junctionwith Huntington Creek at Twin Bridges. In the irrigated areas of the Ruby Mountains sub-basin,cottonwoods have generally been replaced by narrow strings of willows along the stream margins andthe irrigation ditches.116
North Fork Humboldt River Sub-Basin
The North Fork Humboldt River sub-basin is a southward-draining tributary to the Humboldt Riverlocated in central Elko County and consists of one hydrographic area: Nevada hydrographic area 44,North Fork Area. The North Fork sub-basin has a surface area of approximately 1,110 square miles.Among the eleven sub-basins within the Humboldt River Basin, the North Fork sub-basin ranks asthe seventh largest with 6.6 percent of the basin’s total surface area. The North Fork sub-basinencompasses the northern and eastern drainage of the Humboldt River system lying between theMary’s River sub-basin to the east and the Maggie (and Susie) Creek sub-basin to the west. To thesouth of this sub-basin lies the Humboldt River and the Elko Reach sub-basin and the northern borderof the Ruby Mountains sub-basin. To the northeast, north and northwest, the North Fork sub-basinis bordered by the Snake River Basin (Nevada Hydrographic Region 3).

DIVISION OF WATER PLANNING Humboldt River Chronology—Part I
Nevada Water Basin Information and Chronology Series I–45
Figure 10 – North Fork Sub-Basin
The North Fork sub-basin is drained virtually entirely by the North Fork of the Humboldt River alongwith its principal tributaries of Pie Creek and Beaver Creek. The headwaters of the North Fork lieapproximately 65 miles upriver to the north from theHumboldt River main stem at the foot of theIndependence Mountains and some five miles northof McAfee Peak (10,439 feet MSL). The sub-basinis confined by a ridge of low hills separating it fromthe Mary’s River sub-basin to the east, broken hillsand mountains to the north separating it from theSnake River Basin, and the IndependenceMountains to the west separating it from the MaggieCreek sub-basin. To the south, the lower portion ofthe Adobe Range separates the North Fork sub-basin from the Elko Reach sub-basin within theHumboldt River system.
Due to its remoteness and ruggedness, much of theNorth Fork sub-basin saw little early explorationand settlement until May 1869. At that time, silverchloride deposits were discovered by the James(Jesse) Cope party of prospectors on the upper East Fork of the Owyhee River, located just beyondthe northern border of the North Fork sub-basin drainage. The Cope Mining District was establishedwith Mountain City as its center of operations. Also in this year, Columbia, Cornucopia andTuscarora began extensive production of silver in areas adjacent to the upper reaches of the NorthFork of the Humboldt River. The increased economic activity of these mining endeavors had aprofound influence on the agricultural and transportation development within the North Fork sub-basin.117 The importance of mining to the development of the upper Humboldt River’s sub-basinscan be appreciated from a June 1869 article in the Elko Independent. The article stated that 30 to40 Central Pacific Railroad freight cars unloaded daily at Elko with machinery and supplies for themining camps to the north and south of Elko. The railroad’s records showed that receipts in thismonth alone for both passengers and freight exceeded $5,000 per day. Within two months (August1869), when the freight wagon traffic to the Cope, Cornucopia and Columbia mines to the north ofElko had taken off, these receipts had grown to $5,000 per day for freight alone.118
Even by July 1869, the North Fork sub-basin’s isolation remained largely well preserved. In thismonth, the Elko Independent commented on this fact, describing the North Fork of the HumboldtRiver as a beautiful, fertile, but nameless valley, “the paradise of Nevada”, on the proposed road tothe Cope Mining District, in which no settler had yet pitched his tent. But that was soon to changewith the completion of the Elko and Idaho Toll Road in October 1869. This freight and passengerroad ran north from Elko along the North Fork Humboldt River drainage and through Mountain Cityand the Cope Mining District to the Idaho state line. At that point it connected with the IdahoCentral Toll Road to Silver City and Boise City.119 But these early mining influences would not lastfor long, and even to this day the valley of the North Fork of the Humboldt River remains, in effect,nameless, remote and relatively isolated, except for Nevada State Highway 225 which runs throughits uppermost portion.

Humboldt River Chronology—Part I DIVISION OF WATER PLANNING
I–46 Nevada Water Basin Information and Chronology Series
Shortly after the initial surge in nearby mining activity, around 1870, the range potential of the NorthFork sub-basin was recognized when Dan Murphy acquired and stocked with Texas longhorn cattlethe area comprising the present Devil’s Gate, Haystack and Rancho Grande ranches. Daniel Murphywas one of the sons of Martin Murphy, of the famous Stevens-Murphy-Townsend wagon train whichhad traversed the Humboldt River Basin in 1844 en route to California. This wagon train wassingular as it was the first emigrant train to use the Truckee River and Donner Pass route over theSierra Nevada. Mr. Murphy’s ranch headquarters was established at Halleck, which up until the early1900’s was the railroad shipping point for the Murphy-Morgan Hill Ranches and was well knownthroughout the state as a bustling, boisterous and roistering cow town.120
After the disastrous cattle losses of the “White Winter” of 1889-90, sheep began to move into theNorth Fork sub-basin. By early 1906, several large sheep outfits had bought, leased or homesteadedenough key acreage to effectively control the summer range not only in the Independence Mountainwatersheds but also in the high country formerly used as Daniel Murphey’s summer range aroundGold Creek and the headwaters of the Bruneau River (Snake River Basin), which lies adjacent to thenorthern boundary of the North Fork sub-basin. In an effort to protect the valuable watershed sourceareas of the North Fork sub-basin from growing threats from extensive grazing operations, in May1906 the federal government established the Independence Forest Reserve. This action made possiblethe initiation of a grazing management program aimed at preventing further deterioration of the highwater-yielding lands in the Independence Mountain Range. On July 1, 1908, the Independence ForestReserve and the Ruby Mountains Forest Reserve (located in the Ruby Mountains sub-basin) wereconsolidated into a new unit called the Humboldt National Forest. Forest headquarters wereestablished at Elko, Nevada.121
Heavy grazing by sheep ranchers continued to supplant cattle ranching in the upper reaches of theNorth Fork sub-basin and dramatically changed the vegetation patterns and promoted extensive gullyerosion throughout the sub-basin’s upper and middle drainage areas. By 1911, sheep ranchers beganto homestead the lower Beaver Creek area in the sub-basin, thereby controlling virtually all of theformer cattle range within this lower drainage area. In just a few years, the extensive flocks and“huge” numbers of sheep of both resident ranchers and transient sheep outfits had virtually devastatedthe natural vegetation throughout an extensive area and reduced much of the soil-holding grasslandsacross significant portions of the sub-basin. These activities effectively changed the landscape froma well-vegetated state of desirable perennial grasses and forbs and fostered extensive sheet and gullyerosion.122
Topographically, the North Fork sub-basin consists of three distinct land forms: the mountainhighlands, the valley uplands and the valley lowlands. Elevations with the sub-basin extend fromabove 10,000 feet MSL in the Independence Mountains to just over 5,000 feet MSL at the NorthFork’s confluence with the Humboldt River main stem.. Based on this relatively extreme range inelevations, precipitation measures also show wide variations, ranging from approximately 35 inchesaround Jacks Peak (10,198 feet MSL), which is located some three miles south-southwest of McAfeePeak, to 8-9 inches in the sub-basin’s lower bottom and bench lands.123 The predominant plant coverover much of the sub-basin is the big sagebrush-grass varieties. Low sagebrush (Artemisis arbuscula)and grasses are found on large claypan bench lands on the northern and western slopes of the AdobeRange in the southern portion of the sub-basin, extending along the middle and upper reaches of the

DIVISION OF WATER PLANNING Humboldt River Chronology—Part I
Nevada Water Basin Information and Chronology Series I–47
North Fork drainage. Expanses of phreatophytes, principally rubber rabbitbrush and somegreasewood exist along the lower North Fork bottom lands between Devil’s Gate (located some 18miles upstream from the Humboldt River) and along the Humboldt River main stem. Willows alsoline much of the North Fork’s channels from south of the Devil’s Gate Ranch all the way to theheadwaters of the North Fork and its tributaries.
On the national forest lands in the Independence Mountains, aspen is prevalent and interspersed withsmall mixed grass-forb meadows which occupy the bottoms and small basins of the North Fork’stributaries. Covering much of the drier slopes in the Independence Mountains is a combination ofsagebrush-browse-grass vegetation, giving way to mixed stands of subalpine fir and limber pine inthe high basins and on the north and easterly exposures. The perennial native grasses – bluebunchwheatgrass (Agropyron spicatum), Idaho fescue (Festuca idahoensis) and Nevada bluegrass – whichonce constituted the predominant understory of the sagebrush-grass and mixed browse-aspen-grasscover types, have largely disappeared over much of the North Fork sub-basin. These more desirableforage varieties are now found in significant quantities only on the national forest lands or onprotected, remote or inaccessible relict areas and privately owned range lands. Through extensivegrazing operations, these preferred perennial grass and forage varieties have been largely replaced bycheatgrass and other less desirable forage types such as big sagebrush, Sandberg bluegrass,bottlebrush squirreltail and lesser amounts of needlegrass.124
The vegetation of the North Fork sub-basin has also been adversely impacted by periodic over-populations of beaver on the headwaters of many of the streams emanating from the IndependenceMountains. In the past, extensive destruction to aspen groves by the numerous beaver have beenexperienced on Winters Creek, upper Ganz Creek, Pratt Creek and the upper North Fork itself. Thedestruction of these aspen groves has severely affected the soil-binding capabilities of these upperwatersheds as well as harmed the aesthetic and recreational value of these areas.125
Maggie Creek Sub-Basin
The Maggie Creek sub-basin is a southward draining tributary to the Humboldt River lying in thesouthwest portion of Elko County and the extreme northeast corner of Eureka County. This sub-basin has a total surface area of approximately 619 square miles. Among the eleven sub-basins withinthe Humboldt River Basin, the Maggie Creek sub-basin ranks as the second smallest sub-basin withonly 3.7 percent of the basin’s total surface area. The Maggie Creek sub-basin consists of twodefined Nevada hydrographic areas: Nevada hydrographic area 50, the Susie Creek Area whichcovers 223 square miles, and Nevada hydrographic area 51, the Maggie Creek Area covering 396square miles. This maple-leaf shaped sub-basin extends north from the Humboldt River’s main stemat Carlin with most of it lying within Elko County and a smaller portion in Eureka County.126

Humboldt River Chronology—Part I DIVISION OF WATER PLANNING
I–48 Nevada Water Basin Information and Chronology Series
Figure 11 – Maggie Creek Sub-Basin
The Maggie Creek sub-basin drains a relatively small area consisting of two sub-drainage areas toinclude the Maggie Creek drainage occupying the western and northern portions of the sub-basin andabout 64 percent of the sub-basin’s total area, and the smaller Susie Creek drainage covering some36 percent of the eastern portion of the sub-basin. The Maggie Creek sub-basin is wedged betweenthe North Fork sub-basin to the east, the Battle Mountain sub-basin to the west, the Elko Reach sub-basin to the south and southeast, and the Snake River Hydrographic Region to the north. The basinis bound by the Adobe Range to the southeast, the Tuscarora Mountains to the west, the HumboldtRiver to the south and is divided essentially downits center by the southern extension of theIndependence Mountain Range.
The headwaters of Susie Creek originate on theeastern slopes of the Independence Mountains withthe highest elevation being Lone Mountain (8,657feet MSL). Other Susie Creek tributaries have theirheadwaters located in the Adobe Range. Theheadwaters of Maggie Creek originate between theeastern slopes of the Tuscarora Mountains and thewestern slopes of the Independence Mountains withthe highest elevation being Beaver Peak in theTuscarora Mountains at 8,786 feet MSL. Thelowest part of the sub-basin is located around Carlinon the Humboldt River main stem at just overapproximately 4,900 feet MSL.
Due to its relatively isolated and inaccessible nature, except for the portion of the sub-basin in theCarlin area, the Maggie Creek sub-basin did not figure prominently in any early exploration, emigranttransportation or settlement patterns. The first recorded development of agriculture within the sub-basin occurred in July 1868 when J.A. Palmer took up lands for farming along the Humboldt Riverand a portion of lower Maggie Creek.127 Carlin, the oldest town in Elko County, was established inDecember 1868 as a railroad division point by the Central Pacific Railroad. When the railroadconstruction crews reached the Carlin Meadows, always a favorite stopping place for early wagontrains along the California Emigrant Trail, a town site was laid out and a large roundhouse and shopswere erected.
The town of Carlin grew rapidly, vying over time with Elko and Palisade for the stage and freightingbusiness to Bullion, Mineral Hill, Eureka and other booming mining communities to the south. In1872, Carlin became a rival of not only Elko, but also Winnemucca and Battle Mountain as a shippingpoint for the silver, lead and gold ores from the Cornucopia, Tuscarora and Bull Run Mining Districtsto the north in the Snake River drainage.128 In September 1872, in order to facilitate the direct accessto the northern mining districts, Woodruff & Ennor, a well-known staging and freighting firm of thisperiod, built a toll road north from Carlin up Maggie Creek, traversing Taylor Canyon and exitingfrom the sub-basin into Jack’s Valley, Tuscarora and Cornucopia.129
The growing of small grains along the lower Maggie and Susie Creeks began in 1869 and met with

DIVISION OF WATER PLANNING Humboldt River Chronology—Part I
Nevada Water Basin Information and Chronology Series I–49
some success. On July 14, 1969, the Elko Independent newspaper commented on the luxuriant barleycrops being raised along Maggie Creek. Around 1870 the sub-basin’s agriculture industry began itstransformation from grains to livestock and animal feed. At this time, Dr. G.W. Grayson, a SanFrancisco physician, began the Horseshoe Ranch at Beowawe which, until more recent times, wasamong the oldest and one of the largest cattle ranches in eastern Nevada. Under the Horseshoe-Barbrand, the ranch owned or controlled over 200,000 acres in Elko, Eureka and Lander counties,including the Horseshoe Ranch on Maggie Creek. Around 1875, the agricultural pursuits in manysub-basins within the upper Humboldt River Basin underwent a more substantive change from theproduction of small grains and agricultural produce to the raising of livestock, particularly cattleraising.130 By 1875, carloads of cattle were being shipped from Carlin and Beowawe from rancheswhich included extensive acreage in the Maggie Creek sub-basin.131
Around 1875, Tom and William Hunter began grazing cattle in the Susie Creek drainage. Around1910, George Hunter, Tom’s son, formed a partnership with George Banks and the resultant firm,Hunter and Banks, became one of the largest cattle operations in eastern Nevada. At its peak, thispartnership boasted a herd of at least 5,000 head of cattle along Susie Creek, extending from its lowerreaches upstream to Lone Mountain (8,657 feet MSL). A combination of drought and hard timeseventually forced the dissolution of the company in 1925. In 1877 the W.T. Jenkins Company wasestablished at Battle Mountain and began grazing cattle and sheep on 278,000 acres of deeded landsin Lander, Pershing and Elko counties, including the Stampede Ranch on the upper portions ofMaggie Creek.132 In addition to extensive cattle and sheep herds being sustained on the bench landsand open grassy ridges in the Maggie and Susie Creek watersheds, the sub-basin also sustainedextensive herds of horses in this period of open range use. On June 18, 1890, the Winnemucca SilverState newspaper reported that approximately 650 head of horses had perished in the snows of upperMaggie and Susie Creeks as a result of the “White Winter” of 1889-90.133
Topographically, surface elevations within the Maggie Creek sub-basin vary from between 8,000 feetto nearly 9,000 feet in both the Independence and Tuscarora Mountains to under 5,000 feet at Carlinalong the Humboldt River main stem. Climatologically, this variation in topography has resulted inwide variations in localized precipitation as well. The average annual precipitation typically variesfrom seven inches in the vicinity of Carlin to approximately 12 inches per year in the Adobe Range(6,000 to 7,000 feet MSL), 20 inches in the Independence Mountains (8,000 to 9,000 feet MSL), to25 inches along the crest of the Tuscarora Mountains at elevations of 8,000 to 9,000 feet MSL. Ithas been estimated that nearly 70 percent of the Maggie Creek sub-basin’s gross water yieldoriginates on the U.S. Bureau of Land Management (BLM) managed public lands located in theTuscarora Mountains.134
Based on the sub-basin’s variations in topography and climate, the Maggie Creek sub-basin alsoshows wide differences in vegetation types and coverage. The predominant vegetative cover overmuch of the sub-basin is big sagebrush-grass. Low sagebrush is found on large claypan bench siteson the south extremity of the Independence Mountains lying between Maggie and Susie Creeks.Similar coverage and claypan benchlands are found west of Maggie Creek in the northwest portionof the sub-basin on the eastern slopes of the Tuscarora Mountains. Extensive areas of blacksagebrush (Artemisia nova) and grass coverage are found on the shallow-soiled steep mountain slopesand mountain tops from 6,500 feet to over 8,000 feet MSL along the Tuscarora Range west of

Humboldt River Chronology—Part I DIVISION OF WATER PLANNING
I–50 Nevada Water Basin Information and Chronology Series
Figure 12 – Elko Reach Sub-Basin
Maggie Creek.135
At one time, more extensive meadows of ryegrass existed along both Susie and Maggie Creeks;however, these areas have been greatly desiccated and reduced by the deep gullying (i.e., erosion)along both of these stream systems. This has allowed the spread of rabbitbrush into much of theseformer grassland areas. Small amounts of willow occur in areas lining the upper portions of Susieand Maggie Creeks and their tributaries, such as Coon Creek, Lone Mountain Creek, Cold Creek,Blue Basin Creek and others. Stands of aspen grow in scattered areas along the water courses in thehigh drainages at the headwaters of Beaver, Coyote and other streams draining the TuscaroraMountains. Similar aspen stands may be found on the west side of Lone Mountain in theIndependence Mountains at the head waters of Coon and Lone Mountain Creeks, among others.There are no extensive stands of conifers within the sub-basin, except for scattered clumps of limberpine along the Lone Mountain crest (Independence Mountains), and scattered stands of juniper in theAdobe Range just north of the Humboldt River.136
Elko Reach Sub-Basin
The Elko Reach sub-basin of the Humboldt River system includes the river’s bottomlands and smalltributaries to the Humboldt River main stem between Rydon and Palisade, Nevada, a distance ofapproximately 45 miles. Through this reach, the Humboldt River runs in a generally southwesterlydirection. The Elko Reach sub-basin has a total surface area of approximately 375 square miles andis the smallest of the eleven Humboldt River sub-basins, comprising only 2.2 percent of the basin’stotal surface area. The Elko Reach sub-basin includes two of Nevada’s hydrographic areas, Nevadahydrographic area 49, Elko Segment, and Nevada hydrographic area 52, Mary’s Creek Area. TheElko Segment contains 314 square miles and comprises nearly 84 percent of the sub-basin’s totalarea, while the Marys Creek Area contains 61 square miles and 16 comprising percent of the sub-basin’s total surface area.
Humboldt River flows through the Elko Reach sub-basin are affected by major tributaries entering fromother sub-basins either upstream of the Elko Reachsub-basin – Mary’s River and upper Humboldt River(Mary’s River sub-basin), North Fork HumboldtRiver (North Fork sub-basin), Lamoille Creek (RubyMountains sub-basin) – or entering directly withinthe sub-basin – South Fork Humboldt River (RubyMountains sub-basin) and Maggie and Susie Creeks(Maggie Creek sub-basin). Other small tributariesalso empty directly into the Humboldt River mainstem through this reach. Due to the limited drainageareas contained within this sub-basin, most of thesesmaller direct tributaries are seasonal or ephemeralstreams and include (in upstream to downstreamorder) Jackstone Creek, Sherman Creek, KittridgeCreek, East Adobe Creek, Tonka Creek, Marys

DIVISION OF WATER PLANNING Humboldt River Chronology—Part I
Nevada Water Basin Information and Chronology Series I–51
Creek and Woodruff Creek.
Geographically, most of the Elko Reach sub-basin is located in southwestern Elko County with theextreme downstream portion of the sub-basin, to include most of the Marys Creek drainage, locatedin northeastern Eureka County. The sub-basin is totally enclosed by other Humboldt River sub-basins, to include the North Fork sub-basin on the north, the Ruby Mountains sub-basin to the eastand southeast, the Pine Valley sub-basin to the south, and the Maggie Creek sub-basin to thenorthwest and west. Downstream, the Elko Reach sub-basin connects directly to the Battle Mountainsub-basin. Due to the restricted nature of this sub-basin to small drainage areas contiguous to theHumboldt River main stem, the sub-basin’s topography does not reflect the extremes in elevationswhich characterizes surrounding, more expansive sub-basins, which tend to include both lowlandvalley basins and lofty mountain ranges. To the east, the Elko Reach sub-basin is bordered by theElko Hills with Elko Mountain (7,505 feet MSL) and Grindstone Mountain (7,377 feet MSL) andto the west the sub-basin is enclosed by the Adobe Range and Mouse Mountain (7,475 feet MSL).Downstream, the Marys Creek drainage includes Marys Mountain at 6,704 feet MSL. The lowestelevation within the sub-basin is located at Palisade, which is at an elevation of just over 4,800 feetMSL.
Due to its strategic location along the Humboldt River main stem, the Elko Reach sub-basin hasfigured prominently in virtually all events pertaining to early exploration, emigration, transportationand commerce. On November 9, 1828, Peter Skene Ogden, a fur trapper for the Hudson BayCompany, led a party of trappers comprising the Fifth Snake County Expedition south from theColumbia River Basin and was the first visit by Europeans to the Humboldt River Basin.137 Comingdown the Little Humboldt River through Paradise Valley, Ogden found the Humboldt River linedwith willows and well-stocked with beaver. At first, he explored the river to the west anddownstream for several days, but was then forced upriver by bad weather.138 On December 12, 1828,Ogden and his party passed the location of present-day Elko.139 It was during this expedition that oneof Ogden’s trappers, Joseph Paul, died and was the first European to be buried along the HumboldtRiver.
Known by many names – Ogden’s River, Mary’s River, Paul’s River, Barren River, Swampy Riverand Unknown River – the Humboldt River was later (1848) and finally named by John C. Frémontafter Baron Alexander von Humboldt, a German scientist whom Frémont admired, but who had nevereven seen the river.140 This river valley, first explored in its entirety by Peter Ogden during 1828 and1829, would soon become the most important transportation corridor for early emigrants traversingthe Great Basin on their way to California by means of the Overland Emigrant Trail. Basically, therewere two early routes into the Humboldt River Basin as part of the Emigrant Trail which broughtearly wagon trains into the Elko Reach sub-basin. The Fort Hall route came down from northeasternNevada using the route through Thousand Springs Valley to Humboldt Wells, while the HastingsCutoff route brought emigrants through the Ruby Mountains and down Huntington Creek and theSouth Fork of the Humboldt River to the Humboldt River main stem just below the present-day siteof Elko, Nevada.
The period of emigration and the development of early transportation routes through this regionbegan in 1841 with the Bartleson–Bidwell emigrant party, which made the first successful crossing

Humboldt River Chronology—Part I DIVISION OF WATER PLANNING
I–52 Nevada Water Basin Information and Chronology Series
of the Great Basin, passing directly through most of the Elko Reach sub-basin using the HastingsCutoff route.141 Between this time and the completion of the Central Pacific Railroad in 1868, theElko Reach sub-basin served as a portion of the primary western route to California for thousandsof wagons and countless emigrants. The route was not an easy one, however. The entire passagedown the Humboldt River Valley’s over 300 miles generally took as much as three weeks under themost favorable circumstances, and the weary emigrants and their oxen, mules and horses all sufferedgreatly in the process. By late summer, the lack of precipitation and the heavy traffic made animalforage extremely scarce along the route and available springs could not always be relied upon late inthe season. And then there was the river itself. As noted somewhat derisively in 1849 in the diaryof Elisha D. Perkins: “The stream itself does not deserve the name of river being only a good sizedcreek…For the first days travel in its valley the grass is splendid, then the valley begins to narrow andfeed to get poorer and less of it all the rest of its course, till for the last 80 miles, except in specialspots we could hardly get enough for our mules to eat and water barely drinkable from saline andsulphurous impregnation and having a milky color. I think Baron Humboldt would feel but littlehonored by his name being affixed to a stream of so little pretension.”142
The Elko Reach sub-basin’s agricultural industry began its rapid expansion around 1868 with theraising of hay and grains for the draft animals used to pull the huge “sagebrush clipper” freightwagons and the Concord coach stagecoaches on the north-south toll roads serving the various miningdistricts. Construction of the Central Pacific Railroad through the sub-basin from November 1868through January 1969 heralded the demise of the era of the covered wagon. By the 1870’s, extensiveherds of Texas longhorn cattle were brought into the sub-basin to feed on the lush ryegrass in thelower meadowlands and the native bunch grasses on the upper slopes and hillsides. With the demiseof the mining industry in the late 1870’s, the towns of Elko, Carlin and Palisade, which began theirexistence as freight and shipping points for the bustling mining communities to the north and south,now became important embarkation points for the region’s cattle ranching industry.143
Variations in elevation within the Elko Reach sub-basin are not as great as other sub-basins withinthe upper Humboldt River Basin. Mountain peaks are below 8,000 feet MSL (Elko Mountain, 7,505feet MSL; Grindstone Mountain, 7,377 feet; and Mouse Mountain, 7,475 feet) and the lowest pointin the basin, Palisade, lies slightly above 4,800 feet in elevation. Precipitation measures across theElko Reach sub-basin range from about 7 inches at Carlin on the Humboldt River to between nineand 15 inches in the mountain highlands above 6,000 feet. Big sagebrush and invasive cheatgrassmake up the predominant plant cover over most of the upland bench lands and intermediate mountainslopes within the sub-basin. Juniper may be found on the low rolling hills south of the HumboldtRiver from Elko Mountain, nine miles northeast of Elko, Nevada, to the rolling uplands west ofGrindstone Mountain, located nearly 12 miles southwest of Elko. A small amount of single-leafpinyon pine may be found with the juniper on Grindstone Mountain as well. North of the HumboldtRiver, small expanses of juniper are present near the ridge tops from Carlin Canyon to ShermanCreek. A few small groves of aspen are also located on the north side of the river in the upperreaches of Sherman and Jackstone Creeks. Willows may be found in the Elko Reach sub-basin alongthe natural water courses and the irrigation ditches.144
Pine Valley Sub-Basin

DIVISION OF WATER PLANNING Humboldt River Chronology—Part I
Nevada Water Basin Information and Chronology Series I–53
Figure 13 – Pine Valley Sub-Basin
The Pine Valley sub-basin is a northward-draining tributary to the Humboldt River lying south ofPalisade, Nevada, situated mostly in north-central Eureka County and extending into a relatively smallportion of southwestern Elko County. The sub-basin has a total surface area of approximately 1,002square miles and is the ninth largest of the eleven sub-basins within the Humboldt River Basin,comprising nearly 6.0 percent of the basin’s total surface area. The Pine Valley sub-basin consistsof one hydrographic area, Nevada hydrographic area 53, Pine Valley. Within the sub-basin there alsoexist several distinct watersheds to include Henderson Creek in the extreme southern portion of thesub-basin, Denay Creek in the southwestern portion of the sub-basin, the Upper Pine Creekwatershed in the central portion of the sub-basin, and the Lower Pine Creek watershed in the northernportion of the sub-basin and joining the Humboldt River main stem just below the U.S. GeologicalSurvey’s Palisade gaging station location.
Geographically, the Pine Valley sub-basin drains a relatively narrow, north-south running valleywithin the south-central part of the Humboldt River Basin and is wedged between the RubyMountains sub-basin to the east and the Reese River sub-basin to the west. To the north lies theHumboldt River and to the southeast, south and southwest lies the Central Region (NevadaHydrographic Region 10). The Pine Valley sub-basin is bounded by the Pinyon Range in thenortheast (Ravens Nest, 8,710 feet MSL and Pine Mountain, 8,285 feet MSL), the Sulphur SpringsRange extending down the eastern side of the sub-basin (Coffin Mountain, 8,168 feet MSL, BaldMountain, 7,686 feet MSL, and Mineral Hill, 7,439feet MSL), the Roberts Range in the south (RobertsCreek Mountain, 10,133 feet MSL), the SimpsonPark Mountains in the west and southwest (TwinPeaks, 7,625 feet MSL), and the Cortez Mountains(Mount Tenabo, 9,162 feet MSL) extending alongthe western and northwestern portion of the sub-basin. The Humboldt River and the Elko Reach sub-basin constitute the northern boundary of the PineValley sub-basin.
The Pine Valley sub-basin remained relativelyisolated and unchartered through the HumbodltRiver Basin’s early exploration and emigrationperiod of the first half of the 1800’s. During thisperiod, the sub-basin was only infrequently visited by early fur trappers, remaining largely a haunt ofWestern Shoshone Indians. During the 1841-1868 emigration period, the lower portion of PineValley was occasionally crossed by emigrant parties using the Woodruff Canyon-Crescent Valleybypass of the narrow Palisade Canyon. More extensive penetration and exploitation of the PineValley sub-basin and its grass and timber resources began with the arrival in late 1868 of the CentralPacific Railroad at Palisade (first named Palisades). Due to the naturally constricted nature of anytownsite in Palisade Canyon, at first the Central Pacific Railroad refused to establish a townsite anddivision point at that location. However, the subsequent emergence of the Eureka and Mineral Hillmining districts to the south showed the distinct benefits of this location as well as establishing afreight transportation route directly through Pine Valley.

Humboldt River Chronology—Part I DIVISION OF WATER PLANNING
I–54 Nevada Water Basin Information and Chronology Series
The “sagebrush clipper” freight wagons and the stagecoach reigned supreme along the Palisade-PineValley-Eureka route from June 1870 until the construction of the Eureka & Palisade Railroad .145
The ninety-mile narrow gauge (3-foot) Eureka & Palisade Railroad was completed through PineValley in late 1875 to accommodate the growing freight traffic to and from the lead and silver minesat Eureka and the mines at Mineral Hill in Pine Valley and Cortez in Crescent Valley to the west ofthe Cortez Mountains. The Eureka & Palisade Railroad provided the primary economic stimulus andaccess to the Pine Valley sub-basin and served the sub-basin’s development until its forcedabandonment in 1938 due to increased highway truck traffic. Its only extended break in service camein 1910 when a disastrous winter flood, very possibly the worst flood event to visit the HumboldtRiver Basin in recorded history, washed out nearly one-third of the railway’s track.146
The Pine Valley sub-basin’s agricultural industry began to develop in the early 1870’s when hay wasgrown to serve the needs of the large numbers of draft animals used on the stage and freight roadsconnecting Palisade with the Mineral Hill, Eureka and the White Pine mines to the south. With thecompletion of the Eureka & Palisade Railroad in 1875 and the curtailment in freight and stage trafficthrough the valley, much of the area’s hay production was then shipped out of the sub-basin. Theagriculture industry shifted to dairy ranching during the late 1870’s and 1880’s, primarily in the lowerportion of the Pine Valley sub-basin. The open-range livestock industry also took off at about thistime and continued to expand throughout the sub-basin until the disastrous “White Winter” of 1889-1890. Numerous livestock of all kinds starved and froze to death during this severe winter event,proving the impracticality of wintering large herds of livestock on the open range without adequatesupplemental feed. After 1890 the sub-basin’s ranching industry began a slow and gradual recoverycharacterized by fewer farms and ranches, but of typically larger size.147
In terms of topography and its effects on precipitation within the Pine Valley sub-basin, elevationswithin the sub-basin range from a maximum of just over 10,000 feet MSL in the southern part of thesub-basin (Roberts Mountains) to just over 4,800 feet MSL at Palisade along the Humboldt River.While high peaks and mountain ranges virtually surround Pine Valley – Roberts Creek Mountain(10,133 feet MSL) in the Roberts Mountains, Mount Tenabo (9,162 feet MSL) in the CortezMountains, and Ravens Nest (8,710 feet MSL) in the Pinyon Range – precipitation at these elevationsis generally significantly less than in other sub-basins within the upper reaches of the Humboldt RiverBasin. The higher elevations in the Roberts Mountains, located in the southern portion of PineValley, receive about 16 to 18 inches of precipitation each year while the annual average precipitationin the lower portions of the sub-basin is about 8-9 inches.148
Based on these variations in altitude and climate, the Pine Valley sub-basin also shows wide variationsin its vegetative cover. The predominant plant cover over much of the sub-basin is sagebrush-grass.Before the arrival of European settlers and ranchers, the pristine grass understory within the PineValley sub-basin consisted of desirable perennial bunchgrasses such as Idaho fescue and bluebunchwheatgrass, with small amounts of Sandberg bluegrass and the needlegrasses. Extensive grazingthroughout the late 1800’s and early 1900’s decimated much of these native perennial grasses andexposed these areas to the effects of erosion. Since 1910, major flooding and subsequent extensivegully erosion have greatly reduced the extent and condition of the sub-basin’s natural meadowlands,effectively draining these productive grassland areas. As a result, the desiccated meadows, whichconsisted primarily of Great Basin wildrye and some creeping wildrye (Elymus triticoides), have been

DIVISION OF WATER PLANNING Humboldt River Chronology—Part I
Nevada Water Basin Information and Chronology Series I–55
replaced by sagebrush, or non-beneficial phreatophytes such as rubber rabbitbrush and greasewood.
The higher elevations of the Pine Valley sub-basin, located in the Pinyon, Sulphur Springs, SimpsonPark and Roberts mountains, have some extensive growth of pinyon pine and juniper, as well as curl-leaf mountain mahogany, most of which is second growth. However, there still exists little or nograss or herbaceous understory in these areas. Most of the original stands of pinyon pine were clearcut during the 1870’s for the production of charcoal, and pinyon pine is now scarcely found on manyof its former sites in the Pinyon and Sulphur Springs ranges. In these areas, pinyon pine has beenlargely replaced by sagebrush or by juniper, which was not used for early charcoal production.
Small stands of aspen may also be found within the sub-basin in the upper stream bottoms in theCortez Mountains on the west side of Pine Valley, for example, Big and Little Pole Creeks, SheepCreek and other streams. On the east side of Pine Valley, however, aspen stands are more scarce,being principally found at the head waters of Trout Creek and Smith Creek in the Pinyon Range.Limited stands of aspen may also be found along some of the perennial streams flowing north out ofthe Roberts Mountains, which border the southern part of the sub-basin.149
Due to early heavy use of forage and timber resources within the sub-basin, there has resulted aconsiderable change in Pine Valley’s vegetation quantity and quality from early descriptions. From1869-1870 files of the Elko Independent newspaper, one writer described Pine Valley as being a“long, grassy valley, with a clear, silvery stream of water running through the center.” Another writerdescribed the section of Pine Valley running from Palisade to Mineral Hill, located in the SulphurSpring Range, as “one of the most beautiful and fertile in the state, containing a vast amount of finemeadow land.” From other descriptions, the higher mountain slopes were reported as being thicklycovered with bunchgrass, while winterfat, also referred to as white sage (Krascheninnikovia lanata),which has largely disappeared from these areas, clothed the lower slopes and the terraces above thevalley floor.
According to these early reports, the mountain ranges on both sides of Pine Valley were spread “witha thick and tangled growth of mountain mahogany, nut-pine (pinyon pine) and cedar wood.” Themountains (the Sulphur Spring Range) immediately to the east of the now deserted mining camp ofMineral Hill were described in 1870 as “dark round hills, covered with timber.” Today, by contrast,these same hills are virtually devoid of either pinyon pine or juniper cover. In addition, primarily dueto extensive grazing operations, most of the desirable perennial grasses that once covered the slopesand drainages above the stream bottoms have been virtually eliminated and replaced by cheatgrass.Overall, very little of the pristine ground cover that existed before the arrival of European settlersnow remains in Pine Valley.150
Reese River Sub-Basin
The Reese River sub-basin is a north-draining tributary of the Humboldt River extending southwardfrom Battle Mountain and the central portion of the Humboldt River Basin in the north throughLander County into central Nevada and Nye County in the south. From the Humboldt River mainstem, the Reese River drainage extends southward some 150 miles to its headwaters in the southern

Humboldt River Chronology—Part I DIVISION OF WATER PLANNING
I–56 Nevada Water Basin Information and Chronology Series
Figure 14 – Reese River Sub-Basin
portion of the Toiyabe Range below the mountain peaks of Toiyabe Dome (11,788 feet MSL),Toiyabe Dome Southeast Summit (11,353 feet MSL) and Mahogany Mountain (11,165 feet MSL).The Reese River sub-basin is the largest of the eleven sub-basins within the Humboldt River Basin,covering 3,625 square miles and making up 21.5 percent of the Humboldt River Basin’s entire surfacearea.
The Reese River Valley’s southernmost extent thrusts the sub-basin well into central Nevada and theCentral Region (Nevada Hydrographic Region 10). Most of the sub-basin lies within Lander County;however, the eastern portion of Crescent Valley, which is a “closed” (or non-tributary) hydrographicarea within the Reese River sub-basin, extends eastward into Eureka County. The far western portionof the Reese River sub-basin also just touches the eastern boundary of Pershing County. The sub-basin is bound by the Central Hydrographic Region to the west, south and southeast, by the PineValley sub-basin to the east, and by the Humboldt River and Battle Mountain sub-basin to the north.
The Reese River sub-basin incorporates six Nevada hydrographic areas that lie within the HumboldtRiver Basin. However, two of these hydrographic areas are essentially “closed” basins (hydrographicareas) that neither contribute to the flows of the Reese River nor to the flows of the Humboldt River.These include Nevada hydrographic area 54, Crescent Valley, covering 752 square miles, and Nevadahydrographic area 55, Carico Lake Valley, covering376 square miles. Any flows out of Carico LakeValley would enter into Crescent Valley and thencespread out across extensive desert playas locatedthere.
The remaining four hydrographic areas of this sub-basin consist of the Reese River drainage proper andinclude: (1) hydrographic area 56, Upper ReeseRiver Valley, covering 1,138 square miles; (2)hydrographic area 57, Antelope Valley, covering452 square miles; (3) hydrographic area 58, MiddleReese River Valley, covering 319 square miles; and(4) hydrographic area 59, Lower Reese RiverValley, covering 588 square miles.
The Upper Reese River Valley hydrographic areaextends from the river’s headwaters in the Toiyabe Range, located in Nye County, northward throughthe Shoshone Mountain Range in central Lander County. The Middle Reese River Valleyhydrographic area extends from this point to below the Fish Creek drainage, also picking up outflowfrom Antelope Valley. The Lower Reese River hydrographic area extends from this point to theHumboldt River main stem, running northward between the Shoshone Range to the east (MountLewis, 9,680 feet MSL; Goat Peak, 9,060 feet; and Horse Mountain, 8,210 feet) and the northernportion of the Fish Creek Mountains and the Battle Mountain Range (Galena Range) to the west andjust south of the Humboldt River (North Peak, 8,550 feet MSL and Antler Peak, 8,236 feet).
While generally considered as a “tributary” of the Humboldt River, the Reese River, in fact, only

DIVISION OF WATER PLANNING Humboldt River Chronology—Part I
Nevada Water Basin Information and Chronology Series I–57
contributes to the surface water flows of the Humboldt River main stem during high water years, i.e.,flood events, typically from severe wet-mantle storm events151 or the rapid spring meltdown of heavymountain snowpack. In more normal climatological periods, i.e., normal or average water years, theReese River’s surface water flows cease some 10-20 miles short of the Humboldt River south ofBattle Mountain. This can best be seen from Table 6, Lower Humboldt River Principal GagedStream Flows. Based on average water years, the flows at the USGS Battle Mountain gage, locatedabove the Reese River confluence, have averaged 270,040 acre-feet per year, whereas some 35 milesdownstream at the USGS Humboldt River gage at Comus, average year flows have averaged 246,150acre-feet per year. This pattern of diminishing average Humboldt River flows is typical of the river’shydrology below Palisade.152
Early discovery and exploration of the Reese River sub-basin began in November 1854, when JohnReese, the first European known to have explored the Reese River “wilds” to any great extent andfor whom the river was named, left Colonel E.J. Steptoe’s detachment near the present-day site ofBattle Mountain and proceeded up the Reese River Valley.153 In 1859, as a result of his previoussolitary exploration of the Reese River Valley, John Reese was appointed as a guide for Captain J.H.Simpson of the U.S. Topographic Engineers and his party. Captain Simpson had been instructed tofind a route for a good military road to Genoa, located in Carson Valley in western Nevada, and theroute fixed upon became known as the Central Route. This route roughly approximated the cattleand emigrant trail established in 1855 between Salt Lake City and Genoa by Major Howard Egan,Mormon guide, mountaineer, and cattle drover.
The Central Route across Nevada crossed through the Toiyabe Range in the eastern portion of theReese River sub-basin, about three miles north of Austin, then down to Jacobs Springs, located nearthe east bank of the Reese River. From the river, the route finished crossing the Reese River Valleyby cutting through the Shoshone Range to the west about 10 miles west of Jacobs Springs and threemiles north of the present Railroad Pass on U.S. Highway 50. In its early history, this Central Routealso accommodated the Pony Express riders during their 1860-61 brief but highly publicized reign.The route also accommodated the stagecoach, mail, express and freight service from eastern towestern Nevada from 1861 to 1869, as well as the Overland Telegraph Company line, all of whichprovided the earliest access to the central and upper portions of the Reese River sub-basin.154
Battle Mountain, located along the Humboldt River, and Austin, located about 85 miles up the ReeseRiver Valley, represent the only two communities of any significant size within the Reese River sub-basin, and both have interesting early histories. Battle Mountain’s name was derived from themountain range to the southwest of that location where, in 1850, a group of angry Californiaemigrants ambushed a band of Shoshones after the Indians had attacked their wagons. In October1868, the Central Pacific Railroad established the Reese River Siding at the present-day site of BattleMountain, located near the outflow of the Reese River (when it does outflow) and made Argenta(Siding), located five miles eastward (up river), its principal station and point of departure for thebusy mining camps to the south. In January 1870, the Argenta operations were moved in its entiretyto the present-day site of Battle Mountain, and the Reese River Siding was renamed Battle MountainSwitch, creating the town as well.155
Austin, referred to as the mother town of mining camps, essentially began its existence on May 2,

Humboldt River Chronology—Part I DIVISION OF WATER PLANNING
I–58 Nevada Water Basin Information and Chronology Series
1862 when William Talcott, Overland Stage employee and former Pony Express rider, discoveredsilver ore in Pony Canyon near the town’s site. Talcott came from Jacobsville (formerly JacobsSprings), a stage stop six miles to the west on the Reese River, which also served as the first LanderCounty seat. His discovery set off the famous “Rush to Reese” or the “Reese River Excitement” asit came to be known. With this discovery, the Reese River sub-basin’s largely pastoral existence wasdramatically altered and a period of intense exploitation of the area’s timber, mineral, range and waterresources began. A nearby town called Clifton flourished briefly in Pony Canyon, but fast-growingAustin soon took over and became the county seat in 1863, with a population of about 1,200 persons.Early in 1864, Clifton, Austin and Upper Austin were all combined and incorporated as the City ofAustin. Before the mines began to fail in the 1880’s, Austin was a substantial community boastingas many as 10,000 people.156 From Austin, prospectors fanned out to explore Nevada’s vast expanseand establish many other important mining camps throughout central and northern Nevada.157
Livestock raising and ranching operations in the Reese River sub-basin became established in 1862shortly after the start of the Austin mining boom. It was in that year that Lewis R. Bradley, whobecame Nevada’s second Governor (1870-1878), moved to the upper Reese River Valley fromCalifornia with 500 head of Texas longhorn cattle. Along with his son and two other partners,Bradley began the first large-scale ranching operation in Nevada, eventually stocking the lushmeadows of the upper Reese River Valley and the Toiyabe Canyons north and south of Austin withthousands of longhorn cattle. In the 1880’s, 1890’s and early 1900’s, thousands of nomadic andunregulated bands of sheep grazed the upland areas of the Toiyabe and Shoshone Mountain rangesin the middle and upper Reese River sub-basin. Some of the destructive overuse of these uplandwatershed areas was eventually curbed with the establishment in March 1907 of the 600,000-acreToiyabe Forest Reserve, which later became part of the Toiyable National Forest.158
In terms of topography, the Reese River sub-basin shows significant changes in elevation from a lowpoint in the drainage system of just over 4,500 feet MSL at Battle Mountain along the HumboldtRiver to well over 11,000 feet in the Toiyable Range (Toiyabe Dome, 11,788 feet MSL) and over10,000 feet in the southern Shoshone Range (North Shoshone Peak, 10,313 feet MSL). Due to thenature of predominant storm patterns, however, these elevations do not produce nearly the abundanceof precipitation (i.e., snowpack) as do, for example, the Ruby Mountains, which tend to receiveadditional precipitation from more northward-tracking storm systems moving southeasterly from thePacific Northwest.
Average annual precipitation on the irrigated lands in the sub-basin is estimated to vary from sixinches around Battle Mountain and Beowawe to 10 inches in the southern portion of the Reese RiverValley. Precipitation in the mountain regions of the sub-basin varies by elevation and the location ofthe mountain range. In the Toiyabe Range, precipitation typically varies from 12-20 inches per yearin the southern portion at elevations from 7,000 to over 11,000 feet and from 10-25 inches in thenorthern part of the range at elevations of 6,000 to over 11,000 feet. In the Shoshone Range to thewest, annual precipitation levels range from 12-15 inches in the southern end at elevations of 7,000to over 10,000 feet and from 8-15 inches in the north at elevations of 6,000 to 8,500 feet.159
The Reese River sub-basin may be characterized as a “transition zone” among sub-basins within theHumboldt River Basin where the predominance of the big sagebrush-grass vegetation type of the

DIVISION OF WATER PLANNING Humboldt River Chronology—Part I
Nevada Water Basin Information and Chronology Series I–59
river’s upper sub-basins begins to give way to the desert species of shadscale (Atriplex confertifolia)and greasewood plant communities which largely characterize the lower Humboldt River’s sub-basins. These desert plant communities, particularly greasewood intermixed with scattered rubberrabbitbrush, become more prominent in the lower reaches of the Reese River sub-basin, particularlynorth of the Reese River-Fish Creek confluence. Cheatgrass also appears in the less saline sites andwildfire burn sites throughout the sub-basin. South of U.S. Highway 50 in the upper Reese Riverdrainage, big sagebrush occupies the upland benches and terraces along with an understory ofcheatgrass or, less frequently, perennial grasses such as Sandberg bluegrass, Nevada bluegrass, orbottlebrush squirreltail.
On the sub-basin’s upper slopes, big sagebrush eventually gives way to low sagebrush as elevationincreases, usually with a bluegrass understory, along with scattered expanses of bitterbrush. Themountain slopes above the sagebrush areas are generally covered with stands of pinyon pine and Utahjuniper. In the Shoshone Range, juniper predominates, whereas in the Toiyabe Range the pinyon pineare most prevalent. Cheatgrass is also widely distributed in these upper areas as well. On the steepslopes and along the ridge tops, thick stands of mountain mahogany are found on the southern andwestern exposures, and limber pine grow on the northern exposures. These pine stands, particularlyaround Arc Dome, were extensively logged in the mining boom period of the 1860’s and 1870’s. Theupper Reese River area, as well as the upper canyon bottoms of the Shoshone and Toiyabe Mountainranges, are characterized by willow and cottonwood stands giving way to thin stands of aspen at thehigher elevations.160

Humboldt River Chronology—Part I DIVISION OF WATER PLANNING
I–60 Nevada Water Basin Information and Chronology Series
Figure 15 – Battle Mountain Sub-Basin
Battle Mountain Sub-Basin
The Battle Mountain sub-basin is a south and southwesterly-draining area to the Humboldt Riversystem located in the north-central portion of the Humboldt River Basin. The sub-basin’s drainageis essentially divided into eastern and western parts by the southern extent of the Sheep Creek Rangeand other isolated hills and low mountains stretching northward from the Humboldt River at BattleMountain, Nevada. The eastern half of the sub-basin is drained primarily by Rock and BoulderCreeks, with Rock Creek typically being the only perennial (year round) stream flowing along mostof its reach.161 The western half of the sub-basin is drained principally by Kelly and Evans Creeks,both of which produce only seasonal surface water flows. The sub-basin’s most pronounced physicalborders include the Tuscarora Mountains on the east side and the Osgood Range on the west. Tothe north, the Battle Mountain sub-basin is separated from the Little Humboldt River sub-basin bya ridge of relatively low peaks called the Snowstorm Mountains. The sub-basin’s southern extentencompasses the Humboldt River Valley.
The Battle Mountain sub-basin is the second largest of eleven sub-basins within the Humboldt RiverBasin, covering 2,508 square miles and comprising 14.9 percent of the Humboldt River Basin’s totalsurface area. The sub-basin stretches across fourNevada counties to include Elko County in thenorth and northeastern portion of the sub-basin,Eureka County in the southeastern part, LanderCounty in the south-central part of the sub-basin,and Humboldt County in the western portion of thesub-basin. Interestingly, the sub-basin is nearlyequally divided among these four Nevada counties.The sub-basin is bordered by the Maggie Creek andElko Reach sub-basins to the east, the Reese Riversub-basin to the south, the Central Region (NevadaHydrographic Region 10), to the southwest, theSonoma Reach sub-basin to the west, the LittleHumboldt River sub-basin to the northwest andnorth, and the Snake River Basin (NevadaHydrographic Region 3) to the north and northeast.
The Battle Mountain sub-basin includes six Nevada hydrographic areas: (1) hydrographic area 60,Whirlwind Valley, covering 94 square miles; (2) hydrographic area 61, Boulder Flat, covering 544square miles; (3) hydrographic area 62, Rock Creek Valley, covering 444 square miles; (4)hydrographic area 63, Willow Creek, covering 405 square miles; (5) hydrographic area 64, CloversArea, covering 720 square miles; and (6) hydrographic area 66, Kelly Creek Valley, covering 301square miles.
One particularly interesting characteristic of the Battle Mountain sub-basin is that while being theHumboldt River Basin’s second largest sub-basin in terms of surface area, it is also one of the driestin terms of contributing surface water flows into the Humboldt River, being largely drained byseasonal or ephemeral streams.162 From average annual Humboldt River flows of 270,040 acre-feet

DIVISION OF WATER PLANNING Humboldt River Chronology—Part I
Nevada Water Basin Information and Chronology Series I–61
(1897-1998) at Battle Mountain to average annual flows of 246,150 acre-feet (1895-1998) at Comus,this sub-basin more typically acts as a net sink (averaging -23,890 acre-feet per year) for theHumboldt River’s surface waters between these two locations. Rock Creek is the largest and mostconsistently flowing (perennial) tributary within the sub-basin, recording average annual flows of29,900 acre-feet at its USGS gage. However, this gage is located some 22 miles northeast of BattleMountain and the Humboldt River at the creek’s emergence from the Sheep Creek Range, makingits actual contribution to the Humboldt River main stem difficult to determine.
In terms of Rock Creek’s flows actually reaching the Humboldt River, this stream is also seasonal innature. Rock Creek is also the longest tributary stream within the Battle Mountain sub-basin,originating in the Tuscarora Mountains just below Dry Creek Mountain (8,391 feet MSL). RockCreek extends over 60 miles from its headwaters to where it enters the Humboldt River Valley, thenexhibits seasonal flows as it runs another ten miles parallel to the Humboldt River main stem until itsconfluence. A principal tributary of Rock Creek is Willow Creek (and the Willow Creek Reservoir),which drains the western slopes of the Tuscarora Mountains below Toe Jam Mountain (7,123 feetMSL). The remaining tributaries and stream systems of the Battle Mountain sub-basin which draintowards (but do not necessarily reach) the Humboldt River are considerably smaller in volume andtypically do not sustain year-round surface water flows.
Most of the historical aspects of the Battle Mountain sub-basin were concentrated in the lowerportion of the sub-basin located within the Humboldt River Valley. The sub-basin’s history and earlyEuropean’s use and development of its water, range and croplands, and the extraction of mineral andother natural resources, can be roughly divided into three periods. The first period encompassed theyears of 1828-1841 which marked the era of early exploration and fur-trapping. The second periodlasted from 1841 to essentially 1869 and included the period from the passage of the first emigrantsthrough the Humboldt River Valley portion of the sub-basin (the Bartleson–Bidwell emigrant party)to the joining of the Central Pacific rails (from the west) and Union Pacific rails (from the east) atPromontory Summit (Point), Utah on May 10, 1869.163 The third period spans from 1869 to thepresent and marks the development of the Battle Mountain sub-basin’s ranching, farming and miningindustries.
Peter Skene Ogden was reportedly the first European to explore this portion of the Humboldt RiverBasin. On November 16, 1828, during his fifth Snake Country Expedition for the Hudson’s Bay FurCompany, Ogden passed Iron Point, located in the Battle Mountain sub-basin some eight miles dueeast of the southernmost extent of the Osgood Mountains, on his way upstream while trapping beaverand other fur-bearers as he went. In June 1831, John Work, Ogden’s successor, traversed theHumboldt River main stem from present-day Dunphy, located in the eastern portion of the BattleMountain sub-basin and at the southern end of Boulder Valley, westward as far as Winnemucca,Nevada.164
The emigration era through the Battle Mountain sub-basin was inaugurated in 1841 by theBartleson–Bidwell emigrant party, which made the first successful crossing of the Great Basinwithout major event or loss of life. Their passage was made somewhat easier than those wagon trainswhich followed. Before entering the Humboldt River Basin, the Bartleson–Bidwell party abandonedtheir wagons on the eastern slopes of the Pequop Mountains in eastern Nevada, proceeding the rest

Humboldt River Chronology—Part I DIVISION OF WATER PLANNING
I–62 Nevada Water Basin Information and Chronology Series
of the way as a pack train. Following in their path down the Humboldt River Valley and through theBattle Mountain sub-basin were countless other emigrant wagon trains, continuing through the year1869 when the transcontinental railroad was eventually completed. These early passages were filledwith extreme hardships. The Humboldt River Valley did not always offer the most hospitableconditions to early travelers, particularly late in the season and after the passage of numerousemigrants, wagons and hungry livestock cut down the trees for firewood, pulverized the roads intofine, blowing dust, and denuded accessible pastures of forage for livestock.
Many of the early emigrants using this portion of the Emigrant Trail felt bitterly mislead by theguidebooks and early favorable testimonies of this region. On July 20, 1849, Bennett C. Clark notedin his diary: “…came to the river and nooned – grass only tolerable. We begin to be greatlydisappointed in our calculations of finding good grass on this measly Humboldt [River] as Mr. Ware[author of a guidebook] had prepared us to expect. Let no traveler hereafter be governed by WaresGuide as it is perfectly worthless.” The bitterness was not limited to the guidebook writers, however,and even John C. Frémont, who had come through the area in December 1845, took a drubbing: “Iwould ask the learned and descriptive Mr. Frémont and the elegant and imaginative Mr. Bryant,where was the beautiful valley, the surpassing lovely valley of Humboldt? Where was the countrypresenting the most splendid ‘agriculture features?’ Where were the splendid grazing, thecottonwoods lining the banks of their beautiful meandering stream, and every thing presenting themost interesting and picturesque appearance of any place they ever saw?” (Vincent Geiger, 1849)165
The construction of the Central Pacific Railroad up the Humboldt Valley in 1868 and the completionof the transcontinental railway in 1869 effectively brought to a close the era of westward emigrationdown the Humboldt River Valley by wagon train. In November 1868 Argenta Station was set up asa terminus for the freight and stage roads serving the bustling mining communities up the ReeseRiver. Early in 1870, this station was moved five miles west to the junction of the Reese River andthe Humboldt River and a new town, Battle Mountain emerged. The arrival of the railroad had aprofound effect on the land and natural resource use of the Battle Mountain sub-basin. The once-lushmeadowlands along the Humboldt River from Beowawe in the east to Iron Point in the west, whichhad previously fed and watered westward-bound emigrant wagon trains, now began serving the needsof some of Nevada’s largest and best-known cattle operations.166
The Horseshoe Ranch at Beowawe was established by Dr. George W. Grayson of San Francisco andAaron Benson of Beowawe under the famous Horseshoe (branding) iron. This represented the firstbrand to be registered in Lander County and the first major ranching operation established in theBattle Mountain sub-basin. Ultimately, Dr. Grayson and his various partners would come to own orcontrol over 200,000 acres of grazing lands in Elko, Eureka and Lander counties.167 Another majoroperator, the W.T. Jenkins Company, was established with headquarters at Battle Mountain andbegan grazing cattle and sheep on 278,000 acres of deeded lands in Lander, Pershing and Elkocounties.168 By 1891, W.T. Jenkins was known as one of the largest sheep and wool growers inNevada, with flocks numbering some 25,000 head.169
Early mining activities in the Battle Mountain sub-basin were never very extensive, except for theMidas District in the central portion of the sub-basin in the Snowstorm Mountains, and the tungstenand gold mines in the Potosi Mining District in the Osgood Mountains in the western portion of the

DIVISION OF WATER PLANNING Humboldt River Chronology—Part I
Nevada Water Basin Information and Chronology Series I–63
sub-basin. Gold was discovered in the Midas (Gold Circle) District in 1907, during the general surgein prospecting throughout the state following the rich strikes at Tonopah and Goldfield. The peakof this early boom period lasted from 1916 to 1921, with Midas boasting a population of some 2,000persons, 21 saloons, a town water system, a newspaper, four general stores and several hotels androoming houses. Today this once-booming mining community is virtually deserted. The PotosiMining District, on the other hand, has faired considerably better. In fact, the Getchell Mine, whileclosing its tungsten operations in 1957, has since evolved into a relatively productive gold miningoperation along the Getchell Gold Trend, thanks mainly to new gold-extraction techniques.170 Morerecently, the Battle Mountain sub-basin has become the center of the state’s gold mining industrywhich is centered primarily in the upper reaches of Boulder Valley along the Carlin Trend.
Topographically, the Battle Mountain sub-basin does not show the extremes in elevations of the othersub-basins within the Humboldt River system. Peak elevations vary from just over 8,000 feet MSLin the Tuscarora Mountains to the sub-basin’s low point of 4,360 feet MSL at the USGS Comusgaging station located on the Humboldt River main stem. It might be interesting to note that duringthe last peaking highstand of Ice Age Lake Lahonton which occurred some 12,000 years ago at asurface elevation of about 4,380 feet MSL, its farthermost extent up the Humboldt River Valley wasto a point about five miles above Comus to the present-day location of Red House. At this locationit formed a small lake (by late Pleistocene standards) of approximately 30 square miles.
Climatologically, the Battle Mountain sub-basin benefits from its enclosure to the east, north and westby mountains producing surface water runoff from snowpack accumulation. In the east, along theTuscarora Mountains, elevations above 8,000 feet are estimated to experience up to 25 inches ofprecipitation per year. In the north along the Snowstorm Mountains and in the west along theOsgood Mountains, elevations over 8,000 feet generally experience up to 20 inches of precipitationper year, mostly in the form of snowfall. Along the lower reaches of the sub-basin, located withinthe Humboldt River Valley, annual precipitation averages from only six to seven inches betweenBeowawe in the east to Comus in the west.171
Vegetation coverage within the Battle Mountain sub-basin is as varied as within any sub-basin in theentire Humboldt River system and ranges from virtually nothing on the low semi-playa bottomlandsto expanses of trees, shrubs and grasses in the higher elevations. Generally, however, thepredominant plant cover includes either big sagebrush-grass or black greasewood, which togethercover approximately 70 percent of the entire Battle Mountain sub-basin. Other common plant specieswithin the sub-basin includes shadscale, black sagebrush, Utah juniper and aspen. Dense stands ofquaking aspen are found at the drainage headwaters in the higher mountains of the TuscaroraMountains, primarily along the northern slopes. While the upper elevations have a variety of grasses,much of the lower elevations have little desirable grass understory, with invasive cheatgrass havingtaken over much of these areas, particularly as the result of numerous and repetitive open rangewildfires. Willows extend along natural water courses and irrigation ditches throughout the sub-basin’s river bottoms.172
Little Humboldt River Sub-Basin
Situated in the extreme north-central portion of the Humboldt River Basin, the Little Humboldt River

Humboldt River Chronology—Part I DIVISION OF WATER PLANNING
I–64 Nevada Water Basin Information and Chronology Series
Figure 16 – Little Humboldt River Sub-Basin
sub-basin is a south-draining, essentially “closed” drainage area comprised of a number of north-southtrending valleys. Most of the sub-basin is located in east-central Humboldt County; however, theeasternmost portion of the sub-basin, consisting of most of the Little Humboldt River’s South Forkwatershed, extends into western Elko County. The sub-basin’s “normal” drainage area extends fromthe south at a formation called the “Sand Dunes”, lying six miles north of the Humboldt River,northward over fifty miles to the vicinity of Capitol Peak (8,255 feet MSL) in the northern portionof the Santa Rosa Mountain Range. The east-west extent of the sub-basin carries it from the SantaRosa Range in the west to a high plateau area in the east, the 6,000-foot Owyhee Plateau, whichextends some twenty miles inside the western border of Elko County.
Principal streams and drainage areas within the Little Humboldt River sub-basin include the LittleHumboldt River’s North Fork watershed, the South Fork watershed, and the Martin Creekwatershed. In addition, the lower portion of the sub-basin encompasses the confluence of the Northand South forks of the Little Humboldt River, the agricultural area of Paradise Valley, and extendsto the Sand Dunes formation at the sub-basin’s lower end. After the confluence of the river’s Northand South Forks, the Little Humboldt River picks up Eden Creek and then Martin and Indian Creeks.Under normal hydrologic conditions (i.e., average water years), the surface waters of the LittleHumboldt River do not exit the sub-basin andtherefore do not contribute to the flows of theHumboldt River main stem, being blocked by theSand Dunes formation. Under heavy flowconditions (i.e., severe flooding), however, a lake,called Gumboot Lake, forms on the upstream side ofthe Sand Dunes. And during especially severe floodconditions this lake back ups sufficiently to breachthe Sand Dunes and empty into the Humboldt Riverat a point just over three miles above Winnemucca.
The Little Humboldt River sub-basin is the fourthlargest of eleven sub-basins within the HumboldtRiver Basin. The sub-basin covers 1,742 squaremiles, accounting for 10.3 percent of the HumboldtRiver Basin’s total surface area. The sub-basinappears triangular in shape, with one corner pointingto the east and into Elko County, another pointing southwest towards the Humboldt River, and thethird corner marking the northern extent of the Santa Rosa Mountains. The sub-basin is bound bythe Sonoma Reach and Battle Mountain sub-basins to the south, the Snake River Basin (NevadaHydrographic Basin 3) to the north, and the Black Rock Desert Region (Nevada HydrographicRegion 2) to the west. In addition to stretching across two Nevada counties (Humboldt and Elko),the Battle Mountain sub-basin also includes three Nevada hydrographic areas within the HumboldtRiver Basin: (1) hydrographic area 67, Little Humboldt Valley, covering 975 square miles; (2)hydrographic area 68, Hardscrabble Area, covering 167 square miles; and (3) hydrographic area 69,Paradise Valley, covering 600 square miles.
Principal geographic features of the Little Humboldt River sub-basin include the Osgood and
DIVISION OF WATER PLANNING Humboldt River Chronology—Part I
Nevada Water Basin Information and Chronology Series I–65
Snowstorm Mountains separating this sub-basin from the Battle Mountain sub-basin to the south, andthe Santa Rosa Mountain Range stretching along the entire western border of the sub-basin. Thenorthern half of the Santa Rosa Range lies within a portion of the Humboldt National Forest. To thenorth and northeast, the Little Humboldt River sub-basin is bordered by the rolling 6,000-footOwyhee Plateau area of the Snake River Basin.
Historically, the Little Humboldt River basin is particularly noteworthy as it represented the gatewayby which the first European explorers and trappers entered the Humboldt River Basin from the north.In November 1828, Peter Skene Ogden, a trapper for the Hudson’s Bay Company, led a party oftrappers comprising the Fifth Snake County Expedition south from the Columbia River Basin.173
Entering Nevada near present-day Denio, Nevada, the trappers traveled southward along the QuinnRiver and then entered the Little Humboldt River sub-basin on November 9 via Paradise Hill Pass.This represented the first known visit by Europeans to the Humboldt River Basin. Proceeding downthe Little Humboldt River, Ogden reached the Humboldt River main stem, arriving near the vicinityof present-day Winnemucca, Nevada. Knowing neither its origin nor its destination, Ogden initiallynamed the Humboldt simply “Unknown River”.174 Subsequently, Ogden was to conduct twoadditional expeditions into the Humboldt River Basin in 1829, both times using the northern entryroute through the Little Humboldt River sub-basin. Ogden’s Humboldt River Basin explorations of1828-1829 were especially important as they traced the Humboldt River virtually from its source toits sink and produced the first maps and written descriptions of northern and central Nevada.175
Paradise Valley was first occupied by settlers in 1863. Indian trouble started in 1864 and worsenedin 1865, leading to the establishment of Camp Winfield Scott (1866-1870), located about four milesfrom the present-day community of Paradise Valley. The valley soon became the granary andfruit-raising center for the mining camps of central and eastern Nevada and those of southwest IdahoTerritory as well. Scottsdale, named for the nearby Army Post, was established in 1866. It wasrenamed Paradise City in 1869 and eventually was called simply Paradise Valley. During ParadiseValley’s period of mining activity, which extended from 1878 to 1920, the community served as asupply center for the small mining camps of Queen City, Spring City and Gouge-Eye. With thedecline of mining activity in the area beginning about 1918, the Little Humboldt River sub-basin’sdiverse agricultural industry shifted primarily to ranching and the raising of cattle and sheep. By the1950’s, cattle raising had entirely replaced the sheep herds and remains the area’s main economicactivity today.176
The breakthrough of the Little Humboldt River through the sand dune formation to the HumboldtRiver main stem has occurred only infrequently. The “White Winter” of 1889-90 and subsequentheavy snowpack spring meltdown caused extensive flooding in virtually all of the Humboldt River’ssub-basins. This was also the first recorded event in which the Little Humboldt River became asurface water tributary to the Humboldt River’s main stem. Within the sub-basin the flooding fromthis winter’s heavy snowpack meltdown extended from March to June of 1890 and causedconsiderable loss of livestock as Paradise Valley became virtually one large lake. Gumboot Lakeformed on the upstream side of the Sand Dunes and the Little Humboldt River eventually brokethrough to the Humboldt River above Winnemucca. During this time, it was reported that deepsnows packed the canyons at the head of the Little Humboldt River nearly as solidly as ice and weremeasured up to 100 feet deep in places.177

Humboldt River Chronology—Part I DIVISION OF WATER PLANNING
I–66 Nevada Water Basin Information and Chronology Series
The next recorded breakthrough of the Sand Dunes by the Little Humboldt River occurred in thetwentieth century during the flood event of March-April 1907.178 Similar floods, the formation ofGumboot Lake and the breaching of the Sand Dunes by the Little Humboldt River took place inFebruary-April 1910, probably representing the worst flooding in the entire Humboldt River Basin,and again in January-April, 1914. During the 1914 event the Little Humboldt River’s depth at itsconfluence with the Humboldt River main stem was reported at 10.5 feet.179 After a lengthy hiatus,in late January 1943, the Little Humboldt River sub-basin flooded again and Gumboot Lake againbreached the Sand Dunes. Martin Creek discharged into Paradise Valley at a peak rate of 9,000 cfs(typical annual flows average about 34 cfs at this location) and the Little Humboldt River dischargedinto the Humboldt River at a peak rate of 4,000 cfs.180 Gumboot Lake formed again in 1952 andbroke through the Sand Dunes, with the Little Humboldt River showing a peak rate of flow of 5,371cfs into the Humboldt River’s main stem.181
Topographically, elevations within the Little Humboldt River Basin range from a low of 4,300 feetMSL at the Sand Dunes to over 9,000 feet MSL in the Santa Rosa Range (Paradise Peak, 9,443 feetMSL; Santa Rosa Peak, 9,701 feet; Granite Peak, 9,732 feet). Precipitation within the sub-basinranges from 8-9 inches in Paradise Valley to about 25 inches in the upper elevations of the Santa RosaRange, with virtually all precipitation coming during the winter months.182 Plant cover generallyfollows the extremes shown in surface elevations and ranges from nothing on the shifting sand dunesin the lower sub-basin to groves of aspen and scattered conifers in the higher elevations of the SantaRosa Mountains. The predominant ground cover in the high county above 6,000 feet is sagebrush-bunchgrass, while the lower areas throughout the sub-basin are dominated with sagebrush andgreasewood with little perennial grass types present.183
Sonoma Reach Sub-Basin
The Sonoma Reach sub-basin lies along the Humboldt River Valley in the west-central portion of theHumboldt River Basin. Most of the sub-basin lies south of the Humboldt River in the vicinity ofWinnemucca, Nevada; however it also includes short drainages north of the river and the bottomlandsalong the Humboldt River main stem between Comus and a point downstream and just north of thePershing County northern boundary. South of the Humboldt River, the major portions of the sub-basin draining into the Humboldt River include Pumpernickel Valley to the east, which is drainedprimarily by Ragan Creek towards Comus, and Grass Valley to the west, which is drained primarilyby Clear Creek draining towards the Humboldt River some ten miles below Winnemucca. Both ofthese creeks, as well as virtually all other tributary streams within this sub-basin, are typically seasonalor ephemeral in nature. The Sonoma Reach sub-basin’s prominent geographic characteristics includethe Tobin Mountain Range on the sub-basin’s southeast boundary, Buffalo Mountain and the OsgoodMountains on the east, the East Range on the west, Hot Springs Range to the north and the KrumHills to the north and west of Winnemucca. Pumpernickel Valley and Grass Valley, located to thesouth of the Humboldt River, are separated by the Sonoma Range, containing the highest peaks inthe sub-basin and from which the sub-basin derives its name.
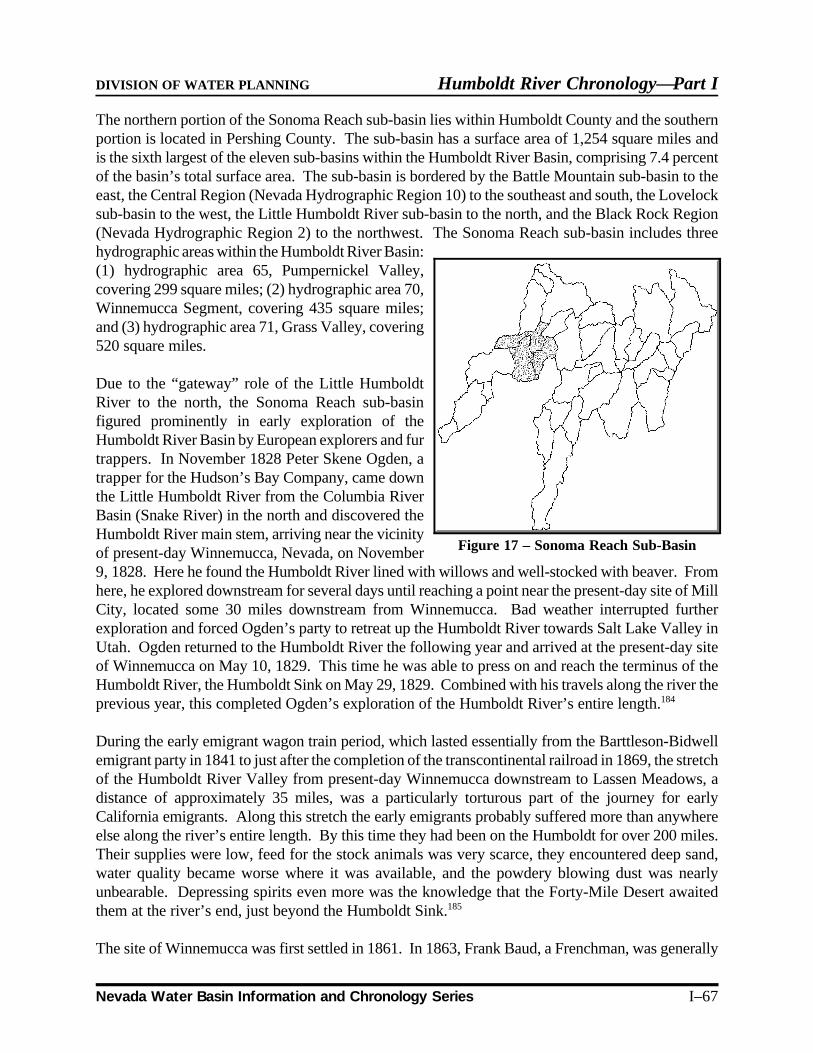
DIVISION OF WATER PLANNING Humboldt River Chronology—Part I
Nevada Water Basin Information and Chronology Series I–67
Figure 17 – Sonoma Reach Sub-Basin
The northern portion of the Sonoma Reach sub-basin lies within Humboldt County and the southernportion is located in Pershing County. The sub-basin has a surface area of 1,254 square miles andis the sixth largest of the eleven sub-basins within the Humboldt River Basin, comprising 7.4 percentof the basin’s total surface area. The sub-basin is bordered by the Battle Mountain sub-basin to theeast, the Central Region (Nevada Hydrographic Region 10) to the southeast and south, the Lovelocksub-basin to the west, the Little Humboldt River sub-basin to the north, and the Black Rock Region(Nevada Hydrographic Region 2) to the northwest. The Sonoma Reach sub-basin includes threehydrographic areas within the Humboldt River Basin:(1) hydrographic area 65, Pumpernickel Valley,covering 299 square miles; (2) hydrographic area 70,Winnemucca Segment, covering 435 square miles;and (3) hydrographic area 71, Grass Valley, covering520 square miles.
Due to the “gateway” role of the Little HumboldtRiver to the north, the Sonoma Reach sub-basinfigured prominently in early exploration of theHumboldt River Basin by European explorers and furtrappers. In November 1828 Peter Skene Ogden, atrapper for the Hudson’s Bay Company, came downthe Little Humboldt River from the Columbia RiverBasin (Snake River) in the north and discovered theHumboldt River main stem, arriving near the vicinityof present-day Winnemucca, Nevada, on November9, 1828. Here he found the Humboldt River lined with willows and well-stocked with beaver. Fromhere, he explored downstream for several days until reaching a point near the present-day site of MillCity, located some 30 miles downstream from Winnemucca. Bad weather interrupted furtherexploration and forced Ogden’s party to retreat up the Humboldt River towards Salt Lake Valley inUtah. Ogden returned to the Humboldt River the following year and arrived at the present-day siteof Winnemucca on May 10, 1829. This time he was able to press on and reach the terminus of theHumboldt River, the Humboldt Sink on May 29, 1829. Combined with his travels along the river theprevious year, this completed Ogden’s exploration of the Humboldt River’s entire length.184
During the early emigrant wagon train period, which lasted essentially from the Barttleson-Bidwellemigrant party in 1841 to just after the completion of the transcontinental railroad in 1869, the stretchof the Humboldt River Valley from present-day Winnemucca downstream to Lassen Meadows, adistance of approximately 35 miles, was a particularly torturous part of the journey for earlyCalifornia emigrants. Along this stretch the early emigrants probably suffered more than anywhereelse along the river’s entire length. By this time they had been on the Humboldt for over 200 miles.Their supplies were low, feed for the stock animals was very scarce, they encountered deep sand,water quality became worse where it was available, and the powdery blowing dust was nearlyunbearable. Depressing spirits even more was the knowledge that the Forty-Mile Desert awaitedthem at the river’s end, just beyond the Humboldt Sink.185
The site of Winnemucca was first settled in 1861. In 1863, Frank Baud, a Frenchman, was generally

Humboldt River Chronology—Part I DIVISION OF WATER PLANNING
I–68 Nevada Water Basin Information and Chronology Series
credited with founding the town of Winnemucca. Baud, along with two other Frenchmen, Louis andTheophile Lay, and an Italian, Joseph Ginaca, built a toll bridge across the Humboldt River and astore. The town came to be known by a number of names, including French Fort, Frenchman’s Ford,French Bridge, and Ginaca Bridge. In 1866 it was finally named after the famous Paiute chieftainwhen a post office was established in the town. During the latter part of the wagon train emigrationperiod, Winnemucca was one of the principal rest stops and supply centers along the HumboldtRiver.186 Baud originally came to the location with Louis Lay from California to work on theHumboldt Canal, a project headed by Dr. A. Gintz and Joseph Ginaca who devised the plan to linkGolconda and Mill City by means of a 66-mile long canal and provide water for the mills in the area.The project was never completed, however.187 After considerable investment and several years oflabor, the canal reached from Golconda to Winnemucca, a distance of 28 miles and went no further.Because of poor engineering there was insufficient drop to develop a head of water adequate for theprojected needs. The canal continued to be used for irrigation purposes until about 1870, however,when it was finally abandoned. While the canal itself was a failure, its development brought to theWinnemucca area a number of young, ambitious and enterprising individuals who were to figureprominently in the future economic and water resources development of this area.188
Golconda, located nearly 20 miles upstream from Winnemucca, was first settled in 1863 and was aby-product of the ill-fated Ginaca-Gintz Humboldt Canal. The town later became the headquartersfor the Golconda & Western Exploration Company, Ltd., and boasted some 500 inhabitants, sixhotels, a newspaper, several stores, many bars, a racetrack and a flourishing tenderloin district at theheight of the region’s mining boom in 1899. The Golconda mining boom, however, was relativelyshort-lived. By 1900, because of difficulties in treating the Adelaide and Copper Canyon ores, uponwhich the town had flourished, the mine, mill and narrow-gauge railroad to the mine site wereabandoned and shut down.189
On September 16, 1868, the Central Pacific Railroad reached Winnemucca. A stage and freight tollroad was opened from Winnemucca northward to the new silver strikes in Idaho Territory, at SilverCity and Boise City. In 1873 the Humboldt County seat was moved from Unionville, which wasfounded in 1861, to Winnemucca. By 1875 Winnemucca was the hub of stage and freight roadsradiating not only to Idaho points, but also to Unionville, Humboldt City, Star City, and Dun Glen,to the south and west, and Paradise City, Spring City, and Queen City in Paradise Valley to the north.Through the years, because of its strategic location, Winnemucca has continued to be an importantstaging point and transportation hub.190
Cattle ranching began in earnest in Humboldt County in 1873 when Frank Button and his uncle I.V.Button drove cattle into the Winnemucca area to begin ranching operations in the rich, fertile valleysof northern and eastern Humboldt County. At that time, the town of Winnemucca consisted of a fewhouses, a ferry across the Humboldt River and Bridge Street paved with sagebrush stubs. Using theirfamous Double Square brand, the Buttons raised thousands of fine horses on their 4,000 square milesof ranch land.191 During the period from the late 1870’s to the 1890’s, Winnemucca was the shippingpoint to California for enormous herds of cattle from the huge northern Nevada and southern Oregoncattle baronies of Miller & Lux, Peter French, and Stauffer & Sweetser. During this period,Winnemucca’s role as a cattle shipping point transcended its other activities.192

DIVISION OF WATER PLANNING Humboldt River Chronology—Part I
Nevada Water Basin Information and Chronology Series I–69
Beginning around 1890, and continuing essentially until the passage of the Taylor Grazing Act in1934, the Sonoma Reach sub-basin was visited by “countless thousands” of migrant sheep whichpassed through Grass Valley (south of Winnemucca) en route to and from their summer ranges in theSonoma, Santa Rosa, East Range, Humboldt Range, and other higher elevation pastures. Accordingto newspaper articles at the time, this continual procession led to the trampling out or extensivegrazing of the once verdant ryegrass meadows in Grass Valley, to the point where only a fewscattered native grassland meadows remained. The high summer ranges in the nearby mountains,particularly the Sonoma and Santa Rosa Ranges, were also subjected to heavy use by transient sheepoperators. Much of the resultant watershed erosion damage evident in these upper watersheds canbe attributed to this past range and upper watershed grazing use.193
The topography of the Sonoma Reach sub-basin is fairly characteristic of other sub-basins in theHumboldt River system: relatively high mountain ridges, mountain highlands, valley lowlands and,in this case, river bottomlands along the Humboldt River main stem. The highest elevations withinthe sub-basin are located in the Sonoma Range (Sonoma Peak, 9,395 feet MSL) located in the centralportion of the sub-basin. Other mountain ranges are typically less imposing, for example, the EastRange (Dun Glen Peak, 7,441 feet and Auld Lang Syne Peak, 7,233 feet), Buffalo Mountain (7,997feet) and the Krum Hills and Blue Mountain (7,342 feet). The lowest point in the sub-basin is alongthe Humboldt River at the Pershing County boundary, which is approximately 4,000 feet MSL.Based on these elevation differences, annual precipitation varies from 6-8 inches in the sub-basin’slowlands to up to 25 inches in the upper reaches of the Sonoma Range. Annual precipitation in thesub-basin’s various mountain ranges, which typically is experienced during the winter months as snowor rain, varies by location and elevation as follows: (1) East Range – 8 to 15 inches (5,000 to over7,000 feet); (2) Sonoma Range – 8 to 25 inches (5,000 to over 9,000 feet); (3) Tobin Range – 8 to20 inches (5,000 to over 8,000 feet); (4) Osgood Mountains – 8 to 15 inches (5,000 to 8,000 feet);(5) Hot Springs Range – 8 to 10 inches (5,000 to over 6,000 feet); and (6) Winnemucca Mountain– 8 to 10 inches (5,000 to 6,000 feet).194
The predominant vegetation cover over most of the Sonoma Reach sub-basin is either big sagebrush-grass, which is more prevalent, or shadscale-grass. Generally, big-sagebrush occupies the steepmountain slopes and basins and the upland bench lands and terraces, but it can also be found fringingthe Humboldt River bottomlands wherever light-textured, well-drained, dune-type soils are found.Shadscale occupies the flat uplands and alluvial fans between the valley bottomlands and the rollingfoothills in both Grass Valley and Pumpernickel Valley. Black greasewood is generally the dominantplant cover throughout the bottomlands of Grass Valley and the northern half of Pumpernickel Valley.Sometimes greasewood may be found intermixed with expanses of rubber rabbitbrush. Cheatgrassis by far the most common grass found throughout the sub-basin, particularly on burn sites such asWinnemucca Mountain, located just north of Winnemucca. Utah juniper is found thinly scatteredacross the western face of the Sonoma Mountain Range and on the ridgetops and fans of the EastRange, but most of these trees are stunted and poorly formed and have little commercial value. Othertrees found within the sub-basin include cottonwood and chokecherry, which are found along mostof the creek bottoms. A few small stands of quaking aspen also occur on the north slopes of theSonoma Mountains near the ridge lines and within the upper watersheds.
Lovelock Reach Sub-Basin

Humboldt River Chronology—Part I DIVISION OF WATER PLANNING
I–70 Nevada Water Basin Information and Chronology Series
Figure 18 – Lovelock Reach Sub-Basin
The Lovelock Reach sub-basin includes the western-most portion of the Humboldt River Basin andriver system to include the Humboldt and Toulon lakes and the Humboldt Sink. The sub-basinextends in a generally northeast to southwest direction and includes a relatively narrow strip some15-20 miles wide and 80 miles long of all of the lands draining directly into the lower Humboldt Riverfrom just north of the Humboldt County-Pershing County border in the north to the HumboldtRiver’s terminus just inside the Churchill County boundary in the south.195 Most of the LovelockReach sub-basin lies within Pershing County, and the central area includes Rye Patch Reservoir andthe agricultural areas around Lovelock, Nevada.
Principal geographic features of the Lovelock Reach sub-basin include an extensive expanse ofHumboldt River bottomlands and meadows surrounded by a series of mountain ranges. Borderingthe eastern portion of the sub-basin from south to north are the West Humboldt Range, the HumboldtRange, and the East Range. To the north, the sub-basin is bordered by the Eugene Mountains, andto the west by the Trinity Range in the south and the Antelope Range in the north-central part of thesub-basin. Much of the lower portion of the sub-basin around Lovelock is used extensively foragricultural purposes and receives its irrigation waters from the 194,300 acre-foot capacity (effective)Rye Patch Reservoir, which was completed by the U.S. Bureau of Reclamation in 1936.
The Lovelock Reach sub-basin is the sixth largest of eleven sub-basins within the Humboldt RiverBasin, comprising 1,668 square miles and accounting for 9.9 present of the basin’s total surface area.The sub-basin stretches across three Nevadacounties (Humboldt, Pershing and Churchill) andincludes three Nevada hydrographic areas and onesub-area. These are: (1) hydrographic area 72,Imlay Area, covering 771 square miles; (2)hydrographic area 73, Lovelock Valley, covering635 square miles; (3) hydrographic sub-area 73A,Lovelock Valley/Oreana Sub-Area, covering 98square miles; and (4) hydrographic area 74, WhitePlains, covering 164 square miles. The LovelockReach sub-basin is bordered by the Sonoma Reachsub-basin to the east and northeast, the Black RockDesert Region (Nevada Hydrographic Region 2) tothe north and northwest, the West Central Region(Nevada Hydrographic Region 5) to the west, theCarson River Basin (Nevada Hydrographic Basin 8)to the south, and the Central Region (NevadaHydrographic Region 10) to the southeast. The lower extent of the Lovelock sub-basin, comprisingthe Humboldt Sink and the terminus of the Humboldt River Basin, forms a hydrologic link with theCarson Sink in the Carson River Basin during particularly high-water years. The last time these twowatersheds were joined was after the 1997 flood, when waters left the Humboldt Sink via theHumboldt Slough and Drain and entered the Carson Sink to the south. This portion of the lowerLovelock sub-basin, along with the Carson Sink and Lahontan Valley, once formed the largest ofseven sub-basins making up Ice Age Lake Lahontan during its several highstands, the latest of whichexisted some 12,000 years ago.

DIVISION OF WATER PLANNING Humboldt River Chronology—Part I
Nevada Water Basin Information and Chronology Series I–71
Due to the Lovelock Reach sub-basin’s “gateway” status along the Humboldt River main stem, it hasfigured prominently in the region’s earliest exploration, use of its natural meadow lands, anddevelopment of early transportation routes. Peter Skene Ogden was the first recorded European tocome into the sub-basin when he arrived near the location of present-day Mill City on November 11,1828, on a fur-trapping expedition. The following year, in May and June 1829, Ogden and hisHudson’s Bay Fur Company brigade returned to the Lovelock Reach sub-basin and trapped beaverand other fur-bearing animals around Lovelock and in the sloughs and lakes down to the HumboldtRiver’s terminus. It was at this time that Ogden contemplated changing his earlier names for theHumboldt River – Unknown River and Paul’s River – to Swampy River for the extensive wetlandsand generally saturated conditions prevalent in the lower portion of the sub-basin. American furtrappers, principally the Bonneville-Walker group of 1833-1834, also trapped this reach of theHumboldt River through 1846, but met with little success.196 Even so, later explorations, particularlythose by Joseph Walker, recognized the natural gateway to the west afforded by the Humboldt RiverValley, eventually establishing this route as the California Emigrant (Overland) Trail.
Portions of the Lovelock Reach sub-basin contained abundant natural meadows and were importantresting stops on the California Emigrant Trail. In the north-central portion of the Lovelock sub-basin,now partly submerged by the waters of the northern portion of Rye Patch Reservoir, was LassenMeadows (also referred to as Rye Patch Meadows), located near present-day Imlay, Nevada. Thisarea represented the first major resting place for early emigrants after nearly 200 miles of weary,monotonous travel down the Humboldt River Valley. It also represented the turn-off for theApplegate-Lassen (Cutoff) Trail, which was used between 1846 and 1848 and took some earlyemigrant wagon trains over to the Black Rock Desert and into northern California and southernOregon. From Lassen Meadows the California emigrants who decided to continue on the regularroute down the Humboldt River headed toward the site of present-day Lovelock, some forty milesdistant. This section of the trail was one of the most arduous of the whole Humboldt River route,and abundant grass and good water were almost nonexistent. As Harriet S. Ward wrote in her diaryin 1853 while traveling this section of the trail: “Today we have been toiling through the deep dust,as uncomfortable for us all as a person who has never traveled this route can ever imagine, with nota green thing to rest our weary eyes upon. It is a perfectly barren land for forty long miles, and it isdistressing to hear the complaints of the poor cattle, which are suffering for want of food.197
Having reached the lower portion of Lovelock Valley, referred to as the Big (or Great) Meadows andlying below present-day Lovelock, the early emigrants had effectively reached the end of theHumboldt River and a place where they could feed and rest their weary livestock. The Big Meadowswas a place of great rejoicing as the survivors at this point had traveled the nearly 300 miles of theHumboldt River Valley and conquered all the adversities and hardships it had to offer. As noted inan 1850 journal entry of one of those early travelers, Lorenzo Sawyer, about the Big Meadows: “Itwould almost seem that these extensive meadows were placed here expressly to supply the means oftraversing this desert country. At any rate they are precisely at the point where they are mostneeded.” This opinion was supported by Eleazer Stillman Ingalls in this same year: “There is anabundance of grass at this point for all the stock that can ever reach here. We have to wade to getit, then cart it to the channel, and boat it across that in a wagon box…Two miles below our campthere are some falls in the river, at which point the meadows terminate.” And a year earlier, VincentGeiger would write of this place: “This marsh for three miles is certainly the liveliest place that one

Humboldt River Chronology—Part I DIVISION OF WATER PLANNING
I–72 Nevada Water Basin Information and Chronology Series
could witness in a lifetime. There is some two hundred and fifty wagons here at all time. Trainsgoing out and others coming in and taking their places, it’s the constant order of the day.”198
After leaving Lovelock (Big) Meadows, the early emigrants came to Humboldt and Toulon Lakesand the Humboldt Sink, an area which was a haven for the ducks, geese, and other waterfowl, butwith mud so thick and extensive that it largely precluded the emigrants from using the waterfowl toreplenish their dwindling food supplies. As noted by Elisha D. Perkins in 1849: “The ponds of thesink were covered with all kinds of wild fowl, geese, ducks, curlews, snipes, cranes, etc. Perfectlysecure from man or beast, as the ground is a perfect mire in every direction. Continuing around thesink or marsh, in a South East course you come to the ‘last wells’ at the foot of the marsh and ponds,being the last place where water can be obtained before crossing the desert to Salmon Trout [TruckeeRiver]…”199
In 1860 silver ore was first discovered in the northern areas of the Humboldt and East Mountainranges near present-day Lovelock. These silver ore discoveries began the ensuing “Rush toHumboldt” resulting in a steady influx of miners to the Humboldt River Basin. This in-migrationwould eventually taper off in the 1880’s and then virtually come to a halt by 1893 following the repealof the Sherman Silver Purchase Act and the demonetization of silver. Shortly after silver ore wasdiscovered in 1860, Humboldt City and Dun Glen in the Humboldt River Basin and Unionville andStar City, just south of the sub-basin’s boundaries, became the first white settlements to emerge inNevada north and east of the Comstock-influenced cities of western Nevada.200 Today, portions ofthe Lovelock Reach sub-basin are literally studded and pock-marked with weathered mine dumps,decaying headframes, abandoned shafts, caved-in tunnels, and ghost mining camps as bygonereminders of this intensive, but short-lived mining period which represented the earliest mining to takeplace in the Humboldt River Basin.201
Agricultural development in the Lovelock Reach sub-basin began immediately after the birth of themining camps. It is generally recognized that in 1861 J.A. Callahan, of the old Callahan Ranch in theLassen Meadows west of Imlay, established the first irrigation system in the Humboldt River Basinand, thereby, lays claim to the basin’s earliest priority (“first in time, first in right”) water right. Thesewater rights were later transferred to the Southwest Ditch and the Irish-American Canal in LovelockValley.202 Alfalfa seed, also known as “Chile clover,” reached the Lovelock Valley area in 1877 whenit was introduced by Colonel Joseph Marzen.203
In July 1868, the Central Pacific Railroad entered the Lovelock Reach sub-basin (and, for that matter,the Humboldt River Basin) by laying its rails across the White Plains Summit and down into theHumboldt-Carson Sink area. The present-day site of Lovelock (then referred to as Lovelock’sStation, or simply Lovelock’s) was reached by the railroad in August 1868. In exchange for GeorgeLovelock’s donation of approximately 80 acres of land for a railway station and trackside facilities,the Central Pacific named the new station Lovelock’s. The site quickly became the point of departurefor the booming mining camps of Arabia and Trinity in the Trinity Range to the north.204
Beginning with the sub-basin’s first water right in 1861, proceeding through an era of dam building,canal construction and the development of early irrigation systems, by 1890 agriculture had becomeentrenched as the Lovelock Reach sub-basin’s economic mainstay. The industry received a further

DIVISION OF WATER PLANNING Humboldt River Chronology—Part I
Nevada Water Basin Information and Chronology Series I–73
boost to its fortunes in the 1930’s. Based on the drought years of the early 1920’s, the LovelockIrrigation District was formed for the purpose of constructing a dam at Oreana, located almost 15miles up the Humboldt River from Lovelock. After spending some $100,000 for engineering andlegal services, the proposed structure was canceled due to insufficient storage capacity. In 1929, theLovelock Irrigation District changed its name to the Pershing County Water Conservation Districtand it was this organization that promoted the construction of the Rye Patch Dam and Reservoir bythe U.S. Bureau of Reclamation beginning in 1935 and completed in 1936.205
In terms of general topography, the Lovelock Reach sub-basin is surrounded by a number ofmountain ranges – West Humboldt, Humboldt, East Range, Trinity Range, Antelope Range, EugeneMountains – which provide little effective runoff to the sub-basin’s lowlands. Virtually all usablewater coming into the sub-basin comes from the Humboldt River itself. The sub-basin’s climate ischaracterized as arid with little precipitation, high summer temperatures and high rates ofevaporation. Annual rates of precipitation in the Lovelock Valley area average only about four inchesper year and six inches at Imlay in the northern portion of the sub-basin. The surrounding mountainranges have peaks and ridges of typically 5,000 to 7,000 feet high, with the sub-basin’s highest peak(Star Peak, 9,834 feet MSL) located in the Humboldt Range. At these elevations, annualprecipitation generally averages about 8-15 inches.206
The predominant vegetation cover in the Lovelock sub-basin is a mixture of shadscale, which is morecommon, and bud sagebrush (Artemisia spinescens). This vegetative cover occupies most of thevalley bottoms and alluvial fans, extending into the upland terraces. Black greasewood may be foundalong the Humboldt River’s floodplain as well as scattered areas of saltgrass and other phreatophytes.The upland benches and terraces typically find a mixing of principally shadscale, bud sagebrush, bigsagebrush, littleleaf horsebrush (Tetradymia glabrata), black sagebrush, Bailey greasewood(Sarcobatus baileyi) and rabbitbrush. Higher elevations have extensive growth of big sagebrushalong with stands of Utah juniper. A number of phreatophye species are present on the HumboldtRiver’s bottomlands, the most prominent being rubber rabbitbrush, black greasewood, willows,cottonwood, and smallflower tamarisk (salt cedar) (Tamarix parviflora).207
Humboldt River Water Rights, Adjudication, and Related Court Decrees
Overview
Unlike the settlement of water rights issues on the river systems in western Nevada – i.e., Truckee,Carson, and Walker – which involved the interstate transfer of water between California and Nevadaand therefore required federal court decrees and federal water masters, all the waters of the HumboldtRiver system lie wholly within Nevada. Consequently, the adjudication process208 within theHumboldt River Basin has been effected solely through state decrees. With two exceptions, thediversion and use of the waters of the Humboldt River and its (normal) tributary streams are presentlyregulated by two water rights decrees: the October 1931 Bartlett Decree and the October 1935Edwards Decree. The exceptions to the coverage of these decrees are the Reese River and the LittleHumboldt River systems. These sub-basins are, in effect, “closed” hydrographic sub-basins209 withrespect to their “normal” (i.e., average water year) surface flows. Consequently, their normal

Humboldt River Chronology—Part I DIVISION OF WATER PLANNING
I–74 Nevada Water Basin Information and Chronology Series
discharges do not contribute to Humboldt River flows and are subject to different decree and waterrights enforcement mechanisms for the allocation of their surface waters. Specifically, the January1935 E.P. Carville Decree applies to water rights in the Little Humboldt River sub-basin,210 whilevirtually all water rights in the Reese River sub-basin are vested rights.211 Vested water rights areclaims to surface waters initiated prior to 1905 which have been used continuously ever since and aresubject to final determination through judicial proceedings (i.e., adjudication).212
The Bartlett Decree applies to and is used in the distribution of the Humboldt River and its tributariesbelow Palisade, Nevada213 (except, as noted for the Reese River and Little Humboldt River sub-basins), while the Edwards Decree applies to and is used in the distribution of water above Palisade.214
The 1931 Bartlett Decree initially applied to the entire Humboldt River system (except for the twonoted closed sub-basins); however, the initial judicial determination of water rights within theHumboldt River Basin was subsequently modified by the 1935 Edwards Decree.215 The fact that themajority of the changes and corrections to the Bartlett Decree were applicable to water rights in theupper Humboldt River Basin (i.e., above Palisade) resulted in the establishment of a dividing line forthe application of these two decrees at Palisade.
Two primary differences between the Humboldt River system’s two principal decrees are that thelengths of the irrigation season (number of days and specific dates) and rates of flow vary betweenthe two decrees, and that the Bartlett Decree incorporates the “doctrine of relation” while theEdwards Decree does not. This concept of relation means that a water priority is claimed as of thedate of appropriation for the amount appropriated, even though a part of it may not have been putto beneficial use until a later date.216 Also, in most cases under the Bartlett Decree the water rightsare appurtenant217 to the land and irrigation is confined to the land specifically described in the decree.Under the Edwards Decree, by contrast, the water-righted lands are not specifically described, butthe water rights are appurtenant to the lands included in groups of legal subdivisions. These landsare shown in the decree as enclosed by brackets and are commonly referred to as “bracketed” land.The water rights are then limited to the aggregate acreage of land and quantity of water indicated inthe decree for each bracket. Some lands in the Bartlett Decree are similarly bracketed and arehandled in the same manner as in the Edwards Decree.218
Both the Bartlett and Edwards decrees stipulate that the maximum length of the irrigation seasonbelow Palisade shall be from March 15 to September 15, and the maximum length of the irrigationabove Palisade shall be from April 15 to August 15, a difference in the irrigation season of sixty days.The decrees also provide for a continuous rate of flow of 0.81 cubic feet per second (cfs) for each100 acres, or proportional amounts thereto, for water-righted lands below Palisade, and a rate of flowof 1.23 cfs for water-righted lands above Palisade. Irrigated lands are divided into three classes inboth decrees (A, B and C), with different water duties (acre-feet per acre per irrigation season) andirrigation seasons (number of days and specific dates of allowable irrigation) as shown in Table 10,General Humboldt River Water Rights.219
Table 10 – General Humboldt River Water Rights†Land Classes and Type, Water Rights, Number of Days and Dates of Irrigation

DIVISION OF WATER PLANNING Humboldt River Chronology—Part I
Nevada Water Basin Information and Chronology Series I–75
Class and Type of LandWater Right
(acre-foot/acre)Irrigation
Days Dates of IrrigationBelow Palisade [Bartlett Decree]‡ (flow rate–0.81 cfs)Class A – Harvest Crop 3.0 180 March 15 – September 15Class B – Meadow Pasture 1.5 90 March 15 – June 13Class C – Diversified Pasture 0.75 45 March 15 – April 28Above Palisade [Edwards Decree] (flow rate–1.23 cfs)Class A – Harvest Crop 3.0 120 April 15 – August 15Class B – Meadow Pasture 1.5 60 April 15 – June 15Class C – Diversified Pasture 0.75 30 April 15 – May 15Little Humboldt River [Carville Decree] (flow rate–1.0 cfs)Class A – Harvest Crop 3.6 180 March 15 – September 15Class B – Meadow Pasture 1.8 90 March 15 – June 13Class C – Diversified Pasture 0.9 45 March 15 – April 28
† Based on water rights adjudicated by the October 1931 Bartlett Decree, the January 1935 Carville Decree, and the October 1935Edwards Decree. Excludes Reese River sub-basin water rights which are vested and have not been adjudicated.‡ The Pine Valley sub-basin, which discharges through Pine Creek into the Humboldt River just below Palisade, is an exceptionto this and generally takes on characteristics of an upper Humboldt River sub-basin.Source Data: Humboldt River Basin, Nevada, Water and Related Land Resources, various reports, based on a cooperative surveyby the Nevada Department of Conservation and Natural Resources and the United State Department of Agriculture and preparedby the USDA’s Economic Research Service, Forest Service and Soil Conservation Service, 1962-1966.
Table 11, Upper Humboldt River Water Rights, and Table 12, Lower Humboldt River Water Rights,which follow later in this section, provide a more detailed breakout of growing seasons, acreage andwater right allowances by specific Humboldt River sub-basin based on their location in either theupper Humboldt River Basin or the lower Humboldt River Basin.
Water Rights Background
A number of important historical events figure prominently in the evolution of Nevada’s water law,its water allocation system and the water rights adjudication process. First, in 1885 the NevadaSupreme Court formally approved the doctrine of prior appropriation for all the state’s watersupplies, although an earlier (1875) lower court decision had given recognition to the doctrine ofriparian ownership.220 Even so, the implementation of the concept of prior appropriation for waterrights required some form of statewide centralized record keeping as to when individual water rightswere initiated (vested) and the water put to beneficial use. However, the requirement for any suchsystematic recording and judicial determination of water rights (the adjudication process) and relatedpriority dates was still lacking in Nevada.
By the late 1880’s, the increase in competing water uses along virtually the entire Humboldt Riversystem dramatically intensified the conflicts and controversy over water rights issues, particularlybetween upstream users in Elko County and those in the lower basin in Lovelock Valley. The 1888-1889 period represented extreme drought years in the Humboldt River Basin and, in fact, throughoutmuch of the entire Great Basin. Despite having generally known and substantiated earlier dates ofwater withdrawal (i.e., a proven prior appropriation date221), many lower Humboldt River basin waterappropriators were still unable to receive sufficient water due to existing drought conditions andextensive upstream diversions. Unfortunately, the controversy over the conflicting concepts of “prior

Humboldt River Chronology—Part I DIVISION OF WATER PLANNING
I–76 Nevada Water Basin Information and Chronology Series
appropriation”222 and “riparian water rights”223, while already settled by the Nevada Supreme Court,could not be effectively implemented until all water rights were formally recorded and judiciallyverified according to their earliest date of use. This situation was not unique to the Humboldt Riversystem and only further emphasized the need for a more equitable and fully codified allocation ofwater rights along all of Nevada’s major water courses.
As a result of this and similar conflicts within the Truckee, Carson and Walker River basins, on March9, 1889, the Nevada Legislature passed a water law which provided the state’s first means fordetermining or adjudicating individual water rights. The 1889 Water Act was designed to regulatethe use of water for irrigation and other purposes. It was modeled after Colorado water law andimposed a self-regulating system by dividing the state into seven irrigation districts by major drainagebasins. Each basin had a water commissioner who had the authority to decide individual waterentitlements within their respective districts. The act decreed that all water rights were to be filedwith each county recorder by September 1, 1889. It also reserved unappropriated water to the Stateof Nevada for future appropriation and prevented new construction or enlargement of any irrigationworks without the expressed permission of the respective water commissioner. No doubt fearingpotential water restrictions associated with the new law, individual water user’s initial claims tostream flows were typically wildly exaggerated and in combination far exceeded the capacity of moststream systems for which they were filed.224
The drought years of 1888-1889 forced downstream Humboldt River water users to file a suit overwater rights and thereby test the recently passed (1889) Nevada water law. P.N. Marker, et al., filedsuit in Humboldt County on behalf of Lovelock Valley farmers (Pershing County was still part ofHumboldt County at that time) against some 540 Humboldt River Valley water appropriatorsspecifically asking that all Humboldt River water rights be determined, i.e., adjudicated. The basicissue involved with that suit was a ruling in favor of the concept of the prior appropriation of waterrights along the Humboldt River. Such a ruling would necessarily have favored the lower basin’swater users over riparian water rights, which were being claimed by upstream ranchers, particularlythose in Elko County whose lands bordered the river. The ranchers in Elko County argued againstsuch a settlement (i.e., the adjudication of water rights based on the date of appropriation) claimingthat the 1889 water regulation statute was, in fact, unconstitutional.
The presiding judge, A.F. Fitzgerald of the District Court in Humboldt County (Winnemucca), agreedwith the upstream ranchers’ position and in June 1890 declared Nevada’s 1889 water law to beunconstitutional. In a petition of constitutionality filed before the Nevada Supreme Court on behalfof water users on the Humboldt, Truckee, and Carson rivers, the law’s validity was questioned onseveral grounds, the primary one being that it was a special law in a case where a general law can bemade applicable.225 Therefore, the basic issue over riparian water rights versus prior appropriationwater rights was never even considered by the court. The state’s initial attempt at a statewide waterlaw was subsequently repealed by the Nevada Legislature in 1893 and no further effort was made tosystematically record water rights and allocate the state’s surface waters until 1905.226
In addition to the drought in 1888 and 1889, the extremely severe winter of 1889-90 also contributedto the eventual adjudication of water rights in the Humboldt River system. The “White Winter” of1889-90 had especially disastrous effects on large cattle ranching operations throughout the

DIVISION OF WATER PLANNING Humboldt River Chronology—Part I
Nevada Water Basin Information and Chronology Series I–77
Humboldt River Basin with countless thousands of cattle and other livestock being lost in theincredibly deep snows during this period. The Humboldt River’s middle and upper basin ranchers,in particular, who used public lands extensively for open-range cattle grazing, were especially hardhit during this period. Their inability to adequately feed their wide-ranging herds during this severewinter period forced the ranchers to recognize the need to restrict open-range grazing operations andgrow more feed for their herds’ winter needs. The need for more irrigation waters on upstream landsin order to cultivate sufficient hay for supplemental winter forage only intensified the conflicts withlower basin water users over Humboldt River water rights issues.
Efforts to more definitively determine water rights in Nevada’s river systems began to intensify in theearly 1900’s. On February 16, 1903, the Nevada Legislature passed the Irrigation Law of 1903which, among other things, created the Office of the State Engineer to solve water problems, toprotect existing water rights, and to bring about a better method to utilize the state’s water resources.This was, in effect, the first step made by the state in providing a speedy and relatively inexpensive(to the water appropriator) method of adjudicating existing (vested) water rights.227 On March 1,1905, this process of better allocating the state’s water resources continued when the NevadaLegislature amended the Irrigation Act of 1903 to require that any person desiring to appropriatewater must file an application with the State Engineer for a permit. If the State Engineer found thatthere existed unappropriated water, he could grant a permit. Within six months following thegranting of a permit, the applicant was required to file a map in support of such application. Uponsatisfactory proof that the application had been “perfected,” the State Engineer could issue acertificate of appropriation. The act also provided a method to adjudicate existing water rights.228
On February 26, 1907, the Nevada Legislature repealed the Irrigation Law of 1903 and provided astatutory method to determine existing water rights. The 1907 act, creating a new water law, did notdiffer materially from the act of 1903, as amended in 1905.229 And finally, on March 22, 1913, theNevada Legislature repealed the water law of 1907, along with its amendments, and approved theso-called “1913 General Water Law,” which became the foundation of Nevada’s present water law.In addition to affecting all the state’s surface waters, for the first time underground water (i.e.,groundwater) was also included under provisions of the state’s “doctrine of prior appropriation” forwater rights.230
The Adjudication Process
In order to help resolve continuing water rights issues on the Humboldt River, on January 17, 1923,the Nevada State Engineer compiled a listing of existing Humboldt River Basin water rights then onfile and submitted this compilation to the Sixth Judicial District Court of the State of Nevada, in andfor the County of Humboldt, as a “Final Order of Determination of the Relative Rights of Claimantsand Appropriators to the Use of the Water of the Humboldt River Stream System and its Tributaries.”According to Nevada State Law, water appropriators were then allowed to file exceptions to theState Engineer’s findings of fact with respect to diversion rights (amounts) and dates of appropriation(the priority date).231 Further, the court allowed for an extension of these exception filings.232 OnJanuary 5, 1925, a hearing was held before the Judge George A. Bartlett on the State Engineer’s“Final Order of Determination” to hear and rule on all exceptions to the order by appropriators of thewaters of the Humboldt River system.233

Humboldt River Chronology—Part I DIVISION OF WATER PLANNING
I–78 Nevada Water Basin Information and Chronology Series
On January 2, 1931, after nearly six years of taking evidence and testimony, the Bartlett Decree wasissued adjudicating water rights along the Humboldt River and its tributaries.234 In addition toadjudicating the river system’s water rights, this decree also recognized that the surface waters withinthe Humboldt River system were already fully appropriated, leaving no surplus water for irrigationduring an average, or normal water year. Another important finding of the Bartlett Decreerecognized the differences in growing seasons between the Humboldt River’s upper basin and itslower basin235 and therefore divided the river system into two districts, District No. 1 below Palisade(USGS gaging station) and District No. 2 above Palisade.236
The Bartlett Decree also recognized the seasonal and ephemeral nature of many streams within theHumboldt River Basin through the concept of “flash streams” and the special need to accommodatewater appropriators along such stream systems. These water courses were defined as streams “thathave a sudden or flash flow or flush flow for a comparatively brief period of time, while such streamis draining the particular basin or source of supply fed by melting snows…These flash streams invarying degrees are typical of the necessity of cumulating the flow during the flush for the particularrights to be served. Where lands are entitled to irrigation from such flash streams, they must beserved at the times when the water is available.”237
The Bartlett Decree established three classes of lands with different irrigation requirements (waterduties) and irrigation periods (both with respect to the number of days of allowable irrigation and thespecific periods of irrigation). These irrigable land classes included: (1) Harvest crop lands (ClassA) – all lands devoted to cultivated crops, including irrigated native or other grass lands whichnormally receive sufficient water to produce a crop which will justify cutting for hay, although it maysometimes be pastured and not cut; (2) Meadow pasture lands (Class B) – all grass lands free frombrush which receive sufficient water to produce what may be classed as good pasture, but notsufficient to warrant cutting for hay; and (3) Diversified pasture lands (Class C) – all lands from whichthe brush has not been cleared but which are artificially irrigated to some extent for the productionof grasses for pasturage. Further, the irrigation periods within the Humboldt River system varied byboth the class of the land and whether it was in District No. 1 (below Palisade) or District No. 2(above Palisade). Due to extensive review and corrections of the written findings by Judge Bartlett,the final Bartlett Decree would not be entered until October 20, 1931.238
Based on subsequent protests, on December 16, 1931, the first of a number of rulings for themodification, correction and amendment of the October 1931 Bartlett Decree was made by DistrictJudge H.W. Edwards, in the Sixth Judicial District Court.239 This was followed by additional changesand amendments entered on April 27, 1933,240 February 8, 1934,241 June 8, 1934,242 October 1,1934,243 November 19, 1934,244 February 11, 1935,245 and finally on March 11, 1935.246 Collectively,this compilation of modifications and changes to the 1931 Bartlett Decree became known as theEdwards Decree. One particular change of some importance to the Bartlett Decree was the oneentered on February 8, 1934 by Judge Edwards which removed language pertaining to the formaldivision of the Humboldt River system into a District No. 1 below Palisade and a District No. 2 abovePalisade. In its place, the Edwards Decree merely established specific irrigation seasons andreaffirmed the three classes of land for specific water rights, the water duty for each land class, andthe period over which water was to be received by these lands.247

DIVISION OF WATER PLANNING Humboldt River Chronology—Part I
Nevada Water Basin Information and Chronology Series I–79
In a related matter pertaining to Humboldt River Basin water rights, on October 1, 1929, inpreparation of the adjudication process for the Little Humboldt River, the Nevada State Engineer filedan “Abstract of Claims in and to the Waters of the Little Humboldt River and its Tributaries inHumboldt and Elko Counties, State of Nevada.”248 Based on hearings begun in November 1931, theE.P. Carville Decree (Case No. 3157) was subsequently issued on January 24, 1935 adjudicatingwater rights for the Little Humboldt River. As with the Bartlett Decree (and the later EdwardsDecree), the Carville Decree determined water rights for three classes of lands: (1) Class A – harvestcrops; (2) Class B – meadow pasture; and (3) Class C – diversified pasture.249 In general, the decreeprovided for a flow of 1.0 cfs per 100 acres of decreed land, or at rates proportional to this. Whenwater was available, Class A water rights are for the delivery of water at this rate of flow for a periodof 180 days from March 15 to September 15, or a total water diversion during the season of 3.6 acre-feet per acre. Class B rights are for 90 days from March 15 to June 13, for a total of 1.8 acre-feetper acre. Class C rights are for 45 days from March 15 to April 28, for a total of 0.9 acre-feet peracre.250
On October 8, 1935, based upon a sequence of changes to the October 20, 1931, Bartlett Decree,the Edwards Decree was issued correcting a number of earlier adjudicated water rights for theHumboldt River Basin.251 As most of the corrected water-rights contained within the EdwardsDecree applied to lands above Palisade (i.e., the upper Humboldt River Basin), the Edwards Decreewas applied to and used for distribution of the Humboldt River system’s waters above Palisade, whilethe Bartlett Decree continued to apply to and be used in the distribution of water below Palisade.252
In general, the Edwards Decree provided for a flow of 1.23 cfs per 100 acres of decreed land or atproportional rates. Three land classes were established (the same as for the Bartlett Decree) withdifferent dates of use and number of days of allowed irrigation. Each sub-basin within the overallHumboldt River Basin had its unique amount of decreed land and decreed water within the three landclasses (A, B and C). Diverted water for irrigation purposes was to be measured where the mainditch enters or becomes adjacent to the land to be irrigated.253
In resolving the final appeals to the Humboldt River adjudication process, on December 3, 1936,Judge J.M. Lockhart of the Sixth Judicial District Court denied a final October 28, 1935 motion filedby John M. Marble and Robert E. Marble and others to declare null and void a document entitled“Amended, Changed and Corrected Findings of Fact, Conclusions of Law and Decree” signed byH.W. Edwards (i.e., the Edwards Decree). One of the motion’s crucial points was that JudgeEdwards was not the presiding judge when he signed the decree. In denying the motion, JudgeLockhart noted that “ever since February 19, 1867, the power has been given to district judges toperform certain acts after they have retired from office.”254 Finally, on November 26, 1938, theNevada Supreme Court refused to allow any further protests to the Edwards Decree and the case wasdeclared closed, officially completing the adjudication of the Humboldt River’s water rights throughthe 1931 Bartlett Decree and the 1935 Edwards Decree.255 While this may have completed theadjudication process for the Humboldt River, it by no means resolved all water-related issues withinthe basin.
Upper Humboldt River Basin Water Rights
The upper Humboldt River Basin’s water rights (above Palisade) were established by the 1935

Humboldt River Chronology—Part I DIVISION OF WATER PLANNING
I–80 Nevada Water Basin Information and Chronology Series
Edwards Decree. In general, this decree provides for a flow of 1.23 cfs per 100 acres of decreedland, or at proportional rates. Water diverted for irrigation purposes is measured where the mainditch enters or becomes adjacent to the land to be irrigated. According to Nevada Water Law:
“The State Engineer shall consider the duty of water as therefore established by court decree or byexperimental work in such area or as near thereto as possible. He shall also consider the growing season,type of culture, and reasonable transportation losses of water up to where the main ditch or channelenters or becomes adjacent to the land to be irrigated, and may consider any other pertinent data deemednecessary to arrive at the reasonable duty of water.”256
Table 11, Upper Humboldt River Water Rights, presents information for those sub-basins located inthe upper Humboldt River Basin by classes and types of decreed lands, irrigation days allowed by landclass, dates of irrigation, decreed land and water and the specific water duty by land class in acre-feetper acre per season (year).

DIVISION OF WATER PLANNING Humboldt River Chronology—Part I
Nevada Water Basin Information and Chronology Series I–81
Table 11 – Upper Humboldt River Water Rights†Land Classes, Number of Days, Dates of Irrigation, Decreed Land and Water Rights
Class and Type of LandIrrigation
DaysDates of
IrrigationDecreed
Land (acres)Decreed Water
(acre-feet)Water Duty(af per acre)
Mary’s River Sub-Basin (flow rate–1.23 cfs)A – Harvest Crop 120 4/15 – 8/15 9,260 27,770 3.00B – Meadow Pasture 60 4/15 – 6/15 1,240 1,860 1.50C – Diversified Pasture 30 4/15 – 5/15 7,700 5,770 0.75 Sub-Basin Totals 18,200 35,400 1.95Ruby Mountains Sub-Basin (flow rate–1.23 cfs)A – Harvest Crop 120 4/15 – 8/15 78,575 235,260 3.00B – Meadow Pasture 60 4/15 – 6/15 3,020 4,565 1.50C – Diversified Pasture 30 4/15 – 5/15 9,060 6,925 0.75 Sub-Basin Totals 90,655 246,750 2.72North Fork Humboldt River Sub-Basin (flow rate–1.23 cfs)A – Harvest Crop 120 4/15 – 8/15 17,525 52,238 3.00B – Meadow Pasture 60 4/15 – 6/15 238 357 1.50C – Diversified Pasture 30 4/15 – 5/15 512 378 0.75 To Sub-Basin Totals 18,275 52,973 2.90Maggie Creek Sub-Basin (flow rate–1.23 cfs)A – Harvest Crop 120 4/15 – 8/15 1,962 5,855 3.00B – Meadow Pasture 60 4/15 – 6/15 540 811 1.50C – Diversified Pasture 30 4/15 – 5/15 1,335 985 0.75 Tot Sub-Basin Totals 3,837 7,651 1.99Elko Reach Sub-Basin‡ (flow rate–1.23 cfs)A – Harvest Crop 120 4/15 – 8/15 15,000 45,000 3.00B – Meadow Pasture 60 4/15 – 6/15 800 1,200 1.50C – Diversified Pasture 30 4/15 – 5/15 6,000 4,500 0.75 Sub-Basin Totals 21,800 50,700 2.33Upper Humboldt River Basin Totals 152,767 393,474 2.58
† Based on water rights enforced by 1935 Edwards Decree.‡ Because of the intermingled use of water between the Humboldt River and side streams, there is some duplication of water rightsin this sub-basin with those adjoining sub-basins, i.e., Ruby Mountains, North Fork, Maggie Creek and Pine Valley.Source Data: Humboldt River Basin, Nevada, Water and Related Land Resources, Nevada Department of Conservation and NaturalResources and the United State Department of Agriculture.
Lower Humboldt River Basin Water Rights
Water rights for the lower Humboldt River Basin (below Palisade and excepting the Little HumboldtRiver and Reese River systems) were established by the 1931 Bartlett Decree. In general, this decreeprovides for a flow of 0.81 cfs per 100 acres of decreed land, or at proportional rates. Water divertedfor irrigation purposes is measured where the main ditch enters or becomes adjacent to the land tobe irrigated. Water rights for the Little Humboldt River, which is a closed sub-basin of the HumboldtRiver Basin except during particularly severe flood events, were established by the 1935 CarvilleDecree.257 Reese River water rights are not included as they are vested water rights and have not,as yet, been fully adjudicated for all this sub-basin’s streams. Also, Pine Valley water rights, whileestablished by the Bartlett Decree, have flow and duration characteristics of upper Humboldt Riversub-basins. Table 12, Lower Humboldt River Water Rights, presents information for those sub-basins

Humboldt River Chronology—Part I DIVISION OF WATER PLANNING
I–82 Nevada Water Basin Information and Chronology Series
located in the lower Humboldt River Basin by classes and types of decreed lands, irrigation daysallowed by class, dates of irrigation, decreed land and water and the specific water duty by land classin acre-feet per acre per season (year).
Table 12 – Lower Humboldt River Water Rights1
Land Classes, Number of Days, Dates of Irrigation, Decreed Land and Water Rights
Class and Type of LandIrrigation
DaysDates of
IrrigationDecreed
Land (acres)Decreed Water
(acre-feet)Water Duty(af per acre)
Pine Valley Sub-Basin (flow rate–1.23 cfs)A – Harvest Crop 120 4/15 – 8/15 3,431 10,293 3.00B – Meadow Pasture 60 4/15 – 6/15 182 273 1.50C – Diversified Pasture 30 4/15 – 5/15 304 228 0.75 Sub-Basin Totals 3,917 10,794 2.76Battle Mountain Sub-Basin2 (flow rate–0.81 cfs)A – Harvest Crop 180 3/15 – 9/15 14,790 46,730 3.00B – Meadow Pasture 90 3/15 – 6/13 16,260 24,390 1.50C – Diversified Pasture 45 3/15 – 4/28 25,500 19,120 0.75 Sub-Basin Totals 56,550 90,240 1.60Sonoma Reach Sub-Basin (flow rate–0.81 cfs)A – Harvest Crop 180 3/15 – 9/15 8,940 26,810 3.00B – Meadow Pasture 90 3/15 – 6/13 2,000 2,990 1.50C – Diversified Pasture 45 3/15 – 4/28 5,920 4,440 0.75 Sub-Basin Totals 16,860 34,240 2.00Lovelock Reach Sub-Basin (flow rate–0.81 cfs)Pershing County WaterConservation District3 180 3/15 – 9/15 37,086 137,536 3.70Other Irrigated Land inPershing County4 — — 3,798 7,297 1.90 Sub-Basin Totals 40,884 144,833 3.50Little Humboldt River Sub-Basin5 (flow rate–1.00 cfs)A – Harvest Crop 180 3/15 – 9/15 30,361 109,300 3.60B – Meadow Pasture 90 3/15 – 6/13 1,539 2,770 1.80C – Diversified Pasture 45 3/15 – 4/28 10,087 9,078 0.90 Sub-Basin Totals 41,987 121,148 2.90Lower Humboldt River Basin Totals 160,198 401,255 2.50
1 Generally based on water rights enforced by 1931 Bartlett Decree with the exception of the Little Humboldt River sub-basin inwhich water rights are enforced by the 1935 Carville Decree (and Bonnifield Decree).2 Most of the water rights were established by the Bartlett Decree. There are some rights, however, that were established by theEdwards Decree, and others by permits from the State Engineer’s office. In general, the decreed rights provide for a rate of flowof 0.81 cfs per 100 acres of decreed land, or at proportional rates, for the periods indicated.3 After the completion of Rye Patch Dam and Reservoir and the transfer of the purchased water rights (to include those water rightsfrom the Battle Mountain sub-basin) to the Humboldt Project, the water rights assigned as meadow pasture (Class B) and diversifiedpasture (Class C) within the project area were converted, by proportion, to harvest crop (Class A) water rights.4 Includes about 2,500 acres in the Imlay-Mill City area, which receive water from the Humboldt River, 200 acres near Oreanawhich are irrigated from underground water, and 1,100 acres of non-project land in Lovelock Valley which receive water from theriver through the Rye Patch Reservoir.5 Based on water rights enforced by the 1935 Carville Decree (and Bonnifield Decree).Source Data: Humboldt River Basin, Nevada, Water and Related Land Resources, Nevada Department of Conservation and NaturalResources and the United State Department of Agriculture.
DIVISION OF WATER PLANNING Humboldt River Chronology—Part I
Nevada Water Basin Information and Chronology Series I–83
Principal Storage Facilities of the Humboldt River Basin
The following provides information on water storage facilities located within the Humboldt RiverBasin. The “NV” numbers refer to the National Inventory of Dams (NID) numbering system whilethe “J” numbers (in parentheses after the NID) refer to the Nevada Safety of Dams Permit Number(per Nevada Revised Statutes 535.010). The sub-basins refer to the eleven defined principal drainageregions of the Humboldt River Basin presented in an earlier section (“Humboldt River Sub-BasinAnalysis”) while the hydrographic area (and hydrographic area number) refer to one of the 33hydrographic areas and one sub-area contained within the Humboldt River Basin as defined by theNevada Division of Water Resources, Department of Conservation and Natural Resources. Thesource for this material was the Office of the State Engineer, Division of Water Resources,Department of Conservation and Natural Resources (September 1999).
(1) Bishop Creek Reservoir (Metropolis Reservoir)NID: NV00050Location: Bishop Creek, 20 miles upstream from Deeth, NevadaSub-Basin/Hydrographic Area: Mary’s River/Mary’s River Area (42)Construction Date: 1912Dam/Reservoir Built By: Pacific Reclamation CompanyDam/Reservoir Owned By: Pacific Reclamation CompanyDam Type: Earthfill with concrete facingReservoir Specifics: Depth–70 feet; length–5 miles; surface area–11,500 acresStorage Capacity: 30,000 acre-feet (has storage restriction imposed by the State Engineer of zeroacre-feet due to leaks)Water Rights Owned By: Pacific Reclamation CompanyWater Used For: IrrigationWhere Used: Lands of Pacific Reclamation CompanyOther Information: Dam leaks badly; no storage currently allowed until fully repaired; waterrights are junior in priority to U.S. Bureau of Reclamation water rights.
(2) South Fork ReservoirNID: NV00226 (J-237)Location: South Fork Humboldt River, 23 miles upstream from Carlin, Nevada, and ten milesup the South Fork from its confluence with the Humboldt River main stemSub-Basin/Hydrographic Area: Ruby Mountains/Huntington Valley Area (47)Construction Date: 1987Dam/Reservoir Built By: State of Nevada and Elko County Fair and Recreation BoardDam/Reservoir Owned By: State of NevadaDam Type: Zoned earthfillReservoir Specifics: Depth–73 feet; length–4 miles; surface area–1,600 acresStorage Capacity: 42,000 acre-feetWater Rights Owned By: State of NevadaWater Used For: Recreation/fisheriesWhere Used: In situ (locally)Other Information: Minimum required flow downstream of dam is 5 cubic feet per second.

Humboldt River Chronology—Part I DIVISION OF WATER PLANNING
I–84 Nevada Water Basin Information and Chronology Series
(3) Maggie Creek Dam/ReservoirNID: NV10195 (J-410)Location: Off-stream, Maggie Creek, 6 miles upstream from Carlin, NevadaSub-Basin/Hydrographic Area: Maggie Creek/Maggie Creek Area (51)Construction Date: 1994 (last modified)Dam/Reservoir Built By: Newmont Gold CorporationDam/Reservoir Owned By: Newmont Gold CorporationDam Type: Zoned earthfillReservoir Specifics: Depth–90 feet; length–one-half mile; surface area–160 acresStorage Capacity: 6,500 acre-feetWater Rights Owned By: Newmont Gold CorporationWater Used For: Excess mine water (dewatering); also minor irrigationWhere Used: Lower Maggie Creek area and discharged to the Humboldt RiverOther Information: Only allowed to discharge during certain times of the year. Water source isgroundwater and leakage into pit of Maggie Creek.
(4) T-S Ranch Dam and ReservoirNID: NV10258 (J-320)Location: Off-stream from Boulder CreekSub-Basin/Hydrographic Area: Battle Mountain/Boulder Flat Area (61)Construction Date: Last modified in 1996Dam/Reservoir Built By: Barrick GoldstrikeDam/Reservoir Owned By: Barrick GoldstrikeDam Type: Zoned earthfillReservoir Specifics: Depth–68 feet; length–one-half mile; surface area–260 acresStorage Capacity: 1,900 acre-feetWater Rights Owned By: Barrick GoldstrikeWater Used For: Excess mine water (dewatering) and used for irrigationWhere Used: Boulder Flat on T-S RanchOther Information: Actual storage approximately 40 acre-feet due to a crack in the reservoir.
(5) Willow Creek ReservoirNID: NV00054 (J-506)Location: Rock Creek, 66 miles above Battle Mountain, NevadaSub-Basin/Hydrographic Area: Battle Mountain/Willow Creek Valley Area (63)Construction Date: 1910-1925 (original); 1999 (last repaired)Dam/Reservoir Built By: Golconda Cattle Company, Ellison Ranching Company, BarrickGoldstrikeDam/Reservoir Owned By: Barrick GoldstrikeDam Type: Rockfill, concrete faceReservoir Specifics: Depth–56 feet; length–3 miles; surface area–600 acresStorage Capacity: 18,000 acre-feetWater Rights Owned By: Barrick GoldstrikeWater Used For: IrrigationWhere Used: Squaw Valley RanchOther Information: Barrick Goldstrike recently (1999) repaired outlet works, spillway and

DIVISION OF WATER PLANNING Humboldt River Chronology—Part I
Nevada Water Basin Information and Chronology Series I–85
parapet wall.
(6) Chimney ReservoirNID: NV01151 (J-134)Location: Little Humboldt River, 48 miles upstream from Winnemucca, Nevada, and 44 milesup from the Humboldt River main stem near the merger of the Little Humboldt River’s North andSouth ForksSub-Basin/Hydrographic Area: Little Humboldt River/Little Humboldt Valley Area (67)Construction Date: 1974Dam/Reservoir Built By: Nevada Garvey RanchesDam/Reservoir Owned By: Nevada Garvey RanchesDam Type: Zoned earthfillReservoir Specifics: Depth–59.7 feet; length–6 miles; surface area–2,080 acresStorage Capacity: 35,000 acre-feetWater Rights Owned By: Nevada Garvey Ranches and Humboldt County Fair and RecreationBoardWater Used For: Irrigation and recreationWhere Used: Little Humboldt ValleyOther Information: Joint usage reservoir.
(7) Lone Tree (Mine) Cooling PondsNID: NV10464 (J-436)Location: North of the Lone Tree Mine site near Valmy Power Plant, off-stream, approximatelyeighteen miles upstream from GolcondaSub-Basin/Hydrographic Area: Battle Mountain/Pumpernickel Valley Area (65)Construction Date: 1997 (one cell)Dam/Reservoir Built By: Santa Fe Pacific GoldDam/Reservoir Owned By: Newmont Gold CorporationDam Type: Zoned earthfillReservoir Specifics: Depth–8 feet; length–one-half mile; surface area–35 acresStorage Capacity: 105 acre-feetWater Rights Owned By: Newmont Gold CorporationWater Used For: Excess pit waterWhere Used: Once cooled, water is discharged to the Humboldt RiverOther Information: Source is groundwater. Water is continuously discharged (recycled) throughthe ponds (cells). While 105 acre-feet is the resident capacity, actual water being discharged isconsiderably greater.
(8) Upper and Lower Pitt-Taylor ReservoirsNIDs: NV00062 and NV00063Location: Pitt-Taylor Canal (from Humboldt River), 32 miles upstream from Lovelock, NevadaSub-Basin/Hydrographic Area: Lovelock Reach/Imlay Area (72)Construction Date: 1907-1911Dam/Reservoir Built By: Humboldt-Lovelock Irrigation, Power & Light CompanyDam/Reservoir Owned By: Pershing County Water Conservation DistrictDam Type: Homogeneous earthfillReservoir Specifics (Upper Reservoir/Lower Reservoir): Depths–16 feet/24 feet; lengths–3

Humboldt River Chronology—Part I DIVISION OF WATER PLANNING
I–86 Nevada Water Basin Information and Chronology Series
miles/5 miles; surface areas–2,000 acres/2,200 acresStorage Capacity (Combined/Upper Reservoir/Lower Reservoir): 36,600 acre-feet/20,800 acre-feet/15,800 acre-feetWater Rights Owned By: Pershing County Water Conservation DistrictWater Used For: IrrigationWhere Used: Lovelock ValleyOther Information: Storage restrictions imposed by the State Engineer; last amended in 1971increasing total (combined) storage capacity from 35,000 acre-feet to present 36,600 acre-feet.
(9) Rye Patch ReservoirNID: NV10124Location: Humboldt River and outflow from Upper and Lower Pitt-Taylor Reservoirs, 9 milesupstream from Lovelock, NevadaSub-Basin/Hydrographic Area: Lovelock Reach/Lovelock Valley Area (dam) (73) and LovelockValley and Imlay Areas (reservoir) (73 and 72)Construction Date: 1935 (begun)/1936 (completed)Dam/Reservoir Built By: U.S. Bureau of ReclamationDam/Reservoir Owned By: U.S. Bureau of ReclamationDam Type: Zoned earthfillReservoir Specifics: Depth–60.5 feet; length–19 miles; surface area–11,970 acresStorage Capacity: 194,300 acre-feetWater Rights Owned By: U.S. Bureau of ReclamationWater Used For: IrrigationWhere Used: Lovelock ValleyOther Information: A 1976 rehabilitation and betterment project raised the height of the dam by3 feet and the normal surface elevation by 2 feet, adding an additional 23,000 acre-feet to storagecapacity.258 U.S. Bureau of Reclamation recently (1995-1996) upgraded seismic resistance ofdam with downstream buttress.
Mining and Mine Dewatering in the Humboldt River Basin
Mining and Early Settlement of the Humboldt River Basin
Mining has played an integral role in Nevada’s earliest settlement patterns. Even today, many ofNevada’s more rural counties, particularly those counties within the Humboldt River Basin, continueto be strongly impacted by regional and local mining activities. Before the discovery of the fabulouswealth of the Comstock Lode in the late 1850’s, the vast expanse that was the Nevada portion of theGreat Basin was considered primarily as an inhospitable and tortuous impediment to westwardmigration. What little commerce existed within the region at that time consisted mostly of fledglingagricultural outposts selling produce and other supplies to early emigrants hastily traversing thiswestern portion of the Utah Territory to reach California and Oregon beyond.
However, Nevada’s vast mineral wealth soon brought the region to national prominence in the early1860’s, making Nevada a territory separate from Utah in 1861, and the 36th State of the Union in

DIVISION OF WATER PLANNING Humboldt River Chronology—Part I
Nevada Water Basin Information and Chronology Series I–87
1864.259 Mining within the Humboldt River Basin first got its start when silver ore was discoveredin 1860 at Humboldt City, located in present-day Pershing County, and in 1862 at Dun Glen, locatedten miles northeast of Mill City and four miles south of Dun Glen Peak.260 Just outside the basin, in1861 silver ore was found on the eastern slopes of the Humboldt Range up Buena Vista Canyon. Thetown of Unionville (initially called Dixie by local Southern sympathizers), located approximately 15miles due south of present-day Imlay and just outside the basin’s borders, quickly grew up to becomethe Humboldt County seat. By the late 1870’s, however, most of the silver ore at these early miningsites had been depleted,261 and the boom-to-bust cycle which has since characterized Nevada’s miningindustry was begun.
Also in 1861, the Star Mining District (along Star Creek), also located just outside the HumboldtRiver Basin, was established when silver ore was discovered. Star City, located eight miles south ofImlay on the eastern slopes of the Humboldt Range, became the central mining town within thedistrict. During the district’s relatively brief boom years of 1864 and 1865, Star City boasted 1,200residents, two hotels, three general stores, a Wells-Fargo office, a church and a dozen or moresaloons. The (Queen of) Sheba Mine, located nearly two miles northeast of Star Peak (9,836 feetMSL), was the district’s largest operation, producing about $5,000,000 in silver by 1868, at whichtime the rich ore began to run out. Three years later, only seventy-eight inhabitants remained in StarCity. All that remains today are crumbling foundations and rusting mill equipment.262
In May 1862, the town of Austin, often referred to as the “mother town of mining camps” and locatedon the eastern side of the Reese River Valley, sprang into being after silver ore was discovered innearby Pony Canyon. With this discovery, the Reese River Valley’s largely pastoral existence wasdramatically altered and a period of intense exploitation of the area’s timber, mineral, rangeland andwater resources began. A town called Clifton flourished briefly in Pony Canyon, but fast-growingAustin soon took over in prominence and became the county seat in 1863. Early in 1864, Clifton,Austin and Upper Austin were all combined and incorporated as the City of Austin. Before the localmines began to fail in the 1880’s, Austin had become a substantial community boasting 10,000residents.263 From Austin, prospectors fanned out throughout the region to establish many otherimportant mining camps.264 In and around Austin, during its peak period, silver production was onlysecond to that of the Eureka and Comstock mines. Estimates reveal that between 1862 and 1902,Austin area’s mines produced approximately $50 million in silver.265
It did not take long for mining activities to result in conflicts with other Humboldt River Basin waterusers, as well as adversely affect the basin’s wildlife. In August 1864, under the so-called “Humboldt[Water] Right”, the Utica Bullion Mining Company boldly laid claim to use all the waters of theHumboldt River.266 The mining company built a dam across the Humboldt River below the Humboldtlakes (Humboldt and Toulon Lakes) to process its ore. The dam became the focus of continuingcontroversy, flooding agricultural fields in the lower Lovelock Valley and preventing upstreammigration of fish. The dam was eventually blown up in June 1884 by a party of masked men, afterwhich the mining company’s claim to any waters of the Humboldt River collapsed.267
In 1869, mining became one of the principal economic activities in the Ruby Mountains sub-basinwhen the Railroad Mining District, located west of Dixie Flats (Dixie Creek), was discovered and themining camp of Bullion, located two miles northeast of Raven’s Nest on the eastern slopes of the

Humboldt River Chronology—Part I DIVISION OF WATER PLANNING
I–88 Nevada Water Basin Information and Chronology Series
Pinon Range, was established as its principal settlement. Between 1869 and 1887, some $3.2 millionin silver, lead, copper and some gold was mined within the district.268
Despite the widespread mining activity, the early period of mining in the Humboldt River Basin neverreally produced the great mining booms or vast wealth of other areas in Nevada like Virginia City,Goldfield and Tonopah. However, based on the crucial importance of the Humboldt River Valleytransportation corridor, especially after the completion of the transcontinental railroad in 1869, thebasin’s development greatly benefitted from mining activities just beyond its borders. Many of thebasin’s principal communities, such as Winnemucca, Battle Mountain, Carlin and Elko, grew upservicing the needs of mining districts, many of which were just outside the boundary of theHumboldt River Basin. For example, to the south, Elko’s railroad depot, freight and stagecoach linesserved the White Pine Mining District and mining camps like Hamilton, Treasure City and White PineCity, all of which lie within Nevada’s Central Region. To the north, Elko’s transportation and freightfacilities served the Cope Mining District and the mines at Columbia, Cornucopia and Tuscarora,which all lie within the Snake River Basin.
Another form of early “mining” within the Humboldt River Basin was begun in October 1875. Atthat time the Elko Mining and Soap Deposit Company attempted to exploit the “soap” depositslocated on the east bank of Huntington Creek above Twin Bridges, about one-half mile aboveHuntington Creek’s confluence with the South Fork of the Humboldt River. These deposits had beenidentified as early as 1849 by the emigrants traveling down along Huntington Creek on the HastingsCutoff route around the Ruby Mountains. While the final product was of high quality (in fact,winning a certificate of merit at the Columbian Exposition in Chicago in 1893), the mineral depositsultimately proved too difficult to process and the operation never became a commercial success.269
By the early 1880’s, mining throughout Nevada had fallen on hard times and as a consequence thestate entered its Twenty-Year Depression (1880-1900). Over this period nearly one-third of thepeople left the state, reducing Nevada’s population from a recorded 62,266 persons in 1880 to 42,335persons by 1900.270 As bad as things appeared for Nevada’s struggling predominate silver miningindustry, they actually worsened appreciably in 1893. In this year the Sherman Silver Purchase Actwas repealed resulting in the demonetization of silver and the curtailment of its use for U.S. currency.This brought prospecting and mining activity in the Humboldt River Basin to a virtual standstill.271
In this case, the Nevada mining industry’s entry into a “bust” period was largely caused by externalfactors over which the state had virtually no control. This would not be the last time that this industrywould be adversely affected by external factors and influences.
Toward the end of the 1800’s, concerted efforts towards copper mining commenced within theHumboldt River Basin. Golconda, located 20 miles up the river from Winnemucca, was first settledin 1863 and was the by-product of the ill-fated and never completed Ginaca-Gintz Humboldt Canal.Later, in 1897, the town became the headquarters for the Golconda & Western ExplorationCompany, Ltd., which began to develop local copper deposits. At the height of the region’s coppermining boom in 1899, the town boasted some 500 inhabitants, six hotels, a newspaper, several stores,many bars, a racetrack and a flourishing tenderloin district. The Golconda copper mining boom wasshort-lived, however. By 1900, because of difficulties in treating the Adelaide and Copper Canyonores upon which the town had flourished, the mine, mill and narrow-gauge railroad to the mine site

DIVISION OF WATER PLANNING Humboldt River Chronology—Part I
Nevada Water Basin Information and Chronology Series I–89
were all shut down.272
The Carlin Trend and the Era of Nevada’s Modern Gold Mining
The era of modern gold (and silver) mining in the Humboldt River Basin began tenuously in the early1900’s when promising gold deposits were first discovered north of Carlin in northern Eureka Countyand western Elko County. In 1907, gold deposits were found in western Elko County in the Midas(Gold Circle) Mining District during the general resurgence in prospecting all over Nevada followingthe fabulous gold strikes at Tonopah and Goldfield. A rush ensued and a townsite – called GoldCircle at first, but later changed to Midas – was laid out, located just over 40 miles north of BattleMountain. At its peak period of production from 1916 to 1921, Midas had a population of some2,000 people. By the end of 1921, the district had produced almost $2.5 million in gold, silver andcopper. After the Elko Prince Mill burned in 1922, Midas, which once hosted 21 saloons, a postoffice, a town water system, a newspaper, four general stores and several hotels and rooming houses,quickly lapsed into a near ghost town and is now visited only seasonally by hunters and curiosityseekers.273
In March 1913, the Big Six Mining Company laid out the town site of Lynn, located approximately20 miles up Maggie Creek from Carlin. Gold was mined at the location in paying quantities and earlyestimates indicated the gold vein as being one of the largest and most lucrative in Nevada. However,this mining boom was quite short lived, even by Nevada’s standards, and by December 1914 thecompany was experiencing severe financial difficulties.274 Despite these early setbacks, the first majorgold strikes in the area north of Carlin were indicative of far greater fortunes to come from this area.Not until the 1980’s, however, would conditions be conducive for the development of this mineral-rich area. At that time, higher gold prices and the use of advanced technology in both ore extractionand milling would allow for the extensive development and cost-effective mining of this vast, butrelatively low-grade body of gold ore running throughout this area of western Elko County andnorthern Eureka County. Only then would this region, now known as the “Carlin Trend”, prove itselfas the richest gold-producing region in the United States.
But before that eventuality, further gold discoveries continued to show the vast extent of theHumboldt River Basin’s mineral wealth. In 1934 two large mines, the Riley and Getchell, located ineastern Humboldt County, were developed in the Potosi Mining District of the Osgood Mountainsto exploit scheelite tungsten and gold-bearing ores. The Getchell Mine, located some 15 miles duenorth of Red House and the Humboldt River, was subsequently acquired in 1935 by GeorgeWingfield and Noble Getchell, prominent Nevada mining men. At first, the mine was operatedprimarily for extraction of gold oxide ores; however, during World War II the gold mining operationswere terminated and extraction was concentrated on tungsten ores, which had greater militaryvalue.275 Later, following the withdrawal of the U.S. Government’s tungsten purchase program in1957,276 gold operations were resumed at the Getchell mine site and would continue through to thepresent day. The district now ranks as an important producer of gold along an ore body called theGetchell Gold Trend, which intersects with the Carlin (Gold) Trend near the Midas mine site some25 miles to the east.
Table 13, Nevada Mining Industry Analysis, 1985-1998, presents information and trends with respect
Humboldt River Chronology—Part I DIVISION OF WATER PLANNING
I–90 Nevada Water Basin Information and Chronology Series
to the total mineral valuation, gold and silver valuation, the number of mining workers, and theproductivity of mining workers for Nevada and for the five principal counties within the HumboldtRiver Basin. The concept of mining worker productivity – a dollar measure of gross mining proceedsper mining worker – has important implications in assessing the financial feasibility and attractivenessof particular mining operations. The rapid and relatively recent (late 1980’s) growth in overall miningin Nevada is clearly shown by the trends between 1985 and 1990. Over that relatively brief period,the valuation of total mineral production in Nevada more than quadrupled from $623 million in 1985to over $2.6 billion by 1990.
The importance of gold mining is also shown in Table 13 by the fact that over the same 1985 to 1990time period the valuation of gold (and silver) production in Nevada increased by a factor of nearlyfive times. From 1985 to 1990, the value of Nevada’s gold production rose from nearly $481 millionand 77 percent of the state’s valuation of total mining proceeds to nearly $2.4 billion and 90 percentof Nevada’s total mineral proceeds. Since 1990, statewide mineral production, based primarily onthe trends in gold mining, has shown only modest gains and by 1998 gold and silver productioncontinued to account for approximately 90 percent of Nevada’s total value of all minerals produced.The more recent weakness in international gold prices has dramatically affected the trends inNevada’s gold mining industry. Statewide total mining employment, primarily reflecting the influenceof increased gold production, rose by 8,240 workers or 136 percent between 1985 and 1990. Since1990, however, job losses in Nevada’s mining industry have totaled 1,085 workers, a decrease of 7.6percent.
Since Nevada became a territory in 1861, mining has played a crucial role in terms of the HumboldtRiver Basin’s settlement and development patterns. These influences have persisted to the presentday. The basin’s principal five counties277 of Elko, Eureka, Humboldt, Lander and Pershing comprisefive of the top six mineral and gold producing counties in Nevada.278 Nevada is currently the largestgold producer in the United States with $2.66 billion in total gold production in 1998. Nevada alsolays claim to having the largest underground gold mine (Barrick Goldstrike’s Meikle Mine) and thelargest surface (open pit) gold mine (Barrick Goldstrike’s Betze-Post Mine) in the U.S. (which is alsothe nation’s largest gold mine).279 The total value of all mining activity in the state in 1998 came tonearly $3 billion, down only slightly from 1997’s total mineral production of $3.12 billion. Gold andsilver production in Nevada in 1998 was also down very slightly from $2.67 billion in gold productionin 1997.

DIVISION OF WATER PLANNING Humboldt River Chronology—Part I
Nevada Water Basin Information and Chronology Series I–91
Table 13 – Nevada Mining Industry Analysis – 1985-1998Gross Mineral Proceeds, Workers, Productivity of Humboldt River Basin Counties†(Gross Mining Proceeds in Millions of Dollars; Productivity in Dollars per Worker per Year)
Mining – State/County 1985‡ 1990 1995 1998
1990-98VolumeChange
1990-98PercentChange
NEVADAGross Mining Proceeds (Value) [1] Gold and Silver Production (Value) Number Mining Workers Mining Worker Productivity [2]
$623.63$480.83
6,081$102,554
$2,635.47$2,367.64
14,321$184,029
$2,991.62$2,740.84
13,187$226,862
$2,998.54$2,663.10
13,236$226,544
$363.07$295.46
-1,085$42,515
13.8%12.5%-7.6%23.1%
Elko CountyGross Mining Proceeds Gold and Silver Production Number Mining Workers Mining Worker Productivity
$102.35$97.53
774$132,235
$238.43$232.15
1,289$184,970
$183.47$169.60
1,295$141,674
$447.42$409.93
1,223$365,835
$208.99$177.78
-66$180,865
87.6%98.2%-5.1%97.8%
Eureka CountyGross Mining Proceeds Gold and Silver Production Number Mining Workers Mining Worker Productivity
$114.88$108.23
636$180,633
$789.73$784.44
3,599$219,432
$1,412.68$1,405.12
3,927$359,735
$946.59$944.83
4,079$232,064
$156.86$160.39
480$12,632
19.9%20.4%13.3%5.8%
Humboldt CountyGross Mining Proceeds Gold and Silver Production Number Mining Workers Mining Worker Productivity
$31.94$31.56
393$81,272
$356.96$353.13
1,527$233,768
$441.82$437.75
2,305$191,681
$365.45$360.16
2,009$181,904
$8.49$7.03
482-$51,864
2.4%2.0%
31.6%-22.2%
Lander CountyGross Mining Proceeds Gold and Silver Production Number Mining Workers Mining Worker Productivity
$96.22$86.68
845$113,869
$276.03$266.08
1,360$202,961
$279.94$258.49
1,082$258,726
$487.54$467.28
1,106$440,816
$211.51$201.20
-254$237,855
76.6%75.6%
-18.7%85.3%
Pershing CountyGross Mining Proceeds Gold and Silver Production Number Mining Workers Mining Worker Productivity
$16.12$3.76
195$82,688
$96.90$85.58
683$141,869
$111.60$99.69
682$163,639
$164.42$151.09
799$205,776
$67.52$65.51
116$63,907
69.7%76.6%17.0%45.0%
Humboldt River Basin CountiesGross Mining Proceeds Percent Statewide Total Gold and Silver Production Percent Statewide Total Number Mining Workers Mining Worker Productivity
$361.5158.0%
$327.7668.2%
2,843$127,158
$1,758.0566.7%
$1,721.3872.7%
8,458$207,856
$2,429.5181.2%
$2,370.6586.5%
9,291$261,491
$2,411.4280.4%
$2,333.2987.6%
9,216$261,656
$653.3713.7pp*$611.9114.9pp*
758$53,799
37.2%—
35.5%—
9.0%25.9%
† Mineral values are for the total county and not necessarily for only those mines within the Humboldt River Basin.‡ Due to reporting limitations at the time, gold and silver production valuation figures for 1985 may also contain relativelyinsignificant mineral valuations of other metals and metallic by-products, for example, lead and copper.* pp = percentage point difference.[1] Gross mining proceeds measures the market valuation of mineral sales made by the Nevada mining industry.[2] Mining worker productivity measures the total state or county gross mining proceeds (including gold and silver production)divided by the respective average mining employment for that year; measured in dollars per mining worker per year.Source Data: Nevada Department of Taxation, Centrally Assessed Properties, Division of Assessment Standards; NevadaDepartment of Employment, Rehabilitation and Training (DETR), Research and Analysis Bureau.

Humboldt River Chronology—Part I DIVISION OF WATER PLANNING
I–92 Nevada Water Basin Information and Chronology Series
The five principal Nevada counties within the Humboldt River Basin accounted for just over 80percent of Nevada’s total mineral production in 1998 and nearly 88 percent of the state’s total goldand silver production. These counties, in ranked order by their total 1998 mineral production,include:
Basin Percent Total State Percent of Total Gold andCounty Mineral Production Silver Mineral ProductionEureka 31.6% 35.5%Lander 16.3% 17.6%Elko 14.9% 15.4%Humboldt 12.2% 13.5%Pershing 5.5% 5.7%Basin Counties Total 80.4% 87.6%
In addition, these five Humboldt River Basin counties also accounted for nearly 70 percent of thestate’s total mining jobs in 1998. Table 14, Humboldt River Basin Mining Employment Trends,1997-1998, shows how the more recent declines in statewide total mining employment (jobs) havetended to be concentrated within the principal gold-producing counties making up the HumboldtRiver Basin. While Nevada experienced a total decline of 1,427 mining jobs from 1997 to 1998, thebasin’s five counties showed a cumulative decline of 1,083 mining jobs, meaning that 75.9 percentof the statewide decline in total mining jobs between 1997 and 1998 were concentrated within thebasin’s principal counties. While mining’s impacts on statewide total employment appears slight,making up only 1.4 percent of total state employment, the importance of mining to the basin’s overallemployment patterns is far more crucial.
In 1998, the mining industry accounted directly for nearly 25 percent of all jobs in the HumboldtRiver Basin’s principal counties, ranging from a high of almost 90 percent of total employment inEureka County to a low of 6.2 percent of total employment in Elko County. Obviously, the greaterthe share of mining jobs, the more extensive the effects that changes in mining jobs will have on thelocal economy. In addition to the direct economic effects of changes in mining jobs within thesecounties, the indirect impact of such changes will result in secondary, or indirect economic impactson other employment sectors,280 and is also likely to have far-reaching effects on employment outsidethe county or region of origin.281
Due to more recent weakening prices in gold, economic trends within Nevada’s mining industry havebeen generally downward since 1996 and have resulted in the curtailment of some aspects of theoperations in Nevada’s gold mines. Areas of operations that have been especially adversely affectedhave included the exploration for new ore deposits, investment in plant and equipment, mining-relatedconstruction activity, and employment. Table 14, Humboldt River Basin Mining Employment Trends– 1997-1998, shows that as a result of cutbacks in mining exploration, operations and investment,statewide total mining employment in 1998 of 13,236 workers was down 9.7 percent, or 1,427workers, from a total of 14,663 mining workers in 1997.282

DIVISION OF WATER PLANNING Humboldt River Chronology—Part I
Nevada Water Basin Information and Chronology Series I–93
Table 14 – Humboldt River Basin Mining Employment Trends – 1997-1998Mining Employment Trends in Counties† Comprising the Humboldt River Basin
County1998 Total
Employment
1997-98Change in
TotalEmployment
1998 MiningEmployment
Percent TotalEmployment
1997-98Change in
MiningEmployment
Percent ofMining
Change‡ toTotal Change
NEVADA 923,199 34,625 13,236 1.4% -1,427 n.m.
Elko 19,894 -288 1,223 6.2% -204 70.8%
Eureka 4,537 -317 4,079 89.9% -191 60.2%
Humboldt 7,962 -592 2,009 25.2% -442 74.7%
Lander 2,466 -242 1,106 44.8% -184 76.3%
Pershing 2,274 -2 799 35.1% -62 n.m.
Total Basin† 37,133 -1,441 9,216 24.8% -1,083 75.2%
† The majority of mines and virtually all major towns and cities within these five counties lie within the Humboldt River Basin.‡ Measures the change in mining jobs as a percent of the change in total jobs.n.m. = not meaningful to either (1) compare percentage shares of decreases (negative numbers) with increases (positive numbers)or (2) the comparison of a very large change to a very small change.Source Data: Nevada Department of Employment, Training and Rehabilitation (DETR), Research and Analysis Bureau.
Table 15, Nevada Gold and Silver Production and Average Prices, shows the historical production(in troy ounces283) and average market prices received for Nevada’s two principal precious metals –gold and silver – for selected years from 1978 to 1998. The evident extreme price variability for gold,from a low of less than $194 per ounce in 1978 to a high of over $613 per ounce in 1980 (arecessionary period and a year of extremely high inflation and general economic uncertainty), reflectsthe metal’s widespread use at that time as a “store of value” and “inflation hedge”. Relatively stablegold prices during the early and mid-1990’s, when its price remained within a relatively narrow rangearound $380-$390 per ounce, were largely responsible for the rapid expansion and prosperity ofNevada’s gold industry over this period. At the source of the more recent decline in the HumboldtRiver Basin’s mining operations has been declining gold prices, which have been trending downwardsince late 1996.
In 1997, the average price received for Nevada’s gold production had fallen to $325 per ounce, andby 1998 the average price received by Nevada’s mines for gold had declined further to only $294 perounce.284 By mid-1999, the price of gold had sunk even further to as low as $250 per ounce, andmine closings and job losses in Nevada had become more extensive. Since that time, however,considerable economic and political pressure has been brought to bear on responsible entities whichhave been involved in large open-market gold sales. By late summer 1999, these pressures helpedpersuade the International Monetary Fund (IMF) to hold off on planned gold sales that weresupposed to benefit poor countries, and on September 26, 1999, 15 European central bankerspromised to tightly limit gold sales over the next five years.285 As a result, by October 1999, gold’s“spot” market price had risen above $300 per ounce. The ultimate effects of these trends onNevada’s gold industry are unknown at this time, but could be profoundly negative if gold’s pricereverses and dips again well below the $300 per ounce level.
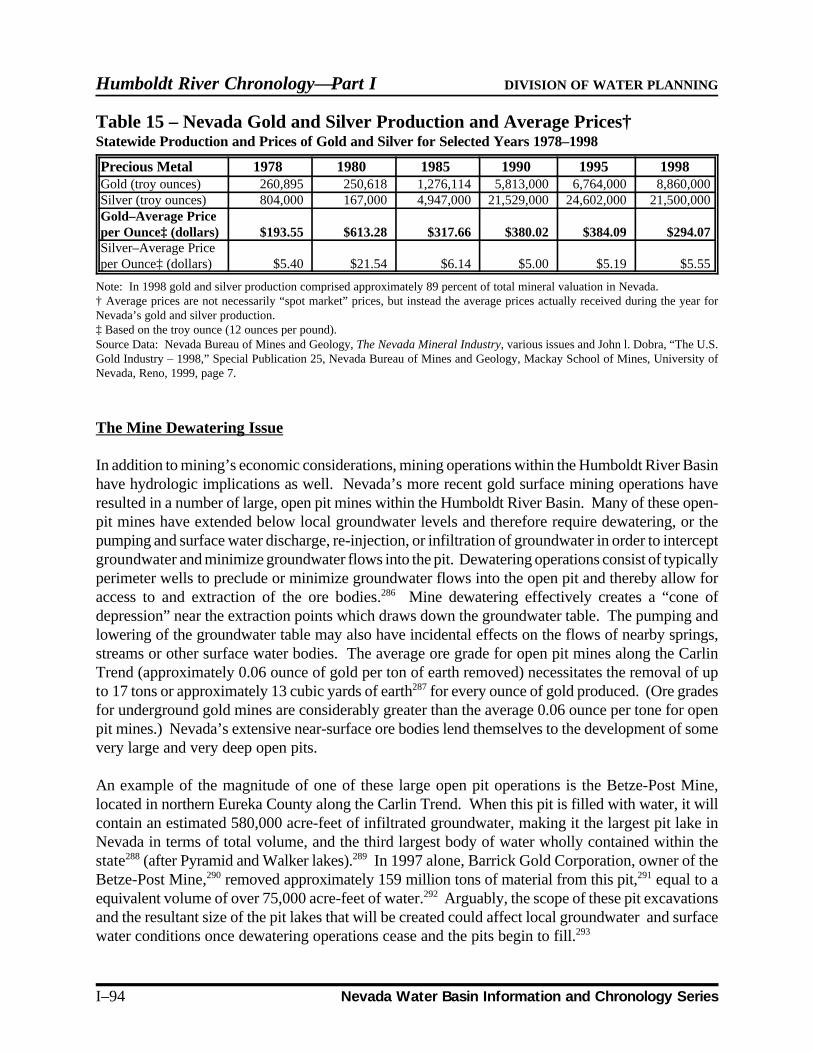
Humboldt River Chronology—Part I DIVISION OF WATER PLANNING
I–94 Nevada Water Basin Information and Chronology Series
Table 15 – Nevada Gold and Silver Production and Average Prices†Statewide Production and Prices of Gold and Silver for Selected Years 1978–1998
Precious Metal 1978 1980 1985 1990 1995 1998Gold (troy ounces) 260,895 250,618 1,276,114 5,813,000 6,764,000 8,860,000Silver (troy ounces) 804,000 167,000 4,947,000 21,529,000 24,602,000 21,500,000Gold–Average Priceper Ounce‡ (dollars) $193.55 $613.28 $317.66 $380.02 $384.09 $294.07Silver–Average Priceper Ounce‡ (dollars) $5.40 $21.54 $6.14 $5.00 $5.19 $5.55
Note: In 1998 gold and silver production comprised approximately 89 percent of total mineral valuation in Nevada.† Average prices are not necessarily “spot market” prices, but instead the average prices actually received during the year forNevada’s gold and silver production.‡ Based on the troy ounce (12 ounces per pound).Source Data: Nevada Bureau of Mines and Geology, The Nevada Mineral Industry, various issues and John l. Dobra, “The U.S.Gold Industry – 1998,” Special Publication 25, Nevada Bureau of Mines and Geology, Mackay School of Mines, University ofNevada, Reno, 1999, page 7.
The Mine Dewatering Issue
In addition to mining’s economic considerations, mining operations within the Humboldt River Basinhave hydrologic implications as well. Nevada’s more recent gold surface mining operations haveresulted in a number of large, open pit mines within the Humboldt River Basin. Many of these open-pit mines have extended below local groundwater levels and therefore require dewatering, or thepumping and surface water discharge, re-injection, or infiltration of groundwater in order to interceptgroundwater and minimize groundwater flows into the pit. Dewatering operations consist of typicallyperimeter wells to preclude or minimize groundwater flows into the open pit and thereby allow foraccess to and extraction of the ore bodies.286 Mine dewatering effectively creates a “cone ofdepression” near the extraction points which draws down the groundwater table. The pumping andlowering of the groundwater table may also have incidental effects on the flows of nearby springs,streams or other surface water bodies. The average ore grade for open pit mines along the CarlinTrend (approximately 0.06 ounce of gold per ton of earth removed) necessitates the removal of upto 17 tons or approximately 13 cubic yards of earth287 for every ounce of gold produced. (Ore gradesfor underground gold mines are considerably greater than the average 0.06 ounce per tone for openpit mines.) Nevada’s extensive near-surface ore bodies lend themselves to the development of somevery large and very deep open pits.
An example of the magnitude of one of these large open pit operations is the Betze-Post Mine,located in northern Eureka County along the Carlin Trend. When this pit is filled with water, it willcontain an estimated 580,000 acre-feet of infiltrated groundwater, making it the largest pit lake inNevada in terms of total volume, and the third largest body of water wholly contained within thestate288 (after Pyramid and Walker lakes).289 In 1997 alone, Barrick Gold Corporation, owner of theBetze-Post Mine,290 removed approximately 159 million tons of material from this pit,291 equal to aequivalent volume of over 75,000 acre-feet of water.292 Arguably, the scope of these pit excavationsand the resultant size of the pit lakes that will be created could affect local groundwater and surfacewater conditions once dewatering operations cease and the pits begin to fill.293
DIVISION OF WATER PLANNING Humboldt River Chronology—Part I
Nevada Water Basin Information and Chronology Series I–95
The State of Nevada has recognized the potential effects that these open-pit mining operations mayhave on the region’s hydrologic conditions. As a result, the State Engineer has established amitigation process of preferred uses for the pumped groundwater from these surface miningoperations. To every extent possible, this process attempts to either minimize or localize the effectsof dewatering operations, or allow the water to substitute for other existing groundwater withdrawals(such as groundwater used for alfalfa irrigation). Consequently, as a first preference, the StateEngineer has mandated that groundwater pumped that is in excess of ore processing requirementsshould be returned to the groundwater source through direct re-injection, if at all possible.Alternatively, if re-injection is not practical, then the water pumped from the mine pit may be storedin surface infiltration ponds. Depending on soil and rock strata conditions, this method can effectivelydispose of water relatively quickly, but does increase losses due to surface water evaporation.However, this option may also tend to cause localized increases in groundwater levels (mounding)294
and soil saturation immediately below and near these infiltration ponds.
As a third option, the State Engineer requires that where re-injection or infiltration are not possibleor practical, then the mine can substitute the pumped groundwater for existing permitted beneficialuses of groundwater. Examples of this include mine water used for growing alfalfa on the TS Ranchin Boulder Flat (Betze-Post Mine)295 and as a substitute for groundwater extracted for cooling theValmy Power Plant in Humboldt County (Newmont’s Lone Tree Mine). If no opportunities forbeneficial use substitution exist, then the State Engineer would consider the creation of new, albeittemporary, beneficial uses for this water.296
As a last resort, if recharge, infiltration or beneficial use substitution are not possible, then the StateEngineer will permit discharge of the pumped groundwater to existing stream systems, some of whicheventually drain into the Humboldt River. However, for such surface water discharges, NationalPollutant Discharge Elimination System (NPDES) permits are issued pursuant to the Federal CleanWater Act (CWA) and the Nevada Water Pollution Control Law. The Nevada Division ofEnvironmental Protection (NDEP) Bureau of Water Pollution Control (BWPC) issues the NPDESpermits which incorporate literally dozens of monitoring requirements pursuant to a multitude of site-specific and appropriate beneficial use standards such that no degradation to existing surface waterquality conditions result.297 For surface water discharges, NDEP’s Bureau of Water Quality Planning(BWQP) has established Requirements to Maintain Existing Higher Quality (RMHQ’s) and sitespecific Water Quality Standards for Nevada’s major lakes, rivers and streams. Some of thesestandards include pH298 levels and the amount of total dissolved solids (TDS).299 Water temperaturedifferentials may also be an issue and some pumped water from mines may initially have to be heldin cooling ponds before eventual release to existing surface waters. NDEP’s BWPC also issues waterquality discharge permits for water that is infiltrated or injected to groundwater.300
The effects and concerns of mine dewatering in the Humboldt River Basin fall into two distinct timeperiods: (1) the current period (short-term) effects occurring during active dewatering operations;and (2) the long-term effects anticipated when dewatering operations have ceased, the mine pits beginto fill, and the resultant pit lake reestablishes equilibrium with the local groundwater table.301 Theshort-term effects deal primarily with the disposal of the pumped groundwater, along with waterquantity, quality and temperature issues. Also important here are the temporary opportunities andbenefits that may be created by the use of this discharged water, such as increased recreational values

Humboldt River Chronology—Part I DIVISION OF WATER PLANNING
I–96 Nevada Water Basin Information and Chronology Series
and the maintenance or increase of instream flows for wildlife. In balance, some form of mitigationmay become necessary where unforeseen effects create a situation of potential harm to theenvironment and existing water supplies. These effects appear to have been generally accommodatedthrough the state’s existing water right and water quality control permitting processes. In theprocess, efforts to more precisely determine the threats and benefits of mine dewatering operationshave typically resulted in better research and understanding, as well as closer working relationshipsamong the mine operators, local water users likely to be most affected, interested environmentalgroups, and state and federal regulatory and permitting agencies.
In October 1995 the USGS, in cooperation with the Nevada Department of Conservation and NaturalResources and the U.S. Bureau of Land Management, began an assessment of the regional waterresources of the Humboldt River Basin. The assessment was undertaken in response to concerns overincreasing demand for the limited water resources of the basin and the potential effects of minedewatering during the past ten years. The assessment focused on 14 hydrographic areas302 in themiddle Humboldt River Basin which included areas of irrigated agriculture and most of the large goldmining operations in northern Nevada. The Humboldt River Basin Assessment was planned in twophases. Phase 1 of the studies were to be undertaken from October 1995 through September 1998and consisted of the following tasks: (1) the compilation and dissemination of hydrologic data viathe Internet (world wilde web) and a bibliography of reports pertinent to the middle basin; (2) a studyof the hydrogeologic framework and groundwater levels; (3) water budgets for selected hydrographicareas; and (4) groundwater use.
Phase 2 studies of the Humboldt River Basin Assessment were to be conducted from October 1998through September 2003 and consist of: (1) a continuation of studies related to groundwater use inthe middle basin; (2) water budgets for the remaining hydrographic areas; and (3) development of acomputer model of groundwater and surface water flow in the middle basin. Several miningcompanies with operations in the Middle Humboldt River Basin provided data, technical assistanceand funding support for the project, including Barrick Goldstrike Mines Inc., Getchell GoldCorporation (subsequently acquired by Placer Dome), Newmont Gold Company, and Santa Fe PacificGold Corporation (subsequently acquired by Newmont).303 All information, data, bibliographicreferences and progress reports are posted on the USGS Humboldt Hydrology website.304
The long-term effects of mine dewatering operations are, as yet, not well known. However, theseissues are being given considerable attention by the mining industry, state and federal regulatory andpermitting agencies, the USGS, geologists, hydrologists, environmentalists and the media. While thegeology, hydrology and hydraulics305 of the affected areas have been extensively studied,306 the long-term effects of pit lake filling and groundwater stabilization are not known with certainty. Nearly onedozen large mine pits and many smaller ones will eventually become man-made lakes which willcontain an estimated 1.5 to 2 million acre-feet of water. While some of these pit lakes will fillrelatively quickly, i.e., within 5 to 10 years, others will fill over a longer period of time, typically inexcess of 50 years.The major hydrologic and environmental concerns during this long-term stabilization process are:
(1) the effects on local groundwater conditions307 and land subsidence308 during and after pit lakefilling;

DIVISION OF WATER PLANNING Humboldt River Chronology—Part I
Nevada Water Basin Information and Chronology Series I–97
(2) the effects of evaporation309 on both pit lake levels and the surrounding groundwaterconditions;
(3) the quality of water flowing into the pits as well as the overall quality of the water within thepit lakes;310
(4) the effects on local springs and creeks and other surface waters during and after pit lakefilling; and
(5) the long-term effects on the flows in the Humboldt River main stem from resultant changesin groundwater conditions and changes in tributary flows.
Agriculture and Its Importance to the Humboldt River Basin[Notes to the presentation of agricultural-related data and analysis: The time periods used in this section differ fromother sections in Part I as they are based on the agricultural census which occurs generally every five years and isdefined by the U.S. Bureau of Census, Agriculture Division (e.g., 1974, 1978, 1982, 1987, and 1992). Irrigatedacreage, and irrigation and livestock water withdrawal data for 1990 were developed by the U.S. Geological Survey(USGS) from 1992 agricultural census data. Acreage and water withdrawal estimates for 1997 were developed by theNevada Division of Water Planning based on an extrapolation of forecasts as presented in the 1999 Nevada State WaterPlan (April 1999). That publication also provides an extensive review of the methodology used in this estimation andforecast process. Also, agricultural data is presented in two general coverages: (1) totals for the five principal countiesmaking up the Humboldt River Basin (i.e., Elko, Eureka, Lander, Humboldt and Pershing); and (2) data for just thearea contained within the basin itself. Due to reporting limitations, data on farm marketings and employment, inparticular, is presented on a total county basis only and thus includes data for areas under cultivation which are insidea county’s borders but outside the basin’s borders. Water withdrawals and water use are terms used synonymously inthis section; however, they differ from the concept of decreed water rights. Water withdrawals represent the totalamount of water diverted to a field, whereas a water right is the water duty in acre-feet per acre per year times thedecreed acreage.]
Overview
While fur trapping may have been the first business enterprise undertaken by Europeans within theHumboldt River Basin, agriculture has certainly been the basin’s most enduring economic pursuit.Even while the basin’s mining industry has shown several repetitions of boom and bust cycles,agriculture has persevered, servicing the mining industry during its boom periods and finding newmarkets outside the basin during mining’s bust periods. The earliest agricultural-related demandswithin the basin were based on the expansive natural grasslands and lush meadows adjacent to theHumboldt River and its principal tributaries. The period of European emigration, commencing in1841 with the Bartleson–Bidwell emigrant party and continuing essentially through the early 1870’s,created new demands for agricultural commodities, both crops and livestock. The basin’s miningboom, which began in the early 1860’s, placed even greater demands on the basin’s agriculturalindustry and began a period of land clearing and leveling, dam construction, canal building, irrigationdiversions, wetland draining, agricultural cultivation and open-range grazing which have persisted tothe present day.
Table 16 – Humboldt River Basin County† Irrigated Acres‡Humboldt River Basin County Agricultural Data for Selected Years, 1974–1997

Humboldt River Chronology—Part I DIVISION OF WATER PLANNING
I–98 Nevada Water Basin Information and Chronology Series
State / County 1974 1978 1982 1987 1990 1997NEVADA Total Irrigated Acres 777,510 881,151 829,761 766,968 728,350 732,833Elko County Irrigated Acres 234,838 224,624 256,932 235,188 210,150 215,296 Percent of Statewide Total 30.2% 25.5% 31.0% 30.7% 28.9% 29.4% Percent Humboldt Basin Counties 49.2% 43.6% 49.7% 53.1% 46.5% 46.4%Eureka County Irrigated Acres 31,247 49,806 33,372 28,606 44,700 38,230 Percent of Statewide Total 4.0% 5.7% 4.0% 3.7% 6.1% 5.2% Percent Humboldt Basin Counties 6.5% 9.7% 6.5% 6.5% 9.9% 8.2%Humboldt County Irrigated Acres 143,800 151,906 158,718 100,972 134,750 146,332 Percent of Statewide Total 18.5% 17.2% 19.1% 13.2% 18.5% 20.0% Percent Humboldt Basin Counties 30.1% 29.5% 30.7% 22.8% 29.8% 31.5%Lander County Irrigated Acres 31,994 48,474 28,820 35,663 31,200 34,736 Percent of Statewide Total 4.1% 5.5% 3.5% 4.6% 4.3% 4.7% Percent Humboldt Basin Counties 6.7% 9.4% 5.6% 8.0% 6.9% 7.5%Pershing County Irrigated Acres 35,681 40,286 38,837 42,796 31,100 29,389 Percent of Statewide Total 4.6% 4.6% 4.7% 5.6% 4.3% 4.0% Percent Humboldt Basin Counties 7.5% 7.8% 7.5% 9.7% 6.9% 6.3%Humboldt River Basin Counties† Total Irrigated Acres 477,560 515,096 516,679 443,225 451,900 463,984 Percent of Statewide Total 61.4% 58.5% 62.3% 57.8% 62.0% 63.3%
† Counties represent the five principal counties of the Humboldt River Basin. Agricultural irrigated acreage figures are for the totalcounties and include some irrigated acreage lying outside of the basin’s boundaries. The majority of the irrigation in these counties,however, is along the Humboldt River main stem, within Lovelock Valley (Lovelock Reach sub-basin), Paradise Valley (LittleHumboldt River sub-basin), Grass Valley (Sonoma Reach sub-basin), or in the Upper and Lower Reese River Valley (Reese Riversub-basin). All these important agricultural areas lie within the Humboldt River Basin.‡ Variations in irrigated acres are due more to the water available for irrigation than the land available for irrigation.Source Data: Irrigated acreage figures for 1974, 1978, 1982 and 1987 are from the U.S. Bureau of the Census, Agriculture Division;irrigated acreage figures for 1990 are estimates from the U.S. Geological Survey (USGS); irrigated acreage for 1997 are based onestimates and forecasts made by the Nevada Division of Water Planning (NDWP) as extrapolated from information presented inthe 1999 Nevada State Water Plan.
Table 16, Humboldt River Basin County Irrigated Acres, presents information on estimated acreagecurrently and historically irrigated for the five principal counties within the Humboldt River Basin.The apparent wide variations in these figures are not necessarily due to the availability of irrigableacreage, but primarily represent variations in the amount of water actually available for irrigationduring these census years. Water has tended to be the most crucial restraining factor in theagricultural industry over time. From Table 16, it may be seen that the basin’s five principal countiescontained an estimated 464,000 irrigated acres in 1997, accounting for over 63 percent of totalirrigated acreage in the State of Nevada. Elko County alone, with over 215,000 irrigated acres, hadthe most irrigated acreage of any county in Nevada in 1997, accounting for over 29 percent of thestatewide total and over 46 percent of all irrigated acreage among the basin’s five counties.
Agriculture not only played an important role in the Humboldt River Basin’s earliest settlement

DIVISION OF WATER PLANNING Humboldt River Chronology—Part I
Nevada Water Basin Information and Chronology Series I–99
patterns and economic development, but also has important relationships to the hydrology of thebasin. Agriculture is by far the largest user of surface water resources within the Humboldt RiverBasin. Consequently, no overview of the basin would be complete without some discussion of thehydrologic and economic consequences of this industry. In 1997, it was estimated that within the fiveprincipal counties in the Humboldt River Basin approximately 464,000 acres were irrigated usingnearly 2 million acre-feet of water (see Table 18, Agricultural Water Use in the Humboldt River BasinCounties).311 Solely within the Humboldt River Basin, there exists over 332,000 decreed water-righted acres of land which use approximately 817,000 acre-feet of decreed water rights each year(see Table 17, Humboldt River Basin Decreed Water Rights).312 The USGS estimated that in 1990,a drought year in the basin, approximately 234,000 acres were irrigated with nearly 1,000,000 acre-feet of water, 75 percent of which represented surface water supplies.313
Table 17 – Humboldt River Basin Decreed Water Rights†Decreed Acreage and Water Rights by Sub-Basin (Acres and Acre-Feet per Acre per Year)
Humboldt River Decreed Lands (acres) Decreed Water Rights (af)Basin Sub-Basins Crop Land Pasture Land Crop Land Pasture LandMary’s River 9,260 8,940 27,770 7,630Ruby Mountains 78,575 12,080 235,260 11,490North Fork Humboldt River 17,525 750 52,238 735Maggie Creek 1,962 1,875 5,855 1,796Elko Reach 15,000 6,800 45,000 6,700Pine Valley 3,431 486 10,293 501Reese River 19,900 — 21,600 —Battle Mountain 14,790 41,760 46,730 43,510Little Humboldt River 30,361 11,626 109,300 11,848Sonoma Reach 8,940 7,920 26,810 7,430Lovelock Reach 37,086 3,798 137,536 7,297Total Humboldt River Basin 236,830 96,035 718,392 98,937
Total Decreed Lands 332,865 Total Decreed Rights 817,329Total Average Water Duty 2.5 Acre-Feet per Acre per YearCrop Land Average Water Duty 3.0 Acre-Feet per Acre per YearPasture Land Average Water Duty 1.0 Acre-Feet per Acre per Year
† Decreed water rights exist for specific lands for which a water use permit has been issued (vested), or for water rights which havebeen adjudicated by court decree. Water rights in terms of acreage and volumes are for the Humboldt River Basin only and differfrom the total irrigated acreage and agricultural water use presented earlier which presented the total water use for the five principalHumboldt River Basin counties (i.e., Elko, Eureka, Lander, Humboldt and Pershing). Water duties are calculated figures and donot necessarily represent actual decreed values.Source Data: Humboldt River Basin, Nevada, Water and Related Land Resources, Reports Number One through Twelve, NevadaDepartment of Conservation and Natural Resources and the U.S. Department of Agriculture, 1962-1966.
Agricultural activities in the Humboldt River Basin resulted in approximately $144 million in totalfarm marketings in 1997 (see Table 19, Humboldt River Basin County Farm Marketings) and creatednearly 1,800 jobs in farming alone (see Table 20, Humboldt River Basin Agricultural-RelatedEmployment). In addition, due to the “export” nature of much of the region’s agriculturalproduction, the industry results in multiple impacts on the local economy by bringing in new moniesin payment for this agricultural output. While the economic effects of mining (especially since the1980’s) have been far greater than agriculture in terms of production valuation, employment, incomes

Humboldt River Chronology—Part I DIVISION OF WATER PLANNING
I–100 Nevada Water Basin Information and Chronology Series
and spending within the Humboldt River Basin, the nature of the agricultural industry has resultedin an underlying economic stabilizing force which has tended to smooth out, to some degree, theeffects of mining’s more typical boom-bust nature.
Table 17, Humboldt River Basin Decreed Water Rights, presents information on decreed (water-righted) lands for both crop lands and pasture lands and the respective decreed water allowed forthese lands based on specific water duties for each of the eleven sub-basins within the Humboldt RiverBasin. These total figures for irrigated acreage differ from the total county irrigated acreage figurespresented in Table 16, Humboldt River Basin County Irrigated Acres, as the irrigated acreage figuresin Table 17 are solely for decreed water-righted lands and specific water duties for each defined sub-basin and only contained within the Humboldt River Basin.
Water Use Trends and Analysis
Table 18, Agricultural Water Use in the Humboldt River Basin Counties, presents estimates of totalwater withdrawals as well as irrigation and livestock water use for the five principal counties of theHumboldt River Basin. These estimates were based on estimates of irrigated acreage presented inTable 16 and a county-specific water duty, measured in acre-feet per acre per year, which wasestimated from historical county water-use trends.314
Based on the agricultural water use estimation process used, the Humboldt River Basin countiesshowed total water withdrawals (a concept which differs from consumptive use which is the basis ofthe decreed water rights figures shown in Table 17) of nearly 2 million acre-feet in 1997, accountingfor over 61 percent of the total water withdrawn in Nevada for agricultural purposes for that year.As expected, due to its ranking in total irrigated acreage, Elko County withdrew the most water forirrigation and livestock use in 1997, accounting for nearly 29 percent of all such withdrawals in thestate and nearly 47 percent of such withdrawals among the Humboldt River Basin’s five principalcounties.

DIVISION OF WATER PLANNING Humboldt River Chronology—Part I
Nevada Water Basin Information and Chronology Series I–101
Table 18 – Agriculture Water Use in the Humboldt River Basin Counties†Total Agricultural, Irrigation and Livestock Water Use for Selected Years (Acre-Feet per Year)
State and County 1974 1978 1982 1987 1990 1997NEVADA Total Agricultural Water Use 3,390,594 3,842,555 3,618,452 3,344,622 3,176,215 3,193,696 Irrigation Water Use 3,383,716 3,834,761 3,611,112 3,337,837 3,169,772 3,187,137 Livestock Water Use 6,878 7,794 7,340 6,784 6,443 6,559Elko County Total Agricultural Water Use 999,446 955,976 1,093,476 1,000,935 894,376 916,277 Percent of Statewide Total 29.5% 24.9% 30.2% 29.9% 28.2% 28.7% Percent Humboldt River Basin‡ 49.5% 44.0% 50.1% 53.3% 46.9% 46.8% Irrigation Water Use 997,577 954,188 1,091,430 999,063 892,704 914,563 Livestock Water Use 1,869 1,788 2,045 1,872 1,673 1,714Eureka County Total Agricultural Water Use 119,170 189,950 127,274 109,097 170,477 145,801 Percent of Statewide Total 3.5% 4.9% 3.5% 3.3% 5.4% 4.6% Percent Humboldt River Basin 5.9% 8.7% 5.8% 5.8% 8.9% 7.4% Irrigation Water Use 119,020 189,712 127,114 108,961 170,263 145,618 Livestock Water Use 149 238 160 137 214 183Humboldt County Total Agricultural Water Use 605,702 639,845 668,538 425,306 567,582 616,368 Percent of Statewide Total 17.9% 16.7% 18.5% 12.7% 17.9% 19.3% Percent Humboldt River Basin 30.0% 29.4% 30.6% 22.6% 29.8% 31.5% Irrigation Water Use 605,069 639,177 667,840 424,861 566,989 615,724 Livestock Water Use 633 668 698 444 593 644Lander County Total Agricultural Water Use 142,960 216,598 128,778 159,355 139,412 155,215 Percent of Statewide Total 4.2% 5.6% 3.6% 4.8% 4.4% 4.9% Percent Humboldt River Basin 7.1% 10.0% 5.9% 8.5% 7.3% 7.9% Irrigation Water Use 142,663 216,148 128,510 159,023 139,123 154,892 Livestock Water Use 297 450 268 331 290 323Pershing County Total Agricultural Water Use 152,825 172,549 166,343 183,299 133,204 125,876 Percent of Statewide Total 4.5% 4.5% 4.6% 5.5% 4.2% 3.9% Percent Humboldt River Basin 7.6% 7.9% 7.6% 9.8% 7.0% 6.4% Irrigation Water Use 152,489 172,170 165,977 182,897 132,912 125,599 Livestock Water Use 336 379 366 403 293 277Humboldt River Basin Counties Total Agricultural Water Use 2,020,103 2,174,919 2,184,408 1,877,992 1,905,052 1,959,536 Percent of Statewide Total 59.6% 56.6% 60.4% 56.1% 60.0% 61.4% Irrigation Water Use 2,016,818 2,171,395 2,180,872 1,874,805 1,901,990 1,956,397 Livestock Water Use 3,284 3,524 3,536 3,187 3,062 3,140
† Represent the five principal counties of the Humboldt River Basin. Agricultural water use is for the total county and may includesome acreage lying outside of the basin. Most of the irrigation in these counties, however, is along the Humboldt River main stem,within Lovelock Valley (Lovelock Reach sub-basin), Paradise Valley (Little Humboldt River sub-basin), Grass Valley (SonomaReach sub-basin), or in the Upper and Lower Reese River Valley (Reese River sub-basin). All these important agricultural areaslie within the Humboldt River Basin. Water use is equivalent to water withdrawals and is not the same as consumptive use.‡ Percent is for Humboldt River Basin counties’ total and not the basin-only total.Source Data: Water use estimates based on estimates of irrigated acreage by U.S. Census Bureau (1974, 1978, 1982 and 1987),U.S. Geological Survey (1990), and Nevada Division of Water Planning (1997) times a water duty (acre-feet per acre per year)calculated for historical trends. Source data and explanation of methodology may be found in the Nevada Division of WaterPlanning’s 1999 Nevada State Water Plan.
Humboldt River Chronology—Part I DIVISION OF WATER PLANNING
I–102 Nevada Water Basin Information and Chronology Series
Historical Perspective to Agriculture in the Humboldt River Basin
The agricultural potential of the Humboldt River Basin was first exploited during the wagon train erabeginning in 1841 when the lush meadowlands and native grasses along the Humboldt River and itsprincipal tributaries provided much-needed nourishment to the early emigrants’ livestock. However,it was the basin’s mining boom and its accompanying population influx that caused the rapidexpansion of the basin’s agricultural industry after 1860. Agricultural pursuits, and particularlylivestock open-range grazing and intensive rangeland use, flourished in the Humboldt River Basinduring the 1870’s and 1880’s.
Livestock raising in the Reese River sub-basin got its start in 1862 shortly after the start of Austin’smining boom. In this year, Lewis R. Bradley, who became Nevada’s second Governor from1870-1878, moved to the upper Reese River Valley from California with 500 head of Texas longhorncattle. Along with his son and two other partners, Bradley began the first large-scale ranchingoperation in the Humboldt River Basin, eventually stocking the lush meadows of the upper ReeseRiver and the Toiyabe Canyons north and south of Austin with thousands of longhorn cattle.315
Very early on, the Lamoille Valley area at the foot of the Ruby Mountains was recognized for itsexcellent grazing conditions and was first permanently settled in 1865 by John Walker and ThomasWaterman. When heavy grazing by the emigrants’ domestic livestock denuded the natural grassesnear the Humboldt River, emigrant wagon trains used the meadows alongside Lamoille Creek as awelcome resting area, returning to the Humboldt River for their continued trek down river.316 In1866, livestock raising got its start in Mound Valley on Smith and Huntington Creeks (tributaries tothe South Fork of the Humboldt River) when Lewis R. Bradley expanded his longhorn ranch fromthe Reese River Valley. Mr. Bradley continued to expand his operations until his cattle ranged all theway from Smith and Huntington Creeks in the east through Dixie Flats and further west to PineValley (Pine Creek) in the west, eventually becoming one of the state’s largest cattle operations.317
Around 1870, Daniel Murphy took over and stocked with Texas longhorn cattle the area comprisingthe present Devil’s Gate, Haystack and Rancho Grande ranches in the North Fork Humboldt Riversub-basin. Dan Murphy was one of the sons of Martin Murphy, who was a member of the famousStevens-Murphy-Townsend wagon train which had traversed the Humboldt River Basin in 1844 enroute to California.318 Also around this time, the firm of Sparks & Tinnen began cattle operationswithin the Mary’s River sub-basin, eventually growing to arguably the greatest cattle ranchingenterprise to ever operate in Nevada. The firm owned outright some 200,000 acres and throughstrategic land ownership along streams and around springs controlled many times that amount interms of public domain lands (national land reserve), stretching from Humboldt Wells (present-dayWells) in the south to the Snake River in Idaho in the north. John Sparks was perhaps the firstrancher in Nevada to introduce the Shorthorn and Hereford cattle breeds, which soon replaced theTexas longhorns on Nevada’s open ranges.319
By 1872, the Horseshoe Ranch at Beowawe was established by Dr. George W. Grayson of SanFrancisco and Aaron Benson of Beowawe under the famous Horseshoe (branding) iron. Ultimately,Dr. Grayson and his various partners would come to own or control over 200,000 acres of grazinglands in Elko, Eureka and Lander counties and, in addition to the Horseshoe brand, operated under
DIVISION OF WATER PLANNING Humboldt River Chronology—Part I
Nevada Water Basin Information and Chronology Series I–103
26 other brands.320 Also in 1872, Peter N. Marker made his first purchase of land in the lowerLovelock Valley. Eventually, his holdings would grow to 12,800 acres in the lower valley, along withadditional acreage in the upper valley.321 By 1873 cattle ranching began in earnest in HumboldtCounty when Frank Button and his uncle I.V. Button drove cattle into the Winnemucca area to beginranching operations in the rich, fertile valleys of northern and eastern Humboldt County.322
Actual land ownership of many of these early cattle operations represented only a small portion ofthe land extent and rangeland use due to the nature of open-range grazing operations. By controllingthe use of critical sources of water, many ranchers were able to effectively control ranges many timesthe size of their actual land holdings. Between 1862 to 1873, extensive farming, ranching and open-range cattle grazing operations had been established from virtually one end of the Humboldt RiverBasin to the other. Throughout the years, and particularly after the disastrous effects of “The WhiteWinter” of 1889-90, many of these operations have changed ownership a number of times. In theprocess, ranches have been consolidated and livestock composition has changed, with sheep firstreplacing cattle and then cattle eventually replacing the sheep. Even so, the agriculture industry ofthe Humboldt River Basin has largely endured the passage of time and remains today vitally importantto the economic welfare of this vast expanse of north-central Nevada.
The Impacts of Halogeton on Open-Range Grazing
Halogeton (Halogeton glomeratus) is a fleshy, annual, herbaceous and succulent plant that wasinadvertently introduced into the rangelands of the western United States during the early twentiethcentury. The name halogeton was derived from the Greek hals (sea or salty) and geiton (habitat) anddescribes the invasive plant’s ability to survive in high salt conditions characterizing the soil makeupof the Great Basin’s lowland valleys and desert playas. No acceptable common name has been foundfor halogeton, although several common names have been proposed internationally: (1) U.S. –barilla; (2) English – cultivated saltwort; (3) French – haloget, barilla; (4) Spanish – barilla fina; (5)German – zahmes salzkraut; (6) Turkish – kalyofu; and (7) Arabic – guraynah.323 The Russiancommon name for halogeton might be translated as “congested halogeton”.324 Beginning with itsinitial discovery in the Intermountain Area and the Humboldt River Basin near Wells, Nevada in 1934,and for at least the next 30 years, halogeton remained an important issue to open-range grazingthroughout the West. Its toxicity to cattle and particularly sheep, both of which abounded on theopen ranges of the Humboldt River Basin in the early 1900’s, combined with the graphic publicitygiven to wholesale livestock die-offs of primarily sheep, were crucially important in bringing to thepublic’s attention the degraded state of western rangelands, a condition which fostered the halogetoninvasion.
Initially, halogeton was listed merely as an exotic nuisance weed which showed rather alarming ratesof spread. The first report of halogeton’s toxicity within Nevada came in the fall of 1942. ElkoCounty sheep herder Nick Goicoa lost 160 sheep from a band that was grazing on the open rangenear Wells. A postmortem examination found considerable quantities of halogeton in the stomachsof the dead animals. Adding to the confusion of the toxicity issue was that sheep did not consistentlyprefer dry halogeton and often refused to eat it altogether. It was later determined that sheep thatwere not regularly salted during the winter months showed a preference for halogeton’s leaves, whichstored salt absorbed from the soil.325 Further, the plant’s toxicity tended to vary throughout the year,

Humboldt River Chronology—Part I DIVISION OF WATER PLANNING
I–104 Nevada Water Basin Information and Chronology Series
confusing the issue and initially delaying a more dramatic and urgent response to the potential harmfuleffects of halogeton.
The most significant event leading to the national recognition of halogeton’s potential devastation toopen-range sheep grazing on western rangelands occurred in Idaho. In November 1945, John Wardof Almo, Idaho, moved a band of 1,300 sheep to winter range in the Raft River bottoms near Bridge.The area was known to be infested with halogeton, but previous losses, from then unknown causes,had amounted to only a few head at a time. On this particular occasion, however, 1,000 sheep diedfrom ingesting halogeton in just one day and the remainder died shortly thereafter. This staggeringloss, coupled with subsequent widespread publicity of this incident and other similar livestockdeaths,326 was the catalyst that stirred public concern and prompted government agencies to begin tostudy and address the problem.327 Ultimately, it was found that the most effective response to thehalogeton problem proved to be biological suppression versus chemical, mechanical and biologicalcontrol, which involve the use of herbicides and other costly rangeland restoration methods.Biological suppression consists of efforts to return the ecological balance to existing plantcommunities by establishing perennial species which naturally and effectively compete for moistureand nutrients required by such invasive annual weeds and toxic plants.328
Halogeton originated in the salt steppes of south Russia from the Ural and Aral-Caspian region upto the Kirgiz and Songarian Area and is also found in the deserts of Tibet. It is distributed from thenorth shore of the Caspian Sea east through the upper Irtysh River system, in the deserts and thefoothills of the mountains eastward from the Caspian Sea to the Pamifs, and into Sinkiang andMongolia.329 Initial research and response to halogeton in the U.S. was greatly hampered due to thelack of English-language literature and the absence of documented references, in any language,alluding to halogeton’s toxicity. From its sudden appearance in the Intermountain Area in the early1930’s, the plant’s spread was nothing less than remarkable with an estimated area of infestation ofover six million acres by 1954 and over 11 million acres by 1957. The spread of halogeton duringthe 1940’s and 1950’s was so spectacular, in fact, that it could not be definitively determined if theplant was actually spreading or whether it was merely being recognized at new locations for the firsttime.330
Considerable speculation continues to exist over halogeton’s introduction into the Great Basin fromAsia. Most theories on the plant’s transport have concentrated on contaminated crested wheatgrassseed introductions,331 halogeton seeds lodged in wool imported from this region, or seeds on the woolof Karakul sheep which were introduced into the Great Basin. The first specimens of halogetonfound in North America were collected in June 1934 by Ben Stahmann and S.S. Hutchings, who wereworking for the Intermountain Forest and Range Experiment Station, U.S. Forest Service,Department of Agriculture (USDA) headquartered in Ogden, Utah. Stahmann’s field notes indicatedthat the new plant, which actually would not be identified until 1936 when the specimens were sentto Washington, D.C., was abundant at the collection site near Wells, located in Elko County in theupper Humboldt River Basin, a location which is very near the geographic center of the IntermountainArea. Wells was a hub of sheep trails connecting summer and winter ranges in the region. Duringthe 1890’s and early 1900’s, the open ranges of the Humboldt River Basin were subjected towidespread and intensive grazing by both cattle and sheep. These activities were essentially withoutany form of grazing management and resulted in severe competition and over use of the basin’s winter

DIVISION OF WATER PLANNING Humboldt River Chronology—Part I
Nevada Water Basin Information and Chronology Series I–105
Figure 19 – Halogeton
(lowland) ranges, in particular. By the early 1930’s, based on the effects of one-half century ofintensive livestock grazing, these rangelands showed little resemblance to the sagebrush-bunchgrassvegetative cover which first greeted domestic livestock in the early 1870’s and provided a fertileenvironment for the spread of exotic plants.
Figure 19 shows a drawing of halogeton in which sub-figure A shows a winged seed with bracts, Bshows the entire halogeton plant, C depicts a leaf detailing the curved bristlelike hair on the leave tip,and D presents a leaf cluster.332 Halogeton’s adaptability to the growing conditions of the GreatBasin, its phenomenal rate of spread, and its potentially lethal levels of toxicity are largely based onits tolerance to high concentrations of salts in the soil and the fact that many of the lower portionsof the Great Basin represent salt-deserts left by the dessication of Pleistocene Epoch lakes, marshesand wetlands. Halogeton is a member of the goosefoot family,Chenopodiaceae (Chenopods), which are often adapted tosoils that are saline, alkaline, or both.333 Halogeton has leavesthat resemble little grey-green sausages with a spine or bristlyhair at the tip (Figure 19).
Halogeton plants vary greatly in size with mature plantsattaining a height of nearly two feet and becoming coveredentirely with flowers and then seeds. In dense stands,however, the plant rises only an inch or two off the ground,but still produces viable seeds in abundance. The nature of theplant’s seeds are especially adapted to its survival and stymiedearly efforts at eradication. Two types of seeds are producedin prodigious quantities, black (actually a dark chocolatebrown) and brown. At first it was believed that the brownseeds were merely non-viable (i.e., immature) black seeds.Later studies, however, clearly showed that the black seedstended to germinate quickly while the brown seeds wereviable, but remained dormant for a number of years. In thisway the plant would still germinate after eradication efforts had ceased.334
Halogeton does most of its growing in midsummer when competition from other annuals, such as theexotic cheatgrass (Bromus tectorum), and native perennial grasses, is minimal. As a succulent,halogeton often uses the moisture from summer storms and has an ability to rapidly absorb soilmoisture and store it for growth and seed production. Sodium, in the form of soluble sodium chloride(NaCl), in the soil is actually an essential element in the plant’s mineral nutrition, as are highconcentrations of chlorine. The sodium in halogeton’s leaves is used primarily to form salts of oxalicacid,335 and where the soil is high in sodium chloride, halogeton tends to be exceptionally vigorousand high in soluble oxalates. It is the soluble oxalates stored in halogeton’s herbage that tend to bemost toxic to grazing herbivores.
Halogeton’s oxalate content has been found to be as high as 25 percent, with most livestock lossesoccurring when the oxalate content was 18 percent or greater. It was also found that the oxalatecontent of halogeton varies according to the plant’s growth stage and certain climatic conditions, and

Humboldt River Chronology—Part I DIVISION OF WATER PLANNING
I–106 Nevada Water Basin Information and Chronology Series
that at least two-thirds of the oxalate content could leach out of the plant in a single snowstorm,thereby making the plant less dangerous, and sometimes entirely harmless, to grazing livestock.Consequently, most sheep losses have reportedly occurred in the fall and early spring, or duringrelatively dry winters when the plant tends to retain the oxalates in lethal concentrations. Losses arealso heightened when sheep eat halogeton in large doses shortly after it is softened by a storm.336
Research has also shown that sheep appear to relish the plant the first time they eat it and were it notfor its variable and unpredictable toxicity, it would make an adequate forage plant with crude proteinlevels comparable to alfalfa.337
Halogeton’s poisonous effects on gazing livestock are especially severe on sheep due to their less-roaming grazing nature. In fact, although halogeton was found to be even more toxic to cattle, dueto their free-roaming grazing behavior, they seldom ingest lethal doses of the plant.338 Some haveargued that the effects of halogeton spelled the demise of the open-range sheep industry in thewestern U.S. In truth, this industry was already in demise and halogeton only hastened thateventuality, albeit somewhat more dramatically than otherwise. However, the effects of halogetonspread far beyond the sheep industry and focused the attention of livestock producers, landmanagement agencies, range scientists and political groups on the larger problem of rangelanddegradation. In effect, an entirely new body of science arose from this period which greatly expandedour knowledge of re-vegetation technology, basic plant and animal physiology, and on establishingthe ecological basis for range weed control.339
By the 1980s’s it had become apparent that halogeton was on the decline in the Great Basin. Oneprimary reason for this remission was the virtual disappearance of the open-range sheep industry inthe western portion of the Great Basin and particularly in the Humboldt River Basin. Another reasonlies with the improved range management conditions which have positively affected the state of theregion’s salt-desert winter ranges. Another important contributing factor in halogeton’s significantreduction throughout the Great Basin has been, ironically, the spread of cheatgrass to the verymargins of the region’s salt deserts. The competition provided by this even more vigorous invasiveplant species has provided a strong biological restraint for halogeton on many open ranges.340
Tall Whitetop
Tall whitetop (Lepidium latifolium L.), a member of the mustard or Brassicaceae family and anoxious weed in Nevada, has become a severe ecological problem in many of Nevada’s water sheds,including the Humboldt River Basin. No benefits have yet been found for this extremely competitiveplant, and it has a number of particularly bad points. Specifically, the plant crowds out desirablenative plant species, impairs scenic values and decreases biodiversity, degrades wildlife habitat,destabilizes river banks and increases erosion potential, lowers the quality of feed from the pasturesand hay fields it infests, and threatens Nevada’s agricultural industry with the potential for extensiveeconomic losses. The potential ecological, environmental and economic damages from this invasiveplant have been found to be so severe that in 1999 the Nevada State Legislature tasked the Universityof Nevada, Reno, Cooperative Extension, to mount a statewide attack on tall whitetop.341
Tall whitetop is native to southeastern Europe and southwestern Asia, and is believed to have beenintroduced into the western United States around 1900 in contaminated sugar beet seed. The first

DIVISION OF WATER PLANNING Humboldt River Chronology—Part I
Nevada Water Basin Information and Chronology Series I–107
official sighting of tall whitetop in Nevada occurred as far back as the 1960’s in Washoe Countyalong Streamboat Creek, a tributary of the Truckee River originating in Washoe Valley. By the early1970’s, it was first referenced in research papers as having reached the Truckee River and by 1992it had reportedly infested some 12,000 acres along the Truckee River’s lower reaches. Since thattime it has been found in the Carson, Walker and Humboldt River basins, several locations in Ely(White Pine County), and has extended as far south as Pahrump in Nye County. In 1999, a singlesiting was reported in Las Vegas (Clark County).342
The plant commonly grows to a height of two to four feet, but may reach up to eight feet inparticularly wet areas. The plant forms tall whitetop monocultures that quickly dominate fields andriparian areas. The plant forms a semi-woody base stem with new growth emerging from the plant’swoody crown. It also forms a course root structure with root diameters typically varying from one-quarter inch up to several inches. The weed expands prolifically from these creeping undergroundroots, which may grow from three feet to over ten feet long, sending up shoots along the way to formnew plants. New plants can also sprout from fragments of perennial roots as small as one-tenth ofan inch in diameter.
Small white flower clusters, with six to eight blossoms, bloom during June and July. Tall whitetop’sflowers are so attractive that they are extensively used in fresh and dried flower arrangements, whichinadvertently sometimes adds to the plant’s spread. In addition to tall whitetop’s spreadingunderground runners, the plant is especially prolific and capable of producing more than six billionseeds per acre.343 Streambank erosion, flooding and irrigation field flooding help to disperse its seedsand broken root fragments both downstream and onto agricultural fields. Its potential for thecontamination of Nevada’s hay and alfalfa croplands is particularly serious and threatens theindustry’s export potential. Tall whitetop is sometimes confused with the noxious weed “hoary cress”or “whitetop” (Carderia draba L.), which is usually much shorter than tall whitetop and blooms inMay.
Typically, tall whitetop initially infests sites along streams, rivers and wetlands. It then quicklyspreads to native hay meadows, abandoned agricultural lands, pastures, hayfields, as well asresidential areas and disturbed areas such as roadsides. The seeds are readily dispersed by a numberof human-related activities such as vehicle traffic, road maintenance, site preparation, construction,agricultural activities and off-road recreational pursuits. Livestock and waterfowl have also beenknown to aid to the dispersal of tall whitetop seeds.
Due to its competitive nature in crowding out native species and its rapidly spreading roots and seedproduction, its complete eradication would not only be extremely expensive, but also unlikely.Consequently, present goals are oriented towards controlling its spread by using integrated weedmanagement practices, which encompass a number of cultural, mechanical, biological and chemicalcoordinated weed control techniques. In terms of biological controls, thus far no insects or diseaseshave been found to kill or debilitate the plant. Also in this regard, caution must be exercised such thatany biological controls used do not infest any of the 11 perennial Lepidium species in the mustardfamily which are native to the western United States.344
Interestingly, some effective suppression of tall whitetop has resulted from carefully managed

Humboldt River Chronology—Part I DIVISION OF WATER PLANNING
I–108 Nevada Water Basin Information and Chronology Series
intensive and continuous grazing by sheep or goats. In irrigated pastures, cattle will tend to avoidtall whitetop altogether even during drought periods when preferred forage plants are depleted.There is also some concern, now being tested more extensively, that tall whitetop may be toxic tograzing livestock. Current research is focusing on the use of herbicides for controlling tall whitetop.To be effective in the long-term, however, it is also recognized that successful management of theplant’s spread must be combined with establishing competitive vegetation immediately aftertreatment. Beneficial plants which have proven to be highly competitive in this regard include tallwheatgrass (Elytrigia elongata), creeping wildrye (Elymus triticolides), and saltgrass (Distichlisspicata).
Tall whitetop was believed to have been introduced into the Humboldt River Basin in the 1960’s, andpossibly earlier, in either the Elko or Lovelock areas and was probably was brought into the regionthrough contaminated forage or carried by livestock. Today, over 10,000 acres are estimated to havebeen infested within the Humboldt River system by this invasive weed with the most severeinfestations occurring in Lovelock Valley along the Humboldt River and along irrigation canals andditches. The Humboldt Sink area is also heavily infested with several thousand acres. Tall whitetop’sspread currently extends from just east of Elko all the way to the Humboldt Sink and is estimated tobe expanding at the rate of approximately 20 percent per year.345
Lovelock Valley and the Rye Patch Reservoir
The agricultural industry in Lovelock Valley, which is located in the lower Humboldt River Basin,is crucially dependent on water stored in Rye Patch Reservoir. Rye Patch Reservoir represents theonly storage facility situated directly on the Humboldt River main stem and its importance toagricultural development in the lower basin was recognized very early. Considered in its entirety, theHumboldt River system represents a fairly “efficient” irrigation water conveyance and distributionmechanism in terms of water diversions and return flows. The irrigation water return flows and“reuse” concept has allowed for greater diversions from the river and its principal tributaries foragricultural purposes than could ever be supported based on existing instream flows.
But this river system has its limits. Agricultural water users along the Humboldt River benefit froma continuous process of water diversion, on-filed application, tailwater runoff, return flow and systemreuse. Even so, the fact that the agricultural lands in the Lovelock Valley are situated some 250 to300 miles from the Humboldt River’s headwaters in the Ruby, Jarbidge and Independence mountains,has greatly strained the river’s ability to deliver sufficient water to lower basin users, particularlyduring below-normal flow years.
Limitations to the capabilities of the Humboldt River water conveyance system became especiallypronounced throughout the late 1800’s as upstream diverters, relying on riparian water rights,increasingly limited water from ever reaching the lower basin. It was, in fact, this increased upstreamconsumptive use for agriculture purposes that intensified the conflicts over Humboldt River waterrights issues, particularly between agricultural interests in Elko County and those in the lower basinin Lovelock Valley. The severe drought period of 1888-89 further exacerbated the situation.Immediately following that drought period, however, hydrologic conditions changed dramatically,and it was, in fact, the extreme “White Winter” of 1889-90 that severely increased the competition

DIVISION OF WATER PLANNING Humboldt River Chronology—Part I
Nevada Water Basin Information and Chronology Series I–109
for the river’s waters. The primarily effect of that event was to intensify upstream agriculture pursuitsas ranchers began even greater diversions in order to grow more supplemental winter forage for theiropen-range grazing operations. The Humboldt River system adjudication process which ensued isdetailed in a previous section to Part I (“Humboldt River Water Rights, Adjudication, and RelatedCourt Decrees”).
Before the rights to the Humboldt River’s waters were legally adjudicated, it was generallyrecognized that a storage system was desperately needed to serve the lower basin agricultureinterests, especially during low stream-flow conditions. In one early reference to this need for waterstorage which, in fact, prophesized the eventual construction of Rye Patch Reservoir, the TuscaroraTimes-Review reported on February 27, 1900 that “The ranchers in the vicinity of Lovelocks[Lovelock] have spent over $100,000 in [water-related] litigation and this has not settled the waterquestion and has not added a drop to the present supply. This sum spent in storage reservoirs wouldhave settled the water question in short order, but possibly the ranchers didn’t think of so simple ascheme as that.”346
The location ultimately chosen for Rye Patch Reservoir was a site of some historical interest. OnJune 29, 1846, Jesse and Lindsay Applegate headed south from Willamette Valley, Oregon, seekinga less hazardous route to that region from the east. On July 21, coming by way of the Black RockDesert into the Humboldt River Basin, they came to a large meadow (Lassen Meadows, but alsoreferred to as Rye Patch Meadows) along the Humboldt River at a place called the “Great Bend”,347
located approximately forty miles downstream from present-day Winnemucca and just to the westof present-day Imlay. Thus they established the beginning of the Applegate Trail (also referred to asthe Applegate-Lassen Cutoff at its juncture with the Humboldt River) at a point which wouldeventually be covered by the upper portion of what is now Rye Patch Reservoir.348
In 1891 national attention was brought to the rather unique water needs of arid and semi-arid westernlands. In that year, Annual National Irrigation Congresses began to be held in major western citiesin recognition that irrigation projects represented the salvation for the settlement of water-starvedlands in the West. These meetings typically ended with a petition to the federal government toprovide assistance in this reclamation effort, in a manner similar to the various Homestead Acts. Itwas strongly suggested that it was the federal government’s obligation to provide water to these aridlands so that they could be settled and farmed on the same advantageous basis.349 In the HumboldtRiver Basin, these efforts would eventually come to fruition with the construction of Rye Patch Damand Reservoir in 1935 as part of the U.S. Bureau of Reclamation’s “Humboldt Project”.
But before that ultimate federal government solution to the lower Humboldt River Basin’s waterneeds, local interests first attempted a solution. In 1910, Lovelock Valley (Big Meadows) agricultureinterests began the area’s first major water storage project in the form of the twin Pitt-TaylorReservoirs, located approximately 35 miles upstream of Lovelock. These storage reservoirs had aninitial total storage capacity of 48,000 acre-feet350 and were situated just to the east of the present-daysite of Rye Patch Reservoir. A diversion structure and canal leading to the reservoirs was constructedbeginning about two miles upstream from Mill City. The principal movers behind the project wereWilliam C. Pitt, a prominent upper Lovelock Valley rancher, and John G. Taylor, an upper valleyfarmer and for many years Nevada’s largest sheep rancher. The enterprise was conducted under the

Humboldt River Chronology—Part I DIVISION OF WATER PLANNING
I–110 Nevada Water Basin Information and Chronology Series
corporate name of the Humboldt-Lovelock Irrigation, Light and Power Company, with L.H. Taylorserving as the irrigation engineer in charge of construction, which was completed in 1913.351 In orderto fill the Pitt-Taylor Reservoirs then being constructed, in 1911 the company filed an application for57,000 acre-feet of floodwater from the Humboldt River352 as by 1900 virtually all of the basin’savailable surface waters had been appropriated.353
Even with the Pitt-Taylor Reservoirs, however, periodic drought years showed that a moresustainable water supply was still needed. In 1919, the Humboldt Project was designed. TheHumboldt Project would include the construction of Rye Patch Dam and Reservoir on the HumboldtRiver near Rye Patch, Nevada, the acquisition and transfer of old upstream water rights near BattleMountain, Nevada, and the use of these stored waters on approximately 30,000 acres of patented landnear Lovelock.
In anticipation of the Humboldt Project, the U.S. Reclamation Service (renamed the U.S. Bureau ofReclamation in 1923) began preliminary investigations of reservoir sites along the lower reaches ofthe Humboldt River and conducted a study of the river’s available runoff for such a storage facility.The finalization of these investigations in 1933 resulted in the selection of the Rye Patch Dam site,located approximately 22 miles upriver from Lovelock. Survey results indicated that a reservoir witha capacity of nearly 200,000 acre-feet could be constructed at this site.354
In the meantime, based on the drought years of the early 1920’s, in 1926 the Lovelock IrrigationDistrict was formed for the purpose of constructing a dam at Oreana, located almost 15 miles up theHumboldt River from Lovelock. After spending some $100,000 for engineering and legal services,the proposed structure was not built after it was determined that it could not provide sufficientstorage capacity to warrant its construction. In 1929, the Lovelock Irrigation District changed itsname to the Pershing County Water Conservation District and it was this organization that promotedthe construction of the Rye Patch Reservoir. Construction on the reservoir eventually began in 1935by the U.S. Bureau of Reclamation and was completed in 1936.355
Prior to construction of Rye Patch Reservoir, in 1931 water rights in the Lovelock Valley wereadjudicated by the George A. Bartlett Decree and subsequent permits from the State Engineer’soffice. In general, the decreed rights provided for a flow of 0.81 cubic foot per second per 100 acresof decreed land, or at proportional rates for specific periods of time. Under this decree, and permitsfrom the State Engineer, 33,300 acres of land within the Pershing County Water ConservationDistrict were given water rights totaling 87,896 acre-feet per year. Subsequently, 867 acre-feet ofwater were transferred from 1,664 acres of land purchased for the Rye Patch Reservoir site.
To further augment the Humboldt Project’s water supply for Rye Patch Reservoir, seven ranchestotaling 32,182 acres (with water rights totaling 48,773 acre feet)356 were purchased in the BattleMountain area and stream channel improvements were made in that vicinity to facilitate water rightstransfers to Rye Patch Reservoir and the Humboldt Project in Lovelock Valley.357 Except for arelatively small amount of water which was used on limited acreage near Battle Mountain, wherephysical conditions rendered its transfer difficult, all this water was eventually transferred downstreamto the Humboldt Project.358

DIVISION OF WATER PLANNING Humboldt River Chronology—Part I
Nevada Water Basin Information and Chronology Series I–111
On October 1, 1934, the Pershing County Water Conservation District entered into a contract withthe U.S. Bureau of Reclamation (USBR) to repay the costs associated with the Humboldt Projectover a term of 40 years without interest. Later, the repayment terms were modified to be 36 equalannual installments commencing in 1944. Ultimately, these construction costs assigned to theconservation district for repayment totaled $1,341,739.359
On January 31, 1935, construction began on Rye Patch Dam. The project was designed to provideseasonal and long-term regulation of the lower Humboldt River and to increase the amount of wateravailable to downstream farmers and irrigators. Rye Patch Dam was completed and began storingwater on June 1, 1936. It is an earthfilled structure with a height of 78 feet, a water level of 73 feet(raised by 3 feet in 1976) and a crest length of 1,074 feet. The outlet works can release water at arate of up to1,000 cubic feet per second and the spillway can discharge at up to 20,000 cubic feet persecond.360
The reservoir is approximately 20 miles long, has a surface area of 11,970 acres and has an officialcapacity, based on an enlargement in 1976, of 194,300 acre-feet, at its design surface water elevationof 4,136.38 feet above mean sea level (MSL). Irrigation water from Rye Patch Reservoir isdistributed in Lovelock Valley through the six diversion structures there, with waters allocated onan acreage basis to all conservation district participants.361 On January 15, 1941, operation andmaintenance responsibilities for the Humboldt Project, including the operation of Rye Patch Dam andReservoir, were transferred from the USBR to the Pershing County Water Conservation District.362
In an early test of the efficacy of this project, a wet-mantle flood event visited the Humboldt RiverBasin during the period of April 3 through May 1, 1942, producing the greatest flooding within theHumboldt River Basin since 1910. This was the first major flood in the basin with Rye PatchReservoir in place. The reservoir proved generally effective at keeping flood waters from LovelockValley. It was also the first time that Rye Patch Reservoir, along with the Pitt-Taylor reservoirs,completely filled. However, the spillage from Rye Patch Reservoir was heavy enough to cause partialfailure of the Young Dam (the farthest upstream in Lovelock Valley), which in turn was believed tohave caused the destruction of the Rogers Dam as well.363
In 1945 the Pershing County Water Conservation District purchased the 1911 water rights obtainedby the Humboldt-Lovelock Light & Power Company, consisting of 57,000 acre-feet of HumboldtRiver floodwaters for the Pitt-Taylor Reservoirs. Presently, the district uses the current safe storagecapacity of this reservoir system of 36,600 acre-feet (increased in 1971 from 35,000 acre-feet) inconjunction with the waters stored in Rye Patch Reservoir.364 The Pershing County WaterConservation District continues to play an active role in maintaining the structural integrity of thiscritical source of water supply for Lovelock Valley.365
Not all the impacts of Rye Patch Reservoir have been considered positive, however. In 1987, theNevada State Museum published a comprehensive study of the archeology, geology and paleontologyof the Rye Patch Reservoir site in Pershing County. It was noted that the construction of Pitt-TaylorReservoirs in 1910 and Rye Patch Reservoir in 1935 flooded many archeological and paleontologicalsites. The study found that wave action has also destroyed some of these sites and has exposedburied deposits in other sites along the reservoir’s shoreline. The study reported finding a total of

Humboldt River Chronology—Part I DIVISION OF WATER PLANNING
I–112 Nevada Water Basin Information and Chronology Series
115 sites, including 30 in the reservoir bottom and 85 around the shoreline. These sites have yieldedevidence of human occupation during the past 7,000 to 12,000 years, with continuous occupationbeginning sometime after 6,900 B.P. (before present).366
Current Agricultural Trends – Farm Marketings
Table 19, Humboldt River Basin County Farm Marketings,367 presents information for selected yearson the value of farm marketings, i.e., the economic effects, of using the Humboldt River Basin’sirrigable lands and available irrigation water. Total farm marketings, or the value of all agriculturalproducts sold, were just over $144 million in 1997 for the Humboldt River Basin’s principal countiesof Elko, Eureka, Humboldt Lander and Pershing. This level of farm output comprised 43 percent oftotal farm marketings for the State of Nevada. Disaggregating total farm marketings into cropmarketings and livestock marketings shows that the Humboldt River Basin counties’ crop marketingstotaled over $56 million in 1997, accounting for nearly 41 percent of Nevada’s total crop marketings,while livestock marketings among the Humboldt River Basin counties were over $87 million, ornearly 45 percent of statewide total livestock marketings in 1997.
The Humboldt River Basin’s five counties also accounted for 63.3 percent of statewide total irrigatedacreage and 61.4 percent of total agricultural water withdrawals in 1997 (see Tables 16 and 18,respectively). From these relative share ratios of agricultural outputs (farm marketings) and resourceinputs (irrigation and livestock water withdrawals), we can provide a means to assess agriculture’srelative “efficiency” among regions (basins) and counties. This is done by calculating the ratiobetween the basin’s or county’s share of statewide total farm marketings and its share of statewidetotal irrigation and livestock water withdrawals.368
Obviously, the higher the ratio of farm marketing share to total water withdrawal share, the greaterthe efficiency to which that water is put. Using this simple ratio technique provides an “agriculturalwater efficiency factor” (rating) of 70.0 (percent) for the entire Humboldt River Basin, based on a43 percent share of statewide total farm marketings and a 61.4 percent share of statewide totalagricultural water withdrawals.

DIVISION OF WATER PLANNING Humboldt River Chronology—Part I
Nevada Water Basin Information and Chronology Series I–113
Table 19 – Humboldt River Basin County† Farm Marketings‡Humboldt River Basin County Agricultural Data for Selected Years, 1974–1997(Farm, Crop and Livestock Marketings in Thousands of Dollars)
State/Humboldt River Basin County 1974 1978 1982 1987 1990 1997NEVADA Farm Marketings ($000s) $145,458 $204,047 $250,610 $271,904 $326,889 $334,926 Crop Marketings 29,479 49,227 69,237 68,130 115,403 138,698 Livestock Marketings 115,979 154,820 181,373 203,774 211,486 196,228Elko County Farm Marketings ($000s) $24,438 $32,730 $40,456 $45,362 $53,071 $43,272 Crop Marketings 688 345 1,526 1,398 2,135 1,958 Livestock Marketings 23,750 32,385 38,930 43,964 50,936 41,314Eureka County Farm Marketings ($000s) $3,753 $7,210 $9,514 $8,996 $11,398 $12,222 Crop Marketings 752 1,813 3,575 3,914 7,346 7,873 Livestock Marketings 3,001 5,397 5,939 5,082 4,052 4,349Humboldt County Farm Marketings ($000s) $17,723 $35,389 $37,910 $38,371 $55,579 $52,740 Crop Marketings 11,293 12,726 22,879 18,756 37,132 36,037 Livestock Marketings 6,430 22,663 15,031 19,615 18,447 16,703Lander County Farm Marketings ($000s) $4,518 $6,170 $6,113 $8,257 $9,563 $6,621 Crop Marketings 524 863 992 1,464 3,096 3,695 Livestock Marketings 3,994 5,307 5,121 6,793 6,467 2,926Pershing County Farm Marketings ($000s) $14,975 $25,706 $29,124 $19,303 $27,874 $29,157 Crop Marketings 5,284 6,955 10,568 10,804 11,113 6,919 Livestock Marketings 9,691 18,751 18,556 8,498 16,761 22,238Humboldt River Basin Counties† Farm Marketings ($000s) $65,407 $107,205 $123,117 $120,289 $157,485 $144,012 Percent Statewide Total 45.0% 52.5% 49.1% 44.2% 48.2% 43.0% Crop Marketings $18,541 $32,639 $39,540 $36,337 $60,822 $56,482 Percent Statewide Total 62.9% 66.3% 57.1% 53.3% 52.7% 40.7% Livestock Marketings $46,866 $74,566 $83,577 $83,952 $96,663 $87,530 Percent Statewide Total 40.4% 48.2% 46.1% 41.2% 45.7% 44.6%
† Agricultural statistics are for Humboldt River Basin’s principal counties and include county totals and are not necessarily limitedonly to those county areas within the basin.‡ Farm Marketings consist of the current dollar value of all farm-related produce, both crops and livestock, which constitute amarket transaction. It therefore excludes certain production used for on-farm use (e.g., seed production and domestic livestockforage) that does not constitute am “external” market transaction.Source Data: U.S. Department of Commerce, Bureau of Economic Analysis (BEA), Regional Economic Information Service (REIS).
In 1997, Elko County accounted for 30.0 percent of the Humboldt River Basin counties’ total farmmarketings, but 46.8 percent of the basin counties’ estimated total agricultural water withdrawals,for an agricultural water efficiency factor of 64.1 (i.e., 30.0 percent divided by 46.8 percent times100). Eureka County accounted for 8.5 percent of the basin’s total farm marketings in 1997 whileusing 7.4 percent of the basin’s total agricultural water withdrawals, resulting in an efficiency factorof 114.9. Humboldt County accounted for 36.6 percent of the basin’s total farm marketings and 31.5percent of total agricultural water withdrawals in 1997, yielding an efficiency factor of 116.2. Lander

Humboldt River Chronology—Part I DIVISION OF WATER PLANNING
I–114 Nevada Water Basin Information and Chronology Series
County accounted for 4.6 percent of the basin’s total farm marketings in 1997 and 7.9 percent of totalagricultural water withdrawals, for an efficiency rating of 58.2. And finally, Pershing Countyaccounted for 20.2 percent of the basin counties’ total farm marketings in 1997 while using anestimated 6.4 percent of the total agricultural water withdrawals of the basin’s counties, resulting inthe highest efficiency factor of any county within the basin at 315.6. Based on these water-useefficiency measures, it may be suggested that the higher water use efficiency factors evident in thelower Humboldt River Basin are, in large part, due to the benefits provided by Rye Patch Reservoir’sirrigation water delivery system. This system has insured a more or less stable supply of water forirrigation purposes in the Lovelock Valley area of Pershing County.
Current Agricultural Trends – Farm Employment
Table 20, Humboldt River Basin County Agricultural-Related Employment, presents information onemployment trends within the Humboldt River Basin’s principal counties in the areas of farming andrelated activities (i.e., agricultural service workers in the fields of landscaping, forestry and fisheries).Of primary importance are the trends in farm employment which, over more recent years, have beengenerally declining for all five counties in the Humboldt River Basin. This follows a similar statewidetrend which shows that Nevada’s total farm employment peaked in 1978 at 5,639 workers anddeclined thereafter to a 1997 level of 4,732 workers engaged in farming activities statewide. Thisrepresented a statewide decline between 1978 and 1997 of 907 farm jobs, or 16.1 percent
Within the Humboldt River Basin counties, basin-wide total farm employment also peaked in 1978at 2,274 workers, declining to 1,755 workers by 1997. This represented a reduction of 519 farmingjobs, or 22.8 percent, among the five basin counties between 1978 and 1997. In 1974, the basin’sfive counties comprised 42.4 percent of the state’s total number of farm workers. This figuredeclined to 37.1 percent of the statewide total number of farm jobs by 1997. By county, between1978 and 1997, jobs in farming declined in each county by the following percentages:
Elko County: -13.4%Eureka County: -44.8%Humboldt County: -23.9%Lander County: -19.6%Pershing County: -34.4%

DIVISION OF WATER PLANNING Humboldt River Chronology—Part I
Nevada Water Basin Information and Chronology Series I–115
Table 20– Humboldt River Basin County† Agricultural-Related EmploymentHumboldt River Basin County Agricultural Data for Selected Years, 1974–1997State/Humboldt River Basin County 1974 1978 1982 1987 1990 1997NEVADA Total Agricultural-Related Employment 5,895 7,728 7,863 10,033 11,487 16,460 Farm Workers 4,570 5,639 5,140 5,628 5,260 4,732 Agricultural Services Workers‡ 1,325 2,089 2,723 4,405 6,227 11,728Elko County Total Agricultural-Related Employment 859 1,005 922 1,186 1,085 1,038 Farm Workers 828 940 858 1,053 949 814 Agricultural Services Workers 31 65 64 133 136 224Eureka County Total Agricultural-Related Employment 134 223 171 157 142 165 Farm Workers 134 223 171 157 118 123 Agricultural Services Workers 0 0 0 0 24 42Humboldt County Total Agricultural-Related Employment 593 691 660 744 711 715 Farm Workers 566 619 537 591 539 471 Agricultural Services Workers 27 72 123 153 172 244Lander County Total Agricultural Related Employment 165 179 129 145 139 141 Farm Workers 165 163 129 145 139 131 Agricultural Services Workers 0 16 0 0 0 10Pershing County Total Agricultural Related Employment 243 329 258 230 257 238 Farm Workers 243 329 217 230 230 216 Agricultural Services Workers 0 0 41 0 27 22Humboldt River Basin Counties† Total Agricultural Employment 1,994 2,427 2,140 2,462 2,334 2,297 Percent Statewide Total 33.8% 31.4% 27.2% 24.5% 20.3% 14.0% Farm Workers 1,936 2,274 1,912 2,176 1,975 1,755 Percent Statewide Total 42.4% 40.3% 37.2% 38.7% 37.6% 37.1% Agricultural Services Workers 58 153 228 286 359 542 Percent Statewide Total 4.4% 7.3% 8.4% 6.5% 5.8% 4.6%
† Agricultural statistics are for Humboldt River Basin’s principal counties and include county totals and are not necessarily limitedonly to those county areas within the basin.‡ Agricultural Services Workers include workers in areas such as gardening and landscaping, as well as workers in the forestry andfishery service areas.Source Data: U.S. Department of Commerce, Bureau of Economic Analysis (BEA), Regional Economic Information Service (REIS).
Table 21, Humboldt River Basin County Agriculture Productivity, presents a comparison of the totaldollar value of agricultural output per farm worker (as a gross measure of agricultural workerproductivity) between all of Nevada (a statewide average) and the combined five principal countiescomprising the Humboldt River Basin. This productivity measure is based on the total cash receiptsfrom farm marketings divided by the respective number of farm workers. This analysis shows thatover the selected years presented in Table 21, the productivity of farm workers in the Humboldt RiverBasin has exceeded the comparable statewide average farm worker productivity figures by nearly 21percent, ranging from a low of 6.1 percent higher (index value of 106.1) in 1974 to 32.1 percenthigher (index value of 132.1) in 1982.

Humboldt River Chronology—Part I DIVISION OF WATER PLANNING
I–116 Nevada Water Basin Information and Chronology Series
Over the entire period of 1969 through 1997, this productivity figure for the Humboldt River Basincounties have averaged 22 percent. In 1997, agriculture’s productivity among the Humboldt RiverBasin’s principal counties was nearly 16 percent higher than the statewide average, $82,058 in farmoutput per worker in the Humboldt River Basin versus $70,779 per farm worker for all of Nevada.
Table 21 – Humboldt River Basin County† Agriculture Productivity‡Humboldt River Basin County Agricultural Worker Productivity, Selected Years, 1974–1997(Total Farm Marketings in Thousands of Dollars; Output per Worker in Dollars)State/Humboldt River Basin 1974 1978 1982 1987 1990 1997NEVADA Total Farm Marketings (000s) $145,458 $204,047 $250,610 $271,904 $326,889 $334,926 Farm Employment 4,570 5,639 5,140 5,628 5,260 4,732 Farm Marketings per Worker (dollars) $31,829 $36,185 $48,757 $48,313 $62,146 $70,779Humboldt Basin Counties (Elko, Eureka, Humboldt, Lander and Pershing)‡ Total Farm Marketings (000s) $65,407 $107,205 $123,117 $120,289 $157,485 $144,012 Farm Employment 1,936 2,274 1,912 2,176 1,975 1,755 Farm Marketings per Worker (dollars) $33,785 $47,144 $64,392 $55,280 $78,782 $82,058 As Percent Statewide Average (=100)* 106.1 130.3 132.1 114.4 126.8 115.9
† Counties represent total figures for the five principal counties of the Humboldt River Basin.‡ Agriculture “productivity” measures the dollar value of the cash receipts from farm marketings divided by the number of farmworkers, in essence, producing a current dollar measure of output produced per worker.* Numbers are based on a base index value of the statewide average index value equals 100. Figures higher than this base measurethe percent that a value exceeds the base; therefore, a value of 106.1 indicates that a value is 6.1 percent above the base value.Source Data: U.S. Department of Commerce, Bureau of Economic Analysis (BEA), Regional Economic Information Service (REIS).
Livestock Grazing, Cheatgrass, Rangeland Wildfires, and Flooding
Overview
The ecosystem369 of the Great Basin has varied considerably during the last 20,000 years. Year-roundglaciers once covered mountain valleys which now only receive winter snow, while expansive lakesand marshes of the late Pleistocene Epoch370 covered many of today’s sagebrush-covered lowlandvalleys and playas. The vegetation communities of this period of time contained modern Great Basinplant species, but were comprised of many more species no longer found growing together today.Many of the animal species, particularly the large herbivores, began to decline during this time andeventually became either extinct or were extirpated by approximately 10,000 to 11,000 years ago.371
By the late Pleistocene Epoch, the mastodon, mammoth, ground sloth, horse, camel, llama,diminutive pronghorn, mountain goat, shrub ox and musk ox had all disappeared from the GreatBasin.372 Climate variation was a primary cause for these changes and as climatic conditionscontinued to change over time so too did the region’s plant and animal communities.373
About 10,000 years ago, during the early Holocene Epoch, a drying trend began throughout the GreatBasin, although the climate then was still both cooler and wetter than it is today. Glaciers melted andmany of the large lakes became shallow wetlands or playas. This change to a dryer climate effectivelyshaped Nevada’s landscape and by about 4,500 years ago the vegetation and animal communities ofthe region began to look much as they do today. The sagebrush-grassland vegetation types which

DIVISION OF WATER PLANNING Humboldt River Chronology—Part I
Nevada Water Basin Information and Chronology Series I–117
characterized much of the Great Basin of northern and central Nevada before European settlementhad become less varied and therefore more susceptible to disturbance374. The general lack of moistureover much of this region and the accumulation of salts in the soil created a vegetative cover whichlacked the resilience to cope with new concentrations of large herbivores and other human-induceddisturbances to the land which typically accompanied early settlement and man’s activities.
The arrival of European settlers initiated a more intensive use of the Great Basin’s natural resources.This was especially true when mining activities accelerated throughout the Humboldt River Basinduring the 1860’s and 1870’s. As a result, this delicate natural balance of climate, soil, plants andanimals, which had persevered for at least the last 4,500 years, was suddenly shattered. Theintroduction of large herds of cattle and sheep on delicate and finely-balanced plant communities didnot produce the adaptations necessary for the survival of many of the region’s native species. As aconsequence, invasive, more adaptive and less desirable plant species, such as cheatgrass (Bromustectorum), were able to take hold when native plants proved less resilient375 to the pressures thatincreased grazing and other settlement-related disturbances placed upon them.
The effects from man’s arrival within the Humboldt River Basin, which occupies a large portion ofthe northern part of the Great Basin, were most pronounced in several areas, for example: (1) thechanging nature of this region’s grass-forb376 understory377 and sagebrush overstory378; (2) theacceleration of erosion and the increased effects of downstream flooding along over-grazed streamsystems; and (3) the increased suppression of natural fires by man, eventually leading to the increasedincidence, severity and return frequency of wildfires across vast expanses of the basin’s openrangelands.
Trends in Nevada’s Rangeland Wildfires
Nevada’s 1999 fire season379 represented by far the worst incidence of wildfires in the state’s recordedhistory, and also produced the most extensive fire devastation ever recorded within the HumboldtRiver Basin. Throughout Nevada, primarily in its rural areas, approximately 1.6 million total acreswere burned, equivalent to over two percent of Nevada’s total surface area, representing twice theburned acreage caused by the previous “worst” fire. The previous worst fire season was in 1985when approximately 885,000 total acres were burned throughout Nevada. The most devastating andfar-reaching burns occurred during a relatively brief period in early August. The five countiesincluded within the Humboldt River Basin absorbed the brunt of the fires’s devastating effects.Specifically, Elko, Eureka, Lander, Humboldt and Pershing counties taken together accounted fornearly 1.39 million burned acres, or nearly 87 percent of the state’s total burned acreage recordedduring the 1999 fire season.
During the 1999 fire season, rangeland fires in Elko County destroyed approximately 331,803 acres(20.8 percent of the state’s total burned acreage and 3.0 percent of Elko County’s total land area).Another 213,142 acres (13.4 percent of the state’s total burned area and 8.0 percent of the county’stotal land area) were burned in Eureka County; 264,167 acres (16.5 percent of the state’s total burnedarea and 4.2 percent of the county’s total land area) were burned in Humboldt County; 219,351 acres(13.7 percent of the state’s total burned area and 6.1 percent of the county’s total land area) wereburned in Lander County; and 364,118 acres (22.8 percent of the state’s total burned area and 9.6

Humboldt River Chronology—Part I DIVISION OF WATER PLANNING
I–118 Nevada Water Basin Information and Chronology Series
percent of the county’s total land area) were burned in Pershing County. The majority of the 1999fire damage, or about 1.22 million acres and about 76 percent of the state’s total burned area, weredue to 25 major fires that were wholly or partially located within the Humboldt River Basin. Thesefires are listed in Table 22, Humboldt River Basin’s 1999 Burned Acreage, and are broken out by thename of the fire, burned area, U.S. Bureau of Land Management (BLM) burned portion, theproportion within the Humboldt River Basin and county areas affected. Of this burned acreageaffecting the Humboldt River Basin, nearly 905,000 acres, or nearly 75 percent of the basin’s total,included lands which were managed by the BLM. Most of the other burned areas within the basin,comprising 22.5 percent of the basin’s total area burned, were privately owned.380
While the 1999 fire season might be considered just an isolated event in terms of its extent andseverity, this fire season more probably reflected a long-term intensification of potential rangelanddestruction from fires which appear to be increasing in both severity and frequency. Admittedly, therewere a number of somewhat unusual contributing factors in 1999 which, together, produced apotentially explosive situation unlike any in recent times. The five years preceding 1999 wereparticularly wet. This wetter than normal period, believed to be the result of the “El Niño”381
phenomenon, produced optimal conditions for plant growth, particularly cheatgrass. The on-set ofthe “La Niña”382 in 1999 at first produced near-drought conditions in southern Nevada and cooler andmore moist conditions in northern Nevada.
By early summer, the prevailing La Niña conditions resulted in unusually high and persistent windsacross much of northern Nevada, along with above normal temperatures and lower than normal fuelmoisture. By late May and early June, the potential for wildfires had become extreme and was basedon a combination of factors including high winds and temperatures, low relative humidity and fuelmoisture, severe thunderstorm activity, and a high level of dead and dry fuels with low flash pointscarried over from prior good growing seasons. From a fuel-loading standpoint, fine flashy fuels,composed primarily of cheatgrass matted from prior years’ growth, provided a situation where evenfire retardant chemical drops from aircraft proved largely ineffective due to the fire’s ability to burnunder and through the matted fuels. In combination, these conditions resulted in severe conditionsand sometimes “joining” fires with extreme and virtually uncontrollable rates of spread.383
Despite the relatively unique combination of conditions leading up to Nevada’s worst recorded fireseason, certain other factors have supported the potential for even greater conflagrations to come.In support of this assertion, forestry and rangeland experts have noted that prior to the arrival of thefirst settlers to the Great Basin, wildfires occurred at return intervals of approximately 32-70 years.384
More recently, however, that fire frequency has been shortened to as little as 4-5 years.385 Thissituation has tended to confirm a growing suspicion that human activities, both direct and indirect,may be major contributing causes of this alarming trend. Since initial settlement began in theHumboldt River Basin, significant changes have occurred in terms of the use of land, timber,vegetation and water resources.
Early economic pursuits such as fur trapping were essentially “non-invasive” activities, meaning thatresource use and extraction did not significantly alter environmental conditions or significantly affectthe region’s long-term ecological balance. However, later economic endeavors within the HumboldtRiver Basin, particularly mining, ranching and open-range grazing activities, have had profound

DIVISION OF WATER PLANNING Humboldt River Chronology—Part I
Nevada Water Basin Information and Chronology Series I–119
effects on the basin’s river flows and diversions, grazing practices, vegetative composition andcoverage, soil stability, destruction of natural firebreaks, and runoff characteristics.
Table 22 – Humboldt River Basin’s 1999 Burned AcreageMajor (Named) Fires and Acreage Within or Contiguous to the Basin (Listed by Fire Size)
BLM Fire NameTotal BurnedArea (acres)
BLM BurnedArea (acres)
BLMAffectedPortion
(percent)
Fire PortionLocated within
Humboldt RiverBasin
Counties Affectedand Acreage
1 Poker Brown 244,049 163,889 67.2% Mostly Pershing2 Sadler 199,204 166,535 83.6% Mostly Elko (167,156);
Eureka (32,048)3 Antelope 133,925 132,615 99.0% Some Churchill (598);
Lander (133,327)4 Slumbering Hills 103,640 73,590 71.0% Little Humboldt5 Trail 74,137 69,378 93.6% Slight Eureka (49,570);
Lander (24,567)6 Clover 72,045 56,357 78.2% Total Elko (61,938);
Humboldt (7,707)7 Frenchie 54,679 26,898 49.2% Total Eureka8 Rose 2 48,478 23,502 48.5% Total Eureka9 Cosgrave 35,074 11,301 32.2% Total Pershing
10 Lone Butte 34,382 16,518 48.0% Total Humboldt11 Chimney 32,774 31,063 94.8% Mostly Elko (27,533);
Humboldt (5,240)12 Izzenhood 28,592 16,207 56.7% Total Elko (15);
Humboldt (14,768);Lander (13,810)
13 Unionville 23,599 13,602 57.6% Partial Pershing14 Rain 21,731 17,021 78.3% Total Elko15 Mule 18,003 13,072 72.6% Total Lander16 Horse 17,867 17,201 96.3% Mostly Eureka17 Rochester 13,321 9,616 72.2% Partial Pershing18 Grass Valley One 12,443 11,243 90.4% Total Pershing19 Blue Mountain 11,520 5,937 51.5% Some Humboldt20 Cyanco 10,616 5,169 48.7% Total Humboldt21 Cedar B 9,283 9,283 100.0% Mostly Lander22 Piney 7,877 7,877 100.0% Total Eureka23 Cedar A 3,466 3,459 99.8% Mostly Lander24 Hunter 2,495 1,300 52.1% Total Elko25 Grass Valley Two 2,231 2,205 98.8% Some Pershing
TOTALS 1,215,430 904,837 74.4%
Source Data: U.S. Bureau of Land Management (BLM), Nevada District Office, September 1999.
Early mining activities within the Humboldt River Basin prompted rapid population growth andintensified the need to produce agricultural food products for both livestock and people. In responseto these requirements, much of the basin’s upland wooded hillsides were denuded of usable timberfor the mines, railroads, building construction and as a source of fuel. As early as 1862 the increasedmining activity throughout much of the basin had caused many of the steep, thin-soiled slopes of

Humboldt River Chronology—Part I DIVISION OF WATER PLANNING
I–120 Nevada Water Basin Information and Chronology Series
upper basin watersheds to become exposed to sheet and gully erosion. The virtual explosion ofmining and the rapid growth of numerous mining towns created a demand for building lumber thatcould only be satisfied by local stands of limber pine from high-altitude drainage areas. As a result,much of these high watershed soils were exposed, and while good second-growth stands have sincecome in at many of these locations, considerable topsoil losses have occurred due to effects oferosion. The denudation of the hillsides also encouraged the establishment of well-developed gullysystems in these upper watersheds which reduced these areas’ natural ability to hold moisture andmitigate and prolong the flows downstream onto the meadowlands below.386
Adding to the effects of erosion on changing the Humboldt River Basin’s native landscape, earlyagricultural activities diverted natural flows out of established stream channels for irrigation purposesand to support large cattle operations. By the late 1800’s, the effects on natural vegetation from theregion’s extensive open-range cattle grazing operations were exacerbated by extensive and far-ranging sheep herding. The resultant overuse of timber, shrub and natural perennial grasses, both inthe basin’s lowland meadows and upland watersheds, began an irreversible process of soil and channelerosion, elimination of natural meadows and native grasses, and the influx of invasive plant species387
(e.g., cheatgrass) which was to accelerate changes to the region’s ecology. This process not onlydramatically changed the basin’s vegetative state, but also made the land even more susceptible tofuture impacts from both floods and wildfires.
The Cheatgrass “Invasion”
Since the beginning of the European settlement of the western United States, approximately twentyspecies of Bromus, i.e., cheatgrass, have been introduced. Of these invasive grass species only two,cheatgrass (Bromus tectorum) and red brome (Bromus madritensis ssp. rubens, formerly Bromusrubens), have come to dominate large portions of western state rangelands. Within the Great Basin,and particularly within the Humboldt River Basin, cheatgrass has had the most profound impacts onrangelands and agricultural yields, while red brome has proliferated in lower elevation desert plantcommunities further to the south, particularly in parts of California, the Mojave Desert and southernNevada.
Throughout this wide range, the extent of these cheatgrass species is primarily defined by altitude andlatitude. Red brome tends to thrive best in the lower altitudes, typically below 4,000 feet MSL, hencelimiting its range mostly to the southern portion of the Great Basin. Cheatgrass grows best atelevations up to about 6,000 feet MSL, which makes it ideally suited to much of the rangeland withinthe Humboldt River Basin. Cheatgrass was first recognized in the western United States in 1861 andits process of invasion (i.e., the state of attaining a “critical mass” of established plant communities)throughout this area was considered essentially “complete” by 1928.388
Cheatgrass, also known as downy chess, downy brome, junegrass, broncograss, and sometimes“railroad” grass, is now abundant as an understory plant throughout the Great Basin sagebrush zoneand particularly within the Humboldt River Basin. It is especially well suited to dry disturbed soils,typically following man’s activities and frequently turning entire landscapes purplish-brown for a fewweeks in the spring and then straw-brown for the rest of the year. While the spread of cheatgrass isoften associated with disturbances by man, it has also spread and come to dominate plant

DIVISION OF WATER PLANNING Humboldt River Chronology—Part I
Nevada Water Basin Information and Chronology Series I–121
communities without human disturbance. With respect to cheatgrass invasion, human activitiestypically affect the “when” and not the “if”.389 Cheatgrass is less common in alkaline soils and atelevations above approximately 6,000 feet MSL.390 Nonetheless, its range, tenacity and adaptabilityto a variety of growing conditions are impressive and cheatgrass infestations have occurred from thesalt desert shrub community through the big sagebrush (Artemisia tridentata) zone and into theponderosa pine (Pinus ponderosa) and Douglas-fir (Pseudotsuga menziesii) zones.391
Cheatgrass is an annual grass species which was originally introduced from Eurasia, being native tothe Mediterranean region eastward to the steppes of Russia, Kazakhstan, Mongolia and China.Unfortunately, it arrived in North America without natural diseases or predators to help keep it incheck.392 It has also been suggested that cheatgrass seeds arrived in contaminated seed grainshipments, which would help to better explain its rapid spread.393 Cheatgrass tends to spread quickly,particularly after fire burns the native plants and grasses, as its seeds appear to be less affected by heatand also show remarkable post-burn recuperative abilities. Cheatgrass also tends to mature morequickly than other competing grass species, thereby robbing the soil of moisture, nitrogen and othernutrients necessary for later-developing native grasses.
As a forage plant, it can only be grazed upon for several weeks in early spring while it is still green,and once mature its seeds make the entire plant generally unusable by grazing animals. Cheatgrasstends to quickly crowd out other grasses which do not demonstrate similar characteristics of firerecovery, early germination and rapid growth. This “choking” effect will eventually turn diverselandscapes into cheatgrass monocultures which are highly vulnerable to the repetition of wildfires.394
Studies on the effects of fire on native and invasive grasses have shown that repeated burning everyfive years, or burns in the early summer, will tend to deplete perennial grasses and allow annualgrasses, primarily cheatgrass, to increase its coverage dramatically. Once a sagebrush-grasscommunity is depleted of its perennial grass cover, as in a wildfire, a secondary succession395 beginswhich eventually results in the dominance of cheatgrass within five years.396 Also, early summer burnsare only a temporary setback for cheatgrass at a time of the year when climax397 perennials are easilykilled by fire. Consequently, under most burning conditions, the density of cheatgrass increases overtime while fewer perennials survive after each fire.398
Further studies have also shown that burning followed by seeding will suppress some invasive species,but even this has not proven especially successful where cheatgrass is dominant. If a succession ofperennials is desired after a fire, the cheatgrass infested areas must be chemically treated or plowedand then seeded, and fire alone, either wild or controlled, will not convert pure stands of cheatgrassto native perennial grasses.399
Cheatgrass also possesses other key attributes that tend to preclude or hinder the establishment ofdesirable grass species. Most important of these is that cheatgrass seeds are able to germinate undera wide range of temperatures, including conditions where day-time and night-time regimes fluctuatebetween 1EC to 15EC (34EF to 60EF). Seedlings that are able to establish themselves at such lowtemperatures have the distinct advantage in being able to utilize the typically more abundant soilmoisture during warm periods in the winter and early spring months.

Humboldt River Chronology—Part I DIVISION OF WATER PLANNING
I–122 Nevada Water Basin Information and Chronology Series
Furthermore, cheatgrass seedlings and young plants tend to grow extremely rapidly, typicallyproducing roots up to 43 centimeters (17 inches) in length in only six weeks. In this regard, the rootsof cheatgrass have been found to develop up to 50 percent faster than the root systems of mostperennial grasses, such as bluebunch wheatgrass.400 As a result, seedlings of only a very few grassspecies401 have shown the ability to effectively compete with cheatgrass, particularly under thesemiarid conditions prevalent in the Humboldt River Basin.402
In addition to its advantages in terms of early germination, rapid growth and disturbance (includingfire) recuperative properties, the ability of cheatgrass to “carry” fire, both in terms of ignition andtransference, has been frequently noted and all too often observed. The dead stems and plant litterof cheatgrass persist for a year or two and serve to carry fire across bare areas and between shrubsand trees. The accumulated fuel created by this annual grass species provides highly flammable tinderthat results in more frequent fires, leading to the eventual replacement of sagebrush and nativeperennial grasses with pure stands of cheatgrass.
This fire-succession cycle increases the density of cheatgrass while significantly expanding its areaof coverage, carrying the threat of greater and more frequent fires along with it.403 The conversionof open rangelands from a sagebrush-bunchgrass vegetative state, which typically does not carry firewell, to the highly flammable “matted” cheatgrass vegetative state, has had obvious effects onincreasing the frequency, severity and return intervals of wildfires across Nevada’s rangelands.
The long-term effects of cheatgrass on native plant populations are not entirely understood; however,the results do tend to speak for themselves. A number of adaptations tend to make the species aparticular threat to Nevada’s rangelands. First, the root system of cheatgrass is fibrous and morespreading nearer the soil surface compared to the deeper and more vertical root systems of nativeperennial bunchgrasses found in the Great Basin. While this gives the native grasses an enhancedability to weather the effects of drought, it also provides better growing conditions for cheatgrassduring wetter to more “normal” water years.
The fact that precipitation conditions (i.e., snowpack water content) have been near “normal” in theHumboldt River Basin over the last five years of 1995-1999 (see Table 23, Northern Nevada WaterBasin Snowpack Water Content) has greatly supported the more recent spread of this highly invasivegrass species. The more rapid germination and maturation of cheatgrass makes it particularly welladapted to incidences of land disturbance, such as fire, rangeland grazing, erosion, land clearing andsurface soil removal, use of off-road vehicles and recreational use of public lands.404 In effect, manhas perhaps been cheatgrass’s greatest benefactor.
Historical Perspective of Open-Range Grazing
It was shortly after the initial surge in mining activity beginning in the early 1860’s that the range andgrazing potential of the Humboldt River Basin became widely recognized. Livestock grazing andintensive rangeland use became more pronounced in the Humboldt River Basin during the 1870’s and1880’s. Between 1862 and 1873, extensive ranching and open-range cattle grazing operations hadbeen established from virtually one end of the Humboldt River Basin to the other. The resultant

DIVISION OF WATER PLANNING Humboldt River Chronology—Part I
Nevada Water Basin Information and Chronology Series I–123
adverse effects on the basin’s perennial native grasses and upper watershed meadows and vegetationthroughout the basin have proven to be significant.
By the late 1880’s the Humboldt River Basin was visited by back-to-back severe and extreme(opposite) hydrologic events which were destined to dramatically reshape the basin’s water use andvegetation conditions. In response to two years of severe drought in 1888 and 1889, the HumboldtRiver Basin’s water resources became even more intensively diverted for irrigating livestock pastureand crop lands. Immediately thereafter, the Humboldt River Basin was subjected to the devastatingeffects of the “White Winter” of 1889-90. Livestock losses of up to 98 percent were reported bysome cattle operators and many ranchers were forced into bankruptcy, resulting in fewer butconsiderably larger ranching operations requiring even more grazing lands. The incredibly severewinter of 1889-90 particularly affected open-range cattle grazing throughout the Humboldt RiverBasin and forced ranchers to supplement their grazing operations with greater irrigation diversionsfor growing winter feed supplies.405 Exacerbating the grazing effects on the basin’s natural vegetationwas the introduction of sheep to the area. After the disastrous cattle losses from the “White Winter”,large herds of sheep began to move into many of the Humboldt River sub-basins, intensifying the useof open grasslands and upper watershed meadowlands.
As one typical example of the extensive use of the basin’s rangelands, after the winter of 1889-90 andcontinuing essentially until the passage of the Taylor Grazing Act in 1934, the lower and middlereaches of the Humboldt River Basin, particularly around Winnemucca, were reportedly visited by“countless thousands” of migrant sheep. These herds passed through Grass Valley (located just southof Winnemucca) on their route to and from their summer ranges in the Sonoma, Santa Rosa, EastRange, Humboldt Range, and other higher elevation pastures. According to newspaper articles atthe time, this continual procession of grazing sheep led to the trampling out or overuse of the onceverdant native ryegrass meadows in Grass Valley, to the point where only a few scattered meadowsremained. Also, the high summer ranges in the nearby mountains, particularly the Sonoma and SantaRosa ranges, were grazed extensively by transient sheep operators. Many of the disastrous floodsand the resultant erosion damage now clearly evident in the high mountain areas of the HumboldtRiver Basin has been attributed to this intensive past range and watershed grazing use.406
It was around 1900 that the exotic407 cheatgrass began to replace the depleted climax perennial grass-forb understory throughout the Humboldt River Basin and take over large areas of the sagebrushoverstory which had been thinned or eliminated by range fires or repeated grazing. In addition to itseffects on erosion and wildfires, the invasion of this annual grass species would also have pervasiveeffects on the types of native animal species which could now be supported within the basin. As oneexample, sharp-tail and sage grouse, which relied on the natural grasses and sagebrush, havesubsequently been largely replaced in many areas by the chukar partridge, which tends to thrive oncheatgrass.408 Despite the growing threat of this exotic and practically worthless grass species, therangeland abuses which fostered its relatively rapid replacement of much of the Humboldt RiverBasin’s native grasses were actually intensifying.
By 1906 several large sheep outfits had bought, leased or homesteaded enough key acreage aroundsprings or along streams to control the summer high mountain ranges in the areas formerly used bymany cattle ranchers. The large numbers of sheep and cattle using many meadow grazing areas
Humboldt River Chronology—Part I DIVISION OF WATER PLANNING
I–124 Nevada Water Basin Information and Chronology Series
throughout the Humboldt River Basin eventually reduced them from a natural well-vegetated rangecovered with desirable perennial native grasses to relatively denuded state showing the effects ofsheet and gully erosion.409 The resultant effects on the basin’s upland meadows were similar and ledto increased erosion in the upper watersheds and the gullying and dessication (drying out) of oncelush meadows. It also created ideal conditions for an opportunistic, adaptive and far less desirableinvasive plant species like cheatgrass to thrive and spread. While livestock grazing in the HumboldtRiver Basin has continued to the present day, it is presently taking place on a reduced scale and, inconcert with cooperative rangeland improvements, leading to improved rangeland conditions.
Historic and recent impacts from fire and past grazing and mining activities have resulted in significantacreage within the Humboldt River Basin that has been dominated with exotic weeds and introducedannual grasses. In addition, significant sagebrush types have been lost within the basin. Even so, theBureau of Land Management’s (BLM) yearly Rangeland Inventory Reports indicate that steady,gradual progress is being made toward improving the condition of the basin’s rangelands. Themajority of the rangelands are in fair to good condition with a little over two million acres being inexcellent condition. Because of the slow pace of plant succession in the arid West, the long-termtrend is a more meaningful measure of range management success. The BLM’s State of the PublicRangelands, 1990, confirms a favorable trend over the past 50 years. At the time of that report, thetrend showed stable to improving conditions on over 87 percent of the public rangeland in theWest.410 The extensive rangeland wildfires of August 1999, however, may have indicated that thenatural rate of recovery as indicated here may not be quick enough.
Rangeland Grazing, Cheatgrass, Fires and Flooding
The federal government’s initial efforts to protect the valuable watershed source areas from thegrowing threats of extensive grazing operations began in 1906 within the North Fork Humboldt Riversub-basin. In this year the Independence Forest Reserve was established making possible theinitiation of a grazing management program aimed at preventing further deterioration and degradationof the high water-yielding lands in the Independence Mountain Range.411 Throughout the late 1800’sand early 1900’s, thousands of nomadic and unregulated bands of sheep grazed the upland areas ofthe Toiyabe and Shoshone Mountain ranges in the middle and upper Reese River sub-basin. Someof the destructive overuse of these upland watershed areas was curbed with the establishment inMarch 1907 of the 600,000-acre Toiyabe Forest Reserve, which later became part of the ToiyabeNational Forest.412 Following this, in 1908, the Independence Forest Reserve and the RubyMountains Forest Reserve (Ruby Mountains sub-basin) were consolidated into a new unit called theHumboldt National Forest.
Then in 1909 the Bruneau was added to the Humboldt National Forest, which covers the upperMary’s River sub-basin, in order to protect and administer land use in the vital watersheds of theJarbidge Mountains.413 In April 1911, in response to local opposition to sheep herds migrating fromthe Independence and Bruneau areas after they were established as national forests, President Taftcreated the Santa Rosa National Forest in the upland watershed of the Little Humboldt River.414 InJune 1912, the Ruby Division of the Humboldt National Forest was withdrawn, additional lands northof Overland (Hastings) Pass were added to these lands, and the new division was renamed the RubyNational Forest.415 Then in June 1917, both the Ruby and Santa Rosa National Forests were

DIVISION OF WATER PLANNING Humboldt River Chronology—Part I
Nevada Water Basin Information and Chronology Series I–125
combined within the present-day Humboldt National Forest.416 Managed grazing programs for theremaining federal lands within the Humboldt River Basin, particularly the lower elevation meadowsand open ranges where the cheatgrass invasion was most prevalent, did not occur until 1935 whenthe new Grazing Service (now the U.S. Bureau of Land Management) was established within the U.S.Department of the Interior.417
The effects of extensive open-range grazing throughout the Humboldt River Basin during the firsthalf of the 1900’s has tended to have two different, but nonetheless compounding effects on periodicnatural disasters occurring within the basin. On the one hand, in the basin’s lower elevations (4,000-6,000 feet) grazing by both domestic livestock and herds of wild horses has thinned native perennialgrasses and supported the invasion of the annual cheatgrass, along with the potential for recurringfires and further cheatgrass succession on newly burned lands. On the other hand, within the basin’supper watersheds, the loss of native grasses, water-holding soils, and formerly lush meadowlandshave had detrimental effects on the basin’s flood potential. The loss of these areas’ ability to hold soilmoisture and attenuate and/or prolong runoff has increased the occurrence of “flash” flows alongmany Humboldt River stream systems, worsened channel erosion, and increased the effects ofdownstream flooding during both spring runoff and severe storm events. Although not fullydocumented, the more sudden flash flow nature of a number of the basin’s stream systems may alsotend to shorten effective irrigation periods along these stream systems. Furthermore, the heavygrazing of riparian areas,418 combined with the down cutting of stream channels, has resulted inalterations to plant communities and moisture conditions along stream courses. As a result, naturalfire breaks have been either narrowed or eliminated altogether from the landscape.
Extensive and severe flooding throughout the Humboldt River system during the February-April 1910time period represented the basin’s worst recorded flood event up to that time. It also arguablyprovided the first and most telling indication of how changes in upland watersheds, meadowlands andriparian vegetation conditions were destined to impact future runoff and flood events throughoutmuch of the basin. The suddenness of the runoff from this event and the resultant severity of thedownstream flooding in comparison to other storm and flood events tended to support the theory thatthe destruction of upper basin vegetative cover and the soil’s diminished water holding capacity wereimportant contributing factors to this flood’s destructive effects. It is now generally believed thatmuch of the susceptibility to erosion along many stream systems within the Humboldt River Basinbegan at this time.419 Like the cheatgrass invasion and its impact on open-range wildfires, thecondition of pervasive erosion within the Humboldt River Basin represents another virtuallyirreversible effect from repetitive livestock grazing on fragile ecosystems which have clearly provento be unable to adapt to the pressures that human activities have placed upon them.The Great Basin: A Fire-Related Assessment
The Bureau of Land Management’s State of the Public Rangelands, 1990, which tended to indicatestable to improving rangeland conditions on a vast majority of the public rangeland in the West,420
may have been overly optimistic when it came to the actual conditions within the Great Basin. Theextensive rangeland wildfires of the 1999 fire season, which raged throughout northern Nevada andthe Humboldt River Basin, supported a more austere picture of the vegetative state of the GreatBasin. In fact, in April 2000 the BLM published a report entitled “The Great Basin: Healing theLand.” This report was based on the effects of 1999’s lightening-produced wildfires which had

Humboldt River Chronology—Part I DIVISION OF WATER PLANNING
I–126 Nevada Water Basin Information and Chronology Series
burned more than 1.7 million acres throughout the Great Basin, with a majority of the damageoccurring in early August 1999.
The first sentence of that report perhaps best described the situation: “The Great Basin is in trouble.”This overall assessment was of little surprise to researchers, ranchers, and resource conservationistswho had been closely watching the long-term trends in the region’s vegetative condition. The reportnoted that “Exotic annual grasses and noxious weeds are crowding out native vegetation. Theinvading species dry out quickly and are highly flammable. They carry wildland fire with devastatingeffectiveness. They are opportunistic, thriving in disturbed areas, particularly where fires burned.The cycle, once started, is difficult to break: fire follows annual grasses, and annual grasses followfire.”421
The BLM’s April report was, in fact, based on an earlier November 1999 report “Out of Ashes, AnOpportunity.”422 This preliminary assessment was published by a group of specialists who met in lateAugust 1999 in Boise, Idaho, to discuss the Great Basin’s recent wildland fires and what theirconsequences might be. Some of this group’s conclusions were: (1) the Great Basin’s ecologicalresiliency is failing as annual grasses and noxious weeds dominate the landscape; (2) traditional meansof fighting invasive species and restoring native habitat are not enough to stop the downward spiral;(3) traditional, post-fire rehabilitation, which mostly addresses soil stability, is not sufficient to resolvethe ecological problems associated with wildland fires. A restoration effort, unlike any otherattempted on western rangelands, must begin; (4) such a restoration would be expensive, but the costof doing nothing ultimately will be much higher, as non-native, invasive species dominate more land;(5) close cooperation with key individuals, local governments and agencies, and organizations isessential to successful restoration.
From this earlier report and other findings, the BLM formed their own conclusions which were thenpublished in April 2000. The BLM assessment found that: (1) the Great Basin’s ecological healthand resiliency are in jeopardy. Exotic annual grasses and noxious weeds now dominate roughly one-third of the land in the Great Basin and are spreading at an alarming rate; (2) the wildland fires of1999, which burned 1.7 million acres in the Great Basin, called attention to rangeland health issuesand accelerated the need for restoration work. If the wildland fires heightened awareness of theserious situation in the Great Basin, then it could be argued they left the faintest of silver linings atthe black edges of the burned land; (3) a restoration effort, on a scale never seen before in thiscountry, needs to be undertaken to stop the downward ecological trends in the Great Basin. Theopportunity to do so is brief; (4) restoration funding remains a huge question mark. No permanentaccount exists for restoration, which means funding may be allocated on an annual, piecemeal basis.That approach restricts the long-term planning and research critical to successful restoration; (5)pending sufficient funding, BLM can accommodate the structure needed to manage restoration withfew changes in its current organization; (6) the consequences of relying on traditional rehabilitationmethods to address the Great Basin’s problems are severe in terms of cost, natural resource damage,effects on local economies, wildland fire intensity and occurrence, and public safety; (7) restorationof the Great Basin ecosystem is a monumental challenge, perhaps the single most demanding land-management task faced by BLM. Successful restoration will require the commitment of not onlyBLM, but also many other agencies, private organizations and other interests.423

DIVISION OF WATER PLANNING Humboldt River Chronology—Part I
Nevada Water Basin Information and Chronology Series I–127
The BLM’s restoration objectives for the Great Basin restoration proposal included the following:(1) resolve the problems of the Great Basin from an ecosystem perspective rather than aprogrammatic or issue basis; (2) protect healthy, functioning ecosystems consisting of native plantcommunities; restore degraded landscapes with high potential; and restore decadent shrublands; (3)develop a common basis for an approach to problem identification and resolution; (4) develop criteriafor prioritizing restoration work and funding; (5) leverage limited current capability by combiningfunding sources on priority areas identified through the restoration criteria; (6) capitalize on externalpartnerships to maximize restoration capability and success; and (7) promote scientific research andstudies.424
The BLM’s proposed program for Great Basin restoration included the following guiding principles:(1) restoration will encompass all landscapes in the Great Basin and not just those areas that burnedin 1999; (2) restoration will be consistent with BLM’s “Standards for Rangeland Health”; (3)decisions about restoration activities must be made, with involvement of local communities and tribes;(4) restoration work will be based on the best available science; (5) restoration must incorporatesound fire management strategies; (6) funds will be devoted to on-the-ground work to the extentpossible; (7) native species should be given preference in seeding projects, pending seed availability,cost and chance of success; (8) all restoration projects will include monitoring, data evaluation andinformation sharing to improve restoration success in the future; (9) restoration activities mustbalance ecological needs with social, political and economic considerations; and (10) the Great Basinmust be managed for no net loss of sagebrush habitat and salt desert shrub habitat.425
In addition to the obvious sense of urgency noted in the BLM document, what has made the BLM’sproposals for the Great Basin singularly innovative is the recognition of having to resolve thepervasive rangeland problems on a more comprehensive, ecosystem basis. In the past, it was argued,restoration was effected for a single program (i.e., livestock grazing), or for a single issue (i.e., sagegrouse), or for a given crisis on a site-specific basis (i.e., wildfire rehabilitation).426 Consequently, thework that was undertaken was based on more short-term, immediate needs rather than long-termgoals and needs of restoration. By contrast, the BLM’s Great Basin restoration objectives were nowcalling for a unification of all rehabilitation and restoration efforts into a single, coordinated programboth to improve the concentration of effort as well as to use available funding most effectively.
Humboldt River Chronology—Part I DIVISION OF WATER PLANNING
I–128 Nevada Water Basin Information and Chronology Series
Humboldt River Basin Snowpack Water Content Analysis
For the Great Basin’s river systems, the extent of the mountain snowpack is essential for downstreamflows.427 In fact, this snowpack water content natural “reservoir” constitutes the most importantwater storage component for these northern Nevada watersheds. Table 23, Northern Nevada WaterBasin Snowpack Water Content,428 presents an historical perspective of snowpack equivalent watercontent (and thereby a proxy measure of annual precipitation) levels in Northern Nevada’s majorwater basins over the years 1980 through 1999. These measures are based on the percentage ofaverage snowpack water content as of April 1 of each year (average, or “normal” year equal to 100percent). This overall period of time is of special significance to the hydrology of northern Nevadaas it included both the wettest year on record for the Sierra Nevada water basins (1983) and theHumboldt River Basin (1984), as well as the most severe drought period on record (1987-1994) forthese same water basins. The trend in these figures clearly shows the extreme variations in snowpackwater content from year to year.
For example, within the upper Humboldt River Basin (i.e., above Palisade, Nevada) snowpackreadings have ranged from a low of 47 percent of normal snowpack water content in 1994 to a highof 227 percent of normal in 1984. Also, within the lower Humboldt River Basin (below Palisade),over a period of just four years, from 1981 to 1984, the snowpack water content readings varied from30 percent of normal snowpack water content to 296 percent of normal. Due, in part, to its locationbetween the storm systems affecting primarily the western Nevada watersheds (i.e., Truckee, Carsonand Walker River Basins) and the more north-trending jet stream induced storm systems affectingprimarily the watersheds of eastern Nevada (i.e., upper Humboldt River), the lower Humboldt RiverBasin has tended to show the greatest variation in its snowpack water content readings among all thewatersheds of northern Nevada.
With respect to the trends shown in Table 23, despite the seemingly wide variations in the snowpackwater content measures for the upper Humboldt River Basin, the (arithmetic) average snowpackwater content for the 1980-99 period was reasonably close to the entire period of record average of100 percent. Specifically, for the upper Humboldt River Basin, the average snowpack water contentreading for this 1980-1999 period was 98 percent of normal,429 which, when combined with arelatively low standard deviation (a measure of an individual year’s variability from this average),indicates that while individual yearly values seem volatile, the overall pattern was approximately“average,” i.e., close to 100 percent.
On the other hand, the average snowpack water content readings for the lower Humboldt River Basinover this 1980-1999 period showed far greater variability with an overall average value of 111percent of normal.430 Furthermore, the individual annual measures showed such a high standarddeviation (variability) as to provide little statistical confidence that this value resembles the “true”mean (100 percent). These year-to-year variations, especially for the lower Humboldt River Basin,add support to concerns over using the concept of an “Average Water Year” for watershedforecasting and planning purposes, as there are so few such years in reality. In this regard, Rye PatchReservoir, located in Lovelock Valley in the lower Humboldt River Basin, has contributed tosmoothing out the surface water available (primarily from the upper basin) for irrigation.

DIVISION OF WATER PLANNING Humboldt River Chronology—Part I
Nevada Water Basin Information and Chronology Series I–129
Table 23 – Northern Nevada Water Basin Snowpack Water ContentSnowpack Water Equivalent (Content) as a Percent of Average (100%) – April 1, 1980-1999
WaterYear
LakeTahoeBasin
TruckeeRiverBasin†
CarsonRiverBasin
WalkerRiverBasin
UpperHumboldt
River Basin
LowerHumboldt
River Basin
1980 134% 134% 153% 170% 121% 131%
1981 62% 58% 70% 73% 55% 30%
1982 141% 149% 147% 156% 178% 173%
1983 202% 205% 206% 227% 157% 272%
1984 103% 100% 95% 106% 227% 296%
1985 90% 90% 85% 85% 115% 145%
1986 142% 134% 158% 170% 115% 115%
1987 56% 56% 48% 46% 75% 92%
1988 29% 32% 36% 40% 52% 44%
1989 93% 100% 87% 70% 103% 141%
1990 41% 50% 47% 47% 63% 45%
1991 64% 60% 63% 69% 72% 74%
1992 46% 45% 37% 54% 39% 33%
1993 149% 158% 123% 144% 95% 98%
1994 44% 50% 43% 46% 47% 36%
1995 168% 184% 157% 185% 73% 95%
1996 116% 121% 106% 113% 110% 107%
1997 93% 121% 87% 117% 98% 81%
1998 129% 138% 118% 142% 99% 123%
1999 133% 138% 103% 99% 74% 91%
Period Percent of Water Basin Average (Average = 100%)Wet Years (1982 - 1986); Drought Years (1987 - 1994); Wet Years (1995 - 1999):
82 - 86 136% 136% 138% 149% 158% 200%
87 - 94* 65% 69% 61% 65% 69% 73%
95 - 99* 128% 140% 114% 131% 95% 101%
Accounting for Flood of January 1997 (Snowpack readings taken February 1, 1997):‡
1997 181% 219% 187% 233% 160% 139%
95 - 99* 145% 160% 134% 154% 111% 115%
† Snowpack water content figures for the Truckee River Basin exclude the Lake Tahoe Basin and begin below the Lake Tahoe Damat Tahoe City, California.‡ Due to the effects of unusual weather conditions and an early runoff caused the extensive “wet-mantle” flooding in early January1997 in northern Nevada, alternative peak snowpack readings are presented for February 1, 1997 (versus April 1) which moreaccurately reflected 1997’s relatively extreme climatological conditions.* Drought years for the upper and lower Humboldt River Basins extended from 1987-1995 and the most recent wet year extendsfrom 1996-1999.Source Data: “Nevada Basin Outlook Report”, various issues, Natural Resources Conservation Service (NRCS), U.S. Departmentof Agriculture, Reno, Nevada.

Humboldt River Chronology—Part I DIVISION OF WATER PLANNING
I–130 Nevada Water Basin Information and Chronology Series
Figure 20 – Upper Humboldt River Basin Snowpack Water Content
Figure 21 – Lower Humboldt River Basin Snowpack Water Content

DIVISION OF WATER PLANNING Humboldt River Chronology—Part I
Nevada Water Basin Information and Chronology Series I–131
In addition to the relatively high variability of snowpack water content readings within each of thesenorthern Nevada watersheds, closer analysis of Table 23 also shows how these watersheds areaffected both similarly and uniquely by winter storm systems. From a more extensive analysis of thisdata, we may make several tentative propositions with respect to the effects of winter storms onregional hydrology. While the overall pattern in the snowpack water content readings appears toshow marked correlation of the readings among all of northern Nevada’s principal watersheds, morerigorous analysis also tends to indicate the presence of distinctly unique effects on specificwatersheds. Furthermore, the apparent differences in the effects of the region’s eastward trackingstorm systems and the resultant variations in snowpack water content conditions exist primarilybetween western Nevada’s watersheds (the Lake Tahoe Basin,431 and the Truckee, Carson andWalker River Basins) and those of the upper and lower Humboldt River Basin.
The snowpack similarities and differences gleaned from Table 23 fall into three general categories:
(1) years in which all the principal watersheds of northern Nevada have responded similarly(i.e., wet years or drought years) in terms of snowpack water content readings (e.g., 1980,1981, 1988, 1990-1992, 1994 and 1996-1998);(2) years in which extremely heavy precipitation (i.e., “wet” storm systems) in the westernNevada watersheds were typically caused by the effects of a more southern-tracking jetstream “drawing” storm systems southward. These storm systems have tended to be“blocked” and depleted of their water content (the “rain shadow” effect) by the SierraNevada. These effects are not typically reflected in the snowpack conditions of the HumboldtRiver Basin, or at least not reflected in the upper Humboldt River Basin (e.g., 1983, 1986,1993, 1995, 1997 [for a February 1, 1997 reading versus the normal April 1, 1997 reading],and 1999); and(3) years in which eastern Nevada and particularly the upper Humboldt River Basin, has beenespecially affected by Pacific storms systems being pushed first further north and east and thendownward from the Pacific Northwest by a more northern-tracking jet stream. The morenorthern track of these systems has tended to cause them to largely by-pass the watershedsof western Nevada (e.g., 1982, 1984 and 1985, 1987 and 1989).
It has been proposed that the southern-tracking jet stream phenomenon supporting greater snowpackwater content in western Nevada’s watersheds is a characteristic of an El Niño event, while the morenorthern-tracking jet stream, which tends to push storms further to the north and then bring themdown into eastern Nevada, is caused by a La Niña period or event.432
Table 23 also reveals important information specifically related to the unusual hydrologic conditionswhich occurred during the 1997 water year (“The Flood of 1997”).433 During this period, whichlasted from late December 1996 to early January 1997, heavy rains produced extensive flooding inwestern Nevada and caused the Humboldt Sink to fill and then flow into the Carson Sink. Based onthe normal April 1 recording of water basin snowpack water content measurements, the 1997 wateryear for both the upper and lower Humboldt River Basins was actually recorded as being below thelong-term average. Specifically, the upper Humboldt River Basin showed snowpack water contentof 98 percent of normal as of April 1, 1997 while the lower Humboldt River Basin was at 81 percentof normal. On the other hand, comparable period snowpack water content readings for the western

Humboldt River Chronology—Part I DIVISION OF WATER PLANNING
I–132 Nevada Water Basin Information and Chronology Series
Nevada watersheds showed more mixed conditions, with some watersheds being slightly belowaverage (the Lake Tahoe Basin and the Carson River Basin) and others just above average (Truckeeand Walker River Basins).
The climatic conditions during this extreme storm and flood event were characterized by heavysnowfalls in December 1996, which were then followed in late December and early January by severaldays of warm torrential rains on heavy snowpack accumulation. At first, the rains virtually depletedthe entire snowpack below 7,000 feet MSL, greatly exacerbating the effects of runoff anddownstream flooding. Weather conditions then cooled appreciably, turning the rain to snow at theupper elevations and again restoring the snowpack to near-record levels. Temperatures then warmedsignificantly by early spring, greatly depleting the snowpack and resulting in snowpack water contentmeasurements on April 1, 1997 which were, despite near-record flooding throughout all these waterbasins, indicative of only a “normal” water year.
The bottom portion of Table 23 has been modified to provide additional analysis of this 1997 periodby changing the presumed date of maximum snowpack for these water basins. Specifically, thissection of the table presents the snowpack water content readings for all of these watersheds takenon February 1, 1997 (versus April 1, 1997), which approximately corresponded to the peak snowpackwater content readings for that water year recorded after recovery from the effects of the earlyJanuary flooding. Even so, snowpack water content measures for 1997 provided poor estimates ofthe winter’s “true” precipitation as by this time (February 1997) a significant portion of the period’soverall precipitation, in terms of both rainfall and melted snowpack, had already flowed (actuallyflooded) to these basins’ respective terminus locations.
Even so, throughout western Nevada’s watersheds the differences between the snowpack watercontent readings taken on February 1, 1997 and those recorded later on April 1, 1997 were extreme.For example, within the Lake Tahoe Basin, snowpack water content measurements changed from 93percent of normal recorded on April 1, 1997, to 181 percent of normal recorded previously onFebruary 1, 1997. As this was a more typical El Niño “wet storm” event, and based on the previousdiscussion with respect to regional snowpack differences, the effects on the Humboldt River Basinwere not quite so dramatic, but nonetheless significant. The snowpack water content readings of theupper and lower Humboldt River Basins changed from 98 percent and 81 percent of normal,respectively, recorded on April 1, 1997, to 160 percent and 139 percent of normal, respectively,recorded previously on February 1, 1997.
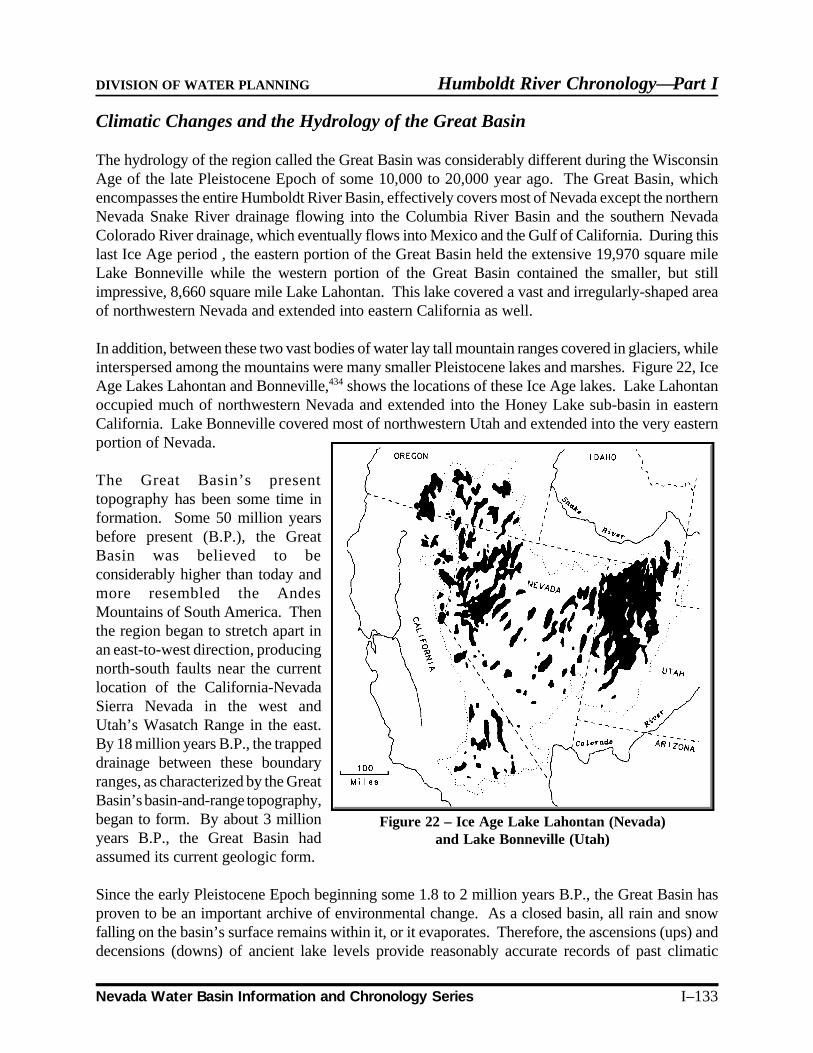
DIVISION OF WATER PLANNING Humboldt River Chronology—Part I
Nevada Water Basin Information and Chronology Series I–133
Figure 22 – Ice Age Lake Lahontan (Nevada)and Lake Bonneville (Utah)
Climatic Changes and the Hydrology of the Great Basin
The hydrology of the region called the Great Basin was considerably different during the WisconsinAge of the late Pleistocene Epoch of some 10,000 to 20,000 year ago. The Great Basin, whichencompasses the entire Humboldt River Basin, effectively covers most of Nevada except the northernNevada Snake River drainage flowing into the Columbia River Basin and the southern NevadaColorado River drainage, which eventually flows into Mexico and the Gulf of California. During thislast Ice Age period , the eastern portion of the Great Basin held the extensive 19,970 square mileLake Bonneville while the western portion of the Great Basin contained the smaller, but stillimpressive, 8,660 square mile Lake Lahontan. This lake covered a vast and irregularly-shaped areaof northwestern Nevada and extended into eastern California as well.
In addition, between these two vast bodies of water lay tall mountain ranges covered in glaciers, whileinterspersed among the mountains were many smaller Pleistocene lakes and marshes. Figure 22, IceAge Lakes Lahontan and Bonneville,434 shows the locations of these Ice Age lakes. Lake Lahontanoccupied much of northwestern Nevada and extended into the Honey Lake sub-basin in easternCalifornia. Lake Bonneville covered most of northwestern Utah and extended into the very easternportion of Nevada.
The Great Basin’s presenttopography has been some time information. Some 50 million yearsbefore present (B.P.), the GreatBasin was believed to beconsiderably higher than today andmore resembled the AndesMountains of South America. Thenthe region began to stretch apart inan east-to-west direction, producingnorth-south faults near the currentlocation of the California-NevadaSierra Nevada in the west andUtah’s Wasatch Range in the east.By 18 million years B.P., the trappeddrainage between these boundaryranges, as characterized by the GreatBasin’s basin-and-range topography,began to form. By about 3 millionyears B.P., the Great Basin hadassumed its current geologic form.
Since the early Pleistocene Epoch beginning some 1.8 to 2 million years B.P., the Great Basin hasproven to be an important archive of environmental change. As a closed basin, all rain and snowfalling on the basin’s surface remains within it, or it evaporates. Therefore, the ascensions (ups) anddecensions (downs) of ancient lake levels provide reasonably accurate records of past climatic
Humboldt River Chronology—Part I DIVISION OF WATER PLANNING
I–134 Nevada Water Basin Information and Chronology Series
changes, with the detailed history of each individual lake basin stored within its layers of sediment.U.S. Geological Survey studies of the sediment in Pyramid Lake, for example, have revealed thatbetween 52,000 to 10,000 years B.P. abrupt, dramatic climatic changes occurred every 1,000 to3,000 years. These changes have also been correlated to changes revealed by Greenland ice andNorth Atlantic sediment, indicating that the changes recorded within the Great Basin are indicativeof more global climatic patterns as well.435
Shoreline altitudes of several pluvial lakes in the northern and western Great Basin have recordedsuccessively smaller lakes from the early to the late Pleistocene Epoch, or from approximately 2million years B.P. to 10,000 years B.P. This decrease in lake size tends to indicate a long-term dryingtrend in the region’s climate. Calculations based on differences in lake area suggest that the highestlevels of these pluvial lakes occurring during the early Pleistocene would have required a regionalincrease in effective moisture of up to three times that effective moisture level estimated to haveexisted in the late Pleistocene. These previously unknown lake levels reflect significant changes inclimate, tectonics and (or) drainage basin configurations and could have facilitated the more extensivemigration of aquatic species in the Great Basin.436
Lake Lahontan ’s early Pleistocene surface level of 4,590 feet MSL was estimated to be over 200 feetabove its late Pleistocene shoreline (4,380 feet MSL), a surface elevation more typically recognizedas this lake’s approximate late Pleistocene highstand. At this higher elevation, Lake Lahontan wouldhave extended its reach up the Humboldt River from the late Pleistocene highstand located just aboveRed House (about five miles above Comus) by another 45 miles to just above Argenta, therebysubmerging Battle Mountain beneath nearly 70 feet of water. There is also evidence showing thepossibility that at one time Lake Lahontan may have extended even further up the Humboldt River,by another 28 miles to the lower end of Palisade Canyon.437
Pyramid Lake, located in the Truckee River Basin in western Nevada, as well as Walker Lake,located nearly 80 miles to the south in the Walker River Basin, represent the last remaining major lakeremnants of Ice Age Lake Lahontan. This ancient lake covered a highly irregular area throughoutmuch of northwestern Nevada as recently as 12,500 years ago and experienced a number offluctuations in its surface elevation and extent over the last 360,000 years.
The importance of this lake’s fluctuations lies in the corresponding climatic conditions that fosteredits rapid ascensions and descensions and, during intervening periods, the complete desiccation (dryingup) of all its major sub-basins, with the exception of Pyramid Lake itself, which constituted the lowestpoint within the Lake Lahontan system. Core samples taken of Pyramid Lake’s lake bottom do notindicate a brine concentration, as does Walker Lake, therefore suggesting that throughout LakeLahontan’s existence Pyramid Lake held water, although it was periodically severely restricted insize.438
Figure 23, Lake Lahontan’s Sub-Basins and Sills,439 show the seven principal sub-basins of Ice AgeLake Lahontan and the sills, or locations of spillover from one sub-basin to another. Lake Lahontanwas fed by the Truckee, Carson, Walker, Humboldt, Susan, and Quinn Rivers. Lake Lahontan’sextent consisted of seven major sub-basins in northwestern Nevada and eastern California. Thesesub-basins are presented below and are marked by Roman numerals in Figure 23:

DIVISION OF WATER PLANNING Humboldt River Chronology—Part I
Nevada Water Basin Information and Chronology Series I–135
Figure 23 – Lake Lahontan’s Sub-Basins and Sills
(I) Smoke Creek/Black Rock Desert;(II) Carson Desert;(III) Buena Vista;(IV) Walker Lake;(V) Pyramid Lake;(VI) Winnemucca Dry Lake; and(VII) Honey Lake, located mostly in California.
Associated with each of these sub-basins was a primary “sill” or interbasin spillway defined as thelowest point on the divide between adjoining sub-basins. The sills were important because only atwater elevations above these threshold levels would the waters of Lake Lahontan, originating in thebasin’s lowest point – Pyramid Lake– spill over into adjacent sub-basins.These sills and their approximateelevations above mean sea level arepresented below and refer to theArabic numbers in Figure 23:
(1) Pronto – Black Rock Desert(4,239 feet or 1,292 meters);(2) Chocolate – Buena Vista (4,140feet or 1,262 meters);(3) Adrian Pass (Valley) – WalkerLake (4,291 feet or 1,308 meters);(4) Darwin Pass – Carson Desert(4,150 feet or 1,265 meters);(5) Mud (Winnemucca) LakeSlough – Winnemucca Dry (Mud)Lake (3,862 feet or 1,177 meters);(6) Astor Pass – Honey Lake (4,009feet or 1,222 meters); and(7) Emerson Pass – Smoke CreekDesert (3,960 feet or 1,207meters);.440
It was only at lake surface elevationsabove approximately 4,290 feetabove mean sea level (MSL) that allthe seven major sub-basins comprising Lake Lahontan were joined into one continuous, albeit highlyirregularly-shaped, lake. This particular elevation represented the highest point within the AdrianValley, a narrow pass, almost 10 miles in length, connecting the lower Carson River Basin in thenorth with Mason Valley and the Walker River Basin to the south. In its last stage towards fullexpansion, waters from an ascending Lake Lahontan flowed west up the Carson River towards thepresent-day site of Dayton, and south through the Adrian Valley and into the Walker River Basin.Once Lake Lahontan’s waters emerged from the Adrian Valley and spread into the northern portion

Humboldt River Chronology—Part I DIVISION OF WATER PLANNING
I–136 Nevada Water Basin Information and Chronology Series
of Mason Valley, they then raced down Campbell Valley throught the site of present-day WeberReservoir to fill Walker Lake and the Walker Lake sub-basin, continuing southward to beyond thepresent-day town of Hawthorne in Mineral County, Nevada. Once the Walker Lake basin was filed,waters then flowed up the Walker River, flooding Mason Valley up to the present-day location of theCity of Yerington located in Lyon County, Nevada.
In the Humboldt River Basin, Lake Lahontan’s late Pleistocene reach up the Humboldt River Valleyeffectively cut some 100 miles off the Humboldt River’s present 300-mile length, covering the sitesof Toulon and Humboldt Lakes by approximately 490 feet. Further upriver, Lake Lahontansubmerged the present-day site of Lovelock by nearly 400 feet, and also submerged the HumboldtRiver’s bed at the present-day site of Winnemucca by nearly120 feet. Just above Winnemucca, LakeLahontan extended north and flowed up the Little Humboldt River drainage, covering the Sand Dunesformation and the southern portion of Paradise Valley, eventually reaching a point approximately 26miles upriver from the Humboldt River main stem. From Winnemucca, Lake Lahontan’s reachcontinued up the Humboldt River Valley for another 32 miles to a point about five miles aboveComus to the present-day location of Red House. At this location a small and relatively shallow lakewas formed of approximately 30 square miles in size.
Extensive evidence based on sophisticated X-ray diffraction petrographic and radiocarbon analyses,as well as detailed analysis of Walker Lake’s lakebed core samples, indicates that Lake Lahontan andits various hydrographic sub-basins have been subject to extensive fluctuations over the last 40,000years, and that most of Lake Lahontan’s sub-basins have desiccated on numerous occasions.441 Thisapparent repetitive cycle of ascension and descension, lake expansion and lake desiccation, and pluvial(wet) and inter-pluvial (dry) periods, has important implications on our own time period and thepresent hydrographic cycle, climatic conditions, and our expectations of natural versus man-causedhydrologic changes within the various hydrographic basins in northern Nevada.
As a general indication of climatic conditions within the Great Basin, evidence shows that between15,000-13,500 years ago, Lake Lahontan went through a peaking enlargement (maximum stage),attaining a surface elevation of almost 4,380 feet MSL,442 a surface area of approximately 8,600square miles,443 and all of its sub-basins were connected. Lake Lahontan’s last highstand occurredsome 12,500 years ago. By the end of the Pleistocene, between 11,000 and 10,000 years ago,climatic conditions again changed dramatically and the region entered what may be an inter-pluvialperiod. Since entering the Holocene Epoch, beginning about 10,000 years ago, generally warm andarid conditions have since prevailed throughout the Great Basin. At that time Lake Lahontancommenced a descension phase and all sub-basins except Pyramid Lake and Walker Lake essentiallydried up.444

DIVISION OF WATER PLANNING Humboldt River Chronology—Part I
Nevada Water Basin Information and Chronology Series I–137
Appendix 1 – Humboldt River Basin Hydrographic AreasHydrographic Areas and Sub-Area by Name, Counties and Preferred Use Designations
AreaNum. Area Name
Size(sq. miles)
Size(acres)
CountiesIncluded† Designations‡
42 Mary’s River 1,073 686,720 Elko 837–Designation (2/14/84);838–Preferred Use: M&I,Domestic (3/20/84)
43 Starr Valley 332 212,480 Elko 867–Designation (7/10/85)44 North Fork 1,110 710,400 Elko 744–Designation (5/28/80)45 Lamoille Valley 257 164,480 Elko 869–Designation (7/18/85)46 South Fork 99 63,360 Elko 870–Designation (7/18/85)47 Huntington Valley 787 503,680 Elko, White
Pine865–Designation (7/10/85)
48 Dixie Creek-TenmileCreek
392 250,880 Elko 848–Designation (9/6/84);1120–Notice of Curtailment(portion) (4/2/96)
49 Elko Segment 314 200,960 Elko, Eureka 778–Designation (portion)(12/8/81); 782–Notice ofCurtailment (1/3/81);864–Designation (remainingportion) (7/10/85);872–Designation (remainingportion): M&I, Domestic(7/18/85)
50 Susie Creek 223 142,720 Elko, Eureka 866–Designation (7/10/85);872–Preferred Use: M&I,Domestic (7/18/85)
51 Maggie Creek 396 253,440 Elko, Eureka 863–Designation (7/10/85);872–Preferred Use (portion):M&I, Domestic (7/18/85);1055–Well Spacing (4/1/92)
52 Marys Creek 61 39,040 Eureka, Elko 868–Designation (7/18/85);872–Preferred Use (portion):M&I, Domestic (7/18/85)
53 Pine Valley 1,002 641,280 Eureka, Elko 862–Designation (7/10/85)54 Crescent Valley 752 481,280 Eureka, Lander 755–Designation (3/20/81);
1082–Well Spacing (10/6/83)55 Carico Lake Valley 376 240,640 Lander None56 Upper Reese River
Valley1,138 728,320 Lander, Nye None
57 Antelope Valley 452 289,280 Lander 276–Designation (portion)(8/5/64)
58 Middle Reese RiverValley
319 204,160 Lander 276–Designation (portion)(8/5/64)
59 Lower Reese RiverValley
588 376,320 Lander, Eureka 739–Designation (3/27/80);839–Preferred Use: M&I,Domestic (3/20/84)
60 Whirlwind Valley 94 60,160 Eureka, Lander 799–Designation (10/5/82)61 Boulder Flat 544 348,160 Eureka, Lander,
Elko799–Designation (10/5/82);839–Preferred Use: M&I,Domestic (3/20/84);1038–Well Spacing (3/29/91)

Humboldt River Chronology—Part I DIVISION OF WATER PLANNING
AreaNum. Area Name
Size(sq. miles)
Size(acres)
CountiesIncluded† Designations‡
I–138 Nevada Water Basin Information and Chronology Series
62 Rock Creek Valley 444 284,160 Elko, Lander,Eureka
None
63 Willow Creek 405 259,200 Elko None64 Clovers Area 720 460,800 Humboldt,
Lander, Elko700–Designation (12/30/77);839–Preferred Use (portion):M&I, Domestic (3/20/84);1085–Well Spacing (1/21/94)
65 Pumpernickle Valley 299 191,360 Humboldt,Pershing
1086–Well Spacing (1/21/94)
66 Kelly Creek Valley 301 192,640 Humboldt, Elko 536–Designation (5/9/75);1087–Well Spacing(12/30/93)
67 Little HumboldtValley
975 624,000 Humboldt, Elko None
68 Hardscrabble Area 167 106,880 Humboldt None69 Paradise Valley 600 384,000 Humboldt 408–Designation (portion)
(10/22/71); 832–Notice ofCurtailment (12/1/83)
70 WinnemuccaSegment
435 278,400 Humboldt 464–Designation (7/24/72);534–Extension of DesignatedArea (5/6/75)
71 Grass Valley 520 332,800 Pershing,Humboldt
464–Designation (7/24/72)
72 Imlay Area 771 493,440 Pershing 702–Designation (1/31/78)73 Lovelock Valley 635 406,400 Pershing,
ChurchillNone
73A Lovelock Valley/Oreana Sub-Area
98 62,720 Pershing 369–Designation (2/25/69);370–Notice of CurtailmentArea and Preferred Use(portion): M&I (2/25/69);1079–Expand CurtailmentArea and Preferred Use(portion) (5/17/93)
74 White Plains 164 104,960 Churchill,Pershing
716–Designation (7/678
† Counties are listed in order of their respective area shares of the hydrographic area or sub-area.‡ Designated = Designated groundwater basins (i.e., hydrographic areas or sub-areas) are basins where permitted ground waterrights approach or exceed the estimated average annual recharge (or perennial yield) and the water resources are being depletedor require additional administration. Under such conditions, and in the interest of public welfare, the Nevada State Engineer,Division of Water Resources, Department of Conservation and Natural Resources, is authorized by statute (Nevada Revised Statute534.120) and directed to designate a groundwater basin and declare preferred uses within such designated basin (e.g., municipaland industrial, domestic, agriculture, etc.). The State Engineer has additional authority in the administration of the water resourceswithin a designated groundwater basin. Numbers refer to the State Engineer’s Order number for specific designations.Source Data: Office of the State Engineer, Nevada Division of Water Resources, Department of Conservation and NaturalResources, Carson City, Nevada.

DIVISION OF WATER PLANNING Humboldt River Chronology—Part I
Nevada Water Basin Information and Chronology Series I–139
Appendix 2 – Principal Humboldt River Basin Plant SpeciesMajor Plant Species Presented in this Chronology – Listed Alphabetically by Common Name
aspen (Populus tremuloides)Bailey greasewood (Sarcobatus baileyi) big sagebrush (Artemisia tridentata)bitterbrush (Purshia tridentata)black sagebrush (Artemisia nova)bluebunch wheatgrass (Agropyron spicatum)bottlebrush squirreltail (Sitanion hystrix)bristlecone pine (Pinus aristata)bud sagebrush (Artemisia spinescens)cheatgrass (Bromus tectorum)chokecherry (Prunus virginiana)cottonwood (Populus fremontii)creeping wildrye (Elymus triticoides)(black) greasewood (Sarcobatus vermiculatus)Great Basin wildrye (Elymus cinereus)halogeton (Halogeton glomeratus)Idaho fescue (Festuca idahoensis)Indian ricegrass (Oryzopsis hymenoides)limber pine (Pinus flexilis)littleleaf horsebrush (Tetradymia glabrata)low sagebrush (Artemisis arbuscula)juniper (Juniperus utahensis)(curl-leaf) mountain mahogany (Cercocarpus ledifolius)needlegrass (Stipa spp.)Nevada bluegrass (Poa nevadensis)(single-leaf) pinyon pine (Pinus monophylla)rabbitbrush (Chrysothamnus nauseosus)rockspirea (Holodiscus discolor) saltgrass (Distichlis stricta)Sandberg bluegrass (Poa secunda)serviceberry (Amelanchier alnifolia)shadscale (Atriplex confertifolia)smallflower tamarisk (salt cedar) (Tamarix parviflora)small rabbitbrush (Chrysothamnus viscidiflorus) snowberry (Symphoricarpos spp.)subalpine fir (Abies lasiocarpa)tall whitetop (Lepidium latifolium L.)white bark pine (Pinus albicaulis)white fir (Abies concolor)willows (Salix spp.)winterfat (white sage) (Krascheninnikovia lanata)

Humboldt River Chronology—Part I DIVISION OF WATER PLANNING
I–140 Nevada Water Basin Information and Chronology Series
Appendix 3 – Humboldt River Basin Gaging Station RecordsU.S. Geological Survey Gaging Stations’ Contiguous Periods of Record
Gaging StationNumber USGS Gage Name and Location Gage Contiguous Period(s) of Record
10313400 Mary’s River below Orange Bridgenear Charleston, Nevada
October 1991 to current year (see “Note” below)
10315500 Mary’s River above Hot SpringsCreek near Deeth, Nevada
October 1943 to September 1980; October 1981 tocurrent year
10315600 Mary’s River below Twin Buttes nearDeeth, Nevada
October 1991 to current year
10316500 Lamoille Creek near Lamoille,Nevada
May 1915 to May 1923; October 1943 to currentyear
10318500 Humboldt River near Elko, Nevada June 1895 to October 1902; October 1944 tocurrent year
10319900 South Fork Humboldt River aboveTenmile Creek near Elko, Nevada
February 1989 to current year
1032000 South Fork Humboldt River aboveDixie Creek near Elko, Nevada
October 1948 to September 1982; July 1988 tocurrent year
10321000 Humboldt River near Carlin, Nevada October 1943 to current year
10321590 Susie Creek at Carlin, Nevada April 1992 to current year
10321925 Simon Creek near Highway 766 nearCarlin, Nevada
November 1996 to current year
10321940 Maggie Creek above Maggie Creekcanyon near Carlin, Nevada
January 1977 to current year
10321950 Maggie Creek at Maggie CreekCanyon near Carlin, Nevada
September 1989 to current year
10322000 Maggie Creek at Carlin, Nevada July 1913 to December 1921; April to May 1922;April 1923 to September 1924; April 1992 tocurrent year
10322150 Marys Creek at Carlin, Nevada November 1989 to current year
10322500 Humboldt River at Palisade, Nevada October 1902 to October 1906; July 1911 tocurrent year
10323425 Humboldt River at Old U.S. Highway40 Bridge at Dunphy, Nevada
February 1991 to current year
10324500 Rock Creek near Battle Mountain,Nevada
March 1918 to September 1925 (fragmentary fromOctober 1923 to April 1925); March 1927 to May1929 (fragmentary); October 1945 to current year
10324700 Boulder Creek near Dunphy, Nevada February 1991 to June 1993; Seasonal records (i.e.,January-June) since June 1993 to current year
10325000 Humboldt River at Battle Mountain,Nevada
May 1896 to December 1897; March 1921 to April1924; October 1945 to September 1981; February1991 to current year
10327500 Humboldt River at Comus, Nevada October 1894 to December 1909; September 1910to September 1926; October 1945 to current year
10329000 Little Humboldt River near ParadiseValley, Nevada
October 1921 to June 1928 (fragmentary); October1943 to current year
10329500 Martin Creek near Paradise Valley,Nevada
October 1921 to current year

DIVISION OF WATER PLANNING Humboldt River Chronology—Part I
Gaging StationNumber USGS Gage Name and Location Gage Contiguous Period(s) of Record
Nevada Water Basin Information and Chronology Series I–141
10333000 Humboldt River near Imlay, Nevada June 1935 to December 1941; April 1945 tocurrent year
10335000 Humboldt River near Rye Patch,Nevada
January 1896 to June 1898; June 1899 toDecember 1909; September 1910 to June 1917;September 1917 to September 1922; September1924 to September 1930 (fragmentary); October1930 to September 1932; October 1935 toSeptember 1941; October 1943 to current year
Note: “Current year” refers to the water year ended September 30 1998.Source Data: Water Resources Data, Nevada, Water Year 1998 , Water-Data Report NV-98-1, U.S. Geological Survey, WaterResources Division, Department of the Interior, Nevada District Office, Carson City, Nevada, 1999, pages 195-231.

Humboldt River Chronology—Part I DIVISION OF WATER PLANNING
I–142 Nevada Water Basin Information and Chronology Series
Index to Part I:
adjudicationBartlett Decree, I-74Bonnifield Decree, I-82Carville Decree, I-74Edwards Decree, I-74
Adobe Range, I-48, I-50Agriculture, I-2, I-97
crop marketings, I-112economic stabilizing force, I-100efficiency, I-112employment, I-114farm marketings, I-99, I-112Historical Perspective, I-102irrigated acreage, I-98livestock marketings, I-112productivity, I-115water resources, I-99water withdrawals, I-100
Alfalfa seed, I-73Applegate Trail, I-71, I-109Applegate-Lassen cutoff, I-12, I-109Arc Dome, I-11Argenta, I-58, I-62Argenta Marsh, I-14, I-24
area, I-24location, I-24Nevada Division of Wildlife, I-25objectives, I-26Pershing County Water Conservation District, I-24Peter Skene Ogden, I-24principal participants, I-26restoration, I-26surveyed, I-24Tule Swamps, I-24U.S. Bureau of Reclamation, I-24wildlife, I-24
Army Drain, I-13Austin, I-58, I-87Barren River, I-51Barrick Gold Corporation, I-94Bartleson–Bidwell emigrant party, I-61, I-67, I-97Bartlett
Judge George A., I-78Bartlett Decree, I-74, I-78, I-110
classes of lands, I-78doctrine of “relation”, I-74irrigation season, I-75
Battle Mountain, I-11, I-57, I-62Battle Mountain Sub-Basin, I-60
area, I-60cheatgrass, I-63

DIVISION OF WATER PLANNING Humboldt River Chronology—Part I
Nevada Water Basin Information and Chronology Series I–143
ephemeral streams, I-61history, I-61hydrographic areas, I-60mining, I-63precipitation, I-63topography, I-63vegetation, I-63
BaudFrank, I-68
BensonAaron, I-62
Beowawe, I-49, I-59, I-62, I-102Big Meadows, I-13Bishop Creek, I-9Bishop Creek Reservoir, I-9, I-40, I-83Black Rock Desert, I-71Bonneville-Walker group, I-71Bonnifield Decree, I-82Boulder Valley, I-63bracketed land, I-74Bradley
Lewis R., I-58, I-102bristlecone pines, I-3Bureau of Land Management, I-96Bureau of Water Pollution Control, I-95Bureau of Water Quality Planning, I-95Button
Frank, I-68, I-103I.V., I-68, I-103
California Emigrant Overland Trail, I-1California Emigrant Trail, I-12, I-48, I-62
Joseph, I-71Callahan
J.A., I-72Camp Winfield Scott, I-65Carlin, I-10, I-48Carlin Trend, I-10, I-63, I-89
average ore grade, I-94open pit mines, I-94
CarsonKit, I-43
Carson River, I-13, I-29Carson Sink, I-13Carville Decree, I-74, I-79Central Pacific Railroad, I-45, I-48, I-52, I-58, I-62, I-68, I-73cheatgrass, I-59, I-70, I-117
wildfires, I-20Chihuahuan Desert, I-3Chile clover, I-73Chimney Reservoir, I-12, I-85Clean Water Act, I-95Clifton, I-58Colorado Plateau, I-3

Humboldt River Chronology—Part I DIVISION OF WATER PLANNING
I–144 Nevada Water Basin Information and Chronology Series
Columbia Plateau, I-3Columbia River Basin, I-67Community Pasture, I-14Confluence Marsh, I-25Cope Mining District, I-45Cortez Mountains, I-54creosotebush clones, I-3Deeth, I-9Department of Conservation and Natural Resources, I-34Devil’s Gate, I-47dewatering, I-94Division of Water Resources, I-34doctrine of prior appropriation, I-75doctrine of “relation”, I-74dryland farming, I-9Ducks Unlimited, I-25Dun Glen, I-72Dunphy, I-32, I-61Edwards
Judge H.W., I-79Edwards Decree, I-74, I-79
bracketed land, I-74irrigation season, I-75
El Niño, I-131, I-132Elko, I-9Elko and Idaho Toll Road, I-45Elko County Conservation Association, I-25Elko County Fair and Recreation Board, I-10Elko Mining and Soap Deposit Company, I-88Elko Mountain, I-52Elko Reach Sub-Basin, I-50
agriculture, I-52area, I-50history, I-51precipitation, I-52topography, I-52transportation, I-52vegetation, I-52
Eureka & Palisade Railroad, I-54Federal Emergency Management Agency, I-33Fifth Snake County Expedition, I-51, I-65flash flows, I-16flooding
February-April 1910, I-125Fort Hall Overland Emigrant Trail, I-43Fort Hall route, I-39, I-51Forty-Mile Desert, I-13, I-68Fox Creek Peak, I-39Frémont
John C., I-3, I-22, I-43, I-51Pyramid Lake, I-22
FrenchPeter, I-69

DIVISION OF WATER PLANNING Humboldt River Chronology—Part I
Nevada Water Basin Information and Chronology Series I–145
French Bridge, I-68French Fort, I-68Frenchman’s Ford, I-68gaging station
Dunphy, I-33Elko, I-34Palisade, I-7, I-32
General Water Law1913, I-77
GetchellNoble, I-89
Getchell Gold Trend, I-63Getchell Mine, I-63Ginaca
Josep, I-68Ginaca Bridge, I-68Ginaca-Gintz Humboldt Canal, I-88Gintz
Dr. A., I-68Golconda, I-68Golconda & Western Exploration Company, Ltd., I-68Golconda and Mill City, I-68Granite Peak, I-66Grass Valley, I-69Grayson
Dr. George W., I-49, I-62, I-102grazing, I-2, I-20, I-39, I-46, I-47, I-49, I-55, I-58, I-69, I-77, I-102, I-103, I-123-125
flooding, I-20Great Basin, I-3, I-116, I-133
1.8 to 2 million years B.P., I-13318 million years B.P., I-1333 million years B.P., I-13350 million years B.P., I-133animal species, I-116annual precipitation, I-4area, I-3biological diversity, I-3bristlecone pines, I-3climate, I-4creosotebush clones, I-3defined, I-3ecological health, I-126fires, I-126floristic characteristics, I-6Frémont, I-3Holocene Epoch, I-4, I-116, I-136Honey Lake area, I-133Humboldt River Basin, I-3, I-6hydrology, I-133includes, I-3Lake Bonneville, I-133Lake Lahontan, I-133landforms, I-3

Humboldt River Chronology—Part I DIVISION OF WATER PLANNING
I–146 Nevada Water Basin Information and Chronology Series
plant species, I-116Pleistocene Epoch, I-4Pyramid Lake, I-134rangeland conditions, I-126regions, I-4restoration, I-126, I-127topography, I-3transition zones, I-4vegetation zones, I-6Walker Lake, I-134wildfires, I-126Wisconsin Age, I-4
Great Salt Lake Desert, I-39Gulf of Mexico, I-4Gumboot Lake, I-64, I-66Halleck, I-9, I-46halogeton, I-41, I-103
adaptability, I-105common names, I-103drawing, I-105first specimens, I-104originated, I-104rangeland degradation, I-106research and response, I-104seeds, I-105sodium chloride, I-105soluble oxalates, I-105toxicity, I-103, I-106
Harrison Pass, I-43Hastings Cutoff, I-43Hastings Pass, I-43Henderson Creek, I-11Holocene Epoch, I-4, I-116, I-136Honey Lake, I-133Horseshoe Ranch, I-49Hudson’s Bay Company, I-24, I-67, I-71Humboldt
Baron Alexander von, I-51Humboldt and Toulon Lakes, I-72, I-87Humboldt Canal, I-68Humboldt City, I-72Humboldt County Fair and Recreation Board, I-12Humboldt Drain, I-13Humboldt Lake, I-13Humboldt lakes, I-13, I-87Humboldt National Forest, I-65, I-124Humboldt River
flooding, I-125grade, I-7hydrologic “division”, I-33meanders, I-1peak flood discharge, I-33productivity, I-27

DIVISION OF WATER PLANNING Humboldt River Chronology—Part I
Nevada Water Basin Information and Chronology Series I–147
source, I-8stream flows, I-27water rights, I-74
Humboldt River and Carson Riverhydrologic link, I-13
Humboldt River Basin, I-6agriculture, I-97area, I-1classes of lands, I-78drainage area, I-7earliest use, I-1flash flows, I-16headwaters, I-1hydrographic areas, I-35, I-137irrigated acreage, I-32Lake Lahontan’s extent, I-136located, I-1lower basin, I-7, I-32mining, I-86origin, I-1overview, I-7plant species, I-139point of separation, I-7proposed reservoir sites, I-16snowpack equivalent water content, I-128socioeconomic activities, I-2sub-basins, I-36terminus, I-1upper basin, I-7, I-32water production, I-16water storage , I-14water storage facilities, I-16, I-83water withdrawals, I-100water-related issues, I-14wildfires, I-117
Humboldt River Valleyearly emigration, I-1
Humboldt Sink, I-13Humboldt Slough, I-13Humboldt Wells, I-39Humboldt-Lovelock Irrigation, Light and Power Company, I-110Hunter and Banks, I-49Huntington Creek, I-39, I-42, I-88Huntington Valley, I-10, I-39hydrographic areas, I-34hydrographic regions, I-2Hydrologic Unit Classification Code, I-34Idaho Central Toll Road, I-45Independence Mountain Range, I-46, I-48Independence Mountains, I-8interbasin transfers, I-19
Antediluvian Policy, I-19intercounty transfers, I-19

Humboldt River Chronology—Part I DIVISION OF WATER PLANNING
I–148 Nevada Water Basin Information and Chronology Series
Intermountain region, I-3International Monetary Fund (IMF), I-93Iron Point, I-62Irrigation Law
1903, I-77irrigation season, I-75Jacobsville, I-58Jarbidge Mountains, I-8, I-39Kit Carson, I-43La Niña, I-131Lahontan cutthroat trout, I-14, I-22
habitat, I-14morphometric differentiation, I-22Pyramid Lake sub-species, I-22
Lahontan Valley Wetlands, I-25Lake Bonneville, I-133Lake Lahontan, I-12, I-22, I-133, I-134
early Pleistocene, I-134late Pleistocene, I-134sub-basins, I-135
Lake Lahonton, I-63Lake Tahoe Basin, I-30Lamoille Creek, I-9, I-50Lamoille Valley, I-102Lassen Meadows, I-12, I-71late Pleistocene Epoch, I-116Little Humboldt River, I-12, I-64
Chimney Reservoir, I-12drainage area, I-12Gumboot Lake, I-12North Fork, I-12South Fork, I-12
Little Humboldt River Sub-Basin, I-64area, I-64Gumboot Lake, I-64history, I-65hydrographic areas, I-64precipitation, I-66Sand Dunes, I-64topography, I-66vegetation, I-66White Winter, I-65
LockhartJudge J.M., I-80
Lone Tree (Mine) Cooling Ponds, I-85Lovelock, I-70Lovelock Irrigation District, I-73, I-110Lovelock Reach Sub-Basin, I-70
agriculture, I-72area, I-70history, I-71Humboldt Sink, I-71hydrographic areas, I-70

DIVISION OF WATER PLANNING Humboldt River Chronology—Part I
Nevada Water Basin Information and Chronology Series I–149
mining, I-72precipitation, I-73Rye Patch Reservoir, I-70topography, I-73vegetation, I-73
Lovelock Valley, I-13, I-108Rye Patch Reservoir, I-108
lower Humboldt River Basin, I-10, I-36area, I-10distance, I-13drainage areas, I-10hydrographic areas, I-10snowpack equivalent water content, I-128sub-basins, I-10water rights, I-81
Maggie Creek, I-10, I-48, I-89gold mining, I-10
Maggie Creek Dam/Reservoir, I-84Maggie Creek Sub-Basin, I-47
agriculture, I-49area, I-47headwaters, I-48history, I-48mining, I-48precipitation, I-49topography, I-49vegetation, I-49White Winter, I-49
Mahogany Mountain, I-56Marker
P.N., I-76, I-103Martin Creek, I-66Marys Mountain, I-51Mary’s River, I-39, I-51
Jarbidge Mountains, I-39tributaries, I-39
Mary’s River Peak, I-39Mary’s River sub-basin, I-8, I-38
altitude, I-40area, I-38Bishop Creek Reservoir, I-40climate, I-40erosion, I-41grazing, I-41halogeton, I-41history, I-39Metropolis, I-40plant cover, I-41precipitation, I-41White Winter, I-39
MarzenColonel Joseph, I-73
Metropolis, I-9, I-40

Humboldt River Chronology—Part I DIVISION OF WATER PLANNING
I–150 Nevada Water Basin Information and Chronology Series
dryland farming, I-9Metropolis Reservoir, I-40Midas (Gold Circle) District, I-63Miller & Lux, I-69mine dewatering, I-21, I-94
cone of depression, I-21, I-94current period effects, I-21, I-95long-term effects, I-21, I-95State Engineer, I-21, I-95surface water discharges, I-95water quality, I-95Water temperature differentials, I-95
mine pit lakes, I-94mining, I-86
Austin, I-87Betze-Post Mine, I-94Big Six Mining Company, I-89boom-to-bust cycle, I-87Bullion, I-88Carlin, I-89Carlin Trend, I-89, I-94Clifton, I-87Cope Mining District, I-88demonetization of silver, I-88Getchell Gold Trend, I-90Getchell Mine, I-89Golconda, I-88Golconda & Western Exploration Company, Ltd., I-88gold and silver valuation, I-90gold prices, I-90Humboldt City, I-87Midas (Gold Circle) Mining District, I-89mineral valuation, I-90number of mining workers, I-90productivity of mining workers, I-90Railroad Mining District, I-88Reese River Valley, I-87Sheba Mine, I-87Star City, I-87Star Mining District, I-87Twenty-Year Depression, I-88Unionville, I-87White Pine Mining District, I-88
Mojave Desert, I-3Murphy
Daniel, I-46, I-102Martin, I-46, I-102
National Pollutant Discharge Elimination System, I-95Nevada Division of Environmental Protection’s (NDEP), I-95
Bureau of Water Pollution Control, I-95Bureau of Water Quality Planning, I-95
Nevada Division of Wildlife, I-25Nevada Revised Statutes, I-19

DIVISION OF WATER PLANNING Humboldt River Chronology—Part I
Nevada Water Basin Information and Chronology Series I–151
Nevada Supreme Court, I-80doctrine of prior appropriation, I-75
North Fork Humboldt River Sub-Basin, I-44area, I-44beaver, I-47history, I-45mining, I-45national forest lands, I-47plant cover, I-47precipitation, I-47range potential, I-46sheep, I-46topography, I-46White Winter, I-46
North Fork of the Humboldt River, I-9, I-45headwaters, I-9
OgdenPeter Skene, I-24, I-51, I-61, I-65, I-67, I-71
Ogden’s River, I-51Oncorhynchus clarki henshawi, I-22open pit mines, I-94Oreana, I-110Oregon Trail, I-39Overland Emigrant Trail, I-8, I-39
Fort Hall route, I-8Overland Pass, I-43Overland Telegraph Company, I-57Owyhee Plateau, I-65Pacific Reclamation Company, I-9, I-40Palisade, I-50, I-51, I-54Palisade Canyon, I-32Paradise City, I-65Paradise Peak, I-66Paradise Valley, I-12, I-65Paul
Joseph, I-51Paul’s River, I-51, I-71Pershing County Water Conservation District, I-24, I-73, I-110Pilot Peak, I-39Pine Creek, I-11Pine Valley, I-11, I-54, I-55
water rights, I-81Pine Valley Sub-Basin, I-53
agriculture, I-54area, I-53history, I-53precipitation, I-54topography, I-54vegetation, I-54White Winter, I-54
PittWilliam C., I-110
Pitt-Taylor Reservoirs, I-85, I-110, I-111

Humboldt River Chronology—Part I DIVISION OF WATER PLANNING
I–152 Nevada Water Basin Information and Chronology Series
archeological and paleontological sites, I-112Pleistocene Epoch, I-2, I-4, I-105, I-116, I-133
animal species, I-116climatic conditions, I-116Wisconsin Age, I-4
Pony Express, I-57Potosi Mining District, I-63prior appropriation, I-75Promontory Summit (Point), I-61Pumpernickel Valley, I-69Pyramid Lake, I-134Quinn River, I-65rain-shadow, I-4rangeland conditions, I-126Red House, I-11Reese
John, I-57Reese River, I-11
peak flood discharge, I-33water rights, I-81
Reese River Sub-Basin, I-56, I-102agriculture, I-58area, I-56history, I-57hydrographic areas, I-56precipitation, I-59topography, I-58transition zone, I-59vegetation, I-59
Reese River Valley, I-11, I-57, I-102riparian water rights, I-76river productivity, I-29
Carson River, I-29Humboldt River, I-29Truckee River, I-30Walker River, I-30
Roberts Creek Mountain, I-11, I-54Roberts Mountains, I-11, I-54Rocky Mountains, I-3Rogers Dam, I-111Ruby Dome, I-43Ruby Mountains, I-8, I-43Ruby Mountains Sub-Basin, I-42
area, I-42drainages, I-42Harrison Pass, I-43history, I-42Huntington Valley, I-43Overland Pass, I-43plant cover, I-44precipitation, I-44topography, I-43
Ruby Valley, I-43

DIVISION OF WATER PLANNING Humboldt River Chronology—Part I
Nevada Water Basin Information and Chronology Series I–153
Rye Patch Dam, I-111Rye Patch Meadows, I-12, I-71Rye Patch Reservoir, I-12, I-24, I-71, I-86, I-108
capacity, I-111drought period of 1888-89, I-109Humboldt Project, I-109Lovelock Irrigation District, I-110Pershing County Water Conservation District, I-110surface area, I-111surface water elevation, I-111U.S. Bureau of Reclamation, I-110water rights transfers, I-111water supply, I-111
sagebrush clipper, I-54Salmo clarkii henshawi, I-22Sand Dunes, I-12, I-64, I-66Santa Rosa Mountain Range, I-64, I-66Santa Rosa Peak, I-66Santa Rose Range, I-8Senate Bill 108, I-19Sheep Creek Range, I-60Shoshone Mountains, I-8Shoshone Range, I-59Sierra Club, I-25Sierra Nevada, I-3Simpson
Captain J.H., I-57Snake (Columbia) River Basin, I-6Snake River Basin, I-65snowpack equivalent water content, I-128
El Niño event, I-131La Niña period, I-131watersheds of northern Nevada, I-131
Snowstorm Mountains, I-60Sonoma Peak, I-69Sonoma Range, I-69Sonoma Reach Sub-Basin, I-66
agriculture, I-68area, I-67history, I-67hydrographic areas, I-67precipitation, I-69topography, I-69vegetation, I-69
Sonoran Desert, I-3South Fork of the Humboldt River, I-9, I-44, I-51South Fork Reservoir, I-10, I-83Southern Pacific Railroad, I-40Sparks & Tinnen, I-102Star City, I-72State Engineer, I-19, I-77, I-79, I-110Stauffer & Sweetser, I-69Steptoe

Humboldt River Chronology—Part I DIVISION OF WATER PLANNING
I–154 Nevada Water Basin Information and Chronology Series
Colonel E.J., I-43, I-57Stevens-Murphy-Townsend wagon train, I-46, I-102Stone House, I-24sub-basins
Battle Mountain, I-60Elko Reach, I-50Little Humboldt River, I-64Lovelock Reach, I-70Maggie Creek, I-47Mary’s River, I-38North Fork Humboldt River, I-44Pine Valley, I-53Reese River, I-56Ruby Mountains, I-42Sonoma Reach, I-66
Susie Creek, I-48Swampy River, I-51, I-71Talbot
Theodore, I-43Talcott
William, I-58tall whitetop, I-106
biodiversity, I-106eradication, I-107erosion, I-106extent, I-107flower arrangements, I-107introduced, I-108river banks, I-106sighting, I-107suppression, I-108wildlife habitat, I-106
TaylorJohn G., I-110
Taylor Grazing Act, I-69Texas longhorn cattle, I-102The Flood of 1997, I-131Thousand Springs Valley, I-39, I-43, I-51Toiyabe Dome, I-56Toiyabe Dome Southeast Summit, I-56Toiyabe Forest Reserve, I-58Toiyabe Mountains, I-8, I-11Toiyabe National Forest, I-124Toiyabe Range, I-56, I-59Toiyable National Forest, I-58Toulon Drain, I-13Toulon Lake, I-13
Toulon Drain, I-13transcontinental railroad, I-1Truckee River, I-30, I-72Tuscarora Mountains, I-10, I-48, I-60, I-63Twenty-Year Depression, I-88U.S. Army Corps of Engineers, I-1, I-24

DIVISION OF WATER PLANNING Humboldt River Chronology—Part I
Nevada Water Basin Information and Chronology Series I–155
U.S. Bureau of Land Management, I-49U.S. Bureau of Reclamation, I-24, I-73, I-109U.S. Fish and Wildlife Service, I-22U.S. Geological Survey, I-7, I-34
Humboldt Hydrology website, I-96Hydrologic Unit Classification Code, I-34
U.S. Interstate 80., I-1U.S. Reclamation Service, I-110U.S. Topographic Engineers, I-57Unionville, I-68, I-72University of Nevada, Reno, Cooperative Extension, I-107Unknown River, I-51, I-65, I-71Upper and Lower Pitt-Taylor Reservoirs, I-85upper Humboldt River Basin, I-7, I-36
area, I-7, I-8distance, I-10drainage areas, I-8hydrographic areas, I-8meanders, I-8snowpack equivalent water content, I-128sub-basins, I-8water rights, I-80
USGS Humboldt Hydrology website, I-96Utica Bullion Mining Company, I-87W.T. Jenkins Company, I-49, I-62Walker
John, I-102Joseph, I-43, I-71
Walker Lake, I-134Walker River, I-30Walton
Izaak, I-23Wasatch Mountains, I-4Water Act
1889, I-76Water Pollution Control Law, I-95water storage facilities, I-16, I-83
Bishop Creek Reservoir, I-83Chimney Reservoir, I-85Lone Tree (Mine) Cooling Ponds, I-85Maggie Creek Dam/Reservoir, I-84Pitt-Taylor Reservoirs, I-85Rye Patch Reservoir, I-86South Fork Reservoir, I-83T-S Ranch Dam and Reservoir, I-84Willow Creek Reservoir, I-84
water-related issuesinterbasin transfers, I-19mine dewatering, I-14open-range grazing, I-14storage capacity, I-14uncertain stream flows, I-14variable climate, I-14

Humboldt River Chronology—Part I DIVISION OF WATER PLANNING
I–156 Nevada Water Basin Information and Chronology Series
WatermanThomas, I-102
Wells, I-8, I-51White Plains Summit, I-73White Winter, I-39, I-46, I-49, I-54, I-65, I-77, I-103, I-109
livestock losses, I-39wildfires, I-63, I-117
burned acreage, I-117counties, I-117
Willow Creek, I-61Willow Creek Reservoir, I-61, I-84Wingfield
George, I-89Winnemucca, I-12, I-68Wisconsin Age, I-4, I-133Woodruff & Ennor, I-48Work
John, I-61Young Dam, I-111

DIVISION OF WATER PLANNING Humboldt River Chronology—Part I
Nevada Water Basin Information and Chronology Series I–157
1. Eakin, Thomas E., and Robert D. Lamke, Hydrologic Reconnaissance of the Humboldt River Basin, Nevada,Water Resources Bulletin No. 32, Nevada Department of Conservation an Natural Resources, Carson City, Nevada,1966, page 17.2. “Flood Control Survey Report on Humboldt River and Tributaries, Nevada,” Department of the Army, Corpsof Engineers, Sacramento District, Sacramento, California, September 15, 1948, page 4.3. The approximate percentage shares of the Humboldt River Basin made up by these counties are as follows: ElkoCounty – 42.2%; Lander County – 13.1%; Eureka County – 9.0%; Pershing County – 13.0%; Humboldt County– 20.3%; White Pine County – 1.6%; Churchill County 0.3%; and Nye County – 0.6%. The approximatepercentage share of each county’s total area which is contained within the Humboldt River Basin is as follows: ElkoCounty – 40%; Lander County – 38%; Eureka County – 35%; Pershing County – 35%; Humboldt County – 34%;White Pine County – 3%; Churchill County 1%; and Nye County – 0.5%. See “Humboldt River Drainage Basin,A Cooperative State-Federal Report on Water Pollution Control,” Nevada State Department of Health, Division ofPublic Health Engineering, Carson City, Nevada, June 1952, page 6.4. The U.S. Geological Survey (USGS), Water Resources Division (WRD), and the Nevada Division of WaterResources, Department of Conservation and Natural Resources, have divided the state into discrete hydrologic unitsfor water planning and management purposes. These have been identified as 232 Hydrographic Areas (256 areasand sub-areas, combined) within 14 major Hydrographic Regions or Basins. These hydrographic regions, areas andsub-areas are discussed more extensively in the Division of Water Planning’s Water Words Dictionary, EighthEdition, Nevada Division of Water Planning, Department of Conservation and Natural Resources, Carson City,Nevada.5. A drainage area is defined as that area, measured in a horizontal plane, enclosed by a topographic (drainage)divide from which direct surface runoff from precipitation or snowpack runoff normally drains by gravity into thestream above the specified point. See Water Words Dictionary, op. cit.6. These are referred to as designated groundwater basins (i.e., hydrographic areas or sub-areas) which are areaswhere permitted ground water rights approach or exceed the estimated average annual recharge (or perennial yield)and the water resources are being depleted or require additional administration. Under such conditions, and in theinterest of public welfare, the Nevada State Engineer, Division of Water Resources, Department of Conservationand Natural Resources, is authorized by statute (Nevada Revised Statute 534.120) and directed to designate agroundwater basin and declare preferred uses within such designated basin (e.g., municipal and industrial, domestic,agriculture, etc.). The State Engineer has additional authority in the administration of the water resources withina designated groundwater basin. Source: Office of the State Engineer, Nevada Division of Water Resources,Department of Conservation and Natural Resources, Carson City, Nevada.7. Houghton, Samuel G., A Trace of Desert Waters: The Great Basin Story, University of Nevada Press, Reno,Nevada, 1994 (reprint of Second Edition; First Edition printed in 1976), page 23.8. In its most general sense, the term hydrographic area (or sub-area) may refer to an defined geographic area, sub-area, sub-basin, basin, region or watershed encompassing the drainage area or catchment area of a stream, itstributaries, or a portion thereof. Typically defined as a study area for analysis or planning purposes in which theland or undersea contours results in surface water flows or measures of elevation draining to a single point. At itssmallest extent, a hydrographic area may encompass a single valley containing a single stream system, or a portionof a valley or stream system with distinctive drainage characteristics. At its greatest extent, a hydrographic areamay encompass the entire drainage area of a major river system, e.g., the Mississippi River hydrographic area,including all tributary rivers, streams and other sources of surface water flow. Conventionally, a number ofhydrographic sub-areas comprise a hydrographic area whereas a number of hydrographic areas comprise ahydrographic basin or region. See Water Words Dictionary, op. cit.9. Padre Pedro Font gave the name Sierra Nevada to the mountain range on the eastern fringe of Spanish Californiain 1776. Sierra means mountains in Spanish and Nevada means snow-covered. Consequently, the name “SierraNevada” means snow-covered mountains and terms such as Sierra Nevada Mountains (snow-covered mountainsmountains) or Sierra Mountains (mountains mountains) are redundant and therefore not strictly appropriate. Theterm Sierra Nevada range may also be used. Communication, Guy Rocha, Nevada State Historian, Carson City,Nevada, December 1999.
Notes to Part I:

Humboldt River Chronology—Part I DIVISION OF WATER PLANNING
I–158 Nevada Water Basin Information and Chronology Series
10. The Northwest Region covers 3,052 square miles (7,905 square kilometers or 1,953,280 acres) in Nevadaconsisting of northern Washoe and Humboldt counties and encompasses 16 hydrographic areas; also extends intothe State of California to the west and the State of Oregon to the north.11. The Black Rock Desert Region covers 8,632 square miles (22,357 square kilometers or 5,524,480 acres) inNevada consisting of parts of Washoe, Humboldt, and Pershing counties and includes 17 valleys (hydrographicareas), two of which are divided into two hydrographic sub-areas each; also extends into the State of California tothe west and the State of Oregon to the north.12. The Humboldt River Basin covers over 16,843 square miles (43,623 square kilometers or 10,779,520 acres)in Nevada consisting of parts of eight counties—Elko, White Pine, Eureka, Humboldt, Lander, Nye, Pershing, andChurchill—and the largest stream (Humboldt River) wholly within Nevada. This basin contains 33 hydrographicareas and one hydrographic sub-area; this basin is one of only two hydrographic regions that are wholly containedwithin the State of Nevada.13. The Great Salt Lake Basin covers 3,807 square miles (9,860 square kilometers or 2,436,480 acres) in Nevadaconsisting of the easternmost portions of Elko, White Pine, and Lincoln counties. It consists of eight hydrographicareas, one of which is divided into four hydrographic sub-areas; extends to the east into the State of Utah.14. Grayson, Donald K. The Desert’s Past: A Natural Prehistory of the Great Basin, Smithsonian Institution Press,Washington, D.C., 1993, page 18.15. Brussard, Peter F., David A. Charlet, and David S. Dobkin, “Regional Trends of Biological Resources – GreatBasin”, Status and Trends of the Nation’s Biological Resources, Volume 2, U.S. Geological Survey, U.S.Department of the Interior, U.S. Government Printing Office, Washington, D.C., 1998, page 506.16. Grayson, op. cit.17. Ricketts, Taylor H., Eric Dinerstein, David M. Olson, and Colby Loucks, “Who’s Where in North America?”,BioScience, Volume 49, Number 5, May 1999.18. Brussard, op. cit., pages 506.19. Ibid., pages 505-506.20. Ibid., page 507.21. Humboldt River Basin, Nevada, Water and Related Land Resources, Report Number Three, Ruby MountainsSub-Basin, Nevada Department of Conservation and Natural Resources and the U.S. Department of Agriculture,May 1963, pages 7-9.22. Grayson, op. cit., page 46.23. About 13,800 year ago, Lake Lahontan, covering a highly irregular portion of northwestern Nevada and spillingover into eastern California (Honey Lake Basin), attained a maximum surface elevation of approximately 4,380 feet(1,335 meters) above mean sea level (MSL), reached a maximum depth of about 900 feet (274 meters) at PyramidLake and a maximum surface area of some 8,665 square miles (5,545,580 acres or 22,440 square kilometers). SeeGrayson, op. cit., pages 92 and 95.24. About 16,000 year ago, Lake Bonneville in western Utah, and spilling over into eastern Nevada, attained amaximum surface elevation of approximately 5,090 feet (1,551 meters) above mean sea level (MSL) and a maximumsurface area of some 19,970 square miles (12,780,750 acres or 51,720 square kilometers). See Grayson, op. cit.,pages 85, 88 and 90.25. Brussard, op. cit., page 507.26. Ibid., page 511.27. USGS Gaging Station 10322500, Humboldt River at Palisade, Nevada — Location: Latitude 40E36'25",longitude 116E12'05", in SE 1/4 SE 1/4 section 35, T.32 N., R.51 E., Eureka County, Hydrologic Unit 16040101[see explanation of USGS Hydrologic Units Part 1 of this chronology], on right bank, 0.2 miles downstream fromSouthern Pacific Railroad bridge, 0.5 miles downstream from Palisade, and 0.8 miles upstream from Pine Creek;Drainage Area: 5,010 square miles, approximately; Period of Record: October 1902 to October 1906, and July 1911to current year. Monthly discharge only for some periods published in Water Resource Publication (WRP) 1314;Revised Records: WSP 1514, 1903-04, 1912, 1914; Gage: Water-stage recorder. Datum of gage is 4,825.55 feetabove mean sea level. Prior to April 1, 1939, non-recording gages (water-stage recorder April 22 to June 3, 1935)at several sites within 0.5 miles of present site at various datums; Remarks: No estimated daily discharges. Recordsgood. Diversions for irrigation above station. See schematic diagram [contained in this publication] of HumboldtRiver Basin; Extremes for Period of Record: Maximum discharge, 7,870 cfs, May 18, 1984, gage height, 10.08 feet.Minimum daily discharge, 2.0 cfs, August 25-28, 1931; Extremes Outside Period of Record: Maximum stage

DIVISION OF WATER PLANNING Humboldt River Chronology—Part I
Nevada Water Basin Information and Chronology Series I–159
known, about 17 feet above present datum, about February 28, 1910, from photographs and written statements ofresident witnesses; discharge about 17,000 cfs; Extremes for Current [1998] Water Year: Maximum discharge, 3,320cfs, June 12, 1998, gage height, 6.69 feet. Minimum daily discharge, 78 cfs, October 2, 1998. Source: WaterResources Data, Nevada, Water Year 1998, Water-Data Report NV-98-1, U.S. Geological Survey, Water ResourcesDivision, Nevada District Office, U.S. Department of the Interior, Carson City, Nevada, 1999.28. Eakin, op. cit., pages 17-18.29. The term “average” or “normal” water year denotes the average annual hydrologic conditions based upon anextended or existing period of record. Because precipitation, runoff, and other hydrologic variables vary from yearto year, planners typically project future scenarios based on hydrologic conditions that generally include average,wet (high-water), and drought (low-water) years. See Water Words Dictionary, op. cit.30. The Great Basin, whose unique inward-draining characteristics were first recognized by John C. Frémont,represents an area covering most of Nevada and much of western Utah and portions of southern Oregon and easternCalifornia consisting primarily of arid, high elevation, desert valleys, sinks (playas), dry lake beds, and salt flats.The Great Basin is characterized by the fact that all surface waters drain inward to terminal lakes or sinks. Foradditional references on this region, see Grayson, Houghton, Fiero and Trimble.31. Sometimes this easternmost reach of the Humboldt River above Halleck, Nevada, and the confluence withLamoille Creek has been referred to as the East Fork of the Humboldt River. For purposes of this publication, thisportion of the river below Wells is referred to simply as the Humboldt River (main stem).32. Humboldt River Basin, Nevada, Water and Related Land Resources, Report Number Four, op. cit., pages 3-4.33. Dam safety records, Office of the State Engineer, Nevada Division of Water Resources, Department ofConservation and Natural Resources, Carson City, Nevada, November 1999.34. Humboldt River Basin, Nevada, Water and Related Land Resources, Report Number Twelve, op. cit., page 11.35. Nevada State Demographer’s Office, University of Nevada, Reno, July 1, 1998 township population estimates.36. Ibid.37. Alternative Plans for Water Resource Use, Humboldt River Basin Area III, prepared by State of Nevada,Division of Water Resources, State Engineer’s Office, Carson City, Nevada, February 1974, page 838. For the Truckee, Carson and Walker River systems this represents a combined total of approximately 98,000irrigated acres above these respective river’s peak or maximum flow points as compared to between 150,000 to200,000 irrigated acres on the Humboldt River above Palisade. See the section entitled “Humboldt River BasinSelected Gaging Station River and Stream Flows” later in this part. Also see Horton, Truckee River Chronology,Carson River Chronology, and Walker River Chronology.39. Nevada State Water Plan, 1999, Nevada Division of Water Planning, Department of Conservation and NaturalResources, Carson City, Nevada, April 1999, Part 3, Section 1, pages 1C-1 through 1C-11. The 1999 water planwas published in five volumes: (1) Summary; (2) Part 1, Background and Resource Assessment; (3) Part 2, WaterUse and Forecasts; (4) Part 3, Water Planning and Management Issues; and (5) Appendices.40. Section 4 of Senate Bill 108 provided for the revision to NRS 533.370 by requiring that “In determining whetheran application for an interbasin transfer of ground water must be rejected pursuant to this section, the state engineershall consider: (a) Whether the application has justified the need to import the water from another basin; (b) If thestate engineer determines that a plan for conservation of water is advisable for the basin into which the water is tobe important, whether the applicant has demonstrated that such a plan has been adopted and is being effectivelycarried out; (c) Whether the proposed action is environmentally sound as it relates to the basin from which the wateris exported; (d) Whether the proposed action is an appropriate long-term use which will not unduly limit the futuregrowth and development in the basin from which the water is exported; and (e) Any other factor the state engineerdetermines to be relevant.”41. Cobourn, John, Wayne Johnson, Jean Ford, Mary Reid and Niel Allen, “Nevada’s Water Future: MakingTough Choices, A Guide for Public Policy Dialogue,” National/Nevada Issues Forums, University of Nevada, Reno,December 1992.42. The Lahontan Basin refers to the drainage area of Lake Lahontan, an Ice Age which covered approximately8,665 square miles in northwestern Nevada, eastern California and southeastern Oregon. Lake Lahontan’s totaldrainage area covered about 45,000 square miles. See Coffin, Patrick D., and William F. Cowan, LahontanCutthroat Trout Recovery Plan, U.S. Fish and Wildlife Service, Region 1, U.S. Department of the Interior,Portland, Oregon, 1995, page 4.43. Coffin, op. cit., pages 1-2.

Humboldt River Chronology—Part I DIVISION OF WATER PLANNING
I–160 Nevada Water Basin Information and Chronology Series
44. “Bring Back the Lahontan Cutthroat [Trout],” U.S. Fish and Wildlife Service, Nevada State Office, U.S.Department of the Interior, Reno, Nevada.45. Houghton, Samuel G., A Trace of Desert Waters: The Great Basin Story, University of Nevada Press, Reno,Nevada, 1994, page 81.46. Frémont, John Charles, Report of the Exploring Expedition to the Rocky Mountains, 1842, and to Oregon andNorth California, 1843–44, Washington, D.C., Gales & Seaton, 1845.47. Extinction deals with the total removal of a species, while extirpation deals with its demise or removal froma particular area or habitat. Personal communication, Glenn Clemmer, Administrator, Nevada Natural HeritageProgram, Department of Conservation and Natural Resources, Carson City, Nevada, October 1999.48. Izaak Walton – 1593-1683. English biographer and author. Carried on draper’s business in London (from1614); retired from London to Stafford (circa 1650). Published biographies of John Donne (1640), Sir Henry Wotton(1651), Richard Hooker (1665), George Herbert (1670), and Bishop Robert Sanderson (1678). His masterpiece wasThe Compleat Angler, or The Contemplative Man’s Recreation (1st edition, 1653; 5th edition, 1676), made up ofdialogues between Piscator (angler), Venator (hunter), and Auceps (falconer), with anecdotes, quotations, countryscenery, snatches of verse, enlarged by appending of part two by Charles Cotton on fly-fishing and making flies.49. A common “fishing” practice was to divert the stream or river onto an adjoining field and then merely pick upthe stranded fish both in the field and in the stream bed below the diversion.50. McQuivey, Robert, “Nevada Environmental, Water, Habitat, Wildlife and Fisheries Historical MediaDatabase,” Reno, Nevada, 1999.51. It is not certain that this name survived. Presently, three high peaks may be found near the Reese Riverheadwaters: Arc Dome, 11,788 feet MSL; Toiyabe Dome, 11,353 feet MSL; and Mahogany Mountain, 11,165 feetMSL.52. McQuivey, op. cit.53. “Bring Back the Lahontan Cutthroat [Trout],” op. cit.54. Ibid.55. Personal communication, Doug Hunt, Habitat Bureau Chief, Nevada Division of Wildlife, Reno, Nevada,January 26, 2000.56. NDOW Briefing Paper, July 19, 1999, op. cit.57. Central Nevadan, Battle Mountain, July 25, 1889, from McQuivey, op. cit.58. Central Nevadan, Battle Mountain, May 7, 1891, from McQuivey, op. cit.59. The actual date of the original repayment contract between the U.S. Bureau of Reclamation and the PershingCounty Water Conservation District, Contract IIr-774, was October 1, 1934. The Humboldt Project was authorizedpursuant to the National Industrial Recovery Act of June 16, 1933 and the National Reclamation Act of 1902. Theproject’s major component, Rye Patch Reservoir, was completed in 1936. Personal communication, Mike Andrews,U.S. Bureau of Reclamation, Lahontan Region Projects Office, Carson City, Nevada, July 6, 2000.60. The water rights obtained for the Humboldt Project came largely from the purchase of ranches owned by theAldous family (purchased on January 17, 1935) and the Fillipini family (purchased on January 26, 1935). Waterrights from five other ranches were also purchased in the Battle Mountain area, but those owners retained the surfacewater rights. The issue of ownership of the Battle Mountain Community Pasture has repeatedly surfaced,particularly most recently with the efforts of the Pershing County Water Conservation District to obtain ownershipof the Humboldt Project. With respect to the purchase of these ranches, the PCWCD’s original role was to negotiateprices and secure options to purchase from the landowners. All options to purchase were assigned to the U.S.Government and the deeds have been recorded with the U.S. Government. The original 1934 contract between theU.S. Bureau of Reclamation and PCWCD was not a contract-for-deed, and therefore, according to BOR sources,the BOR has no authority to transfer title; only Congress and the President can effect that. Personal communication,Mike Andrews, op. cit.61. Rawlings, op. cit., page 47.62. An alternative source has placed the area of this particular marsh at 2,040 acres. See Battle Mountain Bugle,September 3, 1996.63. An alternative source has placed the area of this particular marsh at 560 acres. See Battle Mountain Bugle,September 3, 1996.64. Plat Maps, Survey General’s Office, State of Nevada, May 12, 1869, op. cit.

DIVISION OF WATER PLANNING Humboldt River Chronology—Part I
Nevada Water Basin Information and Chronology Series I–161
65. Rawlings, op. cit., page 47.66. While the issue of the disposition of the Community Pasture was already contentious in the 1960’s (the U.S.Bureau of Reclamation had even considered the idea of surplusing the property to GSA for disposal), the PershingCounty Water Conservation District did not actually make their final payment on the original contract until fiscalyear 1978. Personal communication, Mike Andrews, op. cit.67. U.S. Bureau of Reclamation Rehabilitation & Betterment Contract, August 22, 1975, personal communication,Mike Andrews, op. cit.68. The firm hired was HYA Consulting Engineers, a Dames & Moore Company based in Sacramento, California.See Lovelock Review-Miner, December 12, 1996.69. Battle Mountain Bugle, October 29, 1996.70. The principal participants (aside from the U.S. Bureau of Reclamation, Pershing County Water ConservationDistrict and the Nevada Division of Wildlife) included the following (in alphabetical order): Argenta MarshCommittee, Battle Mountain Shoshone Tribe, Coalition for Nevada’s Wildlife, Ducks Unlimited, Elko Countyconservation Association, Great Basin Bassers, Great Basin Bird Observatory, Intermountain West Joint Venture,Lahontan Audubon Society, Lahontan Valley Wetlands Coalition, Lander County Commission, (The) NatureConservancy, Nevada Bighorns Unlimited, Nevada Farm Bureau, Nevada State Council of Trout Unlimited, NevadaWildlife Federation, Newmont Gold Company, Rocky Mountain Elk Foundation, Sierra Club and Truckee RiverFly Fishers. Source: Personal communication, Doug Hunt, Habitat Bureau Chief, Nevada Division of Wildlife,Reno, Nevada, February 11, 2000.71. NDOW Briefing Paper, July 19, 1999, op. cit.72. The only project lands that the Pershing County Water Conservation District would actually be entitled to undercurrent title transfer policy would be the acquired lands, unless PCWCD wanted to purchase some of the withdrawnlands (lands withdrawn from the public domain for project purposes) at fair market value. That issue would haveto be addressed in legislation. Personal communication, Mike Andrews, op. cit.73. Personal communication, Doug Hunt, Habitat Bureau Chief, Nevada Division of Wildlife, January 24, 2000.74. The “average water year flows” represents a term denoting the average annual hydrologic conditions based uponan extended or existing complete period of record. Also referred to as the “Average Water Year”. See Water WordsDictionary, op. cit.75. The “Low Water Year” represents the lowest total annual volume (in acre-feet per year) and the correspondinglowest annual average rate of flow (in cubic feet per second) recorded at a specific gaging station location over aspecific period of record. See Water Words Dictionary, op. cit.76. The “High Water Year” represent the highest total annual volume (in acre-feet per year) and the correspondinghighest annual average rate of flow (in cubic feet per second) recorded at a specific gaging station location over aspecific period of record. See Water Words Dictionary, op. cit.77. It should be noted that the years of record indicated in these tables for each gaging station are inclusive fullyears and are not necessarily reflective of continuous gaging periods. For example, while the period of record forthe Humboldt River gage at Battle Mountain (USGS gage number 10325000) is listed as 1897 through 1998, theactual record is May 1896 to December 1897, March 1921 to April 1924, October 1945 to September 1981, andFebruary 1991 to the current (1998) year. See Water Resources Date, Nevada, Water Year 1998, Water-Data ReportNV-98-1, U.S. Geological Survey, page 222.78. The “peak” or “maximum” flow concept used here is not to be confused with any high water or flood year flowmeasure. The average year peak flow represents the river’s maximum rate of flow along its entire reach for anormal or average water year period of record. In essence, this location on the river represents the point after whichriver flows begin to decrease (attenuate) due to lack of tributary inflows, evaporation, seepage, infiltration,diversions, evapotranspiration, etc.79. Taken at USGS gage 10311000, Carson River at Carson City, period of record 1940-1998. Actually, USGSgage 10311400, Carson River at Deer Run Road near Carson City, has shown a significantly greater average yearpeak flow (389,500 acre-feet per year); however, this gage’s period of record is only for 1979-1998, making itsrecord less representative of actual, long-term average-year Carson River flow conditions.80. Taken at USGS gage 10293000, East Walker River near Bridgeport, California, below Bridgeport Reservoir(107,150 acre-feet per year), for period of record 1922-1998, and USGS gage 10296500, West Walker River nearColeville, California, above Topaz Reservoir (203,440 acre-feet per year), for period of record 1903-1998.

Humboldt River Chronology—Part I DIVISION OF WATER PLANNING
I–162 Nevada Water Basin Information and Chronology Series
81. Taken at USGS gage 10350000, Truckee River at Vista, Nevada, just downstream from entrance of SteamboatCreek (and the outflows from Truckee Meadows Water Reclamation Facility), for period of record 1899-1998.82. This figure was derived by taking the combined water productivity coefficient for the western Nevadawatersheds of 136.7095 acre-feet of peak flows per square mile of total surface area (1,211,930 acre-feet dividedby 8,865 square miles) and dividing it by the Humboldt River Basin’s water productivity coefficient of 17.2796 acre-feet of peak flows per square mile of total surface area (291,040 acre-feet divided by 16,843 square miles), yieldinga ratio of 7.9116.83. This figure was derived by dividing the combined western Nevada watershed’s adjusted water productivity ratioof 414.3350 acre-feet per year per square mile of actual drainage area (1,211,930 acre-feet divided by 2,925 squaremiles of actual upstream drainage area) by the Humboldt River’s adjusted water productivity factor above Palisadeof 58.0918 acre-feet per year per square mile of actual drainage area (291,040 acre-feet divided by 5,010 squaremiles of upstream drainage), resulting in a ratio of 7.1324.84. Blakemore, Thomas E., H.W. Hjalmarson, and S.D. Waltemeyer, Methods for Estimating Magnitude andFrequency of Floods in the Southwestern United States, U.S. Geological Survey Water-Supply Paper 2433, 1993,page 122.85. Ibid., page 142.86. Calculated by multiplying the total surface area in square miles, times 640 acres per square miles, timesprecipitation in feet, thereby providing an estimate of surface precipitation in acre-feet.87. For the Truckee River, irrigation diversions above the peak flow point are made within the Truckee Meadowsfor less than 20,000 acres; within the Carson River, diversions are made above the peak flow point within CarsonValley for just over 30,000 acres; and within the Walker River system, diversion are made above the East Fork’speak flow point in Bridgeport Valley above Bridgeport Reservoir for about 28,000 acres and above the West Fork’speak flow point in Antelope Valley for about 20,000 acres. This represents a combined total of approximately98,000 irrigated acres above these respective river’s peak flow points. See Horton, Truckee River Chronology,Carson River Chronology, and Walker River Chronology.88. Included are totals for the Mary’s River sub-basin, Ruby Mountains sub-basin, North Fork Humboldt River sub-basin, Maggie Creek sub-basin and the Elko Reach sub-basin. Humboldt River Basin, Nevada, Water and RelatedLand Resources, various reports, op. cit.89. Consumptive use is that portion of water withdrawn from a surface or groundwater source that is consumed fora particular use (e.g., irrigation, domestic needs, and industry), and does not return to its original source or anotherbody of water. See Water Words Dictionary, op. cit.90. The irrigation leaching requirement is the theoretical amount of irrigation water that must pass (leach) throughthe soil beyond the root zone to keep soil salinity within acceptable levels for sustained crop growth. See WaterWords Dictionary, op. cit.91. Water withdrawal measures presented in these estimates include return flows and water reuse, while decreedwater rights are generally for a specified water duty applied to decreed land and typically represent consumptive useonly. Actual water diversions for irrigation will normally include a “leaching” requirement in addition to theconsumptive use requirement. Also, these latter figures are somewhat over-stated as a relatively small portion ofthe Elko County acreage and irrigation figures are for areas lying entirely outside the Humboldt River Basin or arewithin the Battle Mountain sub-basin of western Elko County and are located in drainage areas below the Palisadegage.92. See “Nevada Water Supply and Use,” U.S. Geological Survey Water-Supply Paper 2350 and other issues, U.S.Department of the Interior, Water Resources Division, Carson City, Nevada; U.S. Census of Agriculture, 1987,Volume 1, Geographic Area Series, Nevada and County Data, U.S. Department of Commerce, Bureau of theCensus, Agriculture Division, Washington, D.C., June 1989; and Nevada State Water Plan, Nevada Division ofWater Planning, Department of Conservation and Natural Resources, Carson City, Nevada, April 1999.93. Palisade Canyon, just downstream from the present-day site of Carlin, was a major impediment to earlyemigrant wagon trains. Most of the early wagon trains detoured around this rugged canyon to the north over partof the Tuscarora Range along a trail which now parallels present-day Interstate Highway 80. John Hawkins Clarknoted in his diary in 1852: “The mountains we are crossing [Tuscarora Range] today stands at right angles with ourroad and cuts the valley of the Humboldt [River] into two separate divisions, making an upper and lower Humboldt[River] Valley.” See Curran, Harold, Fearful Crossing – The Central Overland Trail Through Nevada, Great BasinPress, Reno, Nevada, 1982, pages 88-89.

DIVISION OF WATER PLANNING Humboldt River Chronology—Part I
Nevada Water Basin Information and Chronology Series I–163
94. The Federal Emergency Management Agency (FEMA) has estimated that the peak flood discharge of the ReeseRiver, at 8,620 cubic feet per second for a 100-year flood event (the recurrence interval), is nearly 15 percent largerthan that flood discharge of the Humboldt River at the Battle Mountain gaging station, which was estimated to be7,510 cubic feet per second for a 100-year flood event. FEMA has estimated that the peak discharges for these tworiver systems for different predicted recurrence intervals are as follows: (1) Reese River, drainage area – 2,330square miles; peak discharge: 10-year flood – 3,960 cfs; 50-year flood – 6,870 cfs; 100-year flood – 8,620 cfs; and500-year flood – 12,600 cfs. (2) Humboldt River at the Battle Mountain gage, drainage area – 8,870 square miles;peak discharge: 10-year flood – 3,680 cfs; 50-year flood – 6,270 cfs; 100-year flood – 7,510 cfs; and 500-year flood– 10,700 cfs. See “Flood Insurance Study,” Lander County, Nevada (Unincorporated Areas), Federal EmergencyManagement Agency, July 15, 1988, page 10.95. Eakin, op. cit., page 36.96. Cohen, Philip, Water in the Humboldt River Valley Near Winnemucca, Nevada, Water Resources Bulletin No.27, Department of Conservation and Natural Resources, State of Nevada, Prepared in Cooperation with the U.S.Geological Survey, Department of the Interior, Carson City, Nevada, 1964, page 30.97. USGS gaging station number 10329000, Little Humboldt River near Paradise Valley, Nevada.98. USGS gaming station number 10329500, Martin Creek near Paradise Valley, Nevada.99. Personal communication, Jack L. Boyd, Halleck, Nevada, May 22, 2000.100. Due to their relatively shorter periods of record (1935-1998 and 1936-1998, respectively), readings for theImlay and Lovelock Valley USGS gages tend to be overstated, i.e., they should be smaller as their periods of recorddo not include the extreme drought period of the early 1930’s. The readings for these two gages do, however,correspond to the period of construction of Rye Patch Reservoir.101. See Seaber, Paul R., F. Paul Kapinos, and George L. Knapp, Hydrologic Unit Maps, USGS Water-SupplyPaper 2294, U.S. Geological Survey, U.S. Department of the Interior, U.S. Government Printing Office,Washington, D.C., 1987.102. These eleven sub-basin definitions, derived from the 12-volume study referenced below, generally follow, butare not always exactly the same as, the defined Nevada hydrographic areas, which constitute smaller hydrologic unitswithin Nevada’s fourteen hydrographic regions or basins, of which the Humboldt River Basin is Hydrographic Basin4. Where differences existed between these sub-basin classifications and the defined Nevada hydrographic areas,the hydrographic area boundaries were used instead. See the 12-volume series Humboldt River Basin, Nevada,Water and Related Land Resources, based on a cooperative survey by the Nevada Department of Conservation andNatural Resources and the United State Department of Agriculture and prepared by the USDA’s Economic ResearchService, Forest Service and Soil Conservation Service, in the bibliography.103. Mary’s River was one of the first names assigned to the Humboldt River (after “Unknown River”) by PeterSkene Ogden and was named after the Indian wife of one of Ogden’s trappers.104. Humboldt River Basin, Nevada, Water and Related Land Resources, Report Number Four, op. cit., page 11.105. Young, James A., Philip C. Martinelli, Richard E. Eckert, Jr., and Raymond A. Evans, Halogeton: A Historyof Mid-20th Century Range Conservation in the Intermountain Area, Miscellaneous Publication Number 1553,Agricultural Research Service, U.S. Department of Agriculture, August 1999, page 1.106. Humboldt River Basin, Nevada, Water and Related Land Resources, Report Number Twelve, op. cit., page15.107. Ibid., pages 3-4.108. Ibid.109. The Ruby Mountains got its name in September 1854 when a member of Colonel E.J. Steptoe’s detachmentsearching for a feasible military route across central Nevada found “rubies” (actually garnets) in his gold pan whileprospecting one of the streams above Ruby Valley (east side of the Ruby Mountain range) near Hastings Pass (laterrenamed Overland Pass). The range was then named the Ruby Mountains by Colonel Steptoe, replacing the nameHumboldt Mountains assigned by John C. Frémont in 1845 during his Great Basin expedition. See Humboldt RiverBasin, Nevada, Water and Related Land Resources, Report Number Three, op. cit., page 2.110. Some local historians believe that the 1841 Bartleson-Bidwell Party actually crossed the Ruby Mountains notat Harrison Pass, but instead used a trail some two miles north of this location, first called Trail Pass and now RoadPass. (Personal conversation, Cliff Gardner, Ruby Valley, August 1999.)111. Frémont’s first expedition west was conducted in 1842 and left from St. Louis, Missouri, but only got justbeyond South Pass in the northern Rocky Mountains of Wyoming. See Grayson, op. cit., pages 3–4.

Humboldt River Chronology—Part I DIVISION OF WATER PLANNING
I–164 Nevada Water Basin Information and Chronology Series
112. Humboldt River Basin, Nevada, Water and Related Land Resources, Report Number Three, op. cit., page 2.113. Ibid. 114. Ibid., pages 6-7.115. Ibid., page 9.116. Ibid., pages 10-11.117. Humboldt River Basin, Nevada, Water and Related Land Resources, Report Number Five, op. cit., page 1.118. Ibid., page 3.119. Ibid., pages 1-2.120. Ibid., page 4.121. Humboldt River Basin, Nevada, Water and Related Land Resources, Report Number Three, op. cit., page 4.122. Humboldt River Basin, Nevada, Water and Related Land Resources, Report Number Five, op. cit., pages 4-5.123. Ibid., page 9.124. Ibid., pages 9-10.125. Ibid., pages 11-12.126. Humboldt River Basin, Nevada, Water and Related Land Resources, Report Number Six, op. cit., page i.127. Ibid., page 1.
128. Nevada Historical Marker 112, “Carlin,” and Humboldt River Basin, Nevada, Water and Related LandResources, Report Number Six, op. cit., pages 1-2.129. Humboldt River Basin, Nevada, Water and Related Land Resources, Report Number Six, op. cit., page 2.130. Humboldt River Basin, Nevada, Water and Related Land Resources, Report Number Three, op. cit., page 2.131. Humboldt River Basin, Nevada, Water and Related Land Resources, Report Number Six, op. cit., page 2.132. Ibid.133. Ibid., page 3.134. Ibid., page ii and pages 5-6.
135. Ibid., page 6.136. Ibid., pages 6-7.137. On this, the fifth of his Snake Country Expeditions, Ogden was adhering to his Company’s “scorched earth”policy. This policy had a three-fold objective: (1) combat the American fur trappers on their home grounds,including the Great Basin, instead of the Company’s lands farther north; (2) deplete the Snake and the Great Basinareas of their fur resources before the final settlement of the boundary line between the United States and Canadarestricted these areas to the Hudson’s Bay Company; and (3) relieve for awhile the trapping pressure on theCompany’s own trapped-out holdings in western Canada. See Humboldt River Basin, Nevada, Water and RelatedLand Resources, Report Number Ten, op. cit., page 1.138. Humboldt River Basin, Nevada, Water and Related Land Resources, Report Number Ten, op. cit., pages 1-3.139. Humboldt River Basin, Nevada, Water and Related Land Resources, Report Number Seven, op. cit., page 2.140. Ibid., page 47.141. Hulse, James W., The Nevada Adventure, Sixth Edition, University of Nevada Press, Reno, Nevada, 1990,pages 49-52.142. Curran, Harold, Fearful Crossing – The Central Overland Trail Through Nevada, Great Basin Press, Reno,Nevada, 1982, page 41.143. Humboldt River Basin, Nevada, Water and Related Land Resources, Report Number Seven, op. cit., pages1-6. 144. Ibid., pages 10-12.145. Ibid., pages 3-5.146. Humboldt River Basin, Nevada, Water and Related Land Resources, Report Number Two, op. cit., page 6.147. Ibid., pages 6-8.148. Ibid., pages 2-3.

DIVISION OF WATER PLANNING Humboldt River Chronology—Part I
Nevada Water Basin Information and Chronology Series I–165
149. Ibid., pages 3-5.150. Ibid., page 3.151. “Wet-mantle events” typically occur in the winter months (December through February) and generally consistof heavy rainfall under the following conditions: (1) rain on snow causing either flow through or snowpackmetldown; (2) rain on frozen ground; (3) rain on saturated soils; or (4) some combination of these conditions.152. While the gaging periods appear to be almost identical for these two USGS gages, i.e., 1897-1998 for theBattle Mountain gage and 1895-1998 for the Comus gage, there exist a number of discontinuous and different gagingperiods for each site. For example, by continuous period of record, the Battle Mountain gage shows continuous flowreadings from May 1896 to December 1897, March 1921 to April 1924, October 1945 to September 1981, andFebruary 1991 to the current year. The Comus gage, on the other hand, shows a continuous period of record fromOctober 1894 to December 1909, September 1910 to September 1926, and October 1945 to the current year.Interestingly, and disappointingly, both gages were not in operation during the February-April 1910 extreme floodperiod. Had they been in operation at that time, this surely would have been each gage’s high water (flood) recordyear (versus 1971 for the Battle Mountain gage and 1984 for the Comus gage). Also, with a 1910 reading a bothgaging station sites, a more accurate measure could have been obtained for the 1910 record flood outflow from theReese River. Water Resources Data, Nevada, Water year 1998, op. cit., pages 222 and 224.153. Humboldt River Basin, Nevada, Water and Related Land Resources, Report Number Eight, op. cit., page 1.154. Ibid., page 2.155. Nevada Historical Marker 95, “Battle Mountain.”156. As of July 1, 1998, Austin’s resident population was estimated at 871 persons. (Source: Nevada StateDemographer, University of Nevada, Reno, February 22, 1999.)157. Nevada Historical Marker 8, “Austin.”158. Humboldt River Basin, Nevada, Water and Related Land Resources, Report Number Eight, op. cit., page 6.159. Ibid., pages 11-12.160. Ibid., pages 13-17.161. Rock Creek typically flows year-round past its USGS gaging station, which is located some 22 miles northeastof Battle Mountain, Nevada, and the Humboldt River. This location is where Rock Creek emerges from the SheepCreek Mountains. From that point to is confluence with the Humboldt River, flows are not generally perennial, i.e.,year round, and generally dissipate on Boulder Flat (Valley).162. Seasonal streams are defined as those streams which flow only at certain times of the year when it receiveswater from springs, rainfall, or from surface sources such as melting snow. Ephemeral streams are defined as thosestreams which flow only in direct response to precipitation and whose channel is at all times above the water table.See Water Words Dictionary, op. cit.163. Hulse, op. cit., page 125.164. Humboldt River Basin, Nevada, Water and Related Land Resources, Report Number Nine, op. cit., page 2.165. Curran, op. cit., pages 43-44.166. Humboldt River Basin, Nevada, Water and Related Land Resources, Report Number Nine, op. cit., pages 2-3.167. Ibid., page 3.168. Humboldt River Basin, Nevada, Water and Related Land Resources, Report Number Six, op. cit., page 2.169. Humboldt River Basin, Nevada, Water and Related Land Resources, Report Number Nine, op. cit., page 4.170. Ibid., pages 4-7.171. Ibid., page 13.172. Ibid., pages 14-20.173. Humboldt River Basin, Nevada, Water and Related Land Resources, Report Number Ten, op. cit., page 1.174. Humboldt River Basin, Nevada, Water and Related Land Resources, Report Number Twelve, op. cit., page5. 175. Ibid., page 5.176. Humboldt River Basin, Nevada, Water and Related Land Resources, Report Number One, op. cit., page 6,and Nevada Historical Marker 89, “Paradise Valley.”177. Humboldt River Basin, Nevada, Water and Related Land Resources, Report Number One, op. cit., page 102.

Humboldt River Chronology—Part I DIVISION OF WATER PLANNING
I–166 Nevada Water Basin Information and Chronology Series
178. Ibid., page 102.179. Ibid., page 103.180. Ibid., page 104.181. Ibid.182. Ibid., page i.183. Ibid., page 4.184. Humboldt River Basin, Nevada, Water and Related Land Resources, Report Number Ten, op. cit., pages 1-3.185. Curran, op. cit., page 41.186. Humboldt River Basin, Nevada, Water and Related Land Resources, Report Number Ten, op. cit., page i.187. Nevada Historical Marker 2, “Pioneer Memorial Park.”188. Humboldt River Basin, Nevada, Water and Related Land Resources, Report Number Ten, op. cit., page 4.189. Ibid., pages i and 5.190. Ibid., page 4.191. Nevada Historical Marker 164, “Button Point.”192. Humboldt River Basin, Nevada, Water and Related Land Resources, Report Number Ten, op. cit., page 4.193. Ibid., page 7.194. Ibid., pages 10-11.195. Humboldt River Basin, Nevada, Water and Related Land Resources, Report Number Eleven, op. cit., pagei.196. Ibid.197. Curran, op. cit., page 125.198. Ibid., pages 128-129.199. Ibid., page 137.200. Humboldt River Basin, Nevada, Water and Related Land Resources, Report Number Twelve, op. cit., page8.201. Humboldt River Basin, Nevada, Water and Related Land Resources, Report Number Eleven, op. cit., page4.202. Ibid., page 8.203. Ibid., page 9.204. Ibid., page 4.205. Ibid., page 13.206. Ibid., pages 19-20.207. Ibid., pages 21-26.208. An adjudication is a court proceeding to determine all rights to the use of water on a particular stream systemor within a specific groundwater basin. See Water Words Dictionary, op. cit.209. A hydrographic basin (basin, area or sub-area) is considered closed with respect to surface water flow if itstopography prevents the occurrence of visible surface water outflow. It is closed hydrologically if neither surfacenor underground water outflow can occur. See Water Words Dictionary, op. cit.210. The exception to this is the adjudication of the water rights of E.C. and H.L. Lye whose property lies alongIndian Creek in the Little Humboldt River sub-basin. The Lye property was granted certain rights under Suit No.1383, known as the Bonnifield Decree. This Decree grants the Lyes a prior right to the use of 16 cubic feet persecond of Indian Creek water over the rights of the Dooley, Recanzone and Harvey properties. The Decree doesnot hold against any others within the Little Humboldt River system. The Lye property consists of 270.96 acres ofharvest crop land and 26.57 acres of pasture land irrigated by Indian Creek from the Section Line ditch; 510.30 acresof harvest crop land and 173.69 acres of pasture land irrigated by Indian Creek from the Haviland ditch; and 214.30acres of crop land irrigated by Indian Creek by means of the Silve ditch. In addition, the Lyes also obtained the M.Dooley property consisting of 59.01 acres of pasture land irrigated with Indian Creek waters via the Nos. 1, 2 and3 ditches. See Abstract of Claims Little Humboldt River, In the matter of the Determination of the Relative Rightsin and to the Waters of the Little Humboldt River and its Tributaries in Humboldt and Elko Counties, Office of the
DIVISION OF WATER PLANNING Humboldt River Chronology—Part I
Nevada Water Basin Information and Chronology Series I–167
State Engineer, State of Nevada, 1929, pages 11, 19 and 27, and Muth, Edmund, Deputy State Engineer, “FieldInvestigation: Water Distribution Report and Recommendations on Little Humboldt River and Tributaries inNevada,” Office of the State Engineer, Department of Conservation and Natural Resources, State of Nevada, CarsonCity, Nevada, 1943, page 18.211. A vested water right is a right to use either surface or ground water acquired through more or less continualbeneficial use prior to the enactment of water law pertaining to the source of the water. These claims become finalthrough adjudication, i.e., a judicial process. See Water Words Dictionary, op. cit.212. Within the Reese River drainage, only Silver Creek water rights have been adjudicated consisting of 345 acresand 1,635 acre-feet of water. Elsewhere within the total Reese River sub-basin, in Carico Lake Valley two streams,Carico Creek and Crum-Wilson Creeks, have been adjudicated for a total of 966 acres and 2,227 acre-feet of water.On all streams the adjudications provide for varying quantities of water per acre, ranging from 1.5 to 6 acre-feet peracre per year (season). See Humboldt River Basin, Nevada, Water and Related Land Resources, Report NumberEight, op. cit., page 23.213. As previously noted, the Palisade location, and particularly the U.S. Geological Survey Palisade gage (number10322500) has historically been considered as the Humboldt River’s dividing point between an upper and lowerHumboldt River Basin. Above this point the Humboldt River’s flows are generally considered to be increasing andbelow this point, due to considerably reduced tributary inflows, the Humboldt River’s flows are generally consideredto be decreasing. Also, tributary streams and sub-basins above this point are considered to be in the upper portionof the basin and those flowing into the Humboldt River main stem below this point to be in the lower HumboldtRiver Basin. In the Bartlett and Edwards decrees, this concept was extended to use the Palisade location as adividing point to indicate differences in climate and length of irrigation seasons between the upper and lowerHumboldt River basins.214. Hennen, George W., Humboldt River Water Distribution, Part 1 – Problems, Part II – Priority Tables, Divisionof Water Resources, Department of Conservation and Natural Resources, State of Nevada, April 1964, page 9.215. See (The) Humboldt River Adjudication, 1923 – 1938, Compiled by Gray Mashburn, Attorney General andW.T. Mathews, Deputy Attorney General, State Printing Office, Carson City, Nevada, 1943, Section No. 1,Findings of Fact, Conclusions of Law, and Decree of Judge George A. Bartlett, Known as the Barlett Decree, andSection No. 3, Findings of Fact, Conclusions of Law and Decree of Judge H.W. Edwards, Known as the EdwardsDecree.216. More specifically, to secure the benefit of the doctrine of relation, there must be posted a notice ofappropriation (which must be recorded), there must be a bona fide intention to use the water for a beneficial purpose,there must be diligence in the construction work, and the work must be completed (i.e., the waters conducted to theplace of intended use). Actual application of the water is not a prerequisite to the vesting of the right. The rightis complete when possession has been taken. When these requisites have been completed the right to the waterrelates back to the date of posting notice, in order to determine priority between conflicting claims. See Malone,George, W., State Engineer of Nevada, “Humboldt River Distribution and Different Features Affecting TheseDeliveries for the Years 1927 to 1931, Inclusive,” State Printing Office, Carson City, Nevada, 1932, pages 12-13.217. A water right has several characteristics, one of which is the location of where the water will be put tobeneficial use. An “appurtenant water right” is a water right that belongs to the legal owner of the land describedas the place of use of the water right. See Water Words Dictionary, op. cit.218. Hennen, op. cit., page 10.219. Ibid., pages 9-10.220. Shamberger, Hugh A., Evolution of Nevada’s Water Laws, as Related to the Development and Evaluation ofthe State's Water Resources, From 1866 to About 1960, Water Resources Bulletin 46, Prepared by the U.S.Department of the Interior, Geological Survey in cooperation with the Nevada Division of Water Resources,Department of Conservation and Natural Resources, 1991, page 5.221. The prior appropriation date, or priority date, is the date of establishment of a water right; the officiallyrecognized date associated with a water right. The rights established by application have the application date as thedate of priority. Relative to other water rights, the priority date may make a water right senior (predating otherrights) or junior (subordinate to other rights). See Water Words Dictionary, op. cit.222. The prior appropriation doctrine is based on the concept of “First in Time, First in Right”. The first personto take a quantity of water and put it to beneficial use has a higher priority of right than a subsequent user. Underdrought conditions, higher priority users are satisfied before junior users receive water. Appropriative water rightscan be lost through nonuse; they can also be sold or transferred apart from the land. See Water Words Dictionary,

Humboldt River Chronology—Part I DIVISION OF WATER PLANNING
I–168 Nevada Water Basin Information and Chronology Series
op. cit.223. Riparian water rights are the rights of the owners of lands on the banks of watercourses, relating to the water,its use, ownership of soil under the stream, accretion, etc. The term is generally defined as the right which everyperson through whose land a natural watercourse runs has to the benefit of the stream as it passes through his landfor all useful purposes to which it may be applied. See Water Words Dictionary, op. cit.224. Young, James A., and B. Abbott Sparks, Cattle in the Cold Desert, Utah State University Press, Logan, Utah,1985, page 143.225. The primary contentions questioning the law’s constitutionality were first, that as a special law it applied toonly particular rights to the use of water and embraces only a part of the territory of the State. Second, it took awayvested rights of property without due process of law and without giving the owner an opportunity to be heard. Third,it granted rights and imposed burdens upon some of the citizens of the State, which are not granted to or imposedupon others. And fourth, it delegated the law-making power to the Governor and clothed him with power to createwater districts and the discretion to extend to or withhold from the people of the State the provisions of a statute law.See Grace Dangberg, Conflict on the Carson, Carson Valley Historical Society, Minden, Nevada, November 1975,pages 90–91.226. Young, op. cit., 1985, pages 143-144.227. Biennial Report of the State Engineer, 1909–1910, State of Nevada, State Printing Office, Carson City,Nevada, 1911, page 3.228. Shamberger, op. cit., page 20.229. Ibid., page 21.230. Ibid., pages 23–28.231. The date of establishment of a water right; the officially recognized date associated with a water right. Therights established by application have the application date as the date of priority. Relative to other water rights, thepriority date may make a water right senior (predating other rights) or junior (subordinate to other rights). See WaterWords Dictionary, op. cit.232. (The) Humboldt River Adjudication, 1923 – 1938, op. cit., Section No. 1, page 3.233. Ibid.234. Ibid., page 5.235. On this point it was noted that “The Court finds that the growing season in Lovelock [Valley] and the lowerreaches of the Humboldt River is more than thirty days earlier than the growing season in Elko County, and that thetemperatures in the upper reaches are lower than in Lovelock. The Court further finds that the temperature variesbetween Battle Mountain and Lovelock, as well as between Lovelock and Elko. The Court finds from the evidencethat there is a difference in the irrigation season between Battle Mountain and Lovelock of approximately threeweeks and a difference in the irrigation season between Winnemucca and Lovelock of approximately ten days; thatthe Battle Mountain District irrigates approximately 20 days earlier than the Elko District. The evidence shows themost economical method of irrigation on the Humboldt River is to begin irrigation at Lovelock in the earlier springand progress up stream to the Elko District. Such a system of irrigation is the most economical and the only systemthat will serve the proper priorities on the entire stream system, and the Court finds from the evidence that this wasthe system under which the water rights along the Humboldt River were initiated and used since the first irrigationof said stream system.” See (The) Humboldt River Adjudication, 1923 – 1938, op. cit., Section No. 1, page 29.236. Ibid., pages 9-11.237. Ibid., page 29.238. The rate of flow in District No. 1 was based upon an irrigation system of the following approximate lengths:180 days for Class A lands, 90 days for Class B lands, and 45 days for Class C lands. That in District No. 2 was120 days for Class A lands, 60 days for Class B lands, and 30 days for Class C lands. Further, the water duty ofthe cultured areas was established as follows: Harvest Crop lands (Class A) 3 acre-feet; Meadow Pasture (Class B)1.5 acre-feet; and Diversified Pasture, 0.75 acre-feet. See (The) Humboldt River Adjudication, 1923 – 1938, op.cit., Section No. 1,, pages 52 and 242-243239. (The) Humboldt River Adjudication, 1923 – 1938, op. cit., Section No. 2, page 3.240. Ibid., pages 4-5.241. Ibid., pages 6-12.242. Ibid., pages 13-14.

DIVISION OF WATER PLANNING Humboldt River Chronology—Part I
Nevada Water Basin Information and Chronology Series I–169
243. Ibid., pages 15-16.244. Ibid., pages 17-18.245. Ibid., pages 19-20.246. Ibid., pages 21-22.247. Ibid., pages 11-12.248. Abstract of Claims Little Humboldt River, In the matter of the Determination of the Relative Rights in and tothe Waters of the Little Humboldt River and its Tributaries in Humboldt and Elko Counties, Office of the StateEngineer, State of Nevada, 1929.249. Proposed Findings of Fact, Conclusions of Law and Decree, in the District Court of the Sixth Judicial Districtof the State of Nevada, in and for the County of Humboldt, No. 3157, In the Matter of the Determination of theRelative Rights in and to the Waters of the Little Humboldt River and Its Tributaries in Humboldt and ElkoCounties, January 24, 1935 [E.P. Carville Decree], pages 73-74.250. Humboldt River Basin, Nevada, Water and Related Land Resources, Report Number One, op. cit., page 9.251. (The) Humboldt River Adjudication, 1923 – 1938, op. cit., Section No. 2, pages 1-105.252. Hennen, op. cit., page 9.253. Humboldt River Basin, Nevada, Water and Related Land Resources, Report Number Three, op. cit., page 18.254. (The) Humboldt River Adjudication, 1923 – 1938, op. cit., Section No. 4, pages 1-6.255. Hennen, op. cit., page 3.256. Humboldt River Basin, Nevada, Water and Related Land Resources, Report Number Three, op. cit., page 18.257. The exception to this being that the water rights of E.C. and H.L. Lye within the Little Humboldt River sub-basin (Indian Creek) were determined by the Bonnifield Decree. See Muth, op. cit.258. Correspondence, U.S. Bureau of Reclamation, Lahontan Basin Area Office, Carson City, Nevada, July 1999.259. Some disagreement continues to exist over whether it was Nevada’s mineral wealth or its electoral votes thatfacilitated its admission to the Union. Admittedly, both were important issues to the Union’s Civil War effort atthe time.260. Humboldt River Basin, Nevada, Water and Related Land Resources, Report Number Twelve, op. cit., page8261. Nevada Historical Marker 145, “Unionville.”262. Nevada Historical Marker 231, “Star City.”263. As of July 1, 1998, Austin’s population was estimated at 871 persons. (Source: Nevada State Demographer,University of Nevada, Reno, February 22, 1999.)264. Nevada Historical Marker 8, “Austin.”265. Humboldt River Basin, Nevada, Water and Related Land Resources, Report Number Eight, op. cit., page 4.266. Actually, it was later determined that Poker Brown (see 1862 chronology entry in Part II) was apparently theonly rancher who had been granted permission by the mining company to use the waters of the lower HumboldtRiver. (See Humboldt River Basin, Nevada, Water and Related Land Resources, Report Number Eleven, op. cit.,pages 8-9.)267. Humboldt River Basin, Nevada, Water and Related Land Resources, Report Number Eleven, op. cit., page8.268. Humboldt River Basin, Nevada, Water and Related Land Resources, Report Number Three, op. cit., page 2.269. Humboldt River Basin, Nevada, Water and Related Land Resources, Report Number Three, op. cit., page 3.270. Nevada Historical Society, University of Nevada, Reno.271. Humboldt River Basin, Nevada, Water and Related Land Resources, Report Number Twelve, op. cit., page8.272. Humboldt River Basin, Nevada, Water and Related Land Resources, Report Number Ten, op. cit., pages i and5.273. Humboldt River Basin, Nevada, Water and Related Land Resources, Report Number Nine, op. cit., page 5.274. Humboldt River Basin, Nevada, Water and Related Land Resources, Report Number Six, op. cit., page 3.275. Humboldt River Basin, Nevada, Water and Related Land Resources, Report Number Nine, op. cit., page 6.

Humboldt River Chronology—Part I DIVISION OF WATER PLANNING
I–170 Nevada Water Basin Information and Chronology Series
276. Humboldt River Basin, Nevada, Water and Related Land Resources, Report Number Twelve, op. cit., page11.277. In addition to the counties of Elko, Eureka, Humboldt, Lander and Pershing counties, the Humboldt RiverBasin also includes relatively small portions of Churchill County (Humboldt Sink), Nye County (upper Reese RiverValley) and White Pine County (upper Huntington Valley).278. In addition to the five principal counties of the Humboldt River Basin, the sixth major mineral producingcounty is Nye County in central Nevada (Central Hydrographic Region). In 1998, Nye County had $241.26 millionin total valuation of mineral proceeds, of which $227.47, or 94.3 percent was gold and silver production. Source:“Net Proceeds of Minerals”, Nevada Department of Taxation, Division of Assessment Standards, Centrally AssessedProperties, State of Nevada, Carson City, Nevada, April 20, 1999.279. The Meikle Mine in Elko County, owned by Barrick Goldstrike, is the largest underground gold mine in theUnited States, producing 847,313 ounces of gold in 1998. The open-pit Betze-Post Mine in Eureka County northof Carlin, also owned by Barrick, is the single largest gold mine in the United States, producing 1,498,683 ouncesof gold in 1998. Source: “The Nevada Mineral Industry in 1998”, Special Publication MI-1998, Nevada Bureauof Mines and Geology, Mackay School of Mines, University of Nevada, Reno, 1999.280. For example, Professor John L. Dobra, Natural Resource Industry Institute, University of Nevada, Reno, hasestimated that for every four jobs in the mining industry, another three jobs are created in other industry sectors inthe local economy, equivalent to an employment ‘multiplier’ of 1.75 (the ratio of total jobs, 7 [4+3], to mining jobs,4). Using this employment (job) impact estimate, the 9,216 jobs in mining in the Humboldt River Basin countiesin 1998 were responsible for an additional 6,900 jobs. Furthermore, the decline in mining jobs of 1,083 from 1997to 1998, should result in the further employment contraction within the region of 800 jobs in other industry sectors.281. As one example of these far-reaching effects on employment in other industries and areas outside the countywhere mining is conducted, mining-related jobs in Washoe County, which consist primarily of administrative,exploration and laboratory jobs in support mining operations in the rural counties, have declined from a peak of1,513 jobs in 1990 to 656 jobs in 1997 and then to only 513 mining-related jobs in 1998. Source Data: NevadaDepartment of Employment, Training and Rehabilitation (DETR), Research and Analysis Bureau, September 1999.282. In addition, mining employment accounted for 1.4 percent of all workers in Nevada in 1998 as compared to1.7 percent of the state’s total employment in 1997. In 1998, the Nevada mining industry paid $699.18 million intotal payrolls to its workers, down 4.4 percent from $731.75 million in total payrolls in 1997. In 1998, the miningindustry’s payrolls accounted for 2.5 percent of statewide payrolls as compared to 2.9 percent of total payrolls in1997. Some trends, however, reflected the continuation of mining and milling higher grade ore bodes or existingbodies of reserves, while laying off exploration and other workers in the process. The result of these actions wasthe retention of more skilled (and higher paid) mine workers and higher levels of productivity in terms of dollar-valued output per worker. For example, mining jobs averaged $52,824 per worker in annual wages in 1998, up 5.8percent from an average annual wage of $49,905 per worker in 1997. Mining workers’ average wage was 74.9percent higher than the average all-industry Nevada wage of $30,195 in 1998. Productivity measures were alsoaffected as efforts were made to maintain production levels while using fewer workers. For example, on average,the mining worker in Nevada produced $226,544 in gross proceeds in 1998, up from $212,650 in gross proceedsin 1997. This productivity level for 1998 effectively covered the average mining wage for that year by 4.3 times.283. The troy weight is a system of units of weight in which the grain is the same as in the avoirdupois weightsystem and the pound contains 12 ounces, 240 penny weights, or 5,760 grains. See Water Words Dictionary, op.cit.284. In an effort to off-set this 9.5 percent price decline and attempt to maintain revenues from gold sales, Nevada’sgold mines actually increased gold production in 1998, from 7.828 million ounces in 1997 to 8.860 million ouncesin 1998, an increase of 13.2 percent. Since 1995, however, despite a 31 percent increase in gold production, thevalue of the of the state’s total gold production has risen by only 0.3 percent, due entirely to a 23.4 percent declinein gold’s price (from $384.09 per ounce received in 1995 to $294.04 per ounce in 1998).285. BusinessWeek, McGraw-Hill Companies, New York, New York, October 11, 1999, page 43.286. Mine dewatering applies to surface (open-pit) mines as well as underground mines.287. The conversion from weight (tons) to volume (cubic yards) was estimated at 1.3 tons per cubic yard. Source:Nick Horning, President, Nevada Hydrocarbon, Lockwood, Nevada, July 1999.288. Shaw, W. Douglass, “Gold Mining in the Humboldt River Basin of Nevada,” Department of AppliedEconomic and Statistics, College of Agriculture, University of Nevada, Reno, 1998, page 5.

DIVISION OF WATER PLANNING Humboldt River Chronology—Part I
Nevada Water Basin Information and Chronology Series I–171
289. In November 1997 Hydrologic (Colorado) Consultants, Inc. (HCI) published a report for Newmont GoldCompany which estimated current and proposed dewatering activities for a number of mining operations in theHumboldt River Basin. In total, seven mining operations were listed showing existing or proposed (Leeville Mine)groundwater pumping (dewatering) operations amounting to nearly 250,000 gallons per minute (gpm), or over400,000 acre-feet per year. In addition to an analysis of the mines’ dewatering operations and the effects on riverflows, the HCI report also estimated the ultimate size of the mine pit lakes which would form once pumpingoperations ceased. In total, it was estimated that the twelve mine lakes analyzed would fill with nearly 1,370,000acre-feet of groundwater. Based on a total surface area of 2,952 acres, an estimated 11,300 acre-feet would beevaporated from the pit lakes each year. (This estimate is based on a total surface area of 2,952 acres and an averageannual rate of evaporation of 46 inches, or approximately 3.83 feet per year.) See “Preliminary Assessment ofCumulative Impacts on Humboldt River Streamflow from Mining Operations in Humboldt River Basin,” HCI-1718,Hydrologic Colorado Consultants, Inc., Lakewood, Colorado, November 1997.290. The Betze-Post Mine is technically owned by Barrick Goldstrike Mines Inc., which is a wholly-ownedsubsidiary of Barrick Gold Corporation.291. Annual Report 1997, Barrick Gold Corporation, Toronto, Canada, page 16.292. At an average conversion of 1.3 tons per cubic yard, 159 million tons is equivalent to 122,308,000 cubic yardswhich is equivalent to a water-equivalent volume of 75,810 acre-feet.293. Much controversy exists over the potential magnitude of the impacts that mine dewatering operations will haveon groundwater conditions and surface water flows. However, it should be noted that in three Draft EnvironmentalImpact Statements (DEIS’s) on projects on the Carlin Trend – the Gold Quarry expansion, Betze-Post and Leeville– sophisticated hydrologic modeling indicated that the maximum impact on flows in the Humboldt River will be lessthan 8 cubic feet per second. These studies also concluded that there are very few areas where surface springs willbe affected.294. Commonly, groundwater mounding is an outward and upward expansion of the free water table caused byshallow re-injection, percolation below and impoundment, or other surface recharge method (essentially, the reverseof the cone of depression effect created by a pumping well). Mounding can alter groundwater flow rates anddirection; however, the effects are usually localized and may be temporary, depending upon the frequency andduration of the surface recharge events. See Water Words Dictionary, op. cit.295. This represents a joint operation between Barrick and Newmont with the water coming from a Barrick mineand being used for irrigation on farmlands owned by Newmont Gold Mining.296. Bathker, Colleen, “Technical Issue Paper: Mine Dewatering in the Humboldt River Basin,” Unpublishedmanuscript, Nevada Division of Water Planning, Department of Conservation and Natural Resources, Carson City,Nevada, September 1995, pages 1-6.297. Correspondence, Leo Drozdoff, P.E., Chief, Bureau of Water Pollution Control, Nevada Division ofEnvironmental Protection (NDEP), December 14, 1999.298. A term indicating the hydrogen ion concentration of a solution, i.e., a measure of the solution’s acidity. Theterm (from French, pouvoir hydrogène, or literally, “hydrogen power”) is defined as the negative logarithm of theconcentration of H+ ions (protons): pH = –log10 [H+], where [H+] is the concentration of H+ ions in moles perliter. Acid solutions have a pH ranging from 6 (for a weak acid) to 1 (for a strong acid). Inversely, a basic solutionhas a low concentration of H3O+ ions and an excess of OH– ions, and the pH ranges from 8 (for a weak base) to 14(for a strong base). See Water Words Dictionary, op. cit.299. A measure of the amount of material dissolved in water (mostly inorganic salts). Typically aggregates ofcarbonates, bicarbonates, chlorides, sulfates, phosphates, nitrates, etc. of calcium, magnesium, manganese, sodium,potassium, and other cations which form salts. The inorganic salts are measured by filtering a water sample toremove any suspended particulate material, evaporating the water, and weighing the solids that remain. Animportant use of the measure involves the examination of the quality of drinking water. Water that has a highcontent of inorganic material frequently has taste problems and/or water hardness problems. As an example, waterthat contains an excessive amount of dissolved salt (sodium chloride) is not suitable for drinking. High TDSsolutions have the capability of changing the chemical nature of water. High TDS concentrations exert varyingdegrees of osmotic pressures and often become lethal to the biological inhabitants of an aquatic environment. Thecommon and synonymously used term for TDS is “salt”. Usually expressed in milligrams per liter. See WaterWords Dictionary, op. cit.300. Personal communication, Leo Drozdoff, op. cit., December 20, 1999.301. Bathker, op. cit., page 8.

Humboldt River Chronology—Part I DIVISION OF WATER PLANNING
I–172 Nevada Water Basin Information and Chronology Series
302. The 14 hydrographic areas included: (1) 53 – Pine Valley; (2) 54 – Crescent Valley; (3) 55 – Carico LakeValley; (4) 56 – Upper Reese River Valley; (5) 57 – Antelope Valley; (6) 58 – Middle Reese River Valley; (7) 59– Lower Reese River Valley; (8) 60 – Whirlwind Valley; (9) 61 – Boulder Flat; (10) 62 – Rock Creek Valley; (11)63 – Willow Creek; (12) 64 – Clovers Area; (13) 65 – Pumpernickel Valley; and (14) 66 – Kelly Creek Valley.303. “Humboldt River Basin Assessment Briefing Paper, Phase One Progress, Phase Two Plans,” U.S. GeologicalSurvey, Water Resources Division, U.S. Department of the Interior, Carson City, Nevada, December 1998.304. Website address: <http://nevada.usgs.gov/humbl>305. The branch of physics having to do with the mechanical properties of water and other liquids in motion andwith the application of these properties in engineering. See Water Words Dictionary, op. cit.306. For example, see Crompton, E. James, “Potential Hydrolgoic Effects of Mining in the Humboldt River Basin,Northern Nevada,” Water-Resources Investigation Report 94-4233, U.S. Geological Survey, U.S. Department ofthe Interior, Carson City, Nevada, 1995; Maurer, Douglas K., Russell W. Plume, James M. Thomas, and Ann K.Johnson, “Water Resources and Effects of Changes in Ground-Water Use Along the Carlin Trend, North-CentralNevada, Water-Resources Investigation Report 96-4134, U.S. Geological Survey, U.S. Department of the Interior,Carson City, Nevada, 1996; Plume, Russell, W., “Water Resources and Potential Effects of Ground-WaterDevelopment in Maggie, Marys, and Susie Creek Basins, Elko and Eureka Counties, Nevada,” Water-ResourcesInvestigations Report 94-4222, U.S. Geological Survey, U.S. Department of the Interior, Carson City, Nevada,1995; and Plume, Russell, W., and David A. Ponce, “Hydrologic Framework and Ground-Water Levels, 1982 and1996, Middle Humboldt River Basin, North-Central Nevada,” Water-Resources Investigations Report 98-4209, U.S.Geological Survey, U.S. Department of the Interior, Carson City, Nevada, 1999.307. Here a principal concern is that the “cone of depression” exerted by the “draw” of the pit during filling maywell alter the groundwater gradient, i.e., flow, from established routes and courses. This could affect nearby springsand stream flows and water right holders who use those waters.308. A sinking or lowering of a large area of the earth’s crust. Typically this may result from the over-pumpingof a basin’s water table and the inability of the soils to re-absorb water from natural or artificial injection. Alsofrequently results from overdrafts of the aquifer and its inability to fully recharge, a process termed aquifercompaction. See Water Words Dictionary, op. cit.309. Most of these open pits lie in an evaporation band of 44-46 inches per year, meaning that nearly four feet ofsurface water evaporation will occur annually once groundwater is used to fill the pit lakes.310. When the pits are allowed to fill with water, rocks comprising the pit lake walls will have the opportunity tointeract with the water under newly aerobic (in the presence of air or free oxygen) conditions. This may allow acidiccompounds to form, changing the original water chemistry and potentially impacting surrounding groundwater, aswell as wildlife which may be drawn to the newly-formed pit lake. See Bathker, op. cit., page 9.311. Nevada State Water Plan, 1999, Nevada Division of Water Planning, Department of Conservation and NaturalResources, Carson City, Nevada, April 1999.312. Humboldt River Basin, Nevada, Water and Related Land Resources, Reports Number One through Twelve,Nevada Department of Conservation and Natural Resources and the U.S. Department of Agriculture, 1962-1966.313. Crompton, E. James, “Potential Hydrolgoic Effects of Mining in the Humboldt River Basin, NorthernNevada,” Water-Resources Investigation Report 94-4233, U.S. Geological Survey, U.S. Department of the Interior,Carson City, Nevada, 1995.314. For more information on the methodology of using estimated irrigated acreage times and estimated county-specific irrigation water use factor or coefficient (acre-feet per acre per year) to estimate total irrigation (andlivestock) water withdrawals, see the Nevada Division of Water Planning’s 1999 Nevada State Water Plan, Part 2– Water Use and Forecasts, Section 5 – Technical Supplement, Water Use Coefficient and Related Forecast FactorDevelopment and Applications.315. Humboldt River Basin, Nevada, Water and Related Land Resources, Report Number Eight, op. cit., page 6.316. Nevada Historical Marker 109, “Lamoille Valley.”317. Humboldt River Basin, Nevada, Water and Related Land Resources, Report Number Three, op. cit., pages2-3.318. Humboldt River Basin, Nevada, Water and Related Land Resources, Report Number Five, op. cit., page 4.319. Humboldt River Basin, Nevada, Water and Related Land Resources, Report Number Four, op. cit., page 2.320. Humboldt River Basin, Nevada, Water and Related Land Resources, Report Number Nine, op. cit., page 3.

DIVISION OF WATER PLANNING Humboldt River Chronology—Part I
Nevada Water Basin Information and Chronology Series I–173
321. Humboldt River Basin, Nevada, Water and Related Land Resources, Report Number Eleven, op. cit., page9.322. Nevada Historical Marker 164, “Button Point.”323. Young, op. cit., 1999, page 3.324. Ibid., page 4.325. Ibid., page 8.326. The July 15, 1951 issue of Life Magazine, in particular, had an article (pages 55-56) on the “Sheep-KillingWeed” with graphic photographs of dead and dying sheep strewn across the salt desert while another sheep nibbledaway on an innocent-looking halogeton plant. The article commented that halogeton could be suppressed throughproper range management techniques. See Young, op. cit., 1999 page 48.327. Young, op. cit., 1999, page 14.328. Ibid., page vi.329. Ibid., pages 3-4.330. Ibid., page 9.331. Crested wheatgrass was introduced in North America in 1897 by the South Dakota botanist N.E. Hansen, whoworked as a plant explorer for the U.S. Department of Agriculture. Hansen obtained his seed from V.S. Bogdenat the Valuiki Experiment Station on the Volga River in southern Russia. Even though Bogden may have collectedcrested wheatgrass seed from areas where halogeton was present, given the plant’s requirement for sodium chloride,it is doubtful that the weed would have flourished in the black soil belt of Russia. See Young, op. cit., 1999, page18.332. Young, op. cit., 1999, page 10.333. Saline soils are those containing common salt, or sodium chloride, but also refer to those soils specificallycontaining any of the salts of the alkali metals, e.g., sodium, calcium, potassium or magnesium. Strictly speaking,saline soils are nonalkali soils containing soluble salts in such quantities that they interfere with the growth of mostplants. Alkaline soils contain an amount of alkali substances sufficient to raise the pH value above 7.0 and beharmful to the growth of crops. Generally, the term alkaline is applied to water with a pH greater than 7.4.Generally, alkali refers to any strongly basic (high pH) substance capable of neutralizing an acid, such as soda,potash, etc., that is soluble in water and increases the pH of a solution greater than 7.0. But this term may also referto soluble salts in soil, surface water, or groundwater. See Water Words Dictionary, op. cit.334. Young, op. cit., 1999, pages 20-23.335. Oxalates constitute a salt or ester of oxalic acid. An acid, C2H2O4, or (CHO2)2, existing in oxalis as acidpotassium oxalate, and in many plant tissues as sodium or calcium oxalate. Oxalic acid is obtained as a whitecrystalline compound containing two molecules of water, by the action of nitric acid on sugar, starch, etc. It hasa strong acid taste and is poisonous in large doses.336. Young, op. cit., 1999, page 7.337. Ibid., page 27.338. Ibid., page 31.339. Ibid., page vi.340. Ibid., page 17.341. Donaldson, Susan, and Wayne Johnson, “The War Against Tall Whitetop,” Fact Sheet FS 99-95, Universityof Nevada, Reno, Cooperative Extension, January 1999, page 1.342. Ibid., pages 1-2.343. Ibid., page 1.344. Ibid., page 3.345. Fact Sheet: Tall Whitetop in the Humboldt River, Martin Larraneta, Nevada Department of Agriculture,Winnemucca, Nevada, February 7, 2000.346. McQuivey, op. cit.347. “Emigrant Trails in the Black Rock Desert”, Technical Report No. 6, Bureau of Land Management, U.S.Department of the Interior, Nevada State Office, Reno, Nevada, April 1980, page 16.348. Nevada Historical Marker 49, “Applegate-Lassen Trail Cutoff.”

Humboldt River Chronology—Part I DIVISION OF WATER PLANNING
I–174 Nevada Water Basin Information and Chronology Series
349. Rowley, William D., “The Newlands Project: Crime or National Commitment,” Dividing Desert Waters,Nevada Public Affairs Review, Number 1, 1992, Senator Alan Bible Center for Applied Research, University ofNevada, Reno, page 39.350. With the completion of Rye Patch Reservoir in 1936, the Pitt-Taylor Reservoirs have only been used to storewater during high flow years when it is apparent that Rye Patch will not hold the total flow. Current capacity ofthese reservoirs is only 25,000 acre-feet, although these reservoirs are authorized to hold a total of 36,600 acre-feetby the Nevada State Engineer. It has been reported that due to heavy evaporation losses, only approximately one-half of the water diverted into these reservoirs can be made available for release to Rye Patch Reservoir. SeeHumboldt River Basin, Nevada, Water and Related Land Resources, Report Number Eleven, op. cit., page 27.351. Humboldt River Basin, Nevada, Water and Related Land Resources, Report Number Eleven, op. cit., page13.352. “Humboldt Project Briefing Paper,” U.S. Bureau of Reclamation, Mid-Pacific Region, Lahontan Basin AreaOffice, Carson City, Nevada, U.S. Government Printing Office, Washington, D.C., 1972.353. Crompton, op. cit.354. “Humboldt Project Briefing Paper,” op. cit.355. Humboldt River Basin, Nevada, Water and Related Land Resources, Report Number Eleven, op. cit., page13.356. Ibid., page 31.357. “Humboldt Project Briefing Paper,” op. cit.358. Humboldt River Basin, Nevada, Water and Related Land Resources, Report Number Eleven, op. cit., page31.359. “Humboldt Project Briefing Paper,” op. cit.360. Interestingly, although construction on Rye Patch Dam had already begun the previous January, on November1, 1935, the Humboldt Project was officially found feasible by the Secretary of the Interior and subsequentlyapproved by the President on November 6, 1935, approximately ten months after construction reportedly had begun.See “Humboldt Project Briefing Paper,” op. cit. 361. Humboldt River Basin, Nevada, Water and Related Land Resources, Report Number Eleven, op. cit., pages8, 13 and 27.362. “Humboldt Project Briefing Paper,” op. cit.363. Humboldt River Basin, Nevada, Water and Related Land Resources, Report Number Eleven, op. cit., page51.364. “Humboldt Project Briefing Paper,” op. cit.365. In continuing support of the Humboldt Project and moving upstream water to Rye Patch Reservoir asefficiently as possible, on October 6, 1955, the Pershing County Water Conservation District signed a contract torepay the costs of rehabilitation and betterment of the Battle Mountain water development and collection system withthe amount of the obligation not to exceed $123,000, to be repaid in 20 equal annual installments. The notice ofcompletion of work and statement of final cost set the actual contract amount at $122,998. See “Humboldt ProjectBriefing Paper,” op. cit.366. System Plan, 1997, Nevada Division of State Parks, Department of Conservation and Natural Resources,Carson City, Nevada, 1997, page 4-52.367. Data on farm marketings are compiled and published by the U.S. Department of Commerce, Bureau ofEconomic Analysis (BEA), Regional Economic Information Service (REIS).368. Here total agricultural water withdrawals, including both irrigation and livestock water withdrawals, are usedas both crops and livestock production comprise total farm marketings.369. An ecosystem is a complex grouping of interacting plants and animals with their physical surroundings.Ecosystems are isolated from each other by boundaries which confine and restrict the movement of energy andmatter, for example, an ecosystem could be recognized at a watershed level by designating an area of commondrainage (i.e., topography determines movement of water). See Water Words Dictionary, op. cit.370. The Pleistocene Epoch designated the geologic time, rock series, and sedimentary deposits of the earlier ofthe two epochs of the Quaternary Period and was characterized by the alternate appearance and recession of northernglaciation and the appearance of the progenitors of human beings. Also commonly referred to as the Ice Age, thePleistocene immediately preceded the present Holocene Epoch and occurred from about from 2 million years ago

DIVISION OF WATER PLANNING Humboldt River Chronology—Part I
Nevada Water Basin Information and Chronology Series I–175
to 10,000 years ago. See Water Words Dictionary, op. cit.371. Tausch, Robin J., Peter E. Wigand, and J. Wayne Burkhardt, “Viewpoint: Plant Community Thresholds,Multiple Steady States, and Multiple Successional Pathways: Legacy of the Quaternary?”, Journal of RangeManagement, Volume 46, September 1993, page 441.372. A more complete list of extinct or extirpated late Pleistocene mammals known from the Great Basin includeJefferson’s ground sloth (Megalonyx), Shasta ground sloth (Nothrotheriops shastensis), Harlan’s ground sloth(Glossotherium), Short-faced skunk (Brachyprotoma brevimala), Giant short-faced bear (Arctodus simus), Sabertoothcat (Smilodon fatalis), American lion (Panthera leo), American cheetah (Miracinonyx trumani), Horses (Equusspecies) Flat-headed peccary (Platygonus), Yesterday’s camel (Camelops hesternus), Large-headed llama(Hemiauchenia macrocephala), Diminutive pronghorn (Capromeryx), Harrington’s mountain goat (Oreamnosharringtoni), Shrub ox (Euceratherium), Harlan’s muskox (Bootherium bombifrons), American mastodon (Mammutamericanum) and Columbia mammoth (Mammuthus columbi). The American lion and Harrington’s mountain goatstill exist in North America. See Grayson, op. cit., page 159.373. While climatic warming and drought at the beginning of the Holocene interglacial period and the loss ofPleistocene plant communities certainly contributed to the demise and/or extirpation of mega-fauna species, othershave noted that human arrival in the Great Basin and extensive hunting also possibly contributed to the disappearanceof these animal species. See Tausch, op. cit., page 441.374. A disturbance is a discrete event or process which kills or removes vegetation. From an ecological andhierarchical perspective, disturbance is a change in the minimal structure of an ecosystem caused by a factor externalto the reference structure, for example, fire, activities by man, etc. See Water Words Dictionary, op. cit.375. Resilience assesses the ability of an ecosystem to maintain or restore biodiversity, biotic integrity, andecological structure and processes following disturbance. See Water Words Dictionary, op. cit.376. A forb is any herbaceous flowering plant, other than a grass; especially one growing under range conditions.(Herbaceous: With the characteristics of an herb; having the texture and color of a foliage leaf; a plant with nopersistent woody stem above ground.) See Water Words Dictionary, op. cit.377. The understory includes plants growing beneath the canopy of other plants. Usually refers to grasses, forbs,and low shrubs under a tree or shrub overstory, or, in the case of the Great Basin, grasses growing beneath asagebrush overstory. See Water Words Dictionary, op. cit.378. The uppermost or tree part of a forest, formed by tree crowns; canopy. Also, the highest plant communitywithin a given area, which in a sagebrush-grassland setting would be the sagebrush. See Water Words Dictionary,op. cit.379. While not precisely defined such as a “water year” (October 1 through September 30), the “fire year” or fireseason generally begins in April, or even late March in southern Nevada, when moisture conditions are such thattimber and grasses are prone to the effects of ignition. From this time, the fire season moves northward in latitudeand upward in elevations from valley floors to the mountain ranges as drying conditions increase, until aroundOctober when moisture conditions increase sufficiently and most of the danger of fire has passed. Much of thisdefinition is derived from an operational point of view as the time when the various fire suppression agencies (i.e.,BLM, Forest Service, BIA, etc.) hire temporary workers and put fire crews on alert or standby. Source: Oralcommunication, Mark O’Brien, U.S. Bureau of Land Management (BLM), Nevada Office, September 13, 1999.380. All figures related to burned areas were obtained from source data supplied by the U.S. Bureau of LandManagement (BLM), Nevada Office, September 1999.381. Derived from the Spanish for “child” (i.e., the “Christ child” due to its occurrence near Christmas), the namegiven to a southward-flowing ocean current off the coast of Peru causing an irregularly occurring flow of unusuallywarm surface water along the western coast of South America that is accompanied by abnormally high rainfall inusually arid areas and that prevents upwelling of nutrient-rich cold deep water causing a decline in the regional fishpopulation. It typically results in a warm inshore current flowing along the coast of Ecuador and about every sevento ten years it extends southward down the coast of Peru with frequently devastating effects on weather, crops, andfishing (due to adverse effects on plankton). El Niño’s warm and nutrient-poor waters cause great damage to thefishing industry and also to the birds feeding there, which are an important source of guano. The climatic effectsof large-scale El Niño disturbances also cause flooding and drought conditions over a wide area, sometimesextending as far as the southern Pacific Ocean, Europe, Africa, and Asia. Such disturbances have taken place in1953, 1957-58, 1972-73, 1976, 1982-83, 1992 and over an extended period of 1995-1999. It is also believed thatthis condition (the “El Niño effect”) has more far-reaching effects on climatological patterns in the WesternHemisphere and also has influenced storm patterns in the western Atlantic Ocean region (Caribbean and Gulf ofMexico). It has generally been found that the presence of El Niño tends to reduce hurricane activity while the

Humboldt River Chronology—Part I DIVISION OF WATER PLANNING
I–176 Nevada Water Basin Information and Chronology Series
presence of La Niña, or cool eastern Pacific waters, tends to increase hurricane activity. See Water WordsDictionary, op. cit.382. Derived from the Spanish for the “little girl”, the name given to the weather phenomenon characterized byabnormally cold ocean surface water temperatures in the eastern Pacific Ocean near the equator. According to theNational Oceanic and Atmospheric Administration (NOAA), during a La Niña occurrence temperatures are typicallywarmer than normal in the southeast United States and cooler than normal in the northwest, bringing drier thannormal conditions to southern California and the Southwest. With the cold water in the Pacific tropics characterizinga La Niña event, the chill, west-to-east high-altitude winds known as the jet stream no longer move southwardattracted by the temperature differential which exists during the El Niño warm-water event. Therefore, instead ofbeing “pulled” downward as the jet stream hurls across the United States, it tends to shift northward, producingunusually wet springs in the Northwestern U.S. and summer droughts in the mid-Atlantic region. It also means thatthere are no strong upper elevation winds in the middle Atlantic to blow the tops off of any big tropical stormsforming, consequently allowing for the formation of more hurricanes. See Water Words Dictionary, op. cit.383. Stewart, Robert, “Summary, May-August 10, 1999 Nevada Fire Season,” U.S. Bureau of Land Management(BLM), Nevada Office, September 1999.384. Pellant, Mike, “History and Applications of the Intermountain Greenstripping Program,” Paper presented atthe Symposium on Ecology, Management, and Restoration of Intermountain Annual Rangelands, Boise, Idaho, May18-22, 1992.385. Murphy, Patrick M., Deputy State Forester for Resource Management, Correspondence, Nevada Division ofForestry, Department of Conservation and Natural Resources, Carson City, Nevada, October 7, 1996.386. Humboldt River Basin, Nevada, Water and Related Land Resources, Report Number Eight, op. cit., page 49.387. Invasive species are alien or exotic (i.e., not native to a particular ecosystem) plants or animals whoseintroduction does or is likely to cause economic or environmental harm or harm to human health. See Water WordsDictionary, op. cit.388. Hunter, Richard, “Bromus Invasions on the Nevada Test Site: Present Status of B. Rubens and B. Tectorumwith Notes on Their Relationship to Disturbance and Altitude,” Great Basin Naturalist, 51(2), 1991, pages 176-178.389. Goodrich, Sherel, and Natalie Gale, “Cheatgrass Frequency at Two Relic Sites within the Pinyon-Juniper Beltof Red Canyon, Utah,” Proceedings: Ecology and Management of Pinyon-Juniper Communities within the InteriorWest, Provo, Utah, September 15-18, 1997. 390. Cronquist, Arthur, Arthur H. Holmgren, Noel H. Holmgren, James L. Reveal, Patricia K. Holgren,Intermountain Flora, Vascular Plants of the Intermountain West, U.S.A., Volume Six, Columbia University Press,New York, 1977, pages 199-200.391. Monsen, Stephen B., “The Competitive Influences of Cheatgrass (Bromus tectorum) on Site Restoration,”Paper presented at the Symposium on Ecology, Management, and Restoration of Intermountain Annual Rangelands,Boise, Idaho, May 18-21, 1992.392. Morefield, James D., Ph.D., Botanist, Correspondence, Nevada Natural Heritage Program, Department ofConservation and Natural Resources, Carson City, Nevada, September 26, 1996.393. Monsen, op. cit., 1992.394. Invasive Plant Species Records, Nevada Natural Heritage Program, Department of Conservation and NaturalResources, Carson City, Nevada.395. Succession represents the ecological process of sequential replacement by plant communities on a given siteas a result of differential reproduction and competition. See Water Words Dictionary, op. cit.396. One early study (1951) concluded that the conversion of sagebrush-grass ranges to annual weeds progressesthrough three distinct plant communities. Barren or burned areas are first occupied by Russian thistle (Salsolapestifer), then by mustards (Descurainia sophia) and tumble mustard (Sisymbrium altissimum), and finally bycheatgrass (Bromus tectorum). Russian thistle dominates the first two years, mustards the third and fourth years,and cheatgrass from the fifth year on. These changes occur irrespective of weather differences. The communitiesthrive and reproduce within the limits of available moisture. Once cheatgrass has gained control, however, thesuccessive patterns are not repeated if the site is again disrupted. Consequently, disturbed sites can be much moresuccessfully seeded when Russian thistle or mustards are present than when cheatgrass has assumed control. SeeMonsen, Stephen B., and E. Durant McArthur, “Factors Influencing Establishment of seeded Broadleaf Herbs andShrubs Following Fire,” Paper presented at the Symposium on Rangeland Fire Effects, Boise, Idaho, November 27-29, 1984.

DIVISION OF WATER PLANNING Humboldt River Chronology—Part I
Nevada Water Basin Information and Chronology Series I–177
397. The state of a biotic community attained when constituent species’ populations fluctuate rather than exhibitsuccessional replacement and thereby self-perpetuate as long as climatic, edaphic (soil), and biotic conditionscontinue. See Water Words Dictionary, op. cit.398. Wright, Henry A., Arthur W. Bailey, Fire Ecology, United States and Southern Canada, John Wiley & Sons,New York, N.Y., 1982, pages 166-167.399. Ibid., page 171.400. Monsen, op. cit., 1992.401. In this regard, the success of ‘Hycrest’ crested wheatgrass (Agropyron desortorum) and mountain rye (Secalemontanum) has been most notable. Seeds of mountain rye germinate at slightly cooler temperatures than cheatgrass,and the growth rate of this perennial has been found to even exceed that of cheatgrass. When grown in directcompetition, the perennial grass prevails. Few other perennial species have shown similar characteristics. SeeMonsen, Stephen B., and Dale Turnipseed, “Seeding Forage Kochia onto Cheatgrass-Infested Rangelands,” Paperpresented at the Symposium on Cheatgrass Invasion, Shrub Die-Off, and Other Aspects of Shrub Biology andManagement, Las Vegas, Nevada, April 5-7, 1989.402. Monsen, op. cit., 1989.403. Monsen, op. cit., 1992.404. Hunter, op. cit., page 181.405. Humboldt River Basin, Nevada, Water and Related Land Resources, Report Number Nine, op. cit., page 4.406. Humboldt River Basin, Nevada, Water and Related Land Resources, Report Number Ten, op. cit., page 7.407. Exotic species are non-native or non-indigenous species, usually introduced as the result of human activities.See Water Words Dictionary, op. cit.408. Humboldt River Basin, Nevada, Water and Related Land Resources, Report Number Seven, op. cit., page 41.409. Humboldt River Basin, Nevada, Water and Related Land Resources, Report Number Five, op. cit., page 4.410. Correspondence (JoLynn Worley), Bureau of Land Management (BLM), Nevada District Office, Reno,Nevada, December 23, 1999.411. Humboldt River Basin, Nevada, Water and Related Land Resources, Report Number Five, op. cit., page 5.412. Humboldt River Basin, Nevada, Water and Related Land Resources, Report Number Eight, op. cit., page 6.413. Humboldt River Basin, Nevada, Water and Related Land Resources, Report Number Four, op. cit., page 3.414. “Fact Sheet: The Santa Rosa National Forest, 1911-17,” Santa Rosa Ranger District, U.S. Forest Service,U.S. Department of Agriculture, Winnemucca, Nevada, September 1999.415. Humboldt River Basin, Nevada, Water and Related Land Resources, Report Number Three, op. cit., page 4.416. Ibid.417. Ibid.418. Riparian areas represent transitional ecosystem located between aquatic (usually riverine) and terrestrial(upland) environments. Riparian ecosystems are identified by distinctive soil characteristics and vegetationcommunities that require free, i.e., flowing, water. See Water Words Dictionary, op. cit.419. Humboldt River Basin, Nevada, Water and Related Land Resources, Report Number Three, op. cit., page 23.420. JoLynn Worley, op. cit.421. “The Great Basin: Healing the Land,” Bureau of Land Management, U.S. Department of the Interior, April2000, page 1.422. Ibid., page 3.423. Ibid., page 35.424. Ibid., pages 7-8.425. Ibid., pages 17-19.426. Ibid., page 7.427. Beginning in 1901, Dr. James Edward Church, Professor of Classics at the University of Nevada, Reno, andan enthusiastic outdoorsman, first began studies and measurements of snowpack water content on the summit ofMount Rose (10,778 feet MSL) in the Carson Range of the Sierra Nevada near Reno, Nevada, and thereby pioneeredthe science of snow surveying. His research showed that figures indicating the snowpack water content over a widemelting area could be used to forecast with considerable accuracy the likelihood and degree of flood or drought in

Humboldt River Chronology—Part I DIVISION OF WATER PLANNING
I–178 Nevada Water Basin Information and Chronology Series
the drainage area below the measurement area during the following season of runoff. Dr. Church formulated asimple mathematical expression, which he called the “Percentage Method,” involving water content measurementstaken over a “snow course” annually on April 1st and weighted for both soil moisture on that date and precipitationon the snowfield during the period of melting. While new techniques and more modern equipment have beenimplemented since that time, the fundamental relationships developed by this imaginative scientist remain acceptedto this day. Closely associated with the work of Dr. Church and long in charge of the Nevada Cooperative SnowSurveys and the University of Nevada, Reno, was Dr. H.P. Boardman. Both men retired in 1939 and continued tostudy and publish in this area of research for almost 20 years. See Houghton, op. cit., page 58.428. The snowpack water content figures measure the water equivalent of a specific volume (depth) of snow. Themeasures are based on a percent of average for the particular time of year for which the reading is taken, with 100percent being the total period average. The Natural Resources Conservation Service (NRCS), U.S. Department ofAgriculture, maintains a number of SNOTEL, or snowpack telemetry sites throughout the Great Basin andparticularly in the upper watersheds of the Humboldt, Truckee (Lake Tahoe), Carson and Walker River basins.These sites are used to estimate and forecast potential runoff from the existing snowpack for planning and emergencypreparation purposes and serve a wide range of uses to include flood planning, reservoir releases, diversions forirrigation and agricultural needs, and water anticipated to be available for municipal and industrial uses. The basinaverage is the composite reading of a number of individual site readings which are taken monthly, generally fromNovember 1 through April 1 of each year. It is the April 1 figure that determines the year’s assumed maximumsnowpack reading; however, in certain years, e.g., 1997, unique climatologic and hydrologic conditions warranteda different reference period which approximated the maximum annual snowpack water content conditions. Thisanalysis used an alternative reading date of February 1, 1997, in addition to the April 1 date, for comparativecalculations presented in the accompanying table.429. This average period figure reflected a standard deviation, as a measure of variability about the calculated meanor average value, of 46 percentage points, yielding a t-value of 2.16 (the mean divided by the standard deviation),indicating that within a confidence range of 90-95 percent, 98 percent represented the “true” mean of the series.Using the February 1, 1997 snowpack figure to account for unusual weather patterns in that year, this series meanwas 102 percent, standard deviation of 47 percentage points, yielding a t-value of 2.14, also statistically significantat a 90-95 percent confidence interval.430. This average period figure reflected a standard deviation of 70 percentage points, yielding a t-value of only1.59, indicating little confidence that 111 percent of average snowpack figure represented the true mean of theseries. Accounting for the unusual snowpack conditions of 1997 and using February 1, 1997 for snowpackmeasurements yielded an average of 114 percent, standard deviation of 70 percent, and t-value of 1.64, againindicating little statistical confidence in this value. One possible explanation of the larger variability of the lowerHumboldt River Basin’s snowpack water content readings was its location between the storm systems which tendto affect primarily the western Nevada watersheds and the more north-trending jet stream storm which mainly affectthe eastern Nevada and the upper Humboldt River Basin. This leaves the lower Humboldt River Basin between theseoccurrences and being affected, to varying degrees, by the severity and conditions of each.431. The Lake Tahoe basin actually constitutes the upper portion of the overall Truckee River Basin, but for NRCSsnowpack water content data, it has been segregated. Results for the Truckee River Basin also exclude the LakeTahoe Basin.432. According to the National Oceanic and Atmospheric Administration (NOAA), during a La Niña occurrencetemperatures are typically warmer than normal in the southeast United States and cooler than normal in thenorthwest, bringing drier than normal conditions to southern California and the Southwest. With the cold water inthe Pacific tropics characterizing a La Niña event, the chill, west-to-east high-altitude winds known as the jet streamno longer move southward attracted by the temperature differential which exists during the El Niño warm-waterevent. Therefore, instead of being “pulled” downward as the jet stream hurls across the United States, it tends toshift northward, driving winter storms northward and producing unusually wet springs in the Northwestern U.S.See Water Words Dictionary, op. cit.433. For a more extensive analysis of this flood event, see Horton, The Flood of 1997 – Final Report: An Analysisof Snowpack Water Content and Precipitation Changes in the Waterbasins of Western Nevada and the Effects onRunoff and Stream Flows, December 16, 1996—January 6, 1997, Nevada Division of Water Planning, Departmentof Conservation and Natural Resources, Carson City, Nevada, January 1997, updated and revised May 1997.434. Grayson, op. cit., page 86.

DIVISION OF WATER PLANNING Humboldt River Chronology—Part I
Nevada Water Basin Information and Chronology Series I–179
435. Salt Lake Tribune, September 21, 1997, reporting on a symposium held in Salt Lake City of more than 80geoscientists, biologists and archaeologists to discuss what the Great Basin region can teach us about global climatechange and the structure and movement of the Earth’s crust.436. Reheis, Marith, “Highest Pluvial-Lake Shorelines and Pleistocene Climate of the Western Great Basin,”Quaternary Research, 52, 1999, page 196.437. Ibid., page 197.438. Benson, Larry V., “Fluctuation in the Level of Pluvial Lake Lahontan During the Last 40,000 Years,”Quaternary Research, Volume 9, Number 3, University of Washington, 1978, pages 314–315.439. Grayson, op. cit., page 93.440. Benson, Larry V., “Preliminary Paleolimnologic Data for the Walker Lake Sub-Basin, California andNevada,” Water Resources Investigations Report 87–4258, U.S. Geological Survey, U.S. Department of the Interior,Denver, Colorado, 1988, page 2.441. Benson, op. cit., 1978.442. Houghton, op. cit., page 73.443. Benson, op. cit., 1978, page 316.444. Benson, op. cit., 1988, page 1.