humandimensions 2013-2014 r e s e a r c h p r o g r a m
TRANSCRIPT
Federal Aid ProjectNumber W-112-R-23Job Number 101.1Wildlife Restoration
Oct. 1, 2013-Sept. 30, 2014
Marc Miller, DirectorIllinois Department of Natural
Resources
Paul VehlowFederal Aid Coordinator
John E. BuhnerkempeChief, Division of Wildlife
Resources
Craig A. Miller, Ph.D.Program Leader and Principal InvestigatorHuman Dimensions Research ProgramIllinois Natural History Survey
Prepared byAndrew L. Stephenson,Laura A. Schweizer, Brent D. Williams,Linda K. Campbell, and Craig A. Miller
2013-2014 Illinois Hunter Harvest Report
INHS Technical Report 2014 (42)November 12, 2014
HumanDimensionsR e s e a r c h P r o g r a m
Illinois Natural History SurveyPrairie Research InstituteUniversity of Illinois at
Urbana-Champaign
Key words: License Sales, Harvest, Upland Game Hunting, Hunter Attitudes, EHD, Wild Hogs, Hunting Digest Use Suggested Citation: Stephenson, A.L., L.A. Schweizer, B.D. Williams, L.K. Campbell, and C.A. Miller. 2014. 2013-2014 Illinois Hunter Harvest Report. Job Completion Report, Federal Aid in Wildlife Restoration W-112-R-23. Human Dimensions Research Program Report HR-14-01/INHS Technical Report (42). Illinois Natural History Survey, Champaign, IL. 81pp.
LIST OF FIGURES
Page
Figure 1 ...............Number of resident hunting licenses purchased in Illinois, 1938-2013 ....................................................................................... 3
Figure 2 ...............Percent of hunters who purchased a hunting license in 2013 ....................................................................................................... 3
Figure 3 ...............Percent of hunters who hunted any wildlife species in Illinois between March 2013 and February 2014 ............................ 3
Figure 4 ...............Illinois rabbit harvest and hunter activity 2003-2013 .................................................................................................................... 4
Figure 5 ...............Illinois dove harvest and hunter activity 2003-2013....................................................................................................................... 5
Figure 6 ...............Illinois fox squirrel harvest and hunter activity 2003-2013 .......................................................................................................... 5
Figure 7 ...............Illinois gray squirrel harvest and hunter activity 2003-2013........................................................................................................ 6
Figure 8 ...............Illinois coyote harvest and hunter activity 2003-2013.................................................................................................................... 6
Figure 9 ...............Species hunters intended to hunt during the 2013-14 season ....................................................................................................... 7
Figure 10 .............Species hunters relied exclusively on receiving a Free Upland Game Permit to hunt ............................................................. 7
Figure 11 .............Percent of hunters who applied for a Free Upland Game Permit for the 2013-14 season ....................................................... 7
Figure 12 .............Percent of hunters who received a Free Upland Game Permit for the 2013-14 season ........................................................... 7
Figure 13 .............Percent of hunters whose first time applying for the permit was in the 2013-14 season ......................................................... 8
Figure 14 .............How often hunters apply for a Free Upland Game Permit........................................................................................................... 9
Figure 15 .............How often hunters are drawn for a Free Upland Game Permit .................................................................................................. 9
Figure 16 .............Number of sites hunters apply for when they apply for a Free Upland Game Permit ............................................................ 9
Figure 17 .............Percent of hunters who harvested Eurasian collared-doves in Illinois during the 2013 season ............................................. 10
Figure 18 .............The number of Eurasian collared-doves harvested by hunters in Illinois during the 2013 season ........................................ 10
Figure 19 .............Preferred potential changes to the Illinois Dove season if allowed 20 additional hunting days. ............................................ 10
Figure 20 .............Percent of hunters who reported observing dead deer from July through October 2013 ....................................................... 11
Figure 21 .............Percent of hunters that reported any of the dead deer they observed to the IDNR ................................................................. 11
Figure 22 .............Type of land hunters hunt most often for deer ............................................................................................................................... 12
Figure 23 .............Percent of hunters who observed wild hog during the 2013-14 season ....................................................................................... 13
Figure 24 .............Percent of hunters who would attempt to shoot a wild hog during firearm deer season ......................................................... 13
Figure 25 .............Percent of hunters who have hunted wild hogs in any state ......................................................................................................... 13
Figure 26 .............States in which hunters have hunted wild hogs .............................................................................................................................. 13
Figure 27 .............How often hunters use the Illinois Digest of Hunting and Trapping Regulations .................................................................... 14
Figure 28 .............Percent of hunters who took a paper copy of the Illinois Digest of Hunting and Trapping Regulations.............................. 14
Figure 29 .............Percent of hunters who picked up their Digest when they bought their hunting license ......................................................... 15
Figure 30 .............Number of paper copies hunters picked up during the 2013-14 hunting season ...................................................................... 15
Figure 31 .............Type of location hunters stored their paper copy of the Digest during the 2013-14 season .................................................... 15
Figure 32 .............Type of location where hunters picked up their copy of the Digest ............................................................................................ 15
Figure 33 .............Percent of hunters who tried to pick up a paper copy of the Digest, but one was not available............................................. 16
Figure 34 .............Whether inclusion of a removable insert would change the number of paper copies of the digest hunters take ................ 17
Figure 35 .............How frequently hunters would use an insert in the Digest containing Season start/end dates, etc. ....................................... 17
Figure 36 .............Gender distribution of hunters .......................................................................................................................................................... 17
Figure 37 .............Military status of those who hunted during the 2013-14 season .................................................................................................. 17
LIST OF TABLES AND APPENDICES
Page
Table 1 .................Number of resident hunting licenses purchased in Illinois, 1938-2013 ....................................................................................... 19
Table 2 .................Summary of statewide data from the 2013 Hunter Harvest Survey ........................................................................................... 20
Table 3 ................Estimated number (± 95% confidence interval) of Resident Licensed Hunters and Harvest................................................. 21
Table 4 ................Rabbit hunting effort and harvest by Wildlife Management Unit (WMU) ............................................................................... 22
Table 5 ................Non-Wild Quail hunting effort and harvest by Wildlife Management Unit (WMU) ............................................................... 22
Table 6 ................Wild Quail hunting effort and harvest by Wildlife Management Unit (WMU) ........................................................................ 23
Table 7 .................Non-Wild Pheasant hunting effort and harvest by Wildlife Management Unit (WMU) ......................................................... 23
Table 8 .................Wild Pheasant hunting effort and harvest by Wildlife Management Unit (WMU).................................................................. 24
Table 9 .................Non-Wild Gray Partridge hunting effort and harvest by Wildlife Management Unit (WMU).............................................. 24
Table 10 ...............Wild Gray Partridge hunting effort and harvest by Wildlife Management Unit (WMU) ...................................................... 25
Table 11 ...............Dove hunting effort and harvest by Wildlife Management Unit (WMU)................................................................................... 25
Table 12 ...............Woodcock hunting effort and harvest by Wildlife Management Unit (WMU) ......................................................................... 26
Table 13 ...............Snipe hunting effort and harvest by Wildlife Management Unit (WMU).................................................................................. 26
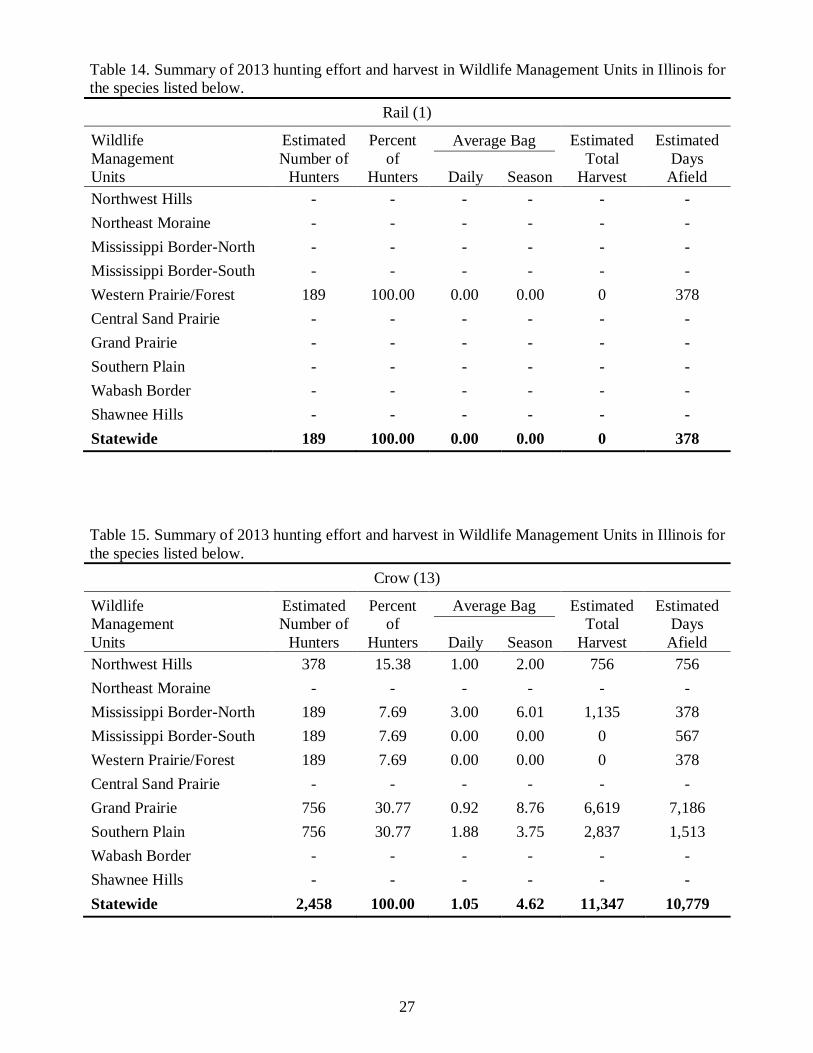
Table 14 ...............Rail hunting effort and harvest by Wildlife Management Unit (WMU) .................................................................................... 27
Table 15 ...............Crow hunting effort and harvest by Wildlife Management Unit (WMU).................................................................................. 27
Table 16 ...............Groundhog hunting effort and harvest by Wildlife Management Unit (WMU) ....................................................................... 28
Table 17 ...............Gray Squirrel hunting effort and harvest by Wildlife Management Unit (WMU)................................................................... 28
Table 18 ...............Fox Squirrel hunting effort and harvest by Wildlife Management Unit (WMU) ..................................................................... 29
Table 19 ...............Raccoon hunting effort and harvest by Wildlife Management Unit (WMU) ............................................................................ 29
Table 20 ...............Red Fox hunting effort and harvest by Wildlife Management Unit (WMU) ............................................................................. 30
Table 21 ...............Gray Fox hunting effort and harvest by Wildlife Management Unit (WMU)........................................................................... 30
Table 22 ...............Coyote hunting effort and harvest by Wildlife Management Unit (WMU) ............................................................................... 31
Table 23 ...............Opossum hunting effort and harvest by Wildlife Management Unit (WMU) ........................................................................... 31
Table 24 ...............Percent change in harvest from 2012 to 2013 in Wildlife Management Units ........................................................................... 32
Table 25 ...............Rabbit hunting effort and harvest by Administrative Region (AR) ............................................................................................ 33
Table 26 ...............Non-Wild Quail hunting effort and harvest by Administrative Region (AR) ........................................................................... 33
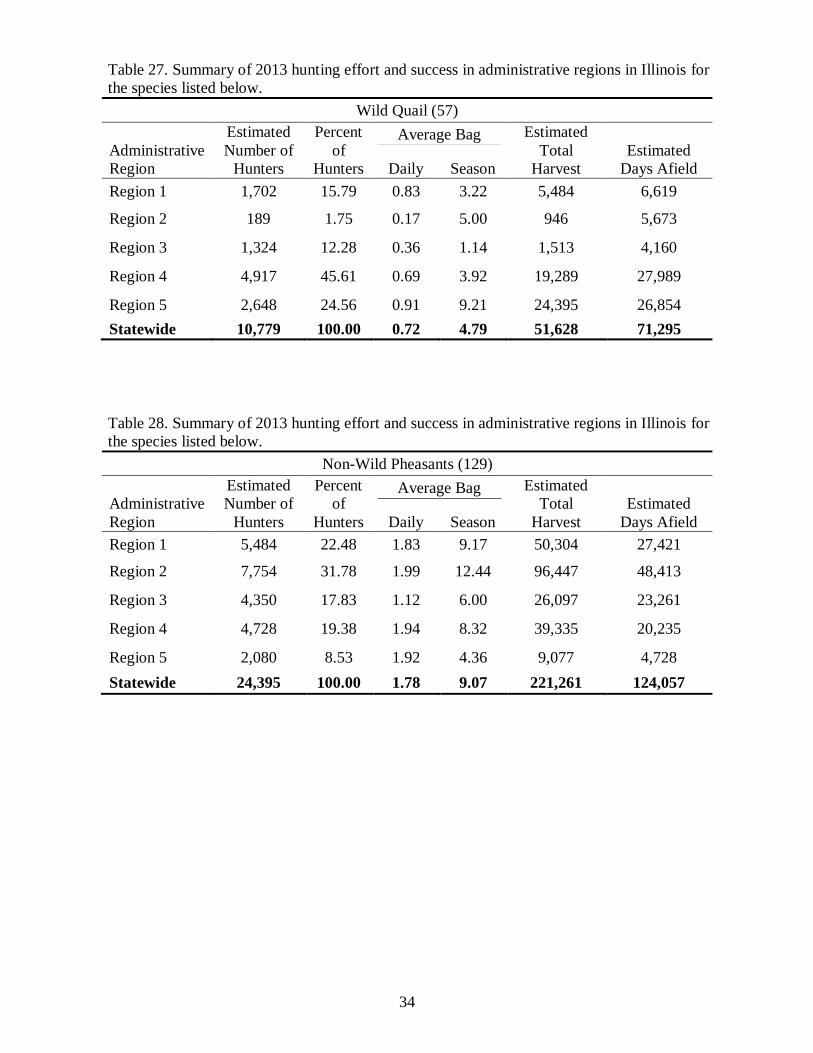
Table 27 ...............Wild Quail hunting effort and harvest by Administrative Region (AR) .................................................................................... 34
Table 28 ...............Non-Wild Pheasant hunting effort and harvest by Administrative Region (AR) ..................................................................... 34
Table 29 ...............Wild Pheasant hunting effort and harvest by Administrative Region (AR) .............................................................................. 35
Table 30 ...............Non-Wild Gray Partridge hunting effort and harvest by Administrative Region (AR) .......................................................... 35
Table 31 ...............Wild Gray Partridge hunting effort and harvest by Administrative Region (AR) ................................................................... 36
Table 32 ...............Dove hunting effort and harvest by Administrative Region (AR) ............................................................................................... 36
Table 33 ...............Woodcock hunting effort and harvest by Administrative Region (AR) ..................................................................................... 37
Table 34 ...............Snipe hunting effort and harvest by Administrative Region (AR) .............................................................................................. 37
Table 35 ...............Rail hunting effort and harvest by Administrative Region (AR)................................................................................................. 38
Table 36 ...............Crow hunting effort and harvest by Administrative Region (AR) .............................................................................................. 38
Table 37 ...............Groundhog hunting effort and harvest by Administrative Region (AR)) .................................................................................. 39
Table 38 ...............Gray Squirrel hunting effort and harvest by Administrative Region (AR) ............................................................................... 39
Table 39 ...............Fox Squirrel hunting effort and harvest by Administrative Region (AR) ................................................................................. 40
Table 40 ...............Raccoon hunting effort and harvest by Administrative Region (AR) ......................................................................................... 40
Table 41 ...............Red Fox hunting effort and harvest by Administrative Region (AR) ......................................................................................... 41
Table 42 ...............Gray Fox hunting effort and harvest by Administrative Region (AR) ....................................................................................... 41
Table 43 ...............Coyote hunting effort and harvest by Administrative Region (AR) ........................................................................................... 42
Table 44 ...............Opossum hunting effort and harvest by Administrative Region (AR) ....................................................................................... 42
Table 45 ...............Percent change in harvest from 2012 to 2013 in Administrative Regions for selected species ............................................... 43
Table 46 ...............Distribution of hunting effort and harvest in 2013 ........................................................................................................................ 44
Table 47 ...............Statewide data from resident Illinois hunters, 2003-2013 ............................................................................................................. 49
Table 48 ...............Percent change in statewide harvest (1-year, 5-year, 10-year) ..................................................................................................... 56
Table 49 ...............Species that hunters have increased their efforts for within the past five years ....................................................................... 57
Table 50 ...............Species that hunters have decreased their efforts for within the past five years ....................................................................... 57
Table 51 ...............Preferred species to hunt if hunters are given only one day to hunt only one species .............................................................. 58
Table 52 ...............2013-14 Season applicants’ satisfaction ratings for the Free Upland Game Permit application............................................ 58
Table 53 ...............Reasons why hunters do not apply for a Free Upland Game Permit every year ...................................................................... 59
Table 54 ...............Frequency of hunting upland game in Illinois on different types of land. ................................................................................. 59
Table 55 ...............Number of dead deer seen between July through October 2013 ................................................................................................. 60
Table 56 ...............Number of dead deer hunters reported to the IDNR ..................................................................................................................... 61
Table 57 ...............Counties in which hunters observed >20 deer believed to have died from EHD or BTV. ....................................................... 61
Table 58 ...............Perceptions of the impact of EHD and BTV on the deer population during 2013 in areas typically hunted ....................... 61
Table 59 ...............Perceptions of the impact of EHD and BTV on the deer population during 2012 in the entire state .................................... 62
Table 60 ...............Effect of EHD/BTV on hunting behaviors ....................................................................................................................................... 62
Table 61 ...............Number of deer seen during the 2013-14 deer season compared to 5 years ago ....................................................................... 62
Table 62 ...............Number of deer harvested during the 2013-14 deer season compared to 5 years ago.............................................................. 63
Table 63 ...............Reasons hunters did not go deer hunting during the 2013-14 seasons ........................................................................................ 63
Table 64 ...............Support for regulations on buck harvest ......................................................................................................................................... 64
Table 65 ...............Preference for “Late-Winter” antlerless-only Firearm season .................................................................................................... 64
Table 66 ...............Attitudes toward wild hogs in Illinois ............................................................................................................................................... 65
Table 67 ...............Use of the paper and/or electronic version of the Digest of Hunting and Trapping Regulations ........................................... 65
Table 68 ...............Desired information to be included on a removable insert from the Digest .............................................................................. 65
Appendix A .........Illinois Hunter Harvest Survey: 2013-2014 Season ........................................................................................................................ 66
Appendix B .........Cover letter sent with first mailing of the 2013-2014 Illinois Hunter Harvest Survey ............................................................. 75
Appendix C .........Thank you/reminder postcard sent as follow-up to the mailings ................................................................................................. 76
Appendix D .........Cover letter sent with second mailing of the 2013-2014 Illinois Hunter Harvest Survey ........................................................ 77
Appendix E .........Map of IDNR Wildlife Management Units ...................................................................................................................................... 78
Appendix F .........Map of IDNR Administrative Regions ............................................................................................................................................. 79
Appendix G ........Season dates, bag limits, and shooting hours for the 2013-14 hunting season in Illinois ......................................................... 80

2013-2014
ILLINOIS HUNTER HARVEST REPORT
JOB COMPLETION REPORT
WILDLIFE HARVEST AND
HUMAN DIMENSIONS RESEARCH PROGRAM
STATE OF ILLINOIS
PROJECT NUMBER: W-112-R-23
STUDY 101
JOB NO. 101.1
Prepared by
Andrew L. Stephenson, Laura A. Schweizer,
Brent D. Williams, Linda K. Campbell, and Craig A. Miller
Illinois Natural History Survey
Champaign, IL
November 24, 2014
Federal Aid in Wildlife Restoration
W-112-R-23
Illinois Department of Natural Resources
Marc Miller, Director John E. Buhnerkempe, Chief
Illinois Department of Natural Resources Division of Wildlife
Equal opportunity to participate in programs of the Illinois Department of Natural Resources (IDNR) and those
funded by the U.S. Fish and Wildlife Service and other agencies is available to all individuals regardless of
race, sex, national origin, disability, age, religion or other non-merit factors. If you believe you have been
discriminated against, contact the funding source’s civil rights office and/or the Equal Employment Opportunity
Officer, IDNR, One Natural Resources Way, Springfield, IL 62702-1271; 217/785-0067; TTY 217/782-9175.
1
ABSTRACT
A random sample of 3,000 hunters was selected from 2013 Illinois Habitat Stamp and hunting license
purchasers. Of the sample of 3,000 hunters, 72 addresses were removed as undeliverable. We received 1,508
questionnaires; 1,488 (51%) of which were usable. License sales decreased from 2012 (282,698) to the 2013
season (281,399). From the 2012-13 to 2013-14 seasons, harvests for 11 game species increased (dove, snipe,
crow, groundhog, fox and gray squirrel, raccoon, red and gray fox, coyote, and opossum), decreased for one
game species (woodcock), and did not change for one game species (rail) and could not be compared for four
game species (rabbit, wild quail, wild pheasant, and wild gray partridge). Hunters were also asked about their
use of the Illinois Digest of Hunting and Trapping Regulations, applying for Free Upland Game Permits, and
the effects of Epizootic Hemorrhagic Disease (EHD) and Blue Tongue Virus (BTV) on their deer hunting
behaviors, as well as their opinions about wild hogs present in Illinois.
OBJECTIVE
To survey resident hunters (18-24 game animal categories) annually to determine their activities and
harvest in Illinois.
METHODS
Hunters were randomly selected from the Illinois resident hunting licenses and state habitat stamp
database. Of the 3,000 hunters sampled, 1,500 were selected from license sales and 1,500 from habitat stamp
sales. From this sample 72 names were removed due to lack of forwarding addresses, incorrect addresses, or
deceased. Methods for survey questionnaire mailings and follow-up reminders followed those of Miller et al.
(1999). We mailed recipients a self-administered, 8-page questionnaire (Appendix A), cover letter (Appendix
B), and postage-paid return envelope on 21 April 2014. This mailing was followed with a thank you/reminder
postcard (Appendix C) on 08 May 2014. On 22 May 2014, a second questionnaire, cover letter (Appendix D),
and return envelope were mailed to non-respondents, and a second thank you/reminder postcard was mailed on
2
11 June 2014. A third and final questionnaire was mailed to non-respondents on 27 June 2014. Data were
coded, entered, and analyzed using SPSS 22.0 (SPSS Inc. 2012). Estimates for species harvests, number of
hunters, and days afield were computed using the formulas in Anderson and Campbell (1993). Harvest
estimates of game species included only those harvested by Illinois resident hunters; non-resident harvests were
not included. In an effort to discern whether some respondents have been reporting non-wild type harvest of
certain species (despite instructions to the contrary), hunters were asked to report non-wild quail, pheasant, and
partridge harvest on the 2012-13 questionnaire. The format of the question in 2013-14 was reverted to the 2011-
12 and previous years’ format. Therefore, estimates of wild quail, pheasant, and partridge harvested during
2012-13 was calculated differently than past estimates as well as the 2013-14 estimate, and comparisons across
years are to be made with extreme caution. Maps of state wildlife management units (WMUs) and
administrative regions are presented in Appendices E and F, respectively.
RESULTS
License Sales
Resident license sales for the 2013-14 hunting season totaled 281,399 and were lower than the 2012-13
license sales (282,698; Figure 1, Table 1).
We received 1,508 questionnaires, of which 1,488 were usable, for a 51% response rate. Of these, 97%
of respondents indicated that they purchased a hunting license in 2013 (Figure 2) and 86% indicated they had
hunted in Illinois during the 2013-14 season (March 2013 – February 2014) (Figure 3).

3
Figure 1. Number of resident hunting licenses purchased in Illinois, 1938-2013.
Harvest
Harvest estimates for deer and turkey are presented in Table 2 along with harvest estimates for 16 other
species; confidence intervals for all species are provided in Table 3. Harvest estimates for the 16 species,
excluding deer and turkey, are available by wildlife management units (WMUs) and administrative regions in
Tables 4-46. The harvest estimates from the last 10 years (2003 – 2013) are presented for all species in table 47
0
100
200
300
400
500
600
1938
1941
1944
1947
1950
1953
1956
1959
1962
1965
1968
1971
1974
1977
1980
1983
1986
1989
1992
1995
1998
2001
2004
2007
2010
2013
Res
iden
t H
unti
ng L
icen
ses
So
ld
(X 1
000)
Year
97.0%
3.0%
Yes No
85.5%
14.5%
Yes No
Figure 2. Percent of hunters who purchased a
hunting license in 2013 (n=1488). Figure 3. Percent of hunters who hunted any
wildlife species in Illinois between March 2013 and
February 2014 (n=1488).
4
and percent change in harvest is provided in table 48. Season dates and bag limits for species hunted can be
located in Appendix G.
Hunters indicated they increased their hunting effort toward deer (firearm & archery) and turkey, but
decreased effort toward rabbit and pheasant (Table 49, 50). If given only one day to hunt, a majority of hunters
(68.2%) identified deer as the species they would target (Table 51).
The 2013-14 estimates suggest an increase in harvests for 11 game species from 2012-13: dove, snipe,
crow, groundhog, fox and gray squirrel, raccoon, red and gray fox, coyote, and opossum. Decreases in harvest
estimates only occurred for one species: woodcock. Due to changes in methods used to estimate harvest of wild
quail, wild pheasant, and wild gray partridge, figures are not comparable to previous estimates other than 2011-
12 estimates, which suggest an increase in harvest for each of the species. Estimates for 2013-14 rabbit harvest
are not directly comparable to previous years as the season was extended to the middle of February, providing
at least two additional weeks of hunting in each zone. Between-year changes in harvests could not be calculated
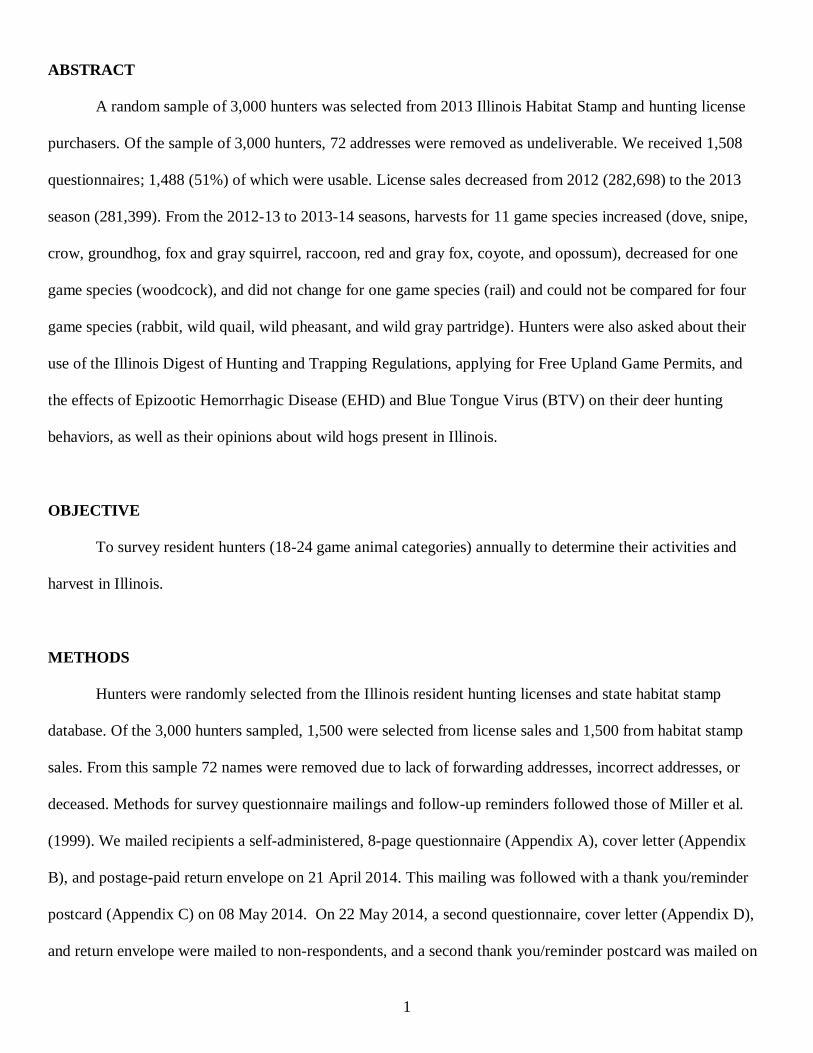
for rail, because hunters did not report any harvest either this year, the previous year, or both. Trends in
estimated number of hunters, harvest, and days afield for rabbit, dove, fox squirrel, gray squirrel, and coyote
from 2003-2013 are provided in Figures 4-8.
Figure 4. Illinois rabbit harvest and hunter activity (2003-2013). *2013-14 Season is not directly comparable to previous years because of increased season length.
0
10,000
20,000
30,000
40,000
50,000
60,000
70,000
80,000
90,000
2003 2004 2005 2006 2007 2008 2009 2010 2011 2012 2013
Year
Hunters
Harvest (x 10)
Days Afield (x 10)

5
Figure 5. Illinois dove harvest and hunter activity (2003-2013).
Figure 6. Illinois fox squirrel harvest and hunter activity (2003-2013).
0
20,000
40,000
60,000
80,000
100,000
120,000
140,000
160,000
180,000
200,000
2003 2004 2005 2006 2007 2008 2009 2010 2011 2012 2013
Year
Hunters
Harvest (x 10)
Days Afield (x 10)
0
10,000
20,000
30,000
40,000
50,000
60,000
70,000
80,000
90,000
2003 2004 2005 2006 2007 2008 2009 2010 2011 2012 2013
Year
Hunters
Harvest (x 10)
Days Afield (x 10)
6
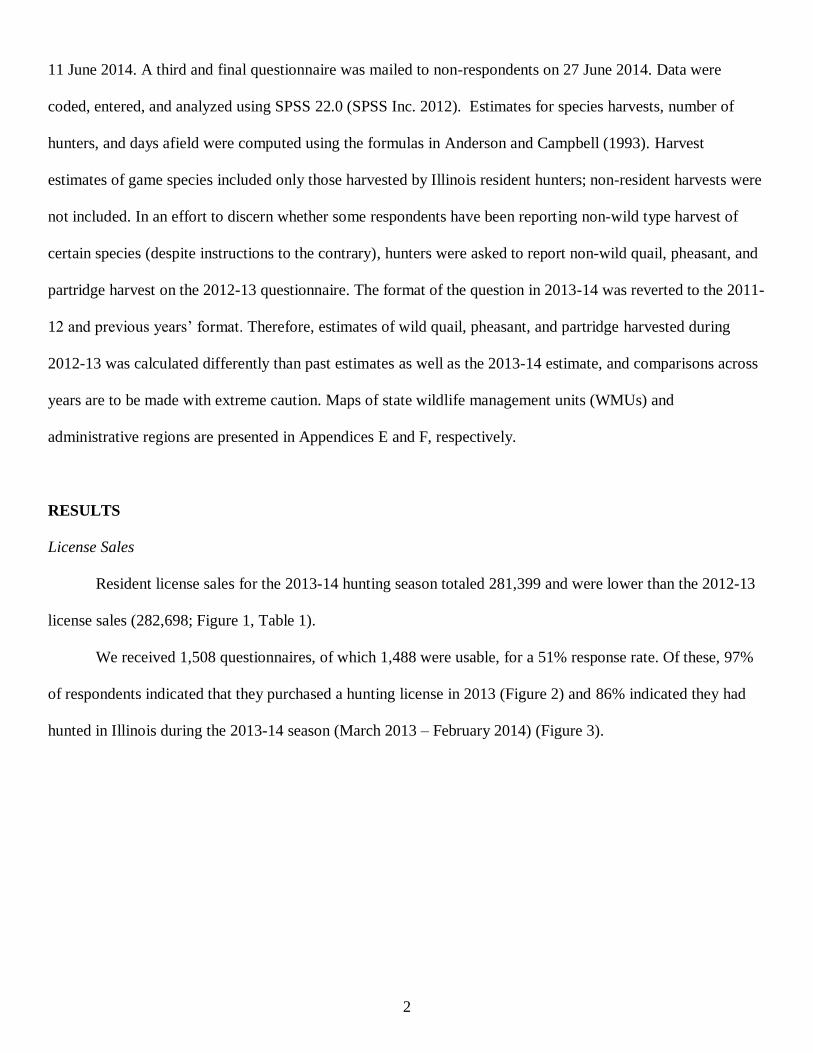
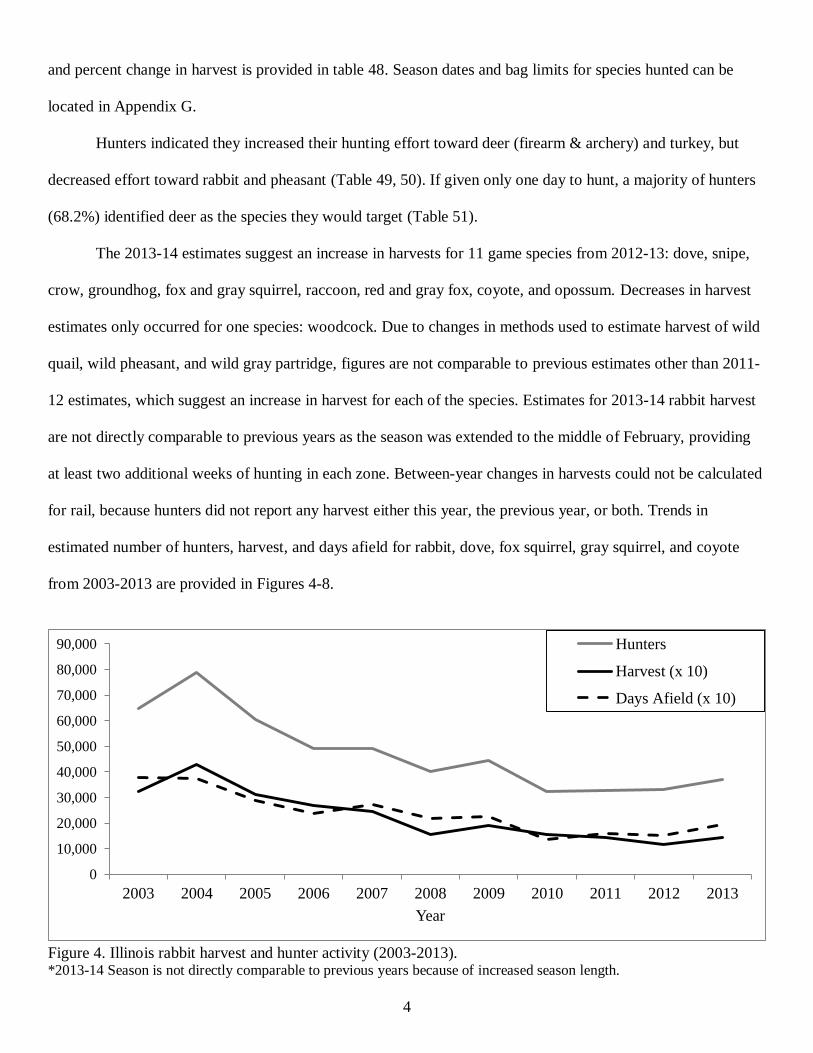
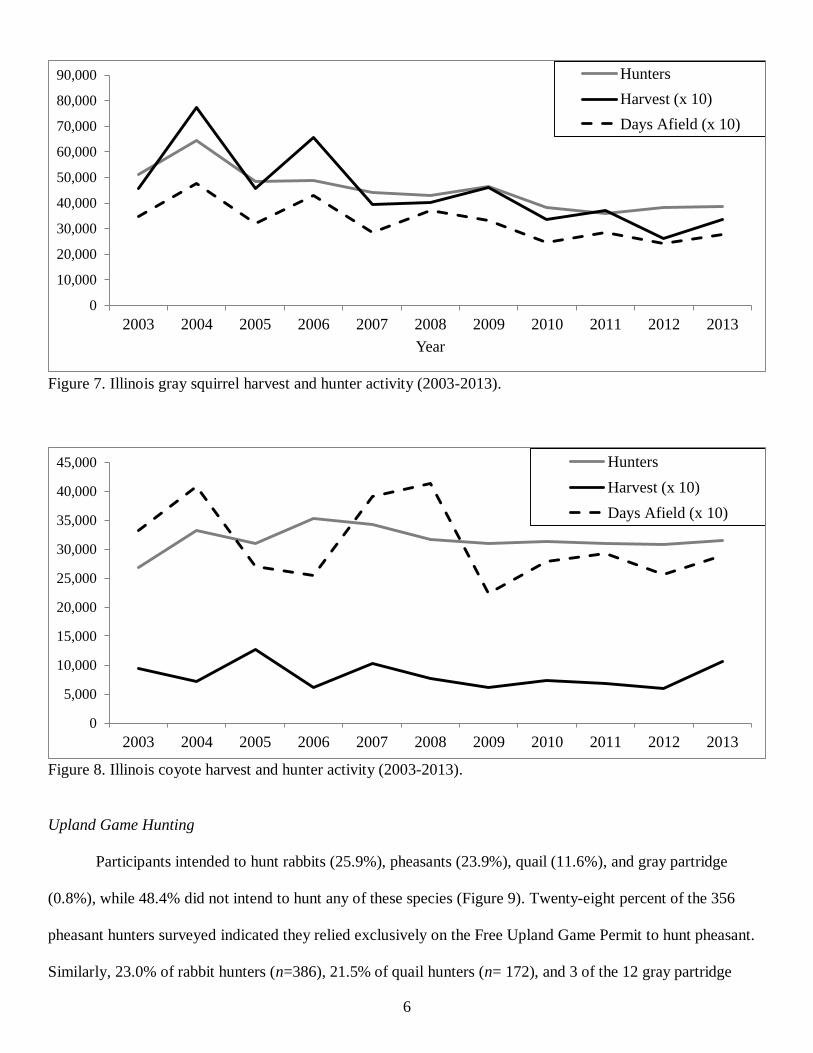
Figure 7. Illinois gray squirrel harvest and hunter activity (2003-2013).
Figure 8. Illinois coyote harvest and hunter activity (2003-2013).
Upland Game Hunting
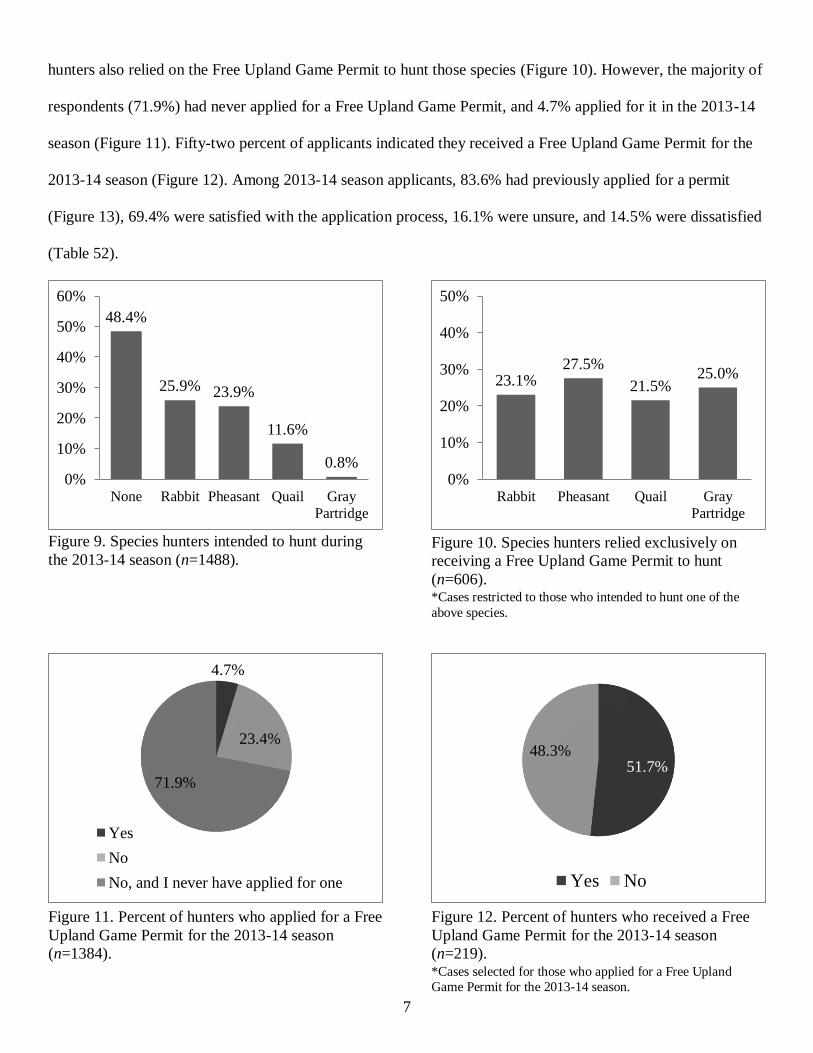
Participants intended to hunt rabbits (25.9%), pheasants (23.9%), quail (11.6%), and gray partridge
(0.8%), while 48.4% did not intend to hunt any of these species (Figure 9). Twenty-eight percent of the 356
pheasant hunters surveyed indicated they relied exclusively on the Free Upland Game Permit to hunt pheasant.
Similarly, 23.0% of rabbit hunters (n=386), 21.5% of quail hunters (n= 172), and 3 of the 12 gray partridge
0
10,000
20,000
30,000
40,000
50,000
60,000
70,000
80,000
90,000
2003 2004 2005 2006 2007 2008 2009 2010 2011 2012 2013
Year
Hunters
Harvest (x 10)
Days Afield (x 10)
0
5,000
10,000
15,000
20,000
25,000
30,000
35,000
40,000
45,000
2003 2004 2005 2006 2007 2008 2009 2010 2011 2012 2013
Hunters
Harvest (x 10)
Days Afield (x 10)
7
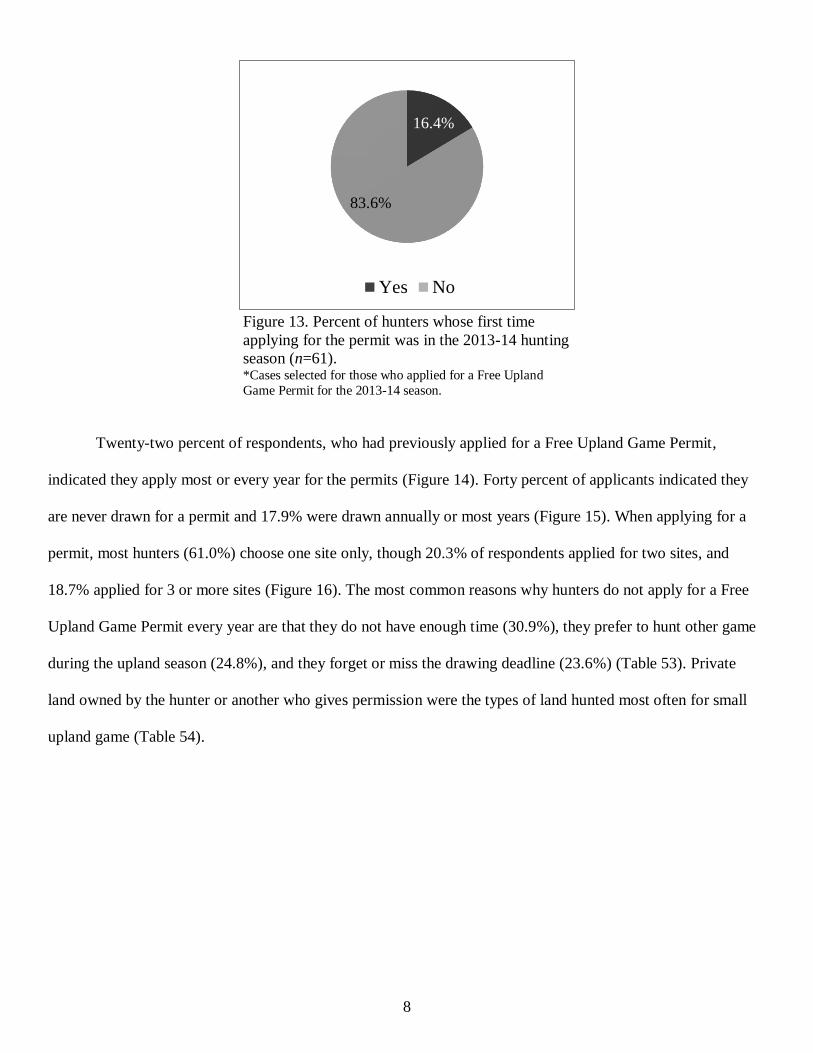
hunters also relied on the Free Upland Game Permit to hunt those species (Figure 10). However, the majority of
respondents (71.9%) had never applied for a Free Upland Game Permit, and 4.7% applied for it in the 2013-14
season (Figure 11). Fifty-two percent of applicants indicated they received a Free Upland Game Permit for the
2013-14 season (Figure 12). Among 2013-14 season applicants, 83.6% had previously applied for a permit
(Figure 13), 69.4% were satisfied with the application process, 16.1% were unsure, and 14.5% were dissatisfied
(Table 52).
48.4%
25.9% 23.9%
11.6%
0.8%0%
10%
20%
30%
40%
50%
60%
None Rabbit Pheasant Quail Gray
Partridge
23.1%27.5%
21.5%25.0%
0%
10%
20%
30%
40%
50%
Rabbit Pheasant Quail Gray
Partridge
4.7%
23.4%
71.9%
Yes
No
No, and I never have applied for one
51.7%48.3%
Yes No
Figure 9. Species hunters intended to hunt during
the 2013-14 season (n=1488). Figure 10. Species hunters relied exclusively on
receiving a Free Upland Game Permit to hunt
(n=606). *Cases restricted to those who intended to hunt one of the
above species.
Figure 11. Percent of hunters who applied for a Free
Upland Game Permit for the 2013-14 season
(n=1384).
Figure 12. Percent of hunters who received a Free
Upland Game Permit for the 2013-14 season
(n=219). *Cases selected for those who applied for a Free Upland
Game Permit for the 2013-14 season.
8
Twenty-two percent of respondents, who had previously applied for a Free Upland Game Permit,
indicated they apply most or every year for the permits (Figure 14). Forty percent of applicants indicated they
are never drawn for a permit and 17.9% were drawn annually or most years (Figure 15). When applying for a
permit, most hunters (61.0%) choose one site only, though 20.3% of respondents applied for two sites, and
18.7% applied for 3 or more sites (Figure 16). The most common reasons why hunters do not apply for a Free
Upland Game Permit every year are that they do not have enough time (30.9%), they prefer to hunt other game
during the upland season (24.8%), and they forget or miss the drawing deadline (23.6%) (Table 53). Private
land owned by the hunter or another who gives permission were the types of land hunted most often for small
upland game (Table 54).
16.4%
83.6%
Yes No
Figure 13. Percent of hunters whose first time
applying for the permit was in the 2013-14 hunting
season (n=61). *Cases selected for those who applied for a Free Upland
Game Permit for the 2013-14 season.

9
Dove hunters were queried if they had harvested any Eurasian collared-doves (Figure 17); 23 hunters
harvested an average of 4.83 Eurasian collared doves during the 2013 season (Figure 18). If 20 days were added
to the dove season, 47.2% of those who hunted dove in the previous year (n=195) would prefer them added
from October 27 to November 2 and December 26 to January 10. Running the season from September 1-
November 9 and December 26 – January 15 was preferred by 44.1%, and 8.7% would want the October to
November gap to remain with the 20 days added after December 26 (Figure 19).
50.8%
15.9%11.4% 9.1%
12.9%
0%
20%
40%
60%40.5%
19.7% 22.0%
12.7%
5.2%
0%
10%
20%
30%
40%
50%
2.4%
0.0%
3.3%
13.0%
20.3%
61.0%
0% 20% 40% 60% 80%
6
5
4
3
2
1
Figure 16. Number of sites hunters apply for when
they apply for a Free Upland Game Permit (n=123). *Cases selected for those who have previously applied for a
Free Upland Game Permit.
Figure 14. How often hunters apply for a Free
Upland Game Permit (n=264). *Cases selected for those who have previously applied for a
Free Upland Game Permit.
Figure 15. How often hunters are drawn for a Free
Upland Game Permit (n=173). *Cases selected for those who have previously applied for a
Free Upland Game Permit.

10
Hunter Attitudes Regarding EHD and Bluetongue Virus
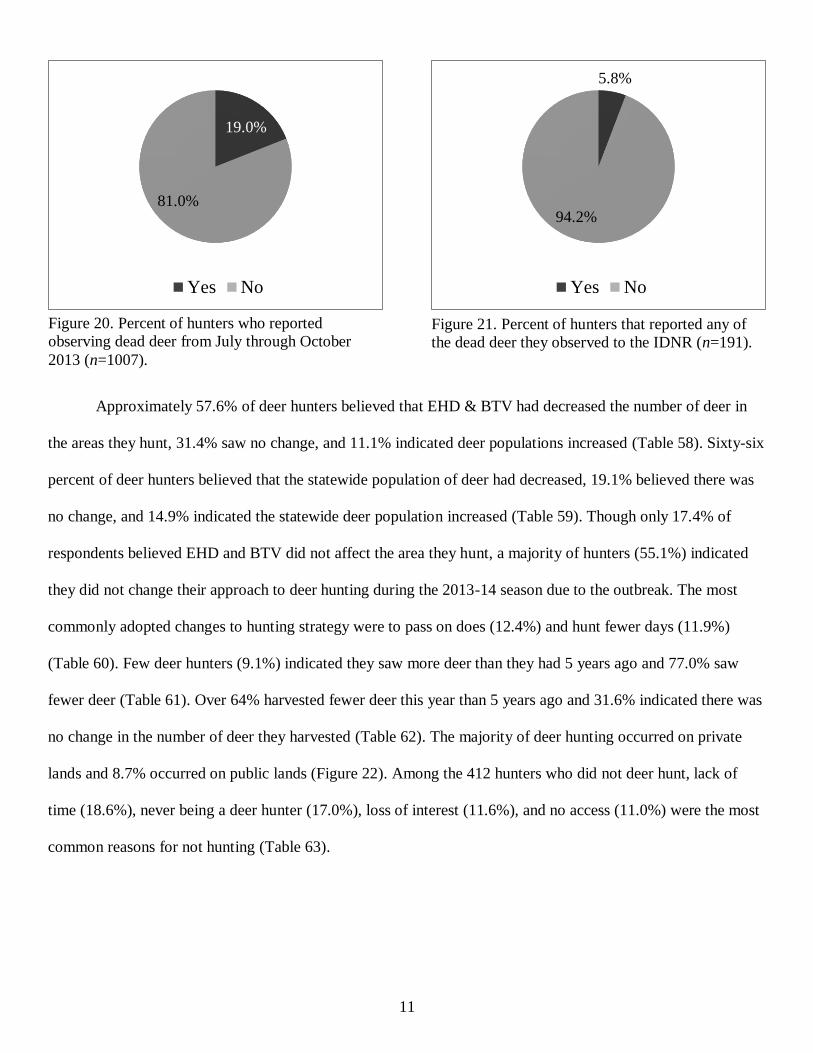
Nineteen percent of deer hunters reported they observed dead deer between July and October 2013
(Figure 20). Among this group, an average of 3.37 ± 3.84 dead deer were observed and 30.9% saw ≥4 deer
(Table 55). An average of 3.91 ± 4.6 of the deer were reported by hunters who contacted the IDNR; however,
94.2% of those who saw dead deer indicated they did not report them to IDNR (Figure 21, Table 56). Counties
in which more than 20 dead deer were reportedly seen include Calhoun, Wayne, Effingham, Pike, Adams,
Champaign, Christian, and Clay Counties (Table 57).
1.6%
95.9%
2.2%
Yes No Not Sure
35.3%
41.7%
25.0%
0% 10% 20% 30% 40% 50%
≥3
2
1
47.2%
8.7%
44.1%
0%
10%
20%
30%
40%
50%
Fill the 5 day gap between October 27
and November 2 and add 15 days from
December 26 – January 10
Leave the October – November gap and
add 20 days from December 26 –
January 15
Run the season from September 1 –
November 9 and add 20 days from
December 26 – January 15
Figure 18. The number of Eurasian collared-doves
harvested by hunters in Illinois during the 2013
season (n=23).
Figure 17. Percent of hunters who harvested
Eurasian collared-doves in Illinois during the 2013
season (n=1077).
Figure 19. Preferred potential changes to the Illinois Dove season if allowed 20 additional hunting days. The
current Illinois Dove Season is open September 1-October 27 and November 2-November 14 (n=195).
(n=1077).
11
Approximately 57.6% of deer hunters believed that EHD & BTV had decreased the number of deer in
the areas they hunt, 31.4% saw no change, and 11.1% indicated deer populations increased (Table 58). Sixty-six
percent of deer hunters believed that the statewide population of deer had decreased, 19.1% believed there was
no change, and 14.9% indicated the statewide deer population increased (Table 59). Though only 17.4% of
respondents believed EHD and BTV did not affect the area they hunt, a majority of hunters (55.1%) indicated
they did not change their approach to deer hunting during the 2013-14 season due to the outbreak. The most
commonly adopted changes to hunting strategy were to pass on does (12.4%) and hunt fewer days (11.9%)
(Table 60). Few deer hunters (9.1%) indicated they saw more deer than they had 5 years ago and 77.0% saw
fewer deer (Table 61). Over 64% harvested fewer deer this year than 5 years ago and 31.6% indicated there was
no change in the number of deer they harvested (Table 62). The majority of deer hunting occurred on private
lands and 8.7% occurred on public lands (Figure 22). Among the 412 hunters who did not deer hunt, lack of
time (18.6%), never being a deer hunter (17.0%), loss of interest (11.6%), and no access (11.0%) were the most
common reasons for not hunting (Table 63).
19.0%
81.0%
Yes No
5.8%
94.2%
Yes No
Figure 20. Percent of hunters who reported
observing dead deer from July through October
2013 (n=1007).
Figure 21. Percent of hunters that reported any of
the dead deer they observed to the IDNR (n=191).

12
The addition of a regulation limiting take to one antlered buck was highly polarized with 42.5% of
hunters in favor, 49.4% in opposition, and 8.0% of hunters unsure (Table 64). Over 64% of hunters agreed with
a 2 antlered buck regulation, 27.6% disagreed, and 7.9% were unsure. Greater unsureness (21.6%) was
indicated toward a two buck limit with only one taken before the close of the first firearm deer season, though
48.5% disagreed with this regulation and 29.9% agreed. Approximately 57.5% agreed that the dates of the late-
winter antlerless season were about right, 17.8% were unsure, and 24.7% disagreed (Table 65). Twenty-three
percent agreed with moving it to a single season in October, 15.9% were unsure, and 60.6% disagreed. Almost
fourteen percent agreed with moving late winter antlerless to a single season in September, 16.7% were unsure,
and 69.4% disagreed.
Wild Hogs
Though 44.2% of hunters agreed wild hogs are a source of disease, an equal amount (45.0%) were
unsure and 10.8% disagreed (Table 66). More than three-quarters of respondents (77.9%) agreed that wild hogs
destroy native wildlife and that they should be eliminated wherever possible. Over 71% agreed that Illinois is
better off without wild hogs, while 19.4% were unsure, and 9.4% disagreed. Thirteen participants (0.9%)
observed feral hogs during the 2013-14 season (Figure 23). Hogs were observed in Cass, Clay, Fulton, Jackson,
Marion, Ogle, Peoria, Pike, Pope, Randolph, Wayne, and Woodford Counties. A majority of hunters (77.3%)
2.1%
3.1%
6.6%
27.5%
60.8%
0% 20% 40% 60% 80%
Federal land
Private land under a lease
State land
Private land owned by me
Private land owned by someone who
gave me permission
Figure 22. Type of land hunters hunt most often for deer (n=969)

13
said they would attempt to shoot a wild hog if they encountered one while hunting during the firearm deer
season (Figure 24). One-tenth of respondents have hunted wild hogs in other states and traveled most often to
the Southeastern United States to do so (Figure 25, 26).
0.9%
99.1%
Yes No
77.3%
22.7%
Yes No
10.7%
89.3%
Yes No
9.0%
16.8%
17.4%
30.3%
0% 10% 20% 30% 40%
Missouri
Tennessee
Florida
Texas
Figure 25. Percent of hunters who have hunted
wild hogs in any state (n=1445).
Figure 23. Percent of hunters who observed wild
hog during the 2013-14 season. Cass, Clay, Fulton,
Jackson, Marion, Ogle, Peoria, Pike, Pope, Wayne,
& Woodford Counties each documented 1 report
and Randolph County recorded 2 reports to the
Illinois Natural History Survey (INHS) (n=1382). *Cases selected for those who indicated they observed at
least one wild hog during the 2013-14 Illinois hunting seasons.
Figure 24. Percent of hunters who would attempt to
shoot a wild hog if one was seen while hunting
during the firearm deer seasons (n=1386).
Figure 26. States in which hunters have hunted wild
hogs (n=155).
14
Hunting Digest Use
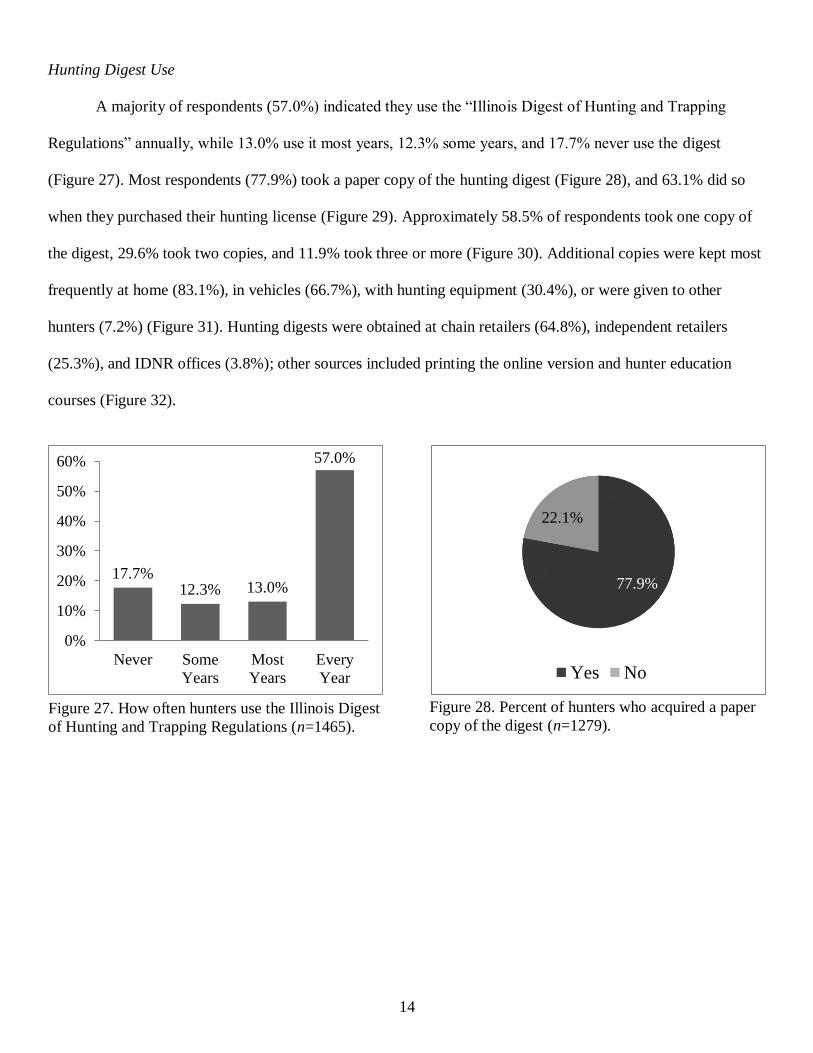
A majority of respondents (57.0%) indicated they use the “Illinois Digest of Hunting and Trapping
Regulations” annually, while 13.0% use it most years, 12.3% some years, and 17.7% never use the digest
(Figure 27). Most respondents (77.9%) took a paper copy of the hunting digest (Figure 28), and 63.1% did so
when they purchased their hunting license (Figure 29). Approximately 58.5% of respondents took one copy of
the digest, 29.6% took two copies, and 11.9% took three or more (Figure 30). Additional copies were kept most
frequently at home (83.1%), in vehicles (66.7%), with hunting equipment (30.4%), or were given to other
hunters (7.2%) (Figure 31). Hunting digests were obtained at chain retailers (64.8%), independent retailers
(25.3%), and IDNR offices (3.8%); other sources included printing the online version and hunter education
courses (Figure 32).
17.7%12.3% 13.0%
57.0%
0%
10%
20%
30%
40%
50%
60%
Never Some
Years
Most
Years
Every
Year
77.9%
22.1%
Yes No
Figure 27. How often hunters use the Illinois Digest
of Hunting and Trapping Regulations (n=1465).
Figure 28. Percent of hunters who acquired a paper
copy of the digest (n=1279).

15
The paper version of the digest was preferred by a majority of hunters (86.2%), though a combination of
online and paper versions were used by 10-20%; the online version alone was used in the lowest proportion by
approximately 10% of respondents. The paper version alone was used 50-70% of the time for obtaining
important hunting information (hunting regulations and rules, seasons and bag limits, etc.). Neither version was
used for the steel shot lethality table by 36.6% of respondents, and 21.9% used neither for the maps and
information on public hunting areas (Table 67).
63.1%
36.9%
Yes No
11.9%
29.6%
58.5%
0% 20% 40% 60% 80%
3+
2
1
19.8%
30.4%
66.7%
83.1%
0% 25% 50% 75% 100%
Other: camp, cabin,
blind, gave to someone,
work
Hunting Bag
Vehicle
Home
6.1%
3.8%
25.3%
64.8%
0% 20% 40% 60% 80%
Other
IDNR Office
Independent retail
store
Chain retail store
Figure 29. Percent of hunters who picked up their
copy of the digest at the same time they bought their
hunting license (n=992).
Figure 30. Number of paper copies of the digest
hunters picked up during the 2013-14 hunting
season (n=993),
x̄= 1.65±1.81.
Figure 31. Type of location hunters stored their
paper copy of the digest during the 2013-14 season
(n=414).
.
Figure 32. Type of location where hunters picked up
their most recent paper copy of the digest (n=1156).
.
16
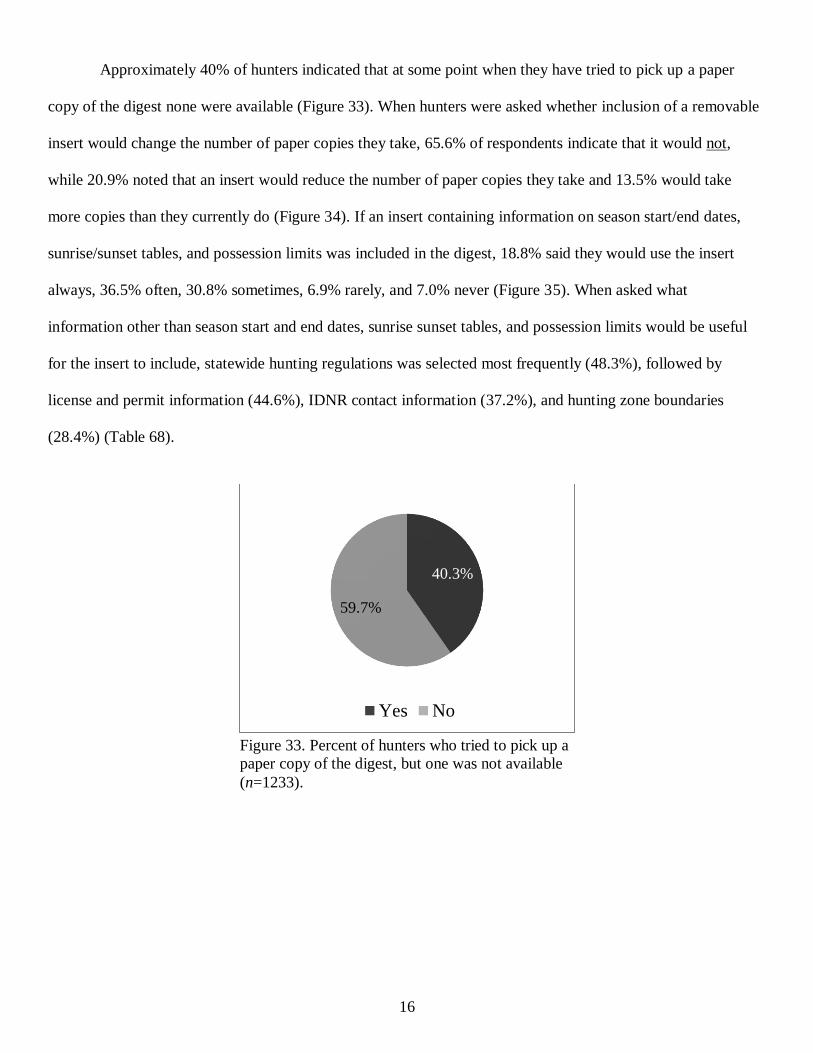
Approximately 40% of hunters indicated that at some point when they have tried to pick up a paper
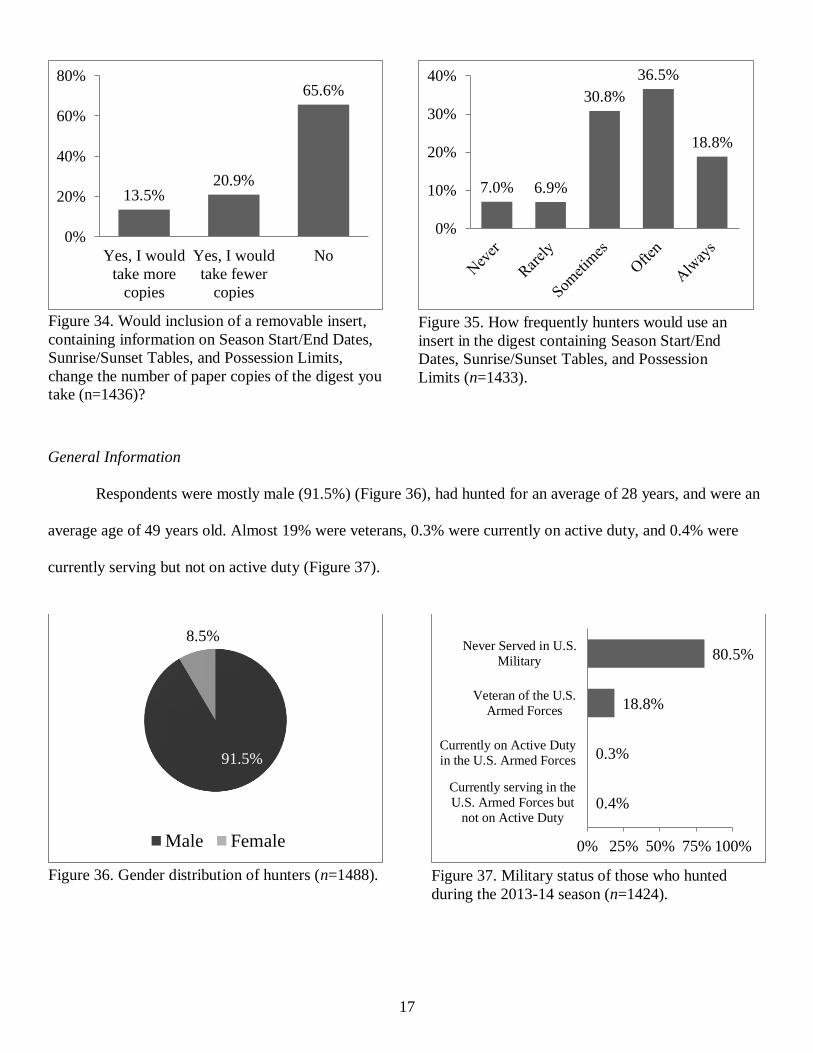
copy of the digest none were available (Figure 33). When hunters were asked whether inclusion of a removable
insert would change the number of paper copies they take, 65.6% of respondents indicate that it would not,
while 20.9% noted that an insert would reduce the number of paper copies they take and 13.5% would take
more copies than they currently do (Figure 34). If an insert containing information on season start/end dates,
sunrise/sunset tables, and possession limits was included in the digest, 18.8% said they would use the insert
always, 36.5% often, 30.8% sometimes, 6.9% rarely, and 7.0% never (Figure 35). When asked what
information other than season start and end dates, sunrise sunset tables, and possession limits would be useful
for the insert to include, statewide hunting regulations was selected most frequently (48.3%), followed by
license and permit information (44.6%), IDNR contact information (37.2%), and hunting zone boundaries
(28.4%) (Table 68).
40.3%
59.7%
Yes No
Figure 33. Percent of hunters who tried to pick up a
paper copy of the digest, but one was not available
(n=1233).
17
General Information
Respondents were mostly male (91.5%) (Figure 36), had hunted for an average of 28 years, and were an
average age of 49 years old. Almost 19% were veterans, 0.3% were currently on active duty, and 0.4% were
currently serving but not on active duty (Figure 37).
13.5%20.9%
65.6%
0%
20%
40%
60%
80%
Yes, I would
take more
copies
Yes, I would
take fewer
copies
No
7.0% 6.9%
30.8%
36.5%
18.8%
0%
10%
20%
30%
40%
91.5%
8.5%
Male Female
0.4%
0.3%
18.8%
80.5%
0% 25% 50% 75% 100%
Currently serving in the
U.S. Armed Forces but
not on Active Duty
Currently on Active Duty
in the U.S. Armed Forces
Veteran of the U.S.
Armed Forces
Never Served in U.S.
Military
Figure 34. Would inclusion of a removable insert,
containing information on Season Start/End Dates,
Sunrise/Sunset Tables, and Possession Limits,
change the number of paper copies of the digest you
take (n=1436)?
.
Figure 35. How frequently hunters would use an
insert in the digest containing Season Start/End
Dates, Sunrise/Sunset Tables, and Possession
Limits (n=1433).
.
Figure 37. Military status of those who hunted
during the 2013-14 season (n=1424).
Figure 36. Gender distribution of hunters (n=1488).

18
References
Anderson, W.L., and L.K. Campbell. 1993. Illinois Hunter Harvest Survey, 1992. Illinois Department of
Natural Resources, Federal Aid in Wildlife Restoration Project W-112-R, Job 1, Job Completion Report
65pg.
IBM SPSS Inc. 2012. SPSS for Windows. IBM Corporation, 1 New Orchard Road, Armonk NY, U.S.A.
Miller, C.A., L.K. Campbell and K.D. Caldwell. 1999. 1998-99 Illinois Hunter Harvest Survey Report.
Illinois Department of Natural Resources, Federal Aid in Wildlife Restoration Project W-112-R-8, Job
1, Job Completion Report 77pg.

19
Table 1. Number of resident hunting licenses purchased in Illinois, 1938-2013.
Year
Licenses
(x 1,000) Year
Licenses
(x 1,000)
1938 294 1976 458
1939 322 1977 424
1940 297 1978 389
1941 337 1979 344 a
1942 309 1980 337
1943 265 1981 338
1944 308 1982 328
1945 321 1983 315
1946 423 1984 310
1947 412 1985 307
1948 451 1986 311
1949 497 1987 317
1950 481 1988 323
1951 477 1989 317
1952 493 1990 330
1953 508 1991 336
1954 506 1992 317
1955 521 1993 313
1956 553 1994 326 b
1957 503 1995 324
1958 502 1996 316
1959 492 1997 305
1960 471 1998 301
1961 463 1999 294 c
1962 473 2000 290
1963 482 2001 296
1964 474 2002 289
1965 452 2003 293
1966 470 2004 300
1967 481 2005 280
1968 399 2006 282d
1969 427 2007 283
1970 448 2008 284
1971 464 2009 288
1972 446 2010 282
1973 478 2011 282
1974
1975
470
463
2012
2013
283
281 a Includes Sportsmen’s (combination hunting/fishing) licenses beginning in 1979. b Includes senior citizen (≥ 65 years) hunting licenses beginning in 1994. c Includes senior citizen (≥ 65 years) Sportsmen’s (combination hunting/fishing) licenses
beginning in 1999. d
Includes apprentice hunting licenses beginning in 2006.

20
Table 2. Summary of statewide data from the 2013 Hunter Harvest Survey (n =1,488).
Species
Total
Estimated
Hunters
Percent
of
License
Salesa
Average Bag Total
Estimated
Harvest
Days Hunting
Daily Season Average
Total
Estimated
Rabbit 37,066 13.17 0.73 3.84 142,401 5.23 194,029
Non-wild Quail 6,052 2.15 4.77 21.31 128,974 4.47 27,043
Wild Quail 10,779 3.83 0.72 4.79 51,628 6.61 71,295
Non-wild Pheasant 24,395 8.67 1.78 9.07 221,261 5.09 124,057
Wild Pheasant 14,940 5.31 0.33 1.38 20,613 4.22 62,974
Dove 40,281 14.31 4.62 19.94 803,159 4.31 173,794
Non-wild Gray
Partridge 1,135 0.40 2.18 4.00 4,539 1.83 2,080
Wild Gray Partridge 189 0.07 0.20 2.00 378 10.00 1,891
Woodcock 189 0.07 0.00 0.00 0 1.00 189
Snipe 189 0.07 2.00 2.00 378 1.00 189
Rail 189 0.07 0.00 0.00 0 2.00 378
Crow 2,458 0.87 1.05 4.62 11,347 4.38 10,779
Groundhog 4,160 1.48 0.91 3.73 15,507 4.09 17,020
Fox Squirrel 41,416 14.72 0.82 5.38 222,963 6.56 271,754
Gray Squirrel 38,579 13.71 1.22 8.72 336,430 7.17 276,671
Turkey-Spring 49,358 17.54 0.11 0.43 21,181 3.94 194,596
Turkey-Fall Shotgun 6,619 2.35 0.17 0.49 3,215 2.80 18,533
Turkey-Fall Archery 18,344 6.52 0.01 0.18 3,215 15.78 289,530
Deer-Regular Firearm 163,771 58.20 0.11 0.49 80,373 4.45 729,216
Deer-Muzzleloader 29,123 10.35 0.11 0.27 7,943 2.57 74,888
Deer-Archery 104,390 37.10 0.03 0.45 46,711 17.40 1,816,799
Deer-Late winter
antlerless 38,768 13.78 0.08 0.18 6,997 2.35 90,963
Deer- Special CWD
Season 7,754 2.76 0.08 0.15 1,135 1.95 15,129
Raccoon 9,077 3.23 1.12 15.50 140,699 13.85 125,759
Red Fox 1,324 0.47 0.09 1.29 1,702 14.57 19,289
Gray Fox 1,135 0.40 0.15 3.00 3,404 20.17 22,883
Coyote 31,582 11.22 0.37 3.35 105,903 9.14 288,774
Opossum 1,702 0.60 0.82 8.11 13,805 9.89 16,831 a Sum across species > 100% because many respondents reported hunting >1 species.

21
Table 3. Estimated number (± 95% confidence interval) of Resident Licensed Hunters and Harvest in
Illinois, 2013 (n =1,488).
Species n
Total Estimated
Hunters
Estimated Average
Season Bag
Total Estimated
Harvest
Rabbit 196 37,066 ± 4,934 3.84 ± 0.72 142,401 ± 33,256
Non-Wild Quail 32 6,052 ± 2,116 21.31 ± 13.39 128,974 ± 93,058
Wild Quail 57 10,779 ± 2,800 4.79 ± 2.75 51,628 ± 32,835
Non-Wild Pheasant 129 24,395 ± 4,105 9.07 ± 1.91 221,261 ± 60,141
Wild Pheasant 79 14,940 ± 3,271 1.38 ± 0.64 20,613 ± 10,764
Non-Wild Gray Partridge 6 1,135 ± 925 4.00 ± 1.01 4,539 ± 3,852
Wild Gray Partridge 1 189 ± 378 2.00 ± 4.16 378 ± 2,043
Dove 212 40,281 ± 5,110 19.94 ± 3.12 803,159 ± 163,370
Woodcock 1 189 ± 378 0.00 ± 0.00 0 ± 0
Snipe 1 189 ± 378 2.00 ± 0.00 378 ± 759
Rail 1 189 ± 378 0.00 ± 0.00 0 ± 0
Crow 13 2,458 ± 1,358 4.62 ± 3.21 11,347 ± 9,964
Groundhog 22 4,160 ± 1,761 3.73 ± 1.65 15,507 ± 9,497
Gray Squirrel 204 38,579 ± 5,018 8.72 ± 1.83 336,430 ± 84,137
Fox Squirrel 219 41,416 ± 5,169 5.38 ± 0.97 222,963 ± 49,596
Raccoon 48 9,077 ± 2,578 15.50 ± 5.53 140,699 ± 64,564
Red Fox 7 1,324 ± 998 1.29 ± 1.26 1,702 ± 2,043
Gray Fox 6 1,135 ± 925 3.00 ± 3.85 3,404 ± 4,931
Coyote 167 31,582 ± 4,605 3.35 ± 1.52 105,903 ± 51,355
Opossum 9 1,702 ± 1,131 8.11 ± 6.71 13,805 ± 14,312

22
Table 4. Summary of 2013 hunting effort and harvest in Wildlife Management Units in Illinois for
the species listed below.
Rabbit (196)
Wildlife
Management
Units
Estimated
Number of
Hunters
Percent
of
Hunters
Average Bag Estimated
Total
Harvest
Estimated
Days
Afield Daily Season
Northwest Hills 2,837 7.65 0.45 2.47 6,997 15,696
Northeast Moraine 567 1.53 0.70 2.33 1,324 1,891
Mississippi Border-North 1,135 3.06 0.90 4.33 4,917 5,484
Mississippi Border-South 4,728 12.76 0.84 2.92 13,805 16,453
Western Prairie/Forest 3,782 10.20 0.91 3.45 13,049 14,373
Central Sand Prairie 1,135 3.06 0.67 7.50 8,510 12,671
Grand Prairie 12,481 33.67 0.61 3.09 38,579 63,731
Southern Plain 8,321 22.45 0.97 5.68 47,278 48,980
Wabash Border 1,324 3.57 0.27 1.71 2,269 8,321
Shawnee Hills 756 2.04 0.88 7.50 5,673 6,430
Statewide 37,066 100.00 0.73 3.84 142,401 194,029
Table 5. Summary of 2013 hunting effort and harvest in Wildlife Management Units in Illinois for the
species listed below.
Non-Wild Quail (32)
Wildlife
Management
Units
Estimated
Number of
Hunters
Percent
of
Hunters
Average Bag Estimated
Total
Harvest
Estimated
Days
Afield Daily Season
Northwest Hills 189 3.13 0.33 2.00 378 1,135
Northeast Moraine 189 3.13 5.00 10.00 1,891 378
Mississippi Border-North 378 6.25 3.18 35.00 13,238 4,160
Mississippi Border-South 189 3.13 6.00 6.00 1,135 189
Western Prairie/Forest 567 9.38 6.79 31.67 17,966 2,648
Central Sand Prairie 567 9.38 2.00 4.00 2,269 1,135
Grand Prairie 1,324 21.88 3.73 13.86 18,344 4,917
Southern Plain 1,891 31.25 4.12 17.30 32,716 7,943
Wabash Border 756 12.50 9.04 54.25 41,037 4,539
Shawnee Hills - - - - - -
Statewide 6,052 100.00 4.77 21.31 128,974 27,043

23
Table 6. Summary of 2013 hunting effort and harvest in Wildlife Management Units in
Illinois for the species listed below.
Wild Quail (57)
Wildlife
Management
Units
Estimated
Number of
Hunters
Percent
of
Hunters
Average Bag Estimated
Total
Harvest
Estimated
Days
Afield Daily Season
Northwest Hills 378 3.51 0.67 1.00 378 567
Northeast Moraine - - - - - -
Mississippi Border-North 378 3.51 1.41 12.00 4,539 3,215
Mississippi Border-South 1,513 14.04 0.24 2.00 3,026 12,671
Western Prairie/Forest 1,135 10.53 0.88 3.83 4,350 4,917
Central Sand Prairie 756 7.02 0.41 1.75 1,324 3,215
Grand Prairie 2,269 21.05 0.25 1.58 3,593 14,183
Southern Plain 3,593 33.33 1.23 7.79 27,989 22,693
Wabash Border 378 3.51 1.00 5.50 2,080 2,080
Shawnee Hills 378 3.51 0.56 11.50 4,350 7,754
Statewide 10,779 100.00 0.72 4.79 51,628 71,295
Table 7. Summary of 2013 hunting effort and harvest in Wildlife Management Units in
Illinois for the species listed below.
Non-Wild Pheasant (129)
Wildlife
Management
Units
Estimated
Number of
Hunters
Percent
of
Hunters
Average Bag Estimated
Total
Harvest
Estimated
Days
Afield Daily Season
Northwest Hills 946 3.88 1.53 9.80 9,266 6,052
Northeast Moraine 2,080 8.53 2.47 10.09 20,991 8,510
Mississippi Border-North 189 0.78 2.00 4.00 756 378
Mississippi Border-South 1,513 6.20 1.78 4.00 6,052 3,404
Western Prairie/Forest 946 3.88 2.00 4.80 4,539 2,269
Central Sand Prairie 1,324 5.43 2.15 10.43 13,805 6,430
Grand Prairie 13,238 54.26 1.73 10.36 137,106 79,427
Southern Plain 3,593 14.73 1.76 6.58 23,639 13,427
Wabash Border 567 2.33 1.23 9.00 5,106 4,160
Shawnee Hills - - - - - -
Statewide 24,395 100.00 1.78 9.07 221,261 124,057

24
Table 8. Summary of 2013 hunting effort and harvest in Wildlife Management Units in Illinois for
the species listed below.
Wild Pheasant (79)
Wildlife
Management
Units
Estimated
Number of
Hunters
Percent
of
Hunters
Average Bag Estimated
Total
Harvest
Estimated
Days
Afield Daily Season
Northwest Hills 946 6.33 0.22 0.40 378 1,702
Northeast Moraine 189 1.27 0.00 0.00 0 567
Mississippi Border-North 189 1.27 0.00 0.00 0 2,837
Mississippi Border-South 378 2.53 0.05 0.50 189 3,971
Western Prairie/Forest 378 2.53 0.33 0.50 189 567
Central Sand Prairie 1,135 7.59 0.43 1.00 1,135 2,648
Grand Prairie 11,158 74.68 0.38 1.68 18,722 49,169
Southern Plain 378 2.53 0.00 0.00 0 1,324
Wabash Border 189 1.27 0.00 0.00 0 189
Shawnee Hills - - - - - -
Statewide 14,940 100.00 0.33 1.38 20,613 62,974
Table 9. Summary of 2013 hunting effort and harvest in Wildlife Management Units in Illinois for
the species listed below.
Non-Wild Gray Partridge (6)
Wildlife
Management
Units
Estimated
Number of
Hunters
Percent
of
Hunters
Average Bag Estimated
Total
Harvest
Estimated
Days
Afield Daily Season
Northwest Hills - - - - - -
Northeast Moraine 189 16.67 0.03 6.00 1,135 378
Mississippi Border-North - - - - - -
Mississippi Border-South 189 16.67 0.03 5.00 946 567
Western Prairie/Forest 189 16.67 0.02 3.00 567 189
Central Sand Prairie - - - - - -
Grand Prairie 567 50.00 0.01 3.33 1,891 946
Southern Plain - - - - - -
Wabash Border - - - - - -
Shawnee Hills - - - - - -
Statewide 1,135 100.00 2.18 4.00 4,539 2,080

25
Table 10. Summary of 2013 hunting effort and harvest in Wildlife Management Units in Illinois for
the species listed below.
Wild Gray Partridge (1)
Wildlife
Management
Units
Estimated
Number
of Hunters
Percent
of
Hunters
Average Bag Estimated
Total
Harvest
Estimated
Days
Afield Daily Season
Northwest Hills - - - - - -
Northeast Moraine - - - - - -
Mississippi Border-North - - - - - -
Mississippi Border-South - - - - - -
Western Prairie/Forest - - - - - -
Central Sand Prairie - - - - - -
Grand Prairie 189 100.00 0.01 2.00 378 1,891
Southern Plain - - - - - -
Wabash Border - - - - - -
Shawnee Hills - - - - - -
Statewide 189 100.00 0.20 2.00 378 1,891
Table 11. Summary of 2013 hunting effort and harvest in Wildlife Management Units in Illinois for
the species listed below.
Dove (213)
Wildlife
Management
Units
Estimated
Number of
Hunters
Percent
of
Hunters
Average Bag Estimated
Total
Harvest
Estimated
Days
Afield Daily Season
Northwest Hills 1,702 4.25 2.19 10.22 17,398 7,943
Northeast Moraine 1,324 3.30 5.23 19.43 25,719 4,917
Mississippi Border-North 1,135 2.83 4.00 28.00 31,771 7,943
Mississippi Border-South 5,484 13.62 5.68 22.72 124,625 21,937
Western Prairie/Forest 5,295 13.21 4.25 17.61 93,232 21,937
Central Sand Prairie 2,269 5.66 2.88 11.75 26,665 9,266
Grand Prairie 13,805 34.43 5.27 19.99 275,914 52,384
Southern Plain 8,321 20.75 4.25 21.91 182,304 42,928
Wabash Border 567 1.42 4.00 10.67 6,052 1,513
Shawnee Hills 378 0.94 6.44 51.50 19,479 3,026
Statewide 40,281 100.00 4.62 19.94 803,159 173,794

26
Table 12. Summary of 2013 hunting effort and harvest in Wildlife Management Units in Illinois for
the species listed below.
Woodcock (1)
Wildlife
Management
Units
Estimated
Number of
Hunters
Percent
of
Hunters
Average Bag Estimated
Total
Harvest
Estimated
Days
Afield Daily Season
Northwest Hills - - - - - -
Northeast Moraine - - - - - -
Mississippi Border-North - - - - - -
Mississippi Border-South - - - - - -
Western Prairie/Forest - - - - - -
Central Sand Prairie - - - - - -
Grand Prairie 189 100.00 0.00 0.00 0 189
Southern Plain - - - - - -
Wabash Border - - - - - -
Shawnee Hills - - - - - -
Statewide 189 100.00 0.00 0.00 0 189
Table 13. Summary of 2013 hunting effort and harvest in Wildlife Management Units in Illinois for
the species listed below.
Snipe (1)
Wildlife
Management
Units
Estimated
Number of
Hunters
Percent
of
Hunters
Average Bag Estimated
Total
Harvest
Estimated
Days
Afield Daily Season
Northwest Hills - - - - - -
Northeast Moraine - - - - - -
Mississippi Border-North - - - - - -
Mississippi Border-South - - - - - -
Western Prairie/Forest - - - - - -
Central Sand Prairie - - - - - -
Grand Prairie 189 100.00 2.00 2.00 378 189
Southern Plain - - - - - -
Wabash Border - - - - - -
Shawnee Hills - - - - - -
Statewide 189 100.00 2.00 2.00 378 189
27
Table 14. Summary of 2013 hunting effort and harvest in Wildlife Management Units in Illinois for
the species listed below.
Rail (1)
Wildlife
Management
Units
Estimated
Number of
Hunters
Percent
of
Hunters
Average Bag Estimated
Total
Harvest
Estimated
Days
Afield Daily Season
Northwest Hills - - - - - -
Northeast Moraine - - - - - -
Mississippi Border-North - - - - - -
Mississippi Border-South - - - - - -
Western Prairie/Forest 189 100.00 0.00 0.00 0 378
Central Sand Prairie - - - - - -
Grand Prairie - - - - - -
Southern Plain - - - - - -
Wabash Border - - - - - -
Shawnee Hills - - - - - -
Statewide 189 100.00 0.00 0.00 0 378
Table 15. Summary of 2013 hunting effort and harvest in Wildlife Management Units in Illinois for
the species listed below.
Crow (13)
Wildlife
Management
Units
Estimated
Number of
Hunters
Percent
of
Hunters
Average Bag Estimated
Total
Harvest
Estimated
Days
Afield Daily Season
Northwest Hills 378 15.38 1.00 2.00 756 756
Northeast Moraine - - - - - -
Mississippi Border-North 189 7.69 3.00 6.01 1,135 378
Mississippi Border-South 189 7.69 0.00 0.00 0 567
Western Prairie/Forest 189 7.69 0.00 0.00 0 378
Central Sand Prairie - - - - - -
Grand Prairie 756 30.77 0.92 8.76 6,619 7,186
Southern Plain 756 30.77 1.88 3.75 2,837 1,513
Wabash Border - - - - - -
Shawnee Hills - - - - - -
Statewide 2,458 100.00 1.05 4.62 11,347 10,779

28
Table 16. Summary of 2013 hunting effort and harvest in Wildlife Management Units in Illinois for
the species listed below.
Groundhog (22)
Wildlife
Management
Units
Estimated
Number of
Hunters
Percent
of
Hunters
Average Bag Estimated
Total
Harvest
Estimated
Days
Afield Daily Season
Northwest Hills 189 4.54 2.00 4.00 756 378
Northeast Moraine - - - - - -
Mississippi Border-North 378 9.09 1.00 6.50 2,458 2,458
Mississippi Border-South 189 4.54 3.26 6.01 1,135 378
Western Prairie/Forest 378 9.09 0.75 1.50 567 756
Central Sand Prairie - - - - - -
Grand Prairie 946 22.74 1.20 2.40 2,269 1,891
Southern Plain 1,891 45.46 1.17 3.40 6,430 5,484
Wabash Border - - - - - -
Shawnee Hills 189 4.54 0.33 10.01 1,891 5,673
Statewide 4,160 100.00 0.91 3.73 15,507 17,020
Table 17. Summary of 2013 hunting effort and harvest in Wildlife Management Units in Illinois for
the species listed below.
Gray Squirrel (204)
Wildlife
Management
Units
Estimated
Number of
Hunters
Percent
of
Hunters
Average Bag Estimated
Total
Harvest
Estimated
Days
Afield Daily Season
Northwest Hills 2,458 6.37 0.55 3.69 9,077 16,453
Northeast Moraine 189 0.49 1.00 20.00 3,782 3,782
Mississippi Border-North 1,891 4.90 1.11 5.10 9,645 8,699
Mississippi Border-South 5,862 15.20 1.78 10.71 62,785 35,364
Western Prairie/Forest 3,782 9.80 0.88 3.80 14,373 16,264
Central Sand Prairie 1,135 2.94 1.77 22.17 25,152 14,183
Grand Prairie 7,754 20.10 1.17 6.95 53,897 45,954
Southern Plain 11,158 28.92 1.09 9.00 100,418 91,719
Wabash Border 2,080 5.39 1.80 15.09 31,393 17,398
Shawnee Hills 2,269 5.88 0.96 11.42 25,908 26,854
Statewide 38,579 100.00 1.22 8.72 336,430 276,671

29
Table 18. Summary of 2013 hunting effort and harvest in Wildlife Management Units in Illinois for
the species listed below.
Fox Squirrel (219)
Wildlife
Management
Units
Estimated
Number of
Hunters
Percent
of
Hunters
Average Bag Estimated
Total
Harvest
Estimated
Days
Afield Daily Season
Northwest Hills 3,026 7.31 0.64 3.50 10,590 16,642
Northeast Moraine - - - - - -
Mississippi Border-North 2,648 6.39 1.22 6.36 16,831 13,805
Mississippi Border-South 4,917 11.87 0.99 5.46 26,854 27,043
Western Prairie/Forest 6,052 14.61 1.00 4.94 29,880 29,880
Central Sand Prairie 1,135 2.74 1.61 11.83 13,427 8,321
Grand Prairie 10,779 26.03 0.94 5.16 55,599 59,192
Southern Plain 9,266 22.37 0.64 5.57 51,628 80,183
Wabash Border 2,269 5.48 0.59 5.00 11,347 19,100
Shawnee Hills 1,324 3.20 0.39 5.14 6,808 17,587
Statewide 41,416 100.00 0.82 5.38 222,963 271,754
Table 19. Summary of 2013 hunting effort and harvest in Wildlife Management Units in Illinois for
the species listed below.
Raccoon (48)
Wildlife
Management
Units
Estimated
Number of
Hunters
Percent
of
Hunters
Average Bag Estimated
Total
Harvest
Estimated
Days
Afield Daily Season
Northwest Hills 1,135 12.50 1.92 19.83 22,504 11,725
Northeast Moraine - - - - - -
Mississippi Border-North 756 8.33 0.82 16.00 12,103 14,751
Mississippi Border-South 756 8.33 2.41 17.50 13,238 5,484
Western Prairie/Forest 1,891 20.83 1.28 12.90 24,395 19,100
Central Sand Prairie 189 2.08 1.00 5.00 946 946
Grand Prairie 1,513 16.67 1.00 7.50 11,347 11,347
Southern Plain 2,269 25.00 0.94 18.00 40,848 43,496
Wabash Border 567 6.25 0.81 27.00 15,318 18,911
Shawnee Hills - - - - - -
Statewide 9,077 100.00 1.12 15.50 140,699 125,759

30
Table 20. Summary of 2013 hunting effort and harvest in Wildlife Management Units in Illinois for
the species listed below.
Red Fox (7)
Wildlife
Management
Units
Estimated
Number of
Hunters
Percent
of
Hunters
Average Bag Estimated
Total
Harvest
Estimated
Days
Afield Daily Season
Northwest Hills - - - - - -
Northeast Moraine - - - - - -
Mississippi Border-North 567 42.86 0.07 1.00 567 8,132
Mississippi Border-South - - - - - -
Western Prairie/Forest - - - - - -
Central Sand Prairie 189 14.29 0 0 0 1,702
Grand Prairie 189 14.29 0 0 0 756
Southern Plain - - - - - -
Wabash Border 378 28.57 0.13 3.00 1,135 8,699
Shawnee Hills - - - - - -
Statewide 1,324 100.00 0.09 1.29 1,702 19,289
Table 21. Summary of 2013hunting effort and harvest in Wildlife Management Units in Illinois for
the species listed below.
Gray Fox (6)
Wildlife
Management
Units
Estimated
Number of
Hunters
Percent
of
Hunters
Average Bag Estimated
Total
Harvest
Estimated
Days
Afield Daily Season
Northwest Hills 189 16.67 0.18 12.0 2,269 12,671
Northeast Moraine - - - - - -
Mississippi Border-North 189 16.67 0 0 0 5,673
Mississippi Border-South - - - - - -
Western Prairie/Forest 189 16.67 0.25 1.00 189 756
Central Sand Prairie 189 16.67 0 0 0 1,702
Grand Prairie 378 33.33 0.45 2.50 946 2,080
Southern Plain - - - - - -
Wabash Border - - - - - -
Shawnee Hills - - - - - -
Statewide 1,135 100.00 0.15 3.00 3,404 22,883

31
Table 22. Summary of 2013 hunting effort and harvest in Wildlife Management Units in Illinois for
the species listed below.
Coyote (167)
Wildlife
Management
Units
Estimated
Number
of Hunters
Percent
of
Hunters
Average Bag Estimated
Total
Harvest
Estimated
Days
Afield Daily Season
Northwest Hills 3,026 9.58 0.54 3.81 11,536 21,370
Northeast Moraine 946 2.99 0.25 1.00 946 3,782
Mississippi Border-North 2,458 7.78 0.28 4.92 12,103 43,496
Mississippi Border-South 2,837 8.98 0.12 1.47 4,160 34,040
Western Prairie/Forest 3,782 11.98 0.31 2.15 8,132 26,097
Central Sand Prairie 1,135 3.59 0.28 1.83 2,080 7,375
Grand Prairie 9,645 30.54 0.28 2.49 24,017 84,344
Southern Plain 6,052 19.16 0.43 3.41 20,613 47,467
Wabash Border 756 2.40 1.36 28.25 21,370 15,696
Shawnee Hills 946 2.99 0.19 1.00 946 5,106
Statewide 31,582 100.00 0.37 3.35 105,903 288,774
Table 23. Summary of 2013 hunting effort and harvest in Wildlife Management Units in Illinois for
the species listed below.
Opossum (9)
Wildlife
Management
Units
Estimated
Number
of Hunters
Percent
of
Hunters
Average Bag Estimated
Total
Harvest
Estimated
Days
Afield Daily Season
Northwest Hills 378 22.22 0.25 2.00 756 3,026
Northeast Moraine - - - - - -
Mississippi Border-North 189 11.11 0.90 27.00 5,106 5,673
Mississippi Border-South - - - - - -
Western Prairie/Forest 189 11.11 1.00 1.00 189 189
Central Sand Prairie - - - - - -
Grand Prairie 567 33.33 0.53 6.67 3,782 7,186
Southern Plain 378 22.22 5.25 10.50 3,971 756
Wabash Border - - - - - -
Shawnee Hills - - - - - -
Statewide 1,702 100.00 0.82 8.11 13,805 16,831

Table 24. Percent change in harvest from 2012 to 2013 in Wildlife Management Units for selected species.
Wildlife Management Unit Rabbita
Non-Wild Quail
Wild Quailc
Non-Wild Pheasant
Wild Pheasantc Dove
Fox Squirrel
Gray Squirrel Raccoon
Red Fox
Gray Fox Coyote
Northwest Hills --- --- b --- --- b --- +62 +58 -30 +752 ---b ---b +992
Northeast Moraine --- --- b --- --- b --- +12 -100 +207 ---b ---b ---b -40
Mississippi Border-North --- --- b --- --- b --- +107 -19 +7 +262 ---b ---b +1275
Mississippi Border-South --- --- b --- --- b --- +28 +93 +8 +479 ---b ---b -50
Western Prairie Forest --- --- b --- --- b --- +108 -1 +63 +19 ---b ---b +71
Central Sand Prairie --- --- b --- --- b --- -51 -22 +361 -73 ---b ---b -97
Grand Prairie --- --- b --- --- b --- +51 +3 +209 -40 ----b ---b -3
Southern Plain --- --- b --- --- b --- +96 -3 -10 +84 ---b ---b +318
Wabash Border --- --- b --- --- b --- -75 +90 +949 +18 ---b ---b +138
Shawnee Hills --- --- b --- --- b --- +295 -14 -26 ---b ---b ---b -64
a Differences were not calculated for Rabbit harvests due to increased season length from 2012-13 to 2013-14. b Percentage change could not be calculated in certain WMU’s due to no harvest in 2012 and/or 2013 in those units. c Differences were not calculated for Wild Quail and Wild Pheasant harvests due to a change in how harvests are calculated.
32

33
Table 25. Summary of 2013 hunting effort and success in administrative regions in Illinois for
the species listed below.
Rabbit (196)
Administrative
Region
Estimated
Number of
Hunters
Percent
of
Hunters
Average Bag Estimated
Total
Harvest
Estimated
Days Afield Daily Season
Region 1 8,699 23.47 0.54 3.02 26,287 48,413
Region 2 2,269 6.12 0.42 4.92 11,158 26,854
Region 3 8,510 22.96 0.89 3.09 26,287 29,691
Region 4 9,645 26.02 1.07 3.98 38,390 35,742
Region 5 7,943 21.43 0.76 5.07 40,281 53,330
Statewide 37,066 100.00 0.73- 3.84 142,401 194,029
*2013-14 Season is not directly comparable to previous years because of increased season length.
Table 26. Summary of 2013 hunting effort and success in administrative regions in Illinois for
the species listed below.
Non-Wild Quail (32)
Administrative
Region
Estimated
Number of
Hunters
Percent
of
Hunters
Average Bag Estimated
Total
Harvest
Estimated
Days Afield Daily Season
Region 1 1,324 21.88 1.12 2.71 3,593 3,215
Region 2 567 9.38 2.13 5.67 3,215 1,513
Region 3 756 12.50 9.22 53.00 40,092 4,350
Region 4 1,702 28.13 4.85 31.78 54,086 11,158
Region 5 1,702 28.13 4.11 16.44 27,989 6,808
Statewide 6,052 100.00 4.77 21.31 128,974 27,043
34
Table 27. Summary of 2013 hunting effort and success in administrative regions in Illinois for
the species listed below.
Wild Quail (57)
Administrative
Region
Estimated
Number of
Hunters
Percent
of
Hunters
Average Bag Estimated
Total
Harvest
Estimated
Days Afield Daily Season
Region 1 1,702 15.79 0.83 3.22 5,484 6,619
Region 2 189 1.75 0.17 5.00 946 5,673
Region 3 1,324 12.28 0.36 1.14 1,513 4,160
Region 4 4,917 45.61 0.69 3.92 19,289 27,989
Region 5 2,648 24.56 0.91 9.21 24,395 26,854
Statewide 10,779 100.00 0.72 4.79 51,628 71,295
Table 28. Summary of 2013 hunting effort and success in administrative regions in Illinois for
the species listed below.
Non-Wild Pheasants (129)
Administrative
Region
Estimated
Number of
Hunters
Percent
of
Hunters
Average Bag Estimated
Total
Harvest
Estimated
Days Afield Daily Season
Region 1 5,484 22.48 1.83 9.17 50,304 27,421
Region 2 7,754 31.78 1.99 12.44 96,447 48,413
Region 3 4,350 17.83 1.12 6.00 26,097 23,261
Region 4 4,728 19.38 1.94 8.32 39,335 20,235
Region 5 2,080 8.53 1.92 4.36 9,077 4,728
Statewide 24,395 100.00 1.78 9.07 221,261 124,057

35
Table 29. Summary of 2013 hunting effort and success in administrative regions in Illinois for
the species listed below.
Wild Pheasants (79)
Administrative
Region
Estimated
Number of
Hunters
Percent
of
Hunters
Average Bag Estimated
Total
Harvest
Estimated
Days Afield Daily Season
Region 1 3,593 24.05 0.22 0.79 2,837 12,860
Region 2 2,269 15.19 0.32 2.00 4,539 13,994
Region 3 6,619 44.30 0.42 1.51 10,023 23,639
Region 4 2,080 13.92 0.40 1.55 3,215 7,943
Region 5 378 2.53 0.00 0.00 0 4,539
Statewide 14,940 100.00 0.33 1.38 20,613 62,974
Table 30. Summary of 2013 hunting effort and success in administrative regions in Illinois for
the species listed below.
Non-Wild Gray Partridge (6)
Administrative
Region
Estimated
Number of
Hunters
Percent
of
Hunters
Average Bag Estimated
Total
Harvest
Estimated
Days Afield Daily Season
Region 1 189 16.67 2.00 4.00 756 378
Region 2 378 33.33 2.25 4.50 1,702 756
Region 3 - - - - - -
Region 4 567 50.00 2.20 3.67 2,080 946
Region 5 - - - - - -
Statewide 1,135 100.00 2.18 4.00 4,539 2,080

36
Table 31. Summary of 2013 hunting effort and success in administrative regions in Illinois for
the species listed below.
Wild Gray Partridge (1)
Administrative
Region
Estimated
Number of
Hunters
Percent
of
Hunters
Average Bag Estimated
Total
Harvest
Estimated
Days Afield Daily Season
Region 1 189 100.00 0.20 2.00 378 1,891
Region 2 - - -
- - -
Region 3 - - - - - -
Region 4 - - - - - -
Region 5 - - - - - -
Statewide 189 100.00 0.20 2.00 378 1,891
Table 32. Summary of 2013 hunting effort and success in administrative regions in Illinois for
the species listed below.
Doves (213)
Administrative
Region
Estimated
Number of
Hunters
Percent
of
Hunters
Average Bag Estimated
Total
Harvest
Estimated
Days Afield Daily Season
Region 1 8,888 22.17 3.19 12.77 113,467 35,553
Region 2 4,350 10.85 5.24 18.22 79,238 15,129
Region 3 8,132 20.28 5.61 21.53 175,118 31,203
Region 4 12,671 31.46 5.33 23.85 302,201 56,734
Region 5 6,241 15.57 3.78 21.33 133,135 35,175
Statewide 40,281 100.00 4.62 19.94 803,159 173,794

37
Table 33. Summary of 2013 hunting effort and success in administrative regions in Illinois for
the species listed below.
Woodcock (1)
Administrative
Region
Estimated
Number of
Hunters
Percent
of
Hunters
Average Bag Estimated
Total
Harvest
Estimated
Days Afield Daily Season
Region 1 - - - - - -
Region 2 189 100.00 0.00 0.00 0 189
Region 3 - - - - - -
Region 4 - - - - - -
Region 5 - - - - - -
Statewide 189 100.00 0.00 0.00 0 189
Table 34. Summary of 2013 hunting effort and success in administrative regions in Illinois for
the species listed below.
Snipe (1)
Administrative
Region
Estimated
Number of
Hunters
Percent
of
Hunters
Average Bag Estimated
Total
Harvest
Estimated
Days Afield Daily Season
Region 1 189 100.00 2.00 2.00 378 189
Region 2 - - - - - -
Region 3 - - - - - -
Region 4 - - - - - -
Region 5 - - - - - -
Statewide 189 100.00 2.00 2.00 378 189
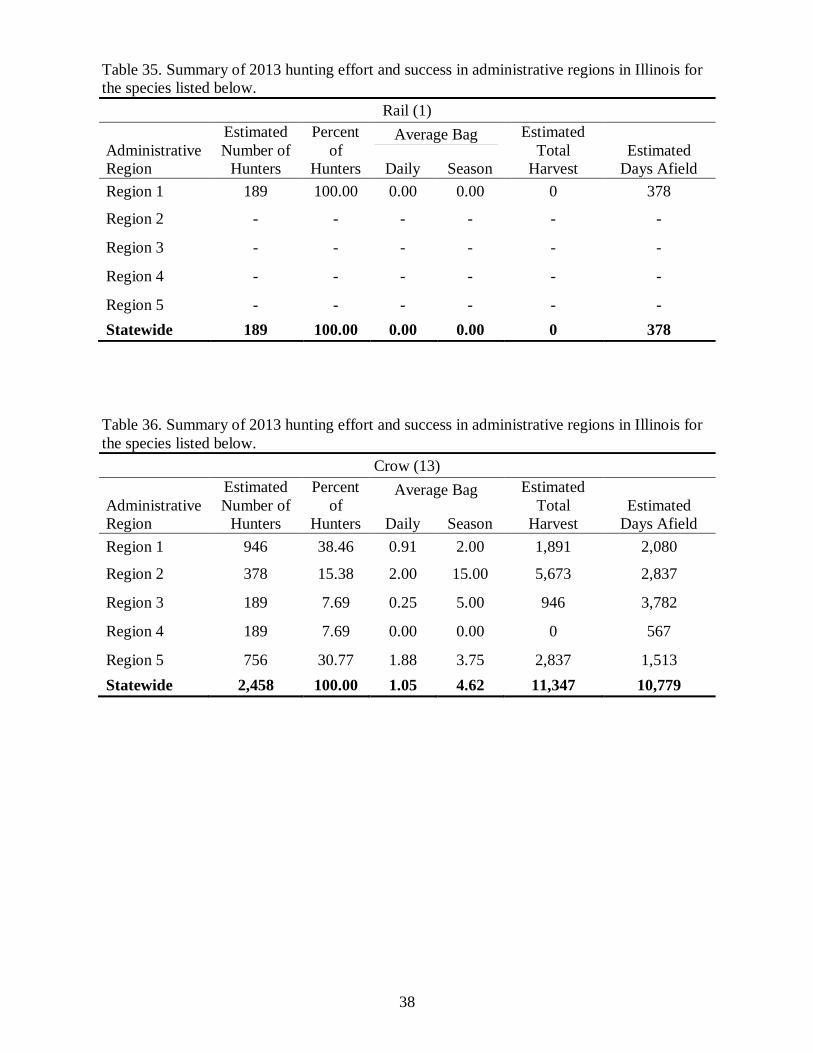
38
Table 35. Summary of 2013 hunting effort and success in administrative regions in Illinois for
the species listed below.
Rail (1)
Administrative
Region
Estimated
Number of
Hunters
Percent
of
Hunters
Average Bag Estimated
Total
Harvest
Estimated
Days Afield Daily Season
Region 1 189 100.00 0.00 0.00 0 378
Region 2 - - - - - -
Region 3 - - - - - -
Region 4 - - - - - -
Region 5 - - - - - -
Statewide 189 100.00 0.00 0.00 0 378
Table 36. Summary of 2013 hunting effort and success in administrative regions in Illinois for
the species listed below.
Crow (13)
Administrative
Region
Estimated
Number of
Hunters
Percent
of
Hunters
Average Bag Estimated
Total
Harvest
Estimated
Days Afield Daily Season
Region 1 946 38.46 0.91 2.00 1,891 2,080
Region 2 378 15.38 2.00 15.00 5,673 2,837
Region 3 189 7.69 0.25 5.00 946 3,782
Region 4 189 7.69 0.00 0.00 0 567
Region 5 756 30.77 1.88 3.75 2,837 1,513
Statewide 2,458 100.00 1.05 4.62 11,347 10,779

39
Table 37. Summary of 2013 hunting effort and success in administrative regions in Illinois for
the species listed below.
Groundhog (22)
Administrative
Region
Estimated
Number of
Hunters
Percent
of
Hunters
Average Bag Estimated
Total
Harvest
Estimated
Days Afield Daily Season
Region 1 946 22.73 0.59 2.00 1,891 3,215
Region 2 189 4.55 2.00 2.00 378 189
Region 3 756 18.18 1.25 2.50 1,891 1,513
Region 4 1,135 27.27 1.71 4.83 5,484 3,215
Region 5 1,135 27.27 0.66 5.17 5,862 8,888
Statewide 4,160 100.00 0.91 3.73 15,507 17,020
Table 38. Summary of 2013 hunting effort and success in administrative regions in Illinois for
the species listed below.
Gray Squirrel (204)
Administrative
Region
Estimated
Number of
Hunters
Percent
of
Hunters
Average Bag Estimated
Total
Harvest
Estimated
Days Afield Daily Season
Region 1 6,619 17.16 0.75 3.94 26,097 34,607
Region 2 1,513 3.92 1.44 14.63 22,126 15,318
Region 3 4,728 12.25 1.18 8.00 37,822 32,149
Region 4 12,860 33.33 1.49 9.53 122,545 82,453
Region 5 12,860 33.33 1.14 9.94 127,840 112,143
Statewide 38,579 100.00 1.22 8.72 336,430 276,671

40
Table 39. Summary of 2013 hunting effort and success in administrative regions in Illinois for
the species listed below.
Fox Squirrel (219)
Administrative
Region
Estimated
Number of
Hunters
Percent
of
Hunters
Average Bag Estimated
Total
Harvest
Estimated
Days Afield Daily Season
Region 1 10,023 24.20 1.12 5.45 54,653 48,791
Region 2 1,891 4.57 0.52 2.90 5,484 10,590
Region 3 5,673 13.70 0.97 5.07 28,745 29,501
Region 4 13,238 31.96 1.00 6.31 83,588 83,777
Region 5 10,590 25.57 0.51 4.77 50,493 99,095
Statewide 41,416 100.00 0.82 5.38 222,963 271,754
Table 40. Summary of 2013 hunting effort and success in administrative regions in Illinois for
the species listed below.
Raccoon (48)
Administrative
Region
Estimated
Number of
Hunters
Percent
of
Hunters
Average Bag Estimated
Total
Harvest
Estimated
Days Afield Daily Season
Region 1 3,404 37.50 1.10 11.17 38,012 34,418
Region 2 189 2.08 2.40 12.00 2,269 946
Region 3 1,135 12.50 1.19 17.50 19,857 16,642
Region 4 2,080 22.92 1.87 18.00 37,444 20,046
Region 5 2,269 25.00 0.80 19.00 43,118 53,708
Statewide 9,077 100.00 1.12 15.50 140,699 125,759
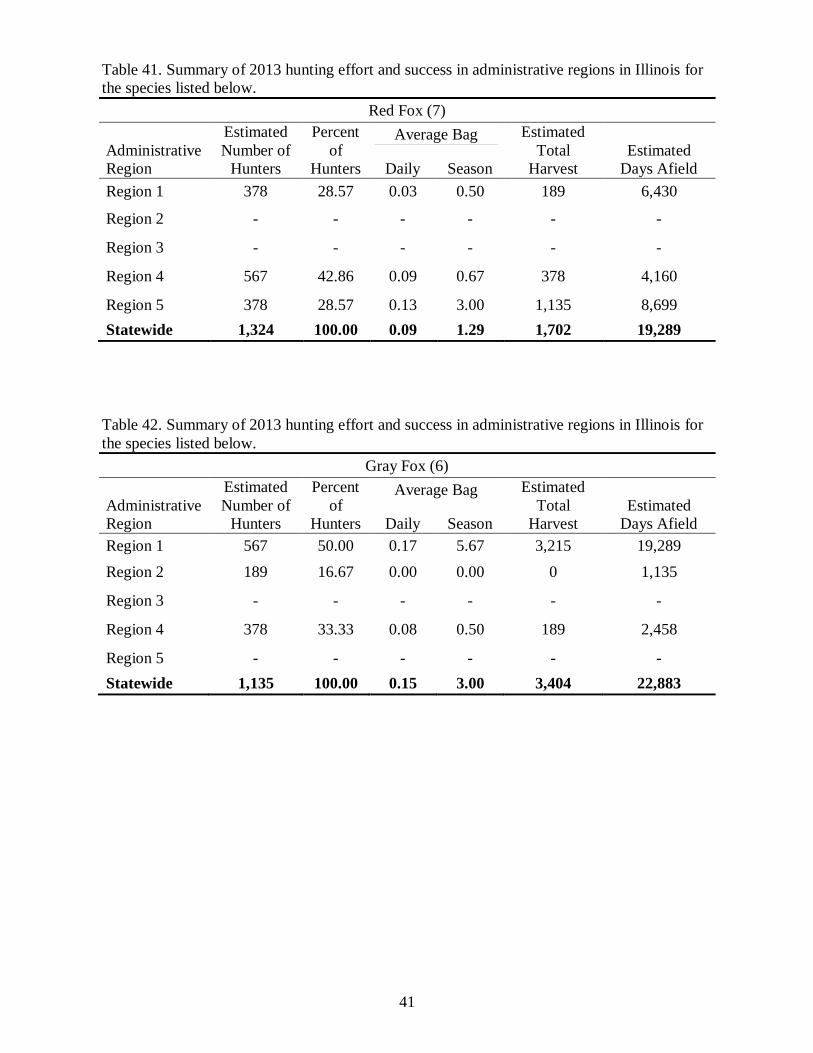
41
Table 41. Summary of 2013 hunting effort and success in administrative regions in Illinois for
the species listed below.
Red Fox (7)
Administrative
Region
Estimated
Number of
Hunters
Percent
of
Hunters
Average Bag Estimated
Total
Harvest
Estimated
Days Afield Daily Season
Region 1 378 28.57 0.03 0.50 189 6,430
Region 2 - - - - - -
Region 3 - - - - - -
Region 4 567 42.86 0.09 0.67 378 4,160
Region 5 378 28.57 0.13 3.00 1,135 8,699
Statewide 1,324 100.00 0.09 1.29 1,702 19,289
Table 42. Summary of 2013 hunting effort and success in administrative regions in Illinois for
the species listed below.
Gray Fox (6)
Administrative
Region
Estimated
Number of
Hunters
Percent
of
Hunters
Average Bag Estimated
Total
Harvest
Estimated
Days Afield Daily Season
Region 1 567 50.00 0.17 5.67 3,215 19,289
Region 2 189 16.67 0.00 0.00 0 1,135
Region 3 - - - - - -
Region 4 378 33.33 0.08 0.50 189 2,458
Region 5 - - - - - -
Statewide 1,135 100.00 0.15 3.00 3,404 22,883

42
Table 43. Summary of 2013 hunting effort and success in administrative regions in Illinois for
the species listed below.
Coyote (167)
Administrative
Region
Estimated
Number of
Hunters
Percent
of
Hunters
Average Bag Estimated
Total
Harvest
Estimated
Days Afield Daily Season
Region 1 9,834 31.14 0.41 3.58 35,175 86,235
Region 2 2,648 8.38 0.39 2.50 6,619 16,831
Region 3 5,106 16.17 0.23 2.15 10,968 46,900
Region 4 6,808 21.56 0.22 2.06 13,994 64,487
Region 5 7,186 22.75 0.53 5.45 39,146 74,321
Statewide 31,582 100.00 0.37 3.35 105,903 288,774
Table 44. Summary of 2013 hunting effort and success in administrative regions in Illinois for
the species listed below.
Opossum (9)
Administrative
Region
Estimated
Number of
Hunters
Percent
of
Hunters
Average Bag Estimated
Total
Harvest
Estimated
Days Afield Daily Season
Region 1 1,135 66.67 0.64 5.83 6,619 10,401
Region 2 - - - - - -
Region 3 189 11.11 0.57 17.00 3,215 5,673
Region 4 - - - - - -
Region 5 378 22.22 5.25 10.50 3,971 756
Statewide 1,702 100.00 0.82 8.11 13,805 16,831
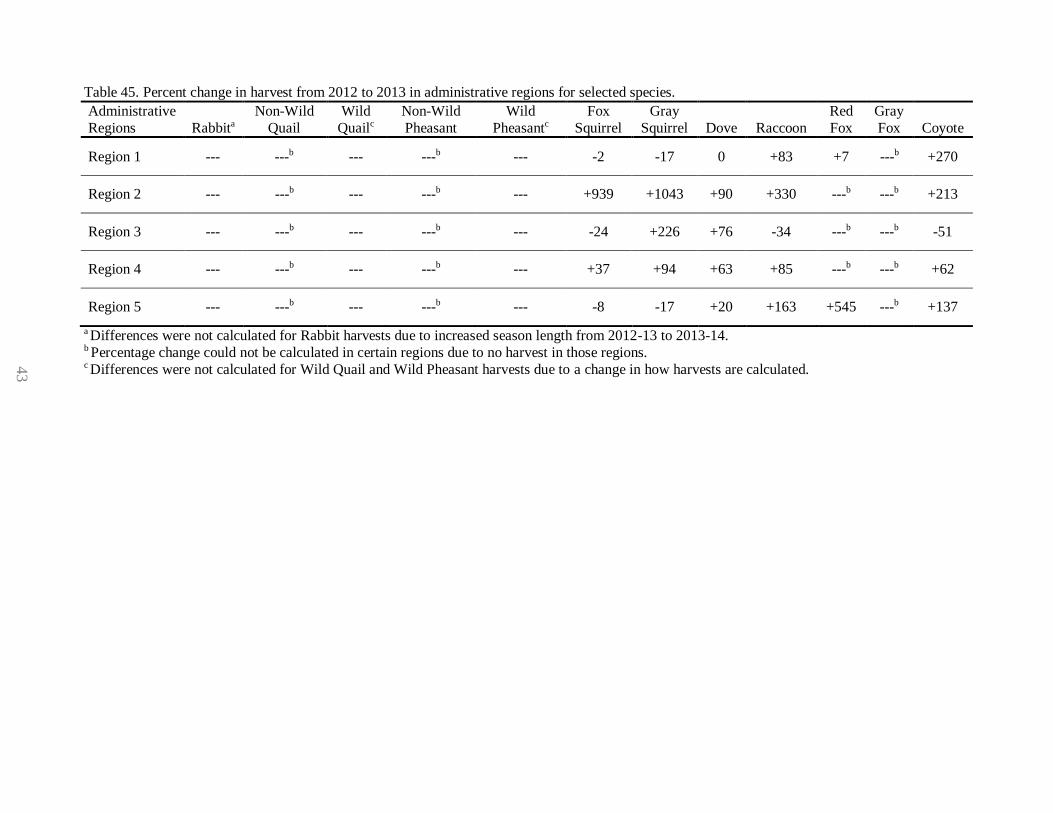
Table 45. Percent change in harvest from 2012 to 2013 in administrative regions for selected species.
Administrative
Regions Rabbita
Non-Wild
Quail
Wild
Quailc
Non-Wild
Pheasant
Wild
Pheasantc
Fox
Squirrel
Gray
Squirrel Dove Raccoon
Red
Fox
Gray
Fox Coyote
Region 1 --- ---b --- ---b --- -2 -17 0 +83 +7 ---b +270
Region 2 --- ---b --- ---b --- +939 +1043 +90 +330 ---b ---b +213
Region 3 --- ---b --- ---b --- -24 +226 +76 -34 ---b ---b -51
Region 4 --- ---b --- ---b --- +37 +94 +63 +85 ---b ---b +62
Region 5 --- ---b --- ---b --- -8 -17 +20 +163 +545 ---b +137
a Differences were not calculated for Rabbit harvests due to increased season length from 2012-13 to 2013-14. b Percentage change could not be calculated in certain regions due to no harvest in those regions. c Differences were not calculated for Wild Quail and Wild Pheasant harvests due to a change in how harvests are calculated.
43

44
Table 46. Distribution of hunting effort and harvest among resident Illinois hunters in 2013, from
the 2013-14 Illinois Hunter Harvest Survey. Days Hunting Animals Harvested
Range Percent of Hunters Range Percent of Hunters
RABBIT --- --- 0 30.6%
1-5 75.5% 1-5 48.5
6-10 16.3 6-10 13.2
11-14 1.6 11-14 2.6
15-19 2.5 15-19 1.5
20-24 1.0 20-24 2.1
25+ 3.1 25+ 1.5
NON-WILD QUAIL --- --- 0 12.5 1-5 71.9 1-5 28.1
6-10 15.6 6-10 31.3
11-14 3.1 11-14 0.0
15-19 3.2 15-19 0.0
20-24 6.2 20-24 3.1
25+ 0 25+ 25.0
WILD QUAIL --- --- 0 43.9
1-5 70.2 1-5 36.8
6-10 14.0 6-10 7.0 11-14 1.8 11-14 5.3
15-19 1.7 15-19 0
20-24 7.0 20-24 3.5
25+ 5.3 25+ 3.5
NON-WILD PHEASANT --- --- 0 14.0
1-5 70.5 1-5 39.5
6-10 19.4 6-10 18.6
11-14 2.3 11-14 4.6 15-19 3.9 15-19 6.2
20-24 1.6 20-24 8.6
25+ 2.3 25+ 8.5
WILD PHEASANT --- --- 0 57.0
1-5 82.3 1-5 39.2
6-10 8.8 6-10 1.3
11-14 1.3 11-14 0
15-19 3.8 15-19 2.5
20-24 2.5 20-24 0 25+ 1.3 25+ 0
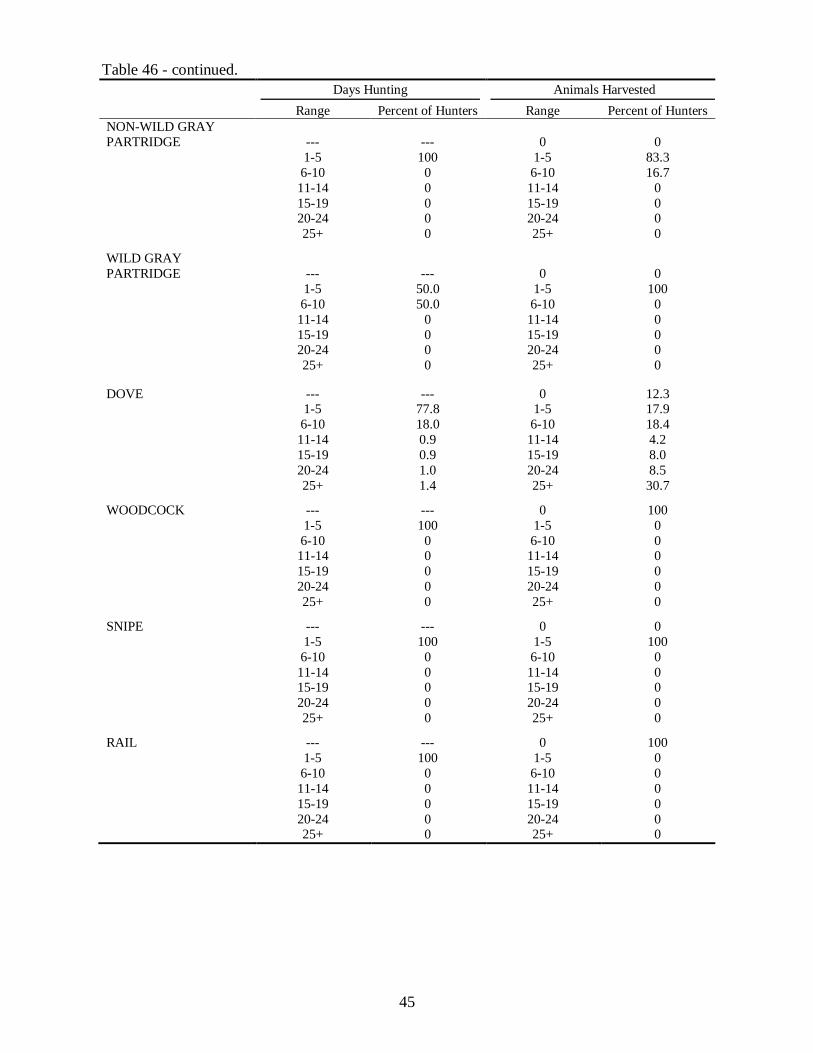
45
Table 46 - continued. Days Hunting Animals Harvested
Range Percent of Hunters Range Percent of Hunters
NON-WILD GRAY
PARTRIDGE
---
---
0
0
1-5 100 1-5 83.3
6-10 0 6-10 16.7
11-14 0 11-14 0
15-19 0 15-19 0 20-24 0 20-24 0
25+ 0 25+ 0
WILD GRAY
PARTRIDGE
---
---
0
0
1-5 50.0 1-5 100
6-10 50.0 6-10 0
11-14 0 11-14 0
15-19 0 15-19 0 20-24 0 20-24 0
25+ 0 25+ 0
DOVE --- --- 0 12.3 1-5 77.8 1-5 17.9
6-10 18.0 6-10 18.4
11-14 0.9 11-14 4.2
15-19 0.9 15-19 8.0
20-24 1.0 20-24 8.5
25+ 1.4 25+ 30.7
WOODCOCK --- --- 0 100
1-5 100 1-5 0
6-10 0 6-10 0 11-14 0 11-14 0
15-19 0 15-19 0
20-24 0 20-24 0
25+ 0 25+ 0
SNIPE --- --- 0 0
1-5 100 1-5 100
6-10 0 6-10 0
11-14 0 11-14 0 15-19 0 15-19 0
20-24 0 20-24 0
25+ 0 25+ 0
RAIL --- --- 0 100
1-5 100 1-5 0
6-10 0 6-10 0
11-14 0 11-14 0
15-19 0 15-19 0
20-24 0 20-24 0 25+ 0 25+ 0

46
Table 46 - continued. Days Hunting Animals Harvested
Range Percent of Hunters Range Percent of Hunters
CROW --- --- 0 38.5
1-5 84.6 1-5 30.8
6-10 7.7 6-10 23.1
11-14 0 11-14 0
15-19 0 15-19 0
20-24 7.7 20-24 7.7 25+ 0 25+ 0
GROUNDHOG --- --- 0 13.6
1-5 81.8 1-5 68.2
6-10 13.6 6-10 9.1
11-14 0 11-14 4.5
15-19 0 15-19 4.5
20-24 0 20-24 0
25+ 4.5 25+ 0
GRAY SQUIRREL --- --- 0 16.7
1-5 61.3 1-5 42.1
6-10 22.5 6-10 18.7
11-14 3.0 11-14 2.9
15-19 4.4 15-19 3.9
20-24 4.4 20-24 6.4
25+ 4.4 25+ 9.3
FOX SQUIRREL --- --- 0 20.5
1-5 64.8 1-5 49.4
6-10 21.5 6-10 15.9
11-14 2.7 11-14 3.2
15-19 3.2 15-19 2.3
20-24 3.7 20-24 5.0
25+ 4.1 25+ 3.7
TURKEY-SPRING --- --- 0 63.6%
1-5 82.0% 1-5 36.4
6-10 14.6 6-10 0
11-14 1.9 11-14 0
15-19 0 15-19 0
20-24 1.5 20-24 0
25+ 0 25+ 0
TURKEY-FALL
SHOTGUN --- --- 0 59.1 1-5 88.6 1-5 40.9
6-10 11.4 6-10 0
11-14 0 11-14 0
15-19 0 15-19 0
20-24 0 20-24 0
25+ 0 25+ 0
TURKEY-FALL
ARCHERY --- --- 0 83.5 1-5 37.1 1-5 16.5
6-10 20.6 6-10 0
11-14 2.1 11-14 0
15-19 6.2 15-19 0
20-24 7.2 20-24 0
25+ 26.8 25+ 0

47
DEER-REGULAR
FIREARM SEASON
--- --- 0 60.2
1-5 63.6 1-5 39.8
6-10 36.1 6-10 0
11-14 0.2 11-14 0
15-19 0 15-19 0
20-24 0 20-24 0
25+ 0 25+ 0
DEER-
MUZZLELOADER-
ONLY SEASON --- --- 0 76.0
1-5 94.2 1-5 24.0
6-10 5.8 6-10 0
11-14 0 11-14 0
15-19 0 15-19 0
20-24 0 20-24 0
25+ 0 25+ 0
DEER-ARCHERY
SEASON
---
---
0
66.3
1-5 23.9 1-5 33.7
6-10 23.7 6-10 0
11-14 6.2 11-14 0
15-19 9.4 15-19 0
20-24 10.9 20-24 0
25+ 25.9 25+ 0
DEER-LATE WINTER
ANTERLESS SEASON
---
---
0
84.4
1-5 95.6 1-5 15.6
6-10 4.4 6-10 0
11-14 0 11-14 0
15-19 0 15-19 0
20-24 0 20-24 0
25+ 0 25+ 0
DEER-SPECIAL CWD
SEASON --- --- 0
85.4
1-5 97.6 1-5 14.6
6-10 2.4 6-10 0
11-14 0 11-14 0
15-19 0 15-19 0
20-24 0 20-24 0
25+ 0 25+ 0
RACCOON --- --- 0 10.4
1-5 41.7 1-5 29.2
6-10 25.0 6-10 16.7
11-14 0 11-14 10.4
15-19 6.2 15-19 2.1
20-24 4.2 20-24 12.5
25+ 22.9 25+ 18.7
RED FOX --- --- 0 28.6 1-5 42.9 1-5 71.4
6-10 14.2 6-10 0
11-14 14.3 11-14 0
15-19 0 15-19 0
20-24 0 20-24 0
25+ 28.6 25+ 0
Table 46 - continued.

48
Table 46 – continued. Days Hunting Animals Harvested
Range Percent of Hunters Range Percent of Hunters
GRAY FOX --- --- 0 50
1-5 33.3 1-5 33.3
6-10 33.4 6-10 0
11-14 0 11-14 16.7
15-19 0 15-19 0
20-24 0 20-24 0 25+ 33.3 25+ 0
COYOTE --- --- 0 45.5
1-5 57.5 1-5 40.7
6-10 21.5 6-10 7.8
11-14 3.6 11-14 1.2
15-19 4.8 15-19 1.2
20-24 4.8 20-24 1.8
25+ 7.8 25+ 1.8
OPOSSUM --- --- 0 0
1-5 55.6 1-5 66.7
6-10 11.1 6-10 0
11-14 0 11-14 0
15-19 11.1 15-19 11.1
20-24 0 20-24 11.1
25+ 22.2 25+ 11.1

49
Table 47. Statewide data from resident Illinois hunters, 2003-2013.
Species and
Seasons
Estimated Total
Hunters
Average
Daily
Bag
Average
Season Bag
Estimated Total
Harvest
Average Days
Hunting
Estimated
Total Days
Hunting
RABBIT
2003 64,758 0.85 4.99 323,167 5.87 379,830
2004 78,768 1.14 5.45 429,460 4.76 375,013
2005 60,431 1.07 5.15 311,011 4.80 290,349
2006 49,350 1.13 5.43 267,782 4.81 237,525
2007 49,054 0.90 4.97 243,874 5.53 271,107
2008 40,077 0.71 3.85 154,216 5.40 216,255
2009 44,312 0.84 4.27 189,254 5.10 226,152
2010 32,225 1.13 4.83 155,552 4.25 137,089
2011 32,863 0.93 4.44 145,773 4.79 157,523
2012 33,093 0.77 3.52 116,353 4.54 150,150
2013 37,066a 0.73 3.84a 142,401a 5.23a 194,029a
WILD QUAIL
2003 30,044 1.15 6.80 204,236 5.91 177,617
2004 38,913 1.22 6.77 263,293 5.55 216,064 2005 29,983 1.44 8.16 244,521 5.67 170,108
2006 24,918 1.48 7.95 198,207 5.38 133,972
2007 24,614 1.34 7.67 188,710 5.74 141,227
2008 21,962 1.04 6.88 151,170 6.64 145,720
2009 16,948 1.18 7.31 123,933 6.21 105,220
2010 14,110 1.64 7.07 99,812 4.32 60,967
2011 ---b --- --- --- --- ---
2012 ---b --- --- --- --- ---
2013 ---b --- --- --- --- ---
WILD PHEASANT
2003 50,592 0.66 3.60 181,976 5.42 274,287
2004 55,075 0.67 3.63 200,059 5.44 299,696
2005 44,430 0.67 3.31 146,961 4.93 218,888
2006 38,509 0.72 3.08 118,763 4.26 164,067 2007 35,961 0.58 2.86 102,822 4.95 177,887
2008 29,016 0.73 3.56 103,399 4.86 140,911
2009 22,244 0.64 2.89 64,262 4.48 99,747
2010 24,213 0.70 2.66 64,451 3.83 92,670
2011 ---b --- --- --- --- ---
2012 ---b --- --- --- --- ---
2013 ---b --- --- --- --- ---
WILD GRAY PARTRIDGE
2003 623 0.44 1.00 623 2.25 1,401
2004 0 0.00 0.00 0 0.00 0
2005 311 0.43 3.00 932 7.00 2,175
2006 485 0.50 1.33 647 2.67 1,294
2007 349 1.50 1.50 524 1.00 349 2008 321 0.00 0.00 0 2.50 802
2009 0 0.00 0.00 0 0.00 0
2010 697 0.60 1.50 1,045 2.50 1,742
2011 ---b --- --- --- --- ---
2012 ---b --- --- --- --- ---
2013 ---b --- --- --- --- ---

50
Table 47 - continued.
Species and
Seasons
Estimated Total
Hunters
Average
Daily
Bag
Average
Season Bag
Estimated Total
Harvest
Average Days
Hunting
Estimated
Total Days
Hunting
DOVE
2003 54,172 4.84 23.53 1,274,765 4.86 263,390
2004 78,455 5.13 23.65 1,855,135 4.61 361,989
2005 63,383 4.89 23.35 1,479,709 4.78 302,777
2006 60,514 5.81 24.07 1,456,542 4.14 250,631
2007 51,847 5.38 21.62 1,120,739 4.02 208,437
2008 43,123 4.98 23.14 997,917 4.64 200,225
2009 40,781 4.61 21.41 873,182 4.64 189,254
2010 37,974 4.21 17.61 668,547 4.18 158,688
2011 29,742 4.57 16.57 492,765 3.62 107,769
2012 34,501 3.85 15.97 550,962 4.15 143,109
2013 40,281 4.62 19.94 803,159 4.31 173,794
WOODCOCK
2003 1,090 0.41 1.57 1,712 3.86 4,203
2004 1,569 0.44 1.10 1,726 2.50 3,923
2005 621 0.83 1.25 777 1.50 932 2006 1,133 0.25 0.43 485 1.71 1,942
2007 524 0.60 1.00 524 1.67 873
2008 802 0.18 0.60 481 3.40 2,725
2009 1,059 0.00 0.00 0 4.67 4,943
2010 1,219 0.72 1.14 1,394 1.57 1,916
2011 1,102 0.50 1.67 1,836 3.33 3,672
2012 704 0.40 1.00 704 2.50 1,760
2013 189 0.00 0.00 0 1.00 189
SNIPE
2003 778 1.58 3.80 2,958 2.40 1,868
2004 0 0.00 0.00 0 0.00 0
2005 311 0.75 1.50 466 2.00 621
2006 485 1.80 3.00 1,456 1.67 809 2007 349 1.00 2.50 873 2.50 873
2008 160 0.00 0 0 10.00 1,603
2009 530 0.18 1.33 706 7.33 3,884
2010 348 1.25 5.00 1,742 4.00 1,394
2011 551 1.00 1.33 734 1.33 734
2012 176 1.00 1.00 176 1.00 176
2013 189 2.00 2.00 378 1.00 189
RAIL
2003 156 0.00 0.00 0 2.00 311
2004 0 0.00 0.00 0 0.00 0
2005 466 0.40 0.67 311 1.67 777
2006 324 3.00 6.00 1,942 2.00 647
2007 0 0.00 0.00 0 0.00 0
2008 160 0.00 0.00 0 10.00 1,603
2009 177 0.00 0.00 0 20.00 3,531 2010 174 0.00 0.00 0 1.00 174
2011 367 0.00 0.00 0 1.00 367
2012 176 0.00 0.00 0 2.00 352
2013 189 0.00 0.00 0 2.00 378

51
Table 47 - continued.
Species and
Seasons
Estimated Total
Hunters
Average
Daily
Bag
Average
Season Bag
Estimated Total
Harvest
Average Days
Hunting
Estimated
Total Days
Hunting
CROW
2003 4,826 2.21 9.35 45,144 4.23 20,393
2004 7,689 3.41 18.08 139,021 5.31 40,796
2005 5,748 0.82 4.22 24,235 5.16 29,672
2006 6,310 2.73 8.62 54,365 3.15 19,902
2007 5,237 3.38 8.90 46,610 2.63 13,791
2008 4,489 1.55 9.75 43,764 6.29 28,214
2009 4,414 2.20 12.24 54,022 5.56 24,539
2010 3,135 4.30 13.39 41,980 3.11 9,755
2011 3,121 1.24 3.65 11,383 2.94 9,180
2012 3,168 0.64 2.94 9,329 4.61 14,610
2013 2,458 1.05 4.62 11,347 4.38 10,779
GROUNDHOG
2003 5,604 0.49 4.42 24,751 9.11 51,059
2004 5,021 0.95 4.78 24,007 5.03 25,262
2005 4,816 0.61 2.90 13,982 4.74 22,836 2006 3,236 0.56 4.30 13,915 7.70 24,918
2007 1,571 0.62 8.11 12,744 13.00 20,425
2008 4,649 0.56 2.69 12,504 4.83 22,443
2009 3,531 0.86 5.65 19,949 6.55 23,127
2010 2,961 0.52 2.00 5,923 3.82 11,322
2011 3,488 0.72 3.32 11,566 4.58 15,973
2012 2,112 0.35 1.42 2,992 4.08 8,625
2013 4,160 0.91 3.73 15,507 4.09 17,020
GRAY SQUIRREL
2003 51,059 1.32 8.96 457,664 6.80 346,984
2004 64,490 1.62 11.98 772,306 7.40 477,003
2005 48,314 1.44 9.48 457,816 6.58 317,846
2006 48,864 1.52 13.42 655,945 8.80 430,070 2007 43,992 1.40 8.99 395,401 6.44 283,327
2008 42,963 1.09 9.34 401,411 8.60 369,350
2009 46,431 1.38 9.90 459,718 7.17 333,137
2010 38,322 1.36 8.77 336,190 6.45 247,004
2011 35,801 1.31 10.39 372,144 7.95 284,569
2012 38,198 1.09 6.87 262,455 6.30 240,804
2013 38,579 1.22 8.72 336,430 7.17 276,671
FOX SQUIRREL
2003 62,267 1.16 7.59 472,608 6.55 407,539
2004 77,356 1.27 9.15 707,660 7.21 557,498
2005 57,169 1.12 6.94 396,764 6.22 355,441
2006 55,336 1.05 8.36 462,430 7.96 440,425
2007 50,276 1.15 6.94 348,791 6.01 302,355
2008 45,047 0.79 6.53 294,005 8.27 372,556
2009 46,784 0.90 6.31 295,356 6.97 326,251 2010 39,890 0.98 5.98 238,468 6.10 243,171
2011 36,535 0.95 7.19 262,722 7.58 277,042
2012 41,190 0.76 5.11 210,351 6.75 278,121
2013 41,416 0.82 5.38 222,963 6.56 271,754
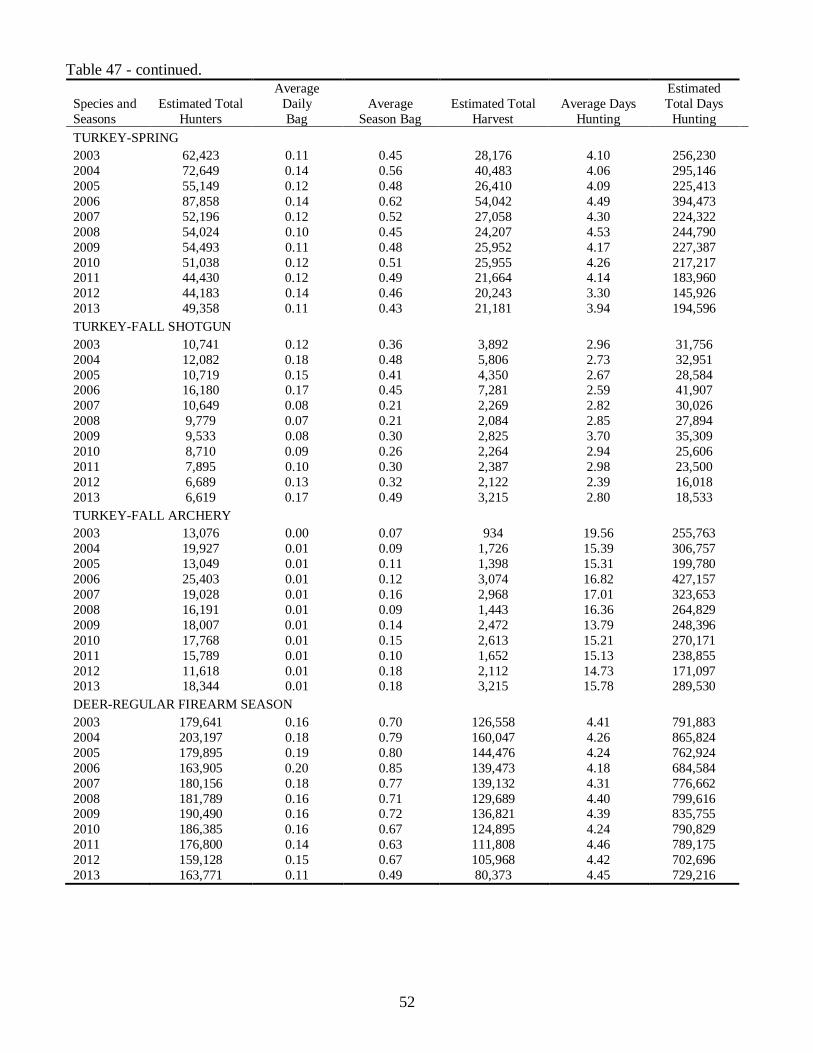
52
Table 47 - continued.
Species and
Seasons
Estimated Total
Hunters
Average
Daily
Bag
Average
Season Bag
Estimated Total
Harvest
Average Days
Hunting
Estimated
Total Days
Hunting
TURKEY-SPRING
2003 62,423 0.11 0.45 28,176 4.10 256,230
2004 72,649 0.14 0.56 40,483 4.06 295,146
2005 55,149 0.12 0.48 26,410 4.09 225,413
2006 87,858 0.14 0.62 54,042 4.49 394,473
2007 52,196 0.12 0.52 27,058 4.30 224,322
2008 54,024 0.10 0.45 24,207 4.53 244,790
2009 54,493 0.11 0.48 25,952 4.17 227,387
2010 51,038 0.12 0.51 25,955 4.26 217,217 2011 44,430 0.12 0.49 21,664 4.14 183,960
2012 44,183 0.14 0.46 20,243 3.30 145,926
2013 49,358 0.11 0.43 21,181 3.94 194,596
TURKEY-FALL SHOTGUN
2003 10,741 0.12 0.36 3,892 2.96 31,756
2004 12,082 0.18 0.48 5,806 2.73 32,951
2005 10,719 0.15 0.41 4,350 2.67 28,584 2006 16,180 0.17 0.45 7,281 2.59 41,907
2007 10,649 0.08 0.21 2,269 2.82 30,026
2008 9,779 0.07 0.21 2,084 2.85 27,894
2009 9,533 0.08 0.30 2,825 3.70 35,309
2010 8,710 0.09 0.26 2,264 2.94 25,606
2011 7,895 0.10 0.30 2,387 2.98 23,500
2012 6,689 0.13 0.32 2,122 2.39 16,018
2013 6,619 0.17 0.49 3,215 2.80 18,533
TURKEY-FALL ARCHERY
2003 13,076 0.00 0.07 934 19.56 255,763
2004 19,927 0.01 0.09 1,726 15.39 306,757
2005 13,049 0.01 0.11 1,398 15.31 199,780
2006 25,403 0.01 0.12 3,074 16.82 427,157
2007 19,028 0.01 0.16 2,968 17.01 323,653
2008 16,191 0.01 0.09 1,443 16.36 264,829
2009 18,007 0.01 0.14 2,472 13.79 248,396
2010 17,768 0.01 0.15 2,613 15.21 270,171
2011 15,789 0.01 0.10 1,652 15.13 238,855
2012 11,618 0.01 0.18 2,112 14.73 171,097 2013 18,344 0.01 0.18 3,215 15.78 289,530
DEER-REGULAR FIREARM SEASON
2003 179,641 0.16 0.70 126,558 4.41 791,883
2004 203,197 0.18 0.79 160,047 4.26 865,824
2005 179,895 0.19 0.80 144,476 4.24 762,924
2006 163,905 0.20 0.85 139,473 4.18 684,584
2007 180,156 0.18 0.77 139,132 4.31 776,662
2008 181,789 0.16 0.71 129,689 4.40 799,616 2009 190,490 0.16 0.72 136,821 4.39 835,755
2010 186,385 0.16 0.67 124,895 4.24 790,829
2011 176,800 0.14 0.63 111,808 4.46 789,175
2012 159,128 0.15 0.67 105,968 4.42 702,696
2013 163,771 0.11 0.49 80,373 4.45 729,216
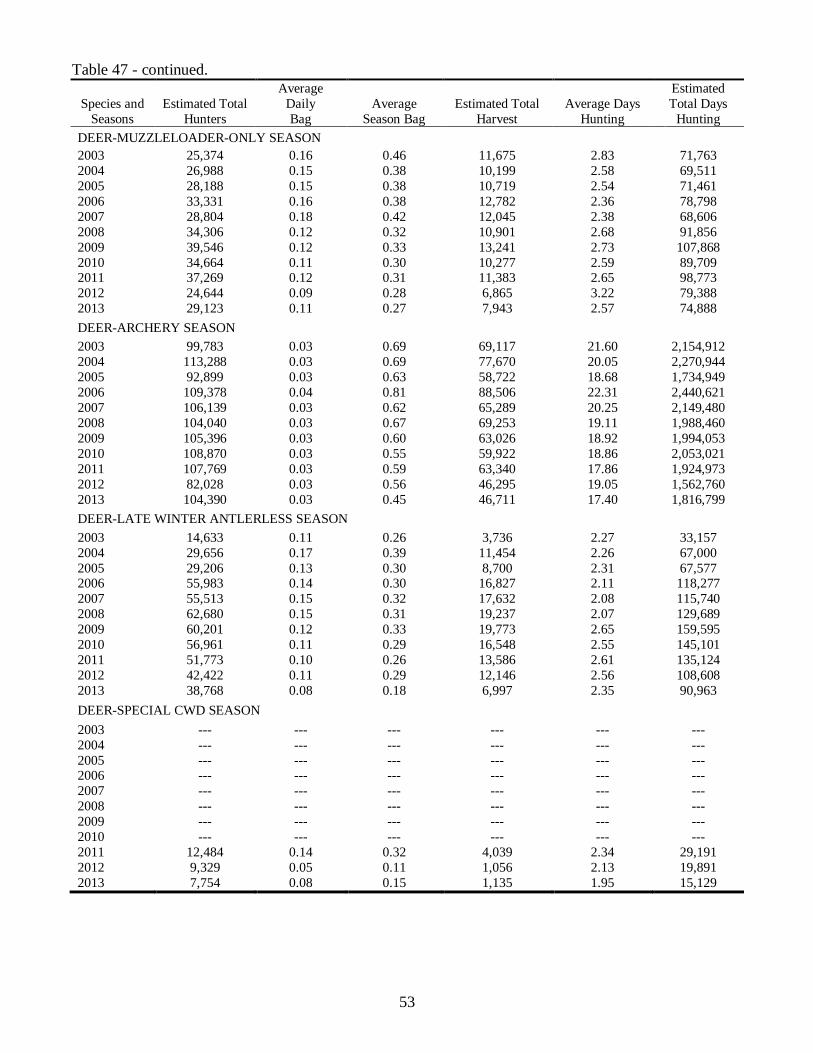
53
Table 47 - continued.
Species and
Seasons
Estimated Total
Hunters
Average
Daily
Bag
Average
Season Bag
Estimated Total
Harvest
Average Days
Hunting
Estimated
Total Days
Hunting
DEER-MUZZLELOADER-ONLY SEASON
2003 25,374 0.16 0.46 11,675 2.83 71,763
2004 26,988 0.15 0.38 10,199 2.58 69,511
2005 28,188 0.15 0.38 10,719 2.54 71,461
2006 33,331 0.16 0.38 12,782 2.36 78,798
2007 28,804 0.18 0.42 12,045 2.38 68,606
2008 34,306 0.12 0.32 10,901 2.68 91,856
2009 39,546 0.12 0.33 13,241 2.73 107,868
2010 34,664 0.11 0.30 10,277 2.59 89,709 2011 37,269 0.12 0.31 11,383 2.65 98,773
2012 24,644 0.09 0.28 6,865 3.22 79,388
2013 29,123 0.11 0.27 7,943 2.57 74,888
DEER-ARCHERY SEASON
2003 99,783 0.03 0.69 69,117 21.60 2,154,912
2004 113,288 0.03 0.69 77,670 20.05 2,270,944
2005 92,899 0.03 0.63 58,722 18.68 1,734,949
2006 109,378 0.04 0.81 88,506 22.31 2,440,621
2007 106,139 0.03 0.62 65,289 20.25 2,149,480
2008 104,040 0.03 0.67 69,253 19.11 1,988,460
2009 105,396 0.03 0.60 63,026 18.92 1,994,053
2010 108,870 0.03 0.55 59,922 18.86 2,053,021
2011 107,769 0.03 0.59 63,340 17.86 1,924,973
2012 82,028 0.03 0.56 46,295 19.05 1,562,760
2013 104,390 0.03 0.45 46,711 17.40 1,816,799
DEER-LATE WINTER ANTLERLESS SEASON
2003 14,633 0.11 0.26 3,736 2.27 33,157
2004 29,656 0.17 0.39 11,454 2.26 67,000
2005 29,206 0.13 0.30 8,700 2.31 67,577 2006 55,983 0.14 0.30 16,827 2.11 118,277
2007 55,513 0.15 0.32 17,632 2.08 115,740
2008 62,680 0.15 0.31 19,237 2.07 129,689
2009 60,201 0.12 0.33 19,773 2.65 159,595
2010 56,961 0.11 0.29 16,548 2.55 145,101
2011 51,773 0.10 0.26 13,586 2.61 135,124
2012 42,422 0.11 0.29 12,146 2.56 108,608
2013 38,768 0.08 0.18 6,997 2.35 90,963
DEER-SPECIAL CWD SEASON
2003 --- --- --- --- --- ---
2004 --- --- --- --- --- ---
2005 --- --- --- --- --- --- 2006 --- --- --- --- --- ---
2007 --- --- --- --- --- ---
2008 --- --- --- --- --- ---
2009 --- --- --- --- --- ---
2010 --- --- --- --- --- ---
2011 12,484 0.14 0.32 4,039 2.34 29,191
2012 9,329 0.05 0.11 1,056 2.13 19,891
2013 7,754 0.08 0.15 1,135 1.95 15,129
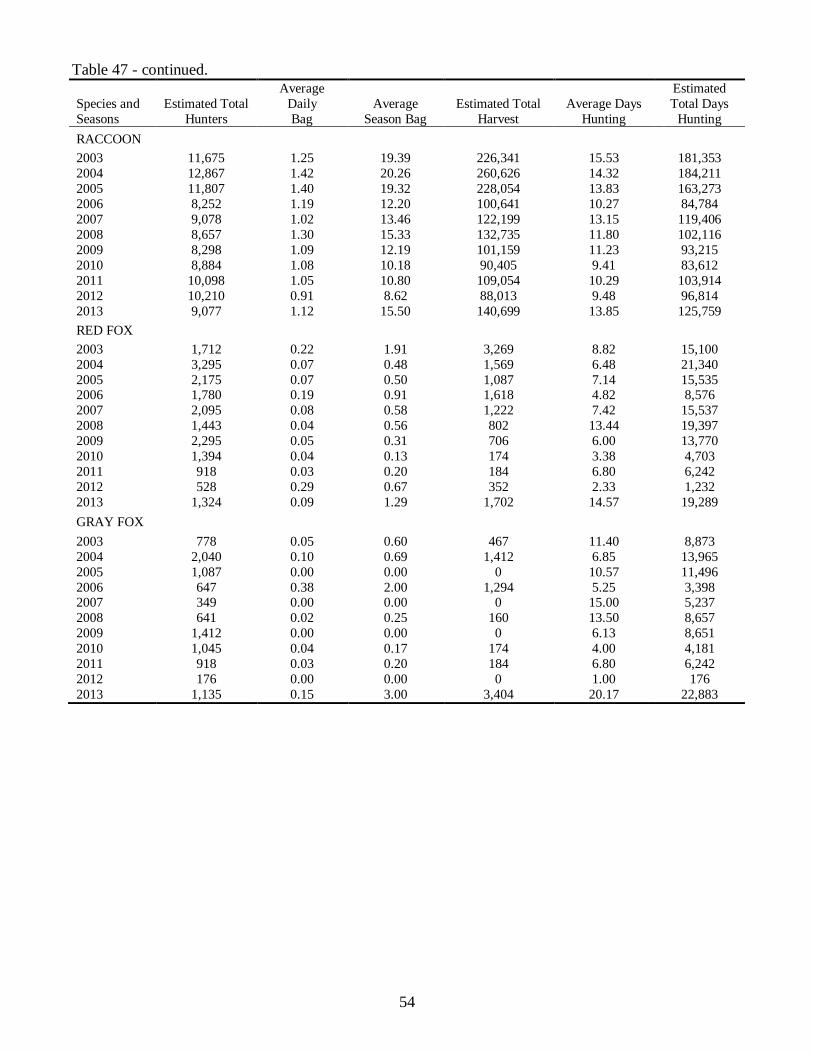
54
Table 47 - continued.
Species and
Seasons
Estimated Total
Hunters
Average
Daily
Bag
Average
Season Bag
Estimated Total
Harvest
Average Days
Hunting
Estimated
Total Days
Hunting
RACCOON
2003 11,675 1.25 19.39 226,341 15.53 181,353
2004 12,867 1.42 20.26 260,626 14.32 184,211
2005 11,807 1.40 19.32 228,054 13.83 163,273
2006 8,252 1.19 12.20 100,641 10.27 84,784
2007 9,078 1.02 13.46 122,199 13.15 119,406
2008 8,657 1.30 15.33 132,735 11.80 102,116
2009 8,298 1.09 12.19 101,159 11.23 93,215
2010 8,884 1.08 10.18 90,405 9.41 83,612
2011 10,098 1.05 10.80 109,054 10.29 103,914
2012 10,210 0.91 8.62 88,013 9.48 96,814
2013 9,077 1.12 15.50 140,699 13.85 125,759
RED FOX
2003 1,712 0.22 1.91 3,269 8.82 15,100
2004 3,295 0.07 0.48 1,569 6.48 21,340
2005 2,175 0.07 0.50 1,087 7.14 15,535 2006 1,780 0.19 0.91 1,618 4.82 8,576
2007 2,095 0.08 0.58 1,222 7.42 15,537
2008 1,443 0.04 0.56 802 13.44 19,397
2009 2,295 0.05 0.31 706 6.00 13,770
2010 1,394 0.04 0.13 174 3.38 4,703
2011 918 0.03 0.20 184 6.80 6,242
2012 528 0.29 0.67 352 2.33 1,232
2013 1,324 0.09 1.29 1,702 14.57 19,289
GRAY FOX
2003 778 0.05 0.60 467 11.40 8,873
2004 2,040 0.10 0.69 1,412 6.85 13,965
2005 1,087 0.00 0.00 0 10.57 11,496
2006 647 0.38 2.00 1,294 5.25 3,398 2007 349 0.00 0.00 0 15.00 5,237
2008 641 0.02 0.25 160 13.50 8,657
2009 1,412 0.00 0.00 0 6.13 8,651
2010 1,045 0.04 0.17 174 4.00 4,181
2011 918 0.03 0.20 184 6.80 6,242
2012 176 0.00 0.00 0 1.00 176
2013 1,135 0.15 3.00 3,404 20.17 22,883

55
Table 47 - continued.
Species and
Seasons
Estimated Total
Hunters
Average
Daily
Bag
Average
Season Bag
Estimated Total
Harvest
Average Days
Hunting
Estimated
Total Days
Hunting
COYOTE
2003 26,775 0.28 3.48 93,245 12.39 331,729
2004 33,265 0.18 2.16 71,707 12.29 408,748
2005 31,070 0.47 4.07 126,610 8.73 271,086
2006 35,273 0.24 1.71 60,190 7.21 254,191
2007 34,216 0.26 3.02 103,345 11.41 390,513
2008 31,741 0.19 2.45 77,749 13.04 413,755
2009 31,072 0.27 1.95 60,731 7.17 222,797
2010 31,354 0.27 2.36 74,031 8.91 279,229
2011 31,027 0.23 2.20 68,113 9.44 292,831
2012 30,805 0.23 1.91 58,969 8.34 256,998
2013 31,582 0.37 3.35 105,903 9.14 288,774
OPOSSUM
2003 778 0.50 3.40 2,646 6.80 5,293
2004 2,824 0.49 5.94 16,789 12.11 34,206
2005 2,952 0.43 6.16 18,176 14.26 42,100 2006 1,618 0.48 7.10 11,488 14.80 23,947
2007 1,920 0.76 4.82 9,252 6.36 12,220
2008 2,084 0.75 4.31 8,977 5.77 12,023
2009 2,648 0.99 5.27 13,947 5.33 14,123
2010 2,090 1.48 5.42 11,322 3.67 7,664
2011 2,937 0.59 4.31 12,668 7.31 21,480
2012 2,816 0.45 3.38 9,505 7.44 20,947
2013 1,702 0.82 8.11 13,805 9.89 16,831 a 2013-14 figures, other than the standardized average daily bag, are not directly comparable to previous years due to
increased season length in 2013-14 season. b Methods used to estimate figures has changed from previous years; thus, figures are not directly comparable.
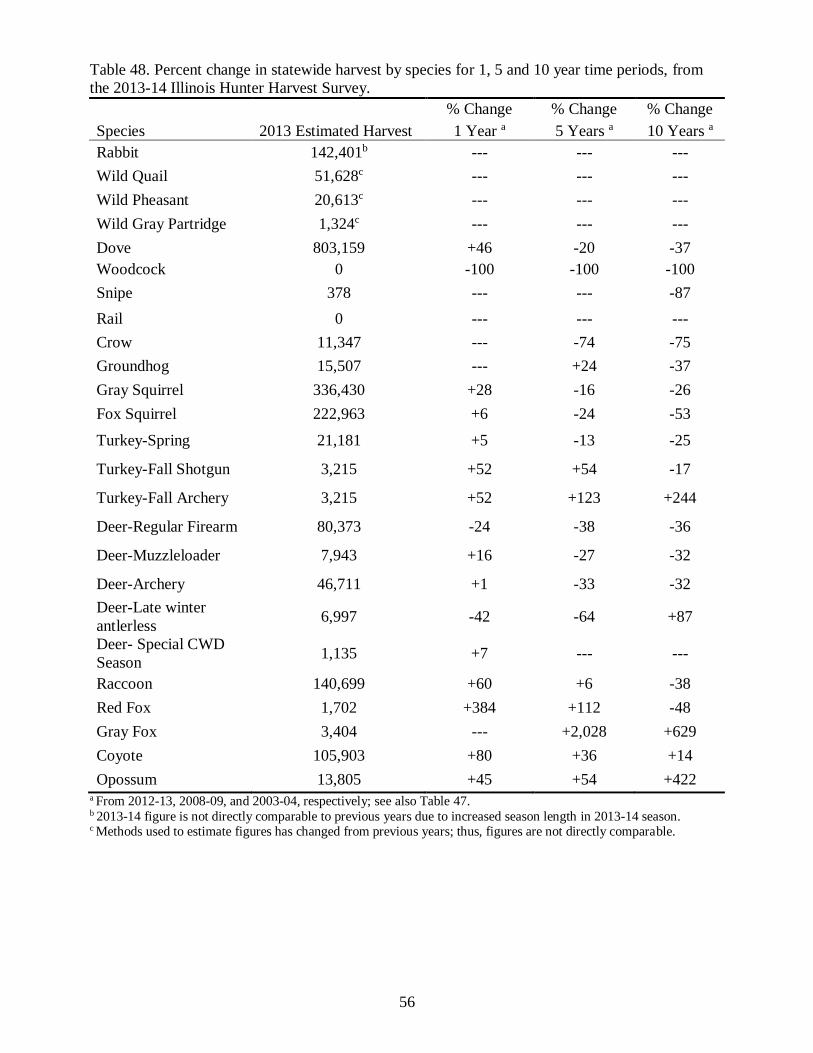
56
Table 48. Percent change in statewide harvest by species for 1, 5 and 10 year time periods, from
the 2013-14 Illinois Hunter Harvest Survey.
% Change % Change % Change
Species 2013 Estimated Harvest 1 Year a 5 Years a 10 Years a
Rabbit 142,401b --- --- ---
Wild Quail 51,628c --- --- ---
Wild Pheasant 20,613c --- --- ---
Wild Gray Partridge 1,324c --- --- ---
Dove 803,159 +46 -20 -37
Woodcock 0 -100 -100 -100
Snipe 378 --- --- -87
Rail 0 --- --- ---
Crow 11,347 --- -74 -75
Groundhog 15,507 --- +24 -37
Gray Squirrel 336,430 +28 -16 -26
Fox Squirrel 222,963 +6 -24 -53
Turkey-Spring 21,181 +5 -13 -25
Turkey-Fall Shotgun 3,215 +52 +54 -17
Turkey-Fall Archery 3,215 +52 +123 +244
Deer-Regular Firearm 80,373 -24 -38 -36
Deer-Muzzleloader 7,943 +16 -27 -32
Deer-Archery 46,711 +1 -33 -32
Deer-Late winter
antlerless 6,997 -42 -64 +87
Deer- Special CWD
Season 1,135 +7 --- ---
Raccoon 140,699 +60 +6 -38
Red Fox 1,702 +384 +112 -48
Gray Fox 3,404 --- +2,028 +629
Coyote 105,903 +80 +36 +14
Opossum 13,805 +45 +54 +422 a From 2012-13, 2008-09, and 2003-04, respectively; see also Table 47. b 2013-14 figure is not directly comparable to previous years due to increased season length in 2013-14 season. c Methods used to estimate figures has changed from previous years; thus, figures are not directly comparable.

57
Table 49. Species that hunters have increased their efforts for within the past five years (n=1488).
Species Number of hunters Percent of hunters
Deer (firearm) 618 41.5%
Deer (archery) 478 32.1
Turkeys 266 17.9
Ducks 179 12.0
Squirrels 167 11.2
Geese 135 9.1
Doves 122 8.2
Pheasants 108 7.5
Rabbitsa 82 5.5
Furbearers 53 3.6
Quail 44 3.0
Coyotes* 24 1.7
Gray Partridge 4 0.3
Raccoon* 5 0.3
Deer (crossbow), elk & woodchuck* 3 0.3
None 204 13.7 aHunters had an additional two to four weeks to hunt rabbit in 2013-14 than previous years.
*Indicates write-ins provided by hunters.
Table 50. Species that hunters have decreased their efforts for within the past five years (n=1488).
Species Number of hunters Percent of hunters
None 332 22.3%
Rabbitsa 311 20.9
Pheasants 254 17.1
Deer (firearm) 244 16.4
Squirrels 233 15.7
Deer (archery) 207 13.9
Doves 205 13.8
Quail 184 12.4
Turkeys 160 10.8
Ducks 152 10.2
Geese 144 9.7
Furbearers 78 5.2
Gray Partridge 40 2.7
Coyotes* 4 0.3
Raccoon* 2 0.1 aHunters had an additional two to four weeks to hunt rabbit in 2013-14 than previous years.
*Indicates write-ins provided by hunters.

58
Table 51. Preferred species if hunters are given only one day to hunt only one species (n=1436).
Species Number of hunters Percent of hunters
Deer 980 68.2%
Ducks 99 6.9
Turkeys 93 6.5
Pheasants 77 5.4
Squirrels 52 3.6
Furbearers 29 2.0
Rabbits 24 1.7
Doves 28 1.9
Geese 21 1.5
Quail 18 1.3
Coyotes* 11 0.8
Raccoon* 2 0.1
Gray Partridge 2 0.1
*Indicates write-ins provided by hunters.
Table 52. 2013-14 Season applicants’ satisfaction ratings for the Free Upland Game Permit
application process (n=62).
Impact level Number of hunters Percent of hunters
Very Dissatisfied 4 6.5%
Dissatisfied 2 3.2
Slightly Dissatisfied 3 4.8
Unsure 10 16.1
Slightly Satisfied 5 8.1
Satisfied 29 46.8
Very Satisfied 9 14.5
*Cases selected for those who applied for a Free Upland Game Permit for the 2013-14 season.

59
Table 53. Reasons why hunters do not apply for a Free Upland Game Permit every year (n=165).
Reason Number of hunters Percent of hunters
Not enough time 51 30.9%
I prefer to hunt other game during the
upland season
41 24.8
I forgot or missed the drawing deadline 39 23.6
Too much competition from other hunters 29 17.6
Do not have enough dogs 25 15.2
Poor habitat quality 22 13.3
I am never drawn for my preferred site 15 9.1
Do not have enough people 14 8.5
I have limited internet access 11 6.7
My preferred site is too far away 7 4.2
*Cases selected for those who have applied for a Free Upland Game Permit, but who do not apply every year.
Table 54. How often respondents reported hunting upland game in Illinois at the following types of
sites during the 2013-14 hunting season.
Never Rarely Sometimes Often Always
IDNR controlled pheasant hunts (n=1021) 89.3% 3.3% 2.9% 2.7% 1.7%
Public hunting areas (n=1021) 83.5% 4.9% 6.2% 2.6% 2.7%
Private hunting preserves (n=1021) 86.2% 4.4% 4.0% 2.2% 3.2%
Private land I lease (n=985) 93.9% 1.6% 0.9% 1.9% 1.6%
Private land owned by me (n=1056) 77.9% 3.8% 3.7% 4.6% 9.9%
Private land owned by someone who gave
me permission (n=1160) 60.4% 5.9% 9.1% 7.2% 17.3%

60
Table 55. Number of dead deer seen between July through October 2013.*
Number of dead
deer observed
Number
of hunters
(# of dead deer observed x
# of hunters)
1 57 57
2 49 98
3 26 78
4 17 68
5 17 85
6 9 54
8 5 40
9 1 9
10 3 30
11 1 11
12 2 24
15 1 15
17 1 17
20 1 20
38 1 38
TOTAL 191 644
*Indicates number of dead deer hunters actually saw in or next to bodies of water (creeks, ponds, lakes, etc.), were fresh enough to have died during the July-October period, and did not show any visible signs of trauma (broken
bones or other wounds).
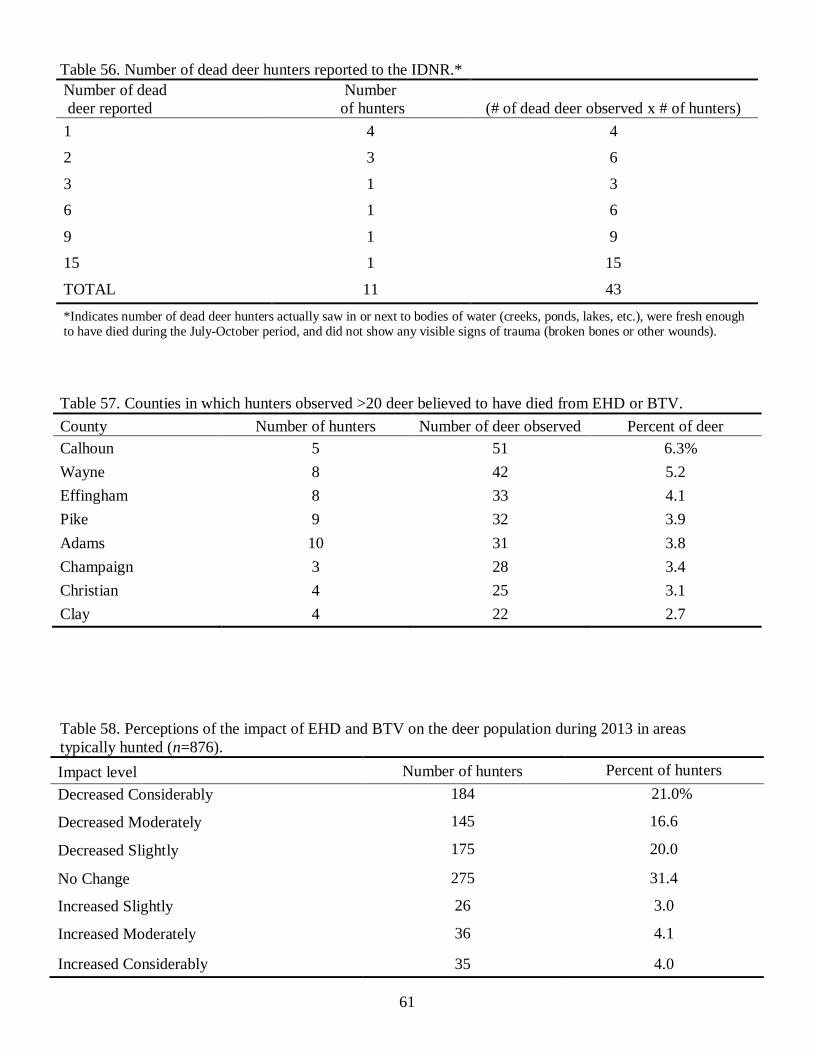
61
Table 56. Number of dead deer hunters reported to the IDNR.*
Number of dead
deer reported
Number
of hunters (# of dead deer observed x # of hunters)
1 4 4
2 3 6
3 1 3
6 1 6
9 1 9
15 1 15
TOTAL 11 43
*Indicates number of dead deer hunters actually saw in or next to bodies of water (creeks, ponds, lakes, etc.), were fresh enough to have died during the July-October period, and did not show any visible signs of trauma (broken bones or other wounds).
Table 57. Counties in which hunters observed >20 deer believed to have died from EHD or BTV.
County Number of hunters Number of deer observed Percent of deer
Calhoun 5 51 6.3%
Wayne 8 42 5.2
Effingham 8 33 4.1
Pike 9 32 3.9
Adams 10 31 3.8
Champaign 3 28 3.4
Christian 4 25 3.1
Clay 4 22 2.7
Table 58. Perceptions of the impact of EHD and BTV on the deer population during 2013 in areas
typically hunted (n=876).
Impact level Number of hunters Percent of hunters
Decreased Considerably 184 21.0%
Decreased Moderately 145 16.6
Decreased Slightly 175 20.0
No Change 275 31.4
Increased Slightly 26 3.0
Increased Moderately 36 4.1
Increased Considerably 35 4.0

62
Table 59. Perceptions of the impact of EHD and BTV on the deer population during 2013 in the entire state
(n=869).
Table 60. Effect of EHD/BTV on hunting behaviors.
Change in hunting approach Number of hunters Percent of hunters
Did not change approach at all 574 55.1%
EHD/BTV did not affect area 181 17.4
Passed on does 129 12.4
Did not hunt as many days 124 11.9
Usually hunt Late-Winter Season, but did not
this year. 86 8.3
Moved to a new hunting area 19 1.8
Did not hunt at all 14 1.3
Hunted, but did not intend to eat deer 10 1.0
Table 61. Number of deer seen during the 2013-14 deer season compared to 5 years ago (n=986).
Change in number of deer seen Number of hunters Percent of hunters
Decreased Considerably 375 38.0%
Decreased Moderately 206 20.9
Decreased Slightly 178 18.1
No Change 137 13.9
Increased Slightly 53 5.4
Increased Moderately 29 2.9
Increased Considerably 8 0.8
Impact level Number of hunters Percent of hunters
Decreased Considerably 185 21.3%
Decreased Moderately 209 24.1
Decreased Slightly 179 20.6
No Change 166 19.1
Increased Slightly 48 5.5
Increased Moderately 41 4.7
Increased Considerably 41 4.7

63
Table 62. Number of deer harvested during the 2013-14 deer season compared to 5 years ago (n=967).
Change in deer harvested Number of hunters Percent of hunters
Decreased Considerably 294 30.4%
Decreased Moderately 150 15.5
Decreased Slightly 176 18.2
No Change 306 31.6
Increased Slightly 23 2.4
Increased Moderately 10 1.0
Increased Considerably 8 0.8
Table 63. Reasons hunters did not go deer hunting during the 2013-14 seasons.
Reason Number of hunters Percent of hunters
Not enough time 83 18.6%
I’ve never been a deer hunter 76 17.0
Lost interest 52 11.6
No access to places to hunt 49 11.0
I was poor in health 45 10.1
Fewer deer where I hunt 35 7.8
Too expensive 17 3.8
Didn’t draw a permit 13 2.9
Deer hunting takes too much effort 3 0.7
Other 31 6.9

64
Table 64. Support for regulations on buck harvest.
I support a limit of…
Strongly
Disagree
(%)
Disagree
(%)
Slightly
Disagree
(%)
Unsure
(%)
Slightly
Agree
(%)
Agree
(%)
Strongly
Agree
(%)
One (1) antlered buck per hunter per
year for all seasons combined
(n=933). 24.8 16.6 8.0 8.0 7.8 12.2 22.5
Two (2) antlered bucks per hunter per
year for all seasons combined
(n=948). 15.1 7.5 5.0 7.9 8.9 27.7 28.0
Two (2) antlered bucks per hunter per
year for all seasons combined,
only one of which may be taken
before the close of the first firearm
deer season (n=890).
26.3 15.7 6.5 21.6 7.9 11.7 10.3
*Cases selected for those who went deer hunting at least one day.
Table 65. Preference for “Late-Winter” antlerless-only Firearm season.
“Late-Winter” Antlerless-only
Firearm
Strongly
Disagree
(%)
Disagree
(%)
Slightly
Disagree
(%)
Unsure
(%)
Slightly
Agree
(%)
Agree
(%)
Strongly
Agree
(%)
The current dates for the Late-Winter
Antlerless-only Firearm Deer Season
(held Dec. 26-29 and Jan. 17-19
during 2013-14) are about right
(n=961).
13.4 6.6 4.7 17.8 9.5 31.7 16.3
The “Late-Winter” antlerless-only
firearm deer season should be moved
to a single season in mid-October
(n=906).
37.4 18.1 5.1 15.9 6.3 8.7 8.5
The “Late-Winter” antlerless-only
firearm deer season should be moved
to a single season in mid-September
(n=900).
44.9 19.8 4.7 16.7 4.7 4.2 5.1
*Cases selected for those who went deer hunting at least one day.
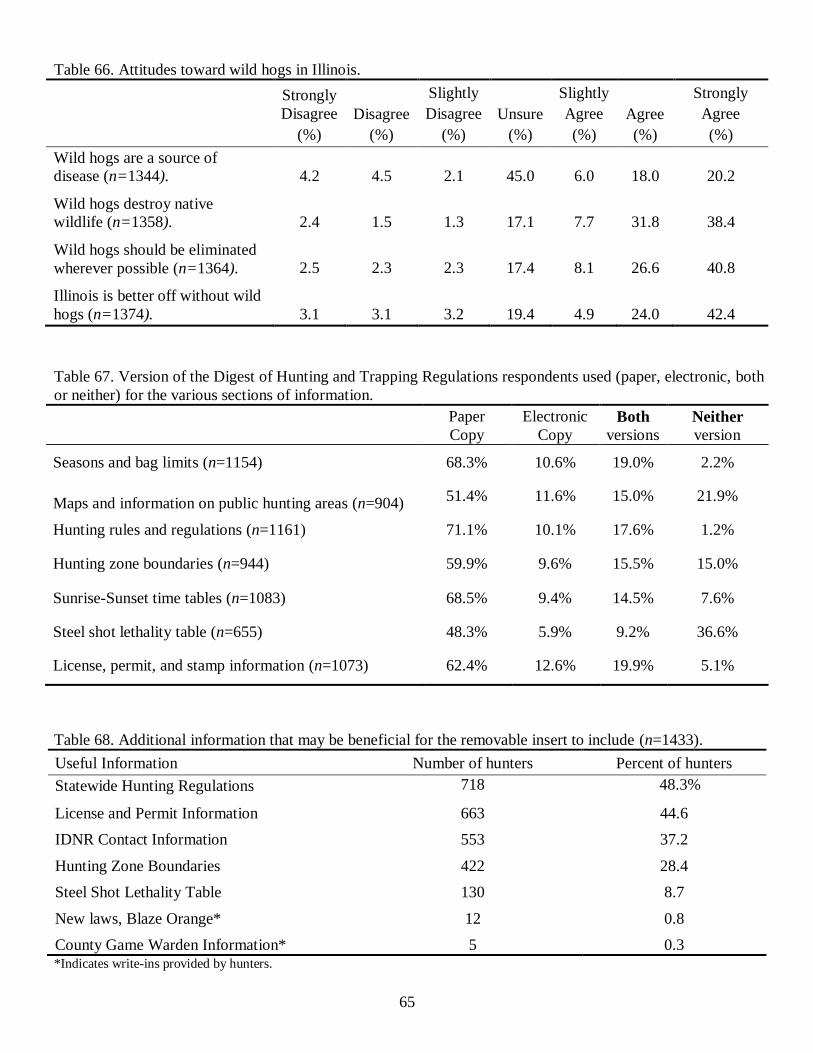
65
Table 66. Attitudes toward wild hogs in Illinois.
Strongly
Disagree
(%)
Disagree
(%)
Slightly
Disagree
(%)
Unsure
(%)
Slightly
Agree
(%)
Agree
(%)
Strongly
Agree
(%)
Wild hogs are a source of
disease (n=1344). 4.2 4.5 2.1 45.0 6.0 18.0 20.2
Wild hogs destroy native
wildlife (n=1358). 2.4 1.5 1.3 17.1 7.7 31.8 38.4
Wild hogs should be eliminated
wherever possible (n=1364). 2.5 2.3 2.3 17.4 8.1 26.6 40.8
Illinois is better off without wild
hogs (n=1374). 3.1 3.1 3.2 19.4 4.9 24.0 42.4
Table 67. Version of the Digest of Hunting and Trapping Regulations respondents used (paper, electronic, both
or neither) for the various sections of information.
Paper
Copy
Electronic
Copy
Both
versions
Neither
version
Seasons and bag limits (n=1154) 68.3% 10.6% 19.0% 2.2%
Maps and information on public hunting areas (n=904) 51.4% 11.6% 15.0% 21.9%
Hunting rules and regulations (n=1161) 71.1% 10.1% 17.6% 1.2%
Hunting zone boundaries (n=944) 59.9% 9.6% 15.5% 15.0%
Sunrise-Sunset time tables (n=1083) 68.5% 9.4% 14.5% 7.6%
Steel shot lethality table (n=655) 48.3% 5.9% 9.2% 36.6%
License, permit, and stamp information (n=1073) 62.4% 12.6% 19.9% 5.1%
Table 68. Additional information that may be beneficial for the removable insert to include (n=1433).
Useful Information Number of hunters Percent of hunters
Statewide Hunting Regulations 718 48.3%
License and Permit Information 663 44.6
IDNR Contact Information 553 37.2
Hunting Zone Boundaries 422 28.4
Steel Shot Lethality Table 130 8.7
New laws, Blaze Orange* 12 0.8
County Game Warden Information* 5 0.3 *Indicates write-ins provided by hunters.
66
Illinois Hunter Harvest Survey:
2013-2014 Seasons
Illinois Department of Natural Resources
Division of Wildlife Resources
and
Illinois Natural History Survey
The Department of Natural Resources is requesting disclosure of information that is necessary to accomplish the
statutory purpose as outlined under the Illinois Compiled Statutes, The Wildlife Code, Chapter 520. Disclosure of
information is voluntary. This study is funded by the federal Wildlife Restoration Fund through your purchase of
hunting arms and ammunition.
THANK YOU FOR YOUR COOPERATION!
All of your responses will be kept confidential.
Please return this survey in the postage-paid return envelope provided.
Appendix A

67
Section 1. Hunting Activity and Harvest in Illinois. Please provide the following information to allow IDNR
biologists to monitor game species harvest and conserve wildlife populations in Illinois.
1. Did you purchase a hunting license in 2013? ____ Yes ____ No (Please go to Question 5)
2. Did you hunt any wildlife species in Illinois between March 2013 and February 2014?
____ Yes ____ No (Please go to Question 5)
3. Please report your hunting effort and harvest in Illinois for the following species between March 1, 2013 and
February 28, 2014. Include only game harvested and days you personally hunted in Illinois. Count only game you
retrieved; do not count animals you were not able to retrieve or animals that were trapped. Count any part of a
day hunted as 1 day.
Species
Number of
Days Hunted
Number
Harvested
County Hunted
Most Often
Rabbit
Quail (shooting preserve, club, etc.)
Quail (wild)
Pheasant (shooting preserve, club, etc.)
Pheasant (wild)
Gray Partridge (shooting preserve, club, etc.)
Gray Partridge (wild)
Dove
Woodcock
Snipe
Rail
Crow
Ground Hog (Woodchuck)
Gray Squirrel
Fox Squirrel
Turkey – Spring
Turkey – Fall Shotgun
Turkey – Fall Archery
Deer – Regular Firearm Season
Deer – Muzzleloader-Only Season
Deer – Archery Season
Deer – Late Winter Firearm Season
Deer – Special CWD season
Raccoon
Red Fox
Gray Fox
Coyote
Opossum
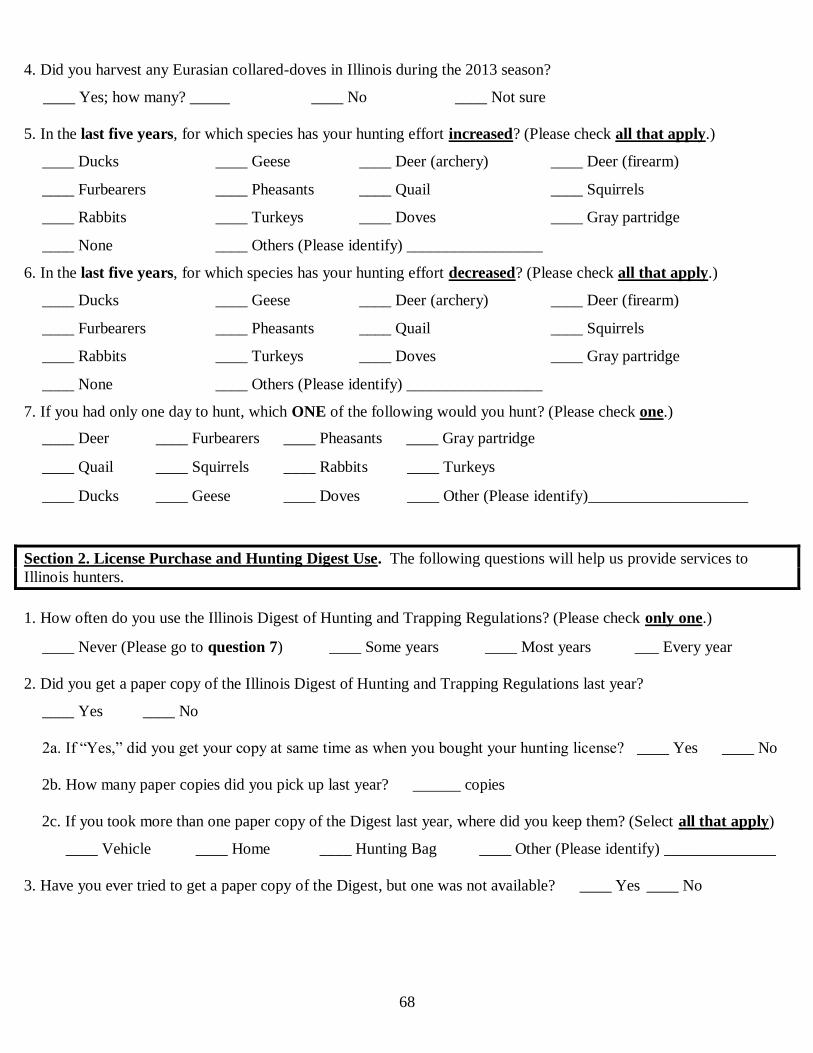
68
4. Did you harvest any Eurasian collared-doves in Illinois during the 2013 season?
____ Yes; how many? _____ ____ No ____ Not sure
5. In the last five years, for which species has your hunting effort increased? (Please check all that apply.)
____ Ducks ____ Geese ____ Deer (archery) ____ Deer (firearm)
____ Furbearers ____ Pheasants ____ Quail ____ Squirrels
____ Rabbits ____ Turkeys ____ Doves ____ Gray partridge
____ None ____ Others (Please identify) _________________
6. In the last five years, for which species has your hunting effort decreased? (Please check all that apply.)
____ Ducks ____ Geese ____ Deer (archery) ____ Deer (firearm)
____ Furbearers ____ Pheasants ____ Quail ____ Squirrels
____ Rabbits ____ Turkeys ____ Doves ____ Gray partridge
____ None ____ Others (Please identify) _________________
7. If you had only one day to hunt, which ONE of the following would you hunt? (Please check one.)
____ Deer ____ Furbearers ____ Pheasants ____ Gray partridge
____ Quail ____ Squirrels ____ Rabbits ____ Turkeys
____ Ducks ____ Geese ____ Doves ____ Other (Please identify)____________________
Section 2. License Purchase and Hunting Digest Use. The following questions will help us provide services to
Illinois hunters.
1. How often do you use the Illinois Digest of Hunting and Trapping Regulations? (Please check only one.)
____ Never (Please go to question 7) ____ Some years ____ Most years ___ Every year
2. Did you get a paper copy of the Illinois Digest of Hunting and Trapping Regulations last year?
____ Yes ____ No
2a. If “Yes,” did you get your copy at same time as when you bought your hunting license? ____ Yes ____ No
2b. How many paper copies did you pick up last year? ______ copies
2c. If you took more than one paper copy of the Digest last year, where did you keep them? (Select all that apply)
____ Vehicle ____ Home ____ Hunting Bag ____ Other (Please identify) ______________
3. Have you ever tried to get a paper copy of the Digest, but one was not available? ____ Yes ____ No

69
4. Which best describes where you picked up your most recent paper copy of the Digest? (Please check only one.)
____ IDNR office or state headquarters
____ Chain retail store (e.g. Wal-mart, Dick’s Sporting Goods)
____ Independent retail store (e.g. local bait shop, local grocery store)
____ Other (Please identify) _________________________________
5. Consider the various sections of the Digest of Hunting and Trapping Regulations. Please indicate which version of
the Digest (paper, electronic, both or neither) you use for each section.
Paper
Copy
Electronic
Copy Both
versions Neither
version
Seasons and bag limits 1 2 3 4
Maps and information on public hunting areas 1 2 3 4
Hunting rules and regulations 1 2 3 4
Hunting zone boundaries 1 2 3 4
Sunrise-Sunset time tables 1 2 3 4
Steel shot lethality table 1 2 3 4
License, permit, and stamp information 1 2 3 4
6. Which version of the Illinois Digest of Hunting and Trapping Regulations do you prefer? (Please check one)
____ Paper copy of the Digest
____ Electronic copy of the Digest
7. If future versions of the Digest included a removable insert with Season Start/End Dates, Sunrise/Sunset Tables,
and Possession Limits, would it change how many paper copies you take?
____ No ____ Yes, I would take fewer copies ____ Yes, I would take more copies
8. If the insert included Season Start/End Dates, Sunrise/Sunset Tables, and Possession Limits, how frequently do
you think you would use the insert?
____ Never ____ Rarely ____ Sometimes ____ Often ____ Always
8a. What information, other than that listed in question 8, do you think would be useful for this insert to include?
(Check all that apply)
____ License and permit information ____ Hunting zone boundaries ____ Statewide hunting regulations
____ Steel shot lethality table ____ IDNR Contact information ____ Other __________

70
Section 3. Upland Game Hunting. IDNR biologists are interested in learning about hunters who hunt upland and
furbearing game in order to better manage hunting opportunities.
1. The current Illinois Dove Season is open September 1 – October 27 and November 2 – November 14.
If the U.S. Fish and Wildlife Service determines that Illinois could add 20 days to the Dove Season, within the
window of September 1 – January 15, which option would you prefer? (Please check only one.)
____ Fill the 5 day gap between Oct. 27 and Nov. 2 and add 15 days from Dec. 26 – Jan.10.
____ Leave the October – November gap and add 20 days from Dec. 26 – Jan.15.
____ Run the season from Sept. 1 – Nov. 9 and add 20 days from Dec. 26 – Jan.15.
2. Which species did you intend to hunt during the 2013-14 season? (Please check all that apply)
____ Pheasant ____ Quail ____ Gray partridge ____ Rabbit ____ None
2a. In 2013-14, which of the following did you rely exclusively on receiving a Free Upland Game Permit to hunt?
____ Pheasant ____ Quail ____ Gray partridge ____ Rabbit ____ None
3. Did you apply for a Free Upland Game Permit for the 2013-14 season?
____ Yes ____ No ____ No, and I have never applied for one. (Please skip to question 11)
4. Was the 2013-14 season your first time applying for this permit? ____ Yes ____ No
4a. If “No”, when did you last apply for a Free Upland Game Permit? ___________ Year
5. Please rate your satisfaction with the Free Upland Game Permit application process. (Please circle one.)
Very Dissatisfied
Dissatisfied
Slightly Dissatisfied
Unsure
Slightly Satisfied
Satisfied
Very Satisfied
1 2 3 4 5 6 7
6. Which best describes how often you apply for a Free Upland Game Permit? (Please check one.)
____ Never (Skip to 11) ____ Rarely ____ Occasional years ____ Most years ____ Every year
7. Which best describes how often you are drawn for a Free Upland Game Permit? (Please check one.)
____ Never ____ Rarely ____ Occasional years ____ Most years ____ Every year
8. If you do not apply for a Free Upland Game Permit every year please indicate why. (Check all that apply.)
____ Not enough time ____ Do not have enough people
____ Poor habitat quality ____ Do not have enough dogs
____ I am never drawn for my preferred site ____ Too much competition from other hunters
____ I have limited internet access ____ My preferred site is too far away
____ I forgot or missed the drawing deadline ____ I prefer to hunt other game during the upland season
____ Other (Please identify) ______________________

71
9. When you apply for a Free Upland Game Permit, to how many sites do you typically apply? (Please circle one.)
1 2 3 4 5 6
10. Did you receive a Free Upland Game Permit for the 2013-14 season?
____ Yes ____ No
10a. If ”No,” when did you last receive a Free Upland Game Permit? ___________ Year
11. How often did you hunt upland game in Illinois at the following types of sites during the 2013-14 hunting season?
Never Rarely Sometimes Often Always
IDNR controlled pheasant hunts 1 2 3 4 5
Public hunting areas 1 2 3 4 5
Private hunting preserves 1 2 3 4 5
Private land I lease 1 2 3 4 5
Private land owned by me 1 2 3 4 5
Private land owned by someone
who gave me permission 1 2 3 4 5
Section 4. White-tailed Deer in Illinois. Please answer the following questions about white-tailed deer and
Epizootic Hemorrhagic Disease (EHD) and Blue Tongue Virus (BTV) in Illinois during 2013.
1. Using the table below, please report the number of dead deer you saw in or next to bodies of water (creeks,
ponds, lakes, etc.) from July through October 2013. Report ONLY deer that (1) YOU actually saw; (2)
were fresh enough to have died DURING the July-October period; (3) were IN or BESIDE a water source;
and (4) DID NOT show any visible signs of trauma (broken bones or other wounds). DO NOT report deer
that someone else told you about, if you did not actually see them.
Did you observe dead deer in this period?
If Yes, how many dead
deer, meeting the criteria above, did you see?
Did you report any of
the dead deer you observed to the IDNR?
If Yes, how many
dead deer did you report to the IDNR?
___ Yes ___ No _____ dead deer ___ Yes ___ No _____ reported
2. In which county did you observe the most deer that you believe died from EHD or BTV? ______________
County
3. How do you think EHD and BTV impacted the deer population during 2013 in areas you typically hunt?
Please circle the number that matches your response.
Decreased
Considerably
Decreased
Moderately
Decreased
Slightly
No
Change
Increased
Slightly
Increased
Moderately
Increased
Considerably
1 2 3 4 5 6 7
72
4. How do you think EHD and BTV impacted the deer population during 2013 throughout the entire state?
Please circle the number that matches your response.
Decreased Considerably
Decreased Moderately
Decreased Slightly
No Change
Increased Slightly
Increased Moderately
Increased Considerably
1 2 3 4 5 6 7
5. How did the 2013 EHD/BTV outbreak in the deer population change your approach to hunting?
(Check all that apply).
____ EHD and BTV did not affect my area ____ I went hunting, but did not intend to eat my deer
____ I passed on does ____ I did not hunt as many days
____ I moved to a new hunting area ____ I did not hunt at all
____ It did not change my approach at all ____ I usually hunt the Late-Winter Season, but did not this year
____ Other (Please identify) ____________________________
6. How did the number of deer you saw during the 2013-14 season compare to 5 years ago? Please circle the
number that matches your response.
Decreased
Considerably
Decreased
Moderately
Decreased
Slightly
No
Change
Increased
Slightly
Increased
Moderately
Increased
Considerably
1 2 3 4 5 6 7
7. How does the number of deer you harvested during the 2013-14 season compare to 5 years ago? Please
circle the number that matches your response.
Decreased
Considerably
Decreased
Moderately
Decreased
Slightly
No
Change
Increased
Slightly
Increased
Moderately
Increased
Considerably
1 2 3 4 5 6 7
8. Which type of land do you hunt most often for deer? (Please check one).
____ Private land owned by me ____ State land
____ Private land under a lease ____ Federal land
____ Private land owned by someone who gave me permission
9. If you did not hunt deer during the 2013-14 season, please select the reason(s) from the list below.
(Please check all that apply).
____ Fewer deer where I hunt ____ Didn’t draw a permit
____ Too expensive ____ Lost interest
____ No access to places to hunt ____ Not enough time
____ Deer hunting takes too much effort ____ I’ve never been a deer hunter
____ I was in poor health ____ Other (Please identify)_________________________

73
10. Please indicate how strongly you agree or disagree with the following statements.
I support a limit of… Strongly
Disagree
Disagree
Slightly
Disagree
Unsure
Slightly
Agree
Agree
Strongly
Agree
one (1) antlered buck per hunter per year for all
seasons combined 1 2 3 4 5 6 7
two (2) antlered buck per hunter per year for all
seasons combined 1 2 3 4 5 6 7
two (2) antlered buck per hunter per year for all
seasons combined, only one of which may be taken
before the close of the first firearm deer season. 1 2 3 4 5 6 7
“Late-Winter” Antlerless-only Firearm
The current dates for the Late-Winter Antlerless-
only Firearm Deer Season (held last season during
Dec. 26-29 and Jan. 17-19) are about right. 1 2 3 4 5 6 7
The “Late-Winter” antlerless-only firearm deer
season should be moved to a single season in mid-
October. 1 2 3 4 5 6 7
The “Late-Winter” antlerless-only firearm deer
season should be moved to a single season in mid-
September. 1 2 3 4 5 6 7
Section 5. Wild Hogs in Illinois. Please answer the following questions about wild (feral) hogs in Illinois.
1. Please indicate how strongly you agree or disagree with the following statements.
Strongly
Disagree
Disagree
Slightly
Disagree
Unsure
Slightly
Agree
Agree
Strongly
Agree
Wild hogs are a source of disease. 1 2 3 4 5 6 7
Wild hogs destroy native wildlife. 1 2 3 4 5 6 7
Wild hogs should be eliminated wherever possible. 1 2 3 4 5 6 7
Illinois is better off without wild hogs. 1 2 3 4 5 6 7
2. Did you observe wild hogs in the field at any point during the 2013-14 Illinois hunting seasons?
____ Yes (Which county?) _________________________ ____ No
3. Would you attempt to shoot a wild hog if you saw one while hunting during the firearm deer seasons?
____ Yes ____ No
4. Have you ever hunted wild hogs before in any state? ____ Yes ____ No
4a. If “Yes”, which state(s)? (Please identify) ____________________________
74
Section 6. Background Information. The following questions allow us to understand more about the people
involved in hunting in Illinois. All responses are kept confidential.
1. How many years have you hunted in Illinois? _____ years
2. What is your county of residence? ________________________ County
3. What county do you hunt in most often? ________________________ County
4. What is your gender? ____ Male ____ Female
5. Please give your age. _____ years
6. What is your military status? (Please check one)
____ I am a veteran of the U.S. Armed Forces.
____ I am currently on active duty in the U.S. military.
____ I am currently serving in the U.S. military but not on active duty.
____ I have never served in the U.S. military.
Comments
THANK YOU FOR YOUR TIME AND ASSISTANCE!
Please return this survey in the postage-paid envelope provided. The Illinois Department of Natural Resources receives federal assistance and therefore must comply with federal anti-discrimination laws. In compliance with the
Illinois Human Rights Act, the Illinois Constitution, Title VI of the 1964 Civil Rights Act, Section 504 of the Rehabilitation Act as amended, and the U.S. Constitution,
the Illinois Department of Natural Resources does not discriminate on the basis of race, color, sex, national origin, age, or disability. If you believe you have been
discriminated against in any program, activity, or facility, please contact the Equal Employment Opportunity Officer, Department of Natural Resources, One Natural
Resources Way, Springfield, IL 62701-1787, (217) 782-7616 or the Officer of Human Resources, U.S. Fish and Wildlife Service, Washington, D.C. 20240.

75
Appendix B
April 15, 2014
Dear Illinois Hunter,
You are one of a select group of Illinois hunters asked to provide information about your
hunting activities during the 2013-2014 hunting season. Please take a few minutes to complete the enclosed
questionnaire, even if you did not hunt or were not successful.
The information you and other selected hunters furnish our biologists is vital for proper wildlife management
and allows us to safeguard wildlife populations while maximizing hunting opportunities. A postage-paid
envelope is provided for returning the questionnaire to us.
You may access the results of this and other studies of hunters and hunting in Illinois at
http://www.inhs.illinois.edu/programs/hd/. You may also find information about Illinois Department of Natural
Resources wildlife management programs and wildlife in Illinois at http://dnr.state.il.us/orc/wildliferesources/.
Thank you for your time and assistance.
1816 South Oak Street,
Champaign, Illinois 61820 USA
ILLINOIS NATURAL HISTORY SURVEY Prairie Research Institute
University of Illinois at Urbana-Champaign

76
Appendix C
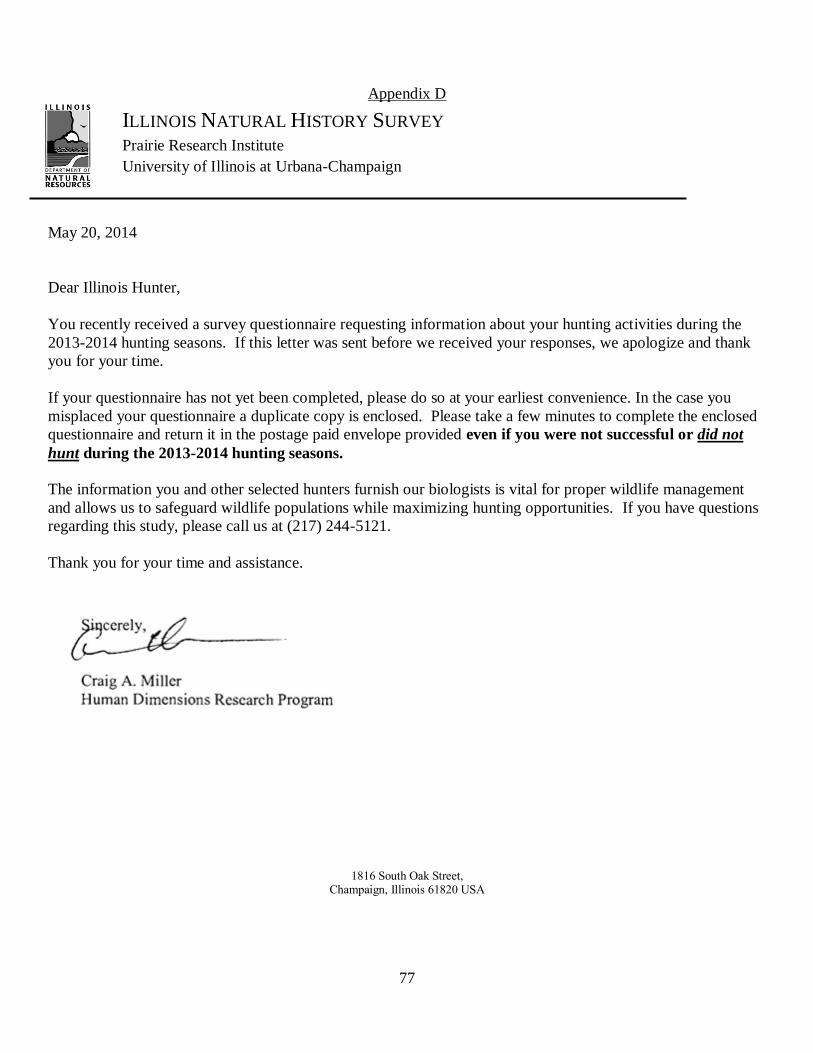
77
Appendix D
May 20, 2014
Dear Illinois Hunter,
You recently received a survey questionnaire requesting information about your hunting activities during the
2013-2014 hunting seasons. If this letter was sent before we received your responses, we apologize and thank
you for your time.
If your questionnaire has not yet been completed, please do so at your earliest convenience. In the case you
misplaced your questionnaire a duplicate copy is enclosed. Please take a few minutes to complete the enclosed
questionnaire and return it in the postage paid envelope provided even if you were not successful or did not
hunt during the 2013-2014 hunting seasons.
The information you and other selected hunters furnish our biologists is vital for proper wildlife management
and allows us to safeguard wildlife populations while maximizing hunting opportunities. If you have questions
regarding this study, please call us at (217) 244-5121.
Thank you for your time and assistance.
1816 South Oak Street,
Champaign, Illinois 61820 USA
ILLINOIS NATURAL HISTORY SURVEY Prairie Research Institute
University of Illinois at Urbana-Champaign

78
Appendix E
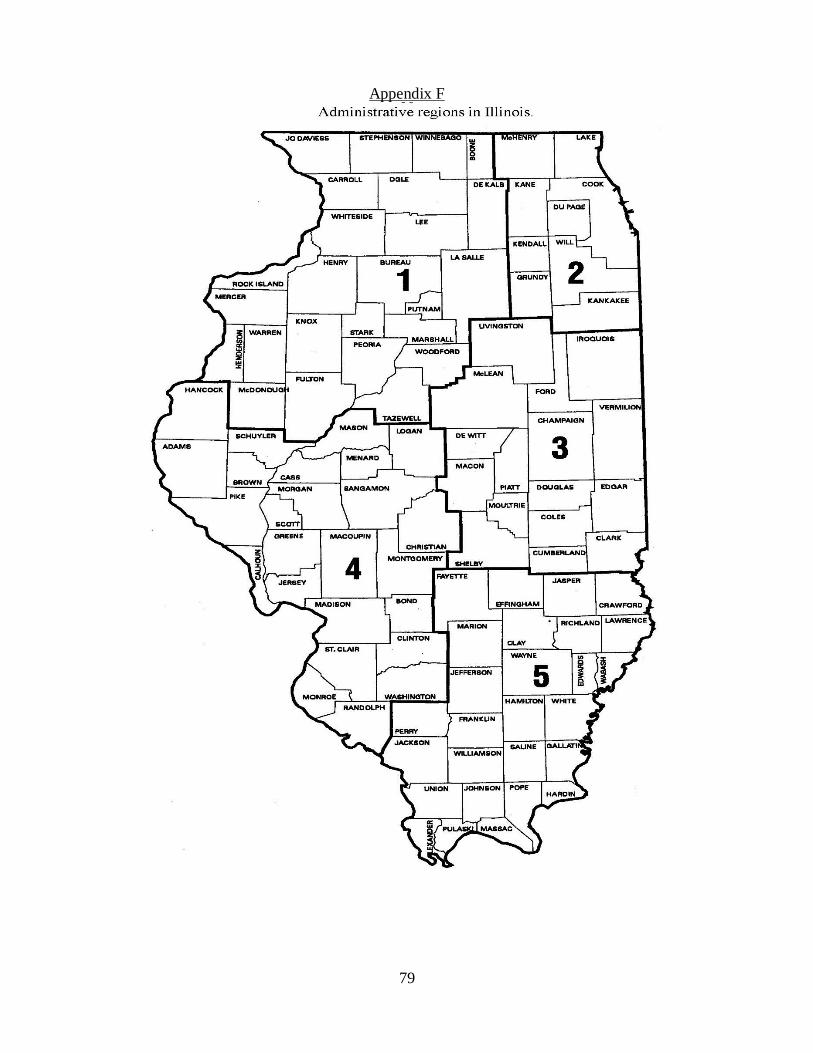
79
Appendix F
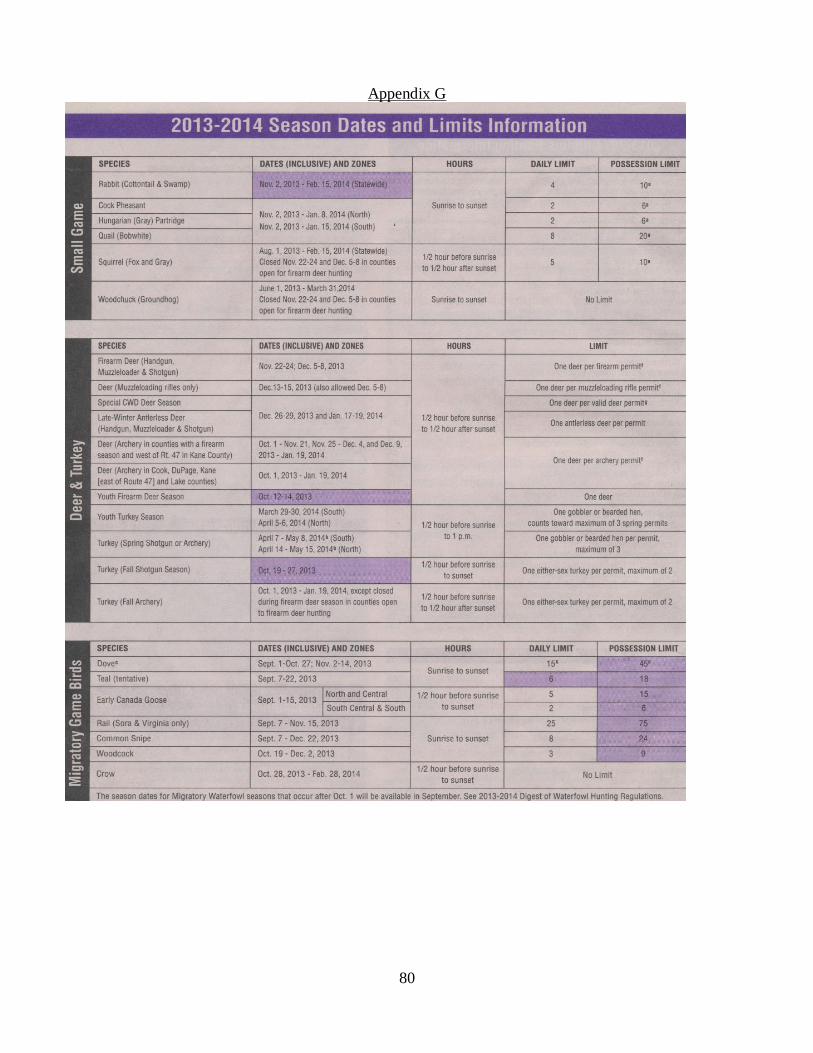
80
Appendix G

81
Appendix G continued