human resources management - philippine association...
TRANSCRIPT

PACU Academic Management
Seminar Series 2013 - 2014
Human Resources Management:
Laws and Issues in Preparation for ASEAN 2015 and K-12
1
Wage and Salary Administration
Module One: Fundamental
Concepts and Principles
2

HR Framework
Attract
Retain Motivate
Wage and Salary Management
Managing the different types of pay and reward systems that individual employees receive representing payment for services rendered:
Direct Financial
Indirect Financial
Non-Financial
Compensation Management Framework
PMAP CHRM - Workshop - Compensation Management Framework.xlsx
4
Direct Financial Compensation
Consists of the pay that a person receives in the form of:
Wages
Salaries
Allowances
Bonuses
Commissions
5

Indirect Financial Compensation
Consists of pay supplements that a person receives in the form of:
Statutory Benefits
Fringe Benefits
CBA Mandated Benefits
6
Non-Financial Compensation
Consists of the satisfaction or fulfillment that a person receives from the job itself, or from the psychological and/or physical environment in which the person works.
7

Principles of Compensation
Competitiveness
Solid market analyses
Identify benchmark jobs
Identify survey companies for data benchmarking
Match benchmark jobs
Analyze survey result
8
Principles of Compensation
Meritocracy
Based on effective delivery of performance:
Salary increases based on effective delivery of performance
Promotions based on merit
Other benefits and perks based on performance (Bonuses, Stock Options, etc)
9
Principles of Compensation
Internal Equity
Intelligent delivery of direct and indirect compensation programs:
Relative value of positions
Job grades and Broad Bands
Competencies
Job performance
Elimination of salary distortions
10

Principles of Compensation
Return on Investment
Value for money to drive business results:
Cost effective and responsive to employees’ needs
Higher level of productivity
Affordability
11
Wage and Salary Administration
Module Two: Designing the
Job Classification System
12

Job Classification System
Defines the relative worth of jobs in the organization.
Composed of “job grades/levels” which represent a grouping of jobs, which, although different as to the type of work done, are sufficiently equivalent in terms of level of skills demanded, level of difficulty, and amount of responsibility.
13

Job Classification System
Convenient groupings of rated jobs with each
group consisting of jobs approximately the
same relative worth for the purpose of
assigning pay rate (or rate range) to a group
of jobs rather than different rates to jobs
differing by some small increment.
Job grades, in effect, minimize the number of
applicable job rates, making the base
compensation structure relatively simple to
administer.
14

Job Classification System
The Job Classification System serves two primary purposes:
The first is to verify and document the value of internal equity as to the results of Job Evaluation by providing the hierarchy of jobs in the organization.
The second is to relate the classification system or hierarchy of jobs to labor market values, and through this linkage, establish salary structures.
15
Job Structures
Job Categories
Rank-and-File
Professional/Technical
Supervisory
Managerial/Executive
Example of Job Structure
PMAP CCM - Example - Job Structure and Mapping.xlsx
16
Job Categories
Rank-and-File
Those employees whose day-to-day duties and responsibilities are as follows:
Routine and transactional functions
Clerical in nature
Coordination works
Performs simple to moderate execution of work plans and programs, and technical specifications
17

Job Categories
Professional/Technical
Those employees who perform any of the following:
They have broad technical expertise and have depth of know-how and experience in the field of specialized sciences, engineering and technology.
18

Job Categories
Professional/Technical
Those employees who perform any of the following: (continuation)
By reason of their positions or nature of work, are required to assist or act in fiduciary (trust and confidence) manner to managerial employee and hence, are likewise privy to sensitive and highly confidential information.
19
Job Categories
Professional/Technical They are officers or members of a
managerial staff, and they perform the following functions: Performance of work directly related to
management policies of their employer. Customarily and regularly exercise
discretion and independent judgment. Regularly and directly assist a proprietor
or a managerial employee, whose primary duty consists of the management of the establishment in which he is employed or subdivision thereof.
20
Job Categories
Supervisory
Those employees who, in the interest of the employer, effectively recommends such managerial actions if the exercise of such authority is not merely routine or clerical in nature but requires the use of independent judgment and executes general supervision of work.
21
Job Categories
Managerial
If they meet any of the following:
Their primary duty consists of the management of the establishment in which they are employed or of a department or subdivision thereof.
They customarily and regularly direct the work of two or more employees therein.
22
Job Categories
Managerial
If they meet any of the following: (continuation)
They have the authority to hire or fire other employees of the lower rank, or their suggestions and recommendations as to the hiring and firing, and as to the promotion or any change of status of his employees are given particular weight.
23
Job Structures
Example: Job Rating Process
PMAP CHRM - Example - Job Rating Process.xlsx
Example: Development of Job Structure
PMAP CHRM - Example - Development of Job Structure.xlsx
Example: Types of Job Structures
PMAP CHRM - Example - Types of Job Structures.xlsx
24
Wage and Salary Administration
Module Three:
Collecting and Analyzing Salary Market Data
25

Salary Market Survey
Self and Jointly Conducted Survey – Conducted by an organization for its own purpose.
“Off-the-Shelf” Third Party Survey – Third party survey that are published and available off-the-shelf.
Example of “Off-the-Shelf” Total Rewards Survey
PMAP CHRM - Example - TRS General Industry.pdf
Customized Third Party Survey – Target approach in selecting survey comparators.
26
Benchmark Jobs
Used to assess the competitive pay position of an organization.
By applying internal JE methods to non-benchmark jobs and comparing them to benchmark jobs, the over-all competitive pay position of the organization is gauged.
Do not assume that labor market, job descriptions, or the mix of salary, variable pay, etc., remain the same from year to year.
27
Analyzing Salary Market Data
Average or Mean
Weighted Average
Salary Market Percentile
Low/Minimum
10th
25th
50th or Median
75th
90th
High/Maximum
28

Analyzing Salary Market Data
Average or Mean
The total sum of the data for a particular item divided by the number of individual observations.
Calculated by adding all occurrences of data, i.e., the salaries of benchmark jobs as reported by each survey participants, and dividing the result by the number of occurrences.
29
Analyzing Salary Market Data
Weighted Average
In a weighted average calculation, each occurrence of data, e.g., salary, is multiplied by a weighting factor, e.g., the number of incumbents in the position at each reporting company.
The results are added and then divided by the sum of that factor, e.g., the total number of incumbents reported.
30

Analyzing Salary Market Data
Weighted Average
In a weighted average calculation, each occurrence of data, e.g., salary, is multiplied by a weighting factor, e.g., the number of incumbents in the position at each reporting company.
The results are added and then divided by the sum of that factor, e.g., the total number of incumbents reported.
31
Analyzing Salary Market Data
Low
Represented by the lowest value used in a sample.
Together with the high value, extremes in the database reflect the absolute range in the sample.
32
Analyzing Salary Market Data
10th Percentile
Is the value in an array below which falls 10% of a sample.
Together with the 90th percentile, a range of data can be identified that eliminates extremes in the sample and reveals a more realistic dispersion of data.
33

Analyzing Salary Market Data
25th Percentile
The first quartile is the value in an array that falls at the first quarter or 25th percentile of a sample.
The figure below which 25% of the relevant data fall.
75% or three-fourths of the values in the sample are greater in magnitude than the first quartile value.
34
Analyzing Salary Market Data
50th Percentile (Median)
Is the value that is at the 50th percentile in an array of data with values that are rank ordered by magnitude.
The figure above and below which 50% of the relevant data fall.
35
Analyzing Salary Market Data
75th Percentile
Is the value in an array that falls at the third quarter or 75th percentile of a sample.
The figure below which 75% of the relevant data fall.
25% or one-fourth of the values in a sample are greater in magnitude than the third quartile value.
36
Analyzing Salary Market Data
90th Percentile
Is the value in an array below which falls 90% of a sample and above which falls 10% of the sample.
Together with the 90th percentile, a range of data can be identified that eliminates extremes in the sample and provides a more realistic dispersion of data.
37
Analyzing Salary Market Data
High
Represented by the highest value used in a sample.
Together with the low value, extremes in the database reflect the absolute range of data in the sample.
38

Analyzing Salary Market Data
Calculation of Percentiles
Percentiles can be identified by locating the desired position in an array of data points. The following formula is used:
J(N+1)/100
In this formula:
J – the rank of the desired percentile
N – the number of data points
39
Analyzing Salary Market Data
Example of Percentile Calculation
PMAP CHRM - Workshop - Calculation of Percentile - Compensation & Benefits Manager (Workshop Exercise).xlsx
40

Analyzing Salary Market Data
Compa-Ratio
Index of measurement to determine the competitiveness of a given salary with respect to its “Market Data Point” or MDP.
100% compa-ratio indicates that a given salary is competitive.
Formula: Present Salary/Desired MDP
Example of Compa-Ratio Calculation
PMAP CCM - Workshop - Calculation of Compa-Ratio (Workshop Exercise).xlsx
41
Analyzing Salary Market Data
Regression Analysis
Analyzes the relationship between two (linear regression) and more (multiple regression) variables.
Useful in making direct comparisons between job value, and salaries in the labor market.
Example of Regression Analysis Calculation
PMAP CHRM - Workshop - Regression Analysis Mercer Data (Workshop Reference).xlsx
42
Analyzing Salary Market Data
Maturity Curves
Relate base salary and/or total cash to seniority, or years in job.
Useful in evaluating the difference between novice and seasoned employees within a functional grouping of jobs with similar types of education and skill set requirements.
43
Wage and Salary Administration
Module Four:
Pay Philosophy
44
Pay Philosophy
Statement of belief, which will drive the total organization in pursuing its over-all compensation direction.
It’s role is to link the compensation investment to the achievement of business goals by providing a framework for decision making at every stage of the salary management process.
Example of Pay Philosophy
PMAP CHRM - Example - Pay Philosophy.docx
45

Organization’s Pay Position
In order to determine a realistic and achievable market position, it is important to identify how that position would translate into expenditures.
The first step is to determine the organization’s target market position and to define the labor market/s, from which it competes for its employees.
46
Organization’s Pay Position
The second step is to determine the target market position in order to define the “competitive level” of the total compensation strategy.
Once identified, the target pay position is compared to the organization’s current position to determine whether or not the goal is readily achievable.
47
Types of Salary Increases
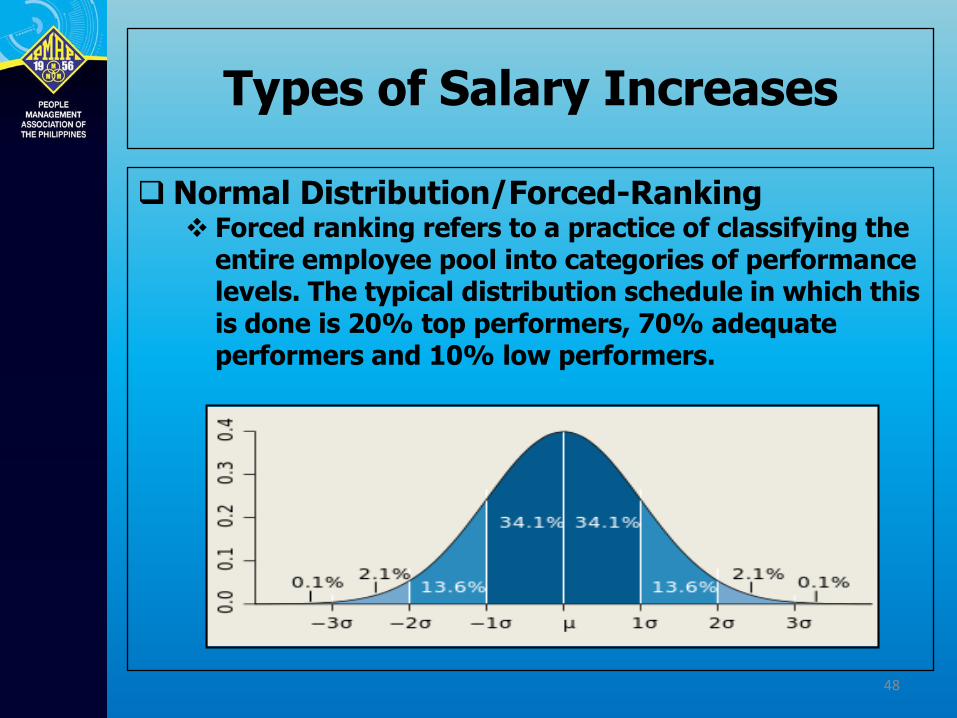
Normal Distribution/Forced-Ranking Forced ranking refers to a practice of classifying the
entire employee pool into categories of performance levels. The typical distribution schedule in which this is done is 20% top performers, 70% adequate performers and 10% low performers.
48

Types of Salary Increases
Forced-Ranking Policy
Performance Level
Performance Rating
Percent Distribution
5 Outstanding 10%
4 Above Average 20%
3 Standard Performance 65%
2 Below Standard 5%
1 Unsatisfactory
49

Wage and Salary Administration
Module Five: Designing the
Salary Grades and Structures
50
Definition of Salary Structure
Management tool designed to be:
Internally equitable
Externally competitive
Cost effective and affordable
To support organization’s compensation philosophy and business strategies
51
Number of Salary Structure
Generally, the smaller or more homogenous an organization, it’s more likely that a single structure will support the goals for both internal equity and competitive positioning in the labor market:
One salary structure for all positions
52
Number of Salary Structure
Large and/or diverse organizations are more likely to have multiple salary structures with pay targets that are tailored to different labor markets and pay trends for various job families or classifications:
Blue Collar and White Collar
Unionized and Non-Unionized
Exempt and Non-Exempt
53

Number of Salary Structure
One structure for each type of job classification:
Executive/Managerial
Supervisory
Professional/Technical
Sales
Clerical/Administrative
Geographically-based structures, to compete effectively for employees at specific operating sites.
54
Types of Salary Structures
Types of Salary Structures
Single Rate
Step Rate
Salary Range
Combined Step Rate and Salary Range
Quartile
Broadband
Examples of Salary Structures
PMAP CHRM - Workshop - Types of Salary Structures (Workshop Reference).xlsx
55
Types of Salary Structure
Single Rate
Consists of a single established rate for one job or group of jobs.
Easily understood and administered.
Inadequate in terms of recognizing differences in performance, knowledge, skill or effort.
More likely to be used with relatively simple and repetitive jobs.
56
Types of Salary Structure
Step Rate
Consists of series of established rates for a job or group of jobs.
Incumbents (typically from production, maintenance or service jobs), “step up” from one rate to the next when they attain a predetermined level of skill, knowledge, time in job or a combination of criteria or predetermined competencies tied to each step.
57

Types of Salary Structure
Step Rate (continuation)
Progress through the steps ceases, when a designated control point is reached, which is typically, the top step rate.
The highest step rate is often reserve for a limited number of incumbents to provide additional pay for reasons of performance, skill, knowledge, work leadership, special role, or seniority.
58
Types of Salary Structure
Salary Range
Consists of series of salary guidelines with minimum and maximum values that represent the lowest and highest salaries.
Range midpoint or other designated control point represents the target for each range.
59

Types of Salary Structure
Salary Range (continuation)
More complex to administer, than single or step rate salary structures.
Recognizes differences in experience, skill, knowledge and/or performance.
Offers more flexibility in terms of salary structure design.
60

Types of Salary Structure
Combined Step Rate and Salary Range
Structures that combine the elements of step rates and salary ranges.
Comprised of step rates on the lower side of the range, such as between minimum and midpoint or control point
Instead of additional steps, a salary range is used to administer pay beyond the control points.
61
Types of Salary Structure
Combined Step Rate and Salary Range
(continuation)
Instead of additional steps, a salary range is used to administer pay beyond the control points.
More advantageous when flexibility is needed to manage pay system than would normally be possible with a step rate system, particularly when performance differences need to be recognized.
62

Types of Salary Structure
Combined Step Rate and Salary Range (continuation)
Also used as a way to prioritize increases for incumbents whose salaries are at the lower end of the range.
Particularly when, in spite of acceptable performance and time in job, low increase budgets and other circumstances have hampered pay progress towards the control point.
63
Types of Salary Structure
Quartile Salary Structure
The salary structure is divided into four salary zones as follows:
First Quartile (0-25th Percentile of Range)
Second Quartile (26th -50th Percentile of Range)
Third Quartile (51th -75th Percentile of Range)
Fourth Quartile (76th -100th Percentile of Range)
64
Types of Salary Structures
Broad Bands
Have far fewer grades and far wider range spreads than would be found in traditional salary structures.
While a variable range spread structure may have range spreads as high as 80%, broad bands are consistently wider at all grade levels, and typically have range spread as wide as 250% or more.
65

Types of Salary Structures
Broad Bands (continuation)
Usually signals a significant change in both an organization culture and its approach to compensation:
Flattening or decrease in the number of hierarchical levels, particularly in the professional (exempt) and management ranks.
66

Validation of Salary Structures
Evaluate the feasibility of implementing the proposed salary structure from cost and affordability perspectives.
PMAP CHRM - Workshop - Validation of Salary Structure.xlsx
67

Wage and Salary Administration
Module Six:
Managing the Salary Review Process
68
Salary Management Process
A process for rewarding a combination of factors such as merit or performance, level of knowledge or competency, and over-all value to the organization.
A process for blending the difficult balance of internal equity and external competitiveness.
A process for managing salary controls and expenditures, including salary ranges, pay policy increases, budgets, pay relationships and differentials.
69
Salary Management Process
The influence of equity, management control, legal compliance, and fiscal responsibility are the most difficult challenges of recognizing outstanding performance and managing retention.
Therefore, this is one of the most powerful tools of an organization in order to retain its best talents, in managing salary expectations, and communicating the salary rewards process.
70
Types of Salary Increases
Structural/Salary Market Review Merit/Performance-Based
Promotional
Job Re-Evaluation to a New Job Grade
Skill/Knowledge-Based
Equity
General and Cost of Living Increase
Statutory
71

Types of Salary Increases
Structural/Salary Market Review
As a result of implementing a salary market review, new salary structure or updating the current salary structure.
Salaries are reviewed and evaluated:
Pay Philosophy
Market Data Point
Performance Differentiation (Forced-Ranking)
72
Types of Salary Increases
Structural/Salary Market Review
Green and red circle salaries are often subjected to special policies.
Generally, green circle salaries are accelerated to the minimum of the new salary structure.
Alternatively, red circle salaries may be frozen until the range maximum catches up or, an indication that the employee should move to the next higher job grade, or simply over staying in a particular level.
73
Types of Salary Increases
Merit/Performance-Based
Earned by employees on the basis of individual performance over an established period of time, usually one year.
Associated with salary range structures that offer the flexibility to manage pay and grant increases that consider a combination of factors, including individual performance results, current position of salary in the range, and internal equity.
74
Types of Salary Increases
Merit/Performance-Based
Increases are based on performance levels, and it is advisable to manage the proportion of employees who receive ratings above standard.
Thus, budgetary guidelines may be exceeded and the meaning and value of performance-based increases could be negated.
75

Types of Salary Increases
Merit/Performance-Based
By combining the influences of performance, position in range and budgetary constraints, guidelines may be established to determine the size of merit pay increases to ensure that they are appropriate based on performance and position in range.
76
Types of Salary Increases
Merit/Performance-Based
One of the most commonly used practice is to divide the salary range into levels, usually quartiles, and to define corresponding performance in conjunction with objective performance appraisal procedures.
77
Types of Salary Increases
Promotional Increase
Movement to a higher job grade accompanied by relatively more difficult duties and responsibilities. Generally, this is accompanied by salary increase.
Some organizations calculate a promotional increase based on the number of job grades between the new and old positions up to a maximum promotional increase.
78

Types of Salary Increases
Promotional Increase
Others do their calculation based on the position of pre-promotion pay in the new range.
Should be sensitive to the relationship of the newly promoted employee’s pay to that of others in the same job grade.
79
Types of Salary Increases
Job Re-Evaluation to a New Job Grade
Due to re-organization, multi-tasking, job design, job enrichment, rightsizing etc., some positions are likely to be upgraded.
Changes are more likely to occur in terms of salary opportunity and actual changes in pay.
Pay policy must clearly distinguish “Job Re-Evaluation” vis-à-vis “Promotion”.
80

Types of Salary Increases
Skill/Knowledge-Based
Reward employees for acquiring new or enhanced job-related skills or competencies.
Associated with step rate structures, whereby the pay of each eligible employee advances to the next higher step based on the acquisition of new competencies.
81
Types of Salary Increases
Equity Increase
To correct pay relationships between employees in the same job grade.
To correct salary distortions.
Statutory Increase
By virtue of statutory mandate, the “Minimum Wage Rate” is increased.
82

Types of Salary Increases
General and Cost of Living Increase
Salary adjustment at an equal percent or amount due to increase in cost of living.
Designed to achieve the balance between purchasing cost of money and changes in the economic market.
Normally driven by Inflation Rate and Consumer Price Index.
Not based on performance.
83

84