human resource management’s effects on firm-level relative efficiency
DESCRIPTION
Using stochastic frontier production functions methodology with data from 1579 private-sector establishments, we demonstrate that HR practices are significantly associated with differences in relative firm-level efficiency. Supplemental analysis implies that this efficiency analysis is substantively different than the common approach to evaluating HRM’s relationships with firm-level labor productivity. The results suggest that HR practices’ contributions to relative firm-level efficiency are an important but heretofore overlooked factor in the relationship between HRM and firm performance.TRANSCRIPT

Human Resource Management’s Effects onFirm-Level Relative Efficiency
CLINT CHADWICK, JI-YOUNG AHN, and KIWOOK KWON*
*Hall,Ewhaewhajin-guinsigh
IND
Pub
Using stochastic frontier production functions methodology with data from 1579private-sector establishments, we demonstrate that HR practices are significantlyassociated with differences in relative firm-level efficiency. Supplemental analysisimplies that this efficiency analysis is substantively different than the commonapproach to evaluating HRM’s relationships with firm-level labor productivity.The results suggest that HR practices’ contributions to relative firm-levelefficiency are an important but heretofore overlooked factor in the relationshipbetween HRM and firm performance.
Introduction
A FAVORITE DEPENDENT VARIABLE IN THE LITERATURE ON HUMAN RESOURCEMANAGEment(HRM) and firm performance is firm-level labor productivity. There is anestablished argument that this outcome is more proximate to HRM practicesthan other common measures of firm-level performance such as market share orstock price (e.g., Arthur 1994; Colakoglu, Lepak, and Hong 2006; Dyer 1984;Dyer and Reeves 1995; Rogers and Wright 1998). However, there aredrawbacks to the ways in which firm-level labor productivity hasbeen operationalized in most of the current literature. One common shortcomingis that many papers in this stream of research employ firm-level labor productiv-ity measures that do not account for firms’ labor costs, and conceptually, laborcosts should anchor any estimates of productivity. Simply accounting for laborcosts, though, does not necessarily create an accurate picture of firm-levellabor productivity in a broad sample of firms. This is because the usualapproach employed by HRM researchers evaluates firm-level labor productivitywith respect to a specific configuration of HRM variables—a particular HRM
The authors’ affiliations are, respectively, School of Business, University of Kansas, 326 Summerfield1300 Sunnyside Ave., Lawrence, KS 66045-7601, E-mail: [email protected]; School of Business,Womans University, 11-1 Daehyun-dong Seodaemun-gu, Seoul, Korea 120-751, E-mail: jy-ahn@
.ac.kr; and School of Business, Konkuk University, 402 Kyungyoung Kwan, Hwayang-dong 1, Gwang, Seoul, Korea 143-701. E-mail: [email protected]. We are indebted to Gopesh Anand fortful suggestions on our analysis.
USTRIAL RELATIONS, Vol. 51, No. 3 (July 2012). � 2012 Regents of the University of Californialished by Wiley Periodicals, Inc., 350 Main Street, Malden, MA 02148, USA, and 9600 Garsington
Road, Oxford, OX4 2DQ, UK.
704

HRM’s Effects on Firm-Level Relative Efficiency / 705
production function, in essence. Explanations of firm-level labor productivitybased on such analyses can be substantially incomplete when that HRM produc-tion function is not uniformly relevant across a diverse sample of firms.However, the methodology that we employ in this paper can identify the
effects of HR practices on firm performance while accommodating HRMconfigurations that are idiosyncratic across firms. This allows us to investigateHR practices’ effects on firm performance without reference to a specificHRM production function. We also have general cost data for firms’ labor andcapital production inputs. As we demonstrate, these advantages generate analternate view of the relationships between HRM and firm performance thatcomplements what can be learned from the usual approach to this question inthe extant literature.
Problems with the Usual Approach to HRM and Firm-LevelProductivity
The Problem of Omitted Labor Costs. As we suggested above, the typicalapproach to evaluating HRM’s effects on firm-level labor productivity exhibitstwo major drawbacks. Let us first consider the issue of labor costs. Researcherson HRM and firm performance have often employed sales per employee as ameasure of firm-level labor productivity (e.g., Datta, Guthrie, and Wright2005; Guthrie 2001; Huselid 1995; Koch and McGrath 1996; Sun, Aryee, andLaw 2007). This measure has its strengths. First, total sales is an outcome thatis more proximate to HRM practices than are accounting measures of firm per-formance. Moreover, total sales is a relatively straightforward measure of firmoutput compared with accounting performance measures, which can varyacross firms depending on their treatment of various accounting issues. Thismay be particularly true in diverse samples where firms have notably differentapproaches to creating value. Furthermore, dividing sales revenue by a firm’snumber of employees scales output to firm size, which is an important consid-eration because firm size and sales revenue are positively correlated. Thus,sales per employee is a broad measure of how successful firms are at generat-ing revenue. When sales per employee is estimated conditional on such factorsas industry, capital intensity, ownership structure, unionization, and the like, itbecomes comparable across a population of firms.But sales per employee is only labor productivity in the broadest sense of the
term, that is, in that the size of a firm’s workforce is the denominator in ameasure of firm output. The same logic applies equally well to alternative mea-sures such as market share per employee, patents per employee, and the like.As labor productivity, however, such measures are incomplete. Productivity has

706 / CHADWICK, AHN, AND KWON
traditionally been defined as the ratio of a firm’s labor inputs to its outputs, or,in other words, the efficiency with which a firm converts resources into salablegoods and services. Concern for both outputs and inputs is crucial. Firms withthe same level of sales per employee, for instance, may have very differentlabor productivities if they differ in the costs of the labor inputs required toproduce those sales.Accordingly, a number of observers have called for studies on the relation-
ship between HRM and firm-level labor productivity to include labor costs aswell as estimates of the benefits firms derive from their sets of HR practices(e.g., Barney and Wright 1998; Cappelli and Neumark 2001; Macky andBoxall 2007). These costs can significantly modify the inferences thatresearchers draw from their analyses, which have generally described positiverelationships between HRM and firm-level labor productivity (e.g., Combset al. 2006). For example, Cappelli and Neumark (2001) found that increasesin firm performance associated with high commitment HR practices werecounterbalanced by corresponding increases in employee compensation. Conse-quently, the HR practices studied by Cappelli and Neumark led to higher out-put per worker but not necessarily to greater firm-level productivity becausereturns to the firm were not meaningfully higher. Similarly, Way (2002) couldnot find a significant relationship between his HRM system measure and firm-level labor productivity when labor productivity was assessed as total salesdivided by total labor costs. Additionally, Kim (2005) demonstrated that trans-action and implementation costs substantially reduced the positive estimatedimpact of a gainsharing program. In short, evidence suggests that HRM’seffects on firms’ revenues can be different than HRM’s effects on firms’ netrevenues, making the latter type of productivity estimations preferable.
The Problem of Ties to Specific HRM Production Functions. Yet, account-ing for costs may not be sufficient by itself to generate a complete picture ofHRM and firm-level labor productivity. Consider a typical HRM ⁄firm-levellabor productivity model utilizing a set of HR practices in a regression. Theparticular HR practices that a researcher chooses to employ and the ways thatshe relates those practices to each other in the analysis are her theoretic speci-fication of an ‘‘HRM production function’’ regarding the dependent variable(cf. Zyphur 2009). Inferences about firm-level labor productivity from thatregression are therefore bound to that HRM production function and dependentvariable. Consequently, this approach is better at evaluating a particular configu-ration of HR practices vis-a-vis a specific firm-level outcome than at capturingHRM’s overall effects on that firm-level outcome.If a researcher constructs an additive index containing HR practice variables
measuring training, selection, performance appraisal, and incentive compensation,

HRM’s Effects on Firm-Level Relative Efficiency / 707
for example, the analysis will evaluate the strength of that particular HR index’srelationship with the dependent variable for firms in the sample. Firm-level laborproductivity that is not attributable to this HR index (for example, because somesample firms effectively utilize HR practices that are not part of the index) or thatis not related to the control variables becomes part of the regression’s residualvariance. Moreover, if an additive approach to configuring these HR practicesdoes not suitably reflect the HR practices’ interrelationships with respect to thedependent variable, the regression can misrepresent the studied HR practices’collective effects (Chadwick 2010). In other words, the insight gained from thisanalysis depends on the salience of the specified HR production function in thesample.Consequently, this approach can also yield significantly incomplete explana-
tions of firm-level labor productivity in data containing firms with widelydiffering approaches to competition because a single HRM production functionmay not be uniformly relevant across the sample. One solution to this problemis to define samples narrowly enough so that it is possible for a single strategyand its matching HRM production function to be optimal for all sample firms.MacDuffie (1995), for example, found that a single theoretically defined HRMsystem was well matched to lean production in automobile assembly. How-ever, even where this is possible, defining a sample so narrowly can signifi-cantly limit generalizability and statistical power.Fortunately, the data that we utilize in this paper can speak to the labor cost
issue, while the methodology that we employ addresses the HRM productionfunction concern, allowing us to more accurately estimate HRM’s overalleffects on firm-level labor productivity irrespective of a specific HRM produc-tion function. As this paper demonstrates, this approach provides an insightfulcomplement to the usual approach to estimating firm-level labor productivity.To hypothesize about HR practices’ influence on firm-level labor productivityin the next section of the paper, we begin with the general concept ofefficiency.
HRM and Efficiency in Theory
We start with efficiency because labor productivity is a form of efficiency.Efficiency concerns a firm’s ability to combine production inputs to create theproducts that it sells to customers. Conceptually, firm-level efficiency is higherif a set of HR practices increases firm performance more than the practices’effects on labor costs (i.e., compensation, benefits, etc.). If a set of HR prac-tices brings in returns (through increases in workers’ effectiveness) below theireffects on labor costs, it is not efficient. On the other hand, returns to the firm

708 / CHADWICK, AHN, AND KWON
above a set of HR practices’ effects on labor costs increase firm efficiency andat some point may also signal competitive advantage accruing to the firmthrough that set of HR practices. Thus, changes in compensation practices suchas gainsharing and pay for skill that are scaled to increases in workers’ contri-butions to the firm are unlikely to change firm-level efficiency either positivelyor negatively because the ratios of firms’ costs to benefits for these practicesremain constant across different degrees of worker effectiveness.In contrast, if the biggest effect of an HR practice on labor productivity
occurs when the practice is adopted (i.e., non-adopters pay a steep price inlower productivity), then a variable measuring that practice could generate asignificant relationship with relative firm-level efficiency even if fairly largeproportions of firms in a sample employ the practice. It is possible, for example,that some fairly straightforward HR practices that are important to firm func-tioning may not be adopted by some firms for institutional reasons (e.g., firmcultures, path dependence). Because these practices are relatively easy tounderstand and imitate, they do not contribute to competitive advantage, butrather serve as baseline terms of competition (or what Boxall and Purcell[2000] call ‘‘table stakes’’), which all comparable firms should implement toachieve competitive parity. With such HR practices, pursuing firm-levelefficiency is mostly about avoiding competitive disadvantage by not omittingimportant baseline practices.In either event, this paper’s methodology is well fitted to these notions of
efficiency, although it is largely new to the HRM and firm performance litera-ture. The reference that anchors our estimation of firm-level labor productivityis sample firms’ efficiency relative to each other, an approach that allows ouranalysis to remain agnostic about the specific configurations of HR practices(or HRM production function) that firms employ. Firm-level relative efficiencyencompasses labor productivity when it is estimated conditional on a firm’slabor input costs. We operationalize HRM’s effects on firm-level labor produc-tivity as the variance in overall firm-level relative efficiency, conditional onlabor costs, that is attributable to firms’ sets of HR practices (we explain thismethodology in detail below).Along with other classes of firm resources such as technology, reputational
capital, organizational capital, financial capital, and physical resources, humancapital is essential to firm functioning (Chadwick and Dabu 2009). Relativefirm-level efficiency is a summary of the quality of firm functioning. There-fore, it is likely that heterogeneity in firms’ pools of human capital helps todetermine differences in firm-level relative efficiency. Indeed, Lopez-Cabrales,Valle, and Herrero (2006) recently linked heterogeneity in core employees’human capital with differences in relative firm-level relative efficiency in asample of Spanish firms. Lopez-Cabrales et al.’s study did not test, however,

HRM’s Effects on Firm-Level Relative Efficiency / 709
the relationship between HR practices and firm-level relative efficiency. Never-theless, extensive empirical and theoretic arguments in the HRM literatureestablish that HR practices help to determine the type, quality, motivation, anddeployment of human resources within a firm, which are key dimensions offirm-level human capital heterogeneity (e.g., Chadwick and Dabu 2009; Deleryand Shaw 2001; Huselid 1995). Thus, we expect that (in addition to othertypes of firm-level performance) HR practices influence relative firm-levelefficiency, a hypothesis that is heretofore untested in the extant literature.
Production Frontiers Analysis
Our analysis utilizes a methodology that is largely unexploited in HRMresearch, production frontiers analysis. Production frontiers analysis wasdeveloped to address circumstances when researchers wish to determinecomparative efficiency in a sample of organizations (firms, in this case) whereproduction inputs and outputs may be combined in many different ways(Coelli, Prasada Rao, and Battese 1998). Various manufacturing assemblylines, for example, may employ a number of different production approaches,such as traditional mass manufacturing, lean manufacturing, or mass custom-ization, and may vary in the emphasis placed on disparate outcomes such asscrap rates, product quality, and productivity.Essentially, production frontiers analysis derives an ‘‘efficiency frontier’’ for
a sample of cases, akin to a standard macroeconomic production possibilitiesfrontier (Lieberman and Dhawan 2005). The most efficient firms map out thefar edge of the frontier, varying in their placement along the frontier accordingto the different ways that they combine inputs and outputs in their productionfunctions. Less efficient firms have lower relative efficiency scores rangingfrom a maximum possible efficiency score of one down to zero. Figure 1illustrates the concept of a production frontier for a sample of firms. Firm Alies on the efficient frontier, whereas Firm B falls below the frontier. Bothfirms consume the same quantities of inputs. Firm B, however, has lower out-put and thus lower relative efficiency. The relative efficiency of Firm B is theratio of B’s inputs and outputs compared with that of efficient firms that definethe frontier in the sample, such as Firm A. Firm B’s efficiency score thereforefalls between zero and one. In other words, as Lieberman and Dhawan (2005:1061) put it, ‘‘efficiency [as determined by a production frontiers analysis] canbe thought of as the firm’s scaling factor relative to the frontier in the range:0<TE<1.’’ While production frontiers analysis technically generates efficiencyestimates that are relative to the production frontier, because a production fron-tier analysis is sample specific and is mapped out by the sample’s most effi-

A
B
X0Input
Y
X
Output
Ya
Yb
FIGURE 1
DEPICTION OF A PRODUCTION FRONTIER
710 / CHADWICK, AHN, AND KWON
cient firms, the efficiency scores for each firm in the sample are de facto esti-mates of firm efficiency relative to all of the other firms in the sample.Accordingly, production frontiers analysis allows us to focus on relative
firm-level efficiency without reference to a specific HRM production function.In fact, production frontiers analysis allows for equifinality in firm efficiencywith respect to HRM, because there are potentially many different configura-tions of HR practices that would set an establishment on the efficiencyfrontier.1 In other words, production frontiers are an analytic approach that canaccommodate idiosyncratic HRM production functions across firms and aretherefore free of the normative bias favoring commitment-based (or ‘‘highperformance’’) HRM systems that characterizes much of the extant literature.Additionally, while OLS assumes that all firms are operating at their highest
efficiency, production frontiers analysis is based on the assumption that manyfirms are operating below the efficiency frontier (Dutta, Narasimhan, andRajiv 2005). Production frontiers thus allows us to capture variance in firms’
1 For comparability, the production frontiers analysis in this paper considers firm-level efficiency withrespect to the same set of HR practices for all firms in our sample. Production frontiers analysis allows sam-ple firms, however, to vary in the emphasis placed on each HR practice—including no use of a particularHR practice at all—and to vary in the ways that the HR practices’ interrelationships are configured.

HRM’s Effects on Firm-Level Relative Efficiency / 711
abilities to effectively implement their sets of HR practices in addition to simplyacknowledging the existence of particular HR practices in sample firms.
The Advantages of Stochastic Frontier Production Function Analysis2
Researchers may choose from a number of different production frontiermethodologies depending on their specific questions and on the data at hand.Perhaps the best known of these techniques is data envelopment analysis(DEA). Data envelopment analysis allows for multiple output variables, whichis a strength, but DEA does not give statistical estimates of the effects ofindividual variables on relative efficiency across the sample because it is anonparametric analysis. In the past, DEA researchers have often workedaround this problem using a two-stage analytic strategy where firms’ efficiencyscores are first estimated based on a set of basic firm characteristics and thenregressed onto a set of explanatory variables (Coelli, Prasada Rao, and Battese1998). However, this approach is conceptually inconsistent because it com-bines nonparametric DEA estimates of relative efficiency with parametricregression analysis (Lieberman and Dhawan 2005).Fortunately, a different parametric form of production frontiers analysis is
now available, SFPF. The advantage of SFPF for our purposes is that it simul-taneously derives estimates of firm-level relative efficiency for a sample andgenerates estimates of independent variables’ (HR practices’) effects on firm-level relative efficiency for the sample generally. In other words, SFPFperforms the two-stage analysis that researchers have previously employedwith DEA simultaneously within the same parametric model, which is moreefficient and theoretically consistent. In contrast to DEA, the SFPF proceduredoes not allow us to incorporate multiple output variables in the same model,but as our interest in this paper focuses on annual firm sales conditional on aset of controls, this is not a drawback.In brief, SFPF analysis estimates relative firm efficiency by introducing a
two-part error term to a regression model (Greene 2001). The first error termvi represents the purely stochastic error component affecting the dependent var-iable, akin to an OLS random error, and it is associated with that portion ofthe SFPF model that estimates the cross-firm effects of various independentvariables on the dependent variable, as in OLS. Conceptually, this error termaccounts for random events both external and internal to the firm, as the inde-
2 We refer the reader to Battese and Coelli (1995); Coelli, Prasada Rao, and Battese (1998); Greene(2001); Dutta, Narasimhan, and Rajiv (2005); and Lieberman and Dhawan (2005) for detailed explanationsof stochastic frontier production functions (SFPF) methodology.

712 / CHADWICK, AHN, AND KWON
pendent variables in this part of the model are production function inputs andfirm characteristics that affect the output of firms across the sample generally.The second error term ui in an SFPF model captures relative firm-level effi-
ciency (described in production frontiers analysis as ‘‘technical efficiency’’)with respect to a set of independent variables (Battese and Coelli 1995).Analytically, efficiency in production frontiers is the ratio of the expectedvalue of the predicted frontier output, conditional on the firm’s technical ineffi-ciency (ui) and a set of firm characteristics, to the expected value of thepredicted frontier output conditional on the value of ui being 0. This efficiencyestimation is determined via maximum likelihood. Conceptually, the efficiencyestimated here is a firm’s relative ability to transform production inputs into anoutcome of interest (e.g., annual sales) conditional on a set of firm characteris-tics specified in the technical efficiency portion of the model. In other words,the variables in this part of the analysis are used to estimate each samplefirm’s standing relative to the frontier.The SFPF model in this study can thus be written as
yi ¼ f ðxi; bÞTEi expðviÞ ð1Þwhere yi denotes the total annual sales of firm i; xi is a vector of the firm’sinputs such as capital inputs, labor inputs, size, etc.; and b is the vector of esti-mated cross-firm effects of a firm’s inputs on its output (i.e., log total sales).Output yi is determined by the f(xi; b) (which is the production frontier), byTEi (the technical efficiency of firm i), and by the random error term exp(vi).Thus, firms where TEi = 1 are at the ‘‘ideal frontier,’’ meaning that observedoutput has reached its maximum obtainable value, given the specification ofthe model, and have output akin to that which would be estimated under OLS.In contrast, TEi < 1 is a measure of sample firms’ shortfalls in efficiencyrelative to the frontier.In our analysis, we treat HR practices as characteristics that influence firms’
relative efficiency by placing them in the technical efficiency portion of theSFPF model; that is, by treating HR practices as the firm characteristics gener-ating differences in estimated relative efficiency.3 We parameterized TEi as thesecond error term, ui,, which is a function of Zi, a vector of firm-specific HRpractices such as pay policy, quality meetings, job rotation, training, and selec-tion ⁄ recruiting breadth in the following form:
3 As part of the analysis that we report below, we employed other specifications of the SFPF model thatplaced some of the control variables in the technical efficiency portion of the model along with the HR prac-tice variables. Our results are largely consistent across these alternative specifications, which suggests thatcentering our technical efficiency analysis on the HR practice variables does not bias our inferences abouttheir influence on relative firm-level efficiency.

HRM’s Effects on Firm-Level Relative Efficiency / 713
ui ¼ ZicþWi ð2Þ
Because TEi is required to be £1, we can also write this expression as anexponential where ui ‡ 0.
TEi ¼ expð�uiÞ ð3Þ
TEi ¼ expð�Zic�WiÞ ð4Þwhere c is a vector of unknown parameters to be estimated in the technicalefficiency portion of the SFPF model and Wis are unobservable randomvariables.Lopez-Cabrales, Valle, and Herrero (2006) recently employed DEA to eval-
uate the effects of core employees’ attributes on relative firm-level efficiency,the first time that production frontiers methodology has been applied toresearch on HRM and firm performance. While this study is a good initialstep, it also leaves open opportunities for improvement. First, Lopez-Cabraleset al.’s sample is considerably smaller (eighty firms) than the sample that weemploy in this paper (n = 1579), limiting generalizability. Second, the Lopez-Cab-rales, Valle, and Herrero (2006) study utilizes the theoretically inconsistentDEA two-stage nonparametric ⁄parametric approach to estimating efficiencyand evaluating its determinants that we described above. The authors first useDEA to estimate relative efficiency for their set of firms and then regress theseefficiency estimates onto a set of variables to infer which firm characteristicsdrive them. Third (and most importantly), the authors do not directly link HRpractices to relative firm-level efficiency.
Data
The data were gathered from a national probability sample of private sectorU.S. for-profit establishments (e.g., manufacturing plants or retail stores) withover twenty employees in 1993, a sampling frame representing approximately85 percent of all establishments in the United States. Corporate headquarterswere omitted from the samples. The survey was conducted via telephone inter-views by employees of the U.S. Bureau of the Census with at least one CensusBureau contact person at each establishment, each of whom was asked toreport on establishment conditions during 1993. In the manufacturing sector,the primary respondents were plant managers. With some restrictions, thesedata, the National Employers’ Survey, are publicly available from the CensusBureau to interested scholars (Cappelli and Neumark 2001).

714 / CHADWICK, AHN, AND KWON
The fact that a single survey was used to gather each panel can createconcerns about measurement error and about spurious correlations between thevariables in the analysis (Gerhart et al. 2000). These potential problems aremitigated by the fact that the ongoing informal reporting relationship thatexisted between the survey respondents and the Census Bureau gave respon-dents a stronger incentive to provide accurate information than occurs in a sin-gle-iteration survey from researchers whom the respondent does not know.Additionally, the surveys were conducted at the establishment level where, asGerhart et al. observed, ‘‘smaller numbers of employees and presumablygreater homogeneity of HR practices might be expected to yield higherreliabilities’’ (2000: 829). Moreover, the dependent variable is anchored infactual reports that are readily available to respondents, and the survey wasdesigned so that other respondents could provide those data if the mainrespondent was unsure about them.One advantage of using data on the establishment level is that it avoids the
questionable assumption that HRM practices are the same across a large andvaried firm. Additionally, concerns about the HRM system being widely differ-ent across a firm’s lines of business are greatly reduced in these data becauseestablishments usually conduct their business in single industries. Indeed, 94.5percent of the sample’s establishments reported that they derived most of theirrevenues from products within a single industry grouping.Moreover, because the survey utilized the existing reporting relationships
with the Census Bureau, the response rate was 72 percent, which is substan-tially higher than similar establishment surveys and reduces sample biasconcerns. On the basis of its primary line of business, each establishment inthe sample was assigned by the Census to one of the twenty-one differentindustries, organized largely by two-digit SIC code. Probit analysis conductedby Lynch and Black (1995) on the characteristics of non-respondents indicatedthat there was no significant pattern at the SIC two-digit industry level in thelikelihood of participating in the survey.These advantages, along with the exceptionally large size of the data set for
this type of research and the availability of input cost data, make these datawell suited to analyzing relative firm-level efficiency with respect to HRM.
Missing Data
Because the analysis employs information from eighty-seven different originalsurvey variables, loss of statistical power from missing data is a potentiallyserious concern. Although only 7.7 percent the data are missing in the originalsample, because these missing data tend to be scattered broadly across cases

HRM’s Effects on Firm-Level Relative Efficiency / 715
and variables, simple casewise deletion of missing data in an analysis utilizingall dependent, HRM, and control variables reduces the usable sample from theoriginal 3167 cases to 732 cases, considerably attenuating statistical power.We are able to mitigate the problem of missing data, however, by utilizingexpectation-maximization (EM) imputation of missing values, which employsmaximum likelihood to converge iteratively on estimates of the missing values.Analyses using EM estimates of missing data have been demonstrated to bemore consistent and efficient than those using regression imputation, meansubstitution, casewise deletion, or pairwise deletion because EM employs less-restrictive assumptions. This is especially true as the proportion of missingdata and the size of a data set increase (Arbuckle 1994). For ordinal variables,we rounded the EM-imputed values to the nearest integer (Schafer 1997). Wedo not use imputed values for the dependent variable or for the costs ofproduction inputs variables, resulting in a working sample of 1579 cases.
Variables
The means, standard deviations, and detailed definitions for the dependent,HRM, input costs, and control variables that we use in the analysis are pre-sented in Table 1. We discuss each type of variable in turn in this section.
Dependent Variable. The dependent variable is the natural logarithm of anestablishment’s total sales for 1993. In estimating relative firm-level efficiencywith respect to log of total sales, we account for the costs of labor and capitalinputs to establishments’ production functions (because such input costs canvary substantially across establishments) as well as for establishment size andother key characteristics. Our use of total annual sales as the dependent vari-able along with the two costs of production inputs is consistent with produc-tion frontiers’ input–output approach to estimating efficiency that we describedabove, while the workforce size variables account for the positive correlationbetween firm size and total sales. (These input cost variables are described indetail below.) Further, the total annual sales variable is preferable to account-ing measures of firm output because it has greater reporting consistency acrossestablishments and also because accounting performance measures are usuallyunavailable for establishments that are privately held or are part of multi-establishment firms.
HR Practice Variables. We employ ten HR practice variables in ouranalysis: pay policy, incentive pay, benefits breadth, pay for skill, qualityimprovement meetings, job rotation, flextime, job sharing, selection ⁄ recruiting

TABLE 1
KEY VARIABLE DESCRIPTIONS AND DESCRIPTIVE STATISTICSa
Mean SD Variables
Dependent Variable10.11 1.96 Log of sales: natural log of total establishment sales, receipts, or shipments for 1993.
HR Practice Variables0.34 0.38 Pay policy: a weighted average of dummy variables across five broad job classes, each
indicating whether the firm pays wages that lead the labor market. Cronbach’s a = 0.82.0.54 0.45 Incentive pay: a weighted average of dummy variables across five broad job classes, each
indicating whether some form of profit sharing, bonuses, or gain sharing is given toemployees. Cronbach’s a = 0.93
7.59 2.14 Benefits breadth scale: count of the number of different benefits (e.g., dental coverage,pensions, etc., up to eleven benefits) offered by the establishment. Cronbach’s a = 0.72.
18.99 31.60 Pay for skill: percentage of establishment employees who receive pay for skill or pay forknowledge.
46.81 41.14 Quality meetings: percentage of non-managerial and non-supervisory workers currentlyinvolved in quality improvement meetings.
1.32 1.60 bLog of job rotation: natural log of the percentage of non-managerial and non-supervisoryworkers currently involved in job rotation.
0.32 0.46 Flextime: dummy variable indicating that the establishment offers flextime.0.25 0.43 Job sharing: dummy variable indicating that the establishment allows job sharing between
employees.3.19 0.59 Selection ⁄ recruiting breadth: count of the number of different selection criteria used (0–
11), weighted by a Likert response about the importance attached to each criterion (1–5pts.). Cronbach’s a = 0.84.
9.59 3.24 Training breadth: count of the number of different kinds of training (0-11) offered.Cronbach’s a = 0.81Inputs Costs Variables
12.64 2.52 Log of labor inputs: natural log of the value of labor production inputs for 1993.13.08 2.89 Log of capital inputs: natural log of the value of capital production inputs for 1993.
Establishment Characteristics Variables0.18 0.38 Size 1-49: Dummy variable indicating that the establishment has 1–49 workers.0.18 0.38 Size 50-99: Dummy variable indicating that the establishment has 50–99 workers.0.19 0.40 Size 100-249: Dummy variable indicating that the establishment has 100–249 workers.
(Omitted category is establishments with 250+ workers.)0.32 0.46 Unionization: dummy indicating that at least some establishment workers are represented
by a labor union.0.35 0.48 Single establishment: dummy indicating that the establishment is part of a single
establishment firm.8.56 2.25 Log of capital stock: natural log of the total book value of establishment’s plant,
equipment, and other capital stock for 1993.0.75 0.43 Founded before 1983: dummy indicating that the establishment was founded before 1983.1.14 0.46 bLog of management levels: natural log of the number of management levels between
first-line supervisor and the establishment’s top official.2.17 0.78 bLog of percent managers: natural log of the percentage of establishment employees who
are managers.1.07 1.31 bLog of percent part-time workers: natural lag of the percentage of establishment
employees who are part-time workers.0.48 0.94 bLog of percent temporary ⁄ contract workers: natural lag of the percentage of
establishment employees who are temporary or contract workers.
716 / CHADWICK, AHN, AND KWON

TABLE 1 (Cont.)
Mean SD Variables
2.24 1.11 bLog of realized turnover: natural log of the percentage of establishment workers whohave been with the firm for <1 year.
13.11 35.66 Percent employment increase: percentage increase in the establishment’s number ofemployees over the past 3 years.
NOTES:an = 1579.
bNatural logs for these variables taken after adding a constant of one (see text).
HRM’s Effects on Firm-Level Relative Efficiency / 717
breadth, and training breadth. As a group, these ten HRM variables reflect thekinds of practices that have been utilized in the previous research on HRMand firm performance, which has emphasized areas such as compensation (paypolicy, incentive pay, benefits, pay for skill), participatory management (qual-ity improvement meetings), flexible work organization (job rotation), employ-ment flexibility (flextime, job sharing), selection (selection ⁄ recruiting breadth),and training (training breadth). Detailed descriptions of these HR practice vari-ables appear in Table 1. Job rotation is expressed as a natural logarithm toreduce non-normality in its distribution (before taking this logarithm, we addeda constant of one to avoid losing cases that have zero values for job rotation).Some control variables were also logged in this way, as indentified in Table 1.The selection ⁄ recruiting breadth and training breadth HR practice variablescapture establishments’ degree of practice implementation in terms of the num-ber of different ways that firms carry out selection ⁄ recruiting and training,respectively. The selection ⁄ recruiting breadth variable also weights each typeof selection ⁄ recruiting by the importance ascribed to it by establishments inmaking their selection ⁄ recruiting choices and is the mean across all selec-tion ⁄ recruiting practices. The HR practice variables vary in their correlationswith log of sales and in their generally low inter-correlations (available uponrequest) supporting our choice to utilize the HR practices as a set of separateindependent variables in our analysis.
Inputs Costs Variables. The labor and capital inputs variables aredetermined from two different survey questions. The first question asks aboutestablishments’ annual total production inputs costs: ‘‘During calendar year1993, what was the cost of goods and services used in the production of your1993 sales (for example energy costs, raw materials, and intermediate goods)?’’A second survey question enables us to partition this total production inputsvariable into separate capital inputs costs and labor inputs costs variables:‘‘What percentage of this establishment’s total cost of production is accountedfor by labor costs?’’ Thus, the capital inputs variable is capital in the broadsense of traditional economics, that is, all non-labor production inputs, notsimply capital goods inputs. Note that there is a separate control variable for

718 / CHADWICK, AHN, AND KWON
the value of a firm’s capital stock, which is distinct from the annual capital (ornon-labor) inputs to an establishment’s production process described here. Cap-ital inputs and labor inputs are positively correlated (0.62, p < 0.05). Thesevariables are measured in absolute amounts rather than as percentages of totalproduction inputs, which would lead to a negative correlation.
Control Variables. The control variables capture key establishment charac-teristics that may plausibly be correlated with both establishment performanceand the HR practice variables. Many of these controls have been employed inthe previous research on firm-level labor productivity. These include laborinputs (e.g., Dunlop and Weil 1996), capital inputs, the value of establish-ments’ capital stocks (e.g., Huselid, Jackson, and Schuler 1997; Koch andMcGrath 1996), the number of management levels in the establishment, thepercentage of employees who are managers (e.g., Delaney and Huselid 1996),the percentage of employees who are part-time workers, the percentage ofemployees who are temporary or contract workers, the percentage of the work-force who are new to the establishment within the last year (i.e., realized turn-over), and the percentage increase in the establishment’s workforce over theprevious 3 years. (While turnover is usually a rate, the realized turnover vari-able is a reasonable measure when the analysis also controls for overall growthin establishment workforces, which could also lead to higher proportions ofnewer employees in an establishment’s workforce.)The controls also include dummy variables indicating the approximate size
of the establishment in employees (cf. Koch and McGrath 1996; Wright et al.1999; Youndt et al. 1996), unionization (e.g., Arthur 1994; Koch andMcGrath 1996), whether the establishment was founded before 1983, whetherthe establishment is in a single establishment firm (Chadwick 2007), andindustry dummies at the two-digit SIC code level (e.g., Huselid 1995; Kochand McGrath 1996).
Results
The first model in Table 2 reports an OLS regression utilizing the full setof control variables except for the two inputs cost variables. (All regressionsare weighted by a term that accounts for deviations in the Census’ sampleframe from a completely random sample of U.S. establishments.) These resultsgenerally run in reasonable directions and are largely stable across the regres-sion models reported in Table 2. For example, the size dummies indicate thatgreater establishment size is associated with higher sales, as is capital stockand increases in the size of the establishment workforce. The inclusion of the

TABLE
2
OLSREGRESS
ION
ANDSF
PFRESU
LTS
FOR
THEHRM
PRACTICEV
ARIA
BLESa
Mod
el1
Mod
el2
Mod
el3
Model
4
OLScontrolsmod
elOLScontrols+HRM
mod
elOLSmainmod
elSF
PFmainmod
elb
General
effectsvariables
Con
stant
5.950(0.282
)***
5.120(0.332
)***
4.134(0.395
)***
5.240(0.349
)***
Log
oflaborinpu
ts0.125(0.015
)***
0.136(0.016
)***
Log
ofcapitalinpu
ts0.091(0.013
)***
0.117(0.014
)***
Industry
controls
Yes
Yes
Yes
Yes
Size
1)0.727(0.122
)***
)0.801(0.122
)***
)0.689(0.136
)***
)1.230(0.118
)***
Size
2)0.557(0.121
)***
)0.552(0.119
)***
)0.352(0.128
)**
)1.060(0.097
)***
Size
3)0.175(0.126
))0.219(0.123
)†)0.035(0.134
))0.674(0.087
)***
Union
ization
0.253(0.097
)**
0.240(0.100
)*0.229(0.102
)*0.083(0.068
)Single
establishm
ent
)0.198(0.064
)**
)0.153(0.066
)*)0.098(0.070
))0.207(0.064
)**
Log
ofcapitalstock
0.493(0.018
)***
0.442(0.019
)***
0.288(0.022
)***
0.241(0.019
)***
Foun
dedbefore
1983
)0.251(0.062
))0.172(0.062
)**
)0.035(0.067
))0.058(0.068
)Log
ofmanagem
entlevels
0.169*
*(0.063
)0.190(0.064
)**
0.024(0.070
)0.180*
(0.071
)Log
ofpercentmanagers
0.055(0.036
)0.025(0.037
))0.049(0.041
)0.090*
(0.037
)Log
ofpercentpart-tim
eworkers
)0.128(0.021
)***
)0.112(0.022
)***
)0.163(0.024
)***
)0.044†
(0.026
)Log
ofpercenttempo
rary
⁄contract
workers
0.081*
(0.035
)0.065(0.034
)†0.117(0.037
)**
0.079(0.031
)*
Log
ofrealized
turnover
)0.018(0.028
)***
)0.081(0.028
)**
)0.014(0.029
))0.056†
(0.029
)Percentem
ploy
mentincrease
0.003(0.001
)***
0.003(0.001
)***
0.002(0.001
)**
0.001(0.001
)Error
term
0.047(0.052
)Technical
efficiencyvariables(H
Rpractices)
Paypo
licy
0.144(0.081
)†0.253(0.087
)**
)0.493(0.362
)Incentivepay
0.413(0.069)***
0.258(0.074)**
)0.186(0.311
)Benefitsbreadth
0.046(0.017)**
)0.003(0.019
))0.685(0.298
)*Payforskill
)0.002(0.001
)†)0.003(0.001
)**
0.033(0.053
)Qualitymeetin
gs0.001(0.001)
)0.002(0.001
)*0.091(0.064
)Log
ofjobrotatio
n)0.035(0.019
)†)0.087(0.021
)***
0.010(0.059
)†Flextim
e)0.387(0.067
)***
)0.069(0.074
)0.583(0.208
)**
Jobsharing
0.307(0.071
)***
0.224(0.079
)**
)0.439(0.266
)†
HRM’s Effects on Firm-Level Relative Efficiency / 719

TABLE
2(C
ont.)
Model
1Model
2Model
3Mod
el4
OLScontrolsmod
elOLScontrols+HRM
mod
elOLSmainmod
elSF
PFmainmod
elb
Selection
⁄recruiting
breadth
0.196(0.052)***
0.199(0.056)***
2.493(0.757)**
Trainingbreadth
)0.00
7(0.010
)0.016(0.011
))0.267(0.216
)Inefficiencyconstant
)2.636(1.102
)*n
1579
1579
1579
1579
F-statistic
83.271
***
62.448
***
48.259
***
AdjustedR2
0.43
30.46
10.489
Changein
AdjustedR2
–0.02
80.056
Log
Likelihoo
d)24
08.73
Chi
squared(degrees
offreedo
m)
2403.46(47df)***
NOTEs:
†p<0.10,*p<0.05,**
p<0.01,***p<0.001
a Standarderrors
arein
parentheses.
b SFP
FcoefficientsforHR
practicevariablesshould
generally
beinterpretedopposite
oftheirOLScounterparts(see
Results
sectiontext).
720 / CHADWICK, AHN, AND KWON

HRM’s Effects on Firm-Level Relative Efficiency / 721
size dummies conditions the results on the size of establishments’ workforces,making the OLS regressions for log of sales not simply estimations of estab-lishment size. The adjusted R-squared indicates that this model explains a rea-sonable amount of the variance in establishment log of sales.The second model in Table 2 adds the HR practice variables to the first
regression. Here, pay policy, incentive pay, benefits breadth, job sharing, andselection ⁄ recruiting breadth are associated with higher sales, conditional onestablishment size, capital and labor inputs, and so forth. On the other hand,pay for skill, job rotation, and flextime are associated with lower sales withthe same controls. In all, eight of the ten HR practice variables have significantcoefficients in this regression. The mixed nature of the HR practices’ resultshere again supports our decision to model them as a set of separate variables.This second model is akin to the usual approach to estimating the effects ofHR practices on firm-level productivity in the literature, although we departsomewhat from convention in utilizing the HR practices separately rather thanas part of a factor or index, because the intercorrelations between HR practicevariables do not support such an approach.Following the prescriptions of those who advocate accounting for labor
costs in estimating the effects of HR practices on firm-level productivity, thethird regression in Table 2 adds the two inputs costs variables, labor inputsand capital inputs, to the previous OLS model. These two variables are indeedimportant, generating significant positive coefficients and boosting the model’sadjusted R-squared from 0.46 to 0.49. A few of the control variables’coefficients change when we include the inputs costs variables, notably thecoefficients for the single establishment dummy and for log of managementlevels. More importantly, some of the HR practice variables’ results change inthis model, as well. The coefficients for benefits breadth and flextime becomenon-significant in this model, while the coefficient for quality meetingsbecomes significant and pay policy and job rotation have enhanced significance.Additionally, a number of the significant HR practices that carry over fromModel 2 have smaller coefficients in Model 3. Indeed, the change in adjustedR-squared that comes from adding the HR practice variables to the ‘‘controlsonly’’ model drops from 0.028 (the difference between Model 1 and Model 2in Table 2) to 0.017 once the costs variables are included in both models (thelatter figure is based on comparison between Model 3 and a regression thatincludes both the full controls and the input costs variables; results omitted forparsimony). In all, seven of the ten HR practice variables have significantcoefficients in Model 3. These results demonstrate that accounting for costssharpens our understanding of the relationships between the HR practicevariables and log of sales, as expected, because omitting labor and capital inputcosts tends to overstate the strength of these relationships. However, accounting

722 / CHADWICK, AHN, AND KWON
for such costs is an incomplete approach, as it still does not accommodateHRM production functions that are idiosyncratic across establishments.
SFPF results. To address the issue of idiosyncratic HRM production func-tions, we employ stochastic frontier production function methodology. The lastmodel in Table 2 reports the results for the SFPF estimation for the same setof variables that appear in Model 3. Although the values generated by theSFPF procedure represent relative firm-level efficiency with respect to HRM,strictly speaking, the second part of the SFPF model is an estimate of indepen-dent variables’ effects on relative inefficiency, and coefficients generated bythis part of the SFPF model are interpreted accordingly. These interpretationscan be somewhat non-intuitive: Whereas in the OLS models, a positive coeffi-cient suggests that an independent variable is generally a ‘‘good thing’’ forestablishments, a positive coefficient in the technical inefficiency of the SFPFmodel associates inefficiency increases with an independent variable, which isgenerally bad for establishments. Similarly, a negative coefficient indicates thatan HR practice is associated with reduced inefficiency (i.e., greater efficiency),which is generally good for establishments.The parameter estimates for the general effects part of the first SFPF model
in Table 2 (Model 4), as expected, parallel the regression results for thesevariables, with very few differences in signs or significance between the esti-mates in Model 3 and Model 4. However, the SFPF model generates differentresults for the HR practice variables. Five of the ten HR practices are signifi-cantly related to the relative efficiency of sample establishments, as hypothe-sized. As we detail in the Discussion section, these general relationships withefficiency across establishments do not preclude more idiosyncratic combina-tions of the HR practices being associated with greater or lesser relativeefficiency for specific sample establishments. In this model, benefits breadthand job sharing are associated with greater relative establishment efficiency,while job rotation, flextime, and selection ⁄ recruiting breadth are related tolower relative establishment efficiency. Of these five significant HR practices,benefits breadth and flextime do not have significant relationships with log ofsales in the equivalent OLS model, Model 3.A key output of Model 4 is estimated establishment efficiency concerning
the HR practice variables. The efficiency scores generated by the first SFPFmodel in Table 2 suggest that many establishments’ efficiency scores withrespect to HRM cluster pretty closely. Specifically, the mean efficiency scorefrom Model 4 and the median and standard deviation of these scores are 0.63,0.63, and 0.10, respectively, indicating fairly tight clustering and little skew inthe efficiency scores’ distribution. In fact, only fifty-four establishments liefurther than two standard deviations below the mean efficiency score.

HRM’s Effects on Firm-Level Relative Efficiency / 723
Discussion and Supplemental Analysis
Overall, the results from our analysis support the argument that estimatingHR practices’ relationships with relative firm-level efficiency is a useful wayto evaluate firm-level labor productivity. Moreover, estimating relative firm-level efficiency with respect to HRM provides different information than theanalytic approach commonly employed in the extant literature. The SFPFmodel demonstrates that HR practices significantly influence differences inrelative firm-level efficiency in our sample. Some HR practices are associatedwith greater firm-level relative efficiency, other HR practices have the oppositerelationship, and a number of the HR practices do not have significant relation-ships with relative firm-level efficiency. It is important to note in this regardthat a great many differences in relative firm-level efficiency with respect toHRM are firm specific and thus not discernable through the coefficients gener-ated in the SFPF analysis, which reflect the general relationships between HRpractices and relative efficiency across the sample’s establishments.To illustrate the variation in establishment-specific HRM production func-
tions that occur within the sample, Table 3 reports the values for the tenHR practice variables for selected individual establishments from the oppositeends of the estimated efficiency variable’s distribution. The first five columnsin Table 3 report HRM practice data for the five establishments with thehighest estimated relative efficiency scores (based on the first SFPF model inTable 2). The second five columns in Table 3 report corresponding data forthe five establishments with the lowest estimated relative efficiency scores(based on the same model). As these data suggest, establishments in thesample utilize HRM in very different ways, even when these establishmentsare the cases defining the efficiency frontier. Note, for example, howestablishments’ use of the five HRM practices that have significant coeffi-cients in the SFPF model in Table 2 (benefits breadth, job rotation, flextime,job sharing, and selection ⁄ recruiting breadth) vary across the establishmentsin Table 3. Perhaps even more revealing is the variation among the high-efficiency establishments. For instance, High-Efficiency Establishment fiveengages in eight of the ten HR practices (some of these practices, such aspay for skill, rather heavily), thus generally matching popular notions of‘‘high performance’’ HRM systems. On the other hand, High-EfficiencyEstablishment three only engages in four of the ten HR practices that westudied. Three of these practices involve compensation (pay policy, incentivepay, and broad benefits), and the other HR practice indicates a very lowlevel of its workforce involved in quality meetings. Yet, despite these differ-ent HRM configurations, both of these establishments have very high levelsof estimated relative efficiency with respect to HRM. Accommodating this

TABLE
3
HRM
P RACTICEV
ARIA
BLEV
ALUES
FORSE
LECTEDEST
ABLISHMENTS
Establishm
ents
HRM
variables
High
Efficiency
1High
Efficiency
2High
Efficiency
3High
Efficiency
4High
Efficiency
5Low
Efficiency
1Low
Efficiency
2Low
Efficiency
3Low
Efficiency
4Low
Efficiency
5
Paypo
licy
1.00
0.00
1.00
0.00
1.00
0.00
0.84
0.15
0.43
0.00
Incentivepay
0.60
0.00
1.00
0.00
1.00
0.00
0.84
0.15
0.43
0.00
Benefitsbreadth
10.00
0.00
1.43
0.88
0.00
0.00
1.00
1.00
1.00
0.25
Payforskill
0.00
4.00
9.00
5.00
5.00
7.00
8.00
10.00
9.00
9.00
Qualitymeetin
gs3.00
0.00
0.00
0.00
100.00
15.00
0.00
0.00
0.00
10.00
Jobrotatio
na3.00
10.00
1.00
100.00
0.00
4.00
100.00
100.00
100.00
50.00
Flextim
e0.00
15.00
0.00
10.00
33.00
0.00
10.00
20.00
50.00
2.00
Jobsharing
0.00
1.00
0.00
1.00
1.00
1.00
1.00
1.00
0.00
1.00
Selection
⁄recruiting
breadth
2.82
1.00
0.00
0.00
1.00
0.00
0.00
1.00
0.00
0.00
Trainingbreadth
11.00
4.36
3.27
3.82
3.27
3.55
3.73
4.18
4.27
2.82
NOTE:aToenhanceinterpretability,
values
forthisHRM
practicevariable
arenotreported
forits
logged
version.
724 / CHADWICK, AHN, AND KWON
HRM’s Effects on Firm-Level Relative Efficiency / 725
variation across firms is a major strength of the production frontiersapproach, as it allows HRM researchers to acknowledge HRM equifinalityarguments analytically.
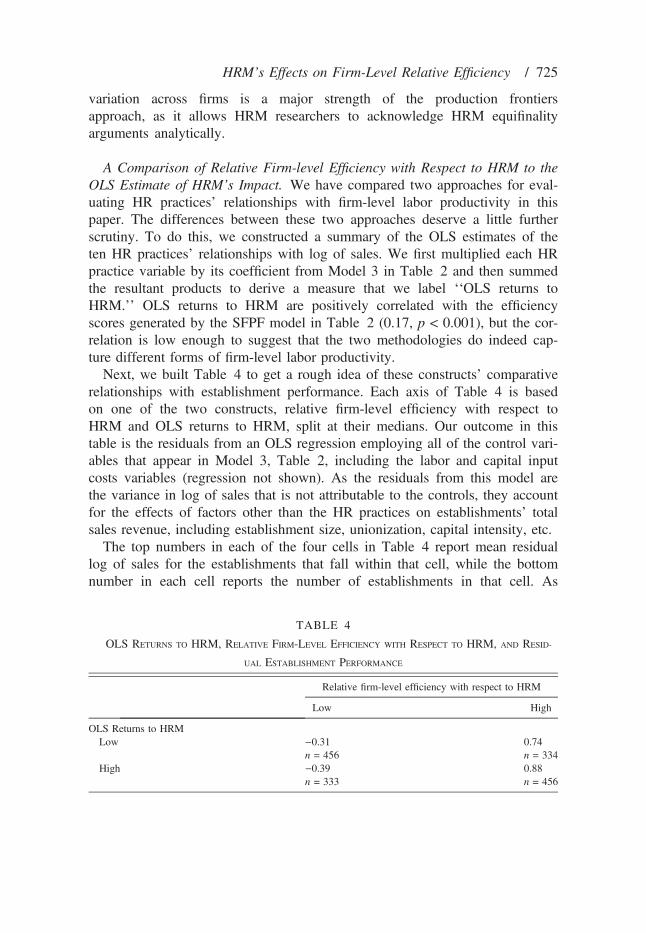
A Comparison of Relative Firm-level Efficiency with Respect to HRM to theOLS Estimate of HRM’s Impact. We have compared two approaches for eval-uating HR practices’ relationships with firm-level labor productivity in thispaper. The differences between these two approaches deserve a little furtherscrutiny. To do this, we constructed a summary of the OLS estimates of theten HR practices’ relationships with log of sales. We first multiplied each HRpractice variable by its coefficient from Model 3 in Table 2 and then summedthe resultant products to derive a measure that we label ‘‘OLS returns toHRM.’’ OLS returns to HRM are positively correlated with the efficiencyscores generated by the SFPF model in Table 2 (0.17, p < 0.001), but the cor-relation is low enough to suggest that the two methodologies do indeed cap-ture different forms of firm-level labor productivity.Next, we built Table 4 to get a rough idea of these constructs’ comparative
relationships with establishment performance. Each axis of Table 4 is basedon one of the two constructs, relative firm-level efficiency with respect toHRM and OLS returns to HRM, split at their medians. Our outcome in thistable is the residuals from an OLS regression employing all of the control vari-ables that appear in Model 3, Table 2, including the labor and capital inputcosts variables (regression not shown). As the residuals from this model arethe variance in log of sales that is not attributable to the controls, they accountfor the effects of factors other than the HR practices on establishments’ totalsales revenue, including establishment size, unionization, capital intensity, etc.The top numbers in each of the four cells in Table 4 report mean residual
log of sales for the establishments that fall within that cell, while the bottomnumber in each cell reports the number of establishments in that cell. As
TABLE 4
OLS RETURNS TO HRM, RELATIVE FIRM-LEVEL EFFICIENCY WITH RESPECT TO HRM, AND RESID-
UAL ESTABLISHMENT PERFORMANCE
Relative firm-level efficiency with respect to HRM
Low High
OLS Returns to HRMLow )0.31
n = 4560.74n = 334
High )0.39n = 333
0.88n = 456

726 / CHADWICK, AHN, AND KWON
Table 4 illustrates, the differences in mean residual log of sales based on themedian split in OLS returns to HRM are small, but the differences in meanresidual log of sales based on the median split in relative firm-level efficiencywith respect to HRM are large and change signs. Establishments high inefficiency have positive residual log of sales, while establishments low in effi-ciency have negative residual log of sales. This exploratory table, while farfrom definitive, therefore implies that relative firm-level efficiency with respectto HRM is more important for establishment performance than HR practices’estimated effects on revenue (i.e., OLS returns to HRM).
Limitations. As in any study, there are limitations to our efforts. As thispaper is the first to examine the relationships between specific HR practicesand relative firm-level efficiency, we did not hypothesize about which individ-ual HR practices would have significant relationships to relative firm-levelefficiency. Such hypothesizing awaits further empirical results that flesh outthe causal mechanisms driving individual HR practices’ relationships with rela-tive firm-level efficiency. Moreover, we suspect that individual HR practicesaffect relative firm-level efficiency differently in different samples. Futureresearch in other data sets could examine how contextual factors may affectthe relationships that we find here. Additionally, future research could explorethe role of mediators between HR practices and relative firm-level efficiency,such as human capital as suggested in the Lopez-Cabrales, Valle, and Herrero(2006) study that we cited earlier. Furthermore, while it would be preferablefor comparability to have a continuous measure of workforce size to estimatesales per employee, the OLS results’ consistency with the published findingsin the HRM and firm performance literature suggest that the workforce sizedummies make a reasonable accounting for size effects.As with all cross-sectional studies, endogeneity is a potential concern in this
research. The type of endogeneity that has most often been raised as a poten-tial weakness in research on HR practices and organizational performance issimultaneity. Because many commitment-based HR practices incur significantadministrative expenses, it may be the case that higher performing firms arebetter able to afford such practices. Positive cross-sectional relationshipsbetween performance and HR practices may therefore be a consequence ratherthan a cause of higher organizational performance. It is possible that this is thecase in these data, but there are two reasons to believe that endogeneity is alesser threat to this paper’s conclusions than it is in typical HRM ⁄organiza-tional performance research.First, the conceptual argument about simultaneity involves, as we noted,
positive relationships between organizational performance and HR practices. Inthis paper’s SFPF analysis, this reasoning would apply when HR practices are

HRM’s Effects on Firm-Level Relative Efficiency / 727
significantly associated with higher establishment relative efficiency. This isindeed true of two of our HR practices, benefits breadth and job sharing. How-ever, three other HR practices, job rotation, flextime, and selection ⁄ recruitingbreadth, are significantly related to lower relative establishment efficiency. Inother words, endogeneity bias because of simultaneity should be confined tobenefits breadth and job sharing in our analysis, because it is difficult to imag-ine how establishments that are inefficient would be prompted by their ineffi-ciency to employ job rotation, flextime, and greater selection ⁄ recruitingbreadth. Moreover, a comparison of the control variables in the analysis showsfew systematic differences between establishments that are high and low onjob sharing, although this same difference is significant on all of the keyestablishment characteristics variables for the benefits breadth variable. Thus,while simultaneity cannot be definitively ruled out, particularly for benefitsbreadth, it appears to be an inadequate explanation for a good number of thesignificant relationships of interest in our SFPF model.Second, the SFPF technique itself may offer protection against biased infer-
ence because of endogeneity. Researchers in production frontiers methodologyhave traditionally assumed that endogeneity is not a threat to inference in theiranalyses because production frontiers is ‘‘a boundary technique that merelymodels feasible relationships between inputs and outputs’’ in a sample (Ormeand Smith 1996: 75). With respect to DEA, however, Orme and Smith (1996)demonstrated with simulation data that endogeneity could bias inference inproduction frontiers models that use small samples, but that endogeneity biasis mitigated in DEA that uses large samples. Bifulco and Bretschneider (2001)challenge this proposition, and their results are, in turn, disputed by Ruggiero(2003). The latter author claims that DEA handles endogeneity very well insamples that are larger than 500 cases, a criterion that is clearly exceeded bythis paper’s data set. Moreover, the logic employed by these scholars extendsfrom DEA to SFPF.This debate has not yet been completely resolved subsequent to the above
publications, but the current conclusions are favorable for our analysis, as theypredict an attenuation of endogeneity bias in larger production frontierssamples like the one that we employ in this paper. Nevertheless, we hope thatfuture research that uses production frontiers to examine HRM and organiza-tional relative efficiency will have more concrete guidelines concerningendogeneity to follow. In general, it is clear that research concerning HRMand organizational performance must account for the possibility of endogeneitybias. Indeed, without the advantages of production frontiers modeling, it ispossible that traditional OLS models of profitability and HRM could faceendogeneity issues even in this same data set.

728 / CHADWICK, AHN, AND KWON
Conclusion
Clearly, our understanding of how HRM influences relative firm-levelefficiency is only a beginning. However, our analysis demonstrates the useful-ness of the relative firm-level efficiency concept in HRM research. Productionfrontiers adds valuable new perspectives to HRM’s impact on firm-level laborproductivity that complement what can be learned from the usual approach inthe literature. To scholars outside of HRM, this study demonstrates that peoplemanagement practices are an important determinant of variance in essentialcompetitiveness—that is, relative efficiency—across firms. Multiple analyticapproaches are becoming increasingly important in research linking HRM withfirm performance as researchers work to uncover the causal mechanismsdriving both efficiency and competitive advantage through people. It is morecomplete approaches like these that will help us to better specify how andwhy people management matters to firms.
REFERENCES
Arbuckle, James. L. 1994. ‘‘Advantages of Model-based Analysis of Missing Data over Pairwise Deletion.’’Paper presented at the RMD Conference on Causal Modeling, Purdue University, West Lafayette, IN.
Arthur, Jeffrey B. 1994. ‘‘Effects of Human Resource Systems on Manufacturing Performance and Turn-over.’’ Academy of Management Journal 37: 670–87.
Barney, Jay B., and Patrick M. Wright. 1998. ‘‘On Becoming a Strategic Partner: The Role of HumanResources in Gaining Competitive Advantage.’’ Human Resource Management 37: 31–46.
Battese, George E., and Timothy J. Coelli. 1995. ‘‘A Model of Technical Inefficiency Effects in StochasticFrontier Production Functions for Panel Data.’’ Empirical Economics 20: 325–32.
Bifulco, R., and S. Bretschneider. 2001. ‘‘Estimating School Efficiency: A Comparison of Methods UsingSimulated Data.’’ Economics of Education Review 20: 417–29.
Boxall, Peter, and John Purcell. 2000. ‘‘Strategic Human Resource Management: Where Have We Comefrom and Where Should We Be Going?’’ International Journal of Management Review 2: 183–203.
Cappelli, Peter, and David Neumark. 2001. ‘‘Do High-performance Work Practices Improve Establishment-level Outcomes?’’ Industrial and Labor Relations Review 54: 737–75.
Chadwick, Clint. 2007. ‘‘Examining Non-linear Relationships between Human Resource Practices and Man-ufacturing Performance.’’ Industrial and Labor Relations Review 60: 499–521.
—––—. 2010. ‘‘Theoretic Insights on the Nature of Performance Synergies in Human Resource Systems:Toward Greater Precision.’’ Human Resource Management Review 20: 85–101.
—––—, and Adina Dabu. 2009. ‘‘Human Resources, Human Resource Management, and the CompetitiveAdvantage of Firms: Toward a More Comprehensive Model of Causal Linkages.’’ OrganizationScience 20: 253–72.
Coelli, Timothy J., D. S. Prasada Rao, and George E. Battese. 1998. An Introduction to Efficiency and Pro-ductivity Analysis. Boston, MA: Kluwer.
Colakoglu, Saba, David P. Lepak, and Ying Hong. 2006. ‘‘Measuring HRM Effectiveness: ConsideringMultiple Stake-holders in a Global Context.’’ Human Resource Management Review 16: 209–18.
Combs, James, Yongmei Liu, Angel Hall, and David Ketchen. 2006. ‘‘How Much Do High-performanceWork Practices Matter? A Meta-analysis of their Effects on Organizational Performance.’’ PersonnelPsychology 59: 501–28.
Datta, David K., James P. Guthrie, and Patrick M. Wright. 2005. ‘‘Human Resource Management and LaborProductivity: Does Industry Matter?’’ Academy of Management Journal 48: 135–45.

HRM’s Effects on Firm-Level Relative Efficiency / 729
Delaney, John T., and Mark A. Huselid. 1996. ‘‘The Impact of Human Resource Management Practices onPerceptions of Organizational Performance.’’ Academy of Management Journal 39: 949–69.
Delery, John E., and Jason D. Shaw. 2001. ‘‘The Strategic Management of People in Work Organizations:Review, Synthesis, and Extension.’’ In Research in Personnel and Human Resource Management,vol. 20. edited by G. R. Ferris, pp. 167–97. Stamford, CT: JAI Press.
Dunlop, John T., and David Weil. 1996. ‘‘Diffusion and Performance of Modular Production in the U.S.Apparel Industry.’’ Industrial Relations 35: 334–55.
Dutta, Shantanu, Om Narasimhan, and Surendra Rajiv. 2005. ‘‘Conceptualizing and Measuring Capabilities:Methodology and Empirical Application.’’ Strategic Management Journal 26: 277–85.
Dyer, Lee. 1984. ‘‘Studying Human Resource Strategy: An Approach and an Agenda.’’ Industrial Relations23: 156–69.
—––—, and Todd Reeves. 1995. ‘‘Human Resource Strategies and Firm Performance: What Do We Knowand Where Do We Need to Go?’’ International Journal of Human Resource Management 6: 656–70.
Gerhart, Berry, Patrick M. Wright, Gary C. McMahan, and Scott A. Snell. 2000. ‘‘Measurement Error inResearch on Human Resources and Firm Performance: How Much Error Is There and How Does itInfluence Effect Size Estimates?’’ Personnel Psychology 53: 803–34.
Greene, William. 2001. ‘‘New Developments in the Estimation of Stochastic Frontier Models with PanelData.’’ Paper presented at 7th European Workshop on Efficiency and Productivity Analysis, Universityof Oveido, Spain.
Guthrie, James P. 2001. ‘‘High-involvement Work Practices, Turnover, and Productivity: Evidence fromNew Zealand.’’ Academy of Management Journal 44: 180–90.
Huselid, Mark A. 1995. ‘‘The Impact of Human Resource Management Practices on Turnover, Productivity,and Corporate Financial Performance.’’ Academy of Management Journal 38: 635–72.
—––—, Susan E. Jackson, and Randall S. Schuler. 1997. ‘‘Technical and Strategic Human Resource Man-agement Effectiveness as Determinants of Firm Performance.’’ Academy of Management Journal 40:171–88.
Kim, Dong-one. 2005. ‘‘The Benefits and Costs of Employee Suggestions Under Gainsharing.’’ Industrialand Labor Relations Review 58: 631–52.
Koch, Marianne J., and Rita G. McGrath. 1996. ‘‘Improving Labor Productivity: Human Resource Manage-ment Policies Do Matter.’’ Strategic Management Journal 17: 335–54.
Lieberman, Marvin B., and Rajeev Dhawan. 2005. ‘‘Assessing the Resource Base of Japanese and U.S.Auto Producers: A Stochastic Frontier Approach.’’ Management Science 51: 1060–75.
Lopez-Cabrales, Alvaro, Ramon Valle, and Ines Herrero. 2006. ‘‘The Contribution of Core Employees toOrganizational Capabilities and Efficiency.’’ Human Resource Management 45: 81–109.
Lynch, Lisa M., and Sandra E. Black. 1995. ‘‘Beyond the Incidence of Employer Provided Training: Evi-dence from a National Employers Survey.’’ NBER Working Paper No. 6120. Cambridge, MA:National Bureau of Economic Research.
MacDuffie, John P. 1995. ‘‘Human Resource Bundles and Manufacturing Performance: Organizational Logicand Production Systems in the World Auto Industry.’’ Industrial and Labor Relations Review 48:197–221.
Macky, Keith, and Peter Boxall. 2007. ‘‘The Relationship Between ‘High-performance Work Practices’ andEmployee Attitudes: An Investigation of Additive and Interaction Effects.’’ International Journal ofHuman Resource Management 18: 537–67.
Orme, Chris, and Peter Smith. 1996. ‘‘The Potential for Endogeneity Bias in Data Envelopment Analysis.’’Journal of Operational Research Society 47: 73–83.
Rogers, Edward W., and Patrick M. Wright. 1998. ‘‘Measuring Organizational Performance in StrategicHuman Resource Management: Problems, Prospects, and Performance Information Markets.’’ HumanResource Management Review 8: 311–31.
Ruggiero, John. 2003. ‘‘Comment on Estimating School Efficiency.’’ Economics of Education Review 22:631–34.
Schafer, Joseph L. 1997. Analysis of Incomplete Multivariate Data. New York, NY: Chapman and Hall.

730 / CHADWICK, AHN, AND KWON
Sun, Li-yun, Samuel Aryee, and Kenneth S. Law. 2007. ‘‘High-Performance Human Resource Practices,Citizenship Behavior, and Organizational Performance: A Relational Perspective.’’ Academy of Man-agement Journal 50: 558–77.
Way, Sean A. 2002. ‘‘High Performance Work Systems and Intermediate Indicators of Firm PerformanceWithin the US Small Business Sector.’’ Journal of Management 28: 765–85.
Wright, Patrick M., Blaine McCormick, W. Scott Sherman, and Gary C. McMahan. 1999. ‘‘The Role ofHuman Resource Practices in Petro-chemical Refinery Performance.’’ International Journal of HumanResource Management 10: 551–71.
Youndt, Mark A., Scott A. Snell, James W. Dean, and David P. Lepak. 1996. ‘‘Human Resource Manage-ment, Manufacturing Strategy, and Firm Performance.’’ Academy of Management Journal 39: 836–66.
Zyphur, Michael J. 2009. ‘‘When Mindsets Collide: Switching Analytical Mindsets to Advance Organiza-tional Science.’’ Academy of Management Journal 34: 677–88.