human capital in the middle east and north africa
TRANSCRIPT
Human capital in the Middle East and North
Africa
Djavad Salehi-Isfahani
Virginia Tech and ERF
Economic Research Forum Annual ConferenceCairo
March 20, 2016
1 / 26

————————————————————————————OUTLINE————————————————————————————
Quantity and quality of human capital
Returns to schooling
Education and the labor market
Discussion2 / 26
Main point
Education has failed its promise. Post-independence MENAautocrats offered universal free education as path to middle class,sometimes with guarantees of state mployment.
Retrenchment of the state and a lack of a robust private sectorresulted in high unemployment of educated youth
Lure of formal schooling has remained because of high privatereturns. Social returns very low, as reflected in growth accounting
Wrong kind of human capital being accumulated: rote memorization,multiple choice tests, and worthless credentials from diploma mills.
Mismatch of skills: the fault of the education system (World Bank[5]) or lack of linkage between the markets for education and labor.
Transitions from school to work burdened by the economy’stransition from state-led to private sector-led development
3 / 26

Introduction
Outline
1 Introduction
2 Human capital quantity
3 Quality of human capital
4 Private and social returns to schooling
5 Education reform
6 References
4 / 26
Introduction
Broken promises
High rates of unemployment of educated youth
Long periods of job search, measured in years not months
Education and labor markets appear disconnected
Is the problem on the supply or demand side? Mismatch of skillsor anemic demand for skilled labor? The issue remainsunresolved
5 / 26

Human capital
Outline
1 Introduction
2 Human capital quantity
3 Quality of human capital
4 Private and social returns to schooling
5 Education reform
6 References
6 / 26
Human capital
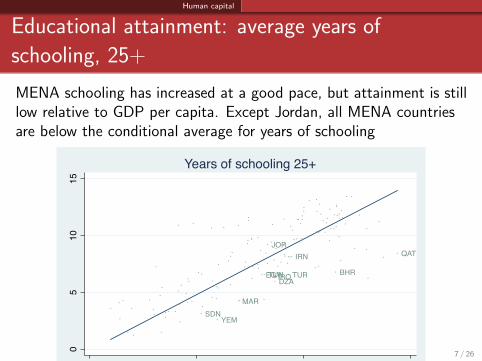
Educational attainment: average years of
schooling, 25+
MENA schooling has increased at a good pace, but attainment is stilllow relative to GDP per capita. Except Jordan, all MENA countriesare below the conditional average for years of schooling
BHRDZA
EGY
IRN
IRQ
JOR
MAR
QAT
SDN
TUN TUR
YEM
05
1015
6 8 10 12Log gdppc
Fitted values BAR.SCHL.25UP
Years of schooling 25+
7 / 26
Human capital
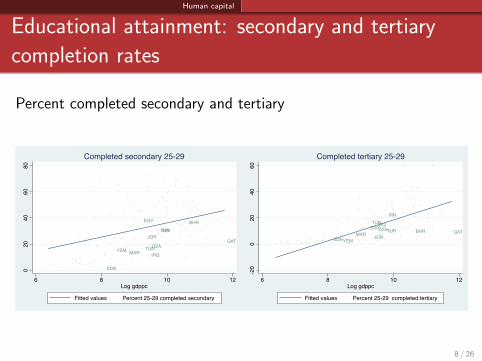
Educational attainment: secondary and tertiary
completion rates
Percent completed secondary and tertiary
BHR
DZA
EGY
IRN
IRQ
JOR
MAR
QAT
SDN
TUN
TUR
YEM
020
4060
80
6 8 10 12Log gdppc
Fitted values Percent 25-29 completed secondary
Completed secondary 25-29
BHRDZAEGY
IRN
IRQ
JORMAR QATSDN
TUN
TUR
YEM
-20
020
4060
6 8 10 12Log gdppc
Fitted values Percent 25-29 completed tertiary
Completed tertiary 25-29
8 / 26
Human capital
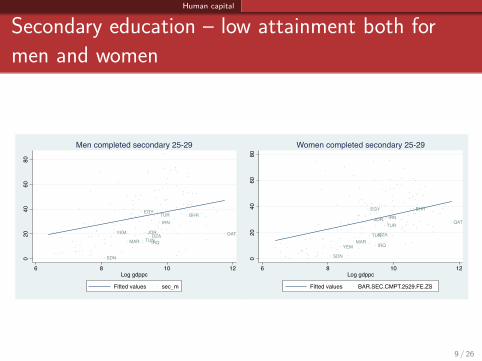
Secondary education – low attainment both for
men and women
BHR
DZA
EGY
IRN
IRQ
JOR
MARQAT
SDN
TUN
TUR
YEM
020
4060
80
6 8 10 12Log gdppc
Fitted values sec_m
Men completed secondary 25-29
BHR
DZA
EGYIRN
IRQ
JOR
MAR
QAT
SDN
TUN
TUR
YEM0
2040
6080
6 8 10 12Log gdppc
Fitted values BAR.SEC.CMPT.2529.FE.ZS
Women completed secondary 25-29
9 / 26
Human capital
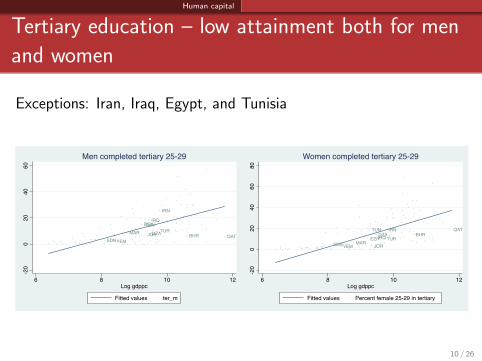
Tertiary education – low attainment both for men
and women
Exceptions: Iran, Iraq, Egypt, and Tunisia
BHRDZA
EGY
IRN
IRQ
JORMARQAT
SDN
TUNTUR
YEM
-20
020
4060
6 8 10 12Log gdppc
Fitted values ter_m
Men completed tertiary 25-29
BHRDZAEGY
IRNIRQ
JORMAR
QAT
SDN
TUN
TURYEM
-20
020
4060
80
6 8 10 12Log gdppc
Fitted values Percent female 25-29 in tertiary
Women completed tertiary 25-29
10 / 26
Human capital
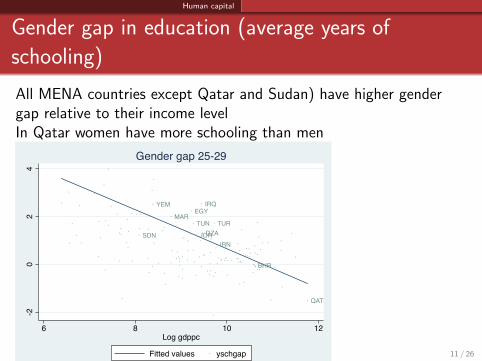
Gender gap in education (average years of
schooling)
All MENA countries except Qatar and Sudan) have higher gendergap relative to their income levelIn Qatar women have more schooling than men
BHR
DZA
EGY
IRN
IRQ
JOR
MAR
QAT
SDN
TUN TUR
YEM
-20
24
6 8 10 12Log gdppc
Fitted values yschgap
Gender gap 25-29
11 / 26

Quality of human capital
Outline
1 Introduction
2 Human capital quantity
3 Quality of human capital
4 Private and social returns to schooling
5 Education reform
6 References
12 / 26
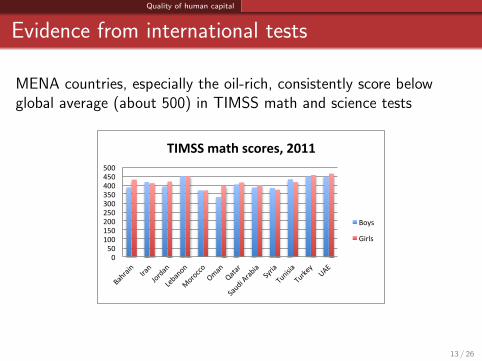
Quality of human capital
Evidence from international tests
MENA countries, especially the oil-rich, consistently score belowglobal average (about 500) in TIMSS math and science tests
050100150200250300350400450500
Bahrain Ira
n
Jordan
Lebanon
Morocco
Oman
Qatar
SaudiArabia
Syria
Tunisia
Turkey
UAE
TIMSSmathscores,2011
Boys
Girls
13 / 26
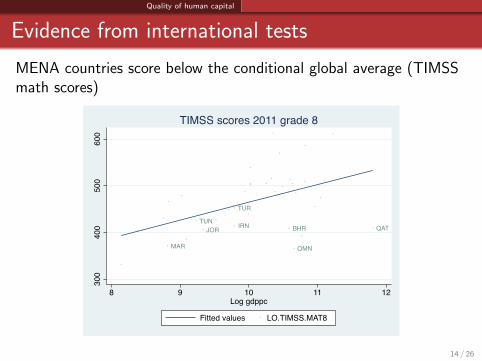
Quality of human capital
Evidence from international tests
MENA countries score below the conditional global average (TIMSSmath scores)
BHRIRNJOR
MAR OMN
QATTUN
TUR
300
400
500
600
8 9 10 11 12Log gdppc
Fitted values LO.TIMSS.MAT8
TIMSS scores 2011 grade 8
14 / 26
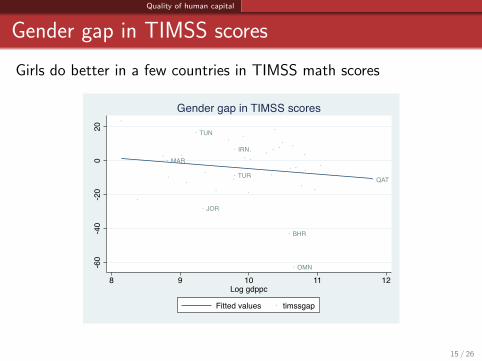
Quality of human capital
Gender gap in TIMSS scores
Girls do better in a few countries in TIMSS math scores
BHR
IRN
JOR
MAR
OMN
QAT
TUN
TUR
-60
-40
-20
020
8 9 10 11 12Log gdppc
Fitted values timssgap
Gender gap in TIMSS scores
15 / 26

Returns to education
Outline
1 Introduction
2 Human capital quantity
3 Quality of human capital
4 Private and social returns to schooling
5 Education reform
6 References
16 / 26
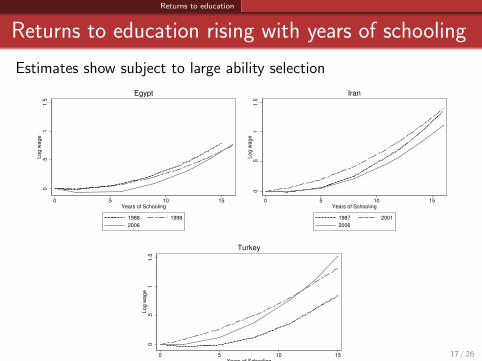
Returns to education
Returns to education rising with years of schooling
Estimates show subject to large ability selection
0.5
11.5
Log w
age
0 5 10 15Years of Schooling
1988 1998
2006
Egypt
0.5
11.5
Log w
age
0 5 10 15Years of Schooling
1987 2001
2006
Iran
0.5
11.5
Log w
age
0 5 10 15Years of Schooling
1988 1994
2003
Turkey
17 / 26
Returns to education
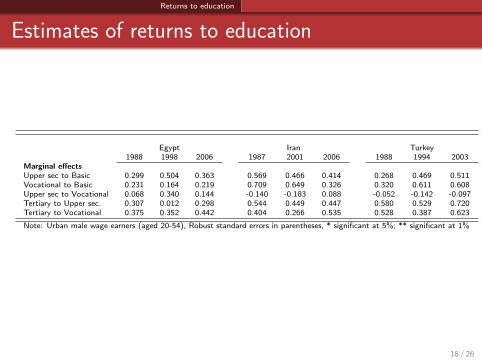
Estimates of returns to education
Egypt Iran Turkey1988 1998 2006 1987 2001 2006 1988 1994 2003
Marginal effectsUpper sec to Basic 0.299 0.504 0.363 0.569 0.466 0.414 0.268 0.469 0.511Vocational to Basic 0.231 0.164 0.219 0.709 0.649 0.326 0.320 0.611 0.608Upper sec to Vocational 0.068 0.340 0.144 -0.140 -0.183 0.088 -0.052 -0.142 -0.097Tertiary to Upper sec. 0.307 0.012 0.298 0.544 0.449 0.447 0.580 0.529 0.720Tertiary to Vocational 0.375 0.352 0.442 0.404 0.266 0.535 0.528 0.387 0.623
Note: Urban male wage earners (aged 20-54), Robust standard errors in parentheses, * significant at 5%; ** significant at 1%
18 / 26
Returns to education
Low returns to education, except at tertiary level
Private returns are close to zero for education below high schoolbut generally high for university education (Salehi-Isfahani,Tunali, Assaad [4])
Low social returns. Pritchett [3] and Makdisi et al [2].
Family background determines wages more than quality ofhigher education
Returns to TVE also low, likely because TVE attracts low abilitystudents who fail the academic track
19 / 26
Returns to education
Mismatch of skills
Wrong kind of human capital
Skills learned in schools not those needed by private sector
A legacy of public sector hiring of graduates, offering secure,well paying jobs
Public sector hiring was based on more ex ante signals (grades,university rank)
Private sector values skills and productivity, but . . .
Schools encourage rote memorization, not creativity, and usemultiple choice tests to measure skills
20 / 26

Education reform
Outline
1 Introduction
2 Human capital quantity
3 Quality of human capital
4 Private and social returns to schooling
5 Education reform
6 References
21 / 26
Education reform
Summary of findings and policy implication
Education has stopped delivering on its promise of social mobility
Diploma mills produce credentials rather than productive skills
Labor markets have changed but signals to education sectorhave not
Reforms should focus on sharpening the signals of how skills arerewarded by private employers
22 / 26

Education reform
Transition from school to work
Policies should aim to improve job search and transitions fromschool to work
Consider behavioral approaches to search
Youth lose the sense of belonging they have in schools when theygraduate, but do not get it back until they have a formal job.
23 / 26

References
Outline
1 Introduction
2 Human capital quantity
3 Quality of human capital
4 Private and social returns to schooling
5 Education reform
6 References
24 / 26
References
References I
Ragui Assaad, Caroline Krafft, and Djavad Salehi-Isfahani.Technical report, 2015.
Samir Makdisi, Zeki Fattah, and Imad Limam.Determinants of growth in the MENA region.In J. Nugent and M. H. Pesaran, editors, Explaining Growth inMiddle East and North Africa, Contributions to Economic Analysis.Elsevier, London, 2007.
Lant Pritchett.Has education had a growth payoff in the MENA region?MENA Working Paper Series 18, World Bank, Washington, D.C.,1999.
25 / 26
References
References II
Djavad Salehi-Isfahani, Insan Tunali, and Ragui Assaad.A comparative study of returns to education of urban men in Egypt,Iran and Turkey.Middle East Development Journal, 1(2):145–187, 2009.
World Bank.The Road not Traveled: Education Reform in the MENA Region.World Bank, Washington, DC, 2007.
26 / 26