hta and submissions - cdn.ymaws.com · health technology assessmentis a ... and ethical issues...
TRANSCRIPT

4/7/2017
1
HTA and Submissions
Ferg Mills, Angela Rocchi
April 5, 2017
Agenda
2
• The Decision Problem
• Role of HTA bodies in Canada
– CADTH, pCODR and INESSS
• Overview of the elements of the HTA submission
– Clinical package for HTA
– Economic analysis for HTA
– Budget impact models

4/7/2017
2
Why HTA?
4
To support decision-making.
Resources are limited.
New investments mean opportunity costs.
We talk about money, but opportunity costs are measured in other people’s health.
4/7/2017
3
Opportunity Cost
Pick the best description(s):
A. The displaced activity that can no longer be funded if a new investment is made, within a constrained budget;
B. The value of the best activity foregone when a choice needs to be made between possible uses of a constrained budget.
C. The loss of potential gain from other investments when one investment is chosen;
C. What we give up to get the things we want.
What is HTA?
6
According to WHO:
Health technology assessment is a multidisciplinary process that summarises information about the medical, social, economic and ethical issues related to the use of a health technology in a systematic, transparent, unbiased, robust manner.

4/7/2017
4
What is HTA?
7
Who is HTA (in Canada)?
8
Not limited to drugs… but will be, for our purposes.

4/7/2017
5
Who makes HTA recommendations?
9
Clinical and economic reviewers– Including clinician experts
HTA expert panels (pERC, CDEC, Conseil)
- Largely health care practitioners- Physicians of various specialties, pharmacists, nurses
- A health economist
- 2 public members (patients)
- Not just technocrats
What guides HTA agencies?
10
HTA expert panels consider the priorities of payers:
• Maximizing population health
• Fiscal prudence
Using HTA values:
• EBM: the primacy of evidence
The dollars are real… the benefits must be, too.

4/7/2017
6
What does HTA value?
11
The pCODR deliberative framework:
Clinical is the most highly valued quadrant.
Clinical Economic
Patient ValuesAdoptionFeasibility
How is HTA conducted? (Process)
12
Submission components:
Within a formalized process explicitly framed for each HTA agency (check their websites).
Clinical SummaryEconomic Evaluation
Patient InputBudget Impact
Analysis

4/7/2017
7
13
CDR pCODR INESSS PP
Clinical
Economic
BIA
Patient ~
Physician
PAG
Patient Input
14
Condition and current therapy:• Impact of condition on patient• Patients’ experiences with current therapy• Impact on caregivers
Drug under review:• Expectations for the new drug (if no experience)• Experiences with the new drug (clinical trial, compassionate use)
Any additional information

4/7/2017
8
Clinical Summary
15
Canadian focus!• Disease background
– Definitions and descriptions, epidemiology, burden of illness, unmet medical need
• Current Canadian treatment practices• Clinical evidence to support new therapy
– Efficacy and safety
• Place in therapy (comparative CLINICAL benefit)– In the context of current practice – beyond the RCT
Note: the GVD is only a starting place!
Unmet Medical Need
16
• Drives prioritization for health care dollars– HTA: same speed of process, but possibly a more
generous evaluation of clinical data– PCPA: ‘top of the pile’
• Documented by treatment guidelines and supported by patient input– Commercial features/benefits may not be unmet needs– Burden of illness research tells us what we spend but
does not tell us if that is the right amount to spend (too high? too low? just right?)

4/7/2017
9
Clinical Evidence: Internal and External Validity
17
• Methodology issues: – study design, statistical plan, conduct of study,
duration of observation, inclusion/exclusion criteria
• Outcomes:– prefer final vs. intermediate/surrogate– align with patient values (especially QOL)– statistical vs clinical significance
• Comparator:– relevant to current Canadian practice
Clinical Evidence
18
Your version of the story:• Support corporate positioning for the drug
– What is your reimbursement ask?– If you seek subgroups – you must provide these data– If you have ANY data updates – provide these– Goes beyond HC summary, GVD, publications
HTA version of the story:– Their primary data sources are: publications, grey
literature, treatment guidelines, external clinical experts – not your summary.

4/7/2017
10
IDC/NMA
19
• If we do not have direct-comparator evidence from RCTs, then we must consider an indirect comparison (IDC) using a network meta-analysis (NMA) to link results from disparate studies
• Extremely complicated and can be difficult to interpret – often leads to lack of clarity
• HTA is a tough audience to satisfy for an NMA• Essentially, there is no substitute for H2H RCTs
Linking Submission Components
20
Price sets the evidence bar and is the reward for the appropriate place in therapy.
Without a clinical story, there is no economic story.

4/7/2017
11
Economic Evidence
21
• How does that compare with what I’m already doing/paying for?
• Does this investment increase or decrease the total amount of health produced?
• What about the opportunity cost?
• How can we tell?
Defining Health
• Are 10 hip replacements more valuable than 12 knee replacements?
• Should we invest more in genomic testing or pediatric oncology?
• Do we need to increase HPV vaccination rates, or expand mental health facilities?
22
• Measuring value for money means we need a multidimensional unit of measure.
• At a minimum, we need to account for both duration of life and some estimate of quality of life.
• Hence the creation of the Quality-Adjusted Life Year (QALY).

4/7/2017
12
Quality-Adjusted Life Years
23
• Combines duration of life with quality of life, (like a KwH), as opposed to just survival (LY).
• Health states are measured on an interval scale whereby 1 represents perfect health, and 0 equals dead. Note that the possibility for states worse than dead also exists.
• Interval scale implies that moving from 0.2 to 0.3 is equivalent to moving from 0.9 to 1.0.
• And that 0.8 is exactly “twice as good” as 0.4.
• This has important equity considerations.
Using QALYs
24
0
0.1
0.2
0.3
0.4
0.5
0.6
0.7
0.8
0.9
1
Dx Year 1 Year 2 Year 3 Year 4 Year 5
Without TX
With TX

4/7/2017
13
Pharmacoeconomic Reference Case
• Cost-effectiveness needs 2 ingredients.
• CADTH has recently decided that just about every submission should include a cost-utility analysis (CUA), using QALYs as the outcome.
• CUA is a special form of cost-effectiveness analysis that facilitates decision-making across possible health programs.
25
Types of Analysis
• Other types of analysis are sometimes permissible, but now only in special cases.
• Cost-effectiveness analysis (CEA) estimates the total costs, with the output expressed in natural units.
• Could be hospitalizations avoided, transplantations saved, days at work gained.
26

4/7/2017
14
Types of Analysis
• Cost-minimization analysis (CMA) or just cost analysis or cost tables.
• Used when effectiveness is assumed identical. Rarely true, but sometimes the conservative assumption.
• Cost-benefit analysis (CBA) assigns a specific value to health gains. More usually associated with welfarist approaches, but very useful mathematically, and very interesting for research (CV/DCE).
27
Interpreting Results
• All analyses consider costs
• But not all consider outcomes in the same way
• Most new technologies deliver more health, but at an additional cost.
28

4/7/2017
15
A Quick Recap
• Decision-makers want to maximize population health
• We measure health in QALYs to allow comparison across investment opportunities
• Most new treatments deliver more health, but at an additional cost.
• We want new investments to create more health than they displace.
29
Representing Results
30
NEMore costly, more effective
SELess costly, more effective
SWLess costly, less effective
NWMore costly, less effective

4/7/2017
16
Decision Analysis Models
31
Evidence
Trials Databases
Costs Event rates
Cohorts
Long-term
Types of Models
• When the time horizon is short, we can often use the simplest and most intuitive approach to modeling: the decision tree.
• Read from left to right, the decision tree puts together decision nodes, chance nodes and outcomes to calculate expected costs and outcomes.
• Appropriate for short-term or discrete time analytical problem.
32

4/7/2017
17
Types of Models
• Consider the following decision tree for prevention of HIV transmission from mother to child:
• The intervention costs $800, but treatment for infected children costs $1500.
• The probability of transmission by untreated mothers is 0.26, and by treated mothers 0.07. However, some women will not accept treatment (p=0.05), incurring no benefits and no additional costs.
33
Decision Tree Example
34

4/7/2017
18
Calculations
Expected cost of intervention = 0.95 x [(0.07 x $2300) + (0.93 x 800)] + 0.05 x [(0.26 x $1500) + (0.74 x $0)
=$879.25
Expected cost of no intervention = (0.26 x $1500) + (0.74 x $0)=$390
So intervention costs $480 more
Let us assume that, in case of vertical transmission, the child will expect to enjoy 5 QALYs (due to shortened life expectancy). With no transmission the child will enjoy 40 QALYs.The expected benefits from intervening can be calculated as:
0.95 x [(0.07 x 5) + (0.93 x 40)] + 0.05 x [(0.26 x 5) + (0.74 x 40)]
=37.2 QALYsThe expected benefits from not intervening can be calculated as:[(0.26 x 5) + (0.74 x 40)]=30.9 QALYs
35
ICERs
• So the ICER for this decision tree can be calculated as:
• ($879.25 - $390) / (37.2 - 30.9) = $77.66/QALY
• Does this represent good value?
• It all depends on what gets displaced
• WHO recommends a standard approach for LMICs of <3x per capita GDP per DALY averted.
36

4/7/2017
19
Markov Models
• Better suited to longer-term analysis, e.g. chronic disease, with repeated periods of events/remissions/progressions/etc.
• Uses discrete periods of time and transition probabilities
• Generates a “Markov trace” of results
• Other approaches are also used.
37
Diagnosed patients
Dead
Patient undergoes
Liver transplant
(LT)
1st year post LT
2nd year
post LT
> 2nd year
post LT
Affordability: Budget Impact
38
• Forget about the abstract concept of value…• Can payers afford what you are selling?
• Budget impact analysis is the how you demonstrate the financial effect on the drug plan of the adoption decision
• Methods are highly formalized.

4/7/2017
20
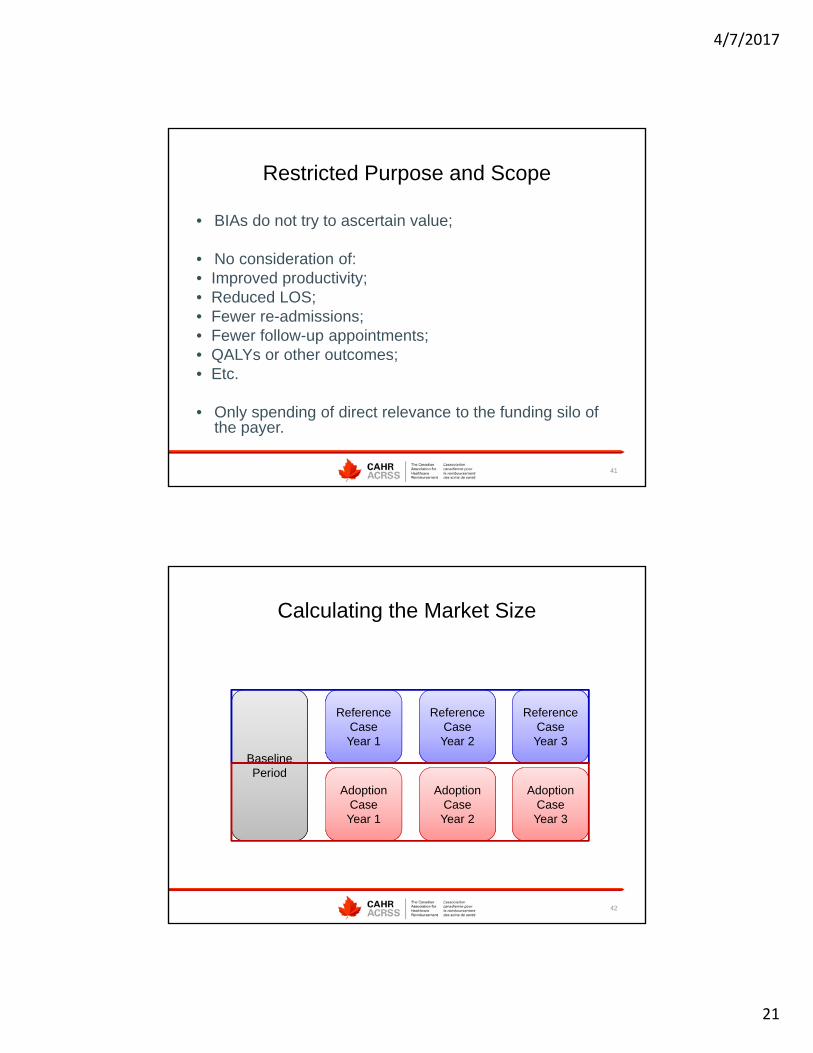
Budget Impact Analysis
• Methods are described by the PMPRB (2007)
• A common baseline period is defined
• We build a Reference Case
• And an Adoption Case
• The difference between the Adoption Case and the Reference Case is the budget impact.
39
Budget Impact Analysis
• Many organizations use BIAs:
• Public drug plans
• Private insurers
• Cancer agencies
• Hospitals, clinics, chains, etc.
• The setting determines the scope.
40
4/7/2017
21
Restricted Purpose and Scope
• BIAs do not try to ascertain value;
• No consideration of:• Improved productivity;• Reduced LOS;• Fewer re-admissions;• Fewer follow-up appointments;• QALYs or other outcomes;• Etc.
• Only spending of direct relevance to the funding silo of the payer.
41
Calculating the Market Size
42
Baseline Period
Reference CaseYear 1
Reference CaseYear 2
Reference CaseYear 3
Adoption CaseYear 1
Adoption CaseYear 2
Adoption CaseYear 3

4/7/2017
22
Calculating the Budget Impact
43
Total Reference
Case
Total Adoption
Case
Budget Impact
Steps
• Selection of Comparators
• Definition of the baseline period
• Growth parameters
• Costs
• Calculation of Results
• Sensitivity analysis
44

4/7/2017
23
Comparators
• All relevant comparators, including:
• Submitted drug;
• Standard(s) of care or appropriate treatments.
• No off-label use considered.
• Questions:
• How should relevant comparators be selected in a crowded therapeutic area, e.g. antidepressants?
• Are there new treatments on the horizon? What do we know about them?
• Are all comparators reimbursed in every jurisdiction?
• Is the SoC consistent across jurisdictions?
45
Creating the Base-line Period
• Calculation of the baseline period is the first step in modeling:
• How many prescriptions, and at what cost? (P x Q)
• So, how do we calculate the baseline period?
• First, we need volume of claims for all appropriate comparators
• 2 basic approaches:
• Epidemiological (literature searches)• Claims-based (IMS Brogan data)
46

4/7/2017
24
Epidemiological Approach
47
Baseline Period Population
Baseline Period Population
Provincial PopulationProvincial Population
Prevalence RatePrevalence Rate
% Meet clinical criteria
% Meet clinical criteria
Plan CoveragePlan CoverageTreatment RateTreatment Rate
Diagnosis RateDiagnosis Rate
Claims-Based Approach
48
Baseline Period Value
(both volume and cost)
Baseline Period Value
(both volume and cost)
IMS Data on comparatorsIMS Data on comparators
Percentage from indicationPercentage from indicationStandardized to allow comparisonStandardized to allow comparison
OrOr
IMS Data on comparatorsIMS Data on comparators
Baseline Period Volume x mean
PM dosing
Baseline Period Volume x mean
PM dosing

4/7/2017
25
Changes in the Market
• Regardless of whether a claims-based or epidemiological approach is used, the subsequent years of the model will be based on the baseline period and :
• Anticipated growth rate (requires assumptions);
• Market penetration of the new drug* (requires assumptions);
• Displacement rates from existing treatment options* (requires assumptions);
• Changes in market composition (e.g. genericization, new entrants), (requires assumptions).
• *Data available from company market research department.
49
Changes in the Market – Cont’d.
• New drug takes its market from somewhere.• Market research department will provide information
on:
• Total market share attributable to new drug;• Displacement rates for each comparator, i.e. percentage of
each comparator’s market that will be captured.
• Total market share is likely to increase over time.• Consider possibility of market expansion: e.g. oral
RA treatment.
50

4/7/2017
26
Example of Market Calculations
51
Best Practices
• Lots of user inputs;
• Explain what is happening in each calculation;
• Justify assumptions with adequate sources;
• Include all relevant comparators;
• Consider perspective and include all relevant costs
52

4/7/2017
27
Quality Assurance
• Challenges to efficiently building a good model are many:• Reimbursement of comparators may vary by plan;
• Market capture and displacement is almost always wrong;
• Fees/mark-ups/co-pays can be structured differently in different jurisdictions;
• Many drugs have multiple indications, and indication-specific information may not be available;
• Prices are not transparent on any formulary;
• Many assumptions incorporated, so many sensitivity analyses are required.
53
Strategic Implications
• Negotiations are to be expected.
• High budget impact is a serious obstacle to listing, but
• Expenditure caps are sometimes used to provide payer certainty.
• The cap is likely to be based on the budget impact.
54
4/7/2017
28
Case Examples
55
• So now that you understand the concept of value…
• Zaxine
• Sovaldi
• Esbriet
Lessons for New Market Access Professionals
56
• Identify your place in therapy• At least know where the best value lies
(subgroup, disease severity, line of treatment), even if you can’t limit your request to that
• Know your data and know its limits• Be the bearer of bad news

4/7/2017
29
57