hsbc global asset management china research field trip ... · hsbc global asset management china...
TRANSCRIPT

For Professional Investors only. Not for further distribution.
HSBC Global Asset Management
China Research Field Trip: China in Transition
13 October 2015
Presented by:
Bill Maldonado, Chief Investment Officer, Asia-Pacific and Strategy Chief Investment Officer, Equities
2 For Professional Investors only. Not for further distribution.
Content page
China macro: What’s happened and where we are now
Looking ahead: Where are the investment opportunities?
The way forward: Implications for asset management
2015
F 2020
F

What’s happened and where we are now

4 For Professional Investors only. Not for further distribution.
China in transition: from rapid growth to “new normal”
Note: Li Keqiang index is an index tracking growth in railway cargo, power consumption and total social financing (TSF)/bank lending
Source: CEIC, HSBC Global Asset Management, data at of June 2015.
China’s slower economic growth reflects both cyclical
and structural factors Industrial activity showed signs of growth stabilisation, but
economic momentum remained weak
0
2
4
6
8
10
12
14
16
1Q00 1Q02 1Q04 1Q06 1Q08 1Q10 1Q12 1Q14
%
QoQ, sa, annualised YoY
5
6
7
8
9
10
11
12
13
14
0
5
10
15
20
25
30
01/08 01/09 01/10 01/11 01/12 01/13 01/14 01/15
% yoyLi Keqiang index*, lhs
Industrial production (% yoy),lhs
Real GDP growth (% yoy),rhs
The Chinese economy is entering a “new normal” phase after decades of rapid expansion, with a focus on
structural reforms and quality of growth
We expect China’s real GDP growth to slow to 6-7% over the next 3-5 years from about 7% currently
Efforts to address debt overhang and overcapacity will likely weigh on the medium-term growth outlook
While economic restructuring should bring long-term gains, there will be short-term pains such as greater
financial market volatility during this transition

5 For Professional Investors only. Not for further distribution.
China’s economy today: more domestic demand and consumption driven
Contribution of net exports to China’s economic growth has declined post global financial crisis
Authorities are committed to moving the economy away from credit-fuelled, investment-driven and resources-
intensive growth model toward a more balanced and sustainable one
There has been internal economic re-balancing with consumption contributing more to GDP growth in 2014/H1
2015 amid weakness in investment
Source: CEIC, HSBC Global Asset Management, data as of September 2015.
The share of household consumption has edged up while
that of investment has peaked off
Consumption has slowed but been relatively resilient
than investment and external trade
-10
0
10
20
30
40
50
60
1990 1994 1998 2002 2006 2010 2014
% Household consumption
Gross capital formation
Net exports
Government consumption
-10
-5
0
5
10
15
20
1991 1994 1997 2000 2003 2006 2009 2012 2015(1H)
Net exports (ppt)
Investment (ppt)
Consumption (percentage points; ppt)
GDP growth (%, yoy)

6 For Professional Investors only. Not for further distribution.
Demographic challenges
China has witnessed a demographic transition and changes in the labour market dynamics, as evidenced by a
mismatch of skills as well as labour shortages and rising wages for unskilled workers
China faces the demographic challenges as its population is ageing and the size of the labor force has peaked off
As a result, the government has started to focus on social financing and safety nets, as well as healthcare reform
Source: UN World Population Prospects (the 2014 revision), Bloomberg, HSBC Global Asset Management, data as of September 2015.
Population is ageing and working-age population has
peaked off
Unit labour costs (OECD competitiveness indicator)
0
50
100
150
200
250
300
1995 1998 2001 2004 2007 2010 2013
1995=100
China India
Indonesia Korea
Brazil
0
2
4
6
8
10
12
14
0
100
200
300
400
500
600
700
800
900
1000
1950 1960 1970 1980 1990 2000 2010
% Million persons
Working-age population*,lhs
Old-age dependencyratio**, rhs

7 For Professional Investors only. Not for further distribution.
Headwinds from high leverage and capital misallocation
A sharp increase in domestic investment and production capacity fuelled by debt and cheap credit, as well as
misallocation of capital has created excess capacity
The trend in productivity of capital has deteriorated
Lower growth in productivity of capital and labour has contributed to slowing total factor productivity growth
Note: simplistically, ICOR measures additional capital required to increase one unit of output (1% of GDP growth)
Source: UN World Population Prospects (the 2014 revision), Bloomberg, HSBC Global Asset Management, data as of September 2015.
Slowing productivity growth Rising leverage and declining productivity of capital
0
1
2
3
4
5
6
7
0
50
100
150
200
250
2002 2004 2006 2008 2010 2012 2014
%
TSF % GDP, lhs
Incremental capital outputratio, rhs
-10
-5
0
5
10
15
20
1990 1993 1996 1999 2002 2005 2008 2011 2014
% yoy
Total factor productivity (TFP)
Labour productivity

8 For Professional Investors only. Not for further distribution.
Increasing use of RMB in international transactions
China has accelerated capital market opening-up to
foster RMB internationalisation and deepen the
offshore market
This has been facilitate by China’s growing weight in
global trade, the size of its economy and its role as the
world’s largest creditors
Source: CEIC, HSBC Global Asset Management, data as of July 2015.
RMB deposits in selected offshore markets
CNH bond issuance in Hong Kong increased significantly
Fast development in offshore CNH market
10.0 12.0 16.0 35.8
107.9 112.2 116.6
197.0
0
50
100
150
200
250
2007 2008 2009 2010 2011 2012 2013 2014
CNY bn
New CNH bond issuance in Hong Kong
0
200
400
600
800
1,000
1,200
0
2,000
4,000
6,000
8,000
10,000
12,000
14,000
16,000
18,000
2004 2006 2008 2010 2012 2014
CNY bn CNY bn
Cross-border RMBtrade settlement(accumulated), lhs
RMB deposits inHong Kong, rhs
RMB CDsoutstanding in HongKong, rhs
0
200
400
600
800
1,000
1,200
0
50
100
150
200
250
300
350
400
01/05 01/07 01/09 01/11 01/13 01/15
RMBbn RMBbn
Singapore, lhs
Taiwan, lhs
Hong Kong, rhs

9 For Professional Investors only. Not for further distribution.
Potential to include the RMB in the IMF’s SDR
To meet a key criterion for the RMB’s SDR inclusion, that the RMB is “freely usable” in international capital transactions, China needs to accelerate capital account liberalisation, FX regime reform and domestic financial reforms
An inclusion in the SDR may be seen as a symbolic milestone in China's emergence as a key player in the global financial system, and an important step forward in RMB internationalisation (promoting the role of the RMB as a reserve currency)
Note: SWIFT – Society for Worldwide Interbank Financial Telecommunication
Source: IMF, SWIFT, HSBC Global Asset Management, data at of March 2015.
China is one of the largest exporters of goods and
services in the world
The CNY is the world’s 5th most used currency in global
payments processed by SWITF
0.4 0.5 0.6 0.7 0.8 0.9 0.9 1.3 1.4 1.8 1.9 2.2 2.7
7.9 28.3
44.6
0 10 20 30 40 50
DKKZARPLNNOKSEKTHBSGDHKDCHFAUDCADCNYJPYGBPEURUSD
%
Use in SWIFT transaction (December 2014)
-
500
1,000
1,500
2,000
2,500
US China Germany Japan France UK
USDbn
2010-14 average
10 For Professional Investors only. Not for further distribution.
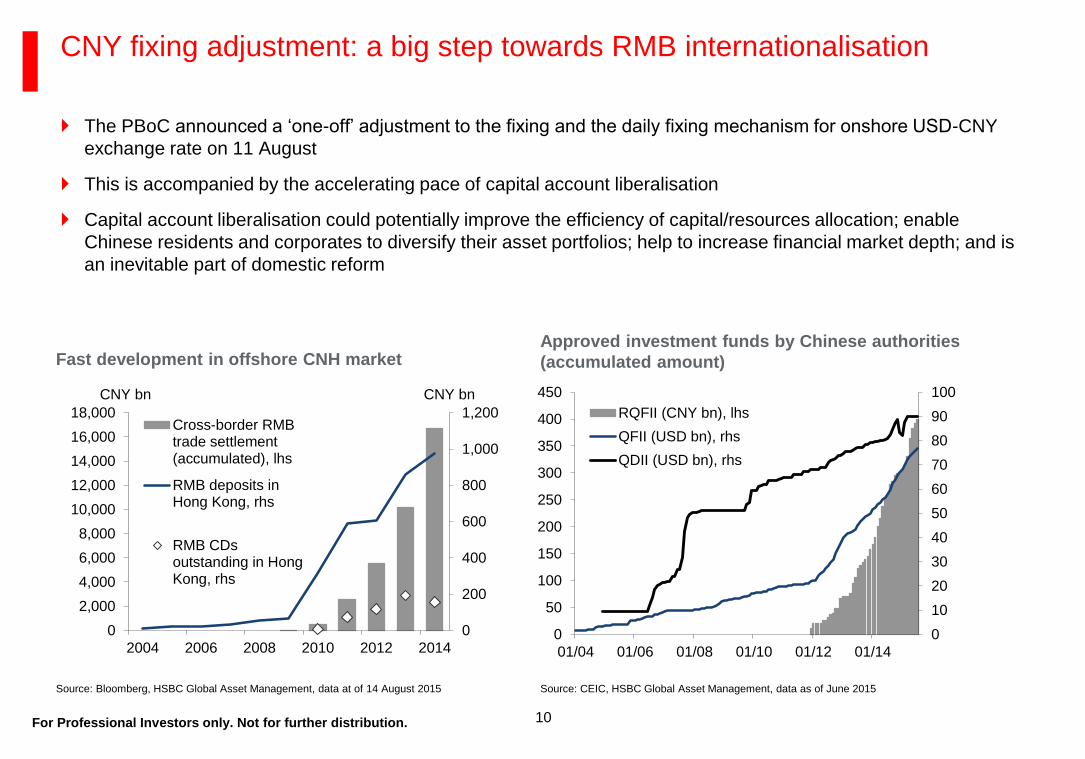
The PBoC announced a ‘one-off’ adjustment to the fixing and the daily fixing mechanism for onshore USD-CNY
exchange rate on 11 August
This is accompanied by the accelerating pace of capital account liberalisation
Capital account liberalisation could potentially improve the efficiency of capital/resources allocation; enable
Chinese residents and corporates to diversify their asset portfolios; help to increase financial market depth; and is
an inevitable part of domestic reform
CNY fixing adjustment: a big step towards RMB internationalisation
Source: Bloomberg, HSBC Global Asset Management, data at of 14 August 2015
Fast development in offshore CNH market
0
200
400
600
800
1,000
1,200
0
2,000
4,000
6,000
8,000
10,000
12,000
14,000
16,000
18,000
2004 2006 2008 2010 2012 2014
CNY bn CNY bn
Cross-border RMBtrade settlement(accumulated), lhs
RMB deposits inHong Kong, rhs
RMB CDsoutstanding in HongKong, rhs
Approved investment funds by Chinese authorities
(accumulated amount)
0
10
20
30
40
50
60
70
80
90
100
0
50
100
150
200
250
300
350
400
450
01/04 01/06 01/08 01/10 01/12 01/14
RQFII (CNY bn), lhs
QFII (USD bn), rhs
QDII (USD bn), rhs
Source: CEIC, HSBC Global Asset Management, data as of June 2015

11 For Professional Investors only. Not for further distribution.
Despite recent concerns over the recent adjustment, the RMB has been relatively strong compared to other
currencies
RMB currency has been incredibly strong
60
70
80
90
100
110
120
130
140
60
70
80
90
100
110
120
130
140
2010 2011 2012 2013 2014 2015
Jan 2010 = 100Jan 2010 = 100
Australia Brazil China Euro area JapanKorea Switzerland United Kingdom United States
Trade weighted currencies - Real broad
Source: BIS, HSBC Global Research

12 For Professional Investors only. Not for further distribution.
Explosive e-commerce growth has driven a new consumption culture
In China’s e-commerce 12th Five-Year Plan (2011-2015), the government unveiled policies to make China a global e-commerce leader, in line with China’s transition from an investment-led growth model towards a more consumption-driven one
The rise of on-line transactions and the increasingly important roles of social media and mobile devices are re-shaping the ways Chinese consumers purchase goods and services
The number of Internet users in China has grown rapidly, although the Internet penetration is still below 50% (48.8% as of June-2015 in aggregate for both urban and rural areas)
Source: CEIC, HSBC Global Asset Management, data as of September 2015.
The Internet market has grown rapidly The e-commerce market is becoming an increasingly
important channel for consumption
0
2
4
6
8
10
12
0.0
0.5
1.0
1.5
2.0
2.5
3.0
2007 2008 2009 2010 2011 2012 2013 2014
CNY trn CNY trn
E-commerce (retail sales),rhs
E-commerce (B2B), lhs
0
10
20
30
40
50
60
70
0
100
200
300
400
500
600
700
800
2006 2008 2010 2012 2014
% Million persons
No ofInternet user(urban), lhs
No ofInternet user(rural), lhs
Internetpenetrationrate (rural),rhs
Internetpenetrationrate (urban),rhs

13 For Professional Investors only. Not for further distribution.
Effective reform implementation is key to unleash China’s growth potential Area Key initiatives and goals
Fiscal reform ** Introduction of a unified and comprehensive budgetary system consisting of both the general budget and previous extra-budget items
** To improve the transparency with mandatory public disclosure of government budgets
** Municipal bonds will provide local governments with more transparent, stable, lower-cost and longer-maturity sources of financing and
reduce their reliance on borrowing from bank loans and shadow banking credit
** To redistribute fiscal revenues and expenditures between central and local governments, to improve local governments' fiscal
sustainability
** To strengthening management and supervision of local government debt and addressing risks associated with LGFVs
** To improve the tax system
Financial reform ** Lending rate has been deregulated. Deposit insurance scheme has been launched, paving way for the liberalization of deposit rate
** A deposit insurance scheme will help reduce the risk of a systemic bank run should one bank faces liquidity or solvency problems
** Crucial to substantially raise the efficiency of credit allocation and the returns to investment, and to help ensure credit risk is
appropriately priced.
** Expect more market-based pricing of credit and the diversification of credit channels, via the development of a multi-layer onshore capital
market, including a municipal bond market
** To accelerate CNY capital account converbility and internationalisation
** Approval for private investors to establish commercial banks
SOE reform ** To promote mixed ownership to improve SOE efficiency and corporate governance, and to also attract additional capital
** To increase competition in some SOE-monopolistic sectors via private sector participation
** To allow non-public capital to take equity stakes in public sector-led investment projects
** To improve the state-owned asset management system
** To increase dividend payout ratio
Deregulation ** Market-based resources pricing to improve the efficiency of resource allocation as well as promote energy conservation and renewable
resources
** To lower entry barriers for private companies and foreign investment
** To simplify investment approval procedures for private investors
Hukou reform ** To transfer qualified rural migrant population to urban residents through a gradual process and grant them the access to the urban
housing and social security system
** Hukou reform and rural land reform are key to the new urbanisation, which should help release the effective demand of migrators for
property, boost their consumption, and sustain job creation
** According to the urbanisation reform plan unveiled at end-July, rural people no longer need to give up their property rights to rural land
and collective undertakings when obtaining urban Hukou
** The State Council’s draft residence permit regulation will allow people to obtain residence permits in the place of their residence to
access to basic social security/welfare services
Land reform ** Aims to improve the land-use efficiency and to protect farmers' interest in land transaction by giving farmers more rights over collectively
owned rural land…
** ... and to increase farmers' income, which will effectively reduce the urban-rural income gap
One child policy ** Incremental population growth to help slow the speed of ageing of the economy

Where are the investment opportunities?

15 For Professional Investors only. Not for further distribution.
The easing in China’s monetary polices has been driving the short-end rate curve lower, which provides a positive backdrop for equities
Meanwhile, the local government debt swap scheme marks a major step in local government debt reform and restructuring. It could lower funding costs and interest burden for local governments, extend their debt maturities, and reduce their financing/liquidity risk in the near term
Monetary policies and lower rates provide support for equity market
Source: Bloomberg, HSBC Global Asset Management, data as of as of September 2015
China interbank rates
0
1
2
3
4
5
6
7
8
9
10
1/11 1/12 1/13 1/14 1/15
%
7-day repo 1-year IRS (7-day repo) 3-month Shibor 7-day reverse repo

16 For Professional Investors only. Not for further distribution.
Since last November, the benchmark lending rate in China has been cut by 115 bps and RRR (the reserve requirement ratio) for major commercial banks were down by 150 bps in an attempt to support growth and lower real financing costs
Real interest rate remains high in China while it is close to zero or negative in key developed markets such as the US, Eurozone and Japan
Ample room for further rate cuts, with CPI at only 2% and PPI at -5.9% in August
Monetary policies and lower rates provide support for equity market
Note: Data using local 3 month interbank rates minus local CPI inflation as a proxy for real interest rate
Source: HSBC Global Asset Management, Bloomberg, data as of September 2015
-5.0
-4.0
-3.0
-2.0
-1.0
0.0
1.0
2.0
3.0
4.0
5.0
11/06 12/07 1/09 2/10 3/11 4/12 5/13 6/14 7/15
US Real China Real Eurozone Real Japan Real
China’s real interest rate vs Japan, Eurozone and the US

17 For Professional Investors only. Not for further distribution.
At 18%, the reserve requirement ratio (RRR) of China remains one of the highest in the world, even after the RRR cut in August 2015
There remains plenty of room for RRR cut to ensure sufficient liquidity and credit support for the economy, lower corporate funding costs, and stabilise economic growth and financial markets
Plenty of room for RRR cut
Source: CICC, data as of August 2015
RRR (%) Note
UK N.A. No reserve requirements
Canada N.A. No reserve requirements
Germany 1.0 For liabilities with maturity up to two years; with
various deductions
France 1.0 For liabilities with maturity up to two years; with
various deductions
Italy 1.0 For liabilities with maturity up to two years; with
various deductions
Japan 1.2 For time deposits more than 2.5 trillion yen
Korea 2.0 For Time deposits, installment savings, mutual
installments, housing installments, CDs
US 10.0 For net transaction accounts more than $103.6m
China 18.0 For large banks
Brazil 20.0 Demand deposits 45%; time deposits 20%
1.0 1.0 1.0 1.2 2.0
10.0
18.0
20.0
0
5
10
15
20
25
Germany France Italy Japan Korea US China Brazil
Reserve requirement ratio (%)

18 For Professional Investors only. Not for further distribution.
A significant proportion of market cap is made up by SOEs in China
By aiming to enhance efficiency and control cost, SOE reform will potentially improve ROE of SOEs and drive market re-rating
In the past 5 years, state owned enterprises (SOEs) underperformed privately owned enterprises (POEs) by 9%; However, SOEs have outperformed POEs by 8% in the past 12 months
SOE reform could drive an improvement in ROE and re-rating
Note:
Any forecast, projection or target contained in this presentation is for information purpose only and is not guaranteed in any way. HSBC accepts no liability for any failure to meet such forecasts, projections or targets. For illustrative
purpose only. Investment involves risks. Past performance is not indicative of future performance
Source: HSBC Global Research, data as of August 2015
Asset injection (only 1/3 of SOE assets are listed; 2/3 will likely
be injected eventually)
Asset disposal of non-performing assets
Mixed ownership structure (private enterprises becoming major
investors and providing new incentives to the SOE employees)
M&As to address and tackle overcapacity
Group listing
Deleverage
Increase dividend payout ratio
SOEs have outperformed POEs in the past year SOE reform
13%
16%
-3%
-1%
9%
11%
-4% -3%
4%
8%
5%
1%
-5%
0%
5%
10%
15%
20%
5yr CAGR 3yr CAGR 1yr CAGR YTD CAGR
POE POE (excl Tencent) SOE
19 For Professional Investors only. Not for further distribution.
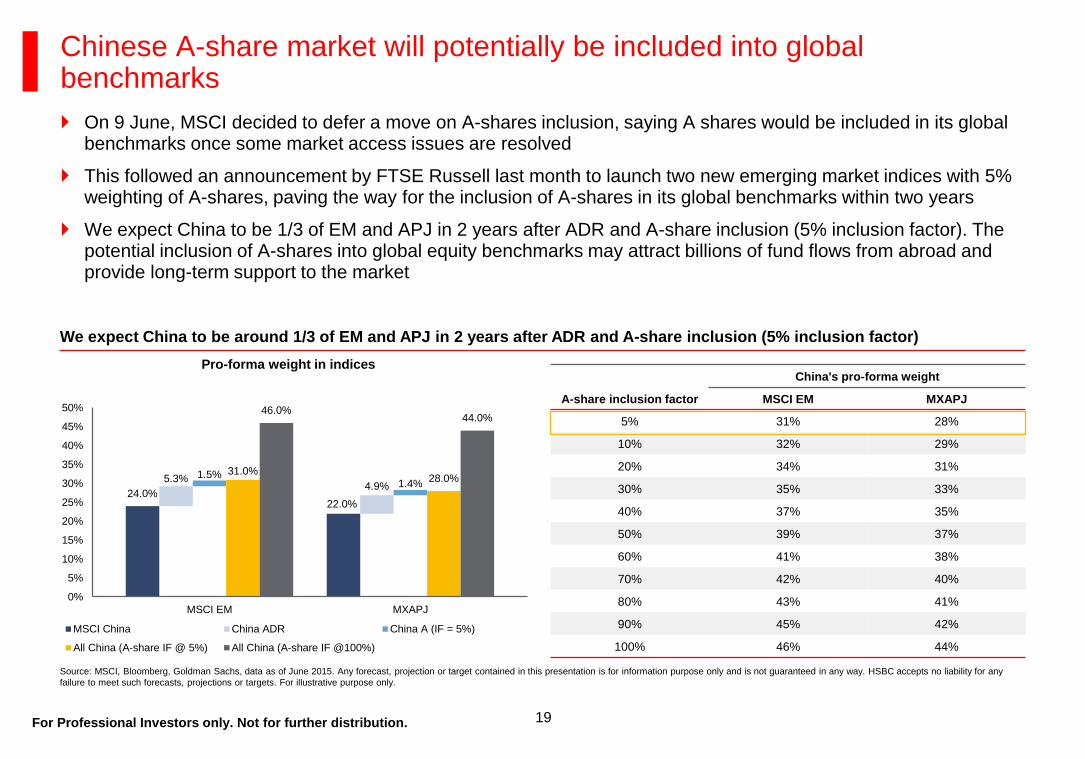
Chinese A-share market will potentially be included into global benchmarks On 9 June, MSCI decided to defer a move on A-shares inclusion, saying A shares would be included in its global
benchmarks once some market access issues are resolved
This followed an announcement by FTSE Russell last month to launch two new emerging market indices with 5% weighting of A-shares, paving the way for the inclusion of A-shares in its global benchmarks within two years
We expect China to be 1/3 of EM and APJ in 2 years after ADR and A-share inclusion (5% inclusion factor). The potential inclusion of A-shares into global equity benchmarks may attract billions of fund flows from abroad and provide long-term support to the market
Source: MSCI, Bloomberg, Goldman Sachs, data as of June 2015. Any forecast, projection or target contained in this presentation is for information purpose only and is not guaranteed in any way. HSBC accepts no liability for any
failure to meet such forecasts, projections or targets. For illustrative purpose only.
We expect China to be around 1/3 of EM and APJ in 2 years after ADR and A-share inclusion (5% inclusion factor)
Pro-forma weight in indices
24.0% 22.0%
5.3% 4.9%
1.5% 1.4%
31.0% 28.0%
46.0% 44.0%
0%
5%
10%
15%
20%
25%
30%
35%
40%
45%
50%
MSCI EM MXAPJ
MSCI China China ADR China A (IF = 5%)
All China (A-share IF @ 5%) All China (A-share IF @100%)
China's pro-forma weight
A-share inclusion factor MSCI EM MXAPJ
5% 31% 28%
10% 32% 29%
20% 34% 31%
30% 35% 33%
40% 37% 35%
50% 39% 37%
60% 41% 38%
70% 42% 40%
80% 43% 41%
90% 45% 42%
100% 46% 44%

20 For Professional Investors only. Not for further distribution.
The USD40bn silk road fund and USD100bn Asia infra investment bank may likely bring an estimation of
USD45bn/annum incremental overseas revenue impact to Chinese E&Cs, or about 2-9% 2016 EPS accretion
China plans to construct 34,600km of HSR for itself and 34,700km for other countries (37.2% of the global total
plan). In particular, the One Belt One Road program will involve HSR construction of 26,300km. As such, Chinese
HSR companies could account for 74.2% (69,400km) of the global total plan and their overseas revenue could
reach as much as 50% of their total revenue
The global high speed rail and infrastructure boom Impact of “One Belt, One Road” programme
Source: Citi Research, Xinhua, United Nations, data as of December 2014
Map of the New Silk Road Plan
21 For Professional Investors only. Not for further distribution.
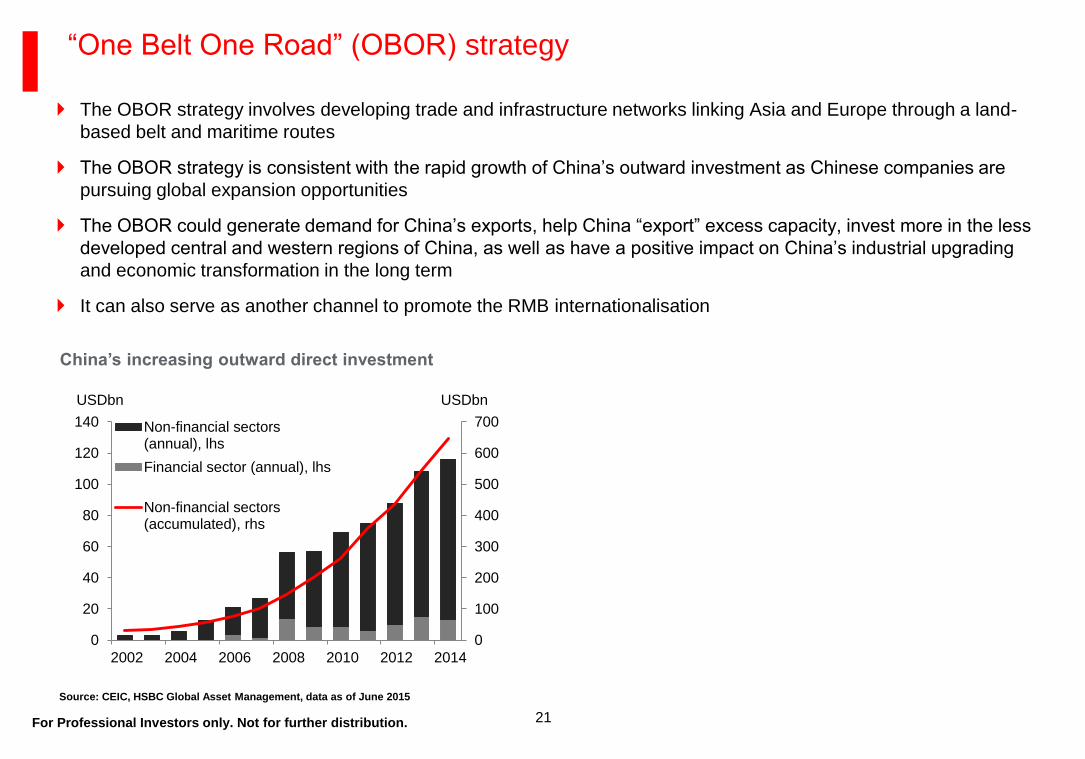
“One Belt One Road” (OBOR) strategy
The OBOR strategy involves developing trade and infrastructure networks linking Asia and Europe through a land-
based belt and maritime routes
The OBOR strategy is consistent with the rapid growth of China’s outward investment as Chinese companies are
pursuing global expansion opportunities
The OBOR could generate demand for China’s exports, help China “export” excess capacity, invest more in the less
developed central and western regions of China, as well as have a positive impact on China’s industrial upgrading
and economic transformation in the long term
It can also serve as another channel to promote the RMB internationalisation
Source: CEIC, HSBC Global Asset Management, data as of June 2015
China’s increasing outward direct investment
0
100
200
300
400
500
600
700
0
20
40
60
80
100
120
140
2002 2004 2006 2008 2010 2012 2014
USDbn USDbn
Non-financial sectors(annual), lhs
Financial sector (annual), lhs
Non-financial sectors(accumulated), rhs

22 For Professional Investors only. Not for further distribution.
The Asia Infrastructure Investment Bank (AIIB) and Silk Road Fund (SRF) may create around USD330-350bn of
incremental investment altogether, which can translate into an average annual spending of USD45bn assuming a
8-year investment cycle
This represents ~1/3 of China’s overseas contract business
Railway equipment and E&C sectors which have stronger overseas franchise, larger overseas exposure and
higher absolute margin levels, stand to benefit
Positive impact of “One Belt, One Road” programme
Source: Goldman Sachs Global investment Research, Gao Hua Securities Research, data as of December 2014. For illustrative purpose only and does not constitute investment advice
Sensitivity analysis on key assumptions of AIIB and SRF

23 For Professional Investors only. Not for further distribution.
International asset managers will be allowed to sell their Hong Kong-registered fund products directly to Chinese
retail investors for the first time and likewise, China-registered fund products will be made available to international
investors as well
Mutual funds domiciled in Hong Kong or mainland China with at least RMB200 million AUM (around USD32 million)
and established for more than one year can apply for authorisation starting from July 2015
A diversification opportunity for local investors as they have more channel to invest in overseas securities like
bonds, fixed income and multi-asset products. Overseas investors have more opportunities to invest in local assets
The financial sector, namely asset managers, will likely to benefit from this measure which aims to further open
China's capital market
Mutual recognition of funds – a milestone of financial market liberalisation
Source: Bloomberg, Wind, CICC, data as of June 2015
About 60% of eligible funds in Hong Kong under MRF
mechanism are equity funds Over 50% of all eligible funds are focused on China/Hong Kong
Equity 61%
Mixed allocation
20%
Fixed income
17%
Money market
2%
Hong Kong 33%
China 18%
Global 15%
Asia Pacific region 14%
Japan 1%
European region
1%
US 1%
Others 17%

Implications for asset management

25 For Professional Investors only. Not for further distribution.
The volatility of Chinese equity remains heightened in Q3 amid weak China macro data, concerns over reform prospects, and global de-risking
FX also adds another layer of complexity for Chinese stocks after the one-off devaluation in mid August
The weakness in the economy is broadly in line with our expectations. We continue to expect downward earnings revision in selective sectors like autos and consumer staples due to margins compression and slower than expected top-line growth
Heightened volatility in Chinese equity markets
Source: Bloomberg, data as of 30 September 2015. Any forecast, projection or target contained in this presentation is for information purposes only and is not guaranteed in anyway. HSBC accepts no liability for any failure to meet
such forecasts, projections or targets. Investment involves risks. Past performance is not indicative of future performance.
Performance of Chinese equities in 2015
55
60
65
70
75
80
85
90
2,900
3,400
3,900
4,400
4,900
5,400
1/15 2/15 3/15 4/15 5/15 6/15 7/15 8/15 9/15
MSCI China CSI 300
CSI 300 (LHS) MSCI China (RHS)

26 For Professional Investors only. Not for further distribution.
Market inefficiencies provide opportunities for stock pickers
In the short-term, equity markets are inefficient; sector and stock valuation anomalies tend to correct over the longer-term
Concentrating overweight positions within profitable sectors and stocks at below-average valuations and ignoring mainstream ‘fairly valued’ stocks and associated market chatter will enhance returns
As stock pickers we believe that volatility affords us an opportunity to uncover mispriced stocks that
could potentially deliver long term returns

27 For Professional Investors only. Not for further distribution.
Compared to 1990s cycle, China currently has:
– Better debt profile – large part of the debt build-up has been in domestic instead of external
– lower inflation – current benign inflation offers flexibility for PBoC to maintain easing bias
– Stronger current account surplus
– Larger FX reserves
China’s economic conditions more stable than during the 1990s cycle…
Source: Morgan Stanley, data as of August 2015.
China’s current macro data vs 1996/97
1996 1997 2015 latest
External debt (% of GDP) 14 14 8
CPI (yoy %) 8.3 2.8 1.6
Current account balance
(% of GDP) 0.8 3.8 2.8
FX reserve (% of GDP) 12 14 34
28 For Professional Investors only. Not for further distribution.
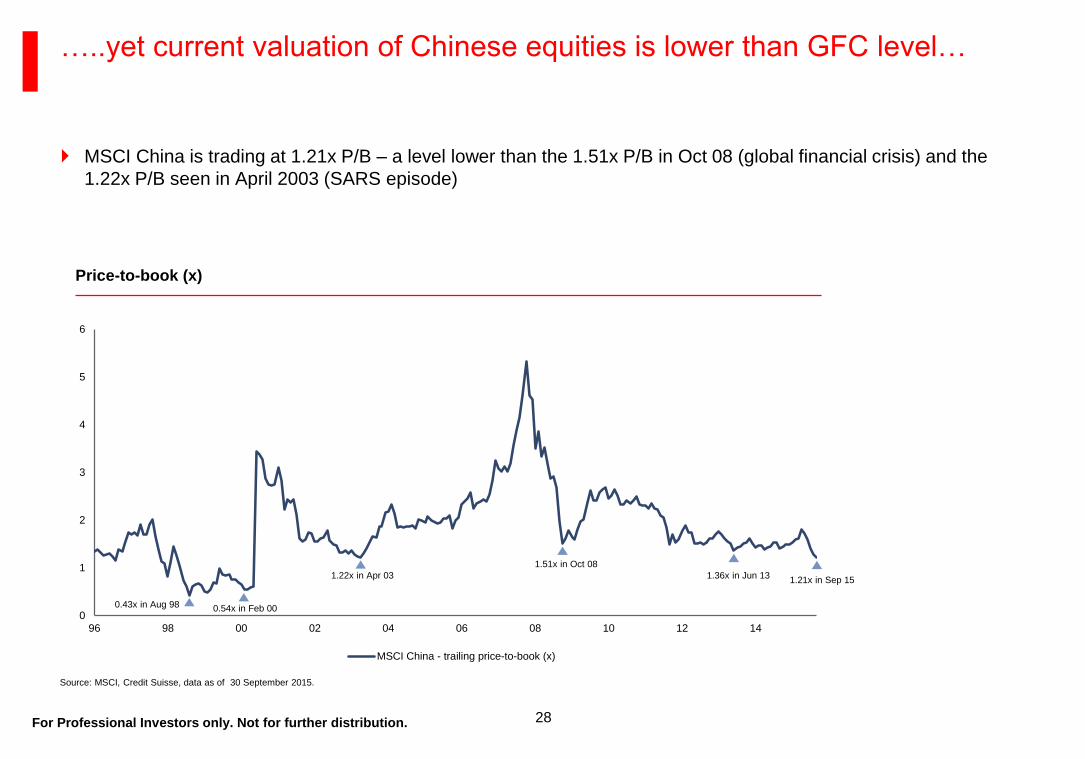
MSCI China is trading at 1.21x P/B – a level lower than the 1.51x P/B in Oct 08 (global financial crisis) and the
1.22x P/B seen in April 2003 (SARS episode)
…..yet current valuation of Chinese equities is lower than GFC level…
Source: MSCI, Credit Suisse, data as of 30 September 2015.
Price-to-book (x)
0
1
2
3
4
5
6
96 98 00 02 04 06 08 10 12 14
MSCI China - trailing price-to-book (x)
0.43x in Aug 98 0.54x in Feb 00
1.22x in Apr 03
1.51x in Oct 08
1.36x in Jun 13 1.21x in Sep 15

29 For Professional Investors only. Not for further distribution.
MSCI China is trading at 9.1x forward P/E and 1.2x P/B vs 10-year average of 12.5x and 2.1x
Valuations for Chinese equities are attractive compared to history
…and attractive versus history
Source: Bloomberg. Data as of end September 2015
Forward price-to-earnings (x) Price-to-book (x)
0
5
10
15
20
25
30
10/05 10/06 10/07 10/08 10/09 10/10 9/11 9/12 9/13 9/14 9/15
MSCI China
Average: 12.5x
+1 stdev: 16.3x
-1 stdev: 8.8x
0
1
2
3
4
5
6
10/05 10/06 10/07 10/08 10/09 10/10 9/11 9/12 9/13 9/14 9/15
MSCI China
Average: 2.1x
+1 stdev: 2.8x
-1 stdev: 1.4x
30 For Professional Investors only. Not for further distribution.
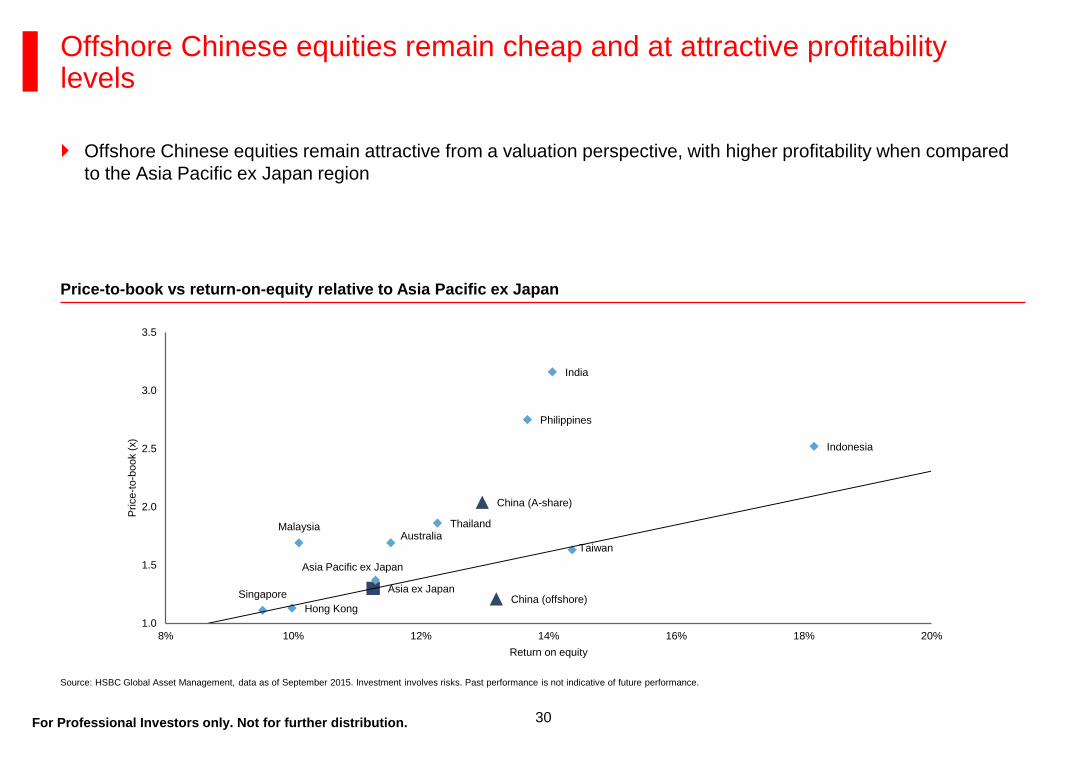
Offshore Chinese equities remain attractive from a valuation perspective, with higher profitability when compared
to the Asia Pacific ex Japan region
Offshore Chinese equities remain cheap and at attractive profitability levels
Source: HSBC Global Asset Management, data as of September 2015. Investment involves risks. Past performance is not indicative of future performance.
Price-to-book vs return-on-equity relative to Asia Pacific ex Japan
Asia ex Japan
Asia Pacific ex Japan
China (offshore)
China (A-share)
India
Indonesia
Hong Kong
Singapore
Malaysia Australia
Taiwan
Thailand
Philippines
1.0
1.5
2.0
2.5
3.0
3.5
8% 10% 12% 14% 16% 18% 20%
Price-t
o-b
ook (
x)
Return on equity

31 For Professional Investors only. Not for further distribution.
Offshore RMB bond market often offers higher yields
Offshore RMB bonds are on average yielding 5.0%, while average duration is only 2.7 years
Bonds denominated in CNH tend to have higher yields, compared to bonds in other major currencies such as USD
and EUR, even when comparing the same issuer with very similar tenor
Same bond in different currencies Yield (%) on 24 Aug 2015
Total 3.75% 09/24/2018 (CNH) 4.07
Total 2.125% 08/10/2018 (USD) 1.69
Total 4.875% 01/28/2019 (EUR) 0.28
Same bond in different currencies Yield (%) on 24 Aug 2015
BPLN 3.95% 10/08/2018 (CNH) 4.63
BPLN 2.241% 09/26/2018 (USD) 1.89
BPLN 2.994% 02/18/2019 (EUR) 0.56
Source: HSBC Global Asset Management; Bloomberg, data as at 28 Jan 2015. The data presented is for information and illustration purposes only and is not intended as an offer or solicitation for the purchase or sale of any financial
instrument or investment strategy
Company 1: Total (bond issued on 12 Sep 2013)
Company 2: BPLN (bond issued on 2 Oct 2013)

32
Yields in the offshore market are attractive on a risk adjusted basis
Source: HSBC Global Asset Management; Bloomberg, data as of 31 August 2015
0.0
1.0
2.0
3.0
4.0
5.0
6.0
Dec-10 Jun-11 Dec-11 Jun-12 Dec-12 Jun-13 Dec-13 Jun-14 Dec-14 Jun-15
HSBC Asian US Dollar Bond Index BofA Merrill Lynch Euro Corporate Index BofA Merrill Lynch US Corporate Index HSBC Offshore RMB Bond Index
0.0
0.5
1.0
1.5
2.0
Dec-10 Jun-11 Dec-11 Jun-12 Dec-12 Jun-13 Dec-13 Jun-14 Dec-14 Jun-15
HSBC Asian US Dollar Bond Index BofA Merrill Lynch Euro Corporate Index BofA Merrill Lynch US Corporate Index HSBC Offshore RMB Bond Index
For Professional Investors only. Not for further distribution.
Duration of the market is only around 2.7 years
Therefore the duration-adjusted yield is attractive
Yield comparison – Asian hard currency bond vs offshore RMB bond (%)
Historical yield (duration adjusted)

Key risks and disclosures

34 For Professional Investors only. Not for further distribution.
Investor sentiment may be susceptible to macro concerns, including the Eurozone debt
Investor should be reminded that investment in some of the developing Asian countries may involve special
considerations and risks. Below could affect adversely the economies of such countries or the value of the
investment
Political changes
Government regulation
Social instability
Diplomatic development
Global economic development etc.
Emerging markets can be significantly more volatile than developed markets, so that the value of investments may
be subject to larger fluctuations
Currency movement and market condition may affect the value of investments
Key risks
35 For Professional Investors only. Not for further distribution.
Explanatory notes and disclaimers
The document is confidential and is supplied to you solely for your information. This document should not be reproduced or further
distributed to any person or entities, whether in whole or in part, for any purpose.
Investment involves risk and past performance is not indicative of future performance. Please refer to the offering document for further
details including the risk factors. The document has not been reviewed by the Securities and Futures Commission.
The material contained herein is not intended to provide professional advice and should not be relied upon in that regard. Readers should
seek appropriate professional advice where necessary.
The opinions expressed herein should not be considered to be a recommendation by HSBC Global Asset Management (Hong Kong)
Limited to any reader of this material to buy or sell securities, commodities, currencies or other investments referred to herein. HSBC
Global Asset Management (Hong Kong) Limited, its ultimate and intermediate holding companies, subsidiaries, affiliates, clients,
directors and/or staff may, at any time, have a position in the markets referred to herein, and may buy or sell securities, currencies, or
any other financial instruments in such markets.
HSBC Global Asset Management (Hong Kong) Limited has based this document on information obtained from sources it believes to be
reliable but which it has not independently verified. HSBC Global Asset Management (Hong Kong) Limited and the HSBC Group make
no guarantees, representations or warranties and accept no responsibility or liability as to its accuracy or completeness. Information in
this report is subject to change without notice.
This presentation is intended for Professional Investors as defined in the Securities and Futures Ordinance in Hong Kong.

Appendix

37 For Professional Investors only. Not for further distribution.
HSBC Global Asset Management (Hong Kong) Limited
Address: Level 22, HSBC Main Building, 1 Queen’s Rd Central, Hong Kong
Telephone: +852 2284 1111
Facsimile: +852 2845 0226
Website: www.assetmanagement.hsbc.com/hk