hrug - linear regression with r
TRANSCRIPT

Linear Regression with R
Ed Goodwin Houston R Users Group

Recap from the last meetup• statistical learning vs. machine learning
• supervised vs. unsupervised learning
• categorical models vs. quantitative models

Linear Regression is…
• statistical learning
• supervised learning
• quantitative model

A Simple Dataset

What’s the best model for this data?
…a straight line, aka a linear model…

What’s the best fit for the line?

The line that minimizes the residual error, or point distance from the line
which is why we refer to the regression line as the least squares error regression line

We determine this with a linear regression to determine the y-intercept and the slope of the line that minimizes
the error residuals
Use the lm function in R to create linear models
A regression on one variable is known as a simple linear regression
Assumptions of Linear Models

• relationship of predictors to predicted variables is linear
• the variance of error terms is constant (homoskedastic)
• minimal to no outliers in the data (high or low y in response to x)
• minimal to no leverage points in the data (high or low x relative to the data)
• no collinearity among predictor variables • predictors are additive to reliability of model
(no interaction effects)

Linear Model Fitting

Data Analysis
Bonds dataset from “A Modern Approach to Regression with R” Sheather, Simon. 2009. https://link.springer.com/book/10.1007%2F978-0-387-09608-7
Consider the following dataset of bond prices bonds.dat = read.csv("http://www.stat.tamu.edu/~sheather/book/docs/datasets/bonds.txt", sep='\t')

Data AnalysisData analysis is the art of asking questions of the data and searching for answers.
What questions should we ask?
• Is Bid Price a function of Coupon Rate or vice versa?
• What type of relationship does Bid Price appear to have with Coupon Rate?
• Is there a formula we could use to predict Bid Price based on Coupon Rate?

Linear Model of Bond Prices as a function of Coupon Rates
• Is this line a good or bad fit with the data?
• Why or why not?
• Can we improve the model?
• How?

Know your data and know how your models work!
• Why would outliers skew the linear regression model?
• What should we do about it?
• Why do these outliers exist?
Outliers

What are the outliers?
A Flower bond is a U.S treasury bond recoverable before maturity upon payment or fulfilling a condition, if used to settle federal estate taxes. When flower bonds are surrendered in payment of taxes, and accepted as
such, that constitutes payment of those taxes for statute of limitations and statutory interest purposes.

Adjusted Bond Model• After removing the
outliers the model looks much better
• But how do you know that it’s a better model?

Evaluating Models

Evaluating the two bond models
Key measures are p-value, Residual Std Error (RSE), and R2

Residual Sum of Squares (RSS)
“In statistics, the residual sum of squares (RSS), also known as the sum of squared residuals (SSR) or the sum of squared errors of
prediction (SSE), is the sum of the squares of residuals (deviations predicted from actual empirical values of data).” Source: https://en.wikipedia.org/wiki/Residual_sum_of_squares

Multiple Regression Models

If Simple Regression Models depict a linear relationship between
two variables, what do you think Multiple Regression Models do?

Multiple Regression Models describe the relationship between a scalar variable and two or more
predictor variables

Why not just run several simple linear
regressions?

Advertising Data SetSales based on multiple types and levels of advertising spend
(TV, Radio, Newspaper)

First, let’s look at the data

Are the model assumptions intact?

Multiple Regression uses the lm function as well. Simply modify the formula by adding more variables

Analyze the Model
Why is newspaper coefficient so low?

What if we removed Newspaper from the model?
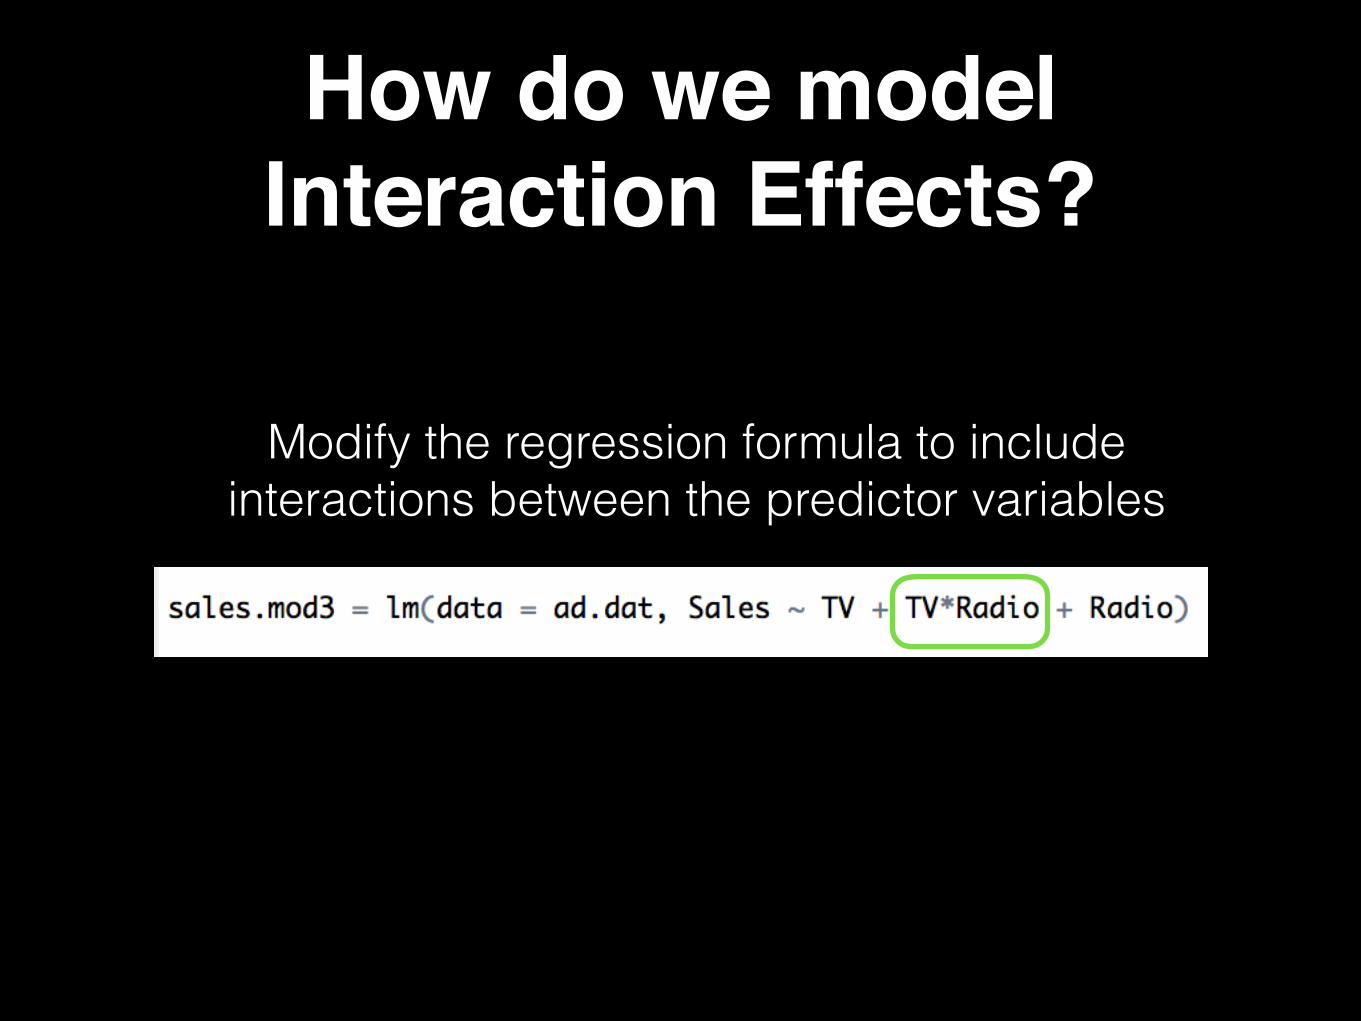
How do we model Interaction Effects?
Modify the regression formula to include interactions between the predictor variables

Does this interaction improve the model?

What about reintroducing Newspaper with interaction?

Model with Newspaper & TV interaction modeled
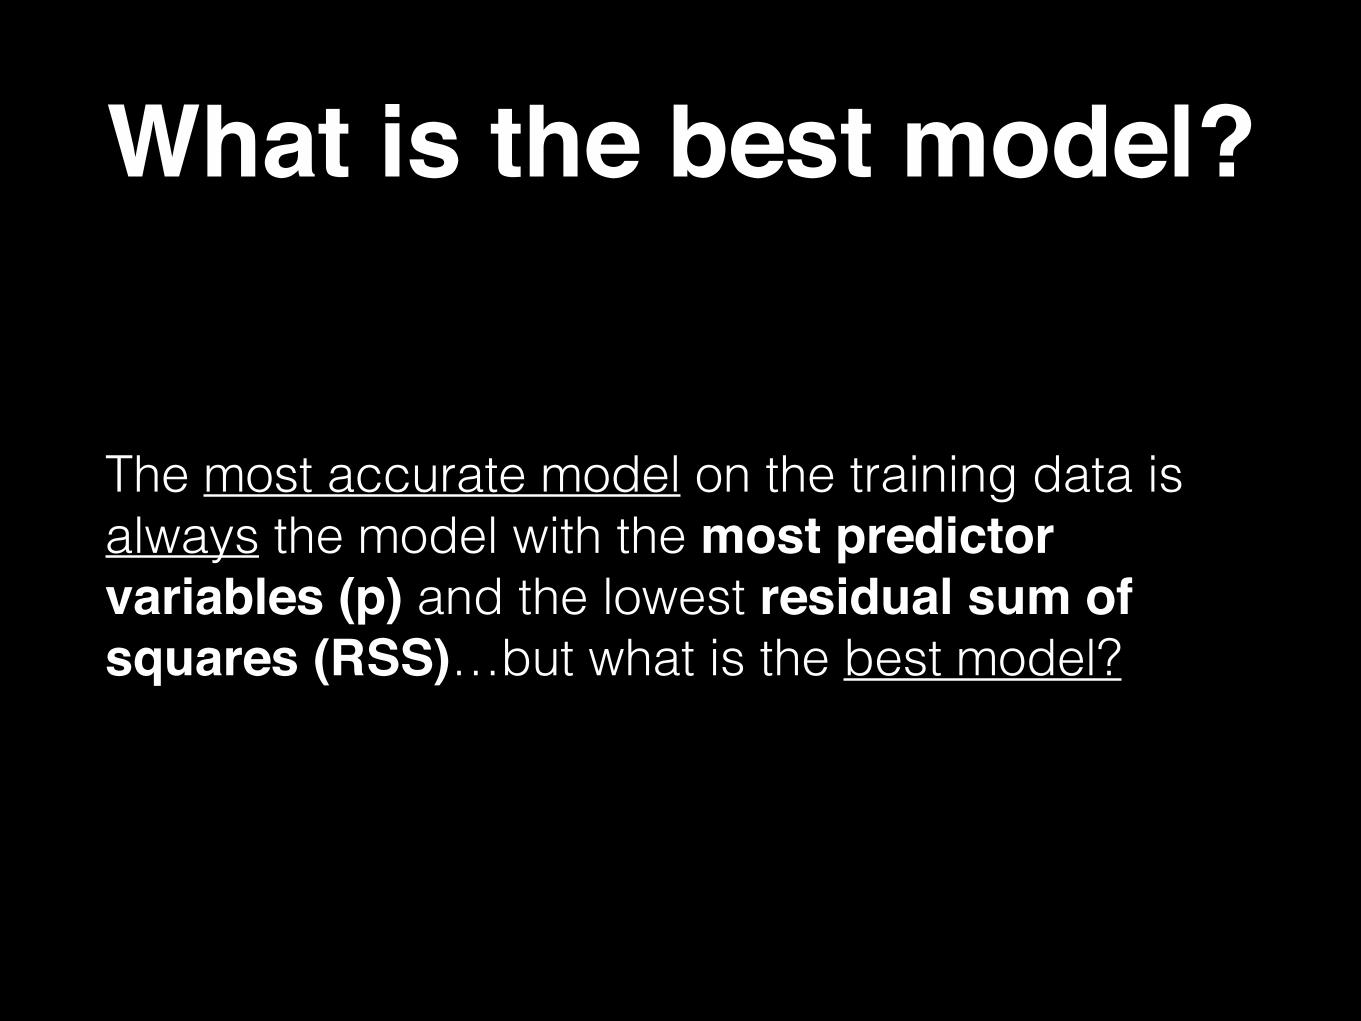
What is the best model?
The most accurate model on the training data is always the model with the most predictor variables (p) and the lowest residual sum of squares (RSS)…but what is the best model?

The best model is…
The best model is the simplest model with the most predictive power on the entire data population while staying
within your resource constraints.

Bonus: Easy and tidy with the broom package
From the broom vignette: https://cran.r-project.org/web/packages/broom/vignettes/broom.html
The broom package takes the messy output of built-in functions in R, such as lm, nls, or t.test, and turns them into tidy data frames.
This package provides three S3 methods that do three distinct kinds of tidying.• tidy: constructs a data frame that summarizes the model's statistical findings.
This includes coefficients and p-values for each term in a regression, per-cluster information in clustering applications, or per-test information for multtest functions.
• augment: add columns to the original data that was modeled. This includes predictions, residuals, and cluster assignments.
• glance: construct a concise one-row summary of the model. This typically contains values such as R2, adjusted R2, and residual standard error that are computed once for the entire model.

broom packageusing our Advertising data