hrpp 442 structures
TRANSCRIPT

Evaluating scour at marine gravity structures
HRPP
442
Richard Whitehouse, John Harris & James Sutherland
Reproduced from a paper presented at: 1st European IAHR CongressEdinburgh4 – 6 May 2010

Evaluating scour at marine gravity structures 1st European IAHR Congress, Edinburgh, 4 – 6 May 2010
2010 1 HRPP 442
EVALUATING SCOUR AT MARINE GRAVITY STRUCTURES Richard Whitehouse, John Harris, & James Sutherland HR Wallingford, Wallingford, Oxfordshire, OX10 8BA, UK Key Words Gravity base, scour, erosion Abstract This paper presents results on the analysis of scour at offshore foundations, with special reference to gravity structures. Gravity structures are used in a range of applications including oil and gas production, windfarm foundations and infrastructure protection, for example, concrete covers to pipelines. Two published empirical methods available for evaluating scour are reviewed and compared with laboratory and field data. The methods that are presented are reasonable for first order assessment although they do not represent the inclusion of skirts. In a vigorous scour environment a skirt may not prevent scour from undermining the structure and scour protection will be required. Some improvements that can be made to the predictive capabilities are outlined. INTRODUCTION AND CONTEXT Marine gravity structures are bespoke structures that rely on their own weight to keep them stable on the seabed, with pin piles or skirts to provide additional lateral resistance. Two types are usually defined including Gravity Base Structures (GBS) – usually steel – or Concrete Gravity Structures (CGS) of various heights, shapes and composite forms depending on their function. They are used in oil and gas projects, for platforms or subsea installations, for providing protection against trawl board or anchor impact (Whitehouse et al, 2010), and for windfarm foundations (Zaaijer, 2003). The use of concrete caissons is also common in civil engineering projects for bridge, breakwater and harbour construction. Effective foundation engineering requires combined understanding from structural, geotechnical and hydraulic-sediment transport disciplines to provide an evidence-based approach to delivering a stable and scour resistant solution. There are considerations for on-bottom stability and also installation with respect to float out and ballasting to
the seafloor or lowering from crane barges. Liquefaction can occur due to rocking of the base although this can be mitigated with skirts and drainage systems under the foundation. With respect to scour analysis, there are a number of approaches that can be taken (Whitehouse, 1998). This paper covers the use of GBS and CGS for a range of marine applications and the examples in the current paper illustrate aspects of flow and scour processes and development. The flow around the structure and through the seabed control the seabed soil response at a specific site. Accelerated flow and turbulence generation give rise to locally enhanced transport of sediment through which gradients in the sediment transport rate are created leading to local erosion or scour. Where the scour takes place on a sand or gravel seabed the material is likely to generate some local deposits associated with that erosion, whereas if the scour occurs on silty or clay seabeds the eroded material is likely to be carried away from the site in suspension, leaving a depression which may not readily be infilled by natural

Evaluating scour at marine gravity structures 1st European IAHR Congress, Edinburgh, 4 – 6 May 2010
2010 2 HRPP 442
processes. The scour response is progressive with tidal currents and may develop more quickly under storm conditions. When the duration of currents or storm is shorter than the characteristic time required for scour to develop then the scour will not develop to its equilibrium depth. Currents (tidal or steady) promote scour and wave action from different sectors and of varying magnitudes will enhance or reduce the scouring such that the pattern and depth of scour will fluctuate in time. Recently, for a monopile foundation, analysis of the temporal variations in scour that can occur in a mixed wave and current environment have been illustrated by Harris et al (2010). GBSs may have skirts but can also be flat based or have ribs. A methodology for scour assessment was provided by O’Riordan and Clare (1990) who stated that scour should be considered in the installation phase including: • Scour during initial touchdown; and, • Scour on completion of installation. For GBSs with a skirt scour during installation can be reduced by making the final bed approach and initial skirt penetration at slack water, during low wave activity, or by preparing the bed with some material that prevents scour but does not impede penetration. Once the skirt has penetrated the bed the relative rates of scour depth development and penetration speed of the skirt tip should be considered, especially in sand. The most vulnerable locations for scour are usually: • The corners of the GBS (assuming a
non-cylindrical shape); • The leading skirt edge – especially in
the final phases of touchdown; and, • Around templates and pipelines outside
the foundation. In areas with currents sufficient to cause erosion of the bed it was recommended that scour protection vessels should be on station to place material at the most vulnerable locations should this become an issue during installation. O’Riordan and Clare concluded that existing design codes
concentrate on the in-service performance of the GBS and that installation activities must not invalidate the design assumptions for the in-service conditions. Dahlberg (1983) reported on scour at the Frigg TP1 GBS in the North Sea at a site where the uppermost layers of seabed soil comprised fine sand in the range 0.1 mm to 0.2 mm. This soil had a low resistance to scour. Observations from this square foundation in 104 m of water showed scour at two corners of about 2 m depth which had developed mainly during the summer months. Remedial measures were taken using gravel bags and gravel fill which proved effective to remove further scour problems. The sensitivity of the scour to foundation shape was highlighted by the TCP2 structure in 102 m of water with 4 m of dense sand overlying clay. At this foundation only 40 m away no scour was experienced in the sand layer. Elsewhere in the North Sea platforms directly on clay, and without scour protection, have not experienced scour (Hoeg, 1991). In shallower water of 30 m to 40 m in the North Sea the scour around a rectangular GBS (75 m by 80 m by 16m high in 42.3 of water) was measured in the field as between 2.5 m and 3.5 m in 0.15 mm sand (Bos et al, 2002). The use of a skirted foundation provides some means of protection against underscour but does not prevent scour from occurring. Tests of scouring in a wave-current facility (1:40 scale tests of Whitehouse, 2004) with a 20 m diameter circular skirted caisson showed that in vigorous scour environments dominated by currents the skirt might promote the continuing development of scour. In areas with limited scour development the presence of a skirt can adequately protect against underscour. Installation of foundations in deep and fast flow, e.g. the concrete caissons used for the Tacoma Narrows second bridge crossing, require complex anchoring during installation which can be optimised with physical model tests to assess operational stability (Chakrabarti and McBride, 2005). The in-service situation is covered by scour
Evaluating scour at marine gravity structures 1st European IAHR Congress, Edinburgh, 4 – 6 May 2010
2010 3 HRPP 442
assessments and where scour protection is envisaged the filter and rock armour layer scour design can be evaluated in laboratory tests (Hebsgaard et al, 1993). These particular tests related to the Oresund Bridge and site experience recorded during installation of one of the piers was for the action of storm induced currents and waves to undermine the pier shortly after it was installed and thus “it required an extensive grouting program to fill under the base” (Gerwick, 2000). The filter course of stone was then placed around the pier and covered with heavy rip rap. PREDICTING SCOUR The dimensions of the foundation exerts the major controlling influence on the scour depth S, and hence it is conventional to non-dimensionalise S with the characteristic length-scale of the foundation. In the case of a slender pile this is taken to be the pile diameter D and this is also the case for larger diameter piles. Slender piles are defined when the pile diameter to water depth ratio is less than 0.5 (Whitehouse, 1998), and for non-slender piles it is usually assumed that a reduction in relative scour depth (i.e. S/D) occurs when the water depth falls below three to five times the pile diameter (Whitehouse, 1998). The height of the pile (with respect to the total water depth) is also important as shorter piles present less disturbance to the flow and less scour than a higher pile of the same diameter (Whitehouse, 1998; Sumer and Fredsøe, 2002). Scour tests with varying structure
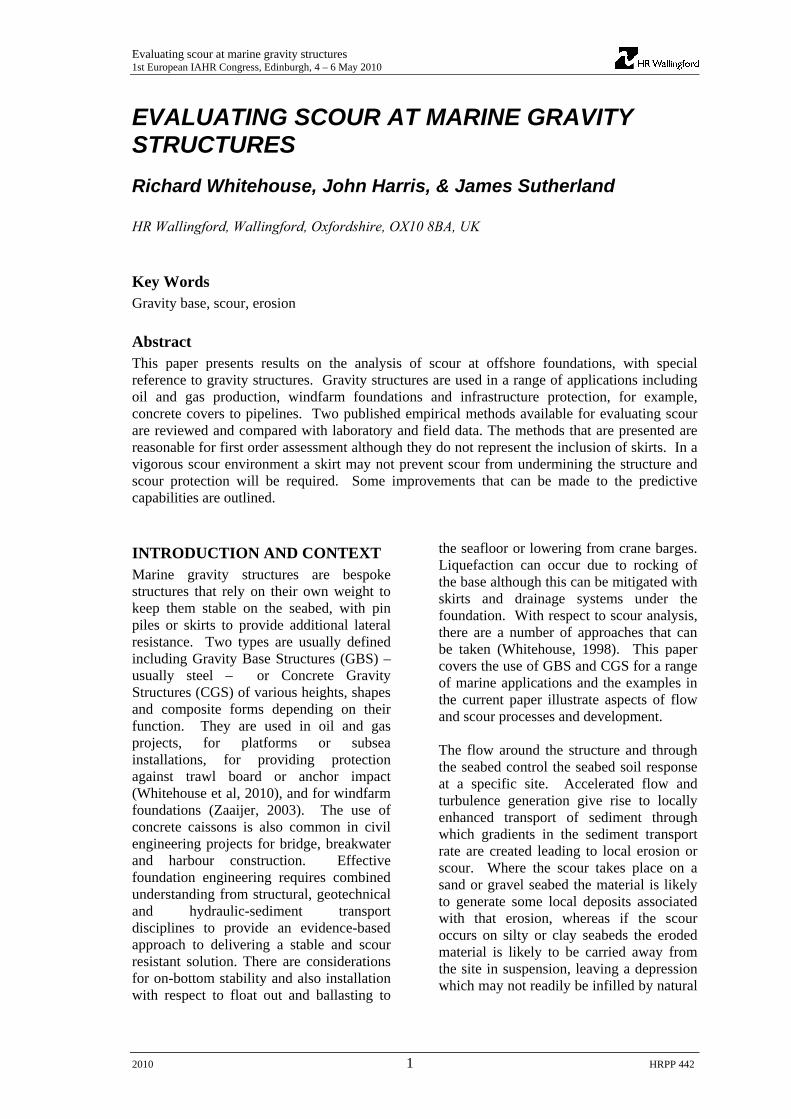
height and skirt depth geometries have been reported by Simons et al (2009). In the current paper a set of test results to contrast scour development for a mobile sand bed condition are reported (Table 1 and Figure 1) in terms of Froude scaled times (Whitehouse, 1998). For monopile foundations the characteristic dimension is the diameter Dp. For the CGS/GBS it is related to the diameter or length of side of the foundation Dc and the height of the foundation above the seabed level hc. The scour depth for the full depth caisson at the end of the test run is deeper than the other two test cases. It equates to 0.37Dc, compared with 0.18Dc for the girder top caisson, and 0.94Dp for the monopile. The result demonstrates the importance of the height of the foundation above the bed on the absolute scour depth, as well as on the rate of scour which was fastest for the full depth caisson after 10 hours than the other two cases. For predictions, in this case of jackup spudcans, Rudolph et al (2005) summarised a number of field observations and laboratory tests and concluded the maximum scour depth in a mobile seabed location Smax was related to the height of the spudcan above seabed level after initial penetration, hc. They proposed a simple formula based on the height of the foundation with which to make a first order estimation of the maximum scour depth:
Smax = K (1)
Table 1 Summary comparison of measured scour depths in a current (1:40 scale tests with equivalent full-scale parameters of 10 m water depth, mobile fine sand, current of around 1.7m/s) Test Number
Structure Maximum scour depth after 10 hours
Maximum scour depth at end of test
1 Monopile Dp = 4.6m
3.4m 4.3m@ 36.1 hours
3 Girder top caisson: Dc = 19m, hc = 2m, Dp = 4.6m
1.5m 3.5m @ 28.6 hours
11 Full depth caisson Dc = 19m
5.5m 7.0m @ 19.5 hours

Evaluating scour at marine gravity structures 1st European IAHR Congress, Edinburgh, 4 – 6 May 2010
2010 4 HRPP 442
0
1
2
3
4
5
6
7
8
0.0 5.0 10.0 15.0 20.0 25.0 30.0 35.0 40.0
Time (hours)
Scou
r Dep
th (m
)
Girder top caissonMonopileSurface Piercing Caisson
Figure 1 Comparison of test results for scour with three different structures in a steady
current (structures in Table 1) They suggested the value of the dimensionless coefficient K was in the region 0.2 to 2 and that the scour depth scaled on the lengthscale hc. For GBS a current-only scour predictor was presented by Hoffmans and Verheij (1997) to make a more specific estimate of scour for the foundation. This formula was originally developed for full water depth circular structures and Hoffmans and Verheij modified it as follows: • The pile diameter was replaced by a
characteristic length, Dc, taken as the average of the length and breadth of the GBS/CGS;
• The flow depth, h, in the water depth to diameter ratio h/Dc was replaced by the GBS/CGS height, hc;
• The undisturbed depth-averaged flow velocity was multiplied by αc/2 with αc = 2 for a circular structure, and αc = 2.3 for a rectangular GBS/CGS expressing the additional turbulence generated at the corners of the structure. The coefficient αc is an influence factor that
• represents the flow enhancement near the structure caused by the structure.
The resulting equation for scour depth, S, is given as Equation 2:
( )
34.0
243.1
83.0andfor1/with
5.01
5.0296.8
⎟⎟⎠
⎞⎜⎜⎝
⎛=≥=
⎟⎟⎠
⎞⎜⎜⎝
⎛⎟⎟⎠
⎞⎜⎜⎝
⎛⎟⎟⎠
⎞⎜⎜⎝
⎛−=
c
ccrcr
Ncc
cr
c
c
Dh
NUUUU
ghU
Dh
UU
DS αα
(2) Here Ucr is the value of depth-averaged flow velocity for initiation of sediment motion (m/s) and g is gravitational acceleration (m/s2). Given that the Froude number in the marine environment is generally << 1 this provides a practical limitation to the use of Equation 2. A range of geometries have been used in Equation 2 and the predictions are shown in Figure 2.

Evaluating scour at marine gravity structures 1st European IAHR Congress, Edinburgh, 4 – 6 May 2010
2010 5 HRPP 442
Table 2 Input parameters for evaluation of scour predictor Equation 2 Case Dimensio
n D (m) Height hs (m)
Water depth h (m)
Ucr (m/s)
Characteristic range of velocity (m/s)
Full depth GBS 180 Same as water depth
30 0.5 c. 0.6
S North Sea GBS 71.4 16 42.3 0.5 c. 0.6 to 0.8 Cover GBS 10.8 3.55 30.55 0.5 c. 0.8 to 1 Small GBS 6 0.6 100 0.6 c. 1
Scour depth predictor different GBS
0.00
1.00
2.00
3.00
4.00
5.00
6.00
0.00 0.20 0.40 0.60 0.80 1.00 1.20 1.40
U (m/s)
Scou
r Dep
th (m
)
Small GBSS North Sea GBSFull depth GBSSmall GBS (Ucr)S North Sea GBS (Ucr)Full depth GBS (Ucr)Cover GBSCover GBS (Ucr)
Cover GBS
S North Sea GBS
Small GBS
Full depth GBS
Figure 2 Scour predictions for the range of typical structure geometries in Table 2
EVALUATION OF PREDICTORS Comparison with Equation 1 for the girder top caisson (Test 3) suggest a value of K = 1.75 based on the initial height of the foundation above the seabed (hc = 2m). This is within the range for K quoted by Rudolph et al (2005). The value of S calculated with Equation 2 for Test 3, using the prototype scale values and assuming live-bed conditions, is 1.82m which is less than the measured value. This is most likely because of the effect of the deep skirt which is represented in Equation 2 by the initial value for height of caisson of 2m. As the scour progresses the effective value of hs increases and hence so does the scour depth. Hoffmans and Verheij (1997) present a version of Equation 2 which
corresponds to the case of the full-depth cylinder; hs is replaced by the water depth h. A calculation of the scour depth for hs = h in Equation 2 has been made for the conditions of Test 11 and a close agreement was found with the predicted value being 7m. However, it is noted that the scour depth measured in Test 11 may not have been the final value. Equation (2) has been evaluated for a range of structure dimensions and water depths and the results have been plotted in Figure 2. In each case two lines are plotted, one assuming no threshold of motion and one with the threshold of motion considered to show how this alters the predictions in sub-threshold conditions. The input parameters are listed in Table 2.

Evaluating scour at marine gravity structures 1st European IAHR Congress, Edinburgh, 4 – 6 May 2010
2010 6 HRPP 442
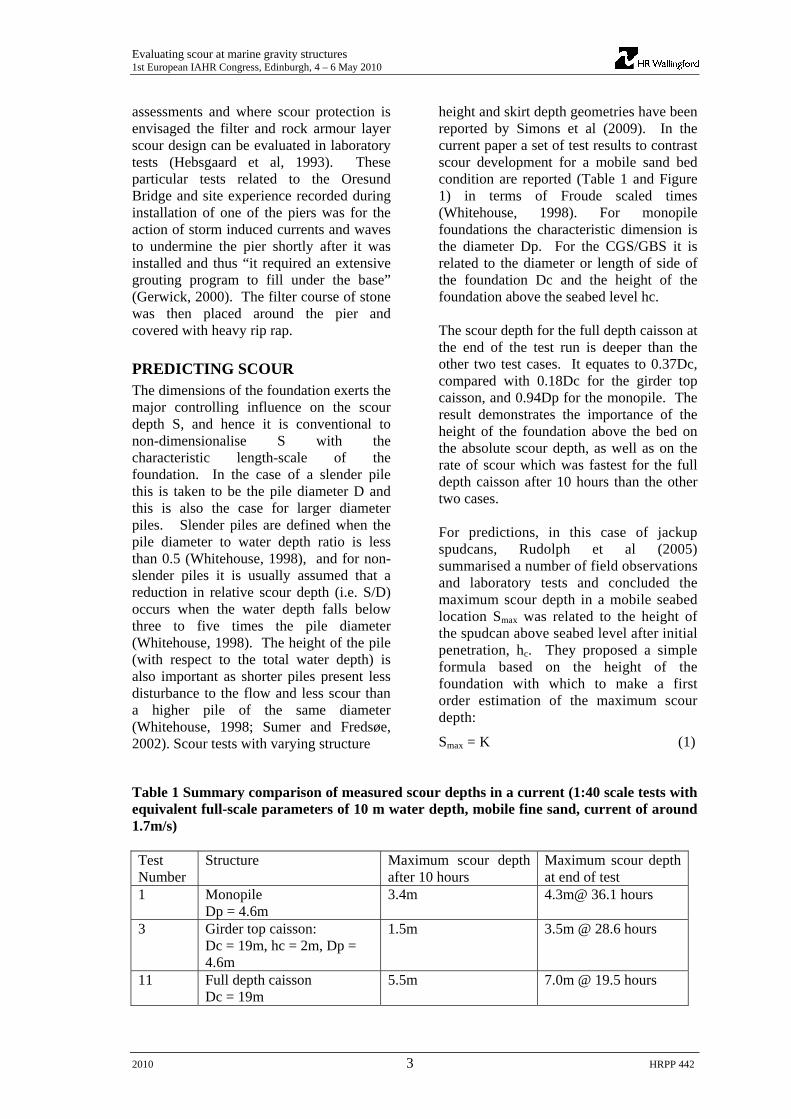
Figure 3 Small GBS in 100m of water with scour and skirt exposure (Photograph reproduced with permission from Technip Offshore UK)
Application of the predictor (plotted as S North Sea GBS in Figure 2) to a structure similar in size to the one evaluated by Bos et al (2002) indicates that the method tends to overpredict, as the prediction (3.5 to 4.4m) in the characteristic range of velocities is larger than the observed scour of 2.5 to 3.5m. For the cover GBS (Whitehouse et al, 2010) scour at the site commenced within a month of installation leading to some undermining of the footings of the cover and within four months observations showed scour induced settlement had taken place. The scour led to an overall settlement of the structure by about 1.25 m which is of a reasonable order compared with prediction in the characteristic range of velocity. For the small GBS field observations (Figure 3) with a fine sand in deep water shows that for a current speed of 1 m/s (the design current) an associated prediction of around the same order as that observed (0.3m) is achieved, with the skirt becoming exposed. For comparison purposes predictions for a large terminal GBS have been included in Figure 2 which indicate very large scour depths even for low flow speeds. This is probably because there are no flow depth limiting effects in the predictor, and in reality for a large structure such as this with
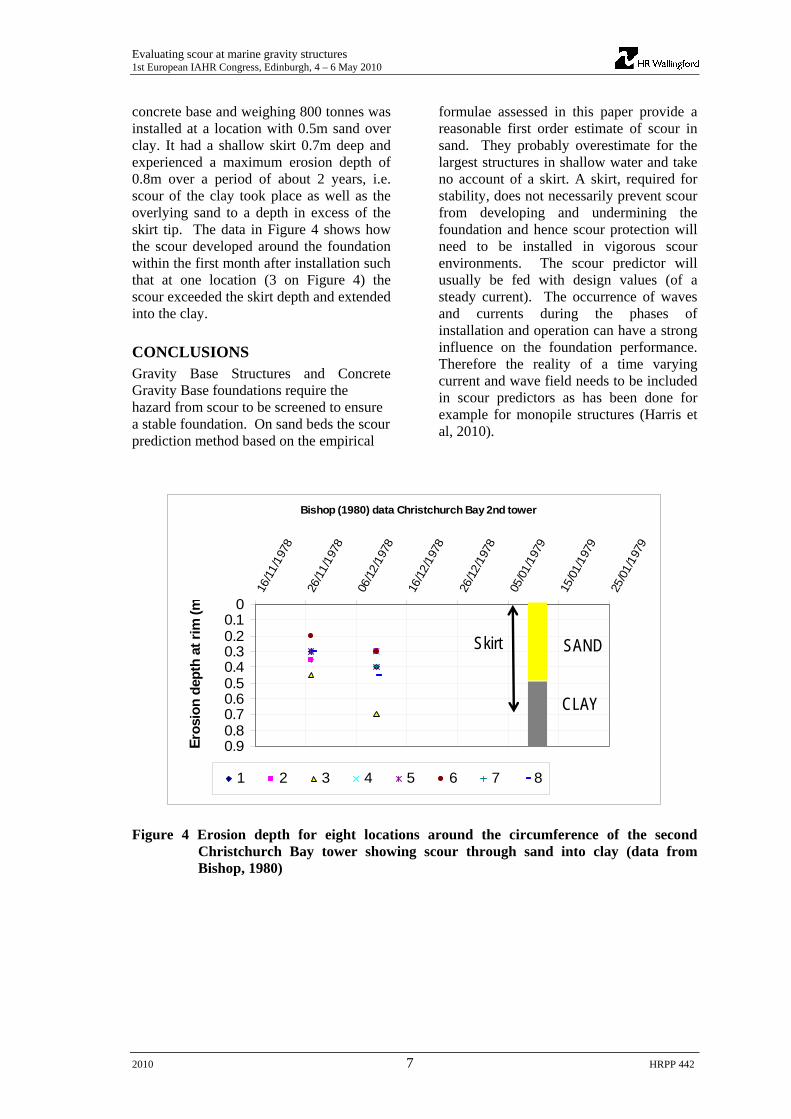
a skirt once scour had undermined the skirt this would tend to relax the development of scour locally. Therefore whilst there is no data to verify the prediction it seems overly conservative for a marine environment. It is usual to use a deterministic approach to scour prediction but in reality the water level, flow speed and direction all vary with time influencing scour along with the variations that occur with wave height, period and direction. The scour depth varies with time and the scour pattern fluctuates around the foundation. Predictions of scour depth have been made method for caissons in tidal flow by Escarameia and May (1999) and recently for waves and currents and monopile foundations by Harris et al (2010). A further complexity is the need to evaluate scour in clay, or in two layer soils with sand overlying clay. The experience in Christchurch Bay of GBS towers installed in 9m water depth is relevant (Bishop, 1980). The first tower was situated at a location with 3m of fine sand overlying clay. The central monopile column was 2.8m in diameter on top of a 10.5m diameter concrete base weighing 200 tonnes, with tapering flanks, and no skirt. The foundation experienced a settlement of 0.5m and a scour depth of 0.8m. Subsequently this foundation was removed and a second one with a 20m diameter
Evaluating scour at marine gravity structures 1st European IAHR Congress, Edinburgh, 4 – 6 May 2010
2010 7 HRPP 442
concrete base and weighing 800 tonnes was installed at a location with 0.5m sand over clay. It had a shallow skirt 0.7m deep and experienced a maximum erosion depth of 0.8m over a period of about 2 years, i.e. scour of the clay took place as well as the overlying sand to a depth in excess of the skirt tip. The data in Figure 4 shows how the scour developed around the foundation within the first month after installation such that at one location (3 on Figure 4) the scour exceeded the skirt depth and extended into the clay. CONCLUSIONS Gravity Base Structures and Concrete Gravity Base foundations require the hazard from scour to be screened to ensure a stable foundation. On sand beds the scour prediction method based on the empirical
formulae assessed in this paper provide a reasonable first order estimate of scour in sand. They probably overestimate for the largest structures in shallow water and take no account of a skirt. A skirt, required for stability, does not necessarily prevent scour from developing and undermining the foundation and hence scour protection will need to be installed in vigorous scour environments. The scour predictor will usually be fed with design values (of a steady current). The occurrence of waves and currents during the phases of installation and operation can have a strong influence on the foundation performance. Therefore the reality of a time varying current and wave field needs to be included in scour predictors as has been done for example for monopile structures (Harris et al, 2010).
Bishop (1980) data Christchurch Bay 2nd tower
00.10.20.30.40.50.60.70.80.9
16/11
/197
8
26/11
/197
8
06/12
/197
8
16/12
/197
8
26/12
/197
8
05/01
/197
9
15/01
/197
9
25/01
/197
9
E ros
ion
dept
h at
rim
(m
1 2 3 4 5 6 7 8
SAND
CLAY
Skirt
Figure 4 Erosion depth for eight locations around the circumference of the second
Christchurch Bay tower showing scour through sand into clay (data from Bishop, 1980)

Evaluating scour at marine gravity structures 1st European IAHR Congress, Edinburgh, 4 – 6 May 2010
2010 8 HRPP 442
REFERENCES Bishop, J.R. 1980. Experience with scour at the Christchurch Bay tower. Proc. One day Society for Underwater Technology seminar on scour prevention techniques around offshore structures, 11-22, 16 December. Bos, K.J., Chen, Z., Verheij, H.J., Onderwater, M. and Visser, M. 2002. Local scour and scour protection of F3 offshore GBS platform. Paper 28127 Proceedings OMAE’02 21st International Conference on Ocean, Offshore and Arctic Engineering, June 23-28, 2002, Oslo, Norway. Chakrabarti, S.K. and McBride, M. 2005. Station-keeping tests of moored caisson in strong current. J. Offshore Mech. Arct. Eng., 127, Issue 4, 315 (7 pages), doi:10.1115/1.2073087. Dahlberg, R. 1983. Observations of scour around offshore structure. Canadian Geotechnical Journal, 20, 617-628. Escarameia, M. and May, R.W.P. 1999. Scour around structures in tidal flows. HR Wallingford Report SR 521, Wallingford, Oxfordshire, OX10 8BA. Gerwick, B.C., Jr. 2000. Construction of Marine and Offshore Structures, 2nd Edition CRC Press. Harris, J.M., Whitehouse, R.J.S. and Benson, T. 2010. The time evolution of scour around offshore structures. Proceedings of the Institution of Civil Engineers, Maritime Engineering. In press. Hebsgaard, M., Ennemark, F., Spangenberg, S., Fredsøe, J., and Gravesen, H. (1993). Scour model tests with bridge piers, PIANC, Bulletin, 82, 84-92. Hoeg, K. (1991). Foundations for offshore structures. Chapter 11* in Offshore Structures, Volume 2, Reddy, D.V. and Arockiasamy, M. (eds), Krieger Publishing Company, Malabar, Florida. (*chapter written in 1982) Hoffmans, G.J.C.M. and Verheij, H.J. 1997. Scour Manual. Balkema. O’Riordan, N.J. and Clare, D.G. 1990. Geotechnical considerations for the installation of gravity base structures, Paper OTC 6381, 22nd Offshore Technology Conference, Houston, 309-316, May. Rudolph, D., Bijlsma, A.C., Bos, K.J. and Rietema, K., 2005. Scour around spud cans – analysis of field measurements. Proceedings Fifteenth (2005) International Offshore and Polar Engineering Conference, Seoul, Korea, June 19-24. 289-295 Simons, R.R., Weller, J. and Whitehouse, R.J.S. 2009. Scour development around truncated cylindrical structures. Coastal Structures 2007, Proceedings of the 5th Coastal Structures International Conference, CSt07, Venice, Italy, 2-4 July 2007, (Eds) Franco, L., Tomasicchio, G.R. and Lamberti, A., 1881-1891. World Scientific. Sumer, B.M. and Fredsøe, J. 2002. The Mechanics of Scour in the Marine Environment. World Scientific, Singapore. Whitehouse, R.J.S. 1998. Scour at Marine Structures. Thomas Telford, London.

Evaluating scour at marine gravity structures 1st European IAHR Congress, Edinburgh, 4 – 6 May 2010
2010 9 HRPP 442
Whitehouse, R.J.S. 2004. Marine scour at large foundations. In: Proceedings of the Second International Conference on Scour and Erosion, Singapore, November 2004, eds. Chiew Y-M., Lim, S-Y. and Cheng, N-S. Pages 455-463. Stallion Press. Whitehouse, R.J.S., Lam, C., Richardson, S. and Keel, P. 2010. Evaluation of seabed stability and scour control around subsea gravity protection structures. Paper 20999 accepted for publication in Proceedings of the ASME 2010 29th International Conference on Ocean, Offshore and Arctic Engineering, OMAE2010, June 6-11, 2010, Shanghai, China. Zaaijer, M.B. 2003. Comparison of monopile, tripod, suction bucket and gravity base design for a 6 MW turbine. OWEMES 2003 European Seminar, paper accessed at http://www.ecn.nl/docs/dowec/2003-OWEMES-Support-structures.pdf

HR Wallingford LtdHowbery ParkWallingfordOxfordshire OX10 8BAUK
tel +44 (0)1491 835381fax +44 (0)1491 832233email [email protected]
www.hrwallingford.co.uk
Fluid thinking…smart solutionsg y , pp
hydraulics, and in the management of
water and the water environment. Created as the Hydraulics Research
Station of the UK Government in 1947, the Company became a private
entity in 1982, and has since operated as a independent, non profi t
distributing fi rm committed to building knowledge and solving problems,
expertly and appropriately.
Today, HR Wallingford has a 50 year track record of achievement in applied
research and consultancy, and a unique mix of know-how, assets and
facilities, including state of the art physical modelling laboratories, a full
range of computational modelling tools, and above all, expert staff with
world-renowned skills and experience.
The Company has a pedigree of excellence and a tradition of innovation,
which it sustains by re-investing profi ts from operations into programmes of
strategic research and development designed to keep it – and its clients and
partners – at the leading edge.
Headquartered in the UK, HR Wallingford reaches clients and partners
globally through a network of offi ces, agents and alliances around the
world.