h.r. 3 and reference pricing - vital transformation
TRANSCRIPT

H.R. 3 and Reference PricingTotal Market Impact
March 22, 2021
Prepared in collaboration with

Executive Summary
06/04/2021 2
• Numerous proposals are being considered that would use the average of pricing in other countries to control US drug prices. Proponents argue that this can be done with little impact on innovation.
• Using the Lower Drug Costs Now Act (“H.R. 3”) as an example, we find that implementation of international reference pricing in the United States would:
o Reduce earnings by 62% on average for impacted companies, with one third (32%) of affected companies having reductions larger than 95% of earnings (using conservative assumptions about the impacts on prices).
o In turn, markedly reduce biopharmaceutical companies’ investments in smaller company R&D through M&A, partnerships and other arrangements.
o Reduce by 90%+ the number of medicines developed by small and emerging biotechs -- 61 fewer medicines over 10 years.
o Disproportionately impact new treatments in rare diseases, oncology, and neurology.
o Create large investment ecosystem losses to smaller companies in 19 states.
o Eliminate nearly 200,000 biopharmaceutical industry jobs, and nearly 1 million jobs across the economy.
© Vital Transformation, LLC 2021

Introduction
• What is an “international pricing index”?
o Sets a maximum US price based on the prices for medicines paid in foreign markets, this is called a price ceiling.
o Price ceilings generally create supply shortages, as they limit the ability of producers to meet market demand; EU payers regularly use delayed access to justify lower prices.
o The delay in access to new therapies in France, according to the French Government, is nearly two years (540 days); the US market and EU markets are very different in how they provide access.
06/04/2021 3© Vital Transformation, LLC 2021
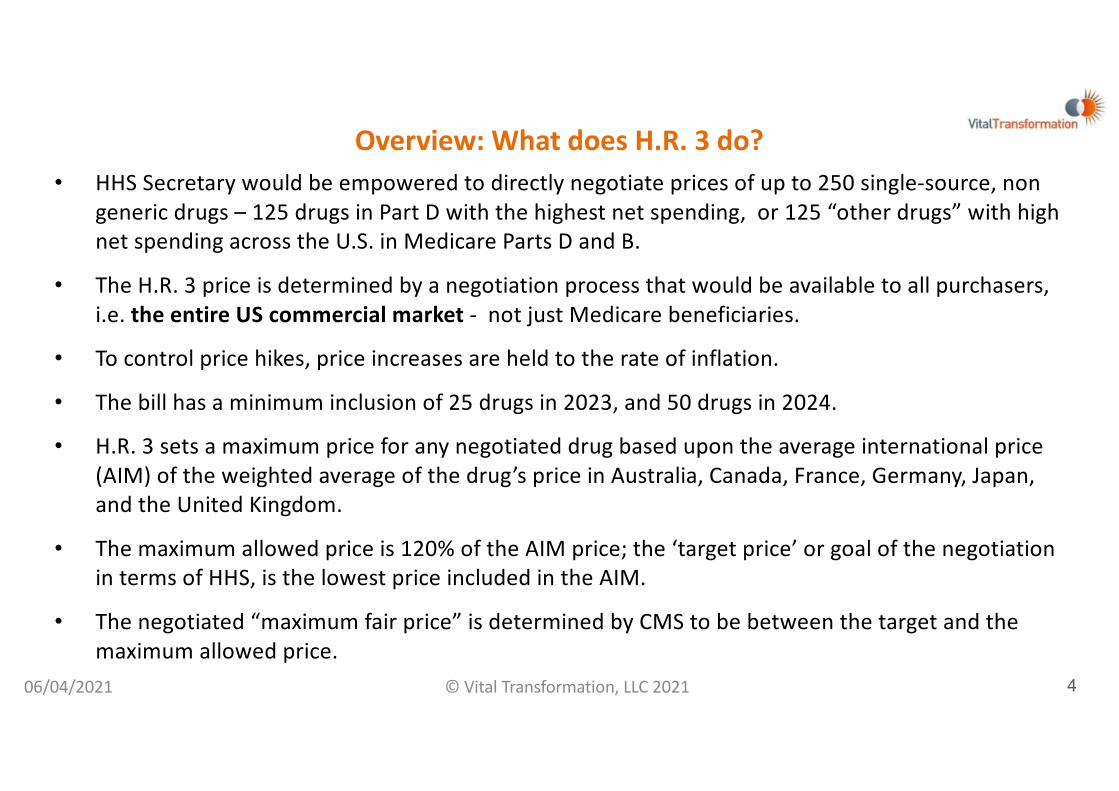
Overview: What does H.R. 3 do?• HHS Secretary would be empowered to directly negotiate prices of up to 250 single-source, non
generic drugs – 125 drugs in Part D with the highest net spending, or 125 “other drugs” with high net spending across the U.S. in Medicare Parts D and B.
• The H.R. 3 price is determined by a negotiation process that would be available to all purchasers, i.e. the entire US commercial market - not just Medicare beneficiaries.
• To control price hikes, price increases are held to the rate of inflation.
• The bill has a minimum inclusion of 25 drugs in 2023, and 50 drugs in 2024.
• H.R. 3 sets a maximum price for any negotiated drug based upon the average international price (AIM) of the weighted average of the drug’s price in Australia, Canada, France, Germany, Japan, and the United Kingdom.
• The maximum allowed price is 120% of the AIM price; the ‘target price’ or goal of the negotiation in terms of HHS, is the lowest price included in the AIM.
• The negotiated “maximum fair price” is determined by CMS to be between the target and the maximum allowed price.
06/04/2021 4© Vital Transformation, LLC 2021

H.R. 3 Pricing
• The ‘target price’ for a drug will be 1.2 times (or 120 percent) of the volume-weighted average International Price Index in the six benchmarking countries.
• The “maximum fair price” will be set by HHS and is negotiated downward from the target price, which cannot be exceeded.
• If a manufacturer refuses negotiations, they will be charged an excise tax between 65-95 percent of annual gross sales.
• H.R. 3 includes all brand-name drugs without two or more generic, biosimilar, or interchangeable biologics up to 125 Medicare Part D therapies, and 125 “other drugs” that have high net spending across the U.S.
• The Secretary would also be empowered to negotiate the price of any newly-launched drug with a wholesale acquisition cost above the median household income.
• Insulin products are also negotiated under the same procedures as H.R. 3 products, and are separate from the 125 drug limit.
06/04/2021 5© Vital Transformation, LLC 2021

Study Objectives:
• We developed a model that measures the impact of H.R. 3 on the biopharmaceutical industry assuming several scenarios:- A ‘minimum’ implementation of 25 drugs in 2023 and 50 drugs in 2024
- Mandatory Insulin negotiations under H.R. 3 in all cases
- A ‘full’ implementation of the top 125 drugs by spending, plus 26 insulin drugs, under H. R. 3
• We model H.R. 3’s impacts for the entire commercial market, including globally
• We calculated the impacts of H.R. 3 on the investment ecosystem and drug development under the above scenarios, both for the entire US and for key states.
06/04/2021 6© Vital Transformation, LLC 2021
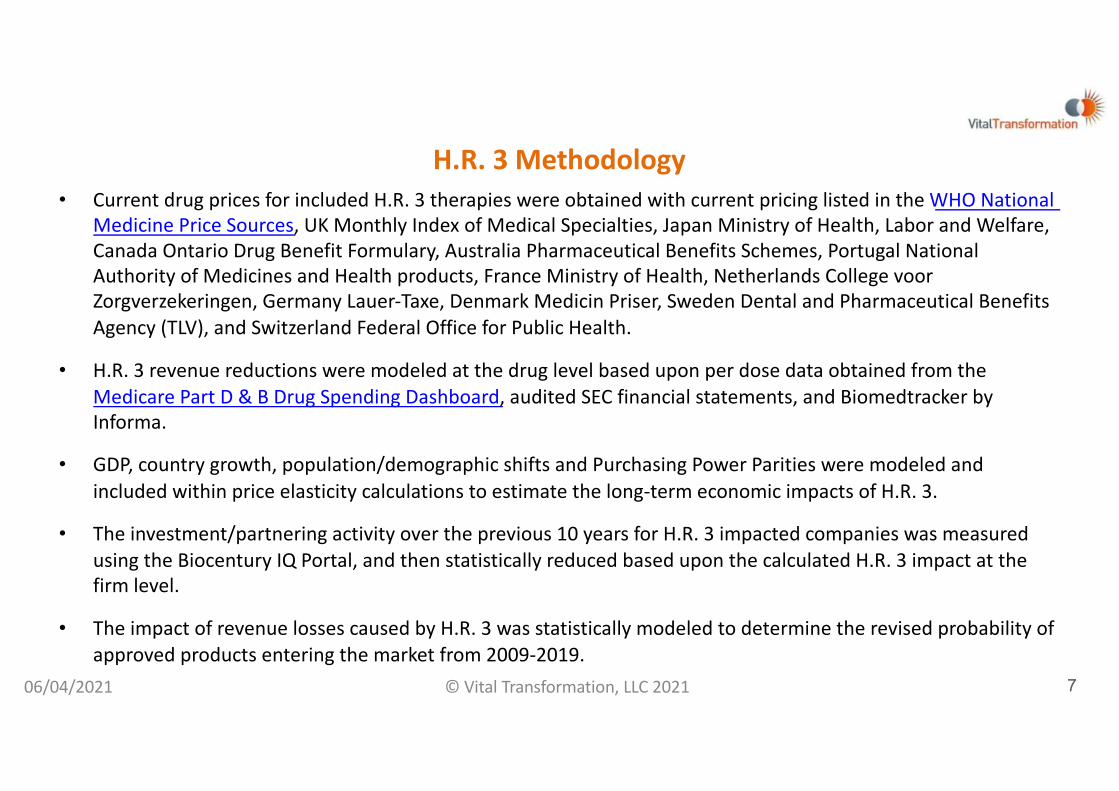
H.R. 3 Methodology• Current drug prices for included H.R. 3 therapies were obtained with current pricing listed in the WHO National
Medicine Price Sources, UK Monthly Index of Medical Specialties, Japan Ministry of Health, Labor and Welfare, Canada Ontario Drug Benefit Formulary, Australia Pharmaceutical Benefits Schemes, Portugal National Authority of Medicines and Health products, France Ministry of Health, Netherlands College voor Zorgverzekeringen, Germany Lauer-Taxe, Denmark Medicin Priser, Sweden Dental and Pharmaceutical Benefits Agency (TLV), and Switzerland Federal Office for Public Health.
• H.R. 3 revenue reductions were modeled at the drug level based upon per dose data obtained from the Medicare Part D & B Drug Spending Dashboard, audited SEC financial statements, and Biomedtracker by Informa.
• GDP, country growth, population/demographic shifts and Purchasing Power Parities were modeled and included within price elasticity calculations to estimate the long-term economic impacts of H.R. 3.
• The investment/partnering activity over the previous 10 years for H.R. 3 impacted companies was measured using the Biocentury IQ Portal, and then statistically reduced based upon the calculated H.R. 3 impact at the firm level.
• The impact of revenue losses caused by H.R. 3 was statistically modeled to determine the revised probability of approved products entering the market from 2009-2019.
06/04/2021 7© Vital Transformation, LLC 2021

H.R. 3 Key Findings I• If enacted, H.R. 3 pricing is projected to:
– reduce US biopharmaceutical industry annual earnings, assuming no defensive measures, from $183 billion to $81 billion in the year 2024 minimum - a reduction of 56%. On average, this is a loss of $102 billion in revenue per year, best case.
• Several companies, many with multiple successful products in H.R. 3, are projected to see revenue reductions larger than their current annual earnings (EBIT), -121%. A third of all affected companies have reductions larger than 95% of net earnings.
• H.R. 3 “penalizes” companies producing the most effective and innovative treatments, many in Oncology, Neurology, Pulmonology and Rheumatology.
• Given its breadth, if enacted, we expect companies will likely avoid developing many Medicare Part D & B therapies altogether, given the punitive H.R. 3 penalties and disincentives.
• It is likely that upwards of $22 billion in revenue from our cohort is being ‘trapped’ by PBMs and not being passed through to patients in terms of savings.
06/04/2021 8© Vital Transformation, LLC 2021

H.R. 3 Key Findings 2 – Ecosystem impacts• Over the last 10 years, companies that would be affected by H.R. 3 have invested $487 billion into 215
venture partnerships, the majority in the US, leading to 68 approved therapies (this total removes M&A’s by J&J/Actelion, AbbVie/Allergan, and BMS/Celgene, Pfizer/Wyeth, Merck/Schering-Plough; if included the total is in excess of $700 billion).
• The potential reduction of $100 billion a year in revenue under H.R. 3 is more than twice the annual $48.7 billion a year in partnership investments from 2009 -2019.
• Controlling for all other factors, the revenue reductions under H.R. 3 would be expected to lead to radical US industry consolidation, and shrink market entry of new drugs from the 68 new assets approved during 2009-2019 in our research cohort to 7 under the most optimistic modeling scenarios
• California alone accounts for 25% of total inward & outward investments of $122 Billion into small emerging biotech companies and for 17 of the 68 US drug approvals in our emerging biotech cohort (roughly 25% of the total), it is the largest in the US.
• Under H. R. 3, only 2 of the 17 medicines produced in California from venture partnerships would have come to market, an 88% reduction.
06/04/2021 9© Vital Transformation, LLC 2021

Modeling the impact
H.R. 3 in practice

HR3 is a Price Ceiling, Price Ceilings Limit Access
USSR & Venezuelaprice ceilings on food
“History 101: Price controls don't work”
11© Vital Transformation, LLC 2021
“Price controls on oil, gasoline and petroleum products. . .were disastrous.”https://www.chicagotribune.com/news/ct-xpm-2007-06-07-0706061080-story.html
“A price ceiling occurs when the government puts a legal limit on how high the price of a product can be. . .when a price ceiling is set, a shortage occurs.”
06/04/2021
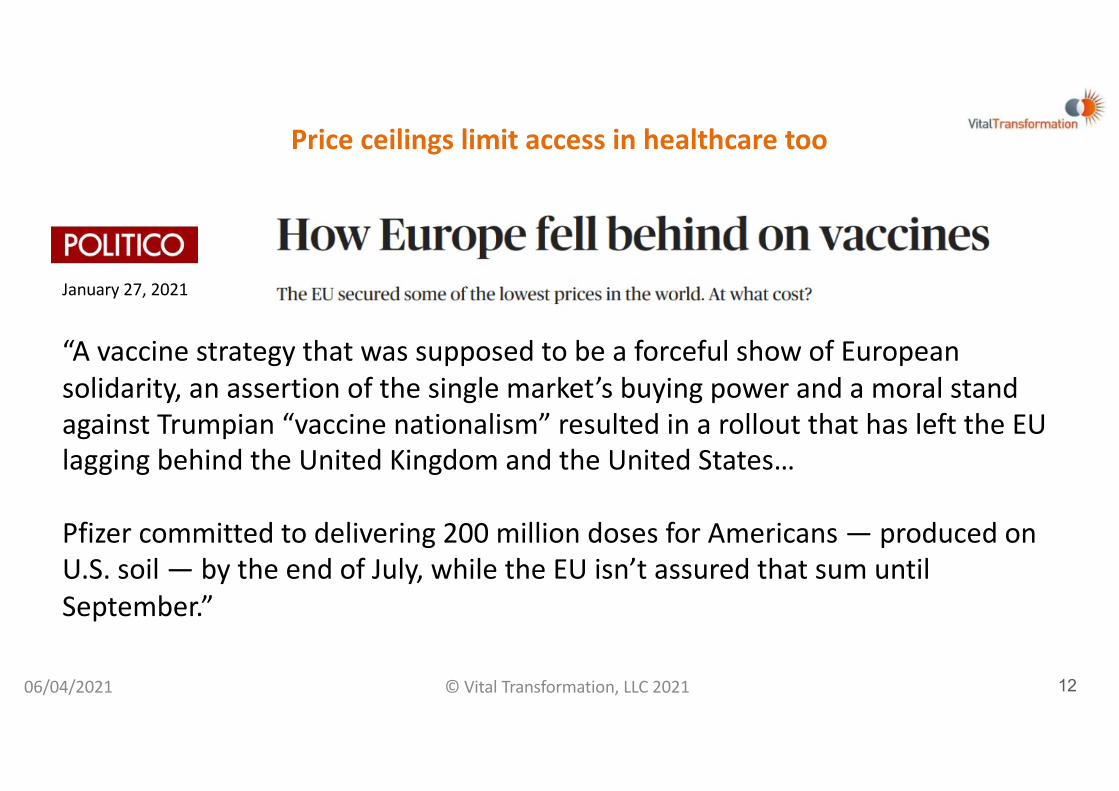
January 27, 2021
“A vaccine strategy that was supposed to be a forceful show of European solidarity, an assertion of the single market’s buying power and a moral stand against Trumpian “vaccine nationalism” resulted in a rollout that has left the EU lagging behind the United Kingdom and the United States…
Pfizer committed to delivering 200 million doses for Americans — produced on U.S. soil — by the end of July, while the EU isn’t assured that sum until September.”
Price ceilings limit access in healthcare too
06/04/2021 12© Vital Transformation, LLC 2021
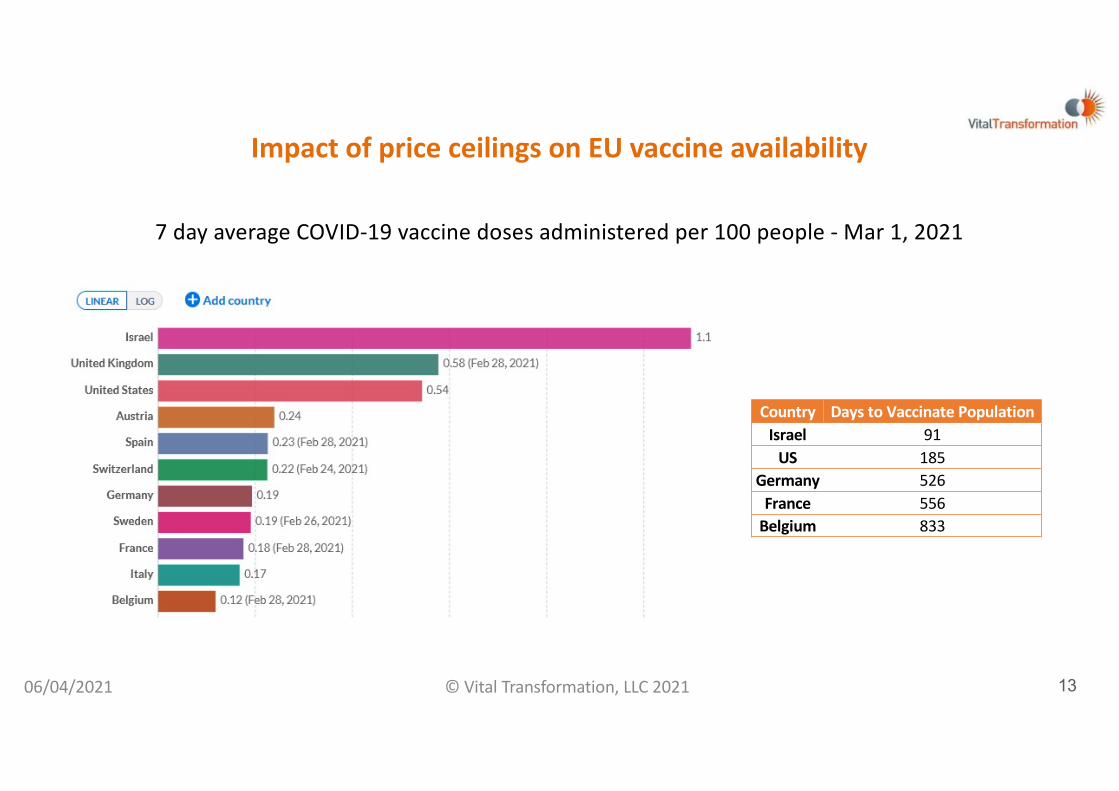
Impact of price ceilings on EU vaccine availability
7 day average COVID-19 vaccine doses administered per 100 people - Mar 1, 2021
Country Days to Vaccinate PopulationIsrael 91
US 185Germany 526
France 556Belgium 833
06/04/2021 13© Vital Transformation, LLC 2021

2023 & 2024 Minimum Revenue Impact by Clinical AreaClinical Areas
25 H.R. 3 Therapies 2023 Estimated Global Sales ($US Mil) 2023 H.R. 3 Revised Sales ($US Mil) % Change
Oncology 7 $48,343 $38,205 21%Rheumatology 4 $27,310 $16,172 41%Neurology 5 $21,913 $8,503 61%Other: 9 $35,136 $17,694 50%
OphthalmologyHematologyImmunologyDermatology
GastroenterologyGrand Total 25 $132,702 $80,575 39%
Clinical Areas 50 H.R. 3 Therapies 2024 Estimated Global Sales ($US Mil) 2024 H.R. 3 Revised Sales ($US Mil) % ChangeOncology 10 $61,875 $51,833 16%Rheumatology 8 $47,836 $28,302 41%Immunology 6 $26,655 $14,898 44%Neurology 9 $31,070 $11,340 64%Other: 17 $50,600 $26,690 47%
HematologyOphthalmology
PulmonologyDermatology
GastroenterologyCardiology
UrologyEndocrinology
Grand Total 50 $218,035 $133,063 39%
06/04/2021 14© Vital Transformation, LLC 2021

Estimated H.R. 3 Macro Revenue Impact, 2023 & 2024
• Assumes 25 drugs in 2023 and 50 drugs in 2024 with the greatest total budgetary impact.
• 26 insulin products with the greatest total budgetary impact included in H.R. 3 in both years.
H.R. 3 Impact 2023 Estimated 2023 H.R. 3 Impact 2024 Estimated 2024 H.R. 3 Impact Revenue
ReductionTotal Lost Revenue
2023 & 2024Diabetes $33,702 $16,346 $33,702 $16,346 51% $34,711
2023 25 Drugs $132,702 $80,575 39% $52,1272024 50 Drugs $218,035 $133,063 39% $84,972
TOTAL Revenue Impact 24 Months ($US Mil) $171,811TOTAL 2023 $69,483TOTAL 2024 $102,328
06/04/2021 15© Vital Transformation, LLC 2021

2024 H.R. 3 Revenue at the company level: 50 Therapies
• H.R. 3 “penalizes” those companies that have invested most in treatments for Medicare Parts D & B.
• The disincentives to product development are additive, in that the more products a company has that are targeted by H.R. 3, the more the firm’s cashflow will be impacted.
• The potential cash impacts are major, and would have devastating impacts on innovation and jobs.
-$9.503
-$2.878
-$1.538
-$10.000
-$9.000
-$8.000
-$7.000
-$6.000
-$5.000
-$4.000
-$3.000
-$2.000
-$1.000
$0
≥ 4 ≥ 2 1
Average revenue impact per firm by number of H.R. 3 therapies per firmAssuming 50 drugs impacted by H.R. 3 in 2024 ($US Mil)
06/04/2021 16© Vital Transformation, LLC 2021

H.R. 3 minimum impact on available cash for investments/pipelines
• H.R. 3 reduces the ability of companies to reinvest their free cash flow into their future pipelines.
• The most impacted 25% of companies show reductions of 121% that exceed their current net annual earnings (EBIT).
• When applied to 50 therapies in 2024, H.R. 3 implementation is projected to reduce EBIT for all H.R. 3 impacted companies from $183 billion to $98.4* billion, a 46% reduction.
EBIT = earnings before interest expense and tax, i.e. net cash available to a firm at year end
-121%
-42%-26%
9%
-140%
-120%
-100%
-80%
-60%
-40%
-20%
0%
20%Top 25% 2nd Quartile 3rd Quartile Bottom 25%
EBIT reductions on H.R. 3 impacted companies by quartilesAssuming 50 drugs impacted by H.R. 3 in 2024
* The $98.4 billion result excludes the H.R. 3 impact upon insulin drugs from the calculation, i.e. this result likely underestimates the full impact on industry
06/04/2021 17© Vital Transformation, LLC 2021
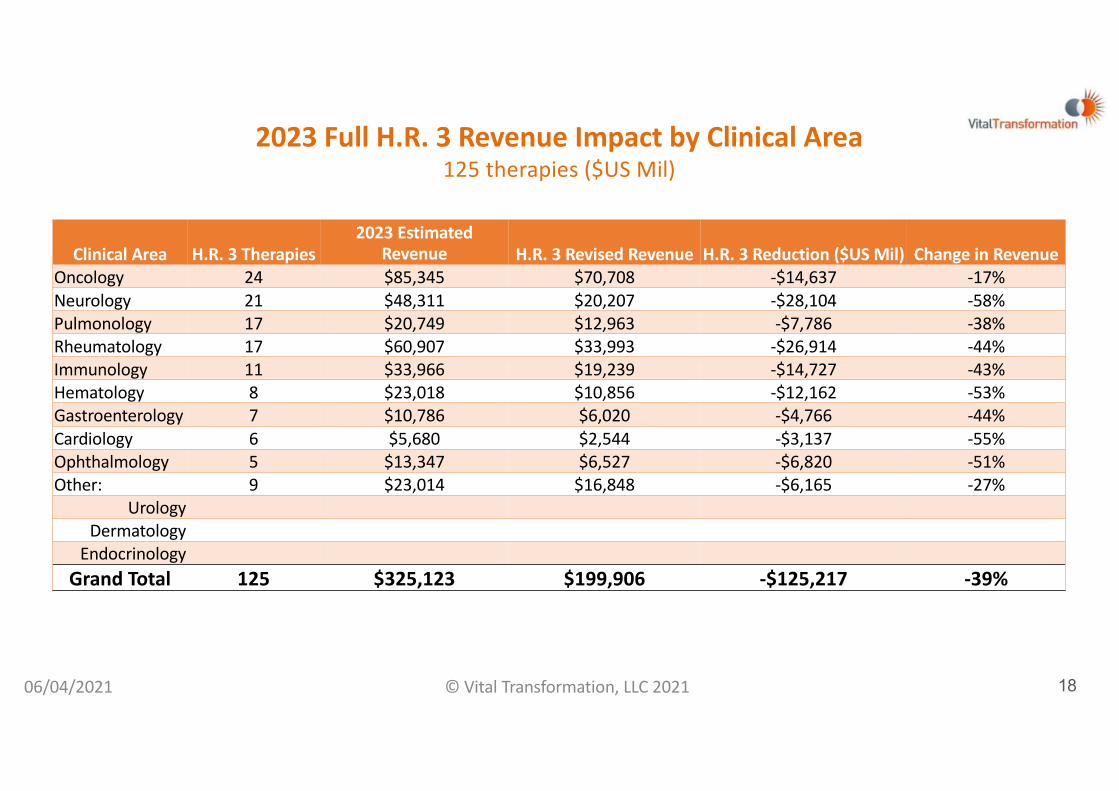
2023 Full H.R. 3 Revenue Impact by Clinical Area125 therapies ($US Mil)
Clinical Area H.R. 3 Therapies2023 Estimated
Revenue H.R. 3 Revised Revenue H.R. 3 Reduction ($US Mil) Change in RevenueOncology 24 $85,345 $70,708 -$14,637 -17%Neurology 21 $48,311 $20,207 -$28,104 -58%Pulmonology 17 $20,749 $12,963 -$7,786 -38%Rheumatology 17 $60,907 $33,993 -$26,914 -44%Immunology 11 $33,966 $19,239 -$14,727 -43%Hematology 8 $23,018 $10,856 -$12,162 -53%Gastroenterology 7 $10,786 $6,020 -$4,766 -44%Cardiology 6 $5,680 $2,544 -$3,137 -55%Ophthalmology 5 $13,347 $6,527 -$6,820 -51%Other: 9 $23,014 $16,848 -$6,165 -27%
UrologyDermatology
EndocrinologyGrand Total 125 $325,123 $199,906 -$125,217 -39%
06/04/2021 18© Vital Transformation, LLC 2021

Estimated H.R. 3 Impact, all 125 Drugs and Insulin
• Assumes top 125 priced drugs reviewed in 2023 and 26 insulin products with the greatest total budgetary impact included under HR3.
H.R. 3 Impact 2023 Estimated 2023 H.R. 3 Revised Revenue Reduction % Subtotal Lost Revenue
Diabetes $33,702 $16,346 -51% $17,3562023 125 Drugs $325,123 $199,906 -39% $125,217
Total 2023 Impact ($US Mil) $142,573
06/04/2021 19© Vital Transformation, LLC 2021
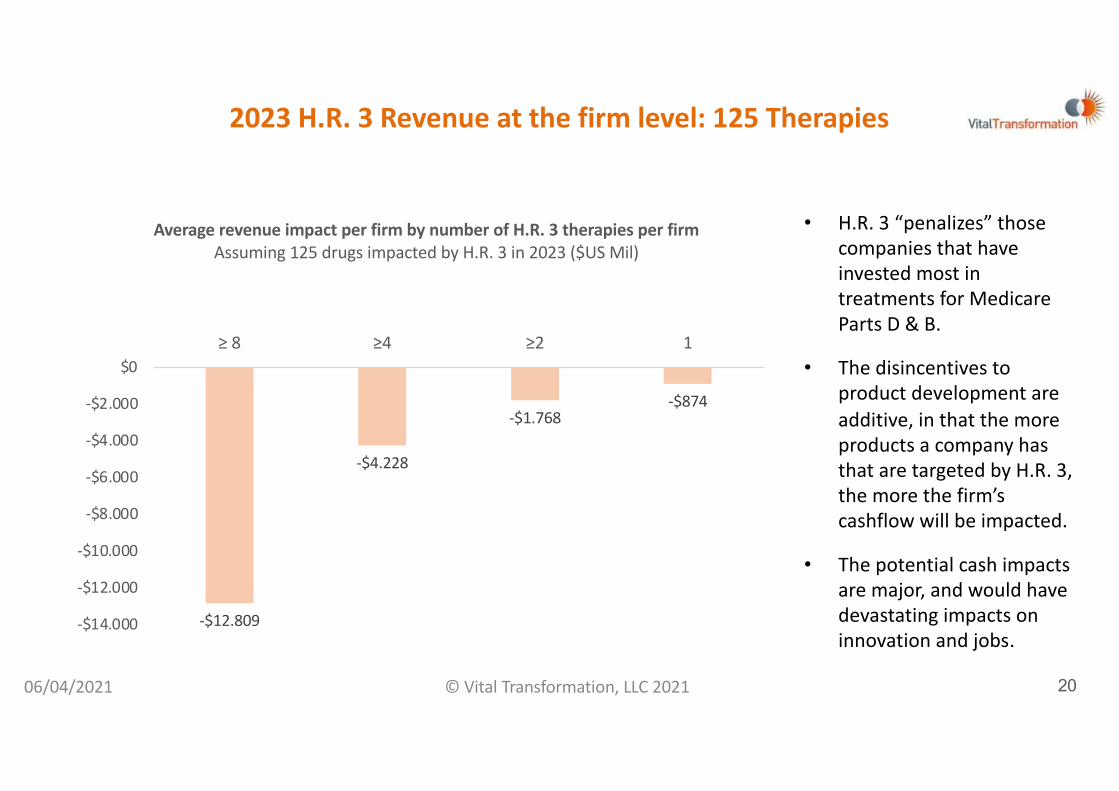
2023 H.R. 3 Revenue at the firm level: 125 Therapies
• H.R. 3 “penalizes” those companies that have invested most in treatments for Medicare Parts D & B.
• The disincentives to product development are additive, in that the more products a company has that are targeted by H.R. 3, the more the firm’s cashflow will be impacted.
• The potential cash impacts are major, and would have devastating impacts on innovation and jobs.
-$12.809
-$4.228
-$1.768-$874
-$14.000
-$12.000
-$10.000
-$8.000
-$6.000
-$4.000
-$2.000
$0≥ 8 ≥4 ≥2 1
Average revenue impact per firm by number of H.R. 3 therapies per firmAssuming 125 drugs impacted by H.R. 3 in 2023 ($US Mil)
06/04/2021 20© Vital Transformation, LLC 2021

H.R. 3 125 drug impact on available cash for investments/pipelines
• H.R. 3 reduces the ability of companies to reinvest their free cash flow into their future pipelines.
• The most impacted 25% of companies show reductions of 78% of their current net annual earnings (EBIT).
• The 2023 estimated EBIT for all H.R. 3 impacted companies is $204 billion, H.R. 3 with 125 therapies reduces earnings by $125* billion, a 62% reduction in the cohort.
* The $125 billion result excludes the H.R. 3 impact upon insulin drugs from the calculation, i.e. this result likely underestimates the full impact on industry
-78%
-67%
-45%
-4%
-90%
-80%
-70%
-60%
-50%
-40%
-30%
-20%
-10%
0%Top 25% 2nd Quartile 3rd Quartile Bottom 25%
EBIT reductions on H.R. 3 impacted companies by quartilesAssuming 125 drugs impacted by H.R. 3 in 2023
EBIT = earnings before interest expense and tax, i.e. net cash available to a firm at year end
06/04/2021 21© Vital Transformation, LLC 2021
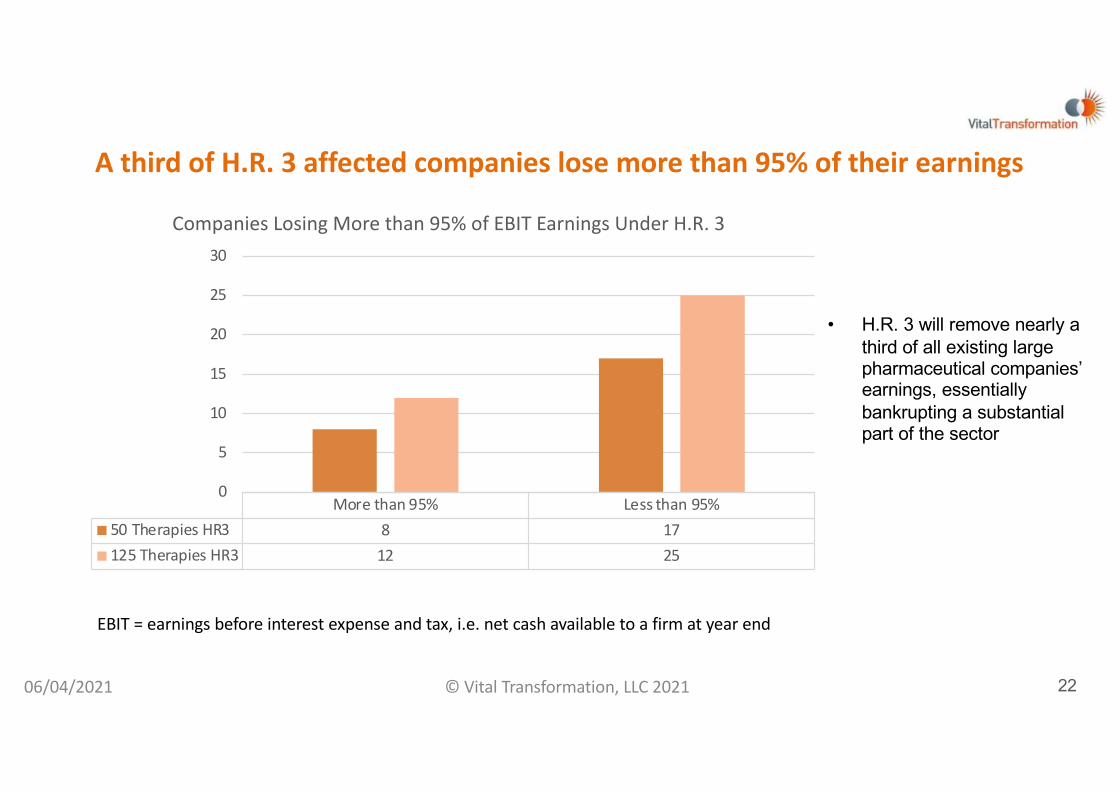
A third of H.R. 3 affected companies lose more than 95% of their earnings
• H.R. 3 will remove nearly a third of all existing large pharmaceutical companies’ earnings, essentially bankrupting a substantial part of the sector
EBIT = earnings before interest expense and tax, i.e. net cash available to a firm at year end
More than 95% Less than 95%50 Therapies HR3 8 17125 Therapies HR3 12 25
0
5
10
15
20
25
30
Companies Losing More than 95% of EBIT Earnings Under H.R. 3
06/04/2021 22© Vital Transformation, LLC 2021

H.R. 3 Direct and Total Supported Job LossesTotal US and 15 most impacted regions/states
$132 Billion Annual Revenue Reduction (125 Drugs) $100 Billion Annual Revenue Reduction (50 Drugs)
StateDirect Biopharma
Jobs ImpactTotal Biopharma
Supported Jobs ImpactBiopharma Supported Output Impact ($M)
Direct Biopharma Jobs Impact
Total Biopharma Supported Jobs Impact
Biopharma Supported Output Impact ($M)
Totals, U.S. & PR -190883 -950463 -$270,505 -144608 -720048 -$204,928
California -32863 -178791 -$54,222 -24896 -135448 -$41,077New Jersey -14288 -71834 -$19,635 -10824 -54420 -$14,875
Massachusetts -14293 -66916 -$16,683 -10828 -50694 -$12,639Pennsylvania -11021 -59743 -$15,839 -8349 -45260 -$11,999
North Carolina -10582 -59078 -$17,523 -8017 -44756 -$13,275Illinois -9592 -58065 -$17,177 -7267 -43989 -$13,013
New York -12981 -54318 -$15,791 -9834 -41150 -$11,963Texas -8951 -46183 -$12,660 -6781 -34987 -$9,591
Indiana -5803 -32933 -$13,089 -4396 -24949 -$9,916Florida -6061 -30805 -$6,831 -4592 -23337 -$5,175
Maryland -7189 -30542 -$7,957 -5446 -23138 -$6,028Ohio -4917 -21371 -$5,193 -3725 -16190 -$3,934
Michigan -3761 -20352 -$5,362 -2849 -15418 -$4,062Puerto Rico -4212 -18356 -$13,564 -3191 -13906 -$10,276
Utah -2901 -17231 -$4,075 -2198 -13054 -$3,087
Source: TEConomy analysis; IMPLAN U.S. 2017 Model, VT adjusted from $100 billion annual reduction of revenue to $132 billion
06/04/2021 23© Vital Transformation, LLC 2021

Ecosystem Impacts of H.R. 3
• Companies impacted by H.R. 3 invested from 2009 – 2019 nearly $487 billion into 215 venture partnerships, the majority in the US, leading to 68 approved therapies.
• H.R. 3 would reduce cashflow available for ecosystem innovation investments by 46% at a minimum.
• Partnerships are not just driven by US companies; all global companies are developing assets in this way. According to VT research, over 70% of global biotech assets are commercialized in the US regardless of the location of the parent company.
• Disproportionately impacts small/emerging companies in 19 states.
– California alone accounts for 25% of total inward investments into small innovative biotech companies of $122 Billion and for 17 of the 68 US drug approvals in our emerging biotech cohort (roughly 25% of the total).
• H.R. 3 does not impact all companies equally.
06/04/2021 24© Vital Transformation, LLC 2021

2009 – 2019 H.R. 3 Impacted companies: inward investments, totals by location
$33$78
$225
$232$371
$550
$605$1.600
$2.431
$3.257$3.705
$4.342
$4.827$4.966
$5.876
$34.542$419.513
$0 $50.000 $100.000 $150.000 $200.000 $250.000 $300.000 $350.000 $400.000 $450.000
BermudaChinaSpain
DenmarkAustralia
IrelandIsrael
BelgiumUnited Kingdom
NetherlandsGermany
Hong KongFrance
CanadaJapan
SwitzerlandUSA
H.R. 3 Impacted companies 222 inward investments$487 billion ($US Mil)
06/04/2021 25© Vital Transformation, LLC 2021

Total deal value of the 222 inward investments made 2009 – 2019 by companies impacted by H.R. 3, by US StateSmall and Mid Cap Innovative Biotech Only
06/04/2021 26© Vital Transformation, LLC 2021
USA - Emerging Biotech Only $366,725,490,000California $129,079,490,000
New Jersey $74,641,000,000Massachusetts $73,961,400,000
Illinois $18,855,000,000Colorado $11,400,000,000
Washington $10,833,000,000North Carolina $10,130,000,000Pennsylvania $9,279,000,000Connecticut $8,267,000,000
New York $4,968,000,000Maryland $4,314,500,000Tennessee $3,600,000,000
Texas $3,139,500,000Georgia $2,500,000,000
Utah $780,000,000Missouri $472,500,000Nevada $318,600,000Florida $140,000,000
Minnesota $46,500,000

Total Investments (2009 – 2019) by H.R.3-Impacted Firms in Small & Mid Cap Biotech Companies in CALIFORNIA
06/04/2021 27© Vital Transformation, LLC 2021
California Biotech Investments by Firm, 2010-2020Companies 1-27 Investments 1-27 Companies 28-54 Investments 28-54
Adheron Therapeutics Inc. $580,000,000 Impact Biomedicines Inc. $7,000,000,000Afferent Pharmaceuticals Inc. $1,250,000,000 InterMune Inc. $8,300,000,000
Alios BioPharma Inc. $1,750,000,000 KAI Pharmaceuticals Inc. $315,000,000AliveGen USA Inc. $562,500,000 Labrys Biologics Inc. $825,000,000
Allogene Therapeutics Inc. $2,800,000,000 MabVax Therapeutics Holdings Inc. $11,000,000Amylin Pharmaceuticals Inc. $7,000,000,000 Medivation Inc. $13,631,000,000Anacor Pharmaceuticals Inc. $5,200,000,000 Meritage Pharma Inc. $245,000,000Anadys Pharmaceuticals Inc. $230,000,000 Neurocrine Biosciences Inc. $2,015,000,000
Apricus Biosciences Inc. $27,500,000 NextWave Pharmaceuticals Inc. $680,000,000Aragon Pharmaceuticals Inc. $1,000,000,000 Ocera Therapeutics Inc. $117,000,000
Armo BioSciences Inc. $1,600,000,000 Onyx Pharmaceuticals Inc. $10,400,000,000Arrowhead Pharmaceuticals Inc. $1,040,000,000 Pearl Therapeutics Inc. $1,150,000,000
Audentes Therapeutics Inc. $3,000,000,000 Pharmacyclics Inc. $21,000,000,000Auspex Pharmaceuticals Inc. $3,500,000,000 Pionyr Immunotherapeutics Inc. $1,740,000,000Avanir Pharmaceuticals Inc. $3,560,000,000 Portola Pharmaceuticals Inc. $1,176,000,000
BiPar Sciences Inc. $500,000,000 Principia Biopharma Inc. $3,680,000,000Cadence Pharmaceuticals Inc. $1,300,000,000 Quanticel Pharmaceuticals Inc. $485,000,000
CGI Pharmaceuticals Inc. $120,000,000 Questcor Pharmaceuticals Inc. $300,000,000Corthera Inc. $620,000,000 Receptos Inc. $7,321,000,000
Cougar Biotechnology Inc. $1,000,000,000 Seragon Pharmaceuticals Inc. $1,725,000,000CV Therapeutics Inc. $1,400,000,000 Synthorx Inc. $2,500,000,000
Delinia Inc. $777,000,000 TargeGen Inc. $560,000,000Denali Therapeutics Inc. $325,000,000 Tracon Pharmaceuticals Inc. $155,000,000
Dermira Inc. $109,500,000 Via Pharmaceuticals Inc. $22,800,000Flexus Biosciences Inc. $1,250,000,000 Vical Inc. $100,490,000
IDM Pharma Inc. $66,700,000 Vitae Pharmaceuticals Inc. $639,000,000Ignyta Inc. $1,753,000,000 Xyphos Biosciences Inc. $665,000,000
06/04/2021 28© Vital Transformation, LLC 2021
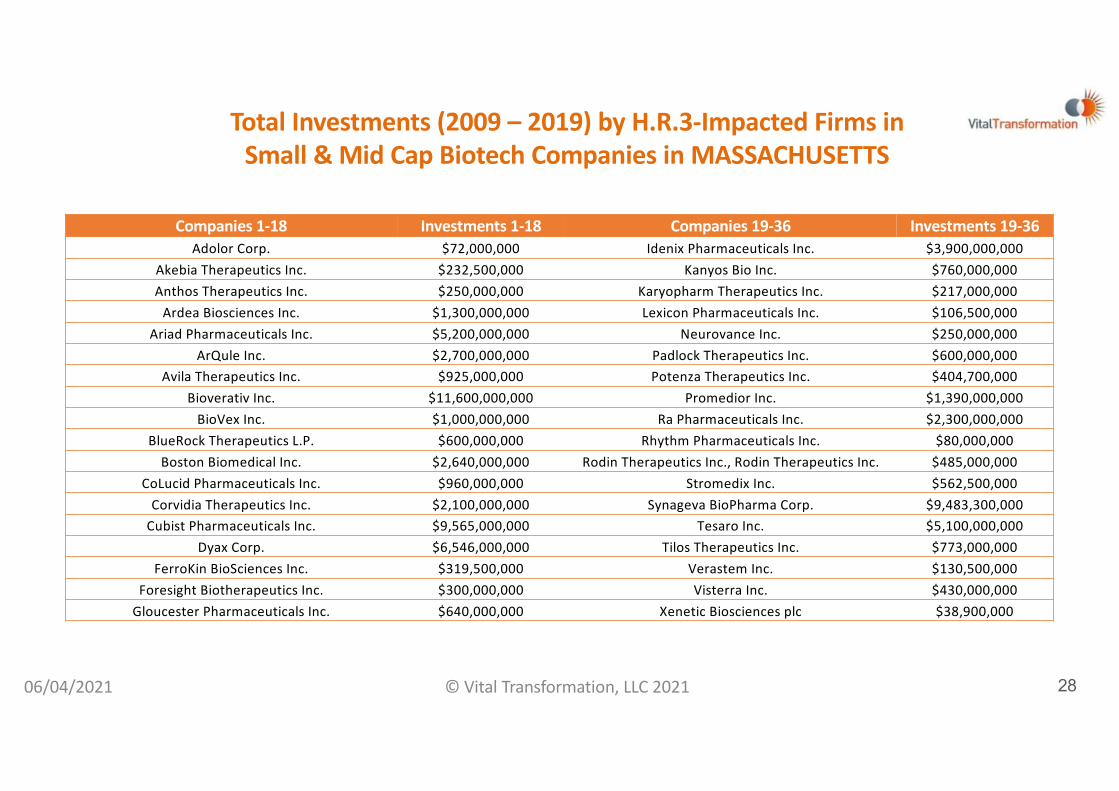
Total Investments (2009 – 2019) by H.R.3-Impacted Firms in Small & Mid Cap Biotech Companies in MASSACHUSETTS
Companies 1-18 Investments 1-18 Companies 19-36 Investments 19-36Adolor Corp. $72,000,000 Idenix Pharmaceuticals Inc. $3,900,000,000
Akebia Therapeutics Inc. $232,500,000 Kanyos Bio Inc. $760,000,000Anthos Therapeutics Inc. $250,000,000 Karyopharm Therapeutics Inc. $217,000,000
Ardea Biosciences Inc. $1,300,000,000 Lexicon Pharmaceuticals Inc. $106,500,000Ariad Pharmaceuticals Inc. $5,200,000,000 Neurovance Inc. $250,000,000
ArQule Inc. $2,700,000,000 Padlock Therapeutics Inc. $600,000,000Avila Therapeutics Inc. $925,000,000 Potenza Therapeutics Inc. $404,700,000
Bioverativ Inc. $11,600,000,000 Promedior Inc. $1,390,000,000BioVex Inc. $1,000,000,000 Ra Pharmaceuticals Inc. $2,300,000,000
BlueRock Therapeutics L.P. $600,000,000 Rhythm Pharmaceuticals Inc. $80,000,000Boston Biomedical Inc. $2,640,000,000 Rodin Therapeutics Inc., Rodin Therapeutics Inc. $485,000,000
CoLucid Pharmaceuticals Inc. $960,000,000 Stromedix Inc. $562,500,000Corvidia Therapeutics Inc. $2,100,000,000 Synageva BioPharma Corp. $9,483,300,000
Cubist Pharmaceuticals Inc. $9,565,000,000 Tesaro Inc. $5,100,000,000Dyax Corp. $6,546,000,000 Tilos Therapeutics Inc. $773,000,000
FerroKin BioSciences Inc. $319,500,000 Verastem Inc. $130,500,000Foresight Biotherapeutics Inc. $300,000,000 Visterra Inc. $430,000,000
Gloucester Pharmaceuticals Inc. $640,000,000 Xenetic Biosciences plc $38,900,000
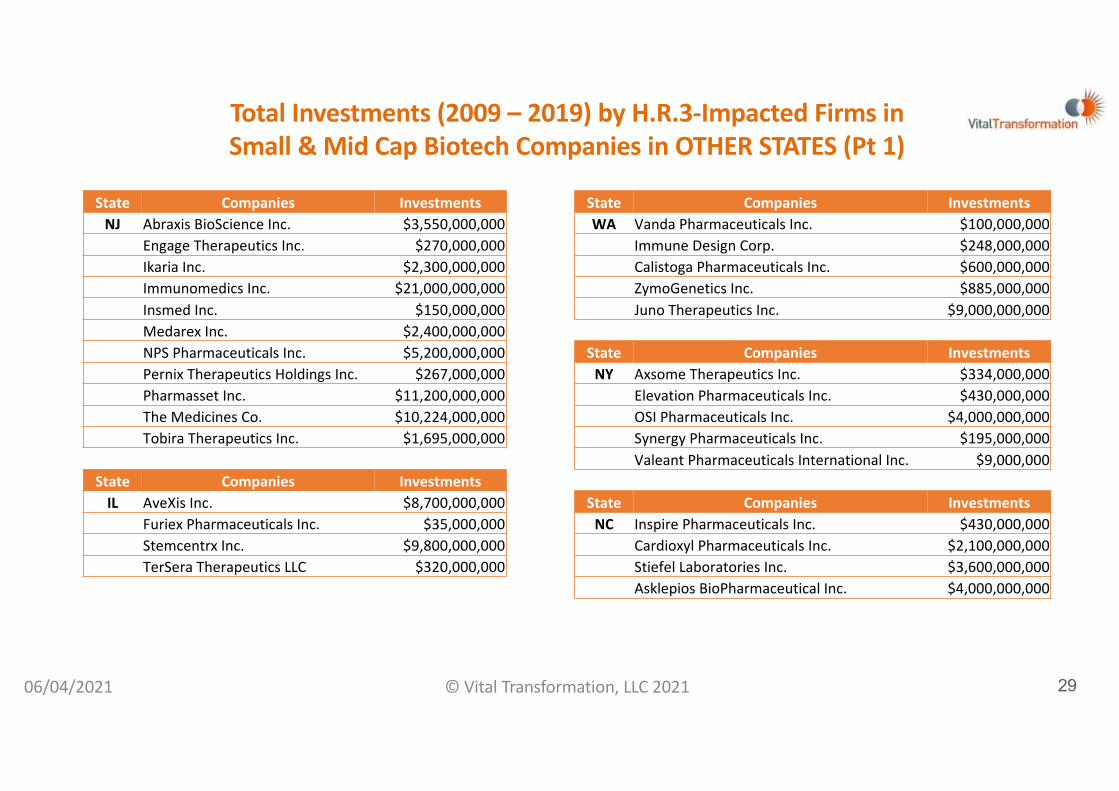
State Companies Investments State Companies InvestmentsNJ Abraxis BioScience Inc. $3,550,000,000 WA Vanda Pharmaceuticals Inc. $100,000,000
Engage Therapeutics Inc. $270,000,000 Immune Design Corp. $248,000,000Ikaria Inc. $2,300,000,000 Calistoga Pharmaceuticals Inc. $600,000,000Immunomedics Inc. $21,000,000,000 ZymoGenetics Inc. $885,000,000Insmed Inc. $150,000,000 Juno Therapeutics Inc. $9,000,000,000Medarex Inc. $2,400,000,000NPS Pharmaceuticals Inc. $5,200,000,000 State Companies InvestmentsPernix Therapeutics Holdings Inc. $267,000,000 NY Axsome Therapeutics Inc. $334,000,000Pharmasset Inc. $11,200,000,000 Elevation Pharmaceuticals Inc. $430,000,000The Medicines Co. $10,224,000,000 OSI Pharmaceuticals Inc. $4,000,000,000Tobira Therapeutics Inc. $1,695,000,000 Synergy Pharmaceuticals Inc. $195,000,000
Valeant Pharmaceuticals International Inc. $9,000,000State Companies Investments
IL AveXis Inc. $8,700,000,000 State Companies InvestmentsFuriex Pharmaceuticals Inc. $35,000,000 NC Inspire Pharmaceuticals Inc. $430,000,000Stemcentrx Inc. $9,800,000,000 Cardioxyl Pharmaceuticals Inc. $2,100,000,000TerSera Therapeutics LLC $320,000,000 Stiefel Laboratories Inc. $3,600,000,000
Asklepios BioPharmaceutical Inc. $4,000,000,000
06/04/2021 29© Vital Transformation, LLC 2021
Total Investments (2009 – 2019) by H.R.3-Impacted Firms in Small & Mid Cap Biotech Companies in OTHER STATES (Pt 1)

06/04/2021 30© Vital Transformation, LLC 2021
Total Investments (2009 – 2019) by H.R.3-Impacted Firms in Small & Mid Cap Biotech Companies in OTHER STATES (Pt 2)
State Companies Investments State Companies InvestmentsCT SpringWorks Therapeutics LLC $103,000,000 MO Nabi Biopharmaceuticals $47,500,000
Achillion Pharmaceuticals Inc. $930,000,000 InfaCare Pharmaceutical Corp. $425,000,000Loxo Oncology Inc. $7,234,000,000
State Companies InvestmentsState Companies Investments NV Spectrum Pharmaceuticals Inc. $24,600,000MD Cerecor Inc. $114,500,000 PDL BioPharma Inc. $294,000,000
Sucampo Pharmaceuticals Inc. $1,200,000,000Human Genome Sciences Inc. $3,000,000,000 State Companies Investments
FL Envoy Therapeutics Inc. $140,000,000State Companies Investments
TN King Pharmaceuticals Inc. $3,600,000,000 State Companies InvestmentsGA Inhibitex Inc. $2,500,000,000 TX CerSci Therapeutics Inc. $939,500,000UT Tolero Pharmaceuticals Inc. $780,000,000 Peloton Therapeutics Inc. $2,200,000,000MN ANI Pharmaceuticals Inc. $46,500,000
State Companies InvestmentsState Companies Investments PA NuPathe Inc. $279,000,000
CO Array BioPharma Inc. $11,400,000,000 ViroPharma Inc. $4,200,000,000Spark Therapeutics Inc. $4,800,000,000

Analysis of 215 inward emerging biotech investmentsTotal Investments Accurately Predict Market Entry
No
Yes
0%
10%
20%
30%
40%
50%
60%
70%
80%
90%
100%
$0 $6.000 $12.000 $18.000 $24.000
Acqu
irer:
App
rove
d?
Acquirer: Total Deal Value Millions
Fit logistic
• This chart shows that the total of all cash invested into the R&D of a therapy predicts FDA approvals with high statistical certainty.
• The “p-value” of 0.0001 means that there is less than a 1 in 10,000 probability that this relationship arises by random chance.
• In our cohort of therapies, a 50% probability of market entry requires a cash commitment of $5.2 billion.
Source -LogLikelihood DF G² statistic pDifference 12.918 1 25.84 <0.0001
Fitted model 121.25 213Null model 134.17 214
A 50% probability of market entry in our cohort requires $5.2 billion of investment
06/04/2021 31© Vital Transformation, LLC 2021

H.R. 3 for 50 therapies - 46% Reduction of EBIT cashflow Reduction from 68 approved therapies to 7
Indication Initial Approval 1-17
H.R. 3 50 Impact Indication Initial Approval
18-34H.R. 3 50 Impact Indication Initial Approval
35-51H.R. 3 50 Impact Indication Initial Approval
52-68H.R. 3 50 Impact
MS 99% 86% Crohn's disease 49% 35% Hypertension 32% 27% Migraine 23% 22%Cancer 98% 80% Psoriasis 49% 35% Bacterial infection 32% 27% IBD 23% 22%B cell lymphoma 88% 61% Lymphoma 48% 35% Hypertension 31% 26% Hypertension 23% 22%
Psoriasis 87% 61% Hemophilia46% 34% Basal cell carcinoma
(BCC)29% 25%
Migraine23% 22%
Anemia 81% 55% Angioedema 43% 32% Angina 28% 25% Migraine 23% 22%Breast cancer 81% 54% Diabetes 42% 32% Pain 27% 25% Constipation 22% 22%Liver cancer 77% 51% NSCLC 42% 31% Alopecia 27% 24% Meningitis 22% 22%Cardiovascular 73% 49% Solid tumors 41% 31% Lymphoma 27% 24% Migraine 22% 22%Post-operative ileus 72% 48%
Fibromyalgia syndrome
39% 30%Melanoma
25% 24%Bleeding
22% 22%
Cardiovascular 72% 48% Psoriasis 39% 30% Ovarian cancer 25% 23% HIV/AIDS 22% 22%Cancer 68% 45% Pancreatic cancer 39% 30% Influenza virus 25% 23% Bone cancer 22% 22%
Pulmonary fibrosis 66% 44% Neurology39% 30%
ADHD24% 23%
Diabetes22% 22%
Lung cancer 61% 41% MS 37% 29% lymphoma (CTCL) 24% 23% Breast cancer 22% 22%Lipodystrophy 59% 40% Lupus 36% 29% Encephalitis 24% 23% ED 22% 22%Autoimmune 57% 39% MS 35% 29% Conjunctivitis 23% 23% ED 22% 22%Cancer 52% 37% NSCLC 35% 28% Bleeding 23% 22% lymphoma (NHL) 22% 22%
Thyroid cancer 49% 35% Insomnia 34% 28% Breast cancer 23% 22%Hyper-cholesterol
22% 22%
Bring to Market Do Not Bring to Market Bring to Market Do Not Bring
to Market Bring to Market Do Not Bring to Market Bring to Market Do Not Bring to
Market
06/04/2021 32© Vital Transformation, LLC 2021

H.R. 3 for 125 therapies - 62% Reduction of EBIT cashflow Reduction from 68 approved therapies to 2
Indication Initial Approval 1-17
H.R. 3 125 Impact Indication Initial Approval
18-34H.R. 3 125
Impact Indication Initial Approval 35-51
H.R. 3 125 Impact Indication Initial Approval
52-68H.R. 3 125
ImpactMS 99% 70% Crohn's disease 49% 31% Hypertension 32% 26% Migraine 23% 22%Cancer 98% 65% Psoriasis 49% 31% Bacterial infection 32% 25% IBD 23% 22%B cell lymphoma 88% 49% Lymphoma 48% 30% Hypertension 31% 25% Hypertension 23% 22%
Psoriasis 87% 48% Hemophilia 46% 30%Basal cell carcinoma (BCC) 29% 25% Migraine 23% 22%
Anemia 81% 44% Angioedema 43% 29% Angina 28% 24% Migraine 23% 22%Breast cancer 81% 44% Diabetes 42% 31% Pain 27% 24% Constipation 22% 22%Liver cancer 77% 41% NSCLC 42% 28% Alopecia 27% 24% Meningitis 22% 22%Cardiovascular 73% 40% Solid tumors 41% 28% Lymphoma 27% 23% Migraine 22% 22%
Post-operative ileus 72% 39%Fibromyalgia syndrome 39% 28% Melanoma 25% 23% Bleeding 22% 22%
Cardiovascular 72% 39% Psoriasis 39% 28% Ovarian cancer 25% 23% HIV/AIDS 22% 22%Cancer 68% 37% Pancreatic cancer 39% 28% Influenza virus 25% 23% Bone cancer 22% 22%Pulmonary fibrosis 66% 37% Neurology 39% 27% ADHD 24% 23% Diabetes 22% 22%Lung cancer 61% 35% MS 37% 27% lymphoma (CTCL) 24% 23% Breast cancer 22% 22%Lipodystrophy 59% 34% Lupus 36% 27% Encephalitis 24% 23% ED 22% 22%Autoimmune 57% 33% MS 35% 26% Conjunctivitis 23% 23% ED 22% 22%
Cancer 52% 32% NSCLC 35% 26% Bleeding 23% 22% lymphoma (NHL) 22% 22%
Thyroid cancer 49% 31% Insomnia 34% 26% Breast cancer 23% 22%Hyper-cholesterol 22% 22%
Bring to Market Do Not Bring to Market Bring to Market Do Not Bring
to Market Bring to Market Do Not Bring to Market Bring to Market Do Not Bring to
Market
06/04/2021 33© Vital Transformation, LLC 2021

61 Therapies Losing Marketing Access - 46% EBIT ReductionIndication Lost Quantity Indication Lost QuantityMigraine 4 Encephalitis 1Hypertension 3 Conjunctivitis 1Non-small cell lung cancer (NSCLC) 2 Basal cell carcinoma (BCC) 1Bleeding 2 Lung cancer 1Erectile dysfunction (ED) 2 Fibromyalgia syndrome 1Breast cancer 2 Bone cancer 1Lymphoma 2 Post-operative ileus 1Cancer (unspecified) 2 Meningitis 1Multiple sclerosis (MS) 2 Pulmonary fibrosis 1Cardiovascular (unspecified) 2 Attention deficit hyperactivity disorder (ADHD) 1Diabetes 2 Thyroid cancer 1Psoriasis 2 Non-Hodgkin lymphoma (NHL) 1Lipodystrophy 1 Angina 1Neurology (unspecified) 1 Ovarian cancer 1Melanoma 1 Inflammatory bowel disease (IBD) 1Constipation 1 Pancreatic cancer 1Pain 1 Influenza virus 1Crohn's disease 1 Insomnia 1Lupus 1 Hemophilia 1Cutaneous T cell lymphoma (CTCL) 1 Solid tumors 1Angioedema 1 HIV/AIDS 1Bacterial infection 1 Alopecia 1Autoimmune (unspecified) 1 Hypercholesterolemia 1
New therapies not coming to market with 50 drugs under H.R. 3
06/04/2021 34© Vital Transformation, LLC 2021

66 Therapies Losing Market Access - 62% EBIT ReductionIndication Lost Quantity Indication Lost QuantityMigraine 4 Autoimmune (unspecified) 1Hypertension 3 Insomnia 1Psoriasis 3 Encephalitis 1Breast cancer 3 Liver cancer 1Non-small cell lung cancer (NSCLC) 2 Pain 1Bleeding 2 Lupus 1Lymphoma 2 Pancreatic cancer 1Cancer (unspecified) 2 Melanoma 1Multiple sclerosis (MS) 2 B cell lymphoma 1Cardiovascular (unspecified) 2 Anemia 1Diabetes 2 Solid tumors 1Erectile dysfunction (ED) 2 Neurology (unspecified) 1Influenza virus 1 Alopecia 1Meningitis 1 Angina 1Lung cancer 1 Bacterial infection 1Attention deficit hyperactivity disorder (ADHD) 1 Angioedema 1Non-Hodgkin lymphoma (NHL) 1 Inflammatory bowel disease (IBD) 1Conjunctivitis 1 Post-operative ileus 1Lipodystrophy 1 Fibromyalgia syndrome 1Constipation 1 Pulmonary fibrosis 1Basal cell carcinoma (BCC) 1 Hemophilia 1Crohn's disease 1 Thyroid cancer 1Bone cancer 1 HIV/AIDS 1Cutaneous T cell lymphoma (CTCL) 1 Hypercholesterolemia 1Ovarian cancer 1
New therapies not coming to market with 125 drugs under H.R. 3
06/04/2021 35© Vital Transformation, LLC 2021
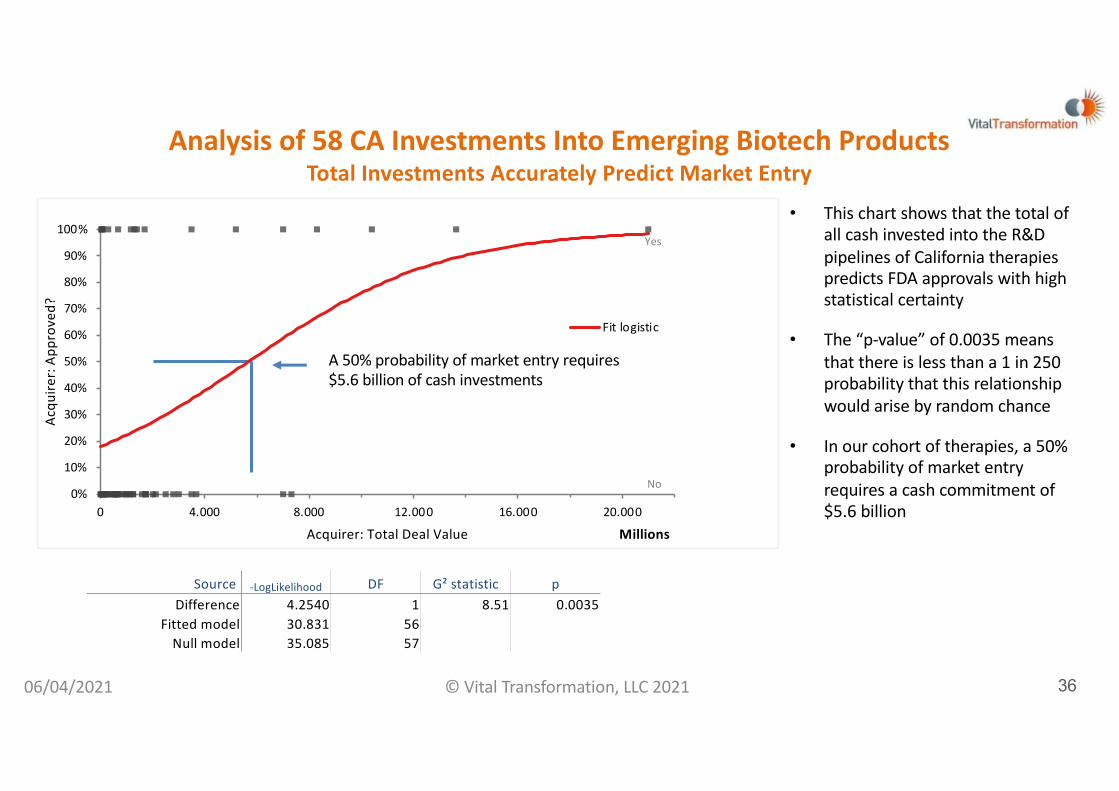
Analysis of 58 CA Investments Into Emerging Biotech ProductsTotal Investments Accurately Predict Market Entry
A 50% probability of market entry requires $5.6 billion of cash investments
• This chart shows that the total of all cash invested into the R&D pipelines of California therapies predicts FDA approvals with high statistical certainty
• The “p-value” of 0.0035 means that there is less than a 1 in 250 probability that this relationship would arise by random chance
• In our cohort of therapies, a 50% probability of market entry requires a cash commitment of $5.6 billion
06/04/2021 36© Vital Transformation, LLC 2021
No
Yes
0%
10%
20%
30%
40%
50%
60%
70%
80%
90%
100%
0 4.000 8.000 12.000 16.000 20.000
Acqu
irer:
App
rove
d?
Acquirer: Total Deal Value Millions
Fit logistic
Source -LogLikelihood DF G² statistic pDifference 4.2540 1 8.51 0.0035
Fitted model 30.831 56Null model 35.085 57

A 46% reduction of EBIT (50 drugs in H.R. 3) reduces CA therapies approved from 17 to 2A 62% reduction of EBIT cashflow (125 Drugs in H.R. 3) reduces CA therapies approved from 17 to 1
06/04/2021 37© Vital Transformation, LLC 2021
Indication Current Probabiliity 46% Reduction 62% ReductionCancer (unspecified) 98% 82% 65%
B cell lymphoma 89% 61% 47%Liver cancer 78% 49% 39%
Pulmonary fibrosis 67% 42% 34%Diabetes 59% 38% 31%Psoriasis 47% 32% 27%
Neurology (unspecified) 36% 27% 24%Basal cell carcinoma (BCC) 26% 22% 21%
Angina 24% 21% 20%Pain 24% 21% 20%
Lymphoma 23% 21% 20%Attention deficit hyperactivity disorder (ADHD) 21% 20% 19%
Inflammatory bowel disease (IBD) 19% 19% 19%HIV/AIDS 18% 18% 18%
Bone cancer 18% 18% 18%Diabetes 18% 18% 18%
Erectile dysfunction (ED) 18% 18% 18%BRING TO MARKET DO NOT BRING TO MARKET

H.R. 3’s impact upon the market access of new products
• With 50 drugs included in H.R. 3 and a 46% reduction of EBIT cashflow, we predict a reduction from 68 approved therapies to 7 in the US, and a reduction from 17 to 2 approved products specifically from emerging California biotech companies.
• With 125 drugs included in H.R. 3 and a 62% reduction of EBIT cashflow, we predict a reduction from 68 approved therapies to 2 in the US, and a reduction from 17 to 1 approved products specifically from emerging California biotech companies.
• Therapies lost include those in the treatment of migraine pain, hypertension, psoriasis, breast cancer, non-small cell lung cancer (NSCLC), bleeding, lymphoma, multiple sclerosis (MS), diabetes, and others.
• A 50% probability of market entry in our 10 year cohort of 215 therapies requires total investments of $5.2 billion dollars per therapy.
06/04/2021 38© Vital Transformation, LLC 2021
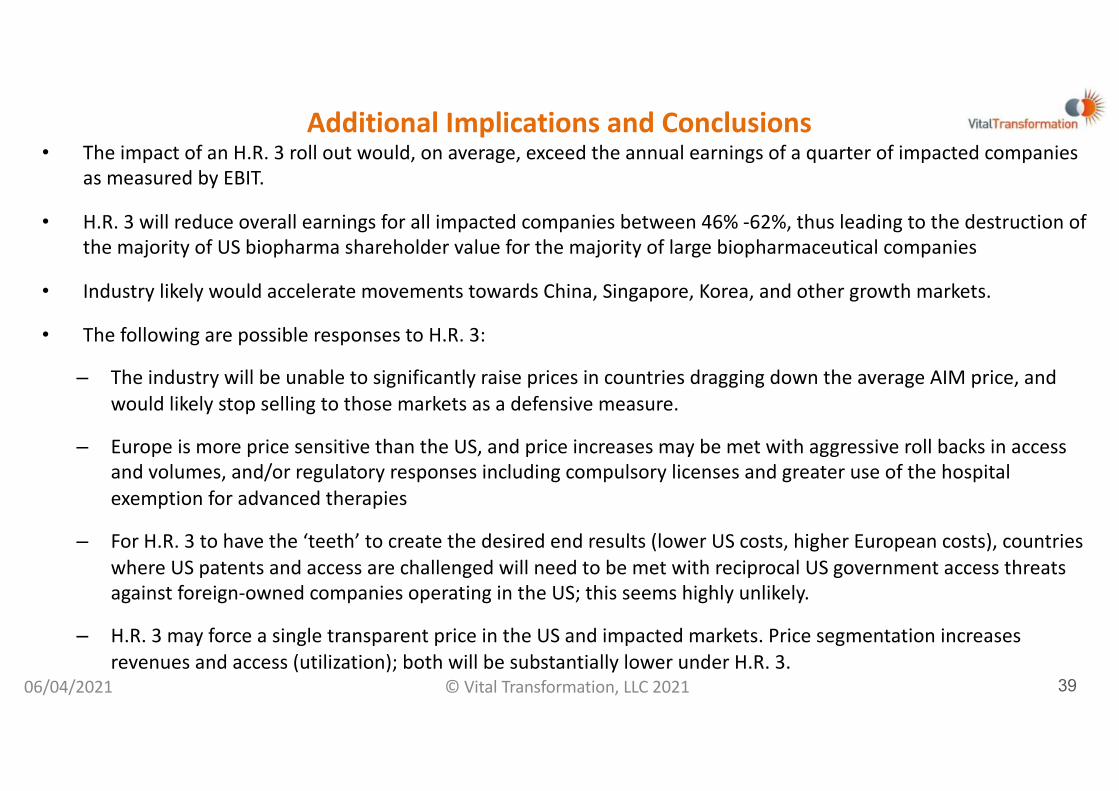
Additional Implications and Conclusions• The impact of an H.R. 3 roll out would, on average, exceed the annual earnings of a quarter of impacted companies
as measured by EBIT.
• H.R. 3 will reduce overall earnings for all impacted companies between 46% -62%, thus leading to the destruction of the majority of US biopharma shareholder value for the majority of large biopharmaceutical companies
• Industry likely would accelerate movements towards China, Singapore, Korea, and other growth markets.
• The following are possible responses to H.R. 3:
– The industry will be unable to significantly raise prices in countries dragging down the average AIM price, and would likely stop selling to those markets as a defensive measure.
– Europe is more price sensitive than the US, and price increases may be met with aggressive roll backs in access and volumes, and/or regulatory responses including compulsory licenses and greater use of the hospital exemption for advanced therapies
– For H.R. 3 to have the ‘teeth’ to create the desired end results (lower US costs, higher European costs), countries where US patents and access are challenged will need to be met with reciprocal US government access threats against foreign-owned companies operating in the US; this seems highly unlikely.
– H.R. 3 may force a single transparent price in the US and impacted markets. Price segmentation increases revenues and access (utilization); both will be substantially lower under H.R. 3.
06/04/2021 39© Vital Transformation, LLC 2021

Appendix ADistribution of Part D and B Medicines in the Analysis

Distribution of Part D and B Medicines in the Analysis
• Of the top 25 drugs by spending, 5 are Part B and 20 are Part D
• Of the top 50 drugs by spending, 9 are Part B and 41 are Part D• Of the top 125 drugs by spending, 21 are Part B and 104 are Part D
• Of the entire cohort of the top 175 drugs by spending, 50 are Part B and 125 are Part D
06/04/2021 41© Vital Transformation, LLC 2021

Appendix BThe Role of Pharmacy Benefit Managers (PBMs)
06/04/2021 42© Vital Transformation, LLC 2021
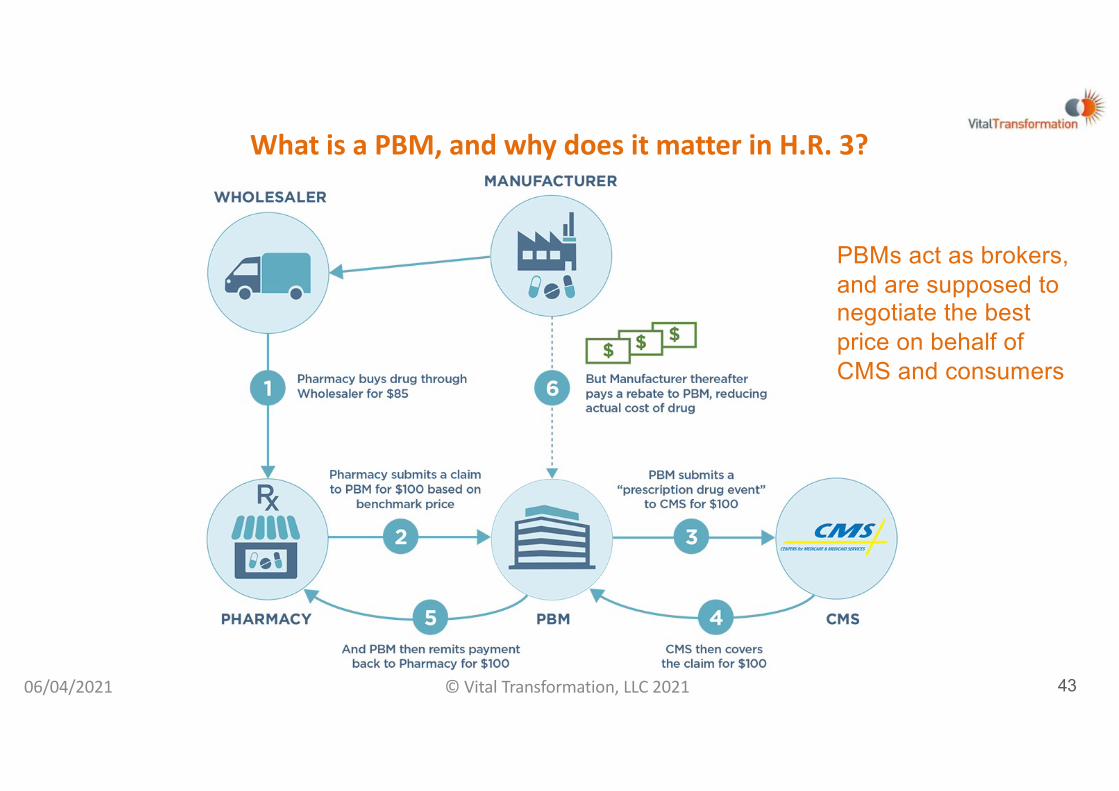
What is a PBM, and why does it matter in H.R. 3?
PBMs act as brokers, and are supposed to negotiate the best price on behalf of CMS and consumers
06/04/2021 43© Vital Transformation, LLC 2021

Insulin prices and pharmacy benefit manager rebates: pin the tail on the patient
By Duane Schulthess March 19, 2020
All told, the unallocated insulin sales [for the six insulin products we investigated] that were reported in Medicare Part D but not booked on the corporate balance sheets . . . total a bit over $2 billion.
How could $2 billion in [insulin] sales simply vanish into thin air?
While our data aren’t proof that pharmacy benefit managers are gobbling up some, if not all, of this insulin margin, it is possible, even probable, . . .the missing sales . . . might be sitting in PBM bank accounts.
One thing for certain is that it isn’t coming back to consumers as discounts and it isn’t going to the pharmaceutical companies that make the products.
06/04/2021 44© Vital Transformation, LLC 2021

44 therapies where Medicare sales exceed all audited US sales$22.2 billion of missing sales
-$3.000
-$2.500
-$2.000
-$1.500
-$1.000
-$500
$01 2 3 4 5 6 7 8 9 10 11 12 13 14 15 16 17 18 19 20 21 22 23 24 25 26 27 28 29 30 31 32 33 34 35 36 37 38 39 40 41 42 43 44
Missing US Sales, 44 Therapies (2019) $US MilMedicare - US Sales
• We find 44 instances in our 175 drug cohort where Medicare CMS sales exceed total audited US sales in the annual SEC filings.
• The amount of ‘missing’ revenue, lost in the supply chain, is roughly $22 billion of missing sales in 2019.
• This money is not ending up on the company balance sheets, nor as discounts to patients.
• We suspect the majority is being paid as discounts to PBMs.
06/04/2021 45© Vital Transformation, LLC 2021

Appendix CDisclosure

Disclosure
• Vital Transformation, an international health economics and healthcare real world evidence strategy consultancy, was asked to conduct an analysis of the impact of international reference pricing, as proposed in H.R. 3, on the biopharmaceutical innovation ecosystem, and specifically the impact on investment and small company capital formation and new drug pipeline development.
• The opinions included in this work are those of Vital Transformation, LLC, and not necessarily those of the project sponsors.
• The analysis was performed by Vital Transformation Consulting Economist Dr Harry Bowen, and Vital Transformation Managing Director Duane Schulthess.
06/04/2021 47© Vital Transformation, LLC 2021

H.R. 3 and Reference PricingTotal Market Impact
March 22, 2021
Prepared in collaboration with