hpc benchmarks: some figures at glance… · hpc benchmarks: some figures at glance ... sandy...
TRANSCRIPT

HPC benchmarks: some figures at glance…
Giorgio Amati, Ivan Spisso
CINECA-SCAI Dept.
Bologna, 6/8 April 2016

We would like to:
Try to understand the technological trend via benchmarks…
…and use them to understand OpenFoam performance issues, limitations and best practices
CAVEAT
All measurements are taken using the available HW at
CINECA
Sometimes there is an “unfair” comparison e.g.:
Sandy Bridge HW used was very “powerful”, HPC oriented
Ivy Bridge HW used was devoted to “data crunching”, not HPC oriented

Tick/Tock
Intel CPU roadmap: two step evolution
Tock phase:
New architecture
New instructions (ISA)
Tick phase:
Keep previous architecture
New technological step (e.g. Broadwell 14nm)
Core “optimization”
Usually increasing core number, keeping Thermal Dissipation (TDP) constant

Performance Issues
Westmere (tick, a.k.a. plx.cineca.it)
Intel(R) Xeon(R) CPU E5645 @2.40GHz, 6 Core per CPU
Only serial performance figure
Sandy Bridge (tock, a.k.a. eurora.cineca.it)
Intel(R) Xeon(R) CPU E5-2687W 0 @3.10GHz, 8 core per CPU
Serial/Node performance figure
Ivy Bridge (tick, a.k.a pico.cineca.it)
Intel(R) Xeon(R) CPU E5-2670 v2 @2.50GHz, 10 core per CPU
Serial/Node/Cluster performance
Infiniband FDR
Hashwell (tock, a.k.a. galileo.cineca.it)
Intel(R) Xeon(R) CPU E5-2630 v3 @2.40GHz, 8 core per CPU
Serial/Node/Cluster performance
Infiniband QDR
Broadwell (tick)
Intel(R) Xeon(R) CPU E5-2699 v4 @ 2.20GHz, 22 core per CPU
Serial/Node performance figure
Released March 31st

Performance Issues
Empirically tested on different HW available at CINECA
Linpack
Intel optimized benchmark, rel. 11.3
Stress Floating point performance, no Bandwidth limitation
Stream
Rel. 3.6, OMP version
Bandwidth, no Floating point limitation
HPCG
Intel optimized benchmark, rel. 11.3
CFD oriented benchmarck with Bandwidth Limitation
BGK
LBM hand-made code (3D Multiblock-Mpi/Openmp)
OpenFoam

LINPACK
Best result obtained, single core
5.6x increase in 6 years (Q1-2010, Q1-2016)
3.1 GHz 2.5 GHz

STREAM
Best result obtained (using intel/gnu), single core
2.6x speed-up in 6 years ……

Roofline Model http://crd.lbl.gov/departments/computer-science/PAR/research/roofline/
Performance ordered according to arithmetic intensity
GFLOPs/Byte

Roofline Model
Which is the OpenFoam arithmetic intensity?
About 0.1, may be less….
“Design and Optimization of OpenFOAM-based CFD Applications for Hybrid and Heterogeneous HPC Platforms”. Onazi et al, ParCFD14

Roofline Mode: serial figure
Using the figures obtained on different HW (LINPACK, STREAM)

HPCG Conjugate Gradient Benchmark (http://hpcg-benchmark.org/)
Intel benchmark: Westmere not supported
2x speed-up only for Broadwell: first release in 2016…

What about OpenFoam? OF release: 2.2.1, single core
3D Driven Cavity, 80^3 gridpoints
Broadwell not (yet) tested
Relative performance i.e. normalized respect “slower CPU” available (> 1 faster, < 1 slower)

LINPACK parallel figures
Best result obtained

LINPACK parallel figures/2
Best result obtained
Efficiency = Parallel_Flops/(#core*Serial_Flops)
1 Linear speed-up

STREAM parallel figures
Best result obtained (intel/gnu compiler)

STREAM parallel figure/2
Best result obtained (intel/gnu compiler)
Efficiency = Parallel_BW/(#core*Serial_BW)
1 Linear Speed-up

Roofline: parallel graph
Using the figures obtained on different HW (LINPACK, STREAM)

Cuncurrent jobs
LBM code, 3D Driven cavity, Mean value
From 1 to n equivalent concurrent jobs

Cuncurrent jobs (errorbar)
LBM code, 3D Driven cavity, Mean value

Intel Turbo mode
i.e. Clock increase
From Hashwell the increase depends from the number of the core involved
For CINECA Hashwell:
Core 1,2: 3.2 GHz
Core 3: 3.0 GHz
Core 4: 2.9 GHz
Core 5: 2.8 GHz
Core 6: 2.7 GHz
Core 7: 2.6 GHz
Core 8: 2.6 GHz
Now It’s hard to make a “honest” speedup!!!!!

Turbo mode & Concurrent jobs
LBM code, 3D Driven cavity. Mean value, Broadwell

OF Speed-up (single node)
100^3, 3D Driven cavity
Rel 2.2.1 for Sandy Bridge, 3.0.1 otherwise

Speed-up (using more nodes)
100^3, 3D Driven cavity,
IvyBridge: 20 task, splitted on 1/2/4 nodes…
Hashwell: 16 tasks, splitted on 1/2/4 nodes…

OF Speed-up (nodes>1)
200^3, 3D Driven cavity, Rel: 3.0.1
Ivy Bridge: Infiniband FDR
Hashwell: Infiniband QDR
FDR vs. QDR!!!!!

Let’s play!!!!
200^3, 3D Driven cavity, Rel: 3.0.1
Ivy Bridge (10 core per CPU): 160 tasks splitted on 8/10/16 nodes

Let’s play!!!!
200^3, 3D Driven cavity, Rel: 3.0.1
Hashwell (8 core per CPU): 80 tasks splitted on 5/10/20/40/80 nodes

Different Solvers
100^3, 3D Driven cavity, Hashwell
GAMG vs PCG

LBM code/1
240^3, 3D Driven cavity
Playing with tasks, using always 16 nodes (max 320 tasks)
Relative performance
Cache effect
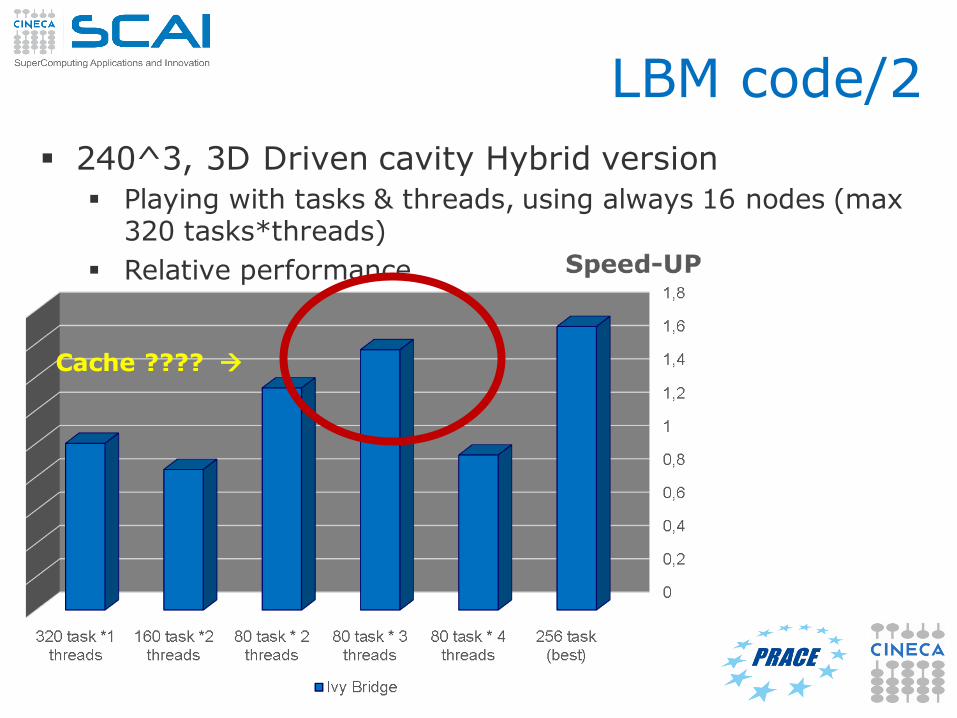
LBM code/2
240^3, 3D Driven cavity Hybrid version
Playing with tasks & threads, using always 16 nodes (max 320 tasks*threads)
Relative performance
Cache ????

Roofline Mode: LBM
Three step serial optimization (an example)
1.Move+Streaming: Computational intensity 0.36
Playing with compilers flag (-O1,-O2,-O3,-fast)
2.Fused: Computational intensity 0.7
Playing with compilers flag (-O1,-O2,-O3,-fast)
3.Fused+single precision: Computational intensity 1.4
Playing with compilers flag (-O1,-O2,-O3,-fast)
Test case:
3D driven cavity
128^3

Roofline Mode: LBM/2
1. Move+Streaming: Computational intensity 0.36 (2.2x)
2. Fused: Computational intensity 0.7 (1.8x)
3. Fused+single precision: Computational intensity 1.4 (2.8x)
Global improvement 7.3x

Some Conclusion
Single core: small improvements over the year for OF
Target is always LINPACK performance
Bandwidth grows more “slowly”
Better not use all the cores (BW bounded)
Check if splitting tasks using more nodes could give a gain
Take care of cache effects

Future work
Deep testing of Broadwell architecture
Check OpenMPI/IntelMPI features
More fine code profiling
Extract the theoretical performance according to the roofline model
…..

Some Links TICK-TOCK: http://www.intel.com/content/www/us/en/silicon-innovations/intel-
tick-tock-model-general.html
WESTMERE: http://ark.intel.com/it/products/family/28144/Intel-Xeon-Processor-
5000-Sequence#@Server
SANDY BRIDGE: http://ark.intel.com/it/products/family/59138/Intel-Xeon-Processor-E5-Family#@Server
IVY BRIDGE: http://ark.intel.com/it/products/family/78582/Intel-Xeon-Processor-
E5-v2-Family#@Server
HASHWELL: http://ark.intel.com/it/products/family/78583/Intel-Xeon-Processor-
E5-v3-Family#@Server
BROADWELL: http://ark.intel.com/it/products/family/91287/Intel-Xeon-Processor-E5-v4-Family#@Server
LINPACK: https://en.wikipedia.org/wiki/LINPACK
STREAM: https://www.cs.virginia.edu/stream/ref.html
HPCG: http://hpcg-benchmark.org/
ROOFLINE: http://crd.lbl.gov/departments/computer-
science/PAR/research/roofline/
TURBO MODE:http://cdn.wccftech.com/wp-content/uploads/2016/03/Intel-Broadwell-EP-Xeon-E5-2600-V4_Non_AVX.png

Some References/2
“Design and Optimization of OpenFOAM-based CFD Applications for Hybrid and Heterogeneous HPC Platforms”. Onazi et al, ParCFD14
“Optimising the Parallelisation of OpenFOAM Simulations”, Shannon Keough
“Do theoretical FLOPs matter for real application’s performance?”, Joshua
Mora, AMD
“Theoretical FLOP/s isn’t
therefore a good indicator
of how applications such
as CFD ones (and many
more) will perform”

Disclaimer